I.J.A.B.R., VOL. 2(2) 2012: 256-265 ISSN: 2250 - 3579 256 SOCIO-ECONOMIC CHARACTERISTICS AND PURPOSE OF KEEPING DAIRY CATTLE IN CENTRAL ZONE OF TIGRAY, NORTHERN ETHIOPIA a Gebrekidan Tesfay, b Zeleke Mekuriaw c Gangwar, S.K. and a Aklilu Hailemichael a Deptt. of Animal Science, College of Agriculture, Aksum University, Aksum, Ethiopia b Deptt. of Animal Science, College of Agriculture, Bahir Dar University, Bahir Dar, Ethiopia c Deptt. of Animal, rangeland and wildlife Sciences, College of Agriculture, Mekelle University, Mekelle, Ethiopia ABSTRACT The purpose of this study was to explore the socio-economic status of dairy producers in central Tigray Zone, Northern Ethiopia. A total of 160 dairy holding households were selected by systematic random sampling technique for the study. The study employed multiple methods of data analysis including descriptive statistics, Chi-square test, T-test, ANOVA, ranking and qualitative analysis. The finding of this study showed similar average family size across urban and peri-urban areas but an increasing trend in average family size was observed from small to large farms. The average family size of small, medium and large farms was 4.980.22, 5.710.33 and 6.860.36 persons, respectively. Literacy rate was higher in urban areas than the peri-urban areas. Majority of the urban dairy farmers were business persons whereas farmers took the higher proportion in the peri-urban areas. Significantly (P<0.05) larger land holding in the farming area was reported from the peri-urban farmers as compared to the urban dwellers. There is significant difference (P<0.05) in the major agricultural activity between Urban and peri-urban areas that could contribute most of the households’ income. Income from sale of dairy products, kiosks and house rent showed significantly (P<0.05) higher in Urban areas than peri-urban areas KEYWORDS: Dairy production, Socio-economic status, family size, household etc. INTRODUCTION Livestock performs multiple functions in Ethiopian economy by providing food, input function for crop production (i.e. they enable optimum use of land and labor in a given household), output function (i.e. the production of milk, meat, hides and skins, manure, etc.), integrated function (i.e. perform various activities in the crop production sub-sector), and soil fertility management, raw material for industries, cash income as well as promoting savings, fuel, asset function, security function and socio- cultural function and employment (Bee et al., 2005). The livestock sub sector contributes 12-16% of total and 35- 40% of agricultural Gross Domestic Product (GDP), respectively. Livestock also contributes 12-15% of total export earnings. The sub sector is the second major sources of foreign currency earnings through export of live animals, hide and skins (Ayele et al., 2003). In Ethiopia, the human and animal populations are very much affected by nutritional problems, primarily due to lack of food of high nutritional value. Therefore, to sooth this problem and to ameliorate the nutritional status of the population, measures should be taken to improve animal production so as to ensure better supply of animal protein of high nutritive value (Ashebir, 1992). In this regard, milk is among livestock products whose demand continues to increase and plays a very important role in feeding the rural and urban population of Ethiopia (Asaminew, 2007). In order to meet the growing demand for milk in Ethiopia, milk production has to grow at least at a rate of 4 % per annum which in turn entails design of appropriate and sustainable dairy development strategies based on socio- economic, institutional and agro-ecological circumstances that build on the demand of consumers and the needs and opportunities of producers (Azage et al., 2001). Hence, in order to design relevant dairy development strategies and implement context specific interventions for future development of the urban and peri-urban dairy production, exploring the socio economic characteristics of the dairy producers is very crucial. Therefore, the objective of this study is assessing the socio-economic status of dairy producers and the purpose of dairy keeping in relation to urban and peri-urban areas. MATERIALS AND METHODS Area description The study was carried out in central zone of Tigray region, Northern Ethiopia. The Central Tigray Zone is one of the five zones in Tigray National Regional State. The zone approximately extends between 13 0 15’ and 14 0 39’ North latitude, and 38 0 34’ and 39 0 25’ East longitude. The altitude of the zone mainly falls within the category of 2000 to 3000 masl. The larger part of the zone receives mean annual rainfall ranging from 400 to 800mm. The mean monthly maximum and minimum temperatures of the zone are 30 0 c and 10 0 c, respectively (NMSA, 1996). Central Tigray zone is bounded by Eritrea in the north, East Tigray zone in the East and south east, West Tigray zone in the west and Amhara National Regional State in the south. The zone with its capital in the ancient city of Aksum encompasses ten woredas. The zone has the largest human population in the region. The specific study sites were Adwa & Aksum urban and peri-urban areas with 1006 & 1024 kilometers far from Addis Ababa, respectively. These two districts were selected purposively based on their conducive agro-

Welcome message from author
This document is posted to help you gain knowledge. Please leave a comment to let me know what you think about it! Share it to your friends and learn new things together.
Transcript

I.J.A.B.R., VOL. 2(2) 2012: 256-265 ISSN: 2250 - 3579
256
SOCIO-ECONOMIC CHARACTERISTICS AND PURPOSE OF KEEPINGDAIRY CATTLE IN CENTRAL ZONE OF TIGRAY, NORTHERN ETHIOPIA
aGebrekidan Tesfay, bZeleke Mekuriaw cGangwar, S.K. and aAklilu Hailemichaela Deptt. of Animal Science, College of Agriculture, Aksum University, Aksum, Ethiopia
bDeptt. of Animal Science, College of Agriculture, Bahir Dar University, Bahir Dar, Ethiopiac Deptt. of Animal, rangeland and wildlife Sciences, College of Agriculture, Mekelle University, Mekelle, Ethiopia
ABSTRACTThe purpose of this study was to explore the socio-economic status of dairy producers in central Tigray Zone, NorthernEthiopia. A total of 160 dairy holding households were selected by systematic random sampling technique for the study.The study employed multiple methods of data analysis including descriptive statistics, Chi-square test, T-test, ANOVA,ranking and qualitative analysis. The finding of this study showed similar average family size across urban and peri-urbanareas but an increasing trend in average family size was observed from small to large farms. The average family size ofsmall, medium and large farms was 4.980.22, 5.710.33 and 6.860.36 persons, respectively. Literacy rate was higher inurban areas than the peri-urban areas. Majority of the urban dairy farmers were business persons whereas farmers took thehigher proportion in the peri-urban areas. Significantly (P<0.05) larger land holding in the farming area was reported fromthe peri-urban farmers as compared to the urban dwellers. There is significant difference (P<0.05) in the major agriculturalactivity between Urban and peri-urban areas that could contribute most of the households’ income. Income from sale ofdairy products, kiosks and house rent showed significantly (P<0.05) higher in Urban areas than peri-urban areas
KEYWORDS: Dairy production, Socio-economic status, family size, household etc.
INTRODUCTIONLivestock performs multiple functions in Ethiopianeconomy by providing food, input function for cropproduction (i.e. they enable optimum use of land and laborin a given household), output function (i.e. the productionof milk, meat, hides and skins, manure, etc.), integratedfunction (i.e. perform various activities in the cropproduction sub-sector), and soil fertility management, rawmaterial for industries, cash income as well as promotingsavings, fuel, asset function, security function and socio-cultural function and employment (Bee et al., 2005). Thelivestock sub sector contributes 12-16% of total and 35-40% of agricultural Gross Domestic Product (GDP),respectively. Livestock also contributes 12-15% of totalexport earnings. The sub sector is the second majorsources of foreign currency earnings through export of liveanimals, hide and skins (Ayele et al., 2003).In Ethiopia, the human and animal populations are verymuch affected by nutritional problems, primarily due tolack of food of high nutritional value. Therefore, to sooththis problem and to ameliorate the nutritional status of thepopulation, measures should be taken to improve animalproduction so as to ensure better supply of animal proteinof high nutritive value (Ashebir, 1992). In this regard,milk is among livestock products whose demand continuesto increase and plays a very important role in feeding therural and urban population of Ethiopia (Asaminew, 2007).In order to meet the growing demand for milk in Ethiopia,milk production has to grow at least at a rate of 4 % perannum which in turn entails design of appropriate andsustainable dairy development strategies based on socio-economic, institutional and agro-ecological circumstancesthat build on the demand of consumers and the needs and
opportunities of producers (Azage et al., 2001). Hence, inorder to design relevant dairy development strategies andimplement context specific interventions for futuredevelopment of the urban and peri-urban dairy production,exploring the socio economic characteristics of the dairyproducers is very crucial. Therefore, the objective of thisstudy is assessing the socio-economic status of dairyproducers and the purpose of dairy keeping in relation tourban and peri-urban areas.
MATERIALS AND METHODSArea descriptionThe study was carried out in central zone of Tigray region,Northern Ethiopia. The Central Tigray Zone is one of thefive zones in Tigray National Regional State. The zoneapproximately extends between 13015’ and 14039’ Northlatitude, and 380 34’ and 39025’ East longitude. Thealtitude of the zone mainly falls within the category of2000 to 3000 masl. The larger part of the zone receivesmean annual rainfall ranging from 400 to 800mm. Themean monthly maximum and minimum temperatures ofthe zone are 300c and 100c, respectively (NMSA, 1996).Central Tigray zone is bounded by Eritrea in the north,East Tigray zone in the East and south east, West Tigrayzone in the west and Amhara National Regional State inthe south. The zone with its capital in the ancient city ofAksum encompasses ten woredas. The zone has the largesthuman population in the region.The specific study sites were Adwa & Aksum urban andperi-urban areas with 1006 & 1024 kilometers far fromAddis Ababa, respectively. These two districts wereselected purposively based on their conducive agro-

Socio-economic characteristics of dairy cattle in central zone of Tigray
257
ecological conditions for dairy production and forexistence of large human population.Data CollectionA cross-sectional survey was used in order to collect dataon the socio economic characteristics of the dairy cattleproducers. Pre-tested formal questionnaire was used in thecross sectional survey. The collected data included age atfirst calving, calving interval, lactation length, averagedaily milk yield per cow per day. A multi-stage samplingtechnique was used in the cross-sectional survey. First,cattle holding households were clustered in to urban andperi-urban. Aksum and Adwa, the larger towns in thezone, were considered as urban. The smaller towns ofWukro, Dura, and Mahiber-selam are found aroundAksum. The remaining small towns of Bete-Hanis, Debre-genet and Gendebta and Mariam-shewito are found aroundAdwa. These small towns found within a radius of 20kmfrom the centers of the two larger towns. Hence the smalltowns were considered as peri-urban. Then farms werecategorized in to large (> 10 dairy cattle), medium (5-10dairy cattle) and small (<5 dairy cattle) according to theguideline of IRLI (1996). Finally, based on the samplingframe obtained from the district office of Agriculture, atotal of 160 cattle holding households were chosen usingsystematic random sampling technique.Data analysisQualitative and quantitative data from the cross-sectionalsurvey, which were collected in the local language(Tigrgna) were translated and entered to Microsoft OfficeExcel 2007. The same software was used for data edition,management, computation of percentages, andpresentation of results in the form of charts and tables.Data was transported to and analyzed using SPSS 16.0(SPSS, 2007) software. In all the comparisons, the level ofsignificance was set at α = 0.05.The following statistical tools were used to teststatistically significance of means and frequencies orpercentages:Descriptive statisticsDescriptive statistical quantities such as, Charts,percentage presentations, frequencies, means, standarddeviation and standard error of mean were employed tosummarize information like level of education, occupationof the respondents, division of labour, trend of farmexpansion, feed sources, experience of growing improvedforages, housing materials, plant materials for washing andsmoking milk utensils and milk and milk productmarketing options.Chi-square test (χ2)Chi-square test was conducted to test difference betweencategorical variables; for instance, on aspects like farmingsystem and source of foundation stock are analyzed byChi-square test.T-testContinuous response variables like landholding andincome sources in respect to locations (urban versus peri-urban) were tested using both equal and unequalassumptions of independent two sample t-test.
Ranking analysisIn addition to the above, ranking analysis was undertakenfor the purpose of keeping dairy cattle and causes ofregression of farms. Hence in the preference rankingmethod, index was computed with the principle ofweighted average and indexes were ranked each otherusing auto ranking with MS-excel 2007. The followingformula was used to compute index as employed by Musaet al. (2006).Index = Rn*C1 + Rn-1*C2…. + R1*Cn/∑Rn*C1+ Rn-1*C2….+ R1*Cn;Where, Rn=value given for the least ranked level (exampleif the least rank is 5th, then Rn=5, Rn-1=4, R1=1)Cn = Counts of the least ranked level (in the above
example, the count of the 5th rank =Cn, and the count of the 1st rank = C1)
Qualitative analysisMoreover, qualitative information obtained fromexploratory study, group discussion, cross-sectional surveyand observations were analyzed using narrative(qualitative) analysis.
RESULTS AND DISCUSSIONVarious socio-economic factors, for instance farmer’s off-farm income, availability of capital investment, milk price,farmer’s level of education and training, and availability offamily labour and their occupation have direct influenceon dairy farmers’ decisions as to whether they want toexpand and improve their dairy operations. From personalobservation, a number of farmers became involved indairy farming as a secondary career, while either thehusband or wife had another form of regular employmentin town.Family size, sex, occupation and educational level ofdairy cattle producersThe overall mean family size of sample households was5.440.24 in the urban areas and 5.460.25 in the peri-urban areas (Table 1). Average family size of small,medium and large farms was 4.980.22, 5.710.33 and6.860.36 persons, respectively. The average family sizeper household in this study is smaller than reported byAsamnew (2007) which was 8.22 and 7.2 persons,respectively for Bahir Dar Zuria and Mecha woredas withthe overall mean of 7.71 persons per family. But more orless similar result was reported by Zelalem (2007) wherethe average family size of dairy farming households inurban areas (5.00.16) persons/household and in peri-urban areas (5.60.13) persons/household in Bahir Darurban and peri-urban areas. The largest average familysize in large farms may be associated with more hiredlabor, which was considered by respondents as familymembers during the survey. Majority of these householdswere found in the urban areas and are relatively better-offand tended to exploit hired labour and allow education totheir family members and increase the ability of the familyto adopt improved technologies and the overallmanagement of the dairy cattle improved. Family size mayinfluence the overall labour availability of the householdsfor any livestock activity.

I.J.A.B.R., VOL. 2(2) 2012: 256-265 ISSN: 2250 - 3579
258
TABLE 1. Household characteristics of respondents in the study areaLocation of the farm
Variables Parameters Urban(N=80)Peri-urban(N=80) Total
N % N % N %Sex of the respondent Male 69 86.25 65 81.25 134 83.75
Female 11 13.75 15 18.75 25 15.62Occupation of the respondent Farmer 17 21.5 53 65.82 69 43.67
housewife 6 7.59 4 5.06 10 6.32business person 35 43.03 12 15.18 46 29.11governmentemployee 14 17.72 7 8.86 21 13.29Retired person 1 1.26 3 3.79 4 2.53Others 7 8.86 1 1.26 8 5.06
Educational background of therespondent illiterate 13 16.25 13 16.45 26 16.35
Elementary 29 36.25 44 54.42 72 45Secondary andabove 38 47.5 23 29.11 61 38.13
Position of respondent Head 80 100 78 98.73 158 99.37Member 0 0 2 1.26 1 0.62
Family Size by location meanS.E 5.440.242 5.460.254Large Medium Small
Family size by farm size 6.860.36 5.710.33 4.980.22N=Number of respondents S.E= Standard error
Regarding respondents’ sex structure, the proportion ofmales was higher than females when total numbers ofrespondents were taken into account. About 86.25% of themales and 13.75 % of females were urban dwellers and81.25% of males and 18.75% of females were living inperi-urban areas. The higher proportion of female in theperi-urban area could be because of more single women inthe peri-urban due to more men went to urban areas tosearch for other businesses and others engaged in theprevious civil wars. The percentage of female dairyfarmers is low as compared to the reported values forAddis Ababa milk shed area (Yoseph et al., 2003) inwhich the proportion of female to male owners is 24% and76% respectively. These shows, higher proportions ofmales were involved in dairying than the females in thestudy area.The proportion of farmers, businessmen, and governmentemployees took the leading with regard to ownership ofdairying in the study area as a whole. Housewife, retiredperson and others (like: truck drivers, mason, and policemen) are also involved in dairy production though they arein small proportion. Business persons (43%), farmers(21.5%) and government employee (17.7%) took theleading in their proportion in the urban areas whereas,farmers (65.8%) followed by business persons (15.2%)and government employee (8.8%) took the rank one tothree, respectively, in the peri-urban areas.Business persons and farmers are those who capitalized onthe potential of dairy cattle, as an investment and theyowned medium and large dairy farms both in the urbanand peri-urban areas. These farms mainly raised high-
grade dairy animals, whereas, small dairy farms weregenerally found in both urban and per-urban areaspossessing local and crossbred animals. About 99.4% ofthe respondents were household heads and the remainingwere household members as a whole in the study area. Inthe urban, all were household heads but in the peri-urbanareas 98.73% of the cattle holding households whoparticipate in dairying were household heads and theremaining were household members.Educational level of all interviewed cattle holdinghouseholds of the farms revealed that 36.25 % and 47.5%of the urban farmers were elementary school complete andsecondary school and above, respectively. But theproportion of dairy keepers in peri-urban areas indicatedthat 54.42% and 29.11% are elementary school completeand secondary and above, respectively. There were higherilliteracy rate in peri-urban areas than the urban areas. Thisobviously has negative impact on transfer of improvedtechnologies to the communities, as anticipated byMulugeta (2005). The proportion of illiterates in this studyare much lower than reported by Yoseph et al. (2003) whoshowed high proportion of illiteracy among dairy farmowners (46%) in Addis Ababa milk shed area.The better literacy in the urban area might be due to betterbasic educational infrastructure and hence have access inlarger towns than the village towns. Considering farm size,illiteracy rate decreased from small to large farms. Thisindicates that member in large farms had better access toeducation and the management of the farm improved andthe problem in relation to poor record keeping is alsodecreased. Better literacy level means better cattle
Socio-economic characteristics of dairy cattle in central zone of Tigray
259
management practices as literacy enhances societies to beaware of efficient utilization of natural resources andadopt new technology in improving livestock productivity.Household age structureMajority of interviewed Cattle holding households in thestudy area were aged between 31-60 years both in urbanand per-urban areas (figure 2). In line with this study,higher proportion of households was obtained in Hawassa
where 33.3% and 30% were in the age range of 41-50 and51-60 years, respectively (Ike, 2002). This age distributionpattern may reflect that young people are less depended onurban livestock keeping as they can find alternative formaland informal employment. For people between 31 and 60years, urban livestock keeping seems to supplement otherinformal or formal employment. For older people,livestock keeping provides a coping strategy forretirement.
FIGURE 1. Age category of respondents in urban and peri-urban areas of the study area (%).
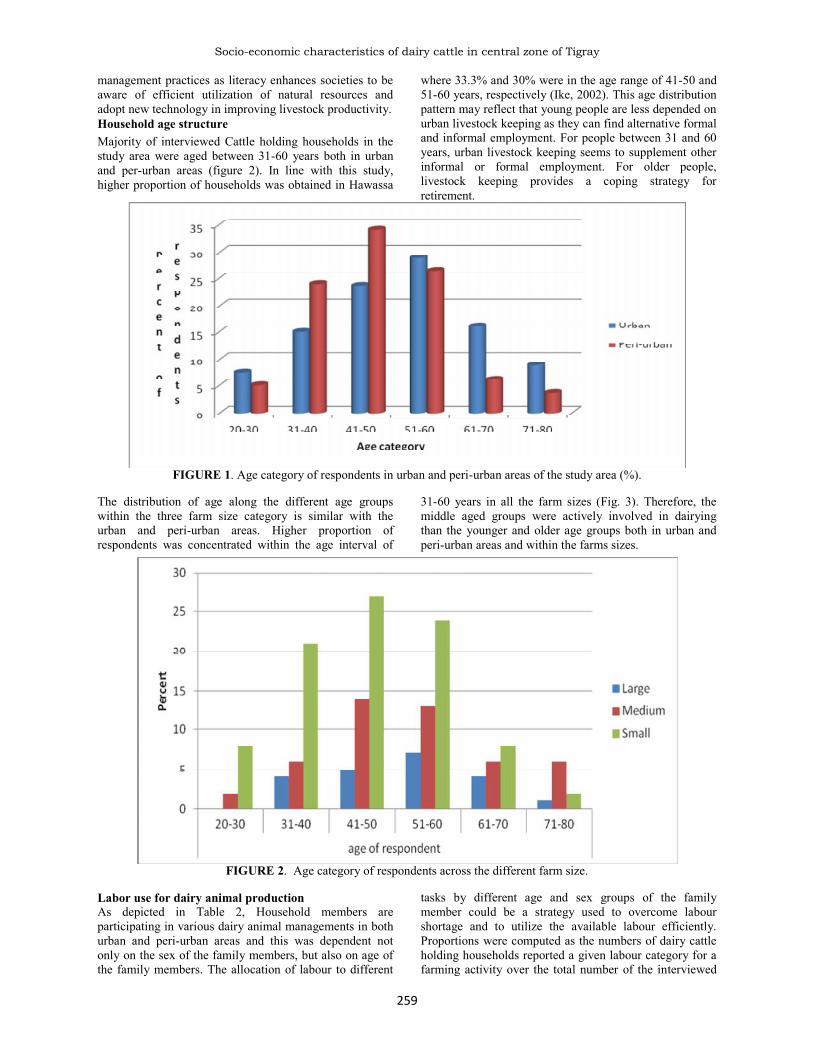
The distribution of age along the different age groupswithin the three farm size category is similar with theurban and peri-urban areas. Higher proportion ofrespondents was concentrated within the age interval of
31-60 years in all the farm sizes (Fig. 3). Therefore, themiddle aged groups were actively involved in dairyingthan the younger and older age groups both in urban andperi-urban areas and within the farms sizes.
FIGURE 2. Age category of respondents across the different farm size.
Labor use for dairy animal productionAs depicted in Table 2, Household members areparticipating in various dairy animal managements in bothurban and peri-urban areas and this was dependent notonly on the sex of the family members, but also on age ofthe family members. The allocation of labour to different
tasks by different age and sex groups of the familymember could be a strategy used to overcome labourshortage and to utilize the available labour efficiently.Proportions were computed as the numbers of dairy cattleholding households reported a given labour category for afarming activity over the total number of the interviewed

I.J.A.B.R., VOL. 2(2) 2012: 256-265 ISSN: 2250 - 3579
260
farms in both the urban and peri-urban areas. According tothe survey result, most of the farming activities includingpurchasing, selling cattle, breeding, caring sick animals
and feeding animals, herding as well as watering were theresponsibility of adult family members.
TABLE 2. Division of labor for dairy production in the study areaActivity Percentage of adult and children labors for dairy production
AMF AMH AFF AFH CBF CBH CGF CGH
Urban
Purchasing 86.1 1.3 12.7 - - - - -Selling 84.6 1.3 14.1 - - - - -Herding 30.2 19.5 20.8 5.7 18.9 1.3 3.8 -Watering 28.3 20.1 22 5 18.2 2.5 3.8 -Cleaning 26.2 21.2 22.5 6.2 16.2 1.9 5.6 -Breeding 58.6 20 13.6 1.4 6.4 - - -Caring sick animals 48.8 14.4 30.6 2.5 2.5 1.2 - -Feeding 38.8 19.4 23.1 5.6 11.2 1.9 - -Milking
27.1 18.1 50.3 4.5 - - - -
Making dairyproducts
15.5 15.5 63.1 4.8 - - -
1.2
-Selling dairyproducts 24.8 15.8 47.4 4.5 4.5 0.8 2.3 -Calf caring 18.8 20.8 37.7 5.8 12.3 1.3 3.2 -Peri-urban
Purchasing 83.3 2.5 14.10 - - - - -Selling 83.1 2.5 14.28 - - - - -Herding 35 12.5 16.25 6.25 25 1.25 3.75Watering 32.5 12.5 18.75 5 23.75 3.75 3.75Cleaning 28.7 12.5 20 6.25 23.75 2.5 6.25Breeding 68.5 8.5 15.71 - 7.14 - - -Caring sick animals 58.7 10 25 2.5 2.5 1.25 - -Feeding 38.7 11.2 25 6.25 16.25 2.5 - -Milking 31.1 10.38 51.94 6.49 - - - -Making dairyproducts 20.4 10.20 67.34 2.04 - - - -Selling dairyproducts 35.5 11.86 45.76 3.38 - - 3.38 -Calf caring 25.9 11.68 33.76 6.49 18.18 1.29 2.59 -
Adult male family member (AMF), Adult male hired (AMH), Adult Female family Member (AFF), Adult Female hired(AFH), Children boys Family member (CBF), Children Boys hired (CBH), Children girls Family member (CGF), Childrengirls hired (CGH)
Adult male hired labor contributed next to adult male andfemale family members to dairying as this labor wasmainly involved in feeding, milking, herding, calf caring,cleaning and watering in the urban areas, whereas adultfemales were second following the adult males as theywere involved more in milking, calf caring, making andselling dairy products in the peri-urban areas. And thehighest participation of adult female family members wasobserved in making dairy products, milking, selling dairyproducts and calf caring in the urban areas.
Family children boys were mainly involved in herding,watering and barn cleaning in both the urban and peri-urban areas. Family children girls had less involvement inthe farms and none of the hired children girls wereinvolved in any dairy activities as reported by the cattleholding households in both urban and peri-urban areas.Similar to this study, most of farming activities includingpurchasing and selling cattle, breeding, milking andfeeding animals as well as caring for sick animals was theresponsibility of adult family members (Negussie, 2006;

Socio-economic characteristics of dairy cattle in central zone of Tigray
261
kedija, 2007). But this finding is in contrast to the findingsof Adebabay (2009) who found in Bure district thatmilking is primarily undertaken by adult male. Theparticipation of females in the decision of householdaffairs (i.e. selling and purchasing cattle) was less both in
urban and peri-urban areas. Decisions are made mainly bymen. Therefore, this result indicated, the necessity of shortterm training and gender education in the study area sothat women can be empowered in every social, economic,cultural and political aspects.
TABLE 3. Major agricultural activities practiced that can contribute most of the households’ income in the study area
LocationActivity Urban(N=78) Peri urban(N=78) Overall Test
N % N % N % p-value χ2
Crop production only 1 1.28 4 5.128 5 3.205 0.000 19.03Livestock production only 53 67.94 26 33.33 79 50.64
Both crop and livestockproduction 24 30.76 48 61.53 72 46.15
N=Number of respondents χ2=Chi-square
As indicated in Table 3, there is significant difference(P<0.05) in the major agricultural activity between Urbanand peri-urban areas that could contribute most of thehouseholds’ income. In the peri-urban areas, majority of
the households depend on both crop and livestockproduction as the farming system in these areas wasmainly mixed crop livestock farming. But the urbandwellers rely mostly on dairying due to less land.
TABLE 4. Average land holding in the residence and farming areaLocation
Land holding Urban Peri-urban TestsN Mean(s.e) N Mean(s.e) p-value
On-plot land holding (m2) 65 2064(821.67) 70 3482(559.3) 0.151Off-plot land holding (m2) 27 2207.6(553.5) 42 10236(3309) 0.021
N=Number of respondents s.e= Standard error df= degree of freedom
Farming system and land holdingThere was no significant difference (P>0.05) in landholding around the residential areas across the location(Table 4), however, there was significant difference(P<0.05) in the size of land holding in the farming areabetween urban and per-urban areas. Larger land holding inthe farming area was reported from the peri-urban farmersas compared to the urban dwellers. The similarity in thesize of land holding around the homestead might bebecause of small and similar land size allotted for thefamily in both urban and peri-urban areas. The landholding in this study is much more less than reported byBelete (2006) in Fogera in which the average croplandholding of the most of the respondents ranged from 1.01to2 hectares.Source of household incomeHousehold’s source of income includes monthly salary,Kiosk, sale of dairy products, house rent, crop productionand miscellaneous activities. The respondents’ averageincome from monthly salary did not show significantdifference (P>0.05) in urban and peri-urban areas (Table5). This might indicate that unfortunately those
government employees who keep dairy animals earnsimilar monthly salary. But due to the engagement ofsome employees of Saba stone and Almeda textile indairying, the average income from monthly salary is raisedin the peri-urban areas. Average income from sale of dairyproducts, kiosks, house rent, crop production and incomefrom other sources showed significant difference (P<0.05)across the locations (urban and peri-urban).
Income from sale of dairy products, house rent and kioskindicated higher in urban areas as compared to the peri-urban, depicting that those dairy keepers living in urbanwere not limited in dairying only but involved inmultidisciplinary sectors to increase their monthly income.Relatively richer households had more houses to rentwhich could add to the monthly income of the household.There were also kiosks from which additional cash incomewas obtained. Hence, households could obtain incomefrom two or more sources in the urban areas than the peri-urban areas.
I.J.A.B.R., VOL. 2(2) 2012: 256-265 ISSN: 2250 - 3579
262
TABLE 5. Monthly average income (in birr) of the households from different sources
Income sourcesLocation
TestUrban Peri-urban
Mean S.E(N) Mean S.E(N) df p-value
Sale of dairy products 2874.8548(73) 1282226(60) 95.18 0.009House rent 1507353(35) 280.2474.99(21) 36.99 0.002Crop production 206.1292(27) 600.86157(55) 31.41 0.008Monthly salary 1095125(15) 1366362(8) 8.71 0.498Kiosk 2525581(18) 930263(10) 22.87 0.020Income from other sources 2940639(26) 789149.7(24) 28.95 0.004
S.E= Standard error N=Number of respondents df= degree of freedom
The proportion of dairy holding households whose sourceof income was sale of dairy products was high both in theurban and peri-urban areas. Since all the respondentsincluded in this study keep dairy, the proportion of dairyholding households with their income from sale of dairyproducts were high even in the peri-urban areas. Similarresults were reported by Azage et al. (2006) whoconcluded that urban and peri-urban dairy productionsystems could contribute to overall development throughincome and employment generation. House rent with43.75% and crop production with 33.75% took the second
and third position in urban areas. Whereas crop productionand income from other sources were ranked second andthird in peri-urban areas of the study site with 68.75% and30%, respectively (Table 6). Proportion of dairy cattleholding households involved in kiosk and governmentalemployment took the least from the total interviewed bothin urban and peri-urban areas. The average income of therespondents from dairy product obtained in this study wasmuch higher than reported by Tsehay (2001) in which afarmer in small scale milk production stated to earn about188 birr or more per month from the sale of morning milk.
TABLE 6. Proportion of households who have got their monthly income from different sources
Income sourcesUrban (N=80) Peri-urban (N=80)
N (%) N (%)Sale of dairy products 73 91.25 60 75House rent 35 43.75 21 26.25Crop production 27 33.75 55 68.75Monthly salary 15 18.75 8 10Kiosk 18 22.5 10 12.5Income from other sources 26 32.5 24 30
N=Number of respondents
Source of foundation stock and trend of farmexpansionThe source of foundation stock of dairy cattle productionin the study area showed significant difference (P<0.05)between urban and peri-urban areas. Both in urban and
peri-urban areas, large proportion of the interviewedhouseholds purchased their initial stock. But 16.25% and15% in the peri-urban area got their foundation stock fromshare owned and gift, respectively (Table 7).
TABLE 7. Source of foundation stock for dairying in the study areaLocation
Source of foundation stock Urban(N=80) Peri-urban(N=80) Overall testN % N % N % χ2 p-value
Gift 5 6.25 12 15 13 16.25Purchase 74 92.5 55 68.75 129 66.25Share owned 1 1.25 13 16.25 14 17.5 15.97 0.000
N=Number of respondents χ2=Chi-square
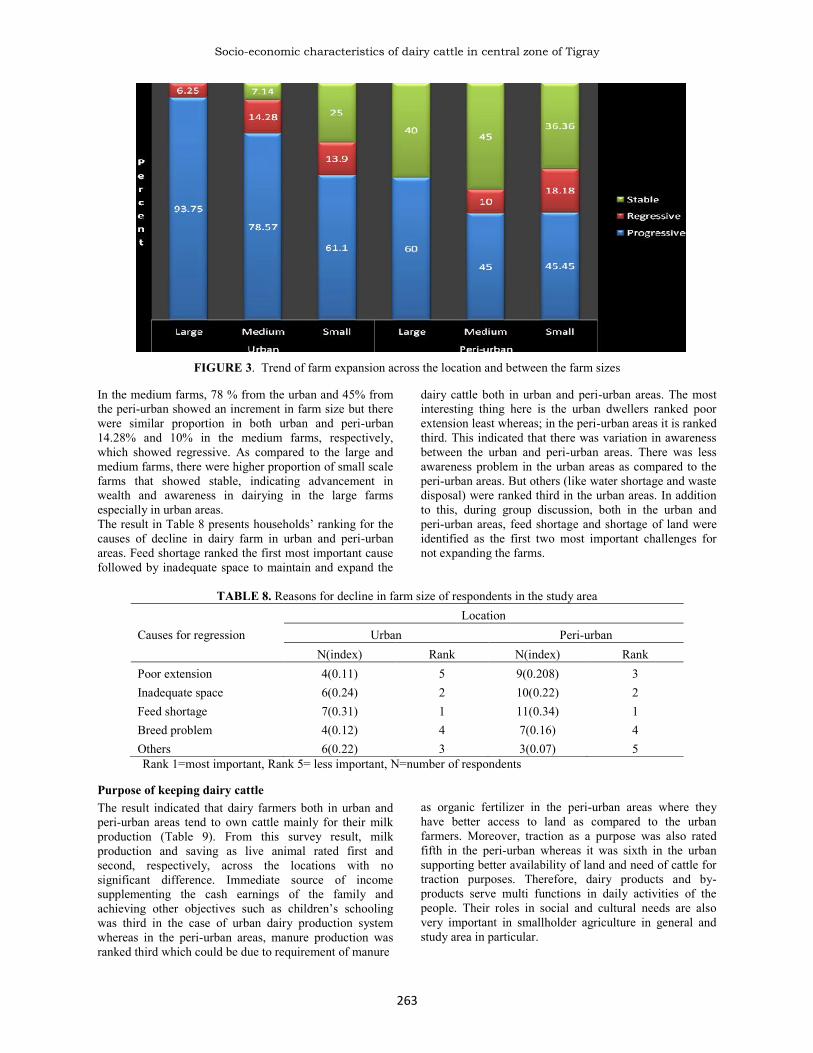
Reported percentages on farm expansion of theinterviewed farms revealed that 93.75% and 60% of thelarge farms from urban and peri-urban, respectively, wereindicating progressive and only 6.25% from urban andnone from the peri-urban farms showed declining rate
(Fig. 4). But there were no stable farm in the urban areaswhereas 40% were stable from the peri-urban large farmswhich might be due to destocking because of feedproblems and lower capacity of the producers to increasethe farms.
Socio-economic characteristics of dairy cattle in central zone of Tigray
263
FIGURE 3. Trend of farm expansion across the location and between the farm sizes
In the medium farms, 78 % from the urban and 45% fromthe peri-urban showed an increment in farm size but therewere similar proportion in both urban and peri-urban14.28% and 10% in the medium farms, respectively,which showed regressive. As compared to the large andmedium farms, there were higher proportion of small scalefarms that showed stable, indicating advancement inwealth and awareness in dairying in the large farmsespecially in urban areas.The result in Table 8 presents households’ ranking for thecauses of decline in dairy farm in urban and peri-urbanareas. Feed shortage ranked the first most important causefollowed by inadequate space to maintain and expand the
dairy cattle both in urban and peri-urban areas. The mostinteresting thing here is the urban dwellers ranked poorextension least whereas; in the peri-urban areas it is rankedthird. This indicated that there was variation in awarenessbetween the urban and peri-urban areas. There was lessawareness problem in the urban areas as compared to theperi-urban areas. But others (like water shortage and wastedisposal) were ranked third in the urban areas. In additionto this, during group discussion, both in the urban andperi-urban areas, feed shortage and shortage of land wereidentified as the first two most important challenges fornot expanding the farms.
TABLE 8. Reasons for decline in farm size of respondents in the study areaLocation
Causes for regression Urban Peri-urbanN(index) Rank N(index) Rank
Poor extension 4(0.11) 5 9(0.208) 3Inadequate space 6(0.24) 2 10(0.22) 2Feed shortage 7(0.31) 1 11(0.34) 1Breed problem 4(0.12) 4 7(0.16) 4Others 6(0.22) 3 3(0.07) 5Rank 1=most important, Rank 5= less important, N=number of respondents
Purpose of keeping dairy cattleThe result indicated that dairy farmers both in urban andperi-urban areas tend to own cattle mainly for their milkproduction (Table 9). From this survey result, milkproduction and saving as live animal rated first andsecond, respectively, across the locations with nosignificant difference. Immediate source of incomesupplementing the cash earnings of the family andachieving other objectives such as children’s schoolingwas third in the case of urban dairy production systemwhereas in the peri-urban areas, manure production wasranked third which could be due to requirement of manure
as organic fertilizer in the peri-urban areas where theyhave better access to land as compared to the urbanfarmers. Moreover, traction as a purpose was also ratedfifth in the peri-urban whereas it was sixth in the urbansupporting better availability of land and need of cattle fortraction purposes. Therefore, dairy products and by-products serve multi functions in daily activities of thepeople. Their roles in social and cultural needs are alsovery important in smallholder agriculture in general andstudy area in particular.

I.J.A.B.R., VOL. 2(2) 2012: 256-265 ISSN: 2250 - 3579
264
TABLE 9. Purpose of keeping dairy cattle among the urban and peri-urban areas
Purpose of keepingLocation
Urban Peri-urbanN (index) Rank N (index) Rank
Milk production 80 (0.34) 1 80 ( 0.28) 1Saving as live animal (prestige value) 77 (0.26) 2 75 ( 0.25) 2Immediate sources of income/sale/ 70 (0.21) 3 54 ( 0.16) 4Manure 46 (0.1) 4 65 ( 0.17) 3Home consumption /meat production/ 20 (0.04) 5 7 ( 0.05) 6For traction 18 (0.037) 6 21 ( 0.08) 5Others - - 2 ( 0.01) 7
N=Number of respondents, Rank 1=most important, Rank 7= less important
Farmers in the study area especially in peri-urban areas,practiced mixed farming system whereby both crop andlivestock productions are practiced side by side, onecomplementing the other. Farmers keeping dairy cattle asa sole means of income especially those living in urbanareas, are better-off as compared to peri-urban farmerswith regard to the reward for their produce. i.e. milk. Insuch a case, they tend to keep their animals in-doors andfeed them usually purchased feeds whereas; farmers inperi-urban areas keep their animals for their dual purposeand at times for multifunction. In peri-urban areas, bothpurchased feeds are not available or not affordable to themajority, and hence dairy producers rely on what isavailable around their area.Therefore, dairying is regarded as one of the best choicesfor urban agriculture. On the other hand, in peri-urbanareas specialization on certain aspects is not as such acommon practice; rather farmers in those areas try todiversify their production objectives in order to deal withuncertainties. They undertake crop farming to have yearround food supply for the family. To do this they requireanimals for drought power for tillage or transport ofgoods. Simultaneously, by-products of crop are used asone of the main feed resource.
CONCLUSIONThe study was conducted in urban and peri-urban areas ofAdwa and Axum towns to explore the socio economiccharacteristics of dairy cattle keepers and purpose ofkeeping dairy cattle in the area. Majority of the dairyproducers in urban area were business persons whereasfarmers took the higher proportion in the peri-urban areas.The educational level of the farmers was better in urbanareas as compared to the peri-urban areas. The averagefamily size was similar across the locations. But there wasincreasing trend in family size from small to the largedairy farm possessing households. The larger averagefamily size in the larger farms was associated with morehired labour, which was considered as family member.Off-plot land holding indicated significantly (P<0.05)larger in the peri-urban area than urban areas which wasused for crop production. Milk production followed bysaving as live animal (prestige value) was the mainpurpose of keeping dairy cattle both in urban and peri-urban areas.
REFERENCESAdebabay Kebede (2009) Characterization of MilkProduction Systems, Marketing and On- Farm Evaluationof the Effect of Feed Supplementation on Milk Yield andComposition at Bure District, Ethiopia. Msc. Thesis, Bahirdar University, Bahir dar, Ethiopia.
Asaminew Tassew (2007) Production, Handling,Traditional Processing Practices and Quality of Milk inBahir Dar Milk Shed Area, Ethiopia. M.Sc. Thesis,Alemaya University, Ethiopia.
Asheber Sewalem (1992) Evaluation of the reproductiveand pre-weaning growth performance of Fogera and theirF1 Fresian crosses at Andassa Cattle breeding station,Ethiopia. M.Sc. Thesis, Alemaya University, Ethiopia.
Ayele Solomon, Assegid Workalemahu, Jabbar M.A.,Ahimed M.M. and Blachew Hurissa (2003) Livestockmarketing in Ethiopia: A review of structure, performanceand development initiatives. Socioeconomics and policyresearch working paper 52. ILRI (International LivestockResearch Institue), Nairobi, Kenya. 2 P
Bee, Y N, Msanga and P Y Kavana (2005) Lactation yieldof crossbred dairy cattle under farmer management inEastern coast of Tanzania, Tanzania Livestock ResearchInstitute.
Belete Anteneh (2006) Studies on cattle milk and meatproduction in Fogera District: Production systems,constraints and opportunities for development. MSc.Thesis, University of Hawassa, Awassa, Ethiopia.
Azage Tegegne, Tsehay Redda, Alemu Gebre Wold andK. Hizkias (2001) Milk recording and herd registration inEthiopia. pp. 90-104. In: Proceedings of the 8th AnnualConference of the Ethiopian Society of Animal Production(ESAP). 24-26 August, 2000. Addis Ababa, Ethiopia.
Azage Tegegne, Million Tadesse, Alemu Yami andYoseph Mekasha (2006) Market-oriented urban and peri-urban dairy systems, Urban Agriculture Magazine, 1, 23-24.
Ike A. (2002) Urban dairying in Awassa, Ethiopia. MScthesis, University of Hohenheim. Instititute of Animal

Socio-economic characteristics of dairy cattle in central zone of Tigray
265
production in the tropics and sub tropics. Stuttgart-Hohenheim, Germany. 113p. ILRI (International livestockresearch Institute) Nairobi, Kenya. 462pp
ILRI (1996) International livestock research institute.Annual project report. ILRI Addis Ababa, Ethiopia.
Kedija Husien (2007) Characterization of milk productionsystem and opportunity for market orientation: A CaseStudy of Mieso District, Oromia Region, Ethiopia. M.Sc.Thesis, Haramaya University, Ethiopia.
Mulugeta Ayalew (2005) Characterization of Dairyproduction system of Yerer Watershed in Ada LibenWoreda, Oromia Region, Ethiopia. MSc. Thesis, AlemayaUniversity, Ethiopia.
Musa, L.M-A., Peters, K. J., and Ahmed , M-K. A. (2006)On farm characterization of Butana and Kenana cattlebreed production systems in Sudan. Livestock Researchfor Rural Development. 18, 56-61.
National Meteorological Service Agency of Ethiopia(NMSA) (1996) Climatic and Agro climatic Resources ofEthiopia, volume 1, No. 1 Addis Ababa, Ethiopia.
Negussie Gebreslasie (2006) Characterization AndEvaluation Of Urban Dairy Production System In Mekelle
City, Tigray Region, Ethiopia. MSc. Thesis, University ofHawassa, Awassa, Ethiopia.
SPSS, Version 16.0 (2007) Statistical Package for SocialSciences for Window.
Tsehay Redda (2001) Small-scale milk marketing andprocessing in Ethiopia. In: proceeding of the south-southworkshop on smallholder dairy production and marketing:constraints and opportunities, Anand, India. 12-16 March.
Yoseph Mekasha, Azage Tegegne and Alemu Yami(2003) Evaluation of the general farm characteristics &dairy herd structure in urban and peri-urban dairyproduction system in the Addis Ababa milk shed. In:Challenges and opportunities of livestock marketing inEthiopia. Proceedings of the 10th annual conference of theEthiopian Society of Animal Production, held in AddisAbaba, Ethiopia, 22-24 Aug 2002. Ethiopian Society ofAnimal Production, Addis Ababa (Ethiopia) ESAP, pp39-144
Zelalem Addis (2007) Milk yield losses due to blindmammary quarters and occurrence of clinical mastitis inmilking cows of urban and peri-urban areas of Bahir Dar,Ethiopia. M.Sc. Thesis, Hawassa university, Ethiopia.
Related Documents