1 Socio-Economic and Environmental Factors Affecting Respiratory Cancer Rates: Texas Public Health Region 6 and 5-South Jason Lyon Bob Ayensu Brett Blackmon GEOG 5550 - Advanced GIS Dr. M. Ji May 07, 2001 Introduction Many different factors can cause respiratory cancer, ranging from pollution from automobiles and large industries, behavioral patterns such as cigarette smoking and other substance abuse and, genetic make-up, which include ethnicity/race and or inherited genetics over several generations. Cancer is a major cause of death and illness in Texas. One in three residents are expected to develop cancer in his or her lifetime. By cancer of the respiratory system we are referring to: cancer of the trachea, bronchus, and lung. Public health is normally affected by three general factors, those are: 1.) Socio-economic factors (race, income level, age, etc.), 2.) Behavioral patterns (i.e. smoking, exercise, etc.) and, 3.) Environmental factors (i.e. air pollution, water quality, etc.). Due to the geographic location of Public Health Region 6 and 5- South there should be some interesting observations made on the issue of environmental justice in this area. Environmental justice is to make sure that no particular groups of people are exposed, either deliberately or by circumstances to a nations or county’s pollution. One of the most telling solutions to the problem of environmental justice/injustice is by means of the Toxic Release Inventory (TRI). The TRI provides a consensus of health related risks due to the release and

Welcome message from author
This document is posted to help you gain knowledge. Please leave a comment to let me know what you think about it! Share it to your friends and learn new things together.
Transcript

1
Socio-Economic and Environmental Factors Affecting Respiratory Cancer Rates: Texas Public Health Region 6 and 5-South
Jason Lyon Bob Ayensu Brett Blackmon
GEOG 5550 - Advanced GIS Dr. M. Ji
May 07, 2001
Introduction
Many different factors can cause respiratory cancer, ranging from pollution from
automobiles and large industries, behavioral patterns such as cigarette smoking and other
substance abuse and, genetic make-up, which include ethnicity/race and or inherited genetics
over several generations. Cancer is a major cause of death and illness in Texas. One in three
residents are expected to develop cancer in his or her lifetime. By cancer of the respiratory
system we are referring to: cancer of the trachea, bronchus, and lung. Public health is normally
affected by three general factors, those are: 1.) Socio-economic factors (race, income level, age,
etc.), 2.) Behavioral patterns (i.e. smoking, exercise, etc.) and, 3.) Environmental factors (i.e. air
pollution, water quality, etc.). Due to the geographic location of Public Health Region 6 and 5-
South there should be some interesting observations made on the issue of environmental justice
in this area.
Environmental justice is to make sure that no particular groups of people are exposed,
either deliberately or by circumstances to a nations or county’s pollution. One of the most telling
solutions to the problem of environmental justice/injustice is by means of the Toxic Release
Inventory (TRI). The TRI provides a consensus of health related risks due to the release and

2
exposure of toxic chemicals from industrial sites (Tiefenbacher et al. 1997). Statistical and
visual observations of TRI along with aggregate number of motor vehicles (a major contributor
to air pollution), socio-economic factors, such as race, median income and, respiratory cancer
rates per county, along with the use of GIS (Geographic Information Systems) will determine if
the presence of TRI sites and vehicle emissions influences the respiratory cancer mortality rate
for Public Health Region 6 and 5-South. GIS is of great benefit to the research and location at or
near hazardous chemical emitting sites because the researcher is able to create buffer zones
around the lines or points that represent hazardous chemical emitting sites. The disease
incidence data can then be merged with these buffer zones to determine how much or how little
of the incidence rates fall within the buffer.
Cancer mortality rates will be higher in counties due to the direct relation of the number
of TRI sites located within each county. And, environmental justice/injustice will be a larger
issue in counties where minority populations are greater. Specifically, this research will 1.)
Identify TRI sites within each county, 2.) Establish a correlation between the number of TRI
sites and respiratory cancer mortality, 3.) Determine the percent of the population by
race/ethnicity located within certain distances around TRI sites, 4.) Establish the average median
income level by race/ethnicity that is located within certain distances around TRI sites and,
finally 5.) Establish a relationship between TRI sites, race/ethnicity, median income levels and,
cancer mortality cases. Due to the fact that more people are moving into urban areas it is
important to determine what populations are affected by high concentrations of air pollution and
whether there is the possibility for environmental justice being an issue.

3
Review of Literature
Air Quality and Respiratory Cancer
One of the leading issues of concern, presently and, in decades to come in the U.S. and
globally, is air pollution. This can be observed in most of the larger cities, due to excessive
emissions from automobiles, and also in industrial districts where smokestacks pump out large
amounts of toxins annually but there is more than meets the eye (Kubasek et al. 1997). There are
variations of the impacts that air quality takes part. Urban planning, distribution of the general
population and, the location of industrial activity increases or decreases a communities risk of
suffering from the release of toxic emissions (Tiefenbacher et al. 1997). There are several other,
more specific, factors that decide an areas risk or “danger potential” due to the release of
airborne toxic emissions and, they are the distance of polluting industrial sites in relation to the
population, the amount of toxins these sites release into the air and, certain socio-economic
characteristics of the population (Tiefenbacher et al. 1997).
Some of the main constituents, or chemicals, that are present in toxic emissions are:
Sulfur dioxide, (SO2), which causes lung and respiratory tract damage and contributes to acid
rain, which damages trees and vegetation, buildings, and aquatic life. Sulfur dioxide comes from
the burning of fossil fuels to generate electricity in which the U.S. relies on for most of its energy
needs. Nitrogen Oxides, (NO2), also contributes to acid rain and, also smog. Nitrogen oxide is
largely created by automobiles and, is also found, in substantial amounts, in industrial emissions.
Carbon monoxide, (CO), replaces oxygen in the bloodstream, causing angina, impaired vision,
poor coordination, and lack of alertness. It also contributes to the formation of ozone and, is
created by the incomplete burning of fossil fuels in automobiles. People with heart and lung
problems are more severely affected by carbon monoxide in the air. Ozone is created when
4
nitrogen dioxide reacts with oxygen in the presence of sunlight and, is directly influenced by the
amount of industrial activity.
Race/Ethnicity and Respiratory Cancer
Despite major technological and social accomplishments disparities in disease and
mortality rates are still a huge concern for policy makers, health care providers and, the general
public. This is clearly evident in the ratio between white and black mortality rates for certain
diseases and health related issues. This is one of the key factors when determining whether
certain populations are victims of environmental injustice. Among African-American males,
lung cancer is the leading cause of death, despite small declines from 1973 – 1991 of lung cancer
incidence and mortality rates among African-American males and females. Since 1991, rates of
lung cancer and rates of lung cancer mortality have increased (Texas Department of Health
1999).
Unless certain actions are taken immediately, such as improvements in prevention, early
detection and, treatment, the rate of cancer mortality will increase due to the aging of the general
population (Texas Cancer Council 2000). Certain social factors, along with race/ethnicity, such
as economic status and location of TRI sites are directly related to environmental justice/injustice
due to the geographic distribution of these specific variables.
Methodology
Our study area is defined by Public Health Region 6 and 5-South (Figure 1) and includes
the following counties:

5
? Walker ? Brazoria ? Montgomery ? Galveston ? Waller ? Chambers ? Hardin ? Liberty
? Jefferson ? Harris ? Wharton ? Fort Bend ? Matagorda ? Orange ? Colorado
Public Health Region 6 and 5-South is in southeastern Texas and is bordered by the Gulf of
Mexico to the south and, Louisiana borders Orange county to the east. This region mostly lies
within the Gulf Coastal Plain predominately dominated by thick vegetation and marshy bogs
(bayous).
Figure 1. Counties within Public Health Region 6 and 5 South (Texas Department of Health 2001).
We chose this area to conduct our research for several reasons. One of the main reasons
is the fact that most of it is urban (large population) and, it is a stronghold for the processing and
refinement of fossil fuels. Another reason is because of the amount of industries that are related
to the shipment of large amounts of raw materials that come in through the Houston ship channel

6
and, also the varying concentration of the geographic location of these industrial sites. Earlier
research by (Tiefenbacher et al. 1997) concluded that Harris, Jefferson, Brazoria, and Galveston
counties reported the highest quantities of toxic emissions in Texas and accounted for 52 percent
of the total toxic air emissions in 1990. Counties such as Montgomery and Fort Bend due to
their location (hazardous neighboring counties) tend to be exposed to high toxic releases.
Statistical analysis along with the application of GIS, were used to measure and observe
trends in respiratory cancer mortality. Statistically, correlation and regression analysis were
performed on the variables to determine whether factors had a direct relationship between each
other and, how much the independent variables explain the dependent variable. In terms of GIS,
coverage's of the counties included in the research with demographic data (1990) included were
analyzed along with coverage's that included TRI sites and buffers around the TRI sites in
increments of 1 mile and 500 feet (Figure 2). Coverage's of the counties along with demographic
data were obtained from Environmental Systems Research Institute, Inc. (ESRI). Toxic Release
Inventory (TRI) coverage's were obtained from the U.S. Environmental Protection Agencies
(EPA) Toxic Release Inventory. Cancer of the respiratory system (trachea, bronchus, and lung)
data (1995 – 1998 death rate (per 100,000)) was extracted from the Texas Department of Health,
“Epigram TX”, database. Rates of cancer death are classified by underlying cause and, by place
of residence. Respiratory cancer data came standardized to the 1970 U.S. population. According
to the T.D.H., cancer data are reported from a number of sources including hospitals, hospital-
based tumor registries, clinical laboratories, and cancer treatment centers. To ensure complete
reporting, the regional registries work with all existing cancer-reporting sources in their areas.

7
Analysis
We began the analysis by retrieving coverage's, shape files, info tables and, Dbase tables
into our workspace so all layers that were needed were easily accessible. To start off we
converted the census block demographic boundary data into Arc Info coverage and demographic
attribute file into an INFO table for each county in Public Health Region 6 and 5-South. Then
each demographic INFO table was joined to each of the county coverage's. TRI site data came
as a shape file of the actual points and also a separate Dbase file. These were converted to a
coverage and INFO table respectively. After converting the shape file and Dbase file the
respective coverage and INFO table were joined together. Next, we projected all of the
coverage's into the Universal Transverse Mercator (UTM) coordinate system and rebuilt the
topology. We then appended all of the county coverage's into one coverage to create a single
Figure 2. TRI sites with 1 mile and 500 feet buffer zones.

8
coverage of the entire Public Health Region 6 and 5-South. The TRI coverage was then clipped
with the Public Health Region coverage so only those TRI sites within the Public Health Region
are available in a new coverage. Most of these previous operations were performed to prepare
the coverage's and create new coverage's that can be used in the actual analysis.
Overlaying the point coverage (TRI) with the polygon coverage (Public Health Region)
begins the first round of actual analysis (Figure 3). These two coverage's were overlaid to create
a new INFO table that included attributes from both the TRI coverage and the Public Health
Region coverage. For each county, populations for White, Black, and Hispanic were summed.
The total number of motor vehicles, median income and TRI sites in each county were also
summed for latter statistical analysis. (Figure 4). Next began the second round of analysis where
buffers of 500 feet and 1 mile were created around the TRI sites to obtain two new coverages.
Then populations for Whites, Blacks, Hispanics, total number of vehicles, median
income, and TRI sites in each county within the buffer zone were summed for latter statistical
analysis. Because respiratory cancer cases and total toxic emissions (total pollution) were
already on the county level, we decided to add these attributes to the Public Health Region
coverage last, but they could have been added at any time. The actual statistical operations that
were performed were done by exporting tables to Dbase files and opened them in Microsoft
Excel and used S-Plus to perform correlations and regression analysis on the variables.

9
Figure 3. TRI sites in Public Health Region 6 and 5-South with census block groups, and TRI sites located in each county in Public Health Region 6 and 5-South.
TRI sites
TRI sites
Counties in Region With TRI Site Locations
Figure 3. TRI sites in Public Health Region 6 and 5-South with census block groups, and TRI sites located in each county in Public Health Region 6 and 5-South.
TRI sites
TRI sites
Census Blocks for Region With TRI Site Locations
Counties in Region With TRI Site Locations

10
Figure 4. Rate of respiratory cancer for each county in comparison with the total number of TRI sites per county.
11
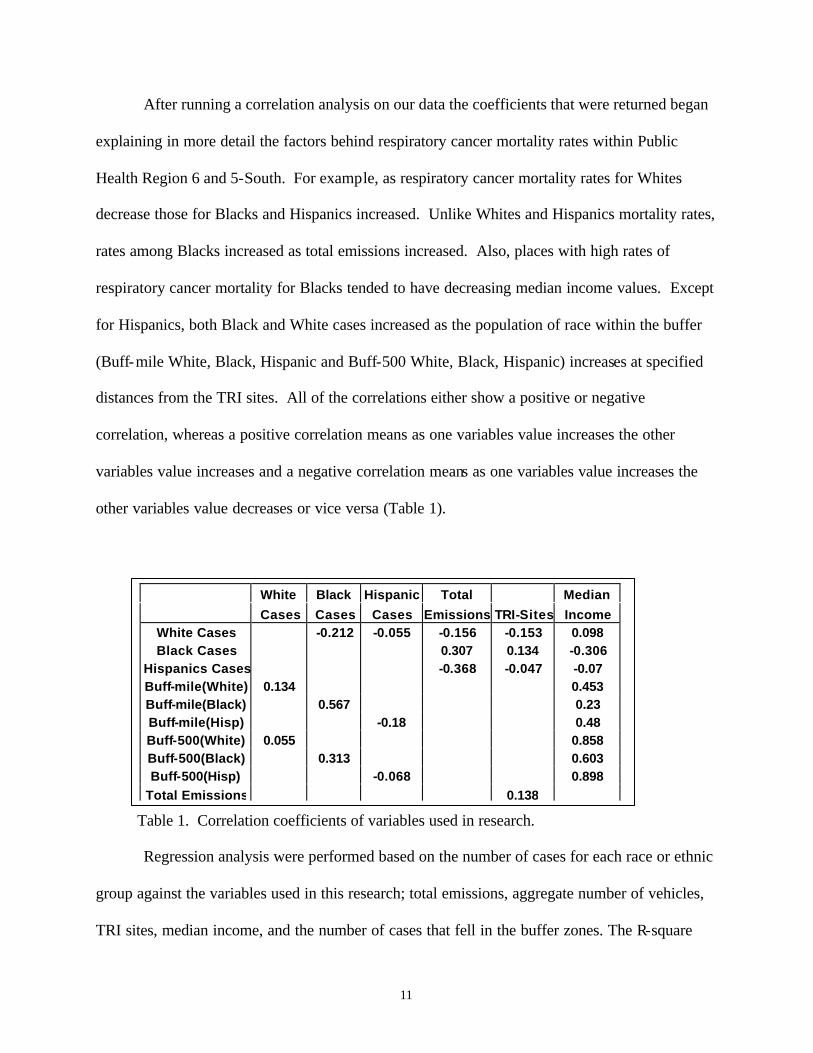
After running a correlation analysis on our data the coefficients that were returned began
explaining in more detail the factors behind respiratory cancer mortality rates within Public
Health Region 6 and 5-South. For example, as respiratory cancer mortality rates for Whites
decrease those for Blacks and Hispanics increased. Unlike Whites and Hispanics mortality rates,
rates among Blacks increased as total emissions increased. Also, places with high rates of
respiratory cancer mortality for Blacks tended to have decreasing median income values. Except
for Hispanics, both Black and White cases increased as the population of race within the buffer
(Buff-mile White, Black, Hispanic and Buff-500 White, Black, Hispanic) increases at specified
distances from the TRI sites. All of the correlations either show a positive or negative
correlation, whereas a positive correlation means as one variables value increases the other
variables value increases and a negative correlation means as one variables value increases the
other variables value decreases or vice versa (Table 1).
Table 1. Correlation coefficients of variables used in research.
Regression analysis were performed based on the number of cases for each race or ethnic
group against the variables used in this research; total emissions, aggregate number of vehicles,
TRI sites, median income, and the number of cases that fell in the buffer zones. The R-square
White Black Hispanic Total Median
Cases Cases Cases Emissions TRI-Sites Income White Cases -0.212 -0.055 -0.156 -0.153 0.098 Black Cases 0.307 0.134 -0.306
Hispanics Cases -0.368 -0.047 -0.07 Buff-mile(White) 0.134 0.453 Buff-mile(Black) 0.567 0.23 Buff-mile(Hisp) -0.18 0.48 Buff-500(White) 0.055 0.858 Buff-500(Black) 0.313 0.603 Buff-500(Hisp) -0.068 0.898
Total Emissions 0.138
12
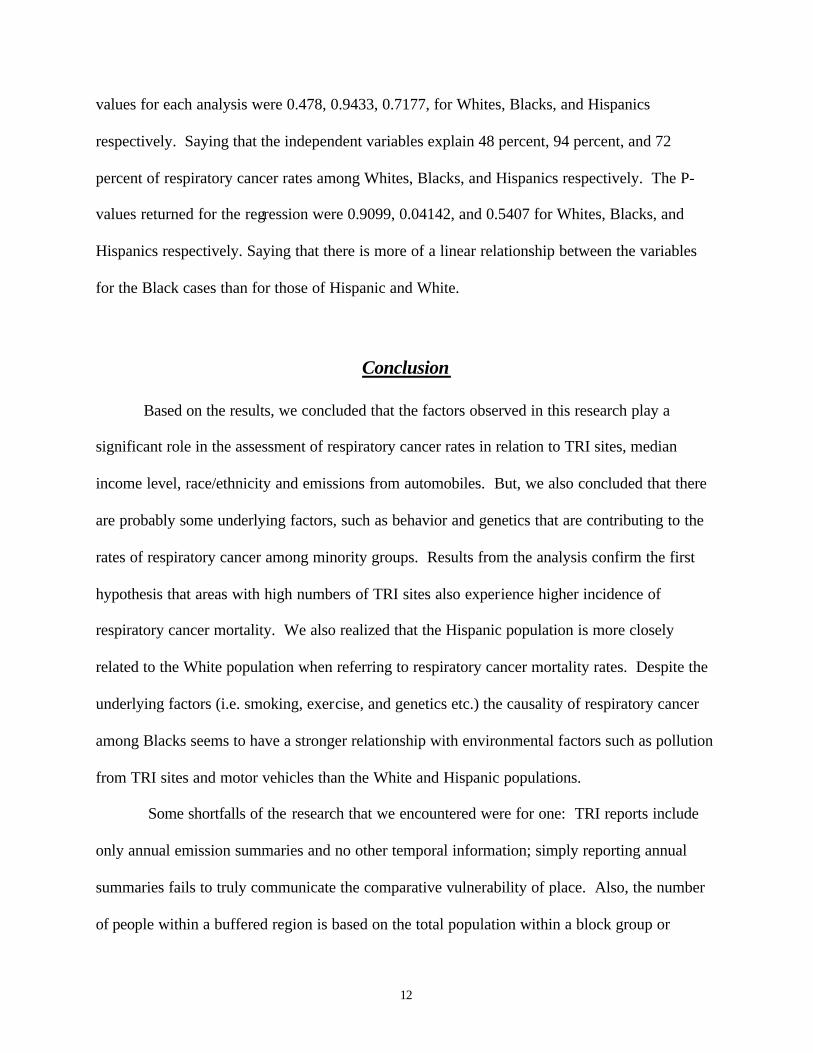
values for each analysis were 0.478, 0.9433, 0.7177, for Whites, Blacks, and Hispanics
respectively. Saying that the independent variables explain 48 percent, 94 percent, and 72
percent of respiratory cancer rates among Whites, Blacks, and Hispanics respectively. The P-
values returned for the regression were 0.9099, 0.04142, and 0.5407 for Whites, Blacks, and
Hispanics respectively. Saying that there is more of a linear relationship between the variables
for the Black cases than for those of Hispanic and White.
Conclusion
Based on the results, we concluded that the factors observed in this research play a
significant role in the assessment of respiratory cancer rates in relation to TRI sites, median
income level, race/ethnicity and emissions from automobiles. But, we also concluded that there
are probably some underlying factors, such as behavior and genetics that are contributing to the
rates of respiratory cancer among minority groups. Results from the analysis confirm the first
hypothesis that areas with high numbers of TRI sites also experience higher incidence of
respiratory cancer mortality. We also realized that the Hispanic population is more closely
related to the White population when referring to respiratory cancer mortality rates. Despite the
underlying factors (i.e. smoking, exercise, and genetics etc.) the causality of respiratory cancer
among Blacks seems to have a stronger relationship with environmental factors such as pollution
from TRI sites and motor vehicles than the White and Hispanic populations.
Some shortfalls of the research that we encountered were for one: TRI reports include
only annual emission summaries and no other temporal information; simply reporting annual
summaries fails to truly communicate the comparative vulnerability of place. Also, the number
of people within a buffered region is based on the total population within a block group or

13
polygon in which the TRI site is located. And finally, the fact that respiratory cancer mortality
cases are based on county level data, the location of where the person lives is impossible. Using
a smaller study area could solve these problems. Where exact locations of respiratory cancer
incidence can be mapped and other factors can be incorporated to resolve the shortfalls faced in
this research. Ultimately, we hope that this research will help to develop more effective disease-
risk mitigation and prevention programs. Also, identify populations with a high risk for
respiratory cancer so that programs can be more specifically targeted at these populations. And
finally, to detect cancer incidence trends that indicate environmental or other risk factors that can
be controlled or removed by intervention.
Bibliography
Environmental Systems Research Institute, Inc. (ESRI). Census Block Group Demographics and Block Group Coverage's for Counties in Texas Public Health Region 6 and 5 South. www.esri.com. 15 March 2001. Environmental Protection Agency. Toxic Release Inventory (TRI). TRI Sites in Texas Coverage. 15 March 2001. Kubasek, Nancy K. Gary S. Silverman, 1997. Environmental Law. Second Edition. Smith, Zachary A. The Environmental Policy Paradox. 2000. 3rd edition. Texas Cancer Council. Cancer Profile. Cancer Deaths in Texas and Denton County. December 2000. Texas Department of Health. "Epigram TX" database. Mortality Data. www.tdh.state.tx.us.gov. 10, April 2001. Tiefenbacher, John P, Dena Chavez Konopka and Fred M. Shelly. Measuring the Vulnerability of Place. Airborne Toxic Emission Hazards in Texas. 1997.
Related Documents