POPULATION AND HOUSING CENSUS 2011 SOCIO-ECONOMIC AND DEMOGRAPHIC REPORT NATIONAL SERIES, VOLUME - 4 Bangladesh Bureau of Statistics (BBS) Statistics and Informatics Division (SID) Ministry of Planning

Welcome message from author
This document is posted to help you gain knowledge. Please leave a comment to let me know what you think about it! Share it to your friends and learn new things together.
Transcript

POPULATION AND HOUSING CENSUS 2011
SOCIO-ECONOMIC AND DEMOGRAPHIC REPORT
NATIONAL SERIES, VOLUME - 4
Bangladesh Bureau of Statistics (BBS) Statistics and Informatics Division (SID)
Ministry of Planning
ii
EDITORIAL COMMITTEE Chairperson
Md. Nojibur Rahman Secretary-in-Charge
Statistics and Informatics Division (SID) Ministry of Planning
Vice-Chairperson Golam Mostafa Kamal
Director General Bangladesh Bureau of Statistics (BBS)
Members
Md. Mizanur Rahman Deputy Director General Md. Mostafizur Rahman Director Salima Sultana Director Abdullah Harun Pasha Director Aziza Parvin Director Satya Ranjan Mondal Director Md. Shamsul Alam Director (C.C)
Member-Secretary
Ashim Kumar Dey Director (Deputy Secretary) and Project Director, Population and Housing Census 2011. Contact details: E-mail: [email protected]; [email protected] Phone: +88-02-8181424
iii
BANGLADESH POPULATION AND
HOUSING CENSUS 2011
NATIONAL REPORT, VOLUME - 4
SOCIO-ECONOMIC AND DEMOGRAPHIC REPORT
DECEMBER 2012
BANGLADESH BUREAU OF STATISTICS (BBS) STATISTICS AND INFORMATICS DIVISION (SID)
MINISTRY OF PLANNING GOVERNMENT OF THE PEOPLE’S REPUBLIC OF
BANGLADESH

iv
CONTENTS
Items Foreword …………………………………………………………………….…….............. Preface …………………………………………………………………….…….................. Sample Survey Results of Population and Housing Census 2011 At a Glance……… Map of Bangladesh……………………………………………………………………… Chapter 1: Introductory Notes and Definitions ………………………………………… Chapter 2: Sample Design ………………………………………………………………… Chapter 3: Household and Housing Characteristics ………………………………… Chapter 4: Population Characteristics ……………………………………............... Chapter 5: Fertility ………………………………………………… Chapter 6: Mortality ………………………………………………………………….…….... Chapter 7: Migration ………………………………………………………………….……... Chapter 8: Tables …………………………………………… HOUSEHOLD AND HOUSING TABLES (Table H01 – Table H10) Table H01: Household, Population and Living Status by Sex, Division and Residence, 2011 Table H02: Sex of Head of Household by Residence and Division, 2011 Table H03: Population Reading Newspapers, Listening to Radio, Watching Television and Using Internet by Sex, Division, Zila and Residence, 2011 Table H04: Number of Living Rooms by Household Size, Division and Zila, 2011 Table H05: Number of Sleeping Rooms by Household Size, Division and Zila, 2011 Table H06: Type of Toilet, Waste Disposal, Source of Light and Cooking Fuel by Housing Tenure, Division and Residence, 2011 Table H07: Type of Toilet, Waste Disposal, Source of Light and Cooking Fuel by Housing Tenure and Zila, 2011 Table H08: Main Source of Drinking Water by Distance to Source of Water, Division and Residence, 2011 Table H09: Main Sources of Drinking Water and Household Drinking Boiled/Bottled/Filtered Water by Zila, 2011 Table H10: Average Household Size by Residence, 1974 – 2011 POPULATION CHARACTERISTICS TABLES (Table P01 – Table P16) Table P01: Age at First Marriage of Ever Married Population by Age Group, Sex and Residence, 2011 Table P02: Number of Marriage by Age, Sex and Residence, 2011 Table P03: Number of Wives for Ever Married Men by Age and Residence, 2011 Table P04: Survival Status of Parents for Population Aged 0 to 18 by Age, Sex and Residence, 2011 Table P05: Percent with Bangla as Mother Tongue by Sex and Residence, 2011 Table P06: Second Language by Age, Sex and Residence, 2011 Table P07: Percentage of Literate Population Aged 7 Years and above by Age, Sex and Zila, 2011 Table P08: Occupation of Population Aged 15 Years and above by Age, Sex and Residence, 2011 Table P09: Educational Attainment of Population Aged 15 Years and above by Occupation, Sex and Residence, 2011 Table P10: Occupation of Head of Household by Highest Class Passed, Sex and Residence, 2011 Table P11: Sector Wise Population Aged 15 Years and above by Employment Status, Sex and Residence, 2011Table P12: Occupational Status of Population by Highest Class Passed, Sex and Residence, 2011 Table P13: Occupational Status of Population by Highest Class Passed, Sex and Residence, 2011
CONTENTS

v
Items Table P14: Industry of Population Aged 15 Years and above by Employment Status, Sex and Residence, 2011 Table P15: Marital Status of Female Employed Population by Employment Status and Residence, 2011 Table P16: School Attendance of Population (Aged 3 to 16 Years) by Survival Status of Parents and Sex, 2011 FERTILITY TABLES (Table F01 – Table F09) Table F01: Women Aged 15 Years and Over by Age Group, Average Number of Children Born, Usual Living Status of Children and Children Died by Residence, 2011 Table F02: Women Aged 15 – 49 Years that Gave Birth in the Last 12 Months by Age Group, Number of Children Ever Born Alive, Children Still Living, Children Died and Residence, 2011 Table F03: Women Aged 15 – 49 Years who Gave Birth in the last 12 Months by Age Group, Residence and Persons Assisted in Delivery, 2011Table F04. Women Aged 15 – 49 Years who Gave Birth in the Last 12 Months by Age Group, Residence and Place of Delivery, 2011 Table F05:Total Fertility Rates (TFRs) by Residence, 1982 – 2011 Table F06: Crude Birth Rates (CBRs) by Residence, 1982 – 2011Table F07: Age Specific Fertility Rates (ASFRs) by Residence, 1982 – 2011 Table F08: Level of Education of Women Aged 15 – 49 Years who Gave Birth in the Last 12 Months by Persons Assisted in Delivery and Residence, 2011 Table F09: Age Specific Fertility Rates (ASFRs) and Total Fertility Rates (TFRs) by Division and Zila, 2011 MORTALITY TABLES (Table M01 – Table M05)Table M01: Deaths in the Last 12 Months by Residence, Age and Sex of the Deceased, 2011 Table M02: Deaths in the Last 12 Months by Residence, Place of Death, Age and Sex of the Deceased, 2011 Table M03: Maternal Deaths 12 Months Prior to the Survey and Maternal Mortality Ratios by Age, Residence and Division, 2011Table M04: Crude Death Rate (CDR) by Sex and Residence, 1991 – 2011 Table M05: Child Death Rate by Sex and Residence, 1991-2011 MIGRATION TABLES (Table Mig01 – Table Mig07) Table Mig01: Lifetime Internal Migration by Place of Birth and Zila, 2011 Table Mig02: Internal Migration by Place of Residence over the Last 5 Years by Zila, 2011 Table Mig03: Members Returned from Abroad by Country and Sex, 2011 Table Mig04: Reasons for Return Members from Abroad by Country, 2011 Table Mig05: Educational Qualification of Returnee by Sex and Country from Return Abroad, 2011 Table Mig06: Reasons for Immigration by Country of Destination and Sex, 2011 Table Mig07: Educational Qualification of Immigrant by Age and Sex, 2011
Appendices Appendix – I : List of Personnel Engaged in Preparing this Report……… Appendix – II : Census Questionnaire……………………………………………… Appendix – III : Sample Census Questionnaire......................................................

vi
Foreword
The fifth Population and Housing Census was conducted over a period of five days starting at the zero hour of 15 March 2011 and completing on the 19 March 2011. Population census done in every ten years indeed is the only recognized source in Bangladesh for quality benchmark database pertaining to population size and its spatial distribution and for various basic demographic characteristics. Along with national level aggregates, the census has generated detailed segregated data at community levels (mahallas/mauzas/villages) of the country being a full-count statistical undertaking. The initiative of publishing zila, community and national reports has been undertaken considering the importance of community level data and information apart from national level in the process of determining policy-strategy and decision-making. The Socio-economic and Demographic Report is an effort of the national reports publication to supplement the main census. In this report, the sample survey results for national, zila and six city corporations’ levels have been presented. I believe that the wide array of sample survey findings presented in this report will be useful to planners and policy makers in formulating, implementing and evaluating responsive development plans and programmes for human resource advancement and overall development as stipulated in the Vision 2021. In addition, the sample survey data and information of this report will be helpful for researchers both at home and abroad. I am pleased to learn that Bangladesh is one of the pioneers in the development world which successfully applied ICR (Intelligent Character Recognition) and iCADE (Integrated Computer Assisted Data Entry) technologies in capturing and processing a large volume of census and survey data in a short span of time. It is indeed a commendable endeavour in census operation. Census is a massive operation which can not be performed by the national statistical organization alone. Its success depends on the joint efforts of the government and the people at large. I express my heart-felt gratitude to all citizens of Bangladesh for providing whole-hearted support and cooperation in census operation and the government and non-government personnel for making significant contribution to this operation. I am especially thankful to the members of Mass Media, Field Administration, Local Government Institutions at all levels and the public representatives who actively participated and motivated the public to provide accurate and reliable information during the census. Their contribution and all-out support towards making the census a success will always be highly appreciated. Under the publication plan, 135 reports of the main census had been planned to publish including Community Reports (64 reports), Zila Reports (64 reports), National Series-Analytical Report (Volume-1), Union Statistics (Volume-2), Urban Area Report (Volume-3), Administrative Report (Volume-5), Post Enumeration Check (PEC) Report, Preliminary Report and Socio-economic and Demographic Report (Volume-4). Among them Community Reports, PEC Report and Preliminary Report have already been published. The present report is the comprehensive sample survey report covering wide spectrum of demographic and socio-economic scenarios. It is my firm belief that the report will not only be useful for planners, policy makers, researchers, population scientists and administrators but also for development partners and BBS itself for undertaking future activities. I express my gratitude to the United Nations Population Fund (UNFPA), European Union (EU), U.S. Census Bureau (USCB) and United States Agency for International Development (USAID) for their financial and technical supports for completing this huge task. I am grateful to the Cabinet Secretary and the Secretary, Ministry of Public Administration for their active cooperation and continuous encouragement and support. I express my gratitude to the Honourable Minister, Ministry of Planning for his leadership, guidance and active cooperation in making this census a real success. I also extend my thanks to the Director General of Bangladesh Bureau of Statistics Mr. Golam Mostafa Kamal, Project Director Mr. Ashim Kumar Dey and all relevant Officials and Staff who have been firmly committed and dedicated to ensure the consistency of the survey in general and publish the Socio-economic and Demographic Report of the National Series in particular. Last but not least, I would also like to put on records the sincere efforts made by the members of

vii
the Editorial Board led by my esteemed predecessor Ms. Riti Ibrahim in upholding the quality of the report.
Dhaka ( Md. Nojibur Rahman ) Poush 16, 1419 December 30, 2012
Secretary-in-Charge Statistics and Informatics Division
Ministry of Planning Government of the People’s
Republic of Bangladesh

viii
Preface
Bangladesh inherited the tradition of conducting the population census on decennial basis since 1872. The fifth Population and Housing Census of Bangladesh and fifteenth in the region, sequencing the decennial periodicity, was conducted during March 15-19, 2011. The main objective of the census was to collect information on the basic characteristics related to housing, households and population for developing a comprehensive database for all development planning and human resource development programmes as well as economic management. With the diversification of research and development, scope and coverage in data needs have been increasing continuously. It is very difficult to meet all such data needs of various sectors through hundred percent count. During 1974 and earlier censuses data were collected on several items but a few of them were processed on hundred percent basis. From the experience it has been observed that addition of numerous questions inversely affect the quality of information. Thus following the international practice of trade-off, Bangladesh continued to collect data on basic characteristics through census and detailed socio-economic information through sample survey. For international comparison, Bangladesh census also followed concepts and recommendations of Global Rounds of population census. Under the conceptual framework of the United Nations, Bangladesh Bureau of Statistics had conducted the fifth Population and Housing Census of Bangladesh in 2011 in three phases as follows:
In phase I, basic data about all households and individual members of the households were gathered through using ICR formatted questionnaire during March 15-19, 2011.
In phase II, quality and coverage of the main count were verified through a Post Enumeration Check (PEC) survey during April 10-14, 2011. For the first time in census history of Bangladesh, the PEC was conducted by an independent organization, Bangladesh Institute of Development Studies (BIDS).
In phase III, detailed socio-economic information was collected by adopting a long machine readable questionnaire in a sample survey to supplement the main census held during October 15-25, 2011.
Bangladesh Bureau of Statistics (BBS) had started the census preparatory activity from the beginning of 2009 with the updating of maps and area Geo-codes. A draft sample design was prepared by the Project Director to get cost effective and reliable estimates at the national, zila and city corporation levels. It was presented in a seminar-cum- expert consultation for open discussion and for obtaining recommendations. The recommendations were first examined by the Census Standing Technical Committee. The Census Standing Technical Committee had formed a sub-committee to design the sample and the questionnaire and to firm up the operational aspects of sample survey and to initiate and monitor the progress in detail. A sub-committee on sample survey and a supporting technical committee on sample design were also formed to check and modify the technical aspects of the sample design. The sample design was a stratified-two-stage cluster design which was a realistic one. Accordingly, the questionnaire was designed in a machine readable format with the technical assistance from US Census Bureau and was printed abroad with the financial assistance from European Union (EU) through the United Nations Population Fund (UNFPA). In the main census there were 293,579 Enumeration Areas (EAs). On an average, an EA was comprised of 120 households. The sample survey covered 6,720 Enumeration Areas (EAs) which were selected as Primary Sampling Units (PSUs). For operational convenience a total of 25 households were selected from each PSU as Secondary Sampling Units (SSUs). In all, 2.29% of EAs and 0.52% of households were covered in the sample survey. De jure Method was adopted in counting the population of Sample Survey, 2011. Following the method regular members of the households were counted whether they were present in the household at the time of enumeration or not. Zero hour of the night of following 14

ix
October, 2011 was considered as the sample survey moment and the period from survey moment to 6.00 am was considered as sample survey night. Enumeration period was 10 days starting from 15 October 2011. For operational convenience all the available Officers and Staff Members of BBS were mobilized as follows: Functional Designation
Designation Number
Chief Census Coordinator Secretary, Statistics and Informatics Division (SID)
1
National Census Coordinator
Director General, Bangladesh Bureau of Statistics (BBS)
1
Deputy National Census Coordinator
Joint Secretary, SID & Deputy Director General, BBS
2
Census Zila Coordinator Director/Deputy Secretary/Joint Director/Deputy Director/Statistical Officer
70
Upazila Census Coordinator
Upazila Statistical Officer/Assistant Statistical Officer
483
Supervisor USO/ASO/TS/SI/SA/JSA 840 For actual enumeration 3,360 enumerators were employed from among the local educated unemployed females.
A verbatim training manual was prepared and used for imparting uniform training to all the sample survey workers. Training was given at two levels:
(i) Training of Master Trainers (Census Zila Coordinators) at Dhaka and (ii) Training of Supervisors and Enumerators at the zila level.
A calendar of Sample Survey activities was developed and was adhered to strictly in providing training, distribution of survey materials, doing actual enumeration and returning all filled-in questionnaires to the Dhaka Headquarters. A centralized processing system was developed constituting the survey analysis and report writing team. Under the system, computer editing, data capture through ICR/iCADE and tabulation through CSPro software were systematically linked.
Censuses are now-a-days a global event. In that respect, Bangladesh Population and Housing Census truly belongs to the world family of Population and Housing Censuses. For the first time ever, the key findings of the sample survey will be published in the Analytical Report (Volume-1) of the main census. In line with our principled stand to ensure consistency, the detailed information of sample survey were checked and verified with the results of main census at the lowest geographic area level, where it was necessary. Direct measures of fertility, mortality, housing and population characteristics were compared with the indirect measures obtained from both the census and the sample survey. To supplement the main census the sample survey report is being published as National Report (Volume-4), which is known as Socio-economic and Demographic Report.
I express my deepest gratitude to Mr. Md. Nojibur Rahman, Secretary-in-Charge and Ms. Riti Ibrahim, Ex-Secretary, Statistics and Informatics Division (SID) for their wholehearted cooperation, guidance and support in formulating this report.
I express my deep gratitude to all Standing Technical Committee Members, Development Partners and also to all participants of the seminar-cum-expert consultations for their valuable contributions towards finalizing the questionnaire and the sample survey program.
I am thankful to all members of the Sampling and Report Writing Team for their valuable contribution. I am also thankful to our Local Government bodies, Field Administration and the people of all levels for their wholehearted support to the sample survey. Finally, I thank the Project Director Mr. Ashim Kumar Dey and other Officials and Staff Members of Statistics and Informatics Division (SID) and Bangladesh Bureau of Statistics

x
(BBS) for their untiring efforts in making the sample survey a success within a very short period of time and in publication of this report. Dhaka ( Golam Mostafa Kamal ) Poush 16, 1419 (Additional Secretary) December 30, 2012 Director General Bangladesh Bureau of Statistics

xi
SOCIO-ECONOMIC AND DEMOGRAPHIC REPORT 2011 KEY FINDINGS
Indicators/Variables 2011 2004 1991 1. Housing and Household A. Type of Dwelling -
Separate 77.5 - -Apartment 6.3 - -Joint/Barrack house 16.2 - -
B. Household Size (Dwelling) Total 4.35 4.66 5.5*Rural 4.36 4.68 5.5*Urban 4.29 4.57 5.5*
C. Reading Newspaper, Listening to Radio, Watching Television and Using Internet
a. Reading Daily Newspaper National 15.25 10.18 6.62 Rural 12.74 6.10 4.76
Urban 25.80 24.80 22.24b. Listening to Radio National 3.92 20.16 - Rural 3.88 24.01 -
Urban 4.13 13.79 -c. Watching Television National 44.80 20.54 - Rural 39.07 14.92 -
Urban 68.92 29.88 -d. Using Internet National 1.11 - - Rural 0.45 - -
Urban 3.88 -D. Household Facilities a. Source of Drinking Water
Tap 8.1 7.81 4.05Tube-well/Deep Tube-well
89.1 50.97 82.53
Well 0.7 1.83 7.16Pond 1.3 1.34 4.57River/Ditch/Canal 0.4 7.83 1.69Others 0.5 30.22 -
b. Toilet Facilities Sanitary with water seal 27.8 - -Sanitary without water seal
33.8 - -
Non-sanitary/Kutcha 31.4 - -Open Space 7.0 - -
c. Source of Light Electricity 56.6 39.77 14.37Solar energy 3.3 - -Kerosene 39.5 59.93 84.73Bio-gas 0.1 - -Others 0.5 0.31 0.89
d. Cooking Fuel Wood 34.8 31.76 44.27Kerosene 1.0 1.79 0.57Gas/LPG 12.6 9.09 2.36

xii
Indicators/Variables 2011 2004 1991 Electricity 0.4 0.76 0.88Straw/Leaf/Dried cow dung
51.2 55.91 -
Bio-gas 0.1 - -E. Construction Material -a. Wall
Straw/Bamboo/Polythene/Plastic/Canvas
13.9 44.44 56.2*
Mud/Un-burnt brick 16.7 20.05 22.7*Tin (CI Sheet) 40.6 22.98 -Wood 1.7 1.63 13.1*Brick/Cement 26.1 10.90 8.0*Others 1.0 - -
b. Roof Straw/Bamboo/Polythene/Plastic/Canvas
4.4 28.48 47.3*
Tin (CI Sheet) 83.0 66.98 48.6*Tally 1.5 - -Brick/Cement 10.7 4.13 4.6*Others 0.4 0.47 -
c. Floor Mud 74.0 - 93.77Wood/Bamboo 1.1 - 1.63Brick/Cement 23.2 - 4.61Mosaic/Tiles 1.7 - -Others - - -
2. Population Characteristics A. Sex Ratio and Marital Status a. Sex Ratio National 99.68 104.1 106.26 Rural 99.97 104.6 106.48
Urban 98.47 102.6 104.46b. Marital Status Male
Never married 52.86 41.47 42.10Married 46.37 57.59 57.20 Widower/Widowed 0.62 0.79 -Divorced 0.06 0.06 -Separated 0.10 0.05 -
Female Never married 41.59 27.12 25.2*Married 50.96 64.37 64.8*Widower/Widowed 6.52 7.54 -Divorced 0.49 0.46 -Separated 0.44 0.51 -
c. Mean Age at Marriage Male 23.9 24.2 23.11
Female 17.5 19.3 16.27d. Remarriage Male Married once 93.5 94.28 87.97
Married more than once 6.5 5.72 12.03Female Married once 97.92 97.71 94.91
Married more than once 2.08 2.29 5.09B. Literacy and Education a. Literacy (All ages)
xiii
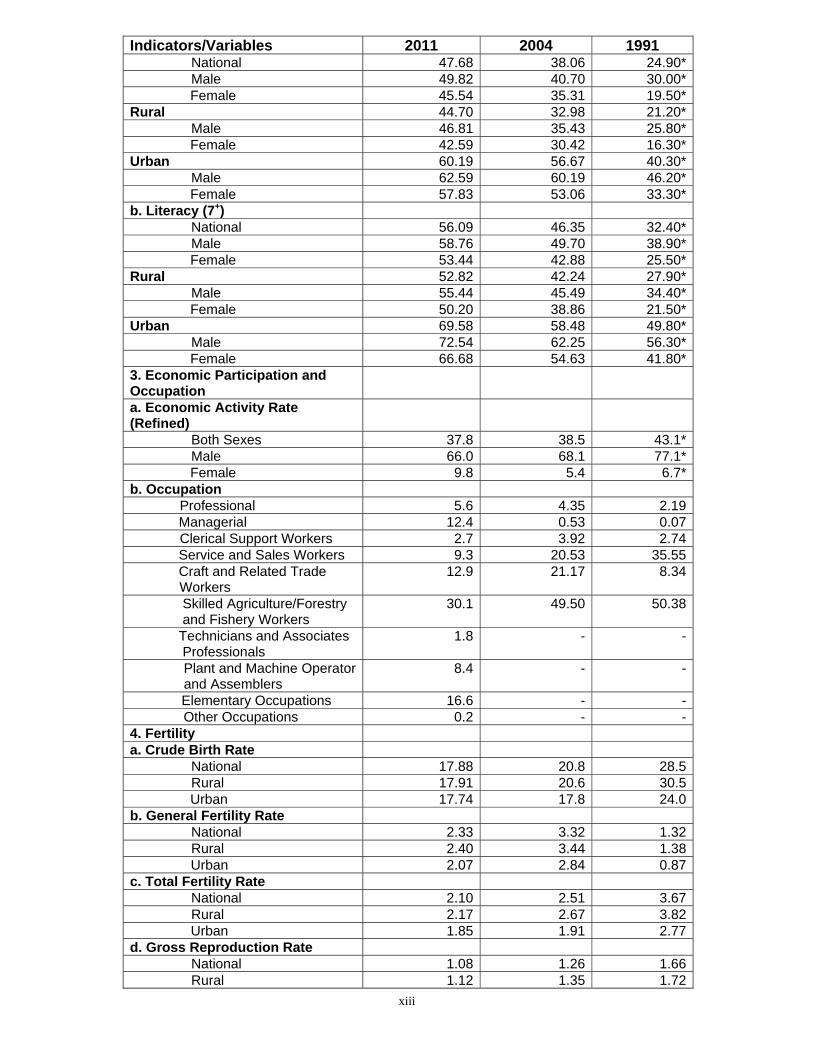
Indicators/Variables 2011 2004 1991 National 47.68 38.06 24.90* Male 49.82 40.70 30.00*
Female 45.54 35.31 19.50*Rural 44.70 32.98 21.20* Male 46.81 35.43 25.80*
Female 42.59 30.42 16.30*Urban 60.19 56.67 40.30* Male 62.59 60.19 46.20*
Female 57.83 53.06 33.30*b. Literacy (7+) National 56.09 46.35 32.40* Male 58.76 49.70 38.90*
Female 53.44 42.88 25.50*Rural 52.82 42.24 27.90* Male 55.44 45.49 34.40*
Female 50.20 38.86 21.50*Urban 69.58 58.48 49.80* Male 72.54 62.25 56.30*
Female 66.68 54.63 41.80*3. Economic Participation and Occupation
a. Economic Activity Rate (Refined)
Both Sexes 37.8 38.5 43.1* Male 66.0 68.1 77.1*
Female 9.8 5.4 6.7*b. Occupation Professional 5.6 4.35 2.19
Managerial 12.4 0.53 0.07 Clerical Support Workers 2.7 3.92 2.74
Service and Sales Workers 9.3 20.53 35.55 Craft and Related Trade Workers
12.9 21.17 8.34
Skilled Agriculture/Forestry and Fishery Workers
30.1 49.50 50.38
Technicians and Associates Professionals
1.8 - -
Plant and Machine Operator and Assemblers
8.4 - -
Elementary Occupations 16.6 - - Other Occupations 0.2 - -4. Fertility a. Crude Birth Rate National 17.88 20.8 28.5 Rural 17.91 20.6 30.5
Urban 17.74 17.8 24.0b. General Fertility Rate National 2.33 3.32 1.32 Rural 2.40 3.44 1.38
Urban 2.07 2.84 0.87c. Total Fertility Rate National 2.10 2.51 3.67 Rural 2.17 2.67 3.82
Urban 1.85 1.91 2.77d. Gross Reproduction Rate National 1.08 1.26 1.66 Rural 1.12 1.35 1.72

xiv
Indicators/Variables 2011 2004 1991 Urban 1.02 1.11 1.22
e. Net Reproduction Rate National 1.05 1.18 1.39 Rural 1.09 1.25 1.47
Urban 0.93 0.91 1.09f. Total Marital Fertility Rate National 2.77 3.32 4.5 Rural 2.81 3.44 4.5
Urban 2.61 2.84 2.8g. Age Specific Fertility Rate National 15-19 0.05 0.05 0.08 20-24 0.14 0.16 0.20
25-29 0.11 0.14 0.1830-34 0.07 0.09 0.1235-39 0.03 0.05 0.0840-44 0.01 0.02 0.0445-49 0.01 0.01 0.02
Rural 15-19 0.05 0.06 0.08 20-24 0.15 0.17 0.21
25-29 0.11 0.14 0.1930-34 0.07 0.09 0.1335-39 0.04 0.05 0.0840-44 0.01 0.02 0.0545-49 0.01 0.01 0.02
Urban 15-19 0.04 0.04 0.0620-24 0.11 0.13 0.1525-29 0.11 0.13 0.1530-34 0.06 0.08 0.1135-39 0.02 0.40 0.0640-44 0.01 0.01 0.0245-49 0.01 0.004 0.01
h. No. of Children Ever Born National
15-19 0.38 0.42 0.3420-24 1.04 1.18 1.3425-29 1.84 2.11 2.6030-34 2.52 2.93 3.6835-39 3.08 3.54 4.5540-44 3.49 4.00 5.1945-49 3.88 4.41 5.59
Rural 15-19 0.38 0.43 0.4820-24 1.07 1.22 1.4425-29 1.90 2.20 2.6330-34 2.61 3.05 3.7335-39 3.18 3.67 4.5840-44 3.61 4.14 5.2245-49 3.98 4.45 5.62
Urban 15-19 0.40 0.40 0.5220-24 0.96 1.07 1.3325-29 1.61 1.82 2.3430-34 2.17 2.55 3.3135-39 2.72 3.14 4.24

xv
Indicators/Variables 2011 2004 1991 40-44 3.02 3.52 4.8845-49 3.47 3.93 5.36
5. Mortality a. Crude Death Rate National 4.8 6.1 9.7 Rural 4.7 6.4 9.9 Urban 5.1 5.2 7.2b. Infant Mortality Rate National 37.3 54 87 Rural 37.9 57 88
Urban 35.0 41 69c. Child Death Rate National 2.71 4.4 13.6 Rural 2.70 4.6 14.4
Urban 2.71 3.9 8.3d. Maternal Mortality Rate National 2.18 3.4 4.72 Rural 2.44 3.8 4.84
Urban 1.05 1.8 4.026. Migration a. Internal Migration Rate 9.70 9.34 10.02b. Internal migration by Direction Rural to Rural 4.20 2.99 8.60
Urban to Rural 0.36 0.38 1.42 Urban to Urban 0.85 26.41 28.04
Rural to Urban 4.29 4.79 5.62c. International Migration Rate 3.46 - -
*Indicates main census results.

xvi
Map of Bangladesh

National Series: Socio-economic and Demographic Report Page 1
CHAPTER - 1
INTRODUCTORY NOTES AND DEFINITIONS
1.1 Background The fifth as well as the last Population and Housing Census in Bangladesh was conducted during March 15-19, 2011 and the Sample Census, i.e., Socio-Economic and Demographic Survey was conducted during October 15-25, 2011. Generally the Sample Survey is always conducted with a short gap of the census conduct with a view to supplementing the data support to the census as because of the census information and data on population are collected with a short questionnaire where population and other fundamental questions are kept priority basis on the national issues for the government planning and policy formulation. In the subsequent survey, a long questionnaire is used to collect the subjective data on various purposes, especially to fill up the data gap on the current socio-economic condition and to perceive the demographic status of population in the country. Some other basic information on housing, health, sanitation, electricity, source of drinking water and any other particular issue that comes up and needs to the state policy formulation are also put in the questionnaire. 1.2 Concepts and Definitions As this survey is a supplement to the main census, almost the definitions of technical and statistical terms of the census have been used and defined as usual in this report. In spite of that there are some other points apart from the definitions those need to be transparent. There may be difference between the survey estimates and census results. With a view to making comparison among variables and to define the relations and fluctuations, both the census results and survey estimates are put forth together in tables for better analysis in many occasions. But data references for both the findings are not equally comparable due to inner data-weights and from the methodological point of view. The census is a direct data provider. On the other hand, survey provides blown up estimates from the sample frame collected within a very narrow structure compared to the whole population. The second thing is the sample census and sample survey. Basically there is no fundamental difference between the terms from the point of methodological point of view. The sample census is conducted immediately after the census conduct following the sampling methods and the blown up estimates are provided. The sample survey may be conducted at any convenient time depending on the whole population (here, households) of the census structure and estimates are supplied from the blown up survey data. 1.3 Objectives of Survey Household based Sample Survey is a basic and suitable method of data collection for population and socio-economic and demographic statistics. Therefore, the socio-economic and demographic survey has always been conducted near by a convenient time of the census completion. In many occasions, the survey is complementary to the census and provides supplementary data for the census to fill up the data gap, especially on the housing, health and demography those relate to population. It has some definite objectives which are described below:
collecting information on household and housing status; providing data on household structural composition, relationship, size and the
headship; obtaining data on age pattern, sex and demographic characteristics by gender
issues; collecting information on public utilities such as water supply and sanitation,
electricity connection etc. and generating data on household income, occupation and other socio-economic
activities involved to household.

National Series: Socio-economic and Demographic Report Page 2
1.4 Questionnaire and Reference Period A four pages long sample survey questionnaire in module form was designed and a total of 81 questions on 10 separate modules matters were incorporated. The sample survey was conducted during October 15-25, 2011. The BBS employees were the supervisors and the hired females were the interviewers. Data was collected carefully from the heads of households or reliable respondents of the households. A total of 25 sample households per enumeration area were covered within 10 days by 3360 female interviewers deployed all over the country and they all were supervised by 840 BBS employees with a proper chain of command under the guidance of the Director General of BBS. The 10 (ten) separate modules of the sample questionnaire are given below:
Modules 1) Identification and Household Summary 2) Housing Related 3) Household Related 4) Individual 5) Economic Activities 6) Nuptiality 7) Fertility 8) Members Returned from Abroad 9) International Migration
10) Death 1.5 Statistical/Technical Terms and Definitions Mostly the definitions and terms used in the survey are adopted intact from the census and without any change to facilitate the tools of comparison among similar variables. It offers the opportunity to study the changes/fluctuations of variables intensively. In addition some other clarifications relate to the subject are given where necessary. However, the terms and definitions used in the survey are defined by turns. Household: A group of persons, related or unrelated, living together and taking food from the same kitchen. Slum Household: Slum household is a dwelling household in the slum area. The housing structure of which is made of with the least cost materials and is built very temporary basis. The uprooted and floating poor, labourers, peddlers (hawkers) are the members of slum households. Slums are seen mainly in the towns/cities beside the main roads/highways or near by mills/factories/small scale industries, railway stations/junctions, or beside the railway line, near the market places, etc. or even on the government abandoned land/properties. Enumeration Area: An enumeration area means a well defined and specified area of enumeration assigned to an enumerator. A map of this area is prepared showing boundaries and locations. An enumeration area may consist of taking several households. A mauza can be divided into several enumeration areas. In the sample survey 2011 an enumeration area was comprised of taking 25 households. Establishment: The basic unit of economic activity is called establishment. It is usually a combination of both activities and resources under a single ownership and location.
Literacy: Person who is able to write a simple letter is defined as literate.
Educational Attainment: Educational attainment is defined as the highest grade completed within the most advanced level attended in the educational system of the country where the education is received. It is not the number of years spent at school which is counted but the highest grade or level completed in the regular school system. The term “completed” means the successful completion of a given grade or level of education of schooling years.
National Series: Socio-economic and Demographic Report Page 3
School Enrolment: The school enrolment is a ratio of total pupils (students) registered or enrolled to the school age population expressed in percentage.
Attendance Ratio: Attendance ratio is the ratio of pupils actually in attendance to pupils enrolled expressed in percentage. Sex Ratio: The ratio of males to females in a given population usually expressed as the number of males per 100 females. Growth Rate: The growth rate is the ratio of annual change to a number compared to the past expressed in percentage. This rate of change may be positive or negative in sense. In this report the growth is calculated using the following annual compounding formula:
= (1 + r) t Where,
= Current population, = Previous population, r = Annual population growth rate, t = Time period between the preceding and the subsequent.
Economic Participation: Economic participation means the participation of population in the economic activities. Basically it indicates the economically active population or labour force which is comprised of all persons of either sex who furnish the supply of labour for the production of economic goods and services during the time-reference period chosen to the investigation. It includes employed and unemployed population. Employed population currently may be at work or may not be at work for time-being. Unemployed population indicates persons capable of working and still looking for work. They all are included in the labour force. “Labour force” is a similar terminology used for economically active population. It also refers both category of active persons under the civilian labour force and those of armed force members. On the other hand, economically inactive population consists of all persons who are not in the labour force and do not contribute directly to production of economic goods and services. This group of persons is comprised of persons engaged in household work (home-makers), students, income recipients, and other persons who are invalid due to physical disability and handicap, children and old-age retired persons incapable of working. Thus, a country’s total population is divided into two major groups: (i) Economically active population and (ii) Economically inactive population.
Working Population: Working population indicates persons currently at work and looking for work and excludes persons not at work. Working population means the population those who are at work during the survey.
Crude Activity Rate: The crude activity rate is defined as the ratio of economically active population in the age group 10 years and over to the total population expressed in percentage. The crude activity rate and refined activity rate are jointly called activity rate.
Refined Activity Rate: The refined activity rate is the ratio of economically active population in the age group 10 years and over to total population of the same age group expressed in percentage.
Self Employed: A person/persons who operate/operates an enterprise or business on his/her own account or operate/operates in jointly with others in the form of partnership. A self-employed person may or may not hire workers to assist him/her in his/her enterprise.
Employer: An employer is a self-employed person who operates his or her own economic enterprise or engages independently in a profession or trade and hires one or more persons for his/her economic institution or in a dwelling house where he/she himself/herself participates actively.

National Series: Socio-economic and Demographic Report Page 4
Unpaid Family Helper/Worker: A person who works a specified minimum amount of time without pay in a family or in an operated farm or business owned or operated by the head of household or by any other member of the household to whom they are related by kinship, marriage, adoption or dependency.
Employee: A person who works for a public or private employer and receives remuneration in wages, salary, commission, tips, piece-rates or pay in kind.
Unemployed: The unemployed consists of all persons who, during the reference period, are not at work but who are seeking work for pay or profit including the person who never worked before. Also the persons who, during the reference period, are not seeking work because of temporary illness. They have made arrangements to start a new job subsequent to the reference period or they were on temporary or indefinite lay-off without pay.
Household Work: Persons engaged in house-wifery activities or various types of housework or domestic type of work at home other than economic activities, such as cooking, washing, taking care of household members, children, etc. are considered as household work. Either male or female may engage himself/herself in household work. Singulate Mean Age at Marriage (SMAM): SMAM is defined as an estimate of the mean number of years lived by cohort of women before their first marriage. This is an indices method of estimation the mean age at marriage. Crude Divorce Rate: It is a relative number of divorces per 1000 population.
Median Age: Median age is the middle most age with half of the population lying above and the other half lying below the age. Dependency Ratio: Dependency ratio has been defined as the ratio of sum of population aged 0-14 years and 60+ years to the population aged 15-59 years expressed as percentage.
Infant: Infant refers to a baby who has not yet reached in his/her first birth day and is shown age 0 or under 1 year. Child- Woman Ratio (CWR): The ratio of children under five (0-4) years of old to women of ages 15-49 is often called the child-women ratio. This is commonly expressed per 1000 population. Crude Birth Rate (CBR): The ratio of live births in a specified period (usually one calendar year ) to the average population in that period (normally taken to be the mid year population). The value is conventionally expressed per 1000 population. Age-Specific Fertility Rate (ASFR): Number of live births occurring to women of a particular age or age group normally expressed per 1000 women in the same age- group in a given year. It is usually calculated for 5 years age groups from 15-19 to 40-44 or 15-19 to 45-49. Total Fertility Rate (TFR): The sum of the Age-Specific Fertility Rates (ASFR) over the whole range of reproductive ages for a particular period (usually a year). It can be interpreted as the number of children a woman would have during her lifetime if she were to experience the fertility rates of period at each age. General Fertility Rate (GFR): The GFR is the ratio of total number of children born alive per woman to the total number of women of ages 15-49 expressed per 1000 population. Net Reproduction Rate (NRR): The average number of daughters that would be born to a woman if she passed through her lifetime from birth conforms to the age specific fertility rates of a given year. This rate is similar to the Gross Reproduction Rate (GRR) and takes into account

National Series: Socio-economic and Demographic Report Page 5
that some women will die before completing their childbearing years. NRR means each generation of mothers having exactly enough daughters to replace itself in the population. Crude Death Rate (CDR): The crude death rate (CDR) is the number of deaths per 1000 mid-year population in a given year. Under 5 Mortality Rate: Under-five mortality rate is defined as the number of deaths among children in age 1-4 per 1000 mid-year population in the same age group. Infant Mortality Rate (IMR): The number of deaths occurring during a given year among the live-born infants who have not reached their first birthday divided by the number of live births in the given year. It is usually expressed per 1000 live births. Maternal Mortality Ratio (MMR): The maternal mortality ratio (MMR) is the ratio of the number of maternal deaths during a given time period per 100,000 live births during the same time-period. A maternal death refers to a female death from any cause related to or aggravated by pregnancy or its management (excluding accidental or incidental causes) during pregnancy and childbirth or within 42 days of termination of pregnancy, irrespective of the duration and site of the pregnancy. Life Expectancy at Birth: Expectation of life is the average remaining lifetime or the average number of year of life remaining at the beginning of age. Expectation of life at birth (eo
o) is the average number of years of life remaining at beginning, i.e. ‘0’ year of age. Natural Growth Rate (NGR): The natural growth rate is the difference between crude birth rate (CBR) and crude death rate (CDR) expressed in percentage. Crude Marriage Rate (CMR): CMR is the ratio of marriages in a given year to the mid-year population of that year.
Migration: Migration is defined in this survey as the movement of persons who change their place of residence, except for marriage, for a period of six months or more. The time period for the migration due to marriage is not fixed. Migration Rate (MR): The in or out migration rate is defined as the number of in or out migration per 1000 mid-year population of a particular area for a specified time interval.
1.6 Some Other Concepts and Terms Used in the Survey In this survey report there are some other concepts and terms used in several sections of the technical analysis. Even in some common terms need to clarify as they are similar to other and are used to express the specific meaning. For example, “cohort” is a demographic common term which is used to explain the observations of some different demographic phenomena. It often yields the useful clues to estimate the magnitude of changes taking place in a cohort analysis and to infer social and economic implications of those changes occurring in a cohort over time. Thus, the concept of cohort plays an important role for analytical and other observations of the population. In the survey many other concepts/terms are used and these are defined in turn. Main Occupation: Occupation refers to the kind of work done during the time-reference period established for data on economic characteristics by the person employed (or performed previously by the unemployed). The head of household or other household members may engage himself/herself in more than one activity to earn more for economic solvency or to support the insufficient principal income. In the sense the survey questionnaire is put forth to inquiry about the main occupation and other subsidiary occupations. Main occupation is defined as the job mainly done by the member in exchange of which he/she gets some benefits either in cash or in kind for livelihood.

National Series: Socio-economic and Demographic Report Page 6
Subsidiary Occupation: If a member is engaged in more than one occupation, the occupation other than the main occupation is considered as subsidiary occupation. It is also called the secondary source of income. Type of Industry: Industry refers to the activity of the establishment in which an economically active person worked during the time-reference period established for data on economic characteristics or last worked, if employed. The survey covers all types of industries or establishments in which persons were engaged in producing or distributing goods and services during the reference period. Death: Death is the permanent disappearance of a member from all evidences of life at any time after live birth has taken place. But death prior to the complete expulsion or extraction from its mother of a product of conception, irrespective of the duration of pregnancy, the death is indicated by the fact that after such separation the foetal does not breathe or show any other evidence of life, such as beating of the heart, pulsation of the umbilical cord, or definite movement of voluntary muscles. Such foetal death is not considered in the survey as it is very difficult to identify. Age at Death: Age in complete years at the time of death is defined as age at death. In case, age is less than one year, age is recorded in number of complete months and any death at age below 1 year is called neonatal death. Duration of Marriage: Duration of marriage is the time during which marriage lasted or continued. Live Birth: Live birth refers to the births occurred after pregnancy and shows signs of life such as crying, breathing etc. Neo-natal Mortality Rate (NMR): The neo-natal morality rate is defined as the number of deaths of infants under 1 month of age during a year per 1000 live births in that year. Post-Neonatal Mortality Rate (PNMR): The post-neonatal morality rate is defined as the number of infant deaths under 1 through 11 months of age during a year per 1000 births in that year. Crude Separation Rate: Crude Separation Rate is a relative number of separations per 1000 population. Antenatal Care: Proportion of women aged 15-49 years that were attended at least once during pregnancy by skilled health personnel. Internal Migration: Migration that takes place between the regions within the country. Enrollment Rates: Percentage of children 6-10 years of age enrolled in primary schools. The figures represent net enrollment rates. The age is assessed using an events calendar. Children following the Primary School or Madrasa text book board are considered. Ownership: This refers to the ownership of the unit and not the ownership of the building or structure in which it may operate. Ownership may be government, semi government, private, foreign or co-operative. In case of mixed ownership, enumerators are instructed to record the major ownership type. Labor Force/Economically Active: Economically active population or labor force is defined as persons aged 15 years and above who are either employed or unemployed during the reference period of the survey (preceding week of the day of survey enumeration). It includes:
• Employers • Own account works/self-employed persons/commissioned agents • Employees & salaried employees and wage earners, paid family workers

National Series: Socio-economic and Demographic Report Page 7
• Unpaid family workers • Members of products co-operatives • Persons classifiable by status.
Hours Worked: Hours worked is the total number of hours worked during the reference period of the survey for a person holding more than one job. Hour worked is the total of hours worked for all jobs. Economic Activity: Economic activity is synonymous with the definition of U.N. System of National Accounts (SNA-2008) and covers all market production and certain types of non-market production including processing of primary products for own consumption, own account construction and production of fixed assets for own use. It excludes unpaid activities such as unpaid domestic activities and voluntary community services. Unemployed Person: Unemployed person is a person who is involuntarily out of gainful employment during the reference period but either
(a) he/she is looking for a job or (b) willing to work but not looking for work because of illness or believing that no work
was available. Employed Person: Employed person is a person who is either working one or more hours for pay or profit or working without pay on family farm or enterprise or organization during the reference period or found not working but has a job or business from which he/she is temporarily absent during the reference period. Underemployment: Underemployment is the condition whereby a person's employment is considered inadequate in terms of time worked, income earned, productivity or use of his/her skills and the person is looking for additional work in conformity with his/her education or skill to augment income. Index of Ageing: Index of ageing is the ratio of old persons of age 60 years and above to the young population of age 0-14 years expressed as percentage. Non-economic Activity: It means the household activities that have no economic values like cooking, cleaning and washing, looking after the younger brothers/sisters and/or children etc. 1.7 Sample Design To conduct the sample survey, 2011 a “stratified two-stage cluster sampling” was undertaken. It was a self weighted realistic design. People living in households were the target population. 1.8 Stratification Two-way stratification had been made to isolate homogeneous groups. The first level stratification was done by locally and divided into the three strata:
i) City Corporation Area; ii) Urban Area and iii) Rural Area. 1.9 Tabulation Plan In order to meet the data requirements of the users an intensive tabulation plan was prepared with the help of US Census Bureau Team. As there were ten (10) modules in the questionnaire, separate tabulation plan on each module was considered. 1.10 Pre-test of the Questionnaire The contents of Sample Survey questionnaire were determined based on data needs assessed on government current priorities and also recommendations of technical committee experts. Several preliminary checks of the questionnaire were made locally. Lastly, the questionnaire was pre-tested in selected areas with participation of some experts of the

National Series: Socio-economic and Demographic Report Page 8
technical committee. Satisfactory pre-test results were resolved finalising a ten moduled questionnaire for adoption in the survey. Accordingly the questionnaire was designed in machine readable format with the technical assistance from US Census Bureau and was printed abroad with the financial assistance from European Union (EU) through United Nations Population Fund (UNFPA). 1.11 Selection of Sample Units A total of 6,720 sample EAs were selected following the predesigned allocation procedures depending on the frame of Population and Housing Census 2011. The covered area was entire Bangladesh. The sampling design was a two-stage cluster sampling with Enumeration Areas (EAs) being the first stage sampling units and households being the second stage units for each of the strata. 1.12 Field Organisation For smooth conduct of the sample survey, the whole country was divided into 23 regions, 64 Zilas and 840 supervisors’ areas to enumerate 6720 sample EAs. Secretary, Statistics and Informatics Division was the Chief Census Co-ordinator, the Director General of BBS was the National Co-ordinator and the Deputy Director General of BBS and the Joint Secretary, Statistics and Informatics Division were the Deputy National Co-ordinators. The Zilas were under the control of Census Zila Co-ordinators (CDCs). CDCs were the Officials of BBS. Most of the CDCs were sent from the headquarters except 23 CDCs who were Officers in charge of 23 Regional Statistical Offices of BBS. In the City Corporation Areas, additional CDCs were deployed according to the number of EAs and responsibilities. In the sample survey, CDCs were responsible for imparting training, distribution of materials to the field staffs and receiving back the filled-in and submitting those to the head office and to meet other problems in the field. Among 840 supervisors, 483 worked as upazila Census Co-ordinators (UCCs) cum supervisors who were Upazila Statistical Officers/Assistant Statistical Officers of BBS. All the 3360 enumerators were appointed from unemployed educated local females who did well as the enumerator in the Population and Housing Census 2011 conducted in 15-19, March 2011. In the selection process, preferences were given to unemployed females and almost all the enumerators were females. The enumerators were given honoraria and training allowances. 1.13 Training A verbatim training manual was prepared for uniform training at all stages. There were two stages of training. In the first stage, all Census Zila Co-ordinators (CDCs) were trained at the headquarters who acted as master trainer for the second stage. A 3-days training was imparted for the Census Zila Co-ordinators (CDCs) in Dhaka headquerters. In the second stage, CDCs imparted training to the supervisors and enumerators. A 5-day long training was imparted to the supervisors and enumerators. The training manuals were made available to the supervisors and enumerators before the training. In all the stages of training, class room training were followed by field trip and mock training. 1.14 Enumeration Enumeration was done during 15-25 October, 2011. The reference night was the night following 14th October, 2011. The enumeration was done following the De jure Method. 1.15 Identification of Enumeration Area The EA boundaries were shown to the enumerators with the help of mauza map and also with the list of sample households supplied to them. This was mainly done by the supervisors and UCCs. 1.16 Collection of Filed in Questionnaires The filled in schedules and documents were collected by the Census Zila Coordinators with the help of supervisors and submitted to the control room at the headquarters. 1.17 Control Room During the field operation (starting from field training to return of documents) control rooms were operated at the headquarters and also in all regional offices. These control rooms were

National Series: Socio-economic and Demographic Report Page 9
kept open from 8.00 A.M. to 9.00 P.M. even on holidays. All the regional offices were directly linked with telephone lines. Any problem that occurred in the field was reported to the headquarters and necessary steps were immediately taken to solve the problems. 1.18 Inventory of Documents All the documents collected by the Census Zila Co-ordinators (CDCs) at field level were returned to the headquarters by them as per schedule. The filled-in questionnaires were stored systematically by Zila and by upazila. 1.19 Data Capturing/Processing The adoption of Intelligence Character Recognition (ICR) strategy was planned for Sample Survey data capturing. As such, ICR machines were used. BBS had gathered experience in OMR and OCR techniques data capturing from earlier censuses and surveys of 1981, 1991 and 2001. The ICR technology was introduced at this Sample Survey in BBS. US Census Bureau supported BBS in using CapturePro and iCADE (Integrated Computer Assisted Data Entry) system for data capturing. For analyzing and tabulating Sample Survey data CSPro software was used. The tabulations were made on the basis of pre-determined tabulation plan. Tabulated data were analyzed and checked for any inconsistency before printing. 1.20 Editing In order to process the Sample Survey data, editing of the modules were done in an efficient computer edit and imputation program. The errors and inconsistencies, if detected, were imputed by applying both ‘hot-deck’ and ‘cold-deck’ methods through CSPro software. For this purpose, written editing instructions, code list for occupation, 2-digit code using Bangladesh Standard Occupational Classification (BSOC) and activity code lists, 2-digit code using Bangladesh Standard Industrial Classification (BSIC) were prepared following international classifications.

National Series: Socio-economic and Demographic Report Page 10
Chapter – 2
Sample Design
2.1 Introduction The United Nations describes Census as the total process of collecting, compiling and publishing demographic, economic and social data pertaining at a specified time or times to all persons in a country or delimited territory. Census is a mammoth activity for every country. It is essential as it is required to study and find out future policies for welfare of its population. Population Census is the primary source of basic national population data required for administrative purposes and for many aspects of economic and social research and planning. Countries with big population like Bangladesh, census becomes gigantic. As the demand for data on almost every aspect of the social and economic status of a country’s population increases, the process becomes more and more exhaustive. Censuses are usually sought to get comparable information in a fixed sequence on social and living conditions of people of various region, religion, community, gender, age, educational status etc. Data on many issues like sex ratio, education level and income, fertility rate, mortality rate, ratio of working women and men, number of disabled persons etc. are found to be of primary interest of various government and non-government sectors. However, incorporating too many dimensions in the census could possibly make the endeavor too complicated, expensive and time consuming as well. That is why almost every country in the world plans a survey with a detailed long questionnaire rightly after completing the census. This survey is often termed as Sample Census. The fifth Population and Housing Census of Bangladesh began from midnight of 14 March, 2011 (Monday). The total number of people living in the country had been enumerated along with collection of concrete data on their age, sex, ethnicity, religion and social and economic status. As usual the census is planned to be followed by a long questionnaire survey. The long questionnaire survey is required to be technically very sound so that it can be advantageously utilized to upgrade and enhance the census data by appropriate supplementation, synchronization and matching. The sampling methodology for this planned survey is described in this document. 2.2 Sampling Design The sampling design in this case is taken as a stratified two-stage cluster sampling method where at the first stage EAs (Enumeration Area having about 120 households each were created all over the country and GIS Map were developed for each EA prior to the census) are selected within the selected EA. Households listed in the Population and Housing Census 2011 are selected at the second stage. 2.3 Stratification Since estimation is required for the Zila delineation without segregating for rural, urban and metropolitan region, primarily, the whole country is divided into 64 strata each defined as the administrative Zilas. At the national and divisional level the estimation is required to be segregated for rural, urban and city corporation regions. The Zila sample will therefore be consisted of both rural and urban region. In addition, for estimation at the city corporation level, six additional strata are defined as the six city corporations. There will be six city corporations strata, 64 Zilas strata

National Series: Socio-economic and Demographic Report Page 11
making a total of 70 (6+64) strata in the population. Independent sampling is done within each stratum. This stratification will result in the list of strata given in the Table 2. The sampling design is basically a two-stage cluster sampling with EAs being the first stage sampling units and households being the second stage units for each of the strata. 2.4 Sample size From general theory the minimum required sample size is determined by the usual sample size determination formula for estimating proportion, which is given by:
deff×+
=
Nn
nn
0
0
1……………………………………………………….. (1)
With 2
2
20
)1(
d
zppn
α−= ………………………………………………….. (2)
Where, p is an apriori proportion of the required characteristics in the population, 2
2αz ,
the value of the standard normal variate allowing %α100 probability of bad samples, d , the allowable margin of error, N is the population size and deff is the design effect used for complex surveys using multi-stage cluster sampling. Conventionallyα can be taken as 0.05 and deff can be taken as 1.5 - 2.0 for most socio-economic surveys in Bangladesh. Theoretically, an apriori 0.5=p gives the safest sample size since )1( pp − takes the highest value for 0.5=p . A common choice for the value of the allowable margin of error is 0.05=d . This value does not seem to be realistic for scenario where the true value of p is outside the range 0.80.2 ≤≤ p when a smaller value for d or consideration of a relative error margin is recommended. The equation (1) is used to revise the sample size and equation (2) for the population size N . It is observed in the theory that for 8000≥N , equation (2) is not much influenced or improved. That is why, equation (2) is straight forwardly used for large population sizes and there is no necessity for increasing the sample size for population becoming any larger. In this particular study under interest, the minimum number of household required in each stratum will be focused and since the number of household in each of the defined strata is fairly larger than 8000, no adjustment for population size will be suggested. The conventional choice of 0.05=α will be considered which would give 1.96=
2
αz . For safer sample size
design effect will be chosen as 2=deff .
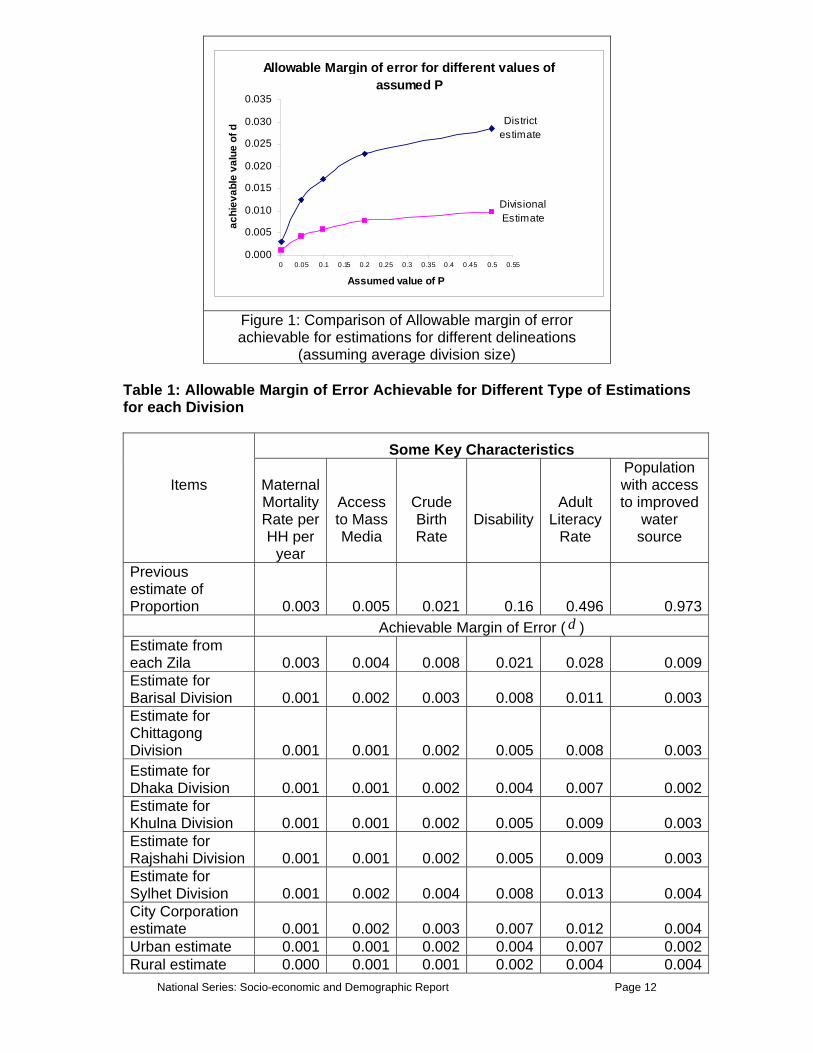
The main concern for sample size determination of this sample census will be to make choices of the values of p and d because a diverse range of variables will be under study. Previous estimates of the proportions for these variables are seen to vary from 003.0=p (for MMR) to 0.97=p (for access to drinking water) and hence taking a nominal choice of 0.05=d would not serve the cause. It will be needed to determine the sample size by keeping the rare variables in mind and also by choosing a moderately small value of d . To allow a maximum error of %25± ( 0.0125=d ) in estimating a characteristic as rare as 5% ( 0.05=p ), the minimum required sample size can be obtained to be approximately 2335 Household per stratum. This sample size will allow a narrower margin of error for estimating characteristics which are more common in nature and also for estimation for larger delineations. Table 1 and Figure 1 can illustrate the amount of allowable margin of error achievable for different type of estimations.
National Series: Socio-economic and Demographic Report Page 12
Allowable Margin of error for different values of assumed P
District estimate
Divisional Estimate
0.000
0.005
0.010
0.015
0.020
0.025
0.030
0.035
0 0.05 0.1 0.15 0.2 0.25 0.3 0.35 0.4 0.45 0.5 0.55
Assumed value of P
achi
evab
le v
alue
of d
Figure 1: Comparison of Allowable margin of error achievable for estimations for different delineations
(assuming average division size) Table 1: Allowable Margin of Error Achievable for Different Type of Estimations for each Division
Items
Some Key Characteristics
Maternal Mortality Rate per HH per
year
Access to Mass Media
Crude Birth Rate
Disability
Adult Literacy
Rate
Population with access to improved
water source
Previous estimate of Proportion 0.003 0.005 0.021 0.16 0.496 0.973 Achievable Margin of Error ( d ) Estimate from each Zila 0.003 0.004 0.008 0.021 0.028 0.009Estimate for Barisal Division 0.001 0.002 0.003 0.008 0.011 0.003Estimate for Chittagong Division 0.001 0.001 0.002 0.005 0.008 0.003Estimate for Dhaka Division 0.001 0.001 0.002 0.004 0.007 0.002Estimate for Khulna Division 0.001 0.001 0.002 0.005 0.009 0.003Estimate for Rajshahi Division 0.001 0.001 0.002 0.005 0.009 0.003Estimate for Sylhet Division 0.001 0.002 0.004 0.008 0.013 0.004City Corporation estimate 0.001 0.002 0.003 0.007 0.012 0.004Urban estimate 0.001 0.001 0.002 0.004 0.007 0.002Rural estimate 0.000 0.001 0.001 0.002 0.004 0.004

National Series: Socio-economic and Demographic Report Page 13
2.5 Allocation of Sample Size
Since individual stratum estimation is required and the sample size is determined to address the minimum requirement which need not be inflated for population size. There will be no need for using any proportional allocation. From each stratum minimum 2335 households are to be drawn. Looking at the number of household in individual EAs, we plan a second stage sample of 25 households from each selected EA. Approximately 96 EAs are to be selected from each stratum resulting a slight adjustment of the sample size to 2400 households per stratum. Table 3 produces the sample size allocation among strata. Table 2: The Allocation of Sample Size among Strata Sl. No.
Zila Code
Name of Zila
Rural Urban Total No. of EAs
No. of
HHs
No. of EAs
No. of
HHs
No. of
EAs
No. of HHs
1 4 Barguna 88 220 8 200 96 2400 2 6 Barisal 91 227 5 125 96 2400 3 6 Barisal (City Corporation) - - - - 96 2400 4 9 Bhola 90 225 6 150 96 2400 5 42 Jhalokati 85 212 11 275 96 2400 6 78 Patuakhali 89 222 7 175 96 2400 7 79 Pirojpur 89 222 7 175 96 2400 8 3 Bandarban 81 202 15 375 96 2400 9 12 Brahmanbaria 87 217 9 225 96 2400 10 13 Chandpur 81 202 15 375 96 2400 11 15 Chittagong 89 222 7 175 96 2400 12 15 Chittagong (City - - - - 96 2400 13 19 Comilla 84 210 12 300 96 2400 14 22 Cox's Bazar 83 207 13 325 96 2400 15 30 Feni 77 192 19 475 96 2400 16 46 Khagrachhari 83 207 13 325 96 2400 17 51 Lakshmipur 87 217 9 225 96 2400 18 75 Noakhali 85 212 11 275 96 2400 19 84 Rangamati 81 202 15 375 96 2400 20 26 Dhaka 89 222 7 175 96 2400 21 26 Dhaka (City Corporation) - - - - 96 2400 22 29 Faridpur 86 215 10 250 96 2400 23 33 Gazipur 66 165 30 750 96 2400 24 35 Gopalganj 89 222 7 175 96 2400 25 39 Jamalpur 83 207 13 325 96 2400 26 48 Kishoreganj 83 207 13 325 96 2400 27 54 Madaripur 86 215 10 250 96 2400 28 56 Manikganj 90 225 6 150 96 2400 29 59 Munshiganj 89 222 7 175 96 2400 30 61 Mymensingh 86 215 10 250 96 2400 31 67 Narayanganj 64 160 32 800 96 2400 32 68 Narsingdi 81 202 15 375 96 2400 33 72 Netrokona 89 222 7 175 96 2400 34 82 Rajbari 87 217 9 225 96 2400

National Series: Socio-economic and Demographic Report Page 14
Sl. No.
Zila Code
Name of Zila
Rural Urban Total No. of EAs
No. of
HHs
No. of EAs
No. of
HHs
No. of
EAs
No. of HHs
35 86 Shariatpur 87 217 9 225 96 2400 36 89 Sherpur 85 212 11 275 96 2400 37 93 Tangail 84 210 12 300 96 2400 38 1 Bagerhat 89 222 7 175 96 2400 39 18 Chuadanga 82 205 14 350 96 2400 40 41 Jessore 81 202 15 375 96 2400 41 44 Jhenaidah 82 205 14 350 96 2400 42 47 Khulna 94 235 2 50 96 2400 43 47 Khulna (City Corporation) - - - - 96 2400 44 50 Kushtia 88 220 8 200 96 2400 45 55 Magura 86 215 10 250 96 2400 46 57 Meherpur 87 217 9 225 96 2400 47 65 Narail 84 210 12 300 96 2400 48 87 Satkhira 90 225 6 150 96 2400 49 10 Bogra 81 202 15 375 96 2400 50 38 Joypurhat 83 207 13 325 96 2400 51 64 Naogaon 90 225 6 150 96 2400 52 69 Natore 84 210 12 300 96 2400 53 70 Chapai Nawabganj 80 200 16 400 96 2400 54 76 Pabna 82 205 14 350 96 2400 55 81 Rajshahi 79 197 17 425 96 2400 56 81 Rajshahi (City Corporation) - - - - 96 2400 57 88 Sirajganj 85 212 11 275 96 2400 58 27 Dinajpur 84 210 12 300 96 2400 59 32 Gaibandha 91 227 5 125 96 2400 60 49 Kurigram 87 217 9 225 96 2400 61 52 Lalmonirhat 89 222 7 175 96 2400 62 73 Nilphamari 84 210 12 300 96 2400 63 77 Panchagarh 90 225 6 150 96 2400 64 85 Rangpur 85 212 11 275 96 2400 65 94 Thakurgaon 88 220 8 200 96 2400 66 36 Habiganj 88 220 8 200 96 2400 67 58 Maulvibazar 89 222 7 175 96 2400 68 90 Sunamganj 90 225 6 150 96 2400 69 91 Sylhet 91 227 5 125 96 2400 70 91 Sylhet (City Corporation) - - - - 96 2400 Total 672 16800
2.6 Selection of Cluster (EA) EAs do not vary much in size. So, these can be selected in a Zila with the help of simple systematic sampling without replacement. The list of EAs, obtained from the pre-census GIS mapping, is considered as the first stage sampling frame. The list of households of selected EA, obtained from the Population and Housing Census 2011, is considered as the 2nd stage sampling frame.
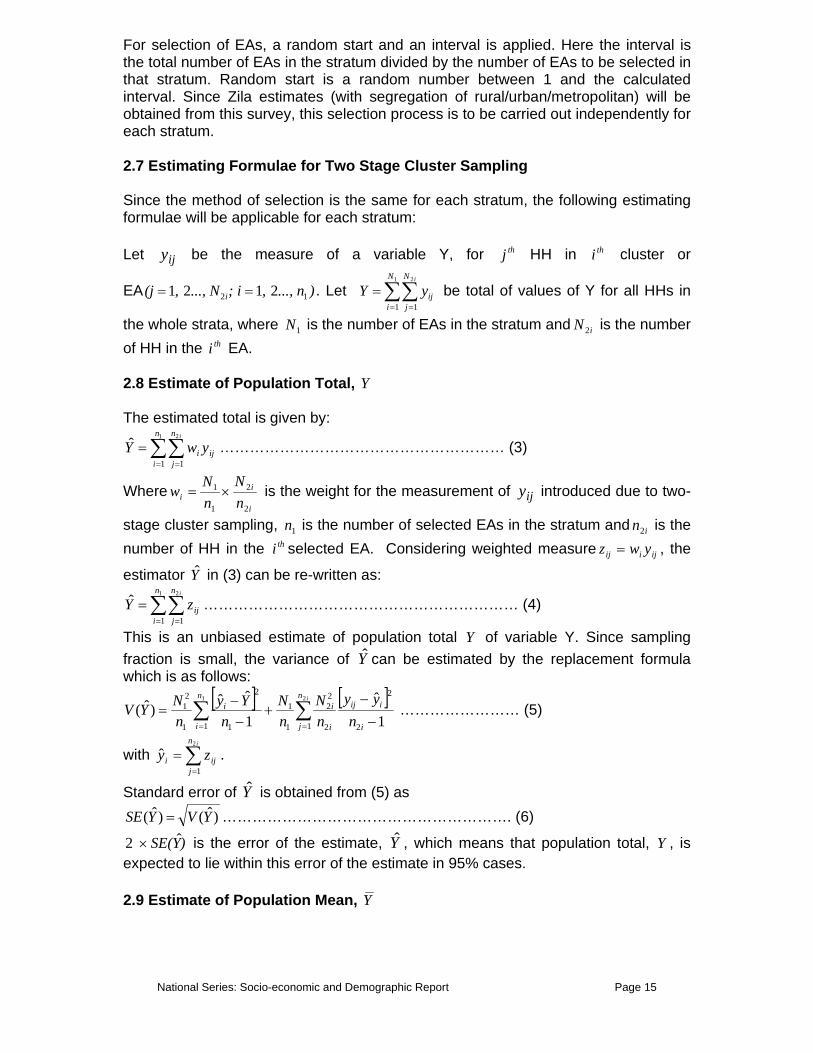
National Series: Socio-economic and Demographic Report Page 15
For selection of EAs, a random start and an interval is applied. Here the interval is the total number of EAs in the stratum divided by the number of EAs to be selected in that stratum. Random start is a random number between 1 and the calculated interval. Since Zila estimates (with segregation of rural/urban/metropolitan) will be obtained from this survey, this selection process is to be carried out independently for each stratum. 2.7 Estimating Formulae for Two Stage Cluster Sampling Since the method of selection is the same for each stratum, the following estimating formulae will be applicable for each stratum: Let ijy be the measure of a variable Y, for thj HH in thi cluster or
EA )..., n, ; i..., N, (j i 12 2121 == . Let ∑∑= =
=1 2
1 1
N
i
N
jij
i
yY be total of values of Y for all HHs in
the whole strata, where 1N is the number of EAs in the stratum and iN 2 is the number of HH in the thi EA. 2.8 Estimate of Population Total, Y The estimated total is given by:
∑∑= =
=1 2
1 1
ˆn
i
n
jiji
i
ywY ………………………………………………… (3)
Wherei
ii n
NnNw
2
2
1
1 ×= is the weight for the measurement of ijy introduced due to two-
stage cluster sampling, 1n is the number of selected EAs in the stratum and in2 is the number of HH in the thi selected EA. Considering weighted measure ijiij ywz = , the
estimator Y in (3) can be re-written as:
∑∑= =
=1 2
1 1
ˆn
i
n
jij
i
zY ……………………………………………………… (4)
This is an unbiased estimate of population total Y of variable Y. Since sampling fraction is small, the variance of Y can be estimated by the replacement formula which is as follows:
[ ] [ ]∑ ∑= = −
−+
−−
=1 2
1 2
2
1 2
22
1
1
1
2
1
21
1ˆ
1
ˆˆ)ˆ(
n
i i
iijn
j i
ii
nyy
nN
nN
nYy
nNYV
i
…………………… (5)
with ∑=
=in
jiji zy
2
1
ˆ .
Standard error of Y is obtained from (5) as )ˆ()ˆ( YVYSE = …………………………………………………. (6)
)YSE( ˆ2 × is the error of the estimate, Y , which means that population total, Y , is expected to lie within this error of the estimate in 95% cases. 2.9 Estimate of Population Mean, Y

National Series: Socio-economic and Demographic Report Page 16
Let N be the number of households of the whole stratum, then the estimate of population mean, Y and its standard error can be obtained by simply dividing the equation (4) and (6) by N , that is
∑∑= =
=1 2
1 1
1ˆ n
i
n
jij
i
zN
Y
And )ˆ(1)ˆ( YVN
YSE = .

National Series: Socio-economic and Demographic Report Page 17
2.10 Estimate of Population Proportion, P Proportion is a special case of mean when the variable y is defined by:
⎩⎨⎧
=other wise0
ion consideratunder sticcharacteri theHH ),(theif1 th
ijji
y
With this definition of variable y, the estimating formulae in (3) can be applied for the estimation of proportion. 2.11 Estimates for Other Strata The above formulae can be used independently for each stratum. 2.12 National Estimates National estimates can be obtained from those of 136 strata. 2.13 Estimation of Total For estimating national total of a variable, stratum totals of the variable and their estimated variances are added separately to get the national estimated total and its estimated variance respectively. 2.14 Estimation of Mean and Proportion The estimated mean of a variable for whole country is the weighted mean of each stratum means. Let hN and N be the number of households of thh stratum and that of whole country respectively. Then the estimated mean of y for whole country is given by:
∑=
=L
h
h
NYNY
1st
ˆ
Where hY = estimated mean for thh stratum.
The estimated variance of stY is
∑= )ˆ()ˆ( 2
2
hh
st YVNNYV , where )ˆ( hYV is estimated variance of mean for thh stratum.
These formulae can be used for estimating national proportion by replacing hY by estimated proportion. References: 1. http://www.searo.who.int/en/Section313/Section1515_6922.htm 2. http://www.bernama.com/bernama/v3/news_lite.php?id=155292 3. http://www.searo.who.int/en/Section313/Section1515_6922.htm 4. http://siteresources.worldbank.org/DISABILITY/Resources/Regions/ South%20Asia/DisabilityinBangladesh.pdf 5. http://www.searo.who.int/en/Section313/Section1515_6922.htm 6. http://www.searo.who.int/en/Section313/Section1515_6922.htm

National Series: Socio-economic and Demographic Report Page 18
HOUSEHOLD AND HOUSING TABLES TableH01 – TableH10

National Series: Socio-economic and Demographic Report Page 19
Table H01: Household, Population and Living Status by Sex, Division and Residence, 2011
Household, Population and Living Status Total Rural Urban 1 2 3 4
Bangladesh Total Households 31705684 25535877 6169807Total Population 139252683 112510154 26742529Male 69514871 56246478 13268393Female 69737812 56263676 13474136Members Usually Living in Household 136984125 110581218 26402907Male 67996378 54948641 13047737Female 68987747 55632577 13355170Usual Household Member Absent During Sample Census 2786402 2403946 382456
Male 2056497 1784868 271629Female 729905 619078 110827Former Household Members Currently Living Abroad 2845572 2421664 423908Male 2696140 2309357 386783Female 149432 112307 37125Visitors 2332195 1878158 454037Male 891409 728853 162556Female 1440786 1149305 291481Household Members Returned from Abroad in the past 5 years 542748 423435 119312Male 486835 385418 101416Female 55913 38017 17896Barisal Division Total Households 1849356 1610041 239315Total Population 8489476 7426175 1063301Male 4281289 3745640 535649Female 4208187 3680535 527652Members Usually Living in Household 8266941 7222822 1044119Male 4130984 3607660 523324Female 4135957 3615162 520795Usual Household Member Absent During Sample Census 275098 251380 23718Male 208419 190606 17813Female 66679 60774 5905Former Household Members Currently Living Abroad 275098 251380 23718Male 208419 190606 17813Female 66679 60774 5905Visitors 164513 136356 28157Male 68369 57559 10810Female 96144 78797 17347Household Members Returned from Abroad in the past 5 years 21974 20065 1909Male 13797 12301 1496Female 8177 7764 413

National Series: Socio-economic and Demographic Report Page 20
Table H01: Household, Population and Living Status by Sex, Division and Residence, 2011
Household, Population and Living Status Total Rural Urban 1 2 3 4
Chittagong Division Total Households 5552269 4364888 1187381Total Population 27163631 21620590 5543041Male 13396709 10661132 2735578Female 13766922 10959458 2807464Members Usually Living in Household 26667332 21204087 5463245Male 12976421 10288310 2688111Female 13690911 10915777 2775134Usual Household Member Absent During Sample Census 604283 526072 78211Male 477021 418611 58410Female 127262 107461 19801Former Household Members Currently Living Abroad 1236340 1082418 153923Male 1209292 1062767 146526Female 27048 19651 7397Visitors 742699 588487 154213Male 270010 210464 59547Female 472689 378023 94666Household Members Returned from Abroad in the past 5 years 194107 154578 39529Male 175717 140279 35438Female 18390 14299 4091Dhaka Division Total Households 2633512 1073144 1560368Total Population 45568835 33696716 11872119Male 22718879 16835863 5883016Female 22849956 16860853 5989103Members Usually Living in Household 44895092 33146571 11748522Male 22312897 16504715 5808183Female 22582195 16641856 5940339Usual Household Member Absent During Sample Census 883464 737958 145505Male 627155 534235 92920Female 256309 203723 52585Former Household Members Currently Living Abroad 892688 733013 159676Male 836928 694671 142258Female 55760 38342 17418Visitors 590729 414033 176696Male 239422 174740 64682Female 351307 239293 112014Household Members Returned from Abroad in the past 5 years 222676 165367 57308Male 199594 154847 44746Female 23082 10520 12562Khulna Division

National Series: Socio-economic and Demographic Report Page 21
Table H01: Household, Population and Living Status by Sex, Division and Residence, 2011
Household, Population and Living Status Total Rural Urban 1 2 3 4
Total Households 3707047 3114437 592610Total Population 15386663 12953935 2432728Male 7708350 6504134 1204215Female 7678313 6449801 1228512Members Usually Living in Household 15091337 12696715 2394622Male 7561881 6375413 1186468Female 7529456 6321302 1208154Usual Household Member Absent During Sample Census 324513 285014 39499Male 226683 197370 29313Female 97830 87644 10186Former Household Members Currently Living Abroad 169682 136562 33120Male 155983 126647 29336Female 13699 9915 3784Visitors 224446 193411 31036Male 79118 69647 9472Female 145328 123764 21564Household Members Returned from Abroad in the past 5 years 29342 21812 7530Male 27408 20068 7340Female 1934 1744 190Rajshahi Division Total Households 4461097 3753726 707371Total Population 18027522 15137596 2889925Male 9026491 7600602 1425889Female 9001031 7536994 1464036Members Usually Living in Household 17727422 14891860 2835563Male 8842882 7460565 1382318Female 8884540 7431295 1453245Usual Household Member Absent During Sample Census 333776 268169 65607Male 240122 190076 50046Female 93654 78093 15561Former Household Members Currently Living Abroad 126002 102147 23856Male 121399 99057 22343Female 4603 3090 1513Visitors 132266 96494 35772Male 40252 32216 8036Female 92014 64278 27736Household Members Returned from Abroad in the past 5 years 38439 29903 8535Male 36580 28085 8495Female 1859 1818 40Rangpur Division Total Households 3794607 3350279 444328

National Series: Socio-economic and Demographic Report Page 22
Table H01: Household, Population and Living Status by Sex, Division and Residence, 2011
Household, Population and Living Status Total Rural Urban 1 2 3 4
Total Population 15434619 13597055 1837563Male 7815503 6880744 934758Female 7619116 6716311 902805Members Usually Living in Household 15214747 13392001 1822746Male 7660077 6741783 918294Female 7554670 6650218 904452Usual Household Member Absent During Sample Census 277939 254037 23901Male 219028 199638 19390Female 58911 54399 4511Former Household Members Currently Living Abroad 27126 22414 4712Male 23910 20087 3823Female 3216 2327 889Visitors 345321 328994 16327Male 148461 142922 5539Female 196860 186072 10788Household Members Returned from Abroad in the past 5 years 9841 8560 1281Male 7759 6689 1070Female 2082 1871 211Sylhet Division Total Households 1762757 1540705 222052Total Population 9181937 8078086 1103851Male 4567650 4018363 549288Female 4614287 4059723 554564Members Usually Living in Household 9121254 8027162 1094092Male 4511235 3970195 541040Female 4610019 4056967 553052Usual Household Member Absent During Sample Census 88725 82709 6016Male 58070 54332 3738Female 30655 28377 2278Former Household Members Currently Living Abroad 304742 271332 33411Male 274220 244995 29225Female 30522 26337 4186Visitors 132221 120384 11837Male 45777 41306 4471Female 86444 79078 7366Household Members Returned from Abroad in the past 5 years 26370 23149 3221Male 25981 23149 2832Female 389 0 389
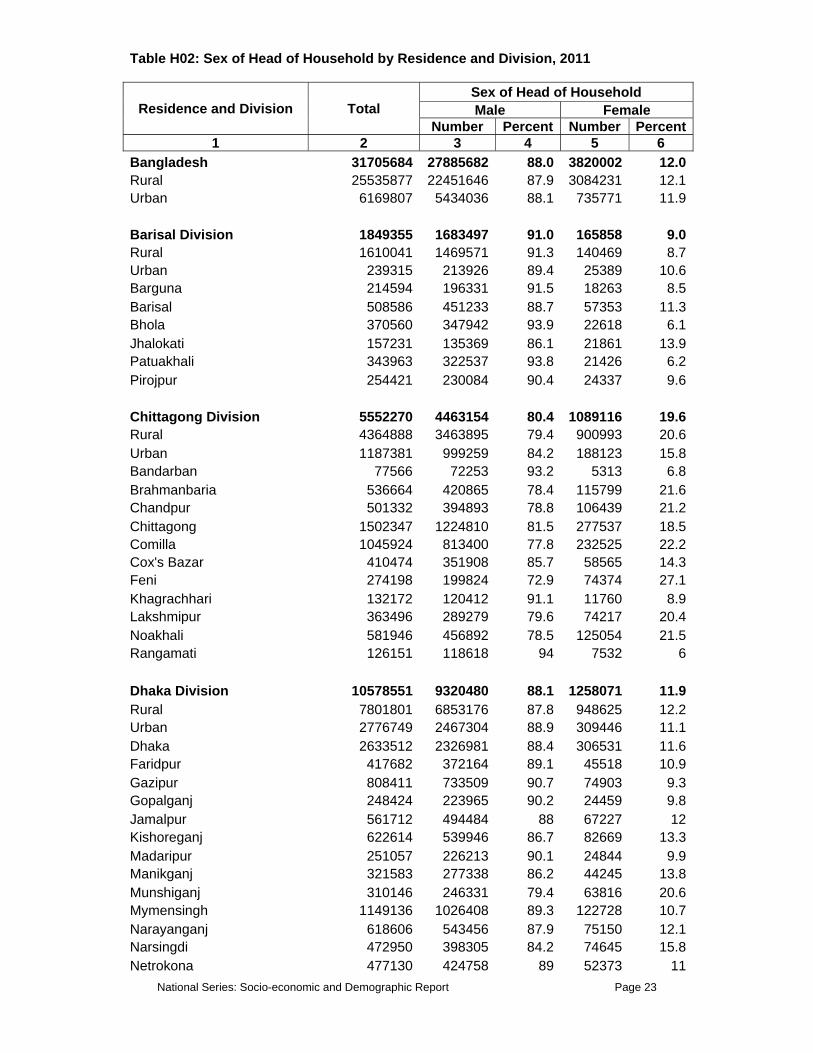
National Series: Socio-economic and Demographic Report Page 23
Table H02: Sex of Head of Household by Residence and Division, 2011
Residence and Division Total Sex of Head of Household Male Female
Number Percent Number Percent1 2 3 4 5 6
Bangladesh 31705684 27885682 88.0 3820002 12.0Rural 25535877 22451646 87.9 3084231 12.1Urban 6169807 5434036 88.1 735771 11.9 Barisal Division 1849355 1683497 91.0 165858 9.0Rural 1610041 1469571 91.3 140469 8.7Urban 239315 213926 89.4 25389 10.6Barguna 214594 196331 91.5 18263 8.5Barisal 508586 451233 88.7 57353 11.3Bhola 370560 347942 93.9 22618 6.1Jhalokati 157231 135369 86.1 21861 13.9Patuakhali 343963 322537 93.8 21426 6.2Pirojpur 254421 230084 90.4 24337 9.6 Chittagong Division 5552270 4463154 80.4 1089116 19.6Rural 4364888 3463895 79.4 900993 20.6Urban 1187381 999259 84.2 188123 15.8Bandarban 77566 72253 93.2 5313 6.8Brahmanbaria 536664 420865 78.4 115799 21.6Chandpur 501332 394893 78.8 106439 21.2Chittagong 1502347 1224810 81.5 277537 18.5Comilla 1045924 813400 77.8 232525 22.2Cox's Bazar 410474 351908 85.7 58565 14.3Feni 274198 199824 72.9 74374 27.1Khagrachhari 132172 120412 91.1 11760 8.9Lakshmipur 363496 289279 79.6 74217 20.4Noakhali 581946 456892 78.5 125054 21.5Rangamati 126151 118618 94 7532 6 Dhaka Division 10578551 9320480 88.1 1258071 11.9Rural 7801801 6853176 87.8 948625 12.2Urban 2776749 2467304 88.9 309446 11.1Dhaka 2633512 2326981 88.4 306531 11.6Faridpur 417682 372164 89.1 45518 10.9Gazipur 808411 733509 90.7 74903 9.3Gopalganj 248424 223965 90.2 24459 9.8Jamalpur 561712 494484 88 67227 12Kishoreganj 622614 539946 86.7 82669 13.3Madaripur 251057 226213 90.1 24844 9.9Manikganj 321583 277338 86.2 44245 13.8Munshiganj 310146 246331 79.4 63816 20.6Mymensingh 1149136 1026408 89.3 122728 10.7Narayanganj 618606 543456 87.9 75150 12.1Narsingdi 472950 398305 84.2 74645 15.8Netrokona 477130 424758 89 52373 11
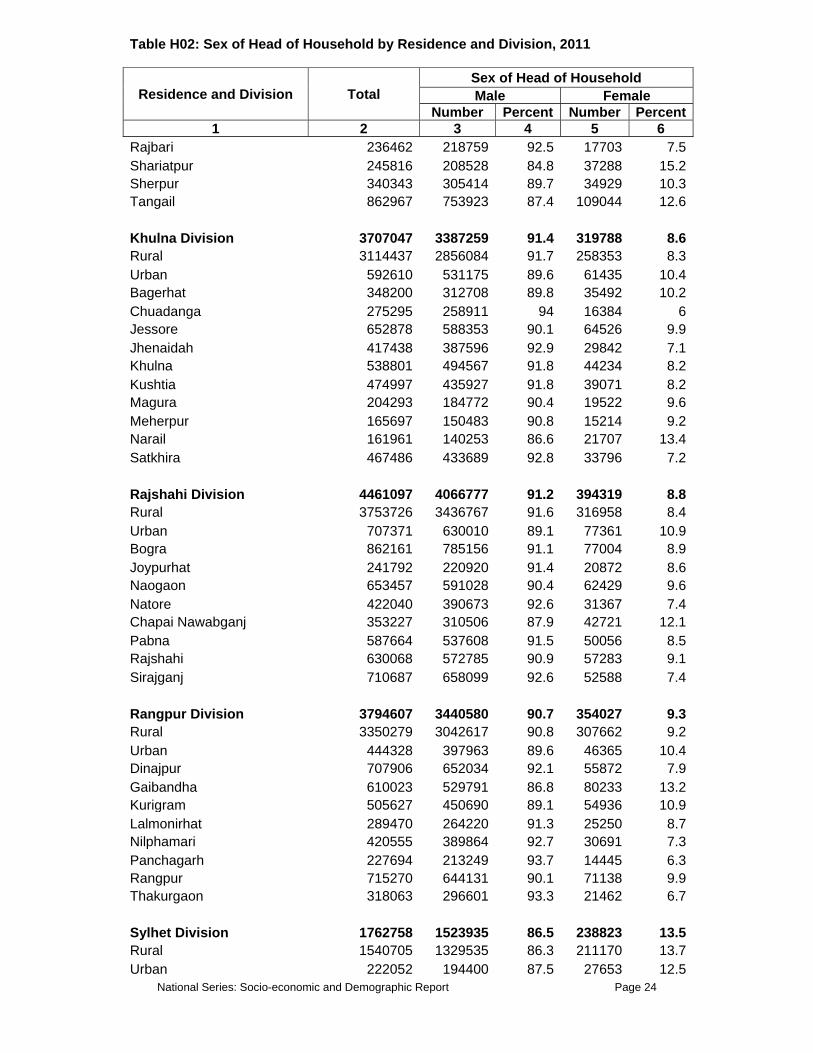
National Series: Socio-economic and Demographic Report Page 24
Table H02: Sex of Head of Household by Residence and Division, 2011
Residence and Division Total Sex of Head of Household Male Female
Number Percent Number Percent1 2 3 4 5 6
Rajbari 236462 218759 92.5 17703 7.5Shariatpur 245816 208528 84.8 37288 15.2Sherpur 340343 305414 89.7 34929 10.3Tangail 862967 753923 87.4 109044 12.6 Khulna Division 3707047 3387259 91.4 319788 8.6Rural 3114437 2856084 91.7 258353 8.3Urban 592610 531175 89.6 61435 10.4Bagerhat 348200 312708 89.8 35492 10.2Chuadanga 275295 258911 94 16384 6Jessore 652878 588353 90.1 64526 9.9Jhenaidah 417438 387596 92.9 29842 7.1Khulna 538801 494567 91.8 44234 8.2Kushtia 474997 435927 91.8 39071 8.2Magura 204293 184772 90.4 19522 9.6Meherpur 165697 150483 90.8 15214 9.2Narail 161961 140253 86.6 21707 13.4Satkhira 467486 433689 92.8 33796 7.2 Rajshahi Division 4461097 4066777 91.2 394319 8.8Rural 3753726 3436767 91.6 316958 8.4Urban 707371 630010 89.1 77361 10.9Bogra 862161 785156 91.1 77004 8.9Joypurhat 241792 220920 91.4 20872 8.6Naogaon 653457 591028 90.4 62429 9.6Natore 422040 390673 92.6 31367 7.4Chapai Nawabganj 353227 310506 87.9 42721 12.1Pabna 587664 537608 91.5 50056 8.5Rajshahi 630068 572785 90.9 57283 9.1Sirajganj 710687 658099 92.6 52588 7.4 Rangpur Division 3794607 3440580 90.7 354027 9.3Rural 3350279 3042617 90.8 307662 9.2Urban 444328 397963 89.6 46365 10.4Dinajpur 707906 652034 92.1 55872 7.9Gaibandha 610023 529791 86.8 80233 13.2Kurigram 505627 450690 89.1 54936 10.9Lalmonirhat 289470 264220 91.3 25250 8.7Nilphamari 420555 389864 92.7 30691 7.3Panchagarh 227694 213249 93.7 14445 6.3Rangpur 715270 644131 90.1 71138 9.9Thakurgaon 318063 296601 93.3 21462 6.7 Sylhet Division 1762758 1523935 86.5 238823 13.5Rural 1540705 1329535 86.3 211170 13.7Urban 222052 194400 87.5 27653 12.5
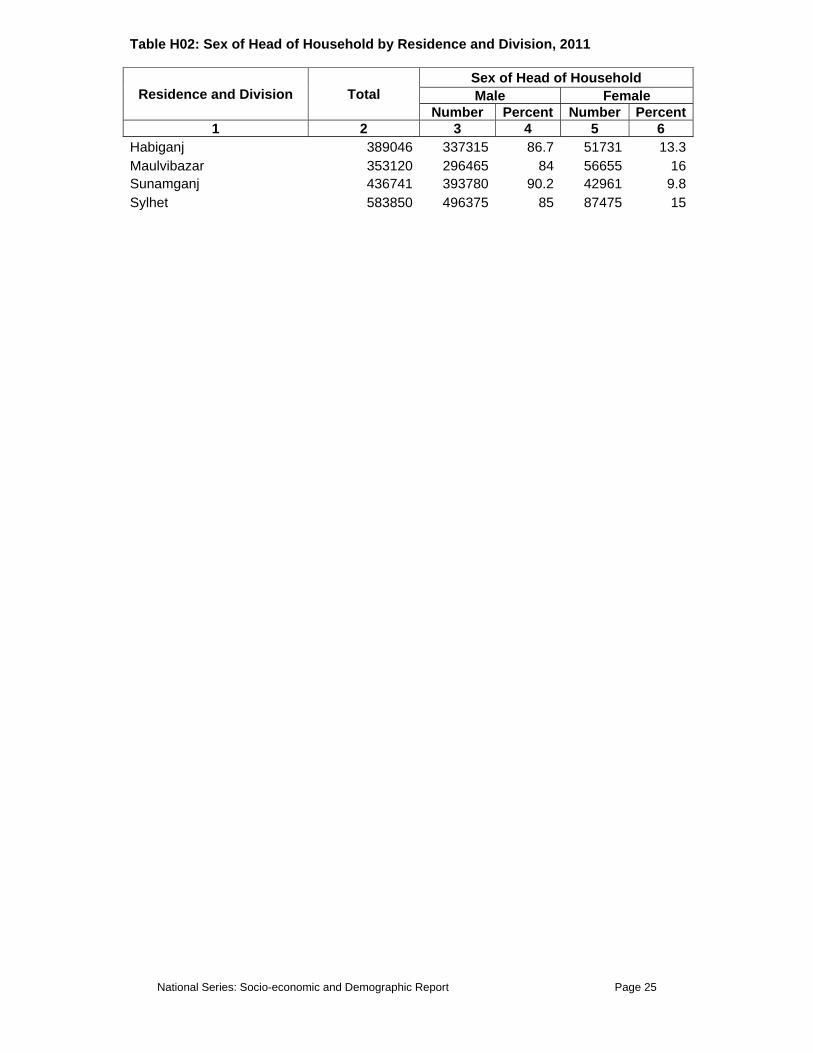
National Series: Socio-economic and Demographic Report Page 25
Table H02: Sex of Head of Household by Residence and Division, 2011
Residence and Division Total Sex of Head of Household Male Female
Number Percent Number Percent1 2 3 4 5 6
Habiganj 389046 337315 86.7 51731 13.3Maulvibazar 353120 296465 84 56655 16Sunamganj 436741 393780 90.2 42961 9.8Sylhet 583850 496375 85 87475 15

National Series: Socio-economic and Demographic Report Page 26
Table H03: Population Reading Newspapers, Listening to Radio, Watching Television and Using Internet by Sex, Division, Zila and Residence, 2011
Division and Zila Reading Newspaper Listening to Radio Watching Television Using Internet Total Male Female Total Male Female Total Male Female Total Male Female
1 2 3 4 5 6 7 8 9 10 11 12 13 Bangladesh 21229494 84.6 15.4 5465575 48.8 51.2 62389779 51.6 48.4 1543654 72.0 28.0 Rural 14328595 89.7 10.3 4360520 49.2 50.8 43958849 52.5 47.5 505197 81.6 18.4 Urban 6900899 74.0 26.0 1105055 47.2 52.8 18430930 49.4 50.6 1038456 67.4 32.6 Barisal Division 701423 81.4 18.6 388832 52.8 47.2 2129149 54.2 45.8 38266 77.8 22.2 Rural 531223 84.1 15.9 344203 53.4 46.6 1548342 55.9 44.1 21156 74.1 25.9 Urban 170200 73.2 26.8 44629 48.4 51.6 580807 49.9 50.1 17110 82.5 17.5 Barguna 62758 74.6 25.4 94361 56.6 43.4 247540 58.1 41.9 4745 71.7 28.3 Barisal 121760 68.5 31.5 65626 45.4 54.6 648837 49.1 50.9 8458 80.7 19.3 Bhola 107202 69.2 30.8 57784 63.5 36.5 290468 61.3 38.7 7436 81.3 18.7 Jhalokati 96636 83.8 16.2 49828 48.5 51.5 231349 52.5 47.5 6237 80.0 20.0 Patuakhali 74055 82.7 17.3 54068 52.4 47.6 355466 56.2 43.8 8628 76.7 23.3 Pirojpur 239012 94.0 6.0 67166 49.2 50.8 355488 54.3 45.7 2763 69.2 30.8 Chittagong Division 3322858 80.3 19.7 768058 52.4 47.6 11745816 50.0 50.0 239821 76.8 23.2 Rural 2283697 85.3 14.7 668096 51.9 48.1 8217388 50.5 49.5 100138 84.1 15.9 Urban 1039161 69.3 30.7 99962 55.3 44.7 3528429 48.9 51.1 139683 71.5 28.5 Bandarban 21122 80.3 19.7 16202 68.0 32.0 74090 58.4 41.6 1640 76.0 24.0 Brahmanbaria 155220 74.3 25.7 62267 47.1 52.9 1183304 48.2 51.8 7615 82.4 17.6 Chandpur 627714 90.6 9.4 141498 44.4 55.6 717148 49.6 50.4 4619 63.6 36.4 Chittagong 1130347 71.8 28.2 214611 62.2 37.8 4350751 50.2 49.8 143909 75.7 24.3 Comilla 373263 79.6 20.4 107084 48.2 51.8 2405670 48.9 51.1 28410 90.8 9.2 Cox's Bazar 157782 66.4 33.6 32039 54.8 45.2 467833 55.8 44.2 8957 59.6 40.4 Feni 365215 93.9 6.1 26169 52.2 47.8 591667 48.4 51.6 14691 81.3 18.8 Khagrachhari 55817 70.8 29.2 38757 47.4 52.6 228623 55.3 44.7 3147 73.7 26.3 Lakshmipur 94099 76.6 23.4 31569 45.7 54.3 492503 51.8 48.2 18061 71.4 28.6 Noakhali 268325 87.4 12.6 56619 50.4 49.6 1009789 49.5 50.5 7139 72.4 27.6
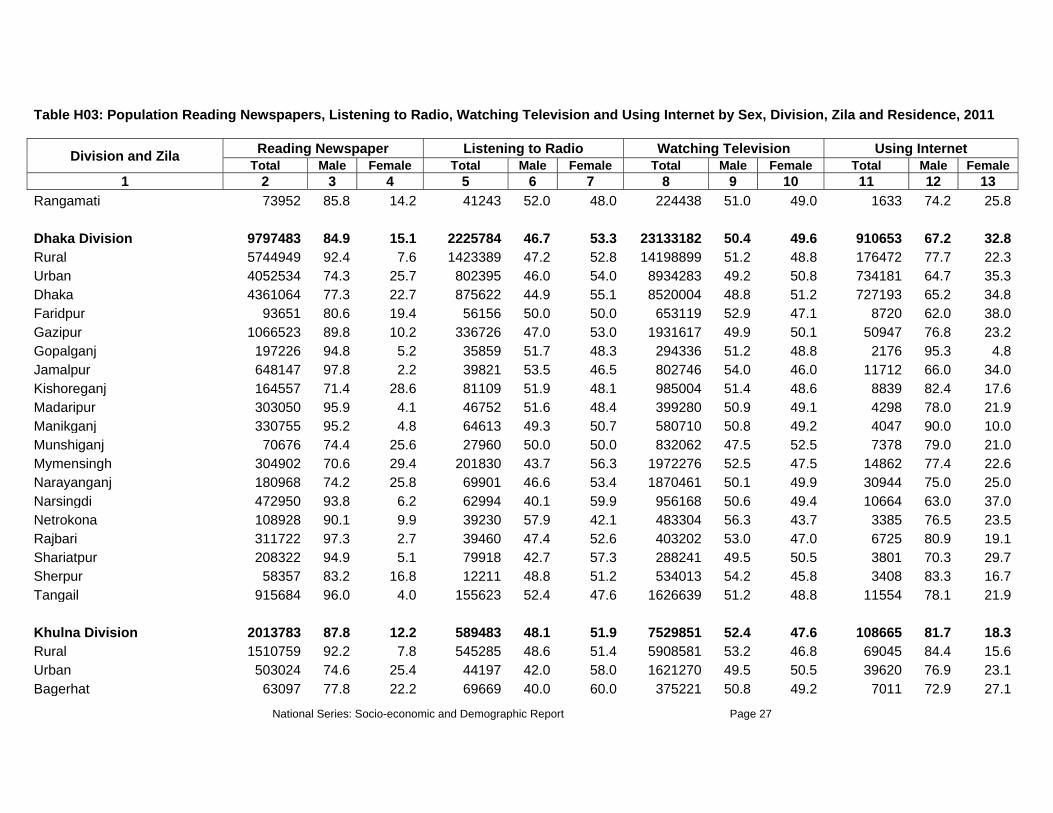
National Series: Socio-economic and Demographic Report Page 27
Table H03: Population Reading Newspapers, Listening to Radio, Watching Television and Using Internet by Sex, Division, Zila and Residence, 2011
Division and Zila Reading Newspaper Listening to Radio Watching Television Using Internet Total Male Female Total Male Female Total Male Female Total Male Female
1 2 3 4 5 6 7 8 9 10 11 12 13 Rangamati 73952 85.8 14.2 41243 52.0 48.0 224438 51.0 49.0 1633 74.2 25.8 Dhaka Division 9797483 84.9 15.1 2225784 46.7 53.3 23133182 50.4 49.6 910653 67.2 32.8 Rural 5744949 92.4 7.6 1423389 47.2 52.8 14198899 51.2 48.8 176472 77.7 22.3 Urban 4052534 74.3 25.7 802395 46.0 54.0 8934283 49.2 50.8 734181 64.7 35.3 Dhaka 4361064 77.3 22.7 875622 44.9 55.1 8520004 48.8 51.2 727193 65.2 34.8 Faridpur 93651 80.6 19.4 56156 50.0 50.0 653119 52.9 47.1 8720 62.0 38.0 Gazipur 1066523 89.8 10.2 336726 47.0 53.0 1931617 49.9 50.1 50947 76.8 23.2 Gopalganj 197226 94.8 5.2 35859 51.7 48.3 294336 51.2 48.8 2176 95.3 4.8 Jamalpur 648147 97.8 2.2 39821 53.5 46.5 802746 54.0 46.0 11712 66.0 34.0 Kishoreganj 164557 71.4 28.6 81109 51.9 48.1 985004 51.4 48.6 8839 82.4 17.6 Madaripur 303050 95.9 4.1 46752 51.6 48.4 399280 50.9 49.1 4298 78.0 21.9 Manikganj 330755 95.2 4.8 64613 49.3 50.7 580710 50.8 49.2 4047 90.0 10.0 Munshiganj 70676 74.4 25.6 27960 50.0 50.0 832062 47.5 52.5 7378 79.0 21.0 Mymensingh 304902 70.6 29.4 201830 43.7 56.3 1972276 52.5 47.5 14862 77.4 22.6 Narayanganj 180968 74.2 25.8 69901 46.6 53.4 1870461 50.1 49.9 30944 75.0 25.0 Narsingdi 472950 93.8 6.2 62994 40.1 59.9 956168 50.6 49.4 10664 63.0 37.0 Netrokona 108928 90.1 9.9 39230 57.9 42.1 483304 56.3 43.7 3385 76.5 23.5 Rajbari 311722 97.3 2.7 39460 47.4 52.6 403202 53.0 47.0 6725 80.9 19.1 Shariatpur 208322 94.9 5.1 79918 42.7 57.3 288241 49.5 50.5 3801 70.3 29.7 Sherpur 58357 83.2 16.8 12211 48.8 51.2 534013 54.2 45.8 3408 83.3 16.7 Tangail 915684 96.0 4.0 155623 52.4 47.6 1626639 51.2 48.8 11554 78.1 21.9 Khulna Division 2013783 87.8 12.2 589483 48.1 51.9 7529851 52.4 47.6 108665 81.7 18.3 Rural 1510759 92.2 7.8 545285 48.6 51.4 5908581 53.2 46.8 69045 84.4 15.6 Urban 503024 74.6 25.4 44197 42.0 58.0 1621270 49.5 50.5 39620 76.9 23.1 Bagerhat 63097 77.8 22.2 69669 40.0 60.0 375221 50.8 49.2 7011 72.9 27.1

National Series: Socio-economic and Demographic Report Page 28
Table H03: Population Reading Newspapers, Listening to Radio, Watching Television and Using Internet by Sex, Division, Zila and Residence, 2011
Division and Zila Reading Newspaper Listening to Radio Watching Television Using Internet Total Male Female Total Male Female Total Male Female Total Male Female
1 2 3 4 5 6 7 8 9 10 11 12 13 Chuadanga 335984 96.4 3.6 17653 53.6 46.4 443402 53.8 46.2 3923 79.4 20.6 Jessore 310376 79.8 20.2 53635 44.2 55.8 1563859 52.4 47.6 27770 86.3 13.7 Jhenaidah 168696 75.8 24.2 52487 46.8 53.2 999710 52.9 47.1 19661 78.6 21.4 Khulna 163528 72.0 28.0 99503 47.3 52.7 1150595 50.4 49.6 15429 72.8 27.2 Kushtia 532116 97.2 2.8 36691 56.2 43.8 1078710 53.6 46.4 15866 87.5 12.5 Magura 69268 80.5 19.5 44780 51.8 48.2 325876 57.8 42.2 4281 86.0 14.0 Meherpur 183125 95.9 4.1 11203 55.6 44.4 368601 53.2 46.8 2559 73.0 27.0 Narail 31310 81.4 18.6 18664 44.6 55.4 273474 50.9 49.1 3178 76.6 23.4 Satkhira 156284 81.9 18.1 185197 49.9 50.1 950404 51.5 48.5 8986 89.1 10.9 Rajshahi Division 2473730 86.5 13.5 914743 48.9 51.1 8727822 52.7 47.3 116116 79.9 20.1 Rural 1937170 89.3 10.7 847407 48.7 51.3 6729115 53.5 46.5 62151 84.9 15.1 Urban 536559 76.5 23.5 67336 51.6 48.4 1998707 49.6 50.4 53965 74.1 25.9 Bogra 296862 77.6 22.4 68008 52.4 47.6 1728999 50.6 49.4 15113 73.8 26.2 Joypurhat 97503 82.6 17.4 37408 49.1 50.9 408466 52.0 48.0 3126 71.0 29.0 Naogaon 137943 73.3 26.7 279975 46.6 53.4 870458 52.4 47.6 7906 93.1 6.9 Natore 457812 95.8 4.2 52160 49.0 51.0 894830 52.2 47.8 8811 86.0 14.0 Chapai Nawabganj 160165 63.8 36.2 112235 46.2 53.8 783113 56.5 43.5 11462 75.3 24.7 Pabna 192862 74.8 25.2 130783 45.4 54.6 1254829 52.7 47.3 15458 81.0 19.0 Rajshahi 187554 72.8 27.2 106416 50.5 49.5 1578484 52.5 47.5 33740 72.0 28.0 Sirajganj 943027 96.2 3.8 127757 56.5 43.5 1208643 53.9 46.1 20501 92.8 7.2 Rangpur Division 1927571 88.5 11.5 407912 48.5 51.5 6518079 55.7 44.3 63768 80.0 20.0 Rural 1595724 89.8 10.2 388393 48.4 51.6 5379526 56.5 43.5 43790 84.2 15.8 Urban 331847 82.6 17.4 19519 50.4 49.6 1138552 51.6 48.4 19978 70.7 29.3 Dinajpur 811328 92.0 8.0 63301 41.8 58.2 1270485 52.2 47.8 14562 79.6 20.4 Gaibandha 152570 80.3 19.7 66224 55.8 44.2 910323 57.2 42.8 7387 86.2 13.8

National Series: Socio-economic and Demographic Report Page 29
Table H03: Population Reading Newspapers, Listening to Radio, Watching Television and Using Internet by Sex, Division, Zila and Residence, 2011
Division and Zila Reading Newspaper Listening to Radio Watching Television Using Internet Total Male Female Total Male Female Total Male Female Total Male Female
1 2 3 4 5 6 7 8 9 10 11 12 13 Kurigram 378639 93.9 6.1 51978 52.4 47.6 709526 59.0 41.0 3381 62.5 37.5 Lalmonirhat 180858 92.5 7.5 44218 45.9 54.1 253105 58.5 41.5 2658 86.3 13.6 Nilphamari 87338 76.1 23.9 38057 53.5 46.5 975976 57.5 42.5 8593 83.7 16.3 Panchagarh 33831 77.8 22.2 21667 47.4 52.6 294310 52.3 47.7 2471 76.9 23.1 Rangpur 211024 77.3 22.7 88475 45.3 54.7 1489423 55.7 44.3 22716 78.9 21.1 Thakurgaon 71984 81.5 18.5 33992 47.8 52.2 614930 54.3 45.7 2000 80.0 20.0 Sylhet Division 992647 79.5 20.5 170763 52.2 47.8 2605879 50.5 49.5 66365 80.3 19.7 Rural 725072 82.7 17.3 143746 53.1 46.9 1976998 50.6 49.4 32444 85.0 15.0 Urban 267575 70.8 29.2 27017 47.2 52.8 628881 50.2 49.8 33921 75.7 24.3 Habiganj 395247 88.9 11.1 39982 49.8 50.2 511439 50.9 49.1 6691 78.0 22.0 Maulvibazar 160972 74.5 25.5 34922 58.8 41.2 646138 50.9 49.1 14239 85.3 14.7 Sunamganj 54661 68.2 31.8 12797 45.7 54.3 382263 50.6 49.4 5667 80.6 19.4 Sylhet 381766 73.5 26.5 83062 51.5 48.5 1066040 50.0 50.0 39768 78.8 21.2

National Series: Socio-economic and Demographic Report Page 30
Table H04: Number of Living Rooms by Household Size, Division and Zila, 2011
Number of Living Rooms
Percentage of Total
Household
Household SizeNumber of Household 1 2 3 4 5 6 7 8 9+
1 2 3 4 5 6 7 8 9 10 11 12
Bangladesh Total 100 31705684 2.3 10 19.5 26.6 19.5 11.1 5.5 2.7 2.8 1 27.2 8632758 5.8 18.2 27 26.6 13.6 5.6 2 0.7 0.5 2 31.3 9912968 1.5 9.5 20.9 29.7 20.4 10.6 4.4 1.8 1.2 3 21.6 6850666 0.6 5.6 15.2 26.9 24 14.3 7.2 3.4 2.7 4 11.9 3779333 0.5 4.5 12.4 23.5 22.2 15.9 9.4 5.7 6 5 4.7 1489444 0.6 3.4 10.5 20.2 22.1 16.5 10.7 6.8 9.2 6+ 3.3 1040514 0.6 3.8 9.1 15.4 17.1 15.4 11.9 8.3 18.4 Rural 100 25535877 2.4 10 19.1 26.2 19.6 11.3 5.7 2.8 2.9 1 26.1 6658209 6.5 18.2 26.4 26.5 13.6 5.7 2.1 0.7 0.4 2 32.9 8393600 1.5 9.7 20.8 29.4 20.5 10.7 4.4 1.8 1.2 3 22.2 5657840 0.6 5.6 14.8 26.3 24.1 14.8 7.5 3.5 2.8 4 11.7 2999248 0.6 4.5 12 22.2 22 16.4 10 6.1 6.2 5 4.1 1050199 0.5 3.6 9.7 18.3 21.6 16.6 11.8 7.5 10.5 6+ 3 776782 0.7 3.7 9.1 14.5 17.5 15.5 12 8.6 18.4 Urban 100 6169807 1.6 10 21.1 28.2 19 10.2 4.7 2.4 2.8 1 32 1974549 3.5 18.2 29.2 27 13.5 5.6 1.8 0.6 0.6 2 24.6 1519369 1 8.8 21.8 31 20 10.5 4.1 1.8 1 3 19.3 1192826 0.5 5.3 17.5 30 23.4 11.9 5.8 3.1 2.5 4 12.6 780086 0.3 4.6 13.7 28.3 22.7 14 7.2 4.1 5.1 5 7.1 439246 0.7 3.1 12.5 24.5 23.3 16.2 8 5.3 6.2 6+ 4.3 263732 0.3 3.9 9 18.2 15.8 15 11.8 7.5 18.5
Barisal Division
Total 100 1849355 1.8 8.1 15.7 25.9 22.3 14.3 6.3 2.8 2.7 1 4.3 80332 9.3 16 26.1 28.6 11.7 5.6 1.8 0.4 0.5 2 18.6 344110 3 12.1 21.3 28.7 18.4 11.2 3 1.4 0.9 3 34.5 637157 1.3 8.4 16.1 28.1 23.6 13.4 6 1.6 1.5 4 25.8 476728 0.7 5.7 12.3 24.7 24.9 16.9 7.6 3.9 3.3 5 10.8 199362 0.9 4.9 11.6 21.6 24.5 16.1 9.9 5 5.5 6+ 6 111667 0.9 5.1 11.2 15.7 19.9 21.2 9.5 7.3 9.3 Rural 100 1610041 1.8 8.1 15.3 25.6 22.5 14.8 6.4 2.9 2.7 1 4.2 66904 10.2 15.8 24.6 28.9 11.3 6.3 1.8 0.5 0.5 2 18.7 300656 3.1 11.7 20.4 28.8 18.5 11.7 3.3 1.5 0.9 3 34.7 558469 1.3 8.4 15.7 27.4 23.9 14 6.2 1.6 1.5 4 25.8 415092 0.8 5.8 11.9 24.4 25.1 17.2 7.6 3.9 3.3 5 10.8 174437 0.9 4.9 11.7 21.4 24.6 16.3 9.6 5 5.5 6+ 5.9 94483 0.8 5.3 11.6 15.1 20 21.8 9.1 7.2 9.1 Urban 100 239315 1.7 8.6 18.6 27.9 21 11.3 5.8 2.6 2.5 1 5.6 13428 4.5 16.9 33.9 27.1 13.8 2.2 1.5 0 0 2 18.2 43454 2.9 14.9 27.5 27.5 17.7 7.5 0.9 0.6 0.6 3 32.9 78688 1.9 8.1 18.6 32.9 21.6 9.8 4.3 1.6 1.2 4 25.8 61636 0.6 5.5 14.9 26.6 23.6 14.8 7.7 3.5 2.9 5 10.4 24925 0.5 5.4 10.6 23.2 23.7 14 12.3 4.7 5.5 6+ 7.2 17184 1.4 3.5 8.8 19.1 19.1 17.9 11.8 8.3 10.1

National Series: Socio-economic and Demographic Report Page 31
Table H04: Number of Living Rooms by Household Size, Division and Zila, 2011
Number of Living Rooms
Percentage of Total
Household
Household Size Number of Household 1 2 3 4 5 6 7 8 9+
1 2 3 4 5 6 7 8 9 10 11 12
Barguna
Total 100 214594 2.6 11.9 19.5 28.5 20.2 10.5 3.9 1.3 1.7 1 7.1 15219 11.8 19.4 25.3 23.5 15.3 4.7 0 0 0 2 18.3 39212 2.7 16.2 26.3 29 17.6 6.6 0.7 0.2 0.7 3 26.8 57476 2.5 11.4 22.9 28.8 20.1 9.8 3.6 0.3 0.6 4 25.4 54432 1 10 15 31.6 22.5 11.2 5.4 1.8 1.5 5 13.6 29096 1.2 10.2 15.7 29.8 20.6 14.5 2.8 1.8 3.4 6+ 8.9 19159 1.9 6.5 9.8 20.1 22 17.3 11.7 4.7 6.1 Barisal Total 100 508586 1.7 7.7 15.5 25.9 21.8 15.4 6.7 3 2.3 1 4.4 22218 5.6 12.7 31.6 31.4 9 8.5 0.3 0.8 0 2 20.3 103447 2.8 11.8 20.2 29.1 18.5 11 3.1 2.2 1.3 3 36.9 187562 1.4 7.7 13.5 27.7 24.3 16.2 6.9 1.3 1 4 24 121947 0.9 4.8 13.3 24.4 23.3 17 9.2 4.2 2.9 5 8.8 44900 1.2 4.7 13.5 19 22.3 17.2 9.6 6.8 5.7 6+ 5.6 28512 0.6 6 12.5 15.8 19.9 21.5 8.8 7.8 7.1 Bhola Total 100 370560 0.7 5.2 14.1 24.8 22.3 16.7 8.3 3.6 4.2 1 4.8 17815 3.5 16.5 29.6 30.4 8.7 6.1 4.3 0 0.9 2 24.4 90316 0.9 8.7 18.9 30.7 20.8 14.1 3.6 1.9 0.5 3 35.5 131524 0.5 4.5 15.2 26.6 23.4 16.3 7.3 2.9 3.3 4 23.6 87528 0 2.7 9.2 20.5 24.4 21.1 11.3 5.3 5.5 5 7.9 29124 1.1 0.5 3.2 14.9 25 16.5 19.1 6.9 12.8 6+ 3.8 14252 1.1 1.1 7.6 9.8 20.7 25 12 8.7 14.1 Jhalokati Total 100 157231 3 10.9 16.5 26.1 22.7 11.9 4.8 2.4 1.8 1 2.8 4399 20.9 11.9 25.4 25.4 7.5 4.5 0 3 1.5 2 10.9 17200 8.8 17.6 21.4 26.3 14.9 7.6 2.3 0.4 0.8 3 38 59807 2.7 11 17.6 26.3 24.1 10.3 4.9 1.9 1.1 4 29.9 47005 1.1 10.1 12.6 26.5 24 15.8 4.6 3.1 2.2 5 12.4 19564 1 5.4 16.8 26.2 24.8 12.4 7.4 2.7 3.4 6+ 5.9 9257 0 12.8 15.6 21.3 23.4 12.8 5.7 5.7 2.8 Patuakhali Total 100 343963 1.5 7.6 14.7 23.7 24.2 15.3 6.6 3 3.4 1 4.1 14092 12.2 17.3 17.3 29.6 17.3 3.1 2 0 1 2 16.7 57375 2.8 11.3 22.3 29.1 16.3 13.3 3.3 0.8 1 3 31.8 109286 1.1 8.9 16.1 26.7 25.3 12.6 6.6 1.6 1.2 4 26.7 91743 0.3 4.7 11.6 21.8 29 18.5 6.1 3.9 4.1 5 13.1 45008 0 5.1 10.2 18.8 28.4 15 12.8 4.8 4.8 6+ 7.7 26459 1.1 2.7 9.8 12 16.8 26.1 8.2 9.2 14.1 Pirojpur Total 100 254421 2.5 9.2 16 28 22.5 12.2 5.1 2.6 1.9 1 2.6 6589 17.7 17.7 19.4 25.8 11.3 3.2 4.8 0 0 2 14.4 36558 7.3 15.7 23.3 22.7 18.3 7.8 3.8 0.6 0.6 3 36 91502 1.2 10.9 17.3 33.3 22.4 8.9 3.7 1.2 1
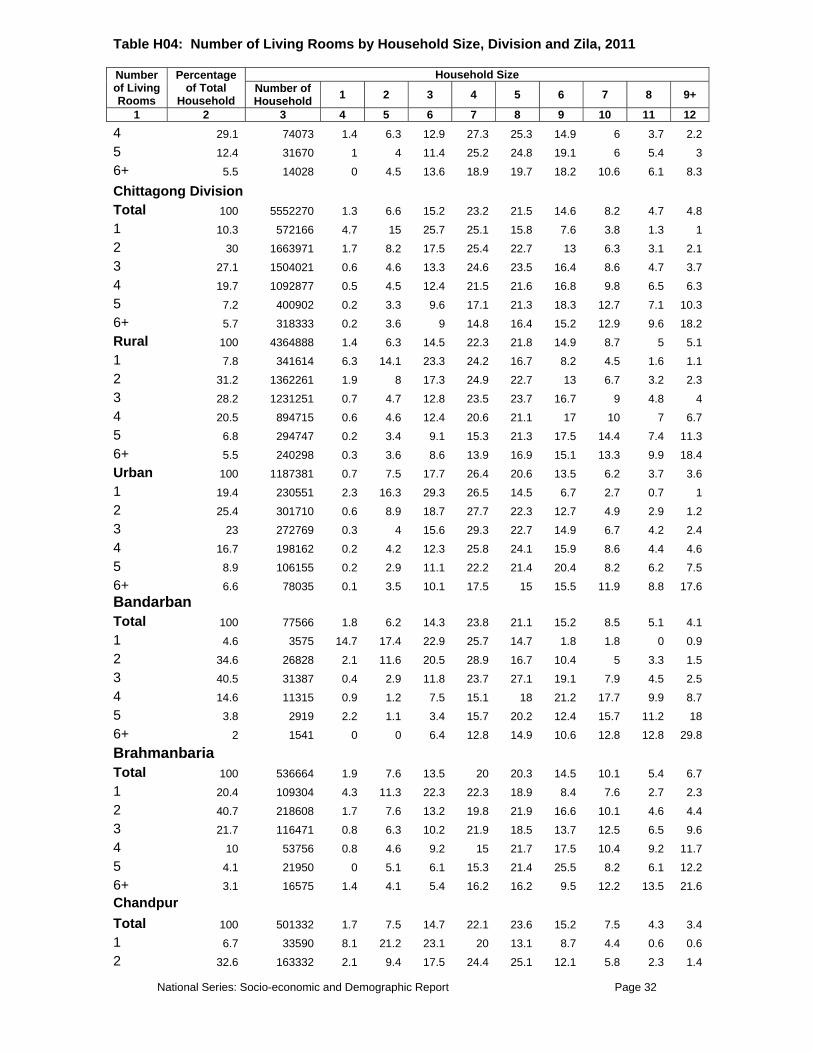
National Series: Socio-economic and Demographic Report Page 32
Table H04: Number of Living Rooms by Household Size, Division and Zila, 2011
Number of Living Rooms
Percentage of Total
Household
Household Size Number of Household 1 2 3 4 5 6 7 8 9+
1 2 3 4 5 6 7 8 9 10 11 124 29.1 74073 1.4 6.3 12.9 27.3 25.3 14.9 6 3.7 2.2 5 12.4 31670 1 4 11.4 25.2 24.8 19.1 6 5.4 3 6+ 5.5 14028 0 4.5 13.6 18.9 19.7 18.2 10.6 6.1 8.3
Chittagong Division Total 100 5552270 1.3 6.6 15.2 23.2 21.5 14.6 8.2 4.7 4.8 1 10.3 572166 4.7 15 25.7 25.1 15.8 7.6 3.8 1.3 1 2 30 1663971 1.7 8.2 17.5 25.4 22.7 13 6.3 3.1 2.1 3 27.1 1504021 0.6 4.6 13.3 24.6 23.5 16.4 8.6 4.7 3.7 4 19.7 1092877 0.5 4.5 12.4 21.5 21.6 16.8 9.8 6.5 6.3 5 7.2 400902 0.2 3.3 9.6 17.1 21.3 18.3 12.7 7.1 10.3 6+ 5.7 318333 0.2 3.6 9 14.8 16.4 15.2 12.9 9.6 18.2 Rural 100 4364888 1.4 6.3 14.5 22.3 21.8 14.9 8.7 5 5.1 1 7.8 341614 6.3 14.1 23.3 24.2 16.7 8.2 4.5 1.6 1.1 2 31.2 1362261 1.9 8 17.3 24.9 22.7 13 6.7 3.2 2.3 3 28.2 1231251 0.7 4.7 12.8 23.5 23.7 16.7 9 4.8 4 4 20.5 894715 0.6 4.6 12.4 20.6 21.1 17 10 7 6.7 5 6.8 294747 0.2 3.4 9.1 15.3 21.3 17.5 14.4 7.4 11.3 6+ 5.5 240298 0.3 3.6 8.6 13.9 16.9 15.1 13.3 9.9 18.4 Urban 100 1187381 0.7 7.5 17.7 26.4 20.6 13.5 6.2 3.7 3.6 1 19.4 230551 2.3 16.3 29.3 26.5 14.5 6.7 2.7 0.7 1 2 25.4 301710 0.6 8.9 18.7 27.7 22.3 12.7 4.9 2.9 1.2 3 23 272769 0.3 4 15.6 29.3 22.7 14.9 6.7 4.2 2.4 4 16.7 198162 0.2 4.2 12.3 25.8 24.1 15.9 8.6 4.4 4.6 5 8.9 106155 0.2 2.9 11.1 22.2 21.4 20.4 8.2 6.2 7.5 6+ 6.6 78035 0.1 3.5 10.1 17.5 15 15.5 11.9 8.8 17.6 Bandarban Total 100 77566 1.8 6.2 14.3 23.8 21.1 15.2 8.5 5.1 4.1 1 4.6 3575 14.7 17.4 22.9 25.7 14.7 1.8 1.8 0 0.9 2 34.6 26828 2.1 11.6 20.5 28.9 16.7 10.4 5 3.3 1.5 3 40.5 31387 0.4 2.9 11.8 23.7 27.1 19.1 7.9 4.5 2.5 4 14.6 11315 0.9 1.2 7.5 15.1 18 21.2 17.7 9.9 8.7 5 3.8 2919 2.2 1.1 3.4 15.7 20.2 12.4 15.7 11.2 18 6+ 2 1541 0 0 6.4 12.8 14.9 10.6 12.8 12.8 29.8
Brahmanbaria Total 100 536664 1.9 7.6 13.5 20 20.3 14.5 10.1 5.4 6.7 1 20.4 109304 4.3 11.3 22.3 22.3 18.9 8.4 7.6 2.7 2.3 2 40.7 218608 1.7 7.6 13.2 19.8 21.9 16.6 10.1 4.6 4.4 3 21.7 116471 0.8 6.3 10.2 21.9 18.5 13.7 12.5 6.5 9.6 4 10 53756 0.8 4.6 9.2 15 21.7 17.5 10.4 9.2 11.7 5 4.1 21950 0 5.1 6.1 15.3 21.4 25.5 8.2 6.1 12.2 6+ 3.1 16575 1.4 4.1 5.4 16.2 16.2 9.5 12.2 13.5 21.6 Chandpur Total 100 501332 1.7 7.5 14.7 22.1 23.6 15.2 7.5 4.3 3.4 1 6.7 33590 8.1 21.2 23.1 20 13.1 8.7 4.4 0.6 0.6 2 32.6 163332 2.1 9.4 17.5 24.4 25.1 12.1 5.8 2.3 1.4
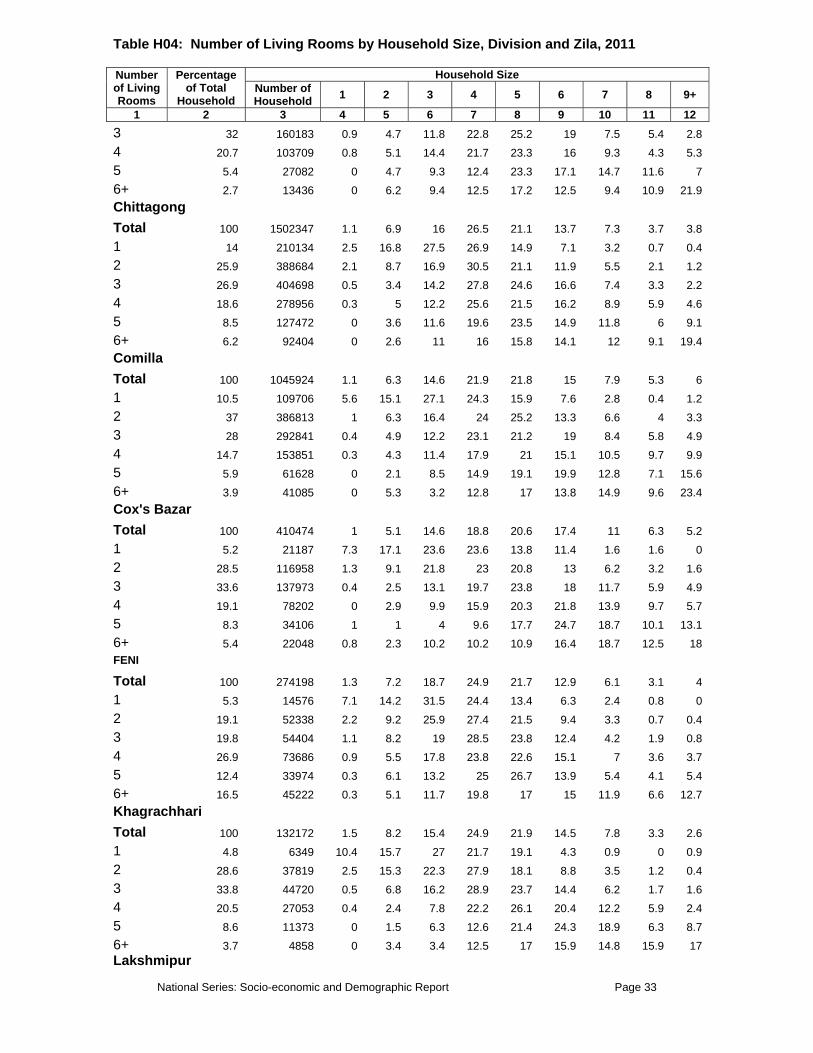
National Series: Socio-economic and Demographic Report Page 33
Table H04: Number of Living Rooms by Household Size, Division and Zila, 2011
Number of Living Rooms
Percentage of Total
Household
Household Size Number of Household 1 2 3 4 5 6 7 8 9+
1 2 3 4 5 6 7 8 9 10 11 123 32 160183 0.9 4.7 11.8 22.8 25.2 19 7.5 5.4 2.8 4 20.7 103709 0.8 5.1 14.4 21.7 23.3 16 9.3 4.3 5.3 5 5.4 27082 0 4.7 9.3 12.4 23.3 17.1 14.7 11.6 7 6+ 2.7 13436 0 6.2 9.4 12.5 17.2 12.5 9.4 10.9 21.9 Chittagong Total 100 1502347 1.1 6.9 16 26.5 21.1 13.7 7.3 3.7 3.8 1 14 210134 2.5 16.8 27.5 26.9 14.9 7.1 3.2 0.7 0.4 2 25.9 388684 2.1 8.7 16.9 30.5 21.1 11.9 5.5 2.1 1.2 3 26.9 404698 0.5 3.4 14.2 27.8 24.6 16.6 7.4 3.3 2.2 4 18.6 278956 0.3 5 12.2 25.6 21.5 16.2 8.9 5.9 4.6 5 8.5 127472 0 3.6 11.6 19.6 23.5 14.9 11.8 6 9.1 6+ 6.2 92404 0 2.6 11 16 15.8 14.1 12 9.1 19.4 Comilla Total 100 1045924 1.1 6.3 14.6 21.9 21.8 15 7.9 5.3 6 1 10.5 109706 5.6 15.1 27.1 24.3 15.9 7.6 2.8 0.4 1.2 2 37 386813 1 6.3 16.4 24 25.2 13.3 6.6 4 3.3 3 28 292841 0.4 4.9 12.2 23.1 21.2 19 8.4 5.8 4.9 4 14.7 153851 0.3 4.3 11.4 17.9 21 15.1 10.5 9.7 9.9 5 5.9 61628 0 2.1 8.5 14.9 19.1 19.9 12.8 7.1 15.6 6+ 3.9 41085 0 5.3 3.2 12.8 17 13.8 14.9 9.6 23.4 Cox's Bazar Total 100 410474 1 5.1 14.6 18.8 20.6 17.4 11 6.3 5.2 1 5.2 21187 7.3 17.1 23.6 23.6 13.8 11.4 1.6 1.6 0 2 28.5 116958 1.3 9.1 21.8 23 20.8 13 6.2 3.2 1.6 3 33.6 137973 0.4 2.5 13.1 19.7 23.8 18 11.7 5.9 4.9 4 19.1 78202 0 2.9 9.9 15.9 20.3 21.8 13.9 9.7 5.7 5 8.3 34106 1 1 4 9.6 17.7 24.7 18.7 10.1 13.1 6+ 5.4 22048 0.8 2.3 10.2 10.2 10.9 16.4 18.7 12.5 18 FENI Total 100 274198 1.3 7.2 18.7 24.9 21.7 12.9 6.1 3.1 4 1 5.3 14576 7.1 14.2 31.5 24.4 13.4 6.3 2.4 0.8 0 2 19.1 52338 2.2 9.2 25.9 27.4 21.5 9.4 3.3 0.7 0.4 3 19.8 54404 1.1 8.2 19 28.5 23.8 12.4 4.2 1.9 0.8 4 26.9 73686 0.9 5.5 17.8 23.8 22.6 15.1 7 3.6 3.7 5 12.4 33974 0.3 6.1 13.2 25 26.7 13.9 5.4 4.1 5.4 6+ 16.5 45222 0.3 5.1 11.7 19.8 17 15 11.9 6.6 12.7 Khagrachhari Total 100 132172 1.5 8.2 15.4 24.9 21.9 14.5 7.8 3.3 2.6 1 4.8 6349 10.4 15.7 27 21.7 19.1 4.3 0.9 0 0.9 2 28.6 37819 2.5 15.3 22.3 27.9 18.1 8.8 3.5 1.2 0.4 3 33.8 44720 0.5 6.8 16.2 28.9 23.7 14.4 6.2 1.7 1.6 4 20.5 27053 0.4 2.4 7.8 22.2 26.1 20.4 12.2 5.9 2.4 5 8.6 11373 0 1.5 6.3 12.6 21.4 24.3 18.9 6.3 8.7 6+ 3.7 4858 0 3.4 3.4 12.5 17 15.9 14.8 15.9 17 Lakshmipur

National Series: Socio-economic and Demographic Report Page 34
Table H04: Number of Living Rooms by Household Size, Division and Zila, 2011
Number of Living Rooms
Percentage of Total
Household
Household Size Number of Household 1 2 3 4 5 6 7 8 9+
1 2 3 4 5 6 7 8 9 10 11 12Total 100 363496 1.6 7.3 16.8 23.5 21.3 15.4 7 3.8 3.2 1 5.2 18972 7.2 14.4 31.2 25.6 12 6.4 2.4 0.8 0 2 27.3 99108 1.8 9.2 20.5 27.3 21.4 13.3 3.1 2.8 0.6 3 22.1 80440 1.1 6.6 13.4 22.1 26.4 14.3 7.2 5.5 3.4 4 33.1 120204 1 6.6 14.6 23.2 20.1 17.9 9 3.4 4.2 5 5.4 19730 1.5 2.3 15.4 17.7 20 15.4 14.6 6.2 6.9 6+ 6.9 25043 0.6 4.2 13.3 18.2 18.8 21.2 10.3 5.5 7.9 Noakhali Total 100 581946 0.9 4.3 12.9 21.5 22.3 14.9 10.2 6.4 6.6 1 6.2 36187 5.4 6.8 20.4 32.7 17.7 8.2 2 4.1 2.7 2 24.3 141302 1 5.6 16.9 23.9 24.9 13.9 8 4.2 1.6 3 23.5 136871 0.7 4.3 11.7 24.1 25.5 12.8 12.1 5.2 3.6 4 28 162965 0.6 3.5 11.8 19.9 21.3 16.3 10 7.7 8.9 5 9 52188 0 3.3 9 16 17.5 21.2 14.2 8 10.8 6+ 9 52434 0 2.3 7 10.8 17.8 17.4 13.6 11.7 19.2 Rangamati Total 100 126151 2 8.3 19.2 27.3 20.9 11.4 6.1 2.9 2 1 6.8 8586 9.8 23.3 23.9 20.9 16 4.3 1.8 0 0 2 25.5 32183 3.4 13.7 25.7 26.7 17.3 8 3.6 1.3 0.2 3 34.9 44034 1 6.8 23 30.6 21.5 9.3 5 1.8 1 4 23.1 29181 0.2 2.9 10.8 27.3 26.7 17.7 7.8 4.7 2 5 6.7 8480 0.6 1.9 4.3 25.5 18.6 16.8 15.5 8.1 8.7 6+ 2.9 3687 1.4 1.4 5.7 11.4 14.3 18.6 15.7 11.4 20
Dhaka Division Total 100 10578551 2.2 11.4 19.9 26.3 19.3 10.9 5.1 2.4 2.4 1 40 4236293 4.2 18.5 25.5 25.9 15 6.9 2.5 0.9 0.6 2 29.3 3095318 1.2 8.7 19.2 28.8 21.4 12.4 5.2 2 1.2 3 16.7 1769859 0.6 5.4 14.5 25.8 24.2 14.5 8 3.8 3.1 4 8.2 867450 0.5 4.6 12.3 24.8 21.9 14.5 8.6 5.9 7 5 3.7 389387 0.7 3.1 11.4 22.4 23.5 15.9 9.3 6.4 7.3 6+ 2.1 220244 0.5 3.7 8.1 15.1 15.9 14.8 11.9 7.5 22.5 Rural 100 7801801 2.5 11.6 19.3 25.6 19.4 11.3 5.4 2.5 2.4 1 39.2 3057736 5 18.5 24.4 25.4 15.4 7.2 2.7 1 0.6 2 32.2 2514358 1.2 9.1 18.9 28.4 21.5 12.5 5.1 2 1.2 3 17 1329104 0.7 5.4 14 24.4 24 15.8 8.7 3.9 3.1 4 7.4 575246 0.7 4.9 11.5 21.7 21.7 15 10.2 6.8 7.5 5 2.5 191623 0.3 3.6 9.4 19 19.8 16.5 11.6 8.4 11.4 6+ 1.7 133734 0.6 4 9.1 13.3 15.7 15 10.8 7.9 23.6 Urban 100 2776749 1.3 10.9 21.6 28.4 19.1 9.6 4.4 2.2 2.5 1 42.4 1178557 2.3 18.5 28.5 27.3 14.2 6 1.9 0.6 0.6 2 20.9 580960 0.9 7.1 20.6 30.5 20.8 11.7 5.5 1.9 1.2 3 15.9 440755 0.2 5.6 16.1 30 24.7 10.5 6.1 3.6 3.1 4 10.5 292204 0.2 4.1 13.8 31 22.3 13.4 5.3 4 6 5 7.1 197764 1.2 2.6 13.4 25.7 27 15.4 7 4.4 3.4 6+ 3.1 86510 0.2 3.2 6.5 17.8 16.3 14.7 13.6 6.9 20.8

National Series: Socio-economic and Demographic Report Page 35
Table H04: Number of Living Rooms by Household Size, Division and Zila, 2011
Number of Living Rooms
Percentage of Total
Household
Household Size Number of Household 1 2 3 4 5 6 7 8 9+
1 2 3 4 5 6 7 8 9 10 11 12
Dhaka Total 100 2633512 1.1 12.7 21.8 27.9 17.8 9.4 4.4 2.3 2.6 1 46.8 1232211 1.5 20.7 27.9 27.9 13.1 5.9 1.9 0.6 0.4 2 18.7 493352 0.8 7.4 20.4 30.6 19.8 12.1 5.4 2 1.6 3 14.4 379643 0.5 6.2 16.6 28.3 23.9 10.8 7 4.2 2.4 4 9.6 253589 0.6 5.1 14.1 29.4 22.1 13.2 4.6 5.1 5.7 5 7.1 185912 1.2 2.8 13.1 25.2 26.4 15.4 7.8 4.5 3.6 6+ 3.4 88803 0 2.6 7 13.3 14.7 13.8 13.3 7.6 27.7
Faridpur Total 100 417682 2.3 8.1 17 26.6 22.2 12.7 6.5 2.5 2 1 24.7 103069 5.2 12.5 23.4 29.1 20.5 6.6 1.5 0.3 0.8 2 34.3 143180 1.9 9.6 18.6 29.8 21.6 12.1 4.1 1.3 0.9 3 21.9 91384 0.6 4.6 14.3 25.8 24 14.5 11.1 3.4 1.7 4 13 54412 1.3 4.8 9 19.6 24.7 19.2 12.2 5.4 3.8 5 3.8 16045 0 2.2 5.4 19.6 20.7 22.8 14.1 9.8 5.4 6+ 2.3 9592 1.8 1.8 12.7 12.7 21.8 14.5 7.3 7.3 20
Gazipur Total 100 808411 1.2 17.8 24.2 26.1 16.7 7.8 2.8 1.4 1.9 1 48.3 390372 2.1 29.6 29.4 22.9 11.5 3.7 0.5 0.3 0.1 2 23.2 187257 0.9 9.2 22.5 26.7 21.6 11.9 4.1 1.8 1.3 3 14.1 114379 0 3.5 18.3 32.2 23 12.7 4.1 2.9 3.2 4 7.9 64106 0 7.9 18.9 33.2 18.9 8.9 6.3 3.2 2.6 5 3.7 30029 0 2.2 12.4 30.3 24.7 10.1 6.7 3.4 10.1 6+ 2.8 22268 0 6.1 10.6 19.7 18.2 13.6 10.6 3 18.2
Gopalganj Total 100 248424 1.6 6 13.2 24.9 23.3 15.7 7.3 4.1 3.8 1 36.3 90166 1.8 6.9 15.7 26.8 23 14.4 6.1 2.8 2.5 2 28.5 70682 1.8 7.5 13 21.8 22.9 18.6 7.3 3.8 3.2 3 21.8 54204 1.5 4.2 12.2 27 25.8 14 7.6 4.4 3.3 4 8.6 21453 1 3.9 9.2 24.2 22.7 15 8.2 7.7 8.2 5 2.8 7047 0 2.9 10.3 20.6 19.1 17.6 11.8 5.9 11.8 6+ 2 4871 0 2.1 2.1 23.4 17 19.1 12.8 10.6 12.8
Jamalpur Total 100 561712 4.3 11.2 18.5 29.4 21.6 8.5 4 1.4 1.2 1 36.5 204961 8.9 17.1 22.6 28.9 16.2 3.8 1.4 0.8 0.2 2 38.5 216439 1.9 9.8 19.7 33.3 22.1 8.9 3 0.8 0.4 3 16.5 92760 1.3 5.6 11.4 26.3 32.1 13.1 7.1 2 1.3 4 5.9 33028 1.4 1.4 9.9 18.4 24.8 19.9 12.8 5 6.4 5 1.8 9838 0 7.1 4.8 23.8 16.7 14.3 14.3 4.8 14.3 6+ 0.8 4685 0 5 10 20 15 10 15 10 15
Kishoreganj Total 100 622614 4 9.1 15.7 22.3 20.1 14.6 7.3 3.8 3.1 1 42.2 262564 8 15.5 19.4 21 17.8 11.5 4.3 1.6 0.9 2 35 217850 1.6 5.8 16 26.1 22.8 15.6 7.2 3.3 1.6 3 15.1 94107 0.3 2.5 8 20.2 21.8 21.8 14.4 5.2 5.8

National Series: Socio-economic and Demographic Report Page 36
Table H04: Number of Living Rooms by Household Size, Division and Zila, 2011
Number of Living Rooms
Percentage of Total
Household
Household Size Number of Household 1 2 3 4 5 6 7 8 9+
1 2 3 4 5 6 7 8 9 10 11 124 5.3 32755 0.8 1.6 8.7 19 16.7 11.1 12.7 14.3 15.1 5 1.5 9359 0 0 13.9 11.1 11.1 16.7 8.3 19.4 19.4 6+ 1 5979 0 0 8.7 8.7 26.1 13 8.7 8.7 26.1
Madaripur Total 100 251057 1.5 8.5 17 25.2 21.2 15.4 6.3 2.6 2.3 1 10 25158 5.4 15.4 24.6 23.3 16.7 7.9 5 0 1.7 2 29.5 74112 1.7 10.5 19.5 29.7 19.8 13 3.3 1.4 1.1 3 37.8 94867 0.9 6 15.4 23.8 24.4 18.1 6.6 2.7 2.2 4 14.1 35326 0.6 6.8 15.4 24.6 16.9 18.7 8.6 4.7 3.6 5 4.8 12055 0 7.8 5.2 21.7 26.1 13.9 16.5 4.3 4.3 6+ 3.8 9539 1.1 7.7 15.4 15.4 22 16.5 7.7 7.7 6.6
Manikganj Total 100 321583 2.3 11.2 19.4 29 19.2 9.7 4.6 2.4 2.1 1 34.1 109532 5.5 18.7 25.2 28.3 15 4.9 1.1 0.5 0.6 2 37.7 121268 0.8 8.9 19.9 31 21 11.3 4.4 1.8 0.8 3 19.4 62320 0.2 5.8 14.3 30.7 23.2 13.6 6.7 2.4 3 4 6.1 19694 0 3.4 6.2 21.9 21.2 13 11.6 11.6 11 5 1.7 5396 0 7.5 10 17.5 22.5 12.5 12.5 12.5 5 6+ 1 3372 4 4 0 4 0 12 28 20 28
Munshiganj Total 100 310146 2.2 9.8 19.8 27.2 20.4 12 4.3 2 2.3 1 30.5 94494 4.5 14.7 23.7 30.5 16.3 8.1 1.6 0.5 0 2 37.5 116370 1.3 9 20.8 27.9 22.2 12.1 4.6 1.6 0.4 3 18.8 58249 0.9 6.2 18.2 26.9 22.2 15.1 4.7 2.7 3.1 4 8.7 27054 1 5.3 9.6 21.1 25.4 15.8 9.1 4.3 8.6 5 2.5 7637 0 1.7 11.9 13.6 18.6 22 11.9 8.5 11.9 6+ 2 6343 2 14.3 10.2 10.2 12.2 10.2 8.2 6.1 26.5
Mymensingh Total 100 1149136 3 10.2 18.4 25.2 18.9 12.2 6 2.8 3.3 1 46.2 530702 6.1 15.3 22.8 25.1 16.1 8.5 3.7 1.2 1.4 2 30.7 352843 0.4 6.8 18.5 28.4 21.3 14.5 6.7 2.2 1.2 3 14.5 166833 0.3 5.2 9.8 22.4 23 17.5 11.2 5.5 5.2 4 5.9 67596 0 4.3 9.2 19.1 21.3 13.5 8.5 8.5 15.6 5 1.7 19656 0 2.4 14.6 22 12.2 19.5 4.9 9.8 14.6 6+ 1 11506 0 4.2 4.2 16.7 8.3 16.7 8.3 8.3 33.3
Narayanganj Total 100 618606 1.7 13.3 21.5 26.8 19.4 9.4 4.3 1.9 1.7 1 45.2 279326 3.5 20.1 29.3 25.9 13 5.3 1.8 0.6 0.6 2 33.2 205557 0.3 9.7 18.1 29.3 25.1 10.2 5.2 1.2 0.8 3 13.5 83439 0.3 5.3 12.6 25.8 26.2 15.2 7.3 4 3.3 4 5.5 33983 0 4.9 4.9 26 20.3 21.1 7.3 7.3 8.1 5 1.6 9946 0 2.8 13.9 11.1 27.8 19.4 8.3 13.9 2.8 6+ 1 6355 0 0 8.7 21.7 13 8.7 21.7 8.7 17.4
Narsingdi Total 100 472950 2.2 9.1 18.4 23.4 21.3 12.5 6.3 3.1 3.6

National Series: Socio-economic and Demographic Report Page 37
Table H04: Number of Living Rooms by Household Size, Division and Zila, 2011
Number of Living Rooms
Percentage of Total
Household
Household Size Number of Household 1 2 3 4 5 6 7 8 9+
1 2 3 4 5 6 7 8 9 10 11 121 44.8 211889 3.9 13.7 24.6 24.4 19.4 8.7 3.5 1 0.7 2 32.9 155807 0.8 5.7 15.5 24.6 23.2 16.3 7 4.2 2.8 3 13.2 62402 0.3 6.3 10.8 19.9 21.8 15.5 13.3 5.1 7 4 5.9 28041 0.7 1.4 11.3 19.7 26.1 14.1 7.7 4.9 14.1 5 1.8 8294 0 4.8 7.1 21.4 19 11.9 9.5 11.9 14.3 6+ 1.4 6517 6.1 9.1 3 12.1 15.2 12.1 6.1 9.1 27.3
Netrokona Total 100 477130 2.7 9.1 16.7 22.6 20.1 14.6 7.8 3.6 2.8 1 51.3 244938 4.4 12.2 21 23 18.4 11.8 5.9 2.3 1.1 2 30.8 147162 1.2 7.6 14.9 24.6 21.9 15.8 8.3 4.1 1.6 3 10.9 52174 0.8 4.2 9.2 20.6 20.2 20.6 11.8 4.2 8.4 4 3.9 18520 0 1.1 4.3 18.3 22.6 19.4 16.1 10.8 7.5 5 1.9 8961 0 0 2.2 8.9 28.9 22.2 13.3 11.1 13.3 6+ 1.1 5377 0 3.7 7.4 3.7 25.9 22.2 3.7 11.1 22.2
Rajbari Total 100 236462 1.6 8.9 19.1 30 21.1 10 4.4 2.6 2.3 1 24.7 58448 4.4 14.7 30.8 29.1 16.1 3.7 0.3 0.5 0.3 2 40.9 96820 1.1 8.6 18.5 33.5 22.5 10.2 3.9 1.3 0.4 3 20.2 47866 0 6.4 13.2 31.8 24.4 12.6 5.2 3.7 2.7 4 8.7 20472 0.5 3.9 9.7 18.4 24.6 15 12.1 7.7 8.2 5 3.4 8011 0 3.7 6.2 25.9 16 16 9.9 9.9 12.3 6+ 2 4846 0 0 8.2 10.2 14.3 22.4 14.3 10.2 20.4
Shariatpur Total 100 245816 1.8 7.2 16.2 20.5 21.4 15.7 9.4 4.9 3 1 14.7 36158 3.7 13.4 23.9 22.2 15.9 10.5 7.1 2.8 0.6 2 31.4 77248 2.4 8.8 18.6 24.3 22.9 13.6 6.6 2.3 0.5 3 30 73858 1 4.5 13.1 18.5 25.5 18.5 9.6 6.7 2.8 4 14.9 36569 0.6 3.9 11 16 18.8 20.8 16.3 5.9 6.7 5 5.6 13662 1.5 6 12.8 19.5 17.3 12 10.5 10.5 9.8 6+ 3.4 8321 1.2 6.2 16 17.3 12.3 17.3 9.9 9.9 9.9
Sherpur Total 100 340343 4.5 12.8 21.2 25.8 18.5 10.6 3.9 1.8 0.8 1 60.4 205597 7 17.1 25 26 15.9 6.9 1.5 0.5 0.1 2 30.5 103793 0.8 7.5 16.4 29.1 22.2 14.9 5.9 2.3 0.8 3 6.8 23286 0.6 1.8 15.2 14.6 20.1 22.6 12.8 9.1 3 4 1.9 6389 0 4.4 4.4 8.9 40 13.3 13.3 4.4 11.1 5 0.2 710 0 0 0 20 20 0 40 20 0 6+ 0.2 568 0 0 0 0 0 50 0 0 50
Tangail Total 100 862967 2.7 12 22.3 27.2 19 8.8 4.4 1.6 1.8 1 18.2 156706 9.7 22.1 30.2 24 10.6 2.1 0.9 0.5 0 2 36.6 315579 1.9 14.6 24.9 30.3 17.5 7.1 2.2 0.7 0.7 3 25.3 218089 0.7 7.3 20 27.3 24.8 11.8 5.1 1.8 1.2 4 13.3 114461 0.3 4.7 15.8 27.8 22.1 12 10.1 3.8 3.5 5 4.3 36830 1 2.9 9.8 15.7 23.5 18.6 11.8 4.9 11.8

National Series: Socio-economic and Demographic Report Page 38
Table H04: Number of Living Rooms by Household Size, Division and Zila, 2011
Number of Living Rooms
Percentage of Total
Household
Household Size Number of Household 1 2 3 4 5 6 7 8 9+
1 2 3 4 5 6 7 8 9 10 11 126+ 2.5 21303 0 1.7 6.8 22 18.6 18.6 13.6 5.1 13.6
Khulna Division Total 100 3707047 2.3 10.1 22.2 30.1 19.2 8.9 3.9 1.6 1.6 1 25.1 929967 6.1 17.2 29.2 29.2 12.4 4.2 1.1 0.4 0.2 2 37.1 1373567 1.4 10 24 32.3 19.7 8.4 2.8 0.8 0.6 3 22.5 835027 0.5 6.5 18.2 30.9 23.5 11.4 5.5 1.8 1.7 4 10 371196 0.8 4.3 13.2 27 23.1 14.3 8.2 4.6 4.5 5 3.4 125066 0.9 3.5 12.4 22.4 23 15.8 8.7 6.5 6.8 6+ 1.9 72224 0.6 5 8.8 18.1 21 12.9 11.2 8 14.5 Rural 100 3114437 2.2 10.1 22 30 19.4 9 4 1.6 1.6 1 24.3 756324 6.1 17.2 29.4 28.9 12.5 4.1 1.2 0.3 0.2 2 38.1 1187094 1.4 10.1 23.9 32.2 19.8 8.4 2.8 0.8 0.6 3 23 717248 0.4 6.5 17.6 31.1 23.5 11.6 5.8 1.7 1.7 4 9.7 302713 0.7 4.2 12.9 26 23.8 14.8 8.3 4.9 4.4 5 3.1 95722 1.1 3.6 11.3 21.9 23.5 15.1 9.4 6.9 7.1 6+ 1.8 55335 0.8 4.4 8.2 17.9 20.6 12.9 12 8.3 14.7 Urban 100 592610 2.6 10.1 23.3 30.6 18 8.5 3.3 1.6 1.8 1 29.3 173643 6.2 16.9 28.6 30.6 12 4.4 0.6 0.4 0.3 2 31.5 186472 1.3 9.3 24.9 32.9 19 8.1 2.8 1.1 0.7 3 19.9 117779 1 6.7 21.9 30 23 9.9 4.2 1.8 1.4 4 11.6 68483 1.1 5.1 14.3 31.4 19.9 12.5 7.8 3.1 4.8 5 5 29344 0.5 2.9 15.9 24.1 21.2 18.1 6.3 5.1 5.8 6+ 2.8 16889 0 7.1 10.6 18.6 22 12.8 8.2 6.9 13.8
Bagerhat Total 100 348200 2.9 8.5 18.6 27.2 21.6 10.7 5.7 2.7 1.9 1 15.3 53311 8.5 15.1 23 27.4 15.1 7.7 2.5 0.3 0.5 2 27.3 95229 3.5 10.3 22.5 29 19.8 7.8 4 2 1.1 3 31.2 108666 1.2 7.3 19.4 29.6 23.5 10.1 5.5 2 1.5 4 16.4 56962 0.5 4.6 13.1 23.3 25.4 15.9 7.9 5.6 3.6 5 7.5 25998 1.1 2.8 8.4 23.6 24.7 17.4 13.5 5.1 3.4 6+ 2.3 8033 1.8 7.3 5.5 12.7 25.5 16.4 10.9 9.1 10.9
Chuadanga Total 100 275295 1.7 11.8 25.8 31.5 16.2 7.3 3.3 1.1 1.3 1 37.3 102687 4.2 20.2 32.1 29.3 10.2 3.3 0.4 0.2 0 2 34.8 95765 0.5 8.4 24.3 34.3 20.4 7.5 3.3 0.5 0.8 3 19.4 53536 0 5.4 21.1 32.8 18.1 13.1 5.8 1.9 1.7 4 6.1 16730 0 3.4 17.2 32.4 18.6 11 8.3 2.8 6.2 5 1.5 4154 0 2.8 5.6 11.1 30.6 8.3 13.9 13.9 13.9 6+ 0.9 2423 0 0 14.3 14.3 19 19 14.3 9.5 9.5
Jessore Total 100 652878 2.6 9.9 22.6 30.5 19.4 8.4 3.6 1.5 1.4 1 23.9 155732 7.7 16.3 32 28.5 11.4 3.3 0.9 0 0 2 33.6 219169 1.4 10.9 25.2 32.4 19.4 7.3 2.2 0.9 0.2 3 22.9 149471 0.7 7.5 17.9 31.1 23.5 10.2 5.5 2.2 1.5 4 14.5 94474 0.9 3.7 13.3 32 23.3 13.8 6.3 2.6 4

National Series: Socio-economic and Demographic Report Page 39
Table H04: Number of Living Rooms by Household Size, Division and Zila, 2011
Number of Living Rooms
Percentage of Total
Household
Household Size Number of Household 1 2 3 4 5 6 7 8 9+
1 2 3 4 5 6 7 8 9 10 11 125 3.5 22598 1.2 2.4 9.6 24.1 25.3 19.3 7.2 6 4.8 6+ 1.8 11435 0 2.4 9.5 14.3 33.3 9.5 11.9 4.8 14.3
Jhenaidah Total 100 417438 2.1 10.9 22.3 32.5 18.5 7.7 3.3 1.2 1.3 1 27.8 116033 5.3 16.6 30.9 32.5 11.6 2 0.5 0.3 0.3 2 38.4 160094 1.3 11.4 22.4 33.6 19.7 8.3 2 0.7 0.7 3 21.3 88824 0.4 6.5 16 35 23.7 10.5 5.7 1.2 1 4 8.5 35284 0.5 4 11.9 27.9 24.4 12.9 9.5 4 5 5 3.2 13166 0 4 20 22.7 18.7 13.3 6.7 5.3 9.3 6+ 1 4037 0 8.7 13 13 4.3 21.7 17.4 13 8.7
Khulna Total 100 538801 1.9 8.7 22.4 29.1 19.5 10.2 3.8 2 2.4 1 28 150907 4.7 12.9 27.4 30.5 15.2 5.8 1.8 1.1 0.5 2 41.6 224009 1 9.1 24.4 30.2 19.6 11 3 0.9 0.8 3 17.8 96115 0.3 4.2 16.3 27 26 13.8 6 2.5 4 4 8.2 43924 0.4 4.2 14.4 24.6 18.9 11.3 9.7 7.8 8.7 5 2.6 14182 1.6 5.2 13.5 24.7 23.6 14.7 4.3 6.8 5.7 6+ 1.8 9664 1.7 3.3 9.3 29.6 14.5 11.6 6 5.2 18.9
Kushtia Total 100 474997 2.7 12.1 24.6 31.1 18 6.8 2.8 1.1 0.8 1 26.7 126930 6.4 22.2 30.9 29.4 8.9 2 0 0 0.2 2 39.1 185834 1.7 9.9 25.7 36 18.1 6.3 1.6 0.3 0.3 3 19.3 91826 0.4 7.3 22 29.8 25.1 8.9 5.2 1.1 0.2 4 9.1 43037 2.8 6.5 15.2 23 27.2 12.9 8.3 3.7 0.5 5 3.2 15271 0 2.6 14.3 23.4 22.1 20.8 3.9 9.1 3.9 6+ 2.5 12098 0 8.2 4.9 21.3 21.3 9.8 11.5 6.6 16.4
Magura Total 100 204293 2.9 9.1 20.2 29.3 21 9.5 4.1 1.8 2.1 1 25 51031 8.2 13.4 26.8 30 16.4 3.5 1.2 0 0.3 2 37 75518 1 8.8 21.3 32.5 22.1 9.8 2.5 1.2 0.7 3 23 46921 0.9 6.4 17.3 29.2 25.4 11.9 5.5 1.8 1.6 4 8.3 17039 1 7.5 9 22.6 22.1 17.1 8 6 6.5 5 3.4 7021 3.7 3.7 17.1 19.5 15.9 13.4 9.8 9.8 7.3 6+ 3.3 6764 1.3 7.6 7.6 15.2 16.5 11.4 17.7 3.8 19
Meherpur Total 100 165697 2.3 13.7 25.7 30.2 16.1 7 2.6 1.4 1 1 22.3 36998 7.3 26.9 32.1 25.6 6.7 0.7 0.6 0 0 2 33.3 55186 1.1 13.2 26.8 32.7 16.5 6.8 1.3 1.3 0.4 3 27.4 45366 0.6 10.1 23.8 33.7 18 8.2 3.5 1.2 0.9 4 10.2 16943 0.8 2.4 20 30.2 24.5 14.7 3.7 2.4 1.2 5 4.5 7469 0.9 6.5 16.7 18.5 25 10.2 12 4.6 5.6 6+ 2.3 3734 0 1.9 11.1 20.4 22.2 14.8 9.3 9.3 11.1
Narail Total 100 161961 2.8 10.1 17.9 28.3 20.8 10.2 5.8 1.8 2.3 1 24.6 39831 7.1 14.8 20.2 27.2 16.8 8.1 3.9 1 0.8
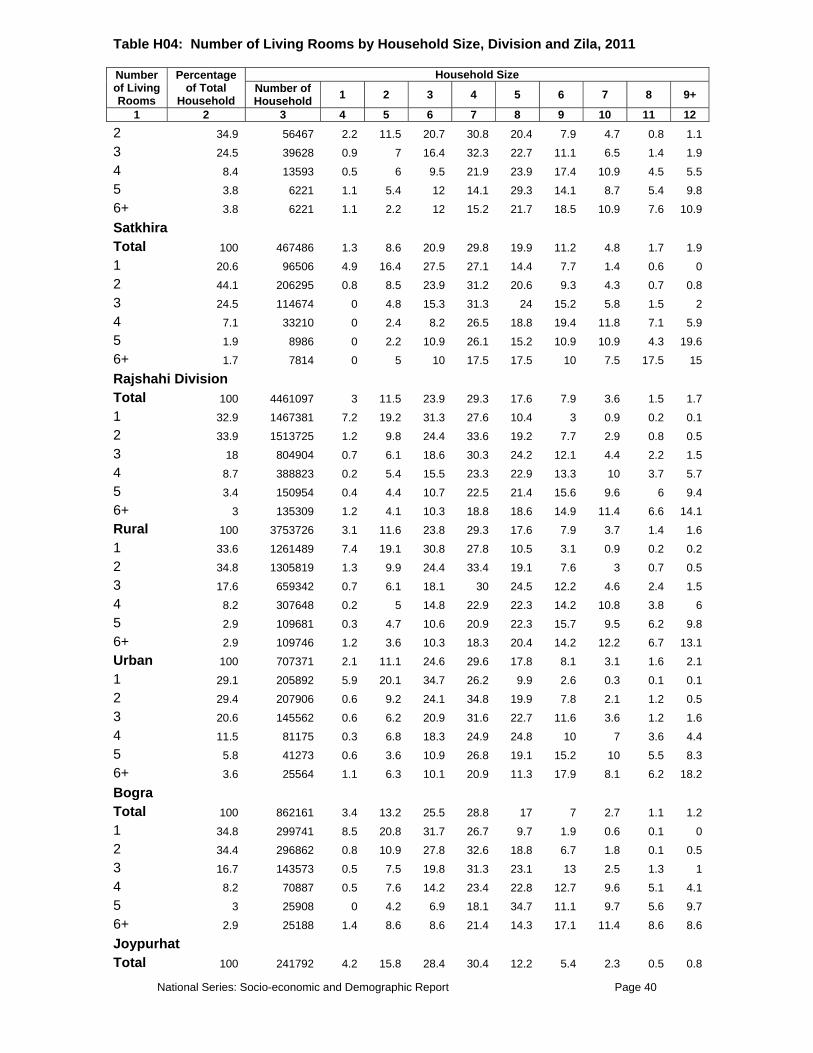
National Series: Socio-economic and Demographic Report Page 40
Table H04: Number of Living Rooms by Household Size, Division and Zila, 2011
Number of Living Rooms
Percentage of Total
Household
Household Size Number of Household 1 2 3 4 5 6 7 8 9+
1 2 3 4 5 6 7 8 9 10 11 122 34.9 56467 2.2 11.5 20.7 30.8 20.4 7.9 4.7 0.8 1.1 3 24.5 39628 0.9 7 16.4 32.3 22.7 11.1 6.5 1.4 1.9 4 8.4 13593 0.5 6 9.5 21.9 23.9 17.4 10.9 4.5 5.5 5 3.8 6221 1.1 5.4 12 14.1 29.3 14.1 8.7 5.4 9.8 6+ 3.8 6221 1.1 2.2 12 15.2 21.7 18.5 10.9 7.6 10.9
Satkhira Total 100 467486 1.3 8.6 20.9 29.8 19.9 11.2 4.8 1.7 1.9 1 20.6 96506 4.9 16.4 27.5 27.1 14.4 7.7 1.4 0.6 0 2 44.1 206295 0.8 8.5 23.9 31.2 20.6 9.3 4.3 0.7 0.8 3 24.5 114674 0 4.8 15.3 31.3 24 15.2 5.8 1.5 2 4 7.1 33210 0 2.4 8.2 26.5 18.8 19.4 11.8 7.1 5.9 5 1.9 8986 0 2.2 10.9 26.1 15.2 10.9 10.9 4.3 19.6 6+ 1.7 7814 0 5 10 17.5 17.5 10 7.5 17.5 15
Rajshahi Division Total 100 4461097 3 11.5 23.9 29.3 17.6 7.9 3.6 1.5 1.7 1 32.9 1467381 7.2 19.2 31.3 27.6 10.4 3 0.9 0.2 0.1 2 33.9 1513725 1.2 9.8 24.4 33.6 19.2 7.7 2.9 0.8 0.5 3 18 804904 0.7 6.1 18.6 30.3 24.2 12.1 4.4 2.2 1.5 4 8.7 388823 0.2 5.4 15.5 23.3 22.9 13.3 10 3.7 5.7 5 3.4 150954 0.4 4.4 10.7 22.5 21.4 15.6 9.6 6 9.4 6+ 3 135309 1.2 4.1 10.3 18.8 18.6 14.9 11.4 6.6 14.1 Rural 100 3753726 3.1 11.6 23.8 29.3 17.6 7.9 3.7 1.4 1.6 1 33.6 1261489 7.4 19.1 30.8 27.8 10.5 3.1 0.9 0.2 0.2 2 34.8 1305819 1.3 9.9 24.4 33.4 19.1 7.6 3 0.7 0.5 3 17.6 659342 0.7 6.1 18.1 30 24.5 12.2 4.6 2.4 1.5 4 8.2 307648 0.2 5 14.8 22.9 22.3 14.2 10.8 3.8 6 5 2.9 109681 0.3 4.7 10.6 20.9 22.3 15.7 9.5 6.2 9.8 6+ 2.9 109746 1.2 3.6 10.3 18.3 20.4 14.2 12.2 6.7 13.1 Urban 100 707371 2.1 11.1 24.6 29.6 17.8 8.1 3.1 1.6 2.1 1 29.1 205892 5.9 20.1 34.7 26.2 9.9 2.6 0.3 0.1 0.1 2 29.4 207906 0.6 9.2 24.1 34.8 19.9 7.8 2.1 1.2 0.5 3 20.6 145562 0.6 6.2 20.9 31.6 22.7 11.6 3.6 1.2 1.6 4 11.5 81175 0.3 6.8 18.3 24.9 24.8 10 7 3.6 4.4 5 5.8 41273 0.6 3.6 10.9 26.8 19.1 15.2 10 5.5 8.3 6+ 3.6 25564 1.1 6.3 10.1 20.9 11.3 17.9 8.1 6.2 18.2
Bogra Total 100 862161 3.4 13.2 25.5 28.8 17 7 2.7 1.1 1.2 1 34.8 299741 8.5 20.8 31.7 26.7 9.7 1.9 0.6 0.1 0 2 34.4 296862 0.8 10.9 27.8 32.6 18.8 6.7 1.8 0.1 0.5 3 16.7 143573 0.5 7.5 19.8 31.3 23.1 13 2.5 1.3 1 4 8.2 70887 0.5 7.6 14.2 23.4 22.8 12.7 9.6 5.1 4.1 5 3 25908 0 4.2 6.9 18.1 34.7 11.1 9.7 5.6 9.7 6+ 2.9 25188 1.4 8.6 8.6 21.4 14.3 17.1 11.4 8.6 8.6
Joypurhat Total 100 241792 4.2 15.8 28.4 30.4 12.2 5.4 2.3 0.5 0.8

National Series: Socio-economic and Demographic Report Page 41
Table H04: Number of Living Rooms by Household Size, Division and Zila, 2011
Number of Living Rooms
Percentage of Total
Household
Household Size Number of Household 1 2 3 4 5 6 7 8 9+
1 2 3 4 5 6 7 8 9 10 11 121 31.1 75119 11 27.1 32.9 22.7 4.6 1.3 0.4 0 0 2 38 91958 1.4 13 31.2 36.1 12.5 4.1 1.2 0.2 0.2 3 17.6 42651 0.5 7.8 23.9 33.6 20.1 10.9 2.6 0.7 0 4 7.9 19057 0.5 10.1 18.5 31.2 18 10.1 9 2.1 0.5 5 3.3 7865 3.8 3.8 14.1 25.6 17.9 14.1 10.3 1.3 9 6+ 2.1 5142 0 3.9 5.9 21.6 21.6 13.7 9.8 5.9 17.6
Naogaon Total 100 653457 3.8 12.2 26.4 30.7 15.6 6 3.1 0.9 1.2 1 24.1 157299 10.1 22.4 35.4 24.6 5.7 1.6 0 0.3 0 2 31.6 206369 2.6 11.8 27.7 36.2 16.1 3.8 1.6 0.1 0 3 19.3 126221 1.5 8 22.7 35.4 20.7 7.3 2.4 1.1 0.9 4 13.5 88055 0.3 6.5 22 26.9 20.1 11.5 9.6 0.6 2.5 5 5.3 34349 0.8 10.3 17.5 31 16.7 12.7 4 3.2 4 6+ 6.3 41165 2 2.6 13.9 20.5 25.2 13.2 9.9 4.6 7.9
Natore Total 100 422040 2.3 11.3 27.4 29.9 17.7 6.1 2.7 1.3 1.4 1 27.6 116303 6.8 19.4 36.1 26.2 9.2 2 0.2 0.2 0 2 32.2 136040 0.6 12 31 33.9 14.8 5.1 1.8 0.8 0 3 22 92866 0.8 6.6 21.1 32.4 27.3 7.2 2.5 1.3 0.8 4 10.2 42997 0 4.1 17.6 27 26.6 11.9 4.9 3.3 4.5 5 4.7 19736 0 2.7 11.6 27.7 19.6 19.6 11.6 4.5 2.7 6+ 3.3 14097 0 1.2 15 16.2 21.2 6.2 13.7 6.2 20
Chapai Nawabganj Total 100 353227 2.2 9.3 16.8 28.4 20.1 11.4 5.6 2.4 3.8 1 36.6 129204 5.2 15.2 25.5 32.5 15 4.6 1.2 0.5 0.5 2 36.5 128757 0.3 7.6 14.9 29.7 26.2 12.6 4.9 1.8 1.8 3 14.4 50908 1.2 2.9 9.4 22.5 22.8 19.9 12.6 5 3.8 4 7.8 27687 0 5.9 6.5 18.3 15.6 17.7 12.4 7.5 16.1 5 2.7 9378 0 1.6 6.3 25.4 12.7 15.9 9.5 6.3 22.2 6+ 2.1 7294 2 2 0 14.3 10.2 22.4 16.3 6.1 26.5
Pabna Total 100 587664 2.3 9.3 20.3 28.9 21 9.6 4.3 1.8 2.5 1 32.9 193598 5.2 16.5 28.4 31.4 13.9 3.2 0.9 0.1 0.4 2 31.4 184765 1.7 7.7 19.7 34.5 20.5 10.6 3.3 1.3 0.7 3 21.3 124894 0.2 4.7 15.7 25.3 30.5 14.3 4.5 2.2 2.6 4 7.6 44903 0 3.8 12.6 16.4 28.4 15.3 12.6 4.4 6.6 5 3.8 22329 0 1.1 6.6 15.4 22 13.2 18.7 11 12.1 6+ 2.9 17176 1.4 2.9 5.7 15.7 18.6 15.7 11.4 5.7 22.9
Rajshahi Total 100 630068 3.7 12.3 26.4 30.8 16.2 6.3 2.3 1.2 0.8 1 35.5 223667 8.9 21.6 34.4 25.8 7.4 1.7 0.1 0.1 0.1 2 35.1 221184 1.1 9.3 25.8 36.5 19.6 5.9 1.5 0.2 0.1 3 16.7 104947 0.5 6.3 20 32.6 23.8 10.8 3.9 1.9 0.3 4 7.4 46809 0.3 1.4 16.9 29 22.4 14.2 8.8 3.2 3.6 5 2.8 17424 0.2 4.6 11.2 26.1 23.6 13.7 7.6 7.4 5.4

National Series: Socio-economic and Demographic Report Page 42
Table H04: Number of Living Rooms by Household Size, Division and Zila, 2011
Number of Living Rooms
Percentage of Total
Household
Household Size Number of Household 1 2 3 4 5 6 7 8 9+
1 2 3 4 5 6 7 8 9 10 11 126+ 2.5 16036 0 4.2 8.9 22.2 14.6 18.5 8.9 12.5 10.2
Sirajganj Total 100 710687 2 9.6 20.7 27.3 19 10.9 5.8 2.3 2.5 1 38.3 272450 4.4 15.4 28.4 28.7 13.8 6.3 2.5 0.3 0.2 2 34.9 247790 0.7 7.6 18.5 30.2 22.2 11.6 6.5 1.9 0.8 3 16.7 118844 0.2 4.2 14.5 27.2 22.7 15.5 7.7 5 2.7 4 6.8 48429 0 4.3 9.2 14.1 25.8 14.7 13.5 6.1 12.3 5 2 13964 0 0 6.4 6.4 14.9 31.9 8.5 8.5 23.4 6+ 1.3 9210 0 6.5 12.9 9.7 9.7 16.1 16.1 3.2 25.8
Rangpur Division Total 100 3794607 3.7 11 21.4 29.8 18.5 9.1 3.5 1.5 1.4 1 29.1 1102436 10.2 19 27.9 27 11.4 3.5 0.8 0.1 0.1 2 36.4 1380346 1.7 11.6 23.3 33.4 18.5 7.9 2.5 0.7 0.4 3 21.2 804178 0.2 4.6 16.1 30.7 26 13.9 5.2 1.7 1.4 4 8.6 327317 0.3 2.7 11.1 27 23.2 18.2 8.9 5.1 3.5 5 2.9 108542 0.3 1.7 8 22.8 21.3 16.5 10.6 8.9 9.9 6+ 1.9 71789 0 2.1 11.9 16.6 17.9 13.3 11.6 7.8 18.9 Rural 100 3350279 3.7 11.1 21.2 29.8 18.8 9.1 3.5 1.5 1.3 1 29.1 973524 10.4 19.1 27.7 27.3 11.2 3.5 0.6 0.1 0 2 36.7 1230427 1.8 11.6 23.2 33.2 18.9 7.8 2.4 0.7 0.4 3 21.4 716934 0.2 4.9 15.7 30.7 26.3 13.8 5.1 1.8 1.4 4 8.4 282871 0.3 2.6 10.8 26.4 23.9 18.5 9.1 5 3.4 5 2.7 90209 0.3 1.2 7.3 21.4 22.6 18.4 11.2 8.8 8.7 6+ 1.7 56315 0 1.3 10.2 15.9 19.7 14.4 12.1 8 18.4 Urban 100 444328 3.2 10.3 23 30 16.4 9 4 1.7 2.4 1 29 128912 8.8 17.9 29.3 24.5 13.5 3.8 1.9 0 0.4 2 33.7 149919 1.7 11.4 24.7 35.1 14.6 8.5 2.7 0.9 0.5 3 19.6 87244 0.3 2.6 19.4 30.9 23.3 14.7 6.1 1.1 1.5 4 10 44446 0.3 3.8 12.9 30.9 19.3 15.7 7.2 5.3 4.6 5 4.1 18333 0 4.2 11.4 29.6 14.8 7.1 7.8 9.6 15.7 6+ 3.5 15475 0 4.6 18.2 19.3 11.5 9.2 9.8 6.9 20.5
Dinajpur Total 100 707906 3.4 11.4 20.2 31.7 18.9 9 3 1.3 1.2 1 34.1 241318 8.7 19.7 25.9 28.4 12.9 3.8 0.4 0.1 0 2 35.9 254097 1.1 9.7 20.7 36 19.8 9.5 2 0.8 0.5 3 18.9 133735 0 4.2 14 33.6 26 13.3 4.9 2 2 4 7.2 50819 0 4.1 11.1 27.5 25.1 15.2 10.5 4.7 1.8 5 2.5 17534 0 3.4 8.5 25.4 20.3 18.6 10.2 6.8 6.8 6+ 1.5 10402 0 0 17.1 11.4 14.3 14.3 14.3 2.9 25.7
Gaibandha Total 100 610023 5.2 12.5 25.6 28.1 16.1 7.4 2.6 1.2 1.2 1 42 256490 10.5 17.1 29.6 27.4 10 4.5 0.8 0 0.1 2 33.9 206822 2.1 12.8 26.1 28.7 17.9 7.8 3 1.2 0.5 3 16.1 98062 0.3 5.5 22.1 29.4 23.1 11.4 3.6 2.9 1.8 4 5.4 33112 0.8 1.5 10.8 27.7 26.2 16.9 6.9 3.1 6.2

National Series: Socio-economic and Demographic Report Page 43
Table H04: Number of Living Rooms by Household Size, Division and Zila, 2011
Number of Living Rooms
Percentage of Total
Household
Household Size Number of Household 1 2 3 4 5 6 7 8 9+
1 2 3 4 5 6 7 8 9 10 11 125 1.8 10698 0 0 4.8 28.6 31 7.1 11.9 4.8 11.9 6+ 0.8 4839 0 0 10.5 21.1 21.1 5.3 10.5 10.5 21.1
Kurigram Total 100 505627 4.3 11.2 21 30.5 17.6 8 4.1 1.5 1.7 1 30.2 152554 11.6 19 27.8 26.5 11.1 2.6 1.1 0.1 0.1 2 39.4 199250 1.8 11 22 35.8 18.3 7.1 2.7 0.5 0.7 3 20.3 102478 0.2 4.1 14.2 30.9 26 13 7.2 2.1 2.3 4 6.6 33596 0 2.5 8.2 27.7 18.2 20.1 13.2 5 5 5 2 10142 0 2.1 10.4 12.5 16.7 16.7 8.3 16.7 16.7 6+ 1.5 7607 0 5.6 22.2 5.6 16.7 8.3 13.9 11.1 16.7
Lalmonirhat Total 100 289470 3.6 12.2 21.4 27.8 18.2 9.6 4.4 1.6 1.1 1 18.8 54487 12.9 19.3 28.8 24.8 10.6 2.7 0.9 0 0 2 36.9 106920 2.5 17.6 24.6 28.1 15.7 7.2 3.3 0.7 0.2 3 23.4 67777 0.9 5.9 18 31 24.4 12.7 4.6 1.8 0.7 4 12.7 36848 0.3 3.9 11.8 31.1 21.6 17.7 8.9 2.6 2 5 4.5 13169 0.9 1.8 15.6 19.3 28.4 19.3 5.5 5.5 3.7 6+ 3.5 10269 0 3.5 11.8 16.5 18.8 10.6 16.5 9.4 12.9
Nilphamari Total 100 420555 3.5 10 17.6 28.1 19.8 12.3 4.7 2.1 2 1 30.4 128026 9.5 19.3 22.7 27.1 16 3.8 1.1 0.4 0 2 34.4 144862 1.5 9.4 19.5 32.9 20.5 11.5 2.9 1.1 0.7 3 21.7 91372 0 3.1 13.2 26.5 25.7 19.4 8.3 2.3 1.5 4 8.3 35075 0.5 2.5 10.5 21.5 19.5 23.5 10.5 7.5 4 5 2.6 10873 1.6 0 3.2 22.6 11.3 19.4 16.1 8.1 17.7 6+ 2.5 10347 0 0 5.1 13.6 15.3 18.6 11.9 11.9 23.7
Panchagarh Total 100 227694 2.6 6.6 19.2 30.1 22 11.2 5 2 1.4 1 3.2 7222 36.8 14.5 31.6 14.5 1.3 0 1.3 0 0 2 39.6 90089 3.6 11 26.4 35.5 16.9 5.3 1.2 0.2 0 3 33.9 77165 0.1 3.8 15.8 31 29.2 13.2 5.4 0.9 0.6 4 14.6 33261 0 1.7 11.7 25.4 21.1 20.3 12.3 5.4 2 5 5.8 13209 0 2.9 7.9 19.4 28.1 19.4 6.5 9.4 6.5 6+ 3 6747 0 1.4 8.5 8.5 21.1 18.3 15.5 8.5 18.3
Rangpur Total 100 715270 3.5 11.8 23.4 29.9 17.8 8.1 2.8 1.3 1.3 1 28.5 203551 10.3 20.4 31.4 25.7 8.8 2.3 0.7 0.1 0.1 2 35.5 254066 1.3 12 26 33.1 18.4 6.5 2.2 0.5 0.1 3 21.3 152141 0.2 6.3 17.3 31.6 25.9 13.6 3.5 0.6 1 4 9.6 68747 0.4 3 12.2 28.3 24.8 15.7 5.7 6.1 3.9 5 3.1 22119 0 1.4 8.1 27 16.2 13.5 13.5 9.5 10.8 6+ 2 14646 0 4.1 8.2 28.6 18.4 14.3 6.1 6.1 14.3
Thakurgaon Total 100 318063 2.2 8.9 18.9 31.1 21.2 10.7 3.7 1.7 1.6 1 18.5 58787 7.5 18.4 26.1 28.6 13.6 4.8 1.1 0 0
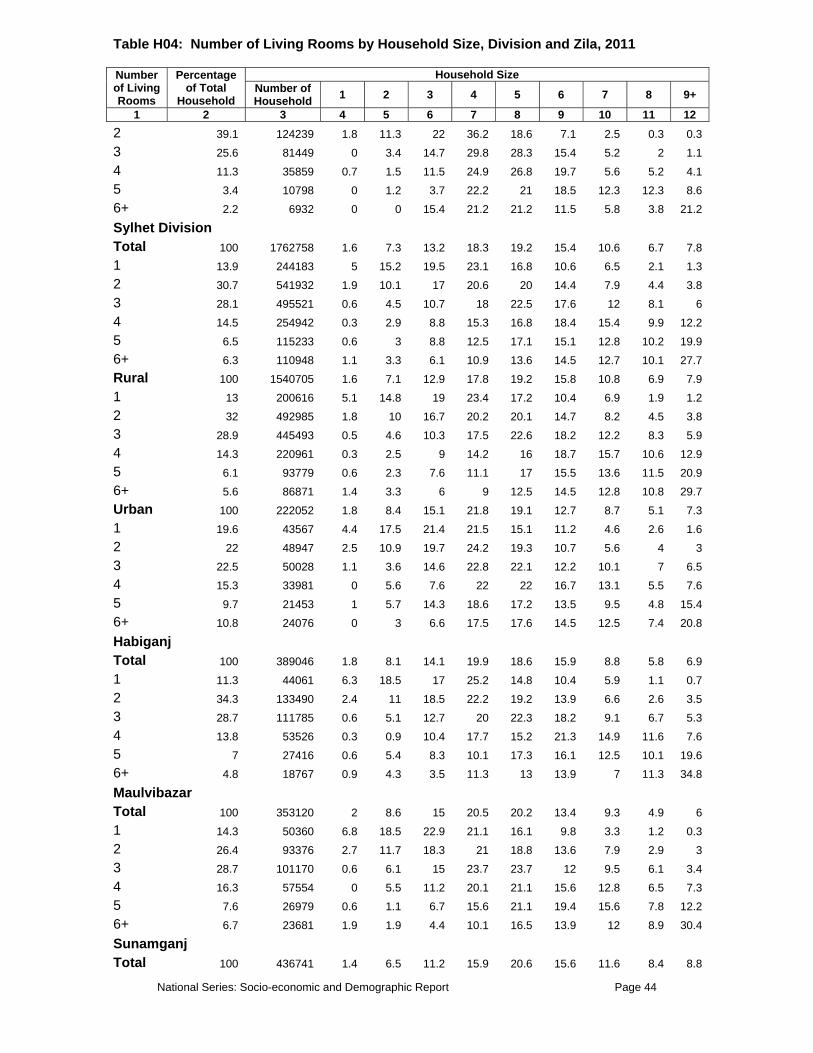
National Series: Socio-economic and Demographic Report Page 44
Table H04: Number of Living Rooms by Household Size, Division and Zila, 2011
Number of Living Rooms
Percentage of Total
Household
Household Size Number of Household 1 2 3 4 5 6 7 8 9+
1 2 3 4 5 6 7 8 9 10 11 122 39.1 124239 1.8 11.3 22 36.2 18.6 7.1 2.5 0.3 0.3 3 25.6 81449 0 3.4 14.7 29.8 28.3 15.4 5.2 2 1.1 4 11.3 35859 0.7 1.5 11.5 24.9 26.8 19.7 5.6 5.2 4.1 5 3.4 10798 0 1.2 3.7 22.2 21 18.5 12.3 12.3 8.6 6+ 2.2 6932 0 0 15.4 21.2 21.2 11.5 5.8 3.8 21.2
Sylhet Division Total 100 1762758 1.6 7.3 13.2 18.3 19.2 15.4 10.6 6.7 7.8 1 13.9 244183 5 15.2 19.5 23.1 16.8 10.6 6.5 2.1 1.3 2 30.7 541932 1.9 10.1 17 20.6 20 14.4 7.9 4.4 3.8 3 28.1 495521 0.6 4.5 10.7 18 22.5 17.6 12 8.1 6 4 14.5 254942 0.3 2.9 8.8 15.3 16.8 18.4 15.4 9.9 12.2 5 6.5 115233 0.6 3 8.8 12.5 17.1 15.1 12.8 10.2 19.9 6+ 6.3 110948 1.1 3.3 6.1 10.9 13.6 14.5 12.7 10.1 27.7 Rural 100 1540705 1.6 7.1 12.9 17.8 19.2 15.8 10.8 6.9 7.9 1 13 200616 5.1 14.8 19 23.4 17.2 10.4 6.9 1.9 1.2 2 32 492985 1.8 10 16.7 20.2 20.1 14.7 8.2 4.5 3.8 3 28.9 445493 0.5 4.6 10.3 17.5 22.6 18.2 12.2 8.3 5.9 4 14.3 220961 0.3 2.5 9 14.2 16 18.7 15.7 10.6 12.9 5 6.1 93779 0.6 2.3 7.6 11.1 17 15.5 13.6 11.5 20.9 6+ 5.6 86871 1.4 3.3 6 9 12.5 14.5 12.8 10.8 29.7 Urban 100 222052 1.8 8.4 15.1 21.8 19.1 12.7 8.7 5.1 7.3 1 19.6 43567 4.4 17.5 21.4 21.5 15.1 11.2 4.6 2.6 1.6 2 22 48947 2.5 10.9 19.7 24.2 19.3 10.7 5.6 4 3 3 22.5 50028 1.1 3.6 14.6 22.8 22.1 12.2 10.1 7 6.5 4 15.3 33981 0 5.6 7.6 22 22 16.7 13.1 5.5 7.6 5 9.7 21453 1 5.7 14.3 18.6 17.2 13.5 9.5 4.8 15.4 6+ 10.8 24076 0 3 6.6 17.5 17.6 14.5 12.5 7.4 20.8
Habiganj Total 100 389046 1.8 8.1 14.1 19.9 18.6 15.9 8.8 5.8 6.9 1 11.3 44061 6.3 18.5 17 25.2 14.8 10.4 5.9 1.1 0.7 2 34.3 133490 2.4 11 18.5 22.2 19.2 13.9 6.6 2.6 3.5 3 28.7 111785 0.6 5.1 12.7 20 22.3 18.2 9.1 6.7 5.3 4 13.8 53526 0.3 0.9 10.4 17.7 15.2 21.3 14.9 11.6 7.6 5 7 27416 0.6 5.4 8.3 10.1 17.3 16.1 12.5 10.1 19.6 6+ 4.8 18767 0.9 4.3 3.5 11.3 13 13.9 7 11.3 34.8
Maulvibazar Total 100 353120 2 8.6 15 20.5 20.2 13.4 9.3 4.9 6 1 14.3 50360 6.8 18.5 22.9 21.1 16.1 9.8 3.3 1.2 0.3 2 26.4 93376 2.7 11.7 18.3 21 18.8 13.6 7.9 2.9 3 3 28.7 101170 0.6 6.1 15 23.7 23.7 12 9.5 6.1 3.4 4 16.3 57554 0 5.5 11.2 20.1 21.1 15.6 12.8 6.5 7.3 5 7.6 26979 0.6 1.1 6.7 15.6 21.1 19.4 15.6 7.8 12.2 6+ 6.7 23681 1.9 1.9 4.4 10.1 16.5 13.9 12 8.9 30.4
Sunamganj Total 100 436741 1.4 6.5 11.2 15.9 20.6 15.6 11.6 8.4 8.8

National Series: Socio-economic and Demographic Report Page 45
Table H04: Number of Living Rooms by Household Size, Division and Zila, 2011
Number of Living Rooms
Percentage of Total
Household
Household Size Number of Household 1 2 3 4 5 6 7 8 9+
1 2 3 4 5 6 7 8 9 10 11 121 16.5 72211 4.8 12.7 15.2 24.3 19.7 9.1 8.9 3.5 1.8 2 36.5 159413 1.3 9.2 15 18.5 22.4 14.6 8.4 6.3 4.5 3 29.2 127604 0.1 2.3 7.7 12.5 23.1 20.6 14.5 11.3 7.9 4 11.7 51188 0.4 1.8 4.3 9.3 15 17.5 18.2 12.5 21.1 5 3.7 16088 0 2.3 8 6.8 14.8 10.2 9.1 15.9 33 6+ 2.3 10238 3.6 5.4 5.4 5.4 5.4 12.5 16.1 7.1 39.3
Sylhet Total 100 583850 1.3 6.5 12.9 17.7 18 16.1 11.7 7 8.7 1 13.3 77550 3.2 13.7 22.6 22 15.8 12.5 6.8 1.8 1.7 2 26.7 155653 1.6 9.2 16.9 21.1 19.1 14.9 8.6 5 3.6 3 26.5 154962 0.9 4.7 9 17.5 21.4 18.4 13.7 7.9 6.6 4 15.9 92673 0.4 3.1 9 14.2 16.1 19.1 15.7 9.6 12.9 5 7.7 44750 0.9 2.8 10.8 14.2 15.3 13.6 12.8 9.7 19.9 6+ 10 58262 0.4 3.1 7.8 12 14.1 15.4 14.3 10.7 22.4

National Series: Socio-economic and Demographic Report Page 46
Table H05: Number of Sleeping Rooms by Household Size, Division and Zila, 2011
Number
of Sleeping Rooms
Percentage of Total
Household
Household Size
Number of Household 1 2 3 4 5 6 7 8 9+
1 2 3 4 5 6 7 8 9 10 11 12
Bangladesh Total 100 31705684 2.3 10 19.5 26.6 19.5 11.1 5.5 2.7 2.8 1 46.1 14609115 4.4 16.2 26.1 27.8 15 6.6 2.4 0.9 0.6 2 36.1 11457347 0.5 5.4 16.2 29 24.5 13.8 6.2 2.6 1.9 3 12.6 4007538 0.4 3.2 9.9 20.8 23 17.8 11.5 7 6.4 4 3.7 1185733 0.2 3 7.6 14.8 17.7 17.5 13.3 9.7 16.2 5 0.9 286244 0.2 2.2 7.4 10.4 13.7 15.8 13.7 10.2 26.4 6+ 0.5 159706 0.5 2.5 3.6 7.3 12.6 12 11.5 10.6 39.5 Rural 100 25535877 2.4 10 19.1 26.2 19.6 11.3 5.7 2.8 2.9 1 46.5 11881398 4.7 16 25.4 27.7 15.2 6.7 2.5 1 0.7 2 36.3 9264872 0.5 5.4 15.8 28.3 24.7 14.2 6.4 2.7 2 3 12.1 3087289 0.4 3.3 9.5 19.5 22.7 18.3 12.3 7.3 6.8 4 3.7 944896 0.3 3.1 7.5 14.6 17.9 17.2 13.5 10 15.9 5 0.9 230018 0.3 2.2 7.7 9.9 14.4 16.5 13.7 9.9 25.4 6+ 0.5 127404 0.6 2.2 4.2 8 13.2 12.5 10.6 11.2 37.5 Urban 100 6169807 1.6 10 21.1 28.2 19 10.2 4.7 2.4 2.8 1 44.2 2727718 3.1 16.9 28.8 27.9 14.1 6 1.9 0.7 0.6 2 35.5 2192475 0.3 5.5 17.8 31.9 23.6 12 5.2 2 1.6 3 14.9 920249 0.5 2.8 11 25.2 24.1 16.3 8.8 6.1 5.2 4 3.9 240837 0.2 2.4 7.8 15.9 16.8 18.6 12.7 8.6 17 5 0.9 56226 0.1 2.1 6.1 12.5 10.8 12.8 13.9 11.4 30.3 6+ 0.5 32302 0 3.8 1.2 4.2 10.1 9.8 14.9 8.6 47.3
Barisal Division Total 100 1849355 1.8 8.1 15.7 25.9 22.3 14.3 6.3 2.8 2.7 1 25.1 464478 5 15.3 23.8 28.9 15.7 7.7 2.2 0.7 0.7 2 45.5 840694 0.8 7.3 15 29.1 24.9 14.2 5.4 1.8 1.5 3 21.6 399440 0.5 3.2 10.6 20 25.7 20.2 10.9 5.1 3.9 4 6.2 115265 0.8 2.8 7.4 14.9 20.3 20.4 12.7 9.4 11.4 5 1.2 23028 0 5.3 12.4 10.2 15.7 21.4 11.1 10.1 13.8 6+ 0.3 6451 0 7.9 7.5 10.6 8.9 11.5 4.9 10.2 38.5 Rural 100 1610041 1.8 8.1 15.3 25.6 22.5 14.8 6.4 2.9 2.7 1 24.5 394845 5.3 15.1 22.8 29.1 15.7 8.1 2.3 0.7 0.7 2 45.9 738480 0.7 7.4 14.7 28.6 25.3 14.5 5.5 1.8 1.5 3 21.8 351732 0.5 3.2 10.4 19.5 25.7 20.8 11 4.9 4 4 6.2 100616 0.9 2.7 7.7 14.7 19.6 20.9 12.2 9.7 11.5 5 1.2 19318 0 5.5 13.3 9.3 15 21.1 10.5 10.8 14.4 6+ 0.3 5050 0 8.8 9.5 13.5 11.3 11.1 2.1 8.8 34.8 Urban 100 239315 1.7 8.6 18.6 27.9 21 11.3 5.8 2.6 2.5 1 29.1 69633 3.8 16.4 29.4 27.8 15.6 5 1.5 0.3 0.3 2 42.7 102213 1.1 6.8 17.1 32.7 22.3 11.9 4.8 1.6 1.8 3 19.9 47709 0.8 2.8 11.7 23.5 25.7 16.4 10 6.1 2.9 4 6.1 14649 0 3.2 4.9 16.3 25 17 15.9 7 10.6 5 1.6 3710 0 4.5 7.5 14.7 19.2 22.7 14.6 6.5 10.3

National Series: Socio-economic and Demographic Report Page 47
Table H05: Number of Sleeping Rooms by Household Size, Division and Zila, 2011
Number of
Sleeping Rooms
Percentage of Total
Household
Household Size
Number of Household 1 2 3 4 5 6 7 8 9+
1 2 3 4 5 6 7 8 9 10 11 12
6+ 0.6 1400 0 4.7 0 0 0 13.1 15.2 15.2 51.8
Barguna Total 100 214594 2.6 11.9 19.5 28.5 20.2 10.5 3.9 1.3 1.7 1 48.6 104209 4.3 15.7 24.1 29.4 17.3 7 1.3 0.1 0.9 2 36.1 77530 1 9.4 18 31.9 21.1 11.5 5.2 0.8 1 3 11.2 24083 0.7 6.3 10.4 21.2 25.3 17.8 8.2 5.2 4.8 4 2.9 6177 1.4 2.9 2.9 11.6 34.8 24.6 8.7 10.1 2.9 5 1 2238 0 4 8 4 28 20 20 4 12 6+ 0.2 358 0 25 0 0 0 25 0 0 50 Barisal Total 100 508586 1.7 7.7 15.5 25.9 21.8 15.4 6.7 3 2.3 1 14.7 74830 6.2 17.4 27.3 28.6 12 6.2 0.9 0.8 0.5 2 47.1 239734 1.1 7.9 15.5 29.8 24.1 14.1 5.2 1.5 0.9 3 27.6 140319 0.7 3.6 11.6 21.6 24.6 20.5 10.3 4.4 2.6 4 8.6 43842 0.8 2.8 9 16 20.2 20.4 13.6 7.9 9.2 5 1.5 7727 0 7.9 17 16.9 9.8 23.6 5.5 12.6 6.7 6+ 0.4 2135 0 8.6 0 8.6 0 17.2 10 18.6 37.1 Bhola Total 100 370560 0.7 5.2 14.1 24.8 22.3 16.7 8.3 3.6 4.2 1 22.9 84739 1.6 10.8 24.3 32.7 15.5 9.9 3.1 1.3 0.7 2 44.1 163437 0.4 4.8 13.7 27.8 25.1 17.3 6.3 2.2 2.5 3 23.9 88457 0.2 1.9 9.1 15.9 24.7 20.7 14.7 7 5.8 4 7.4 27575 1.1 2.2 2.8 15.2 18 21.9 15.2 7.9 15.7 5 1.3 4647 0 0 3.3 6.7 26.7 23.3 16.7 6.7 16.7 6+ 0.5 1704 0 0 18.2 9.1 27.3 0 0 9.1 36.4 Jhalokati Total 100 157231 3 10.9 16.5 26.1 22.7 11.9 4.8 2.4 1.8 1 33.5 52651 7.1 16.8 21.9 26.2 17 7.2 2.2 0.9 0.6 2 45.5 71492 1.2 8.7 13.5 28.9 25.3 12.9 5.1 2.4 2 3 16.9 26522 0.7 5.4 14.4 21 26 18.3 7.7 4.2 2.2 4 3.5 5580 0 4.7 14.1 12.9 29.4 12.9 9.4 8.2 8.2 5 0.4 656 0 20 10 10 10 20 20 10 0 6+ 0.2 328 0 40 20 40 0 0 0 0 0 Patuakhali Total 100 343963 1.5 7.6 14.7 23.7 24.2 15.3 6.6 3 3.4 1 27 92893 5 15.3 21.4 28.3 17.3 8.5 2.6 0.8 0.8 2 47.3 162778 0.2 5.9 14.1 26 28.3 15.7 6.4 1.8 1.7 3 18.4 63415 0.2 1.8 9.1 15.9 28.6 21.8 12 5.7 5 4 5.6 19125 0 3.8 6.8 15 14.3 20.3 9.8 13.5 16.5 5 1.4 4889 0 5.9 14.7 2.9 5.9 20.6 11.8 11.8 26.5 6+ 0.3 863 0 0 0 0 0 33.3 0 0 66.7 Pirojpur Total 100 254421 2.5 9.2 16 28 22.5 12.2 5.1 2.6 1.9 1 21.7 55157 8.3 17.3 23.9 26 14.3 6.6 3.1 0.4 0.2
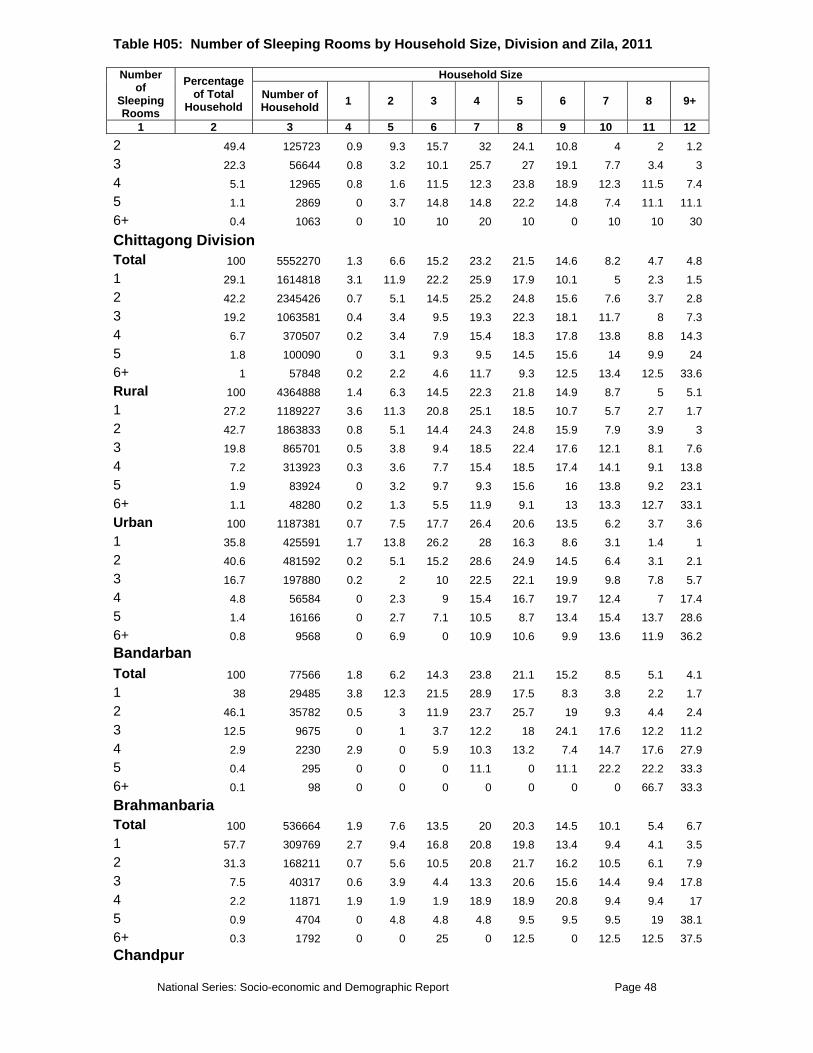
National Series: Socio-economic and Demographic Report Page 48
Table H05: Number of Sleeping Rooms by Household Size, Division and Zila, 2011
Number of
Sleeping Rooms
Percentage of Total
Household
Household Size
Number of Household 1 2 3 4 5 6 7 8 9+
1 2 3 4 5 6 7 8 9 10 11 12 2 49.4 125723 0.9 9.3 15.7 32 24.1 10.8 4 2 1.2 3 22.3 56644 0.8 3.2 10.1 25.7 27 19.1 7.7 3.4 3 4 5.1 12965 0.8 1.6 11.5 12.3 23.8 18.9 12.3 11.5 7.4 5 1.1 2869 0 3.7 14.8 14.8 22.2 14.8 7.4 11.1 11.1 6+ 0.4 1063 0 10 10 20 10 0 10 10 30
Chittagong Division Total 100 5552270 1.3 6.6 15.2 23.2 21.5 14.6 8.2 4.7 4.8 1 29.1 1614818 3.1 11.9 22.2 25.9 17.9 10.1 5 2.3 1.5 2 42.2 2345426 0.7 5.1 14.5 25.2 24.8 15.6 7.6 3.7 2.8 3 19.2 1063581 0.4 3.4 9.5 19.3 22.3 18.1 11.7 8 7.3 4 6.7 370507 0.2 3.4 7.9 15.4 18.3 17.8 13.8 8.8 14.3 5 1.8 100090 0 3.1 9.3 9.5 14.5 15.6 14 9.9 24 6+ 1 57848 0.2 2.2 4.6 11.7 9.3 12.5 13.4 12.5 33.6 Rural 100 4364888 1.4 6.3 14.5 22.3 21.8 14.9 8.7 5 5.1 1 27.2 1189227 3.6 11.3 20.8 25.1 18.5 10.7 5.7 2.7 1.7 2 42.7 1863833 0.8 5.1 14.4 24.3 24.8 15.9 7.9 3.9 3 3 19.8 865701 0.5 3.8 9.4 18.5 22.4 17.6 12.1 8.1 7.6 4 7.2 313923 0.3 3.6 7.7 15.4 18.5 17.4 14.1 9.1 13.8 5 1.9 83924 0 3.2 9.7 9.3 15.6 16 13.8 9.2 23.1 6+ 1.1 48280 0.2 1.3 5.5 11.9 9.1 13 13.3 12.7 33.1 Urban 100 1187381 0.7 7.5 17.7 26.4 20.6 13.5 6.2 3.7 3.6 1 35.8 425591 1.7 13.8 26.2 28 16.3 8.6 3.1 1.4 1 2 40.6 481592 0.2 5.1 15.2 28.6 24.9 14.5 6.4 3.1 2.1 3 16.7 197880 0.2 2 10 22.5 22.1 19.9 9.8 7.8 5.7 4 4.8 56584 0 2.3 9 15.4 16.7 19.7 12.4 7 17.4 5 1.4 16166 0 2.7 7.1 10.5 8.7 13.4 15.4 13.7 28.6 6+ 0.8 9568 0 6.9 0 10.9 10.6 9.9 13.6 11.9 36.2 Bandarban Total 100 77566 1.8 6.2 14.3 23.8 21.1 15.2 8.5 5.1 4.1 1 38 29485 3.8 12.3 21.5 28.9 17.5 8.3 3.8 2.2 1.7 2 46.1 35782 0.5 3 11.9 23.7 25.7 19 9.3 4.4 2.4 3 12.5 9675 0 1 3.7 12.2 18 24.1 17.6 12.2 11.2 4 2.9 2230 2.9 0 5.9 10.3 13.2 7.4 14.7 17.6 27.9 5 0.4 295 0 0 0 11.1 0 11.1 22.2 22.2 33.3 6+ 0.1 98 0 0 0 0 0 0 0 66.7 33.3
Brahmanbaria Total 100 536664 1.9 7.6 13.5 20 20.3 14.5 10.1 5.4 6.7 1 57.7 309769 2.7 9.4 16.8 20.8 19.8 13.4 9.4 4.1 3.5 2 31.3 168211 0.7 5.6 10.5 20.8 21.7 16.2 10.5 6.1 7.9 3 7.5 40317 0.6 3.9 4.4 13.3 20.6 15.6 14.4 9.4 17.8 4 2.2 11871 1.9 1.9 1.9 18.9 18.9 20.8 9.4 9.4 17 5 0.9 4704 0 4.8 4.8 4.8 9.5 9.5 9.5 19 38.1 6+ 0.3 1792 0 0 25 0 12.5 0 12.5 12.5 37.5 Chandpur

National Series: Socio-economic and Demographic Report Page 49
Table H05: Number of Sleeping Rooms by Household Size, Division and Zila, 2011
Number of
Sleeping Rooms
Percentage of Total
Household
Household Size
Number of Household 1 2 3 4 5 6 7 8 9+
1 2 3 4 5 6 7 8 9 10 11 12 Total 100 501332 1.7 7.5 14.7 22.1 23.6 15.2 7.5 4.3 3.4 1 17.3 86494 5.6 17.5 24 24.5 14.8 8.7 3.4 0.7 0.7 2 50.5 253395 1.2 6.6 15.7 24 26.8 14.8 6 3.3 1.4 3 24.8 124493 0.3 3.5 8.3 19.6 24.6 20.4 10.3 6.9 6.1 4 6.1 30441 0 2.1 8.3 11.7 20 15.9 20.7 11.7 9.7 5 0.8 3779 0 5.6 16.7 5.6 22.2 0 5.6 5.6 38.9 6+ 0.5 2729 0 7.7 0 15.4 0 23.1 7.7 7.7 38.5 Chittagong Total 100 1502347 1.1 6.9 16 26.5 21.1 13.7 7.3 3.7 3.8 1 30.7 461903 2.4 13.4 23.9 30.2 15.7 8.9 3.5 1.2 0.8 2 43.4 651607 0.7 4.5 13.7 27.9 25.9 15.5 7.1 3 1.8 3 16.8 252920 0.3 2.7 11.2 22 21.3 16.9 12.6 7.1 5.9 4 6.2 93059 0 4.1 9.2 18.7 17.2 16.9 11.1 8 14.9 5 1.5 22485 0 1.8 10.8 5.4 14.4 14.6 9.2 11 32.9 6+ 1.4 20373 0 4.2 5.9 15.9 11.9 9.9 13 13 26.2 Comilla Total 100 1045924 1.1 6.3 14.6 21.9 21.8 15 7.9 5.3 6 1 29.5 309013 3.3 10.9 22.2 24.9 19.1 10.5 5.2 2.4 1.6 2 45.7 477725 0.3 4.8 14.6 24.1 24.2 16.7 7.4 4.1 3.8 3 17.4 182261 0.2 3.1 5.8 16.3 23.3 18.2 11.5 11.3 10.3 4 5.2 54198 0 4 7.3 9.7 16.9 16.9 11.3 9.7 24.2 5 1.5 15298 0 5.7 0 11.4 11.4 11.4 20 14.3 25.7 6+ 0.7 7430 0 0 0 5.9 5.9 5.9 17.6 11.8 52.9 Cox's Bazar Total 100 410474 1 5.1 14.6 18.8 20.6 17.4 11 6.3 5.2 1 33 135389 2.4 10.3 22.8 24 20.2 11.7 4.7 2.9 0.9 2 44.3 181725 0.4 3 13.2 18.7 22.5 20.6 11.6 5.3 4.8 3 15 61494 0 1.7 6.7 14 20.4 17.6 17.6 13.2 8.7 4 5.6 22909 0.8 0 1.5 7.5 13.5 26.3 21.1 12.8 16.5 5 1.7 7062 0 4.9 9.8 0 7.3 19.5 24.4 14.6 19.5 6+ 0.5 1895 0 0 0 9.1 0 0 18.2 18.2 54.5 Feni Total 100 274198 1.3 7.2 18.7 24.9 21.7 12.9 6.1 3.1 4 1 13.9 37991 4.5 12.1 30.8 27.8 15.4 6.6 2.1 0.3 0.3 2 32.1 87918 1.4 9.8 21.8 26.4 24.9 10.8 3.3 1 0.5 3 26.2 71849 0.6 4 17.3 27.3 20.3 15.5 7.3 4.5 3.2 4 16.6 45566 0.3 6 10.8 21.7 27.7 15.1 7.8 4.8 5.8 5 7.2 19627 0 3.5 14 17.5 18.1 15.2 11.7 3.5 16.4 6+ 4.1 11248 1 2 3.1 15.3 9.2 19.4 17.3 12.2 20.4 Khagrachhari Total 100 132172 1.5 8.2 15.4 24.9 21.9 14.5 7.8 3.3 2.6 1 27.9 36935 4.3 18.1 26.8 27.5 15.8 4.9 1.6 0.6 0.3 2 47.5 62773 0.5 5.7 14.8 29.1 24.8 15.7 6.2 1.8 1.3 3 18.3 24182 0 1.4 4.3 16.4 25.1 24 16.7 7.5 4.6

National Series: Socio-economic and Demographic Report Page 50
Table H05: Number of Sleeping Rooms by Household Size, Division and Zila, 2011
Number of
Sleeping Rooms
Percentage of Total
Household
Household Size
Number of Household 1 2 3 4 5 6 7 8 9+
1 2 3 4 5 6 7 8 9 10 11 12 4 4.5 5963 0 3.7 1.9 5.6 18.5 23.1 23.1 11.1 13 5 1.2 1601 0 0 3.4 0 13.8 17.2 24.1 13.8 27.6 6+ 0.5 718 0 0 0 23.1 23.1 0 0 30.8 23.1 Lakshmipur Total 100 363496 1.6 7.3 16.8 23.5 21.3 15.4 7 3.8 3.2 1 17.5 63441 4.5 14.8 26.1 26.1 14.8 8.6 2.4 2.2 0.5 2 38.1 138569 1.1 6.2 16.5 25.5 25.4 14.2 5.5 3.8 1.6 3 31 112767 0.9 5.9 14 22.1 21.5 19.4 8.1 4.3 3.8 4 10.5 38095 0.8 4.4 12.7 17.9 17.9 17.5 14.3 5.2 9.2 5 2.2 8044 0 1.9 9.4 22.6 15.1 18.9 18.9 5.7 7.5 6+ 0.7 2580 0 0 5.9 5.9 23.5 23.5 11.8 0 29.4 Noakhali Total 100 581946 0.9 4.3 12.9 21.5 22.3 14.9 10.2 6.4 6.6 1 18.9 109792 2.9 7.4 19.7 26.9 22.2 9.9 4.7 4.3 2 2 39.3 228938 0.5 4 14.4 25.7 25.1 14 9.6 4.2 2.6 3 27.2 158287 0.6 4 9.2 16.8 22.4 17.6 12 8.7 8.7 4 10.3 60065 0 1.6 5.7 14.8 15.6 18.9 17.2 11.1 15.2 5 2.8 16247 0 1.5 10.6 4.5 16.7 22.7 13.6 9.1 21.2 6+ 1.5 8616 0 0 5.7 5.7 5.7 14.3 8.6 14.3 45.7 Rangamati Total 100 126151 2 8.3 19.2 27.3 20.9 11.4 6.1 2.9 2 1 27.4 34606 5.3 18.1 28.9 24.2 14.6 6.2 2 0.6 0 2 46.6 58783 0.9 5.9 20 34.1 22.3 9.9 4.6 1.7 0.7 3 20.1 25335 0.6 2.3 7.9 20.2 28.7 18.9 11.2 6.7 3.5 4 4.8 6110 0 2.6 6 12.9 13.8 20.7 23.3 8.6 12.1 5 0.8 948 0 0 5.6 11.1 5.6 22.2 5.6 22.2 27.8 6+ 0.3 369 0 0 0 0 0 28.6 0 14.3 57.1
Dhaka Division Total 100 10578551 2.2 11.4 19.9 26.3 19.3 10.9 5.1 2.4 2.4 1 55.9 5909895 3.6 16.9 25 26.9 15.8 7.5 2.6 1 0.7 2 31.5 3336113 0.4 5 15.4 28.6 24.8 14.2 6.9 2.7 1.9 3 9.5 1004783 0.5 2.9 9.1 19.9 23.1 17.8 11.9 7.5 7.2 4 2.4 249716 0 3.2 7.1 14.3 14.9 17.2 11.9 11.3 20.1 5 0.5 50635 0 1.7 5.9 10.3 9.5 18 15.7 9.3 29.7 6+ 0.3 27408 0.4 1.5 1.8 0.8 13.5 7.4 7.9 8.9 57.9 Rural 100 7801801 2.5 11.6 19.3 25.6 19.4 11.3 5.4 2.5 2.4 1 57.6 4496639 4 16.7 23.9 26.6 16.3 7.9 2.8 1.1 0.7 2 31.4 2450780 0.5 5.1 14.7 27.2 25 15.1 7.4 3 2 3 8.1 628645 0.4 3.1 8.4 17 21.7 19.3 14 8.1 7.9 4 2.2 167776 0 3.9 7.8 13.7 14 17 11.3 11.7 20.7 5 0.5 39119 0 1.9 5.2 10 10.8 17.4 14.5 11 29.2 6+ 0.2 18843 0.6 2.1 2.6 1.1 15.4 8.8 5.1 11.4 52.9 Urban 100 2776749 1.3 10.9 21.6 28.4 19.1 9.6 4.4 2.2 2.5 1 50.9 1413256 2.3 17.7 28.5 27.8 14.3 6.3 1.9 0.6 0.6

National Series: Socio-economic and Demographic Report Page 51
Table H05: Number of Sleeping Rooms by Household Size, Division and Zila, 2011
Number of
Sleeping Rooms
Percentage of Total
Household
Household Size
Number of Household 1 2 3 4 5 6 7 8 9+
1 2 3 4 5 6 7 8 9 10 11 12 2 31.9 885334 0.1 4.8 17.1 32.4 24.5 11.8 5.6 2 1.7 3 13.5 376139 0.7 2.4 10.3 24.9 25.4 15.3 8.5 6.6 5.9 4 3 81939 0.1 1.8 5.7 15.4 16.8 17.7 13.1 10.4 18.9 5 0.4 11516 0 1.1 8.4 11.2 4.8 19.9 19.9 3.2 31.4 6+ 0.3 8565 0 0 0 0 9.3 4.2 14.2 3.5 68.8
Dhaka Total 100 2633512 1.1 12.7 21.8 27.9 17.8 9.4 4.4 2.3 2.6 1 53.9 1419384 1.6 20 28.2 28.2 13.2 6 1.8 0.6 0.4 2 29.4 773069 0.3 4.9 16.8 32.4 23.7 12.4 5.6 2.1 1.8 3 13.1 345261 0.8 3.4 11 21.9 24.8 14.8 10.1 7.6 5.6 4 2.7 71472 0 2.4 5.1 12.8 15.9 19.7 11.8 11.6 20.7 5 0.5 12837 0 3.8 8.6 4.8 3.8 18.1 9.5 3.8 47.7 6+ 0.4 11488 0 0 0 0 8.5 4.3 14.9 4.3 68.1
Faridpur Total 100 417682 2.3 8.1 17 26.6 22.2 12.7 6.5 2.5 2 1 38.2 159748 4.9 14.2 25.5 28.3 18.3 6 1.7 0.3 0.7 2 42.1 175793 0.7 5.2 13.8 30.1 25.7 14.7 6.9 2.1 0.9 3 14.4 60167 0.9 3.2 6.7 18.6 22.9 22.3 14.5 7.2 3.8 4 4.3 18137 0 1.9 7.7 10.6 21.2 20.2 17.3 9.6 11.5 5 0.7 2790 0 0 6.3 6.3 18.8 12.5 12.5 12.5 31.3 6+ 0.3 1046 0 0 16.7 0 16.7 0 0 0 66.7
Gazipur Total 100 808411 1.2 17.8 24.2 26.1 16.7 7.8 2.8 1.4 1.9 1 58.2 470674 2.1 27 29.6 23.9 11.9 4.4 0.6 0.3 0.1 2 29.6 239554 0 5.2 19.7 32 23.9 11.8 4.1 1.8 1.4 3 8.2 66130 0 4.6 10.2 23 25.5 15.3 10.2 4.6 6.6 4 3.1 24968 0 4.1 9.5 21.6 16.2 12.2 9.5 9.5 17.6 5 0.6 5061 0 0 6.7 26.7 6.7 13.3 20 0 26.7 6+ 0.3 2024 0 0 0 0 33.3 0 0 16.7 50
Gopalganj Total 100 248424 1.6 6 13.2 24.9 23.3 15.7 7.3 4.1 3.8 1 61.3 152247 2 7.5 14.9 25.1 23 15.9 6.1 2.9 2.7 2 28.2 69957 1.2 4.4 13.3 27.3 24.6 13.6 7.9 4 3.7 3 7.8 19381 0.5 1.6 2.7 20.9 23.5 21.4 11.2 10.7 7.5 4 2.2 5493 0 1.9 3.8 13.2 17 18.9 15.1 11.3 18.9 5 0.3 622 0 0 0 0 16.7 0 50 16.7 16.7 6+ 0.3 725 0 0 14.3 0 14.3 28.6 0 14.3 28.6
Jamalpur Total 100 561712 4.3 11.2 18.5 29.4 21.6 8.5 4 1.4 1.2 1 62.5 350894 6.3 14.4 21.8 32.2 17.9 5 1.7 0.7 0.1 2 29.1 163266 1 7 14.1 26.4 29.4 13.3 5.9 1.7 1.1 3 6.8 37947 1.2 1.2 9.3 19.8 27.2 15.4 14.2 4.9 6.8 4 1.4 7964 0 8.8 8.8 20.6 0 26.5 11.8 5.9 17.6 5 0.3 1640 0 0 0 0 14.3 14.3 28.6 14.3 28.6

National Series: Socio-economic and Demographic Report Page 52
Table H05: Number of Sleeping Rooms by Household Size, Division and Zila, 2011
Number of
Sleeping Rooms
Percentage of Total
Household
Household Size
Number of Household 1 2 3 4 5 6 7 8 9+
1 2 3 4 5 6 7 8 9 10 11 12 6+ 0 0 0 0 0 0 0 0 0 0 0
Kishoreganj Total 100 622614 4 9.1 15.7 22.3 20.1 14.6 7.3 3.8 3.1 1 66.8 416203 5.8 12.4 19.2 23.2 18.7 12.9 4.6 2.1 0.9 2 26.5 164817 0.5 2.8 9.5 22.4 23.5 18.9 13.4 4.9 4.1 3 4.8 29896 0 0 4.3 13 21.7 15.7 12.2 18.3 14.8 4 1.5 9099 0 0 8.6 14.3 11.4 8.6 8.6 14.3 34.3 5 0.2 1300 0 0 20 0 40 0 0 0 40 6+ 0.2 1300 0 0 0 0 20 20 0 0 60
Madaripur Total 100 251057 1.5 8.5 17 25.2 21.2 15.4 6.3 2.6 2.3 1 28.6 71805 3.8 14.5 23.9 27.4 16.2 8.8 3.6 0.6 1.2 2 48.6 121912 0.6 7 17.4 26.1 24.2 16.6 4.6 1.9 1.7 3 17.8 44760 0.5 3.7 7.7 22.5 22.2 21.8 12.2 5.6 3.7 4 3.5 8910 0 7.1 8.2 11.8 18.8 17.6 18.8 9.4 8.2 5 1.2 2935 0 3.6 3.6 14.3 17.9 25 14.3 10.7 10.7 6+ 0.3 734 14.3 14.3 14.3 14.3 0 14.3 0 14.3 14.3
Manikganj Total 100 321583 2.3 11.2 19.4 29 19.2 9.7 4.6 2.4 2.1 1 47.8 153642 4.5 17.6 24.8 30.7 14.8 5.3 1.2 0.6 0.5 2 39.1 125585 0.3 6.2 17.4 30.6 24.5 12.8 5.3 1.7 1.2 3 10.2 32644 0 3.3 7 18.6 22.7 18.6 12.8 8.7 8.3 4 2.1 6879 0 2 3.9 15.7 9.8 13.7 19.6 19.6 15.7 5 0.8 2428 0 5.6 0 16.7 5.6 5.6 16.7 22.2 27.8 6+ 0.1 405 0 0 0 0 0 0 66.7 0 33.3
Munshiganj Total 100 310146 2.2 9.8 19.8 27.2 20.4 12 4.3 2 2.3 1 45.7 141611 4.3 15.9 24.8 29.5 15.4 7.8 1.7 0.5 0.1 2 41.3 128019 0.3 5.2 17.8 28.5 26 14.9 4.6 1.9 0.9 3 10.2 31714 0.8 2.9 8.6 16.3 23.7 21.2 13.5 5.3 7.8 4 2.2 6731 0 3.8 11.5 9.6 11.5 5.8 11.5 13.5 32.7 5 0.5 1424 0 9.1 0 18.2 0 0 9.1 18.2 45.5 6+ 0.2 647 0 0 0 0 0 0 0 0 100
Mymensingh Total 100 1149136 3 10.2 18.4 25.2 18.9 12.2 6 2.8 3.3 1 59.9 688427 4.8 14.2 22.8 26.3 16.3 9.3 3.8 1.3 1.3 2 30.6 351884 0.3 4.6 12.8 26.4 24.1 15.9 9.1 3.7 3 3 6.4 73349 0 2 8.5 15 22.9 19 12.4 7.8 12.4 4 2.5 28764 0 6.7 13.3 15 8.3 13.3 6.7 15 21.7 5 0.4 4315 0 0 0 11.1 0 66.7 11.1 0 11.1 6+ 0.2 2397 0 0 0 0 20 0 0 0 80
Narayanganj Total 100 618606 1.7 13.3 21.5 26.8 19.4 9.4 4.3 1.9 1.7 1 56.1 346740 2.9 19.8 28.7 25.7 14 5.7 1.9 0.8 0.5

National Series: Socio-economic and Demographic Report Page 53
Table H05: Number of Sleeping Rooms by Household Size, Division and Zila, 2011
Number of
Sleeping Rooms
Percentage of Total
Household
Household Size
Number of Household 1 2 3 4 5 6 7 8 9+
1 2 3 4 5 6 7 8 9 10 11 12 2 33.6 208044 0.1 6.1 14.1 30.7 28.7 11 6.2 1.6 1.5 3 7.7 47521 0 1.7 7.6 22.7 18 25 9.9 8.1 7 4 2.2 13538 0 2 6.1 14.3 22.4 26.5 8.2 10.2 10.2 5 0.4 2210 0 0 0 0 12.5 0 50 25 12.5 6+ 0.1 553 0 0 0 0 0 0 0 0 100
Narsingdi Total 100 472950 2.2 9.1 18.4 23.4 21.3 12.5 6.3 3.1 3.6 1 58.4 276068 3.3 13.2 23.5 24.3 20.7 9.3 3.4 1.4 0.9 2 31.4 148303 0.5 3.7 12.5 24.1 23.8 16.5 10.5 4.8 3.5 3 7.4 34953 1.1 2.8 7.9 17.5 20.3 21.5 11.3 6.8 10.7 4 2 9479 0 0 4.2 14.6 8.3 14.6 8.3 4.2 45.8 5 0.5 2370 0 0 8.3 8.3 8.3 8.3 8.3 25 33.3 6+ 0.4 1777 0 11.1 0 0 11.1 0 0 33.3 44.4
Netrokona Total 100 477130 2.7 9.1 16.7 22.6 20.1 14.6 7.8 3.6 2.8 1 74.8 357051 3.4 11 19.9 23.7 19.1 12.5 6.2 2.4 1.7 2 18.6 88616 0.7 4.7 8.1 21.8 22.9 21.6 11.5 5.8 2.9 3 4.9 23498 0.8 0.8 3.4 12.7 24.6 20.3 16.1 10.2 11 4 1.3 6372 0 0 6.3 9.4 15.6 15.6 12.5 15.6 25 5 0.3 1195 0 0 0 16.7 50 0 0 16.7 16.7 6+ 0.1 398 0 0 0 0 0 0 0 0 100
Rajbari Total 100 236462 1.6 8.9 19.1 30 21.1 10 4.4 2.6 2.3 1 40.1 94743 3.4 14.9 29.2 30.2 15.6 4.6 0.9 0.8 0.3 2 43.5 102754 0.5 6.1 14.3 33.6 26.1 12.5 4.3 1.8 0.8 3 11.8 27790 0 2.1 8.9 23.8 24.2 16.7 12.5 5.7 6 4 3.4 8011 0 1.2 2.5 13.6 16 11.1 13.6 16 25.9 5 0.8 1879 0 0 0 10.5 15.8 21.1 15.8 31.6 5.3 6+ 0.5 1286 0 0 0 0 0 30.8 15.4 7.7 46.2
Shariatpur Total 100 245816 1.8 7.2 16.2 20.5 21.4 15.7 9.4 4.9 3 1 35.7 87725 4.2 13.2 23.2 23.2 17.1 10.9 5.9 1.8 0.6 2 43 105805 0.3 3.5 13.8 20.8 27.3 17.6 9 5.2 2.5 3 16.8 41192 0.7 4.5 9.2 16.7 16.7 20 17 8.5 6.7 4 3.7 9142 1.1 4.5 9 10.1 15.7 21.3 13.5 15.7 9 5 0.5 1130 0 0 9.1 18.2 18.2 9.1 9.1 9.1 27.3 6+ 0.3 822 0 12.5 12.5 12.5 12.5 25 0 0 25
Sherpur Total 100 340343 4.5 12.8 21.2 25.8 18.5 10.6 3.9 1.8 0.8 1 70.5 239816 6.3 16.3 24.3 26.5 16.3 7.3 2.1 0.7 0.2 2 24.5 83488 0.5 5.3 15.6 26.9 24.3 16.8 6.5 2.9 1.2 3 4.2 14199 0 2 7 12 20 24 18 13 4 4 0.8 2840 0 0 0 0 25 35 10 5 25 5 0 0 0 0 0 0 0 0 0 0 0

National Series: Socio-economic and Demographic Report Page 54
Table H05: Number of Sleeping Rooms by Household Size, Division and Zila, 2011
Number of
Sleeping Rooms
Percentage of Total
Household
Household Size
Number of Household 1 2 3 4 5 6 7 8 9+
1 2 3 4 5 6 7 8 9 10 11 12 6+ 0 0 0 0 0 0 0 0 0 0 0
Tangail Total 100 862967 2.7 12 22.3 27.2 19 8.8 4.4 1.6 1.8 1 56 483117 4.6 18.2 26.7 28.7 15.9 4.5 0.9 0.3 0.3 2 33.1 285249 0.5 4.8 19.1 27.2 24.2 13.3 7.2 2.4 1.3 3 8.6 74381 0 2.4 11.2 20.9 19.9 17.5 13.1 5.8 9.2 4 1.4 11915 0 3 3 21.2 18.2 15.2 18.2 3 18.2 5 0.8 6499 0 0 11.1 11.1 5.6 16.7 22.2 5.6 27.8 6+ 0.2 1805 0 0 0 0 40 20 0 40 0
Khulna Division Total 100 3707047 2.3 10.1 22.2 30.1 19.2 8.9 3.9 1.6 1.6 1 47.3 1752027 4.2 15.6 28.7 30 14.5 4.9 1.4 0.4 0.3 2 36.3 1344791 0.5 6 19.1 33 23.2 11.2 4.4 1.4 1.2 3 12.2 453387 0.5 3.8 11.8 26.8 24.6 15.4 8.8 4.5 3.9 4 3.2 118186 0.2 2.5 8.5 18.3 22.3 17.4 12.5 8 10.4 5 0.7 26788 1.9 2.5 4.2 11.9 18.6 11.8 13.1 14 22.1 6+ 0.3 11868 0 8.2 1.5 10.9 10.1 10.7 16.7 6.2 35.6 Rural 100 3114437 2.2 10.1 22 30 19.4 9 4 1.6 1.6 1 48.1 1499108 4.1 15.4 28.5 30 14.8 5 1.5 0.4 0.3 2 36.2 1126483 0.5 5.9 18.5 32.9 23.5 11.4 4.6 1.4 1.2 3 11.7 364399 0.5 3.9 11.5 25.8 24.8 15.8 9.1 4.6 4 4 3 93179 0.3 2.8 7.9 18.4 23.2 16.8 12.7 8.3 9.7 5 0.7 21143 2.4 1.6 4.7 12.9 18.8 11.7 14.6 14.4 18.9 6+ 0.3 10125 0 7 1.8 11.4 11.9 11.4 16.2 4.7 35.6 Urban 100 592610 2.6 10.1 23.3 30.6 18 8.5 3.3 1.6 1.8 1 42.7 252919 5.3 16.7 29.6 30.1 12.6 4.1 1 0.4 0.3 2 36.8 218308 0.6 6.4 22.4 33.4 22 10.2 3.2 1.1 0.7 3 15 88989 0.5 3.3 13.1 31 23.6 13.7 7.5 4 3.2 4 4.2 25007 0 1.1 10.9 17.6 19.1 19.8 11.6 6.9 12.9 5 1 5644 0 5.8 2.2 8 17.8 12.2 7.3 12.5 34.2 6+ 0.3 1743 0 15.2 0 8.4 0 6.6 19.3 14.9 35.7
Bagerhat Total 100 348200 2.9 8.5 18.6 27.2 21.6 10.7 5.7 2.7 1.9 1 34.3 119475 6.7 14.1 25.2 27.3 15.9 7.1 2.4 0.9 0.5 2 39.6 137878 1.3 7.2 18.5 30.3 23.9 10 5.4 2 1.4 3 19.6 68355 0.2 3.4 12 22.9 27.1 16.7 9.4 5.6 2.8 4 5.2 18257 0 1.6 4 24 20.8 16.8 15.2 8.8 8.8 5 1 3359 0 4.3 8.7 8.7 30.4 21.7 4.3 8.7 13 6+ 0.3 876 0 16.7 0 16.7 0 0 33.3 0 33.3
Chuadanga Total 100 275295 1.7 11.8 25.8 31.5 16.2 7.3 3.3 1.1 1.3 1 49.2 135340 3.4 18.6 32.6 29.7 11.8 3.2 0.7 0.2 0 2 36.2 99688 0.1 5.8 21.4 34.8 21.1 10.8 3.9 1 1 3 11.1 30575 0 4.5 16.6 32.5 19.6 12.1 10.2 1.9 2.6

National Series: Socio-economic and Demographic Report Page 55
Table H05: Number of Sleeping Rooms by Household Size, Division and Zila, 2011
Number of
Sleeping Rooms
Percentage of Total
Household
Household Size
Number of Household 1 2 3 4 5 6 7 8 9+
1 2 3 4 5 6 7 8 9 10 11 12 4 2.9 8077 0 0 5.7 24.3 20 14.3 7.1 10 18.6 5 0.4 1038 0 11.1 0 0 0 11.1 33.3 33.3 11.1 6+ 0.2 577 0 0 20 0 0 40 20 0 20
Jessore Total 100 652878 2.6 9.9 22.6 30.5 19.4 8.4 3.6 1.5 1.4 1 46.8 305475 5 15.7 30.7 30.3 13.2 4 1 0 0.1 2 32.9 215085 0.5 5.4 17.8 32.9 25.7 10.6 4.4 1.5 1 3 15.8 102914 0.5 4.8 12.7 30.7 22.8 14.3 7.4 4.5 2.4 4 3.5 22870 0 1.2 8.3 16.7 26.2 21.4 10.7 4.8 10.7 5 0.6 4084 6.7 0 6.7 6.7 33.3 6.7 6.7 6.7 26.7 6+ 0.4 2450 0 0 0 11.1 22.2 0 22.2 11.1 33.3
Jhenaidah Total 100 417438 2.1 10.9 22.3 32.5 18.5 7.7 3.3 1.2 1.3 1 44.9 187303 4.2 17.6 30.4 32.1 12.1 2.1 0.9 0.3 0.4 2 39.3 163956 0.4 6.9 18.1 36.6 23.8 10.4 2.6 0.7 0.5 3 12.3 51258 0.3 2.1 10.6 26 26.4 17.1 9.6 3.4 4.5 4 2.9 12112 0 2.9 10.1 15.9 18.8 14.5 17.4 8.7 11.6 5 0.6 2458 0 0 0 21.4 0 28.6 21.4 21.4 7.1 6+ 0.1 351 0 0 0 0 0 0 50 0 50
Khulna Total 100 538801 1.9 8.7 22.4 29.1 19.5 10.2 3.8 2 2.4 1 61.2 329736 2.9 11.7 26.9 30.2 17.8 7.5 1.9 0.8 0.4 2 27.5 148135 0.1 4.1 18 29.1 22.4 14.7 6.5 2.6 2.5 3 8.2 44361 0.5 3.5 9.4 26 22.7 13.3 8.5 7.3 8.9 4 2.3 12373 1.3 4.9 8 12.7 23.4 17.3 7.7 7 17.6 5 0.5 2625 6.2 2.4 11 15.8 7.2 17.2 6.2 7.2 26.8 6+ 0.3 1570 0 0 0 30.9 0 0 4 12.1 52.9
Kushtia Total 100 474997 2.7 12.1 24.6 31.1 18 6.8 2.8 1.1 0.8 1 36.8 174728 5.9 22 33.5 28.4 8.2 1.8 0 0.1 0.1 2 44.6 211815 0.8 7.4 23 36 22.3 7.5 2.2 0.4 0.3 3 12.7 60094 1.3 3.3 12.5 29 29 13.5 8.3 2.6 0.3 4 4.3 20428 0 4.9 8.7 15.5 26.2 21.4 11.7 8.7 2.9 5 1.2 5752 0 3.4 0 13.8 20.7 3.4 17.2 17.2 24.1 6+ 0.5 2182 0 9.1 0 9.1 9.1 27.3 9.1 0 36.4
Magura Total 100 204293 2.9 9.1 20.2 29.3 21 9.5 4.1 1.8 2.1 1 38 77659 6.9 14.4 26.8 30.7 15 4.4 1.2 0.1 0.4 2 45.9 93841 0.4 6.6 18 31.9 26.5 11.2 3.6 1.3 0.6 3 11.6 23632 0.4 3.6 12 21.4 22.5 18.5 8.3 6.9 6.5 4 3.1 6336 1.4 2.7 10.8 14.9 14.9 12.2 20.3 9.5 13.5 5 0.8 1627 0 0 0 5.3 15.8 5.3 31.6 15.8 26.3 6+ 0.6 1199 0 14.3 0 0 0 14.3 21.4 0 50
Meherpur
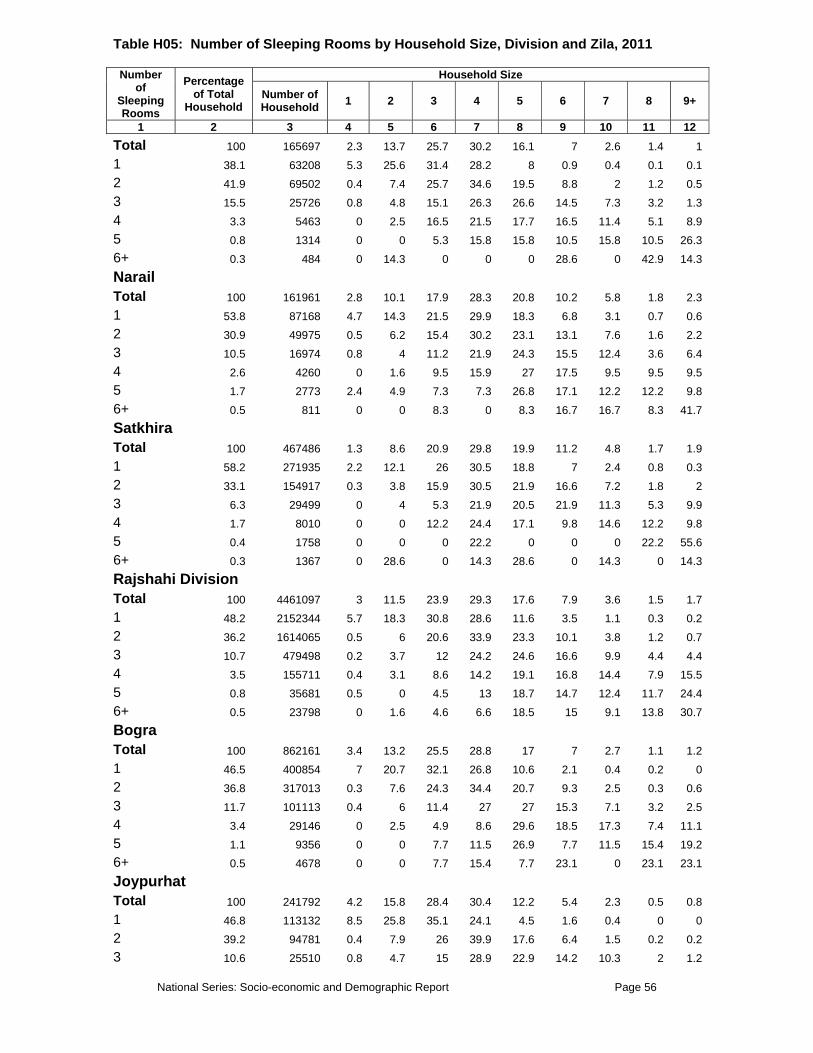
National Series: Socio-economic and Demographic Report Page 56
Table H05: Number of Sleeping Rooms by Household Size, Division and Zila, 2011
Number of
Sleeping Rooms
Percentage of Total
Household
Household Size
Number of Household 1 2 3 4 5 6 7 8 9+
1 2 3 4 5 6 7 8 9 10 11 12 Total 100 165697 2.3 13.7 25.7 30.2 16.1 7 2.6 1.4 1 1 38.1 63208 5.3 25.6 31.4 28.2 8 0.9 0.4 0.1 0.1 2 41.9 69502 0.4 7.4 25.7 34.6 19.5 8.8 2 1.2 0.5 3 15.5 25726 0.8 4.8 15.1 26.3 26.6 14.5 7.3 3.2 1.3 4 3.3 5463 0 2.5 16.5 21.5 17.7 16.5 11.4 5.1 8.9 5 0.8 1314 0 0 5.3 15.8 15.8 10.5 15.8 10.5 26.3 6+ 0.3 484 0 14.3 0 0 0 28.6 0 42.9 14.3
Narail Total 100 161961 2.8 10.1 17.9 28.3 20.8 10.2 5.8 1.8 2.3 1 53.8 87168 4.7 14.3 21.5 29.9 18.3 6.8 3.1 0.7 0.6 2 30.9 49975 0.5 6.2 15.4 30.2 23.1 13.1 7.6 1.6 2.2 3 10.5 16974 0.8 4 11.2 21.9 24.3 15.5 12.4 3.6 6.4 4 2.6 4260 0 1.6 9.5 15.9 27 17.5 9.5 9.5 9.5 5 1.7 2773 2.4 4.9 7.3 7.3 26.8 17.1 12.2 12.2 9.8 6+ 0.5 811 0 0 8.3 0 8.3 16.7 16.7 8.3 41.7
Satkhira Total 100 467486 1.3 8.6 20.9 29.8 19.9 11.2 4.8 1.7 1.9 1 58.2 271935 2.2 12.1 26 30.5 18.8 7 2.4 0.8 0.3 2 33.1 154917 0.3 3.8 15.9 30.5 21.9 16.6 7.2 1.8 2 3 6.3 29499 0 4 5.3 21.9 20.5 21.9 11.3 5.3 9.9 4 1.7 8010 0 0 12.2 24.4 17.1 9.8 14.6 12.2 9.8 5 0.4 1758 0 0 0 22.2 0 0 0 22.2 55.6 6+ 0.3 1367 0 28.6 0 14.3 28.6 0 14.3 0 14.3
Rajshahi Division Total 100 4461097 3 11.5 23.9 29.3 17.6 7.9 3.6 1.5 1.7 1 48.2 2152344 5.7 18.3 30.8 28.6 11.6 3.5 1.1 0.3 0.2 2 36.2 1614065 0.5 6 20.6 33.9 23.3 10.1 3.8 1.2 0.7 3 10.7 479498 0.2 3.7 12 24.2 24.6 16.6 9.9 4.4 4.4 4 3.5 155711 0.4 3.1 8.6 14.2 19.1 16.8 14.4 7.9 15.5 5 0.8 35681 0.5 0 4.5 13 18.7 14.7 12.4 11.7 24.4 6+ 0.5 23798 0 1.6 4.6 6.6 18.5 15 9.1 13.8 30.7
Bogra Total 100 862161 3.4 13.2 25.5 28.8 17 7 2.7 1.1 1.2 1 46.5 400854 7 20.7 32.1 26.8 10.6 2.1 0.4 0.2 0 2 36.8 317013 0.3 7.6 24.3 34.4 20.7 9.3 2.5 0.3 0.6 3 11.7 101113 0.4 6 11.4 27 27 15.3 7.1 3.2 2.5 4 3.4 29146 0 2.5 4.9 8.6 29.6 18.5 17.3 7.4 11.1 5 1.1 9356 0 0 7.7 11.5 26.9 7.7 11.5 15.4 19.2 6+ 0.5 4678 0 0 7.7 15.4 7.7 23.1 0 23.1 23.1
Joypurhat Total 100 241792 4.2 15.8 28.4 30.4 12.2 5.4 2.3 0.5 0.8 1 46.8 113132 8.5 25.8 35.1 24.1 4.5 1.6 0.4 0 0 2 39.2 94781 0.4 7.9 26 39.9 17.6 6.4 1.5 0.2 0.2 3 10.6 25510 0.8 4.7 15 28.9 22.9 14.2 10.3 2 1.2

National Series: Socio-economic and Demographic Report Page 57
Table H05: Number of Sleeping Rooms by Household Size, Division and Zila, 2011
Number of
Sleeping Rooms
Percentage of Total
Household
Household Size
Number of Household 1 2 3 4 5 6 7 8 9+
1 2 3 4 5 6 7 8 9 10 11 12 4 2.5 6151 0 3.3 6.6 16.4 21.3 19.7 14.8 8.2 9.8 5 0.5 1210 0 0 0 0 16.7 25 8.3 8.3 41.7 6+ 0.4 1008 0 0 0 20 30 10 10 0 30
Naogaon Total 100 653457 3.8 12.2 26.4 30.7 15.6 6 3.1 0.9 1.2 1 40.9 267435 8.1 20.4 35.9 26.4 6.9 1.9 0.2 0.2 0 2 39.6 258984 1.1 7.2 23.4 38.4 21.3 5.6 2.6 0.2 0.3 3 12.2 79876 0 5.5 14 28.7 22.9 14.3 9.9 2.4 2.4 4 5.5 35985 0.8 6.8 12.9 17.4 19.7 19.7 9.8 4.5 8.3 5 0.7 4362 0 0 0 37.5 25 6.2 18.7 6.2 6.2 6+ 1 6815 0 0 4 0 32 16 8 12 28
Natore Total 100 422040 2.3 11.3 27.4 29.9 17.7 6.1 2.7 1.3 1.4 1 46.3 195601 4.6 18.6 35.4 29 10.5 1.7 0.1 0.1 0 2 35.5 149785 0.4 6.1 23.6 34.2 22.2 8.9 3.3 0.9 0.2 3 12.9 54627 0 3.2 16.1 24.8 30.6 11 6.5 3.9 3.9 4 3.8 15860 0 1.1 11.1 24.4 18.9 13.3 12.2 7.8 11.1 5 0.9 3877 0 0 4.5 18.2 13.6 22.7 9.1 13.6 18.2 6+ 0.5 2291 0 0 7.7 0 23.1 0 15.4 7.7 46.2
Chapai Nawabganj Total 100 353227 2.2 9.3 16.8 28.4 20.1 11.4 5.6 2.4 3.8 1 42.6 150490 4.7 15.7 24.4 32.2 15.7 4.7 1.3 0.7 0.4 2 38.4 135753 0.3 6 13.4 30.2 26.4 13.7 5.9 2 2.1 3 12.1 42572 0.3 1 7.7 16.1 20.3 25.9 15 5.6 8 4 4.8 16820 0 2.7 5.3 17.7 11.5 11.5 14.2 12.4 24.8 5 1.4 4912 3 0 3 15.2 9.1 21.2 9.1 6.1 33.3 6+ 0.8 2679 0 5.6 0 5.6 16.7 22.2 16.7 5.6 27.8
Pabna Total 100 587664 2.3 9.3 20.3 28.9 21 9.6 4.3 1.8 2.5 1 50.6 297635 4.3 15.1 27.5 33.1 15.1 3.4 1 0.2 0.4 2 36 211755 0.3 3.7 14.6 28.9 28.7 16.3 4.4 1.7 1.3 3 9.2 54227 0 2.7 10 16.7 26.7 15.4 13.6 9 5.9 4 2.9 16931 1.4 1.4 5.8 4.3 14.5 13 27.5 5.8 26.1 5 1 5644 0 0 0 0 13 17.4 13 8.7 47.8 6+ 0.3 1472 0 0 0 16.7 16.7 0 16.7 16.7 33.3
Rajshahi Total 100 630068 3.7 12.3 26.4 30.8 16.2 6.3 2.3 1.2 0.8 1 44.8 282126 7.6 22 34.6 26.2 7.6 1.5 0.1 0.2 0.1 2 38 239502 0.5 5.7 23.1 38.7 23.1 6.8 1.8 0.3 0.1 3 12.2 76708 0.4 1.9 13.5 29.3 25.6 16.9 8.8 2.7 1 4 3.9 24420 0.2 1.4 10.8 19.4 18 21.9 8.8 10.5 8.9 5 0.7 4241 1 0 6.2 3.8 20.5 10.5 14.3 24.8 19 6+ 0.5 3071 0 7.2 0 8.6 1.3 23 15.8 17.1 27
Sirajganj

National Series: Socio-economic and Demographic Report Page 58
Table H05: Number of Sleeping Rooms by Household Size, Division and Zila, 2011
Number of
Sleeping Rooms
Percentage of Total
Household
Household Size
Number of Household 1 2 3 4 5 6 7 8 9+
1 2 3 4 5 6 7 8 9 10 11 12 Total 100 710687 2 9.6 20.7 27.3 19 10.9 5.8 2.3 2.5 1 62.6 445071 3.1 13.3 25.3 29.9 16.4 7.7 3.4 0.5 0.4 2 29.1 206491 0.1 3.9 14.5 26.3 25.9 15 8.8 4 1.4 3 6.3 44864 0 2 6.6 13.9 15.9 24.5 13.2 8.6 15.2 4 1.5 10399 0 2.9 5.7 0 8.6 8.6 17.1 11.4 45.7 5 0.3 2080 0 0 14.3 14.3 14.3 28.6 14.3 0 14.3 6+ 0.3 1783 0 0 16.7 0 16.7 0 0 16.7 50
Rangpur Division Total 100 3794607 3.7 11 21.4 29.8 18.5 9.1 3.5 1.5 1.4 1 54.1 2051533 6.6 17 27.9 30.4 12.9 3.9 1 0.1 0.1 2 34.5 1308059 0.2 4.7 15.7 31.9 26.6 14.4 4.5 1.3 0.8 3 8.6 327373 0.3 2.1 8.9 22.6 22.2 18.9 12 7.7 5.4 4 2 76412 0 1.5 6.1 16.9 15.1 17.6 15.1 11.6 16.1 5 0.5 19531 0 0.6 7.5 16.1 11.7 11.1 13 7.1 32.9 6+ 0.3 11699 0 3.6 1.8 1 19.5 13.8 12.8 7.7 39.8 Rural 100 3350279 3.7 11.1 21.2 29.8 18.8 9.1 3.5 1.5 1.3 1 55.1 1844563 6.7 17.1 27.6 30.7 13 3.9 0.9 0.2 0.1 2 34.2 1145834 0.2 4.6 15.2 31.5 27.3 14.5 4.5 1.4 0.8 3 8.3 277306 0.3 1.8 8.4 21.3 23.1 19.7 12.2 7.9 5.4 4 1.8 60454 0 0.7 4.3 15.7 16.2 17.9 16.6 12 16.7 5 0.4 13836 0 0 7.4 14.9 11.9 13.7 14.9 6.2 30.9 6+ 0.2 8287 0 5.1 0 0 18.7 18.1 13.3 7.8 37 Urban 100 444328 3.2 10.3 23 30 16.4 9 4 1.7 2.4 1 46.6 206970 6.6 16.7 30.5 27.8 12.3 3.8 1.8 0.1 0.4 2 36.5 162225 0.4 5.1 18.9 34.7 21.9 13.5 3.9 0.9 0.8 3 11.3 50067 0 4 11.7 29.7 17.3 14.3 11.2 6.8 5.2 4 3.6 15958 0 4.5 12.7 21.3 10.9 16.6 9.6 10.3 14 5 1.3 5696 0 2.1 7.6 19.1 11.3 4.7 8.5 9.1 37.6 6+ 0.8 3412 0 0 6.2 3.5 21.3 3.5 11.5 7.5 46.5
Dinajpur Total 100 707906 3.4 11.4 20.2 31.7 18.9 9 3 1.3 1.2 1 51 361085 6.4 17.7 25.9 31.9 13.8 3.7 0.4 0.1 0.1 2 37.9 268362 0.2 5.4 15.5 33.7 25.2 13.7 4.1 1.4 0.7 3 8.1 57060 0 3.1 10.9 27.6 22.4 16.1 8.9 6.8 4.2 4 2.2 15454 0 1.9 5.8 21.2 19.2 19.2 15.4 5.8 11.5 5 0.4 2972 0 0 10 10 10 10 30 0 30 6+ 0.4 2972 0 0 0 0 10 30 10 0 50
Gaibandha Total 100 610023 5.2 12.5 25.6 28.1 16.1 7.4 2.6 1.2 1.2 1 62 378495 8.3 17.2 31.4 27.9 10.5 3.8 0.8 0 0.1 2 29.9 182625 0.1 6 18.1 30.4 25.2 13 3.9 2 1.3 3 6 36678 0.7 0.7 9 19.4 27.1 18.8 11.1 6.9 6.3 4 1.5 8915 0 0 8.6 31.4 20 2.9 14.3 8.6 14.3 5 0.3 2038 0 0 0 25 25 0 12.5 0 37.5
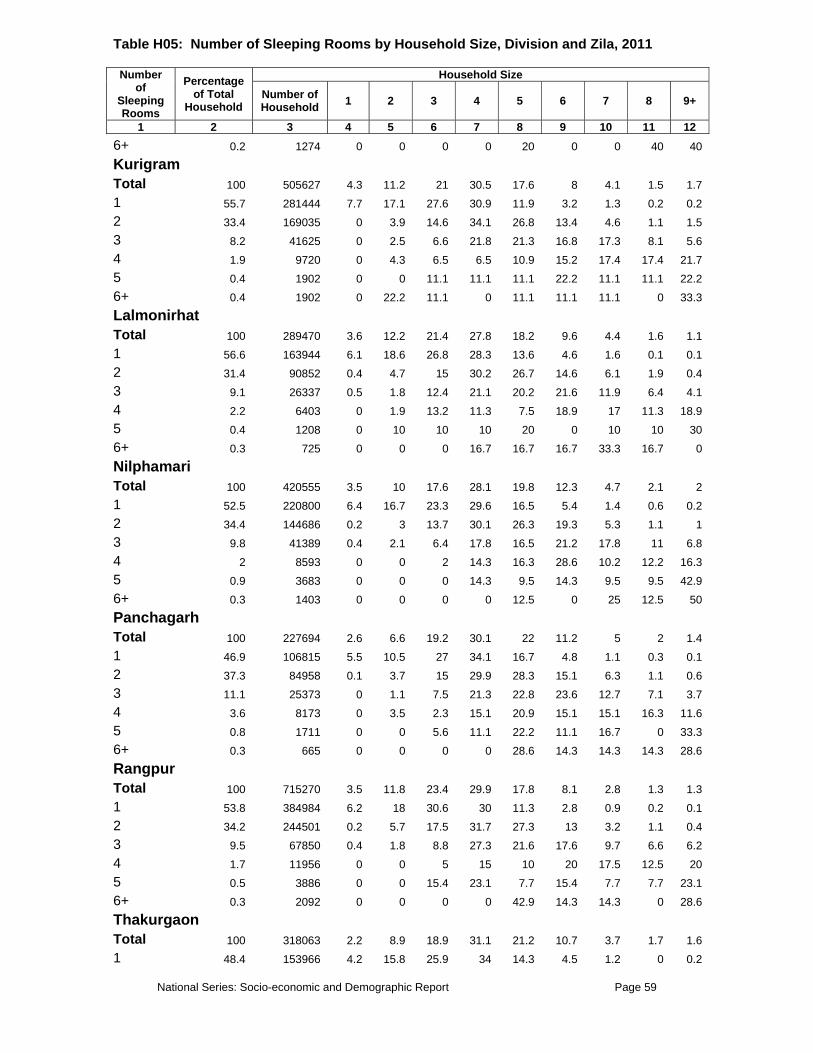
National Series: Socio-economic and Demographic Report Page 59
Table H05: Number of Sleeping Rooms by Household Size, Division and Zila, 2011
Number of
Sleeping Rooms
Percentage of Total
Household
Household Size
Number of Household 1 2 3 4 5 6 7 8 9+
1 2 3 4 5 6 7 8 9 10 11 12 6+ 0.2 1274 0 0 0 0 20 0 0 40 40
Kurigram Total 100 505627 4.3 11.2 21 30.5 17.6 8 4.1 1.5 1.7 1 55.7 281444 7.7 17.1 27.6 30.9 11.9 3.2 1.3 0.2 0.2 2 33.4 169035 0 3.9 14.6 34.1 26.8 13.4 4.6 1.1 1.5 3 8.2 41625 0 2.5 6.6 21.8 21.3 16.8 17.3 8.1 5.6 4 1.9 9720 0 4.3 6.5 6.5 10.9 15.2 17.4 17.4 21.7 5 0.4 1902 0 0 11.1 11.1 11.1 22.2 11.1 11.1 22.2 6+ 0.4 1902 0 22.2 11.1 0 11.1 11.1 11.1 0 33.3
Lalmonirhat Total 100 289470 3.6 12.2 21.4 27.8 18.2 9.6 4.4 1.6 1.1 1 56.6 163944 6.1 18.6 26.8 28.3 13.6 4.6 1.6 0.1 0.1 2 31.4 90852 0.4 4.7 15 30.2 26.7 14.6 6.1 1.9 0.4 3 9.1 26337 0.5 1.8 12.4 21.1 20.2 21.6 11.9 6.4 4.1 4 2.2 6403 0 1.9 13.2 11.3 7.5 18.9 17 11.3 18.9 5 0.4 1208 0 10 10 10 20 0 10 10 30 6+ 0.3 725 0 0 0 16.7 16.7 16.7 33.3 16.7 0
Nilphamari Total 100 420555 3.5 10 17.6 28.1 19.8 12.3 4.7 2.1 2 1 52.5 220800 6.4 16.7 23.3 29.6 16.5 5.4 1.4 0.6 0.2 2 34.4 144686 0.2 3 13.7 30.1 26.3 19.3 5.3 1.1 1 3 9.8 41389 0.4 2.1 6.4 17.8 16.5 21.2 17.8 11 6.8 4 2 8593 0 0 2 14.3 16.3 28.6 10.2 12.2 16.3 5 0.9 3683 0 0 0 14.3 9.5 14.3 9.5 9.5 42.9 6+ 0.3 1403 0 0 0 0 12.5 0 25 12.5 50
Panchagarh Total 100 227694 2.6 6.6 19.2 30.1 22 11.2 5 2 1.4 1 46.9 106815 5.5 10.5 27 34.1 16.7 4.8 1.1 0.3 0.1 2 37.3 84958 0.1 3.7 15 29.9 28.3 15.1 6.3 1.1 0.6 3 11.1 25373 0 1.1 7.5 21.3 22.8 23.6 12.7 7.1 3.7 4 3.6 8173 0 3.5 2.3 15.1 20.9 15.1 15.1 16.3 11.6 5 0.8 1711 0 0 5.6 11.1 22.2 11.1 16.7 0 33.3 6+ 0.3 665 0 0 0 0 28.6 14.3 14.3 14.3 28.6
Rangpur Total 100 715270 3.5 11.8 23.4 29.9 17.8 8.1 2.8 1.3 1.3 1 53.8 384984 6.2 18 30.6 30 11.3 2.8 0.9 0.2 0.1 2 34.2 244501 0.2 5.7 17.5 31.7 27.3 13 3.2 1.1 0.4 3 9.5 67850 0.4 1.8 8.8 27.3 21.6 17.6 9.7 6.6 6.2 4 1.7 11956 0 0 5 15 10 20 17.5 12.5 20 5 0.5 3886 0 0 15.4 23.1 7.7 15.4 7.7 7.7 23.1 6+ 0.3 2092 0 0 0 0 42.9 14.3 14.3 0 28.6
Thakurgaon Total 100 318063 2.2 8.9 18.9 31.1 21.2 10.7 3.7 1.7 1.6 1 48.4 153966 4.2 15.8 25.9 34 14.3 4.5 1.2 0 0.2

National Series: Socio-economic and Demographic Report Page 60
Table H05: Number of Sleeping Rooms by Household Size, Division and Zila, 2011
Number of
Sleeping Rooms
Percentage of Total
Household
Household Size
Number of Household 1 2 3 4 5 6 7 8 9+
1 2 3 4 5 6 7 8 9 10 11 12 2 38.7 123039 0.4 2.5 13.5 32.3 29.3 15.6 4.9 1 0.5 3 9.8 31060 0 3 9.9 16.3 27 20.2 9 9.4 5.2 4 2.3 7198 0 0 7.4 16.7 13 20.4 13 13 16.7 5 0.7 2133 0 0 6.3 18.8 0 6.3 6.3 18.8 43.8 6+ 0.2 667 0 0 0 0 20 0 0 0 80
Sylhet Division Total 100 1762758 1.6 7.3 13.2 18.3 19.2 15.4 10.6 6.7 7.8 1 37.7 664020 3.5 12.9 18.6 22.7 18.6 11.9 6.5 2.9 2.4 2 37.9 668199 0.4 4.9 12 18.5 22.1 17.7 11.6 7.3 5.6 3 15.9 279475 0.6 2.5 7.3 13 17.5 18.4 16.4 11.5 13 4 5.7 99936 0.2 2.5 6 9.6 13.7 14.9 13.5 13.2 26.5 5 1.7 30492 0 0.5 6 5.9 7.3 16.2 14.1 9.9 40 6+ 1.2 20636 2.5 0 3.4 4.4 12.6 13 11.8 8.4 44 Rural 100 1540705 1.6 7.1 12.9 17.8 19.2 15.8 10.8 6.9 7.9 1 37.6 579470 3.5 12.6 17.9 22.5 19 12.2 6.8 2.9 2.6 2 38.6 594011 0.3 4.8 11.8 17.7 22 18.5 11.8 7.5 5.6 3 15.4 237662 0.6 2.2 7.4 12.1 16.7 18.4 17 12.2 13.4 4 5.5 85476 0.2 2.7 5.5 8.9 13.7 14.5 13.8 14 26.7 5 1.7 25767 0 0.6 6.5 5 7.5 18.2 13.3 9.1 39.9 6+ 1.2 18319 2.8 0 2.8 5 12.6 11.7 11.3 9 45 Urban 100 222052 1.8 8.4 15.1 21.8 19.1 12.7 8.7 5.1 7.3 1 38.1 84550 3.8 15 22.7 24.2 15.8 10.1 4.3 2.6 1.5 2 33.4 74188 0.6 5.6 13.4 24.2 23.2 11.7 10.1 5.3 5.8 3 18.8 41813 0.5 3.7 6.3 17.9 22.3 18.6 12.6 7.6 10.5 4 6.5 14460 0 1.3 9 13.4 13.8 17.4 11.9 8.3 24.9 5 2.1 4724 0 0 3.3 11.2 6.6 5.1 18.4 14.7 40.8 6+ 1 2317 0 0 8.1 0 13.2 23 15.6 3.4 36.7
Habiganj Total 100 389046 1.8 8.1 14.1 19.9 18.6 15.9 8.8 5.8 6.9 1 39.7 154378 4 14.3 19.3 23 17.4 12.8 5.4 1.5 2.2 2 37.2 144587 0.5 5.1 13.1 21.6 20.5 17.8 9.7 6.3 5.4 3 15.6 60544 0.5 2.2 8.1 12.9 19.7 19.4 15.9 12.4 8.9 4 5.3 20725 0 2.4 5.5 11.8 15.7 15.7 7.9 15 26 5 1.5 5875 0 2.8 0 5.6 8.3 13.9 8.3 5.6 55.6 6+ 0.8 2937 0 0 0 5.6 5.6 22.2 5.6 5.6 55.6
Maulvibazar Total 100 353120 2 8.6 15 20.5 20.2 13.4 9.3 4.9 6 1 30.9 109263 5.6 16 21.3 22.2 17 9.5 4.8 1.8 1.8 2 40 141188 0.3 6.7 15.2 23.1 23.9 13.9 9.1 4.5 3.3 3 17.8 62950 0.5 4.3 10.2 17.9 20.2 17.6 13.8 8.1 7.4 4 7.5 26529 0 2.3 4 14.1 18.1 16.9 16.9 10.7 16.9 5 2.3 8094 0 0 5.6 3.7 13 14.8 16.7 9.3 37 6+ 1.4 5096 5.9 0 8.8 2.9 8.8 11.8 5.9 8.8 47.1
Sunamganj
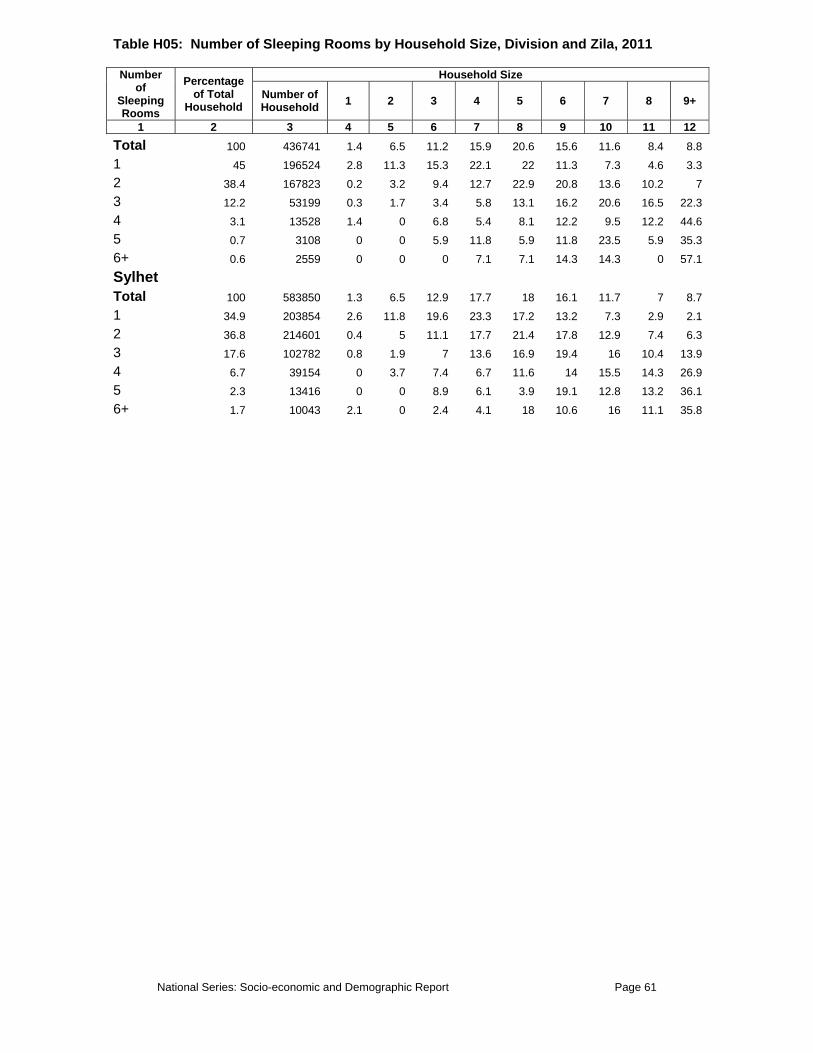
National Series: Socio-economic and Demographic Report Page 61
Table H05: Number of Sleeping Rooms by Household Size, Division and Zila, 2011
Number of
Sleeping Rooms
Percentage of Total
Household
Household Size
Number of Household 1 2 3 4 5 6 7 8 9+
1 2 3 4 5 6 7 8 9 10 11 12 Total 100 436741 1.4 6.5 11.2 15.9 20.6 15.6 11.6 8.4 8.8 1 45 196524 2.8 11.3 15.3 22.1 22 11.3 7.3 4.6 3.3 2 38.4 167823 0.2 3.2 9.4 12.7 22.9 20.8 13.6 10.2 7 3 12.2 53199 0.3 1.7 3.4 5.8 13.1 16.2 20.6 16.5 22.3 4 3.1 13528 1.4 0 6.8 5.4 8.1 12.2 9.5 12.2 44.6 5 0.7 3108 0 0 5.9 11.8 5.9 11.8 23.5 5.9 35.3 6+ 0.6 2559 0 0 0 7.1 7.1 14.3 14.3 0 57.1
Sylhet Total 100 583850 1.3 6.5 12.9 17.7 18 16.1 11.7 7 8.7 1 34.9 203854 2.6 11.8 19.6 23.3 17.2 13.2 7.3 2.9 2.1 2 36.8 214601 0.4 5 11.1 17.7 21.4 17.8 12.9 7.4 6.3 3 17.6 102782 0.8 1.9 7 13.6 16.9 19.4 16 10.4 13.9 4 6.7 39154 0 3.7 7.4 6.7 11.6 14 15.5 14.3 26.9 5 2.3 13416 0 0 8.9 6.1 3.9 19.1 12.8 13.2 36.1 6+ 1.7 10043 2.1 0 2.4 4.1 18 10.6 16 11.1 35.8
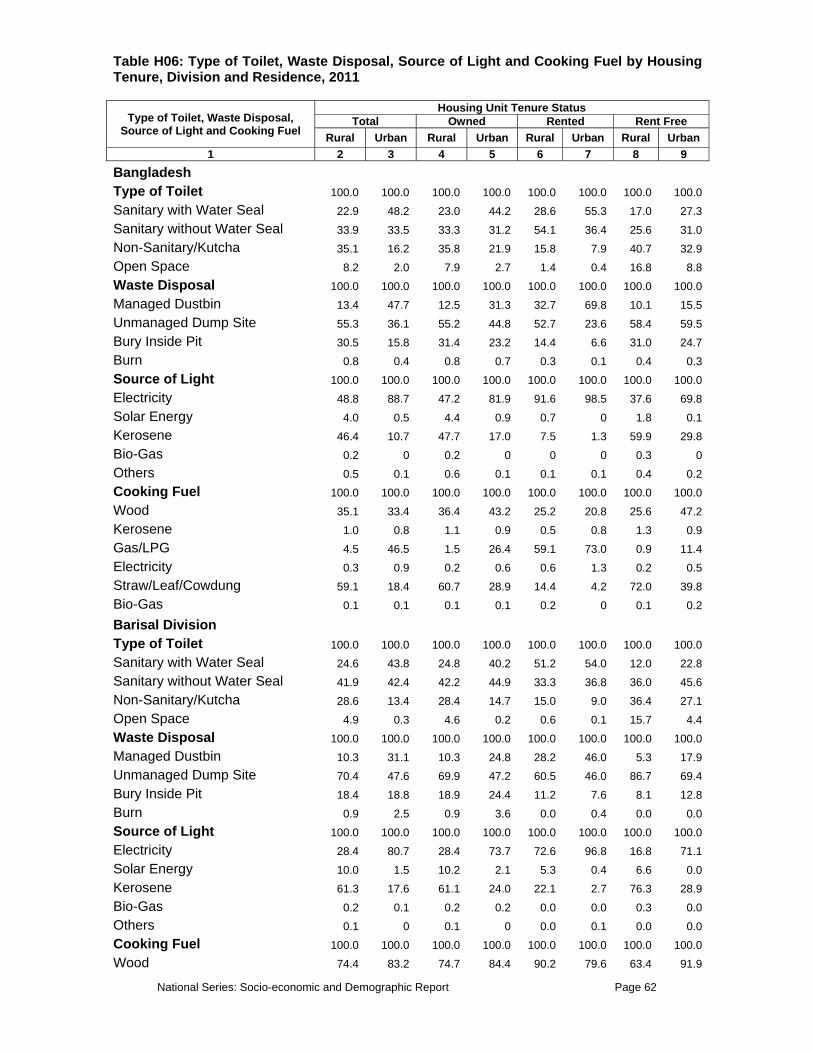
National Series: Socio-economic and Demographic Report Page 62
Table H06: Type of Toilet, Waste Disposal, Source of Light and Cooking Fuel by Housing Tenure, Division and Residence, 2011
Type of Toilet, Waste Disposal, Source of Light and Cooking Fuel
Housing Unit Tenure Status Total Owned Rented Rent Free
Rural Urban Rural Urban Rural Urban Rural Urban 1 2 3 4 5 6 7 8 9
Bangladesh Type of Toilet 100.0 100.0 100.0 100.0 100.0 100.0 100.0 100.0 Sanitary with Water Seal 22.9 48.2 23.0 44.2 28.6 55.3 17.0 27.3 Sanitary without Water Seal 33.9 33.5 33.3 31.2 54.1 36.4 25.6 31.0 Non-Sanitary/Kutcha 35.1 16.2 35.8 21.9 15.8 7.9 40.7 32.9 Open Space 8.2 2.0 7.9 2.7 1.4 0.4 16.8 8.8 Waste Disposal 100.0 100.0 100.0 100.0 100.0 100.0 100.0 100.0 Managed Dustbin 13.4 47.7 12.5 31.3 32.7 69.8 10.1 15.5 Unmanaged Dump Site 55.3 36.1 55.2 44.8 52.7 23.6 58.4 59.5 Bury Inside Pit 30.5 15.8 31.4 23.2 14.4 6.6 31.0 24.7 Burn 0.8 0.4 0.8 0.7 0.3 0.1 0.4 0.3 Source of Light 100.0 100.0 100.0 100.0 100.0 100.0 100.0 100.0 Electricity 48.8 88.7 47.2 81.9 91.6 98.5 37.6 69.8 Solar Energy 4.0 0.5 4.4 0.9 0.7 0 1.8 0.1 Kerosene 46.4 10.7 47.7 17.0 7.5 1.3 59.9 29.8 Bio-Gas 0.2 0 0.2 0 0 0 0.3 0 Others 0.5 0.1 0.6 0.1 0.1 0.1 0.4 0.2 Cooking Fuel 100.0 100.0 100.0 100.0 100.0 100.0 100.0 100.0 Wood 35.1 33.4 36.4 43.2 25.2 20.8 25.6 47.2 Kerosene 1.0 0.8 1.1 0.9 0.5 0.8 1.3 0.9 Gas/LPG 4.5 46.5 1.5 26.4 59.1 73.0 0.9 11.4 Electricity 0.3 0.9 0.2 0.6 0.6 1.3 0.2 0.5 Straw/Leaf/Cowdung 59.1 18.4 60.7 28.9 14.4 4.2 72.0 39.8 Bio-Gas 0.1 0.1 0.1 0.1 0.2 0 0.1 0.2
Barisal Division Type of Toilet 100.0 100.0 100.0 100.0 100.0 100.0 100.0 100.0 Sanitary with Water Seal 24.6 43.8 24.8 40.2 51.2 54.0 12.0 22.8 Sanitary without Water Seal 41.9 42.4 42.2 44.9 33.3 36.8 36.0 45.6 Non-Sanitary/Kutcha 28.6 13.4 28.4 14.7 15.0 9.0 36.4 27.1 Open Space 4.9 0.3 4.6 0.2 0.6 0.1 15.7 4.4 Waste Disposal 100.0 100.0 100.0 100.0 100.0 100.0 100.0 100.0 Managed Dustbin 10.3 31.1 10.3 24.8 28.2 46.0 5.3 17.9 Unmanaged Dump Site 70.4 47.6 69.9 47.2 60.5 46.0 86.7 69.4 Bury Inside Pit 18.4 18.8 18.9 24.4 11.2 7.6 8.1 12.8 Burn 0.9 2.5 0.9 3.6 0.0 0.4 0.0 0.0 Source of Light 100.0 100.0 100.0 100.0 100.0 100.0 100.0 100.0 Electricity 28.4 80.7 28.4 73.7 72.6 96.8 16.8 71.1 Solar Energy 10.0 1.5 10.2 2.1 5.3 0.4 6.6 0.0 Kerosene 61.3 17.6 61.1 24.0 22.1 2.7 76.3 28.9 Bio-Gas 0.2 0.1 0.2 0.2 0.0 0.0 0.3 0.0 Others 0.1 0 0.1 0 0.0 0.1 0.0 0.0 Cooking Fuel 100.0 100.0 100.0 100.0 100.0 100.0 100.0 100.0 Wood 74.4 83.2 74.7 84.4 90.2 79.6 63.4 91.9

National Series: Socio-economic and Demographic Report Page 63
Table H06: Type of Toilet, Waste Disposal, Source of Light and Cooking Fuel by Housing Tenure, Division and Residence, 2011
Type of Toilet, Waste Disposal, Source of Light and Cooking Fuel
Housing Unit Tenure Status Total Owned Rented Rent Free
Rural Urban Rural Urban Rural Urban Rural Urban 1 2 3 4 5 6 7 8 9
Kerosene 1.7 0.4 1.7 0.3 2.9 0.5 3.3 0.3 Gas/LPG 0.2 10.5 0.2 7.2 1.7 18.3 0.3 4.0 Electricity 0.1 0.2 0.1 0.1 0.0 0.4 0.0 0.0 Straw/Leaf/Cowdung 23.5 5.8 23.3 8.1 5.2 1.3 33.0 3.7 Bio-Gas 0 0.0 0.1 0.0 0.0 0.0 0.0 0.0
Chittagong Division Type of Toilet 100.0 100.0 100.0 100.0 100.0 100.0 100.0 100.0 Sanitary with Water Seal 19.3 44.3 19.3 34.7 29.5 56.2 10.1 23.7 Sanitary without Water Seal 43.7 34.7 44.2 38.0 40.4 30.8 31.0 37.0 Non-Sanitary/Kutcha 31.5 19.6 31.3 25.7 28.2 11.8 41.3 35.2 Open Space 5.5 1.4 5.2 1.5 1.9 1.2 17.7 4.1 Waste Disposal 100.0 100.0 100.0 100.0 100.0 100.0 100.0 100.0 Managed Dustbin 11.2 46.8 10.9 29.3 23.7 68.1 6.3 21.5 Unmanaged Dump Site 65.3 44.3 64.8 57.2 66.4 28.5 78.9 67.3 Bury Inside Pit 21.4 7.8 22.0 11.7 8.6 3.3 13.7 10.3 Burn 2.2 1.0 2.3 1.8 1.3 0.1 1.1 0.9 Source of Light 100.0 100.0 100.0 100.0 100.0 100.0 100.0 100.0 Electricity 58.0 90.4 57.8 83.9 86.9 98.7 35.5 71.0 Solar Energy 4.5 1.1 4.7 2.2 0.6 0.0 1.7 0.0 Kerosene 36.8 8.3 36.8 13.8 12.5 1.1 61.8 28.3 Bio-Gas 0.1 0.1 0.1 0 0.0 0.1 0.4 0.0 Others 0.6 0.1 0.6 0.2 0.0 0.0 0.5 0.7 Cooking Fuel 100.0 100.0 100.0 100.0 100.0 100.0 100.0 100.0 Wood 55.8 33.0 56.2 46.6 48.5 16.3 53.4 58.9 Kerosene 1.1 1.2 1.1 1.8 0.8 0.4 1.5 0.0 Gas/LPG 3.5 52.9 2.6 33.4 32.8 76.5 1.1 22.9 Electricity 0.3 0.7 0.3 0.5 1.0 0.9 0.0 0.0 Straw/Leaf/Cowdung 39.2 12.1 39.8 17.5 16.6 5.6 44.0 18.2 Bio-Gas 0.1 0.1 0.1 0.1 0.3 0.2 0.0 0.0
Dhaka Division Type of Toilet 100.0 100.0 100.0 100.0 100.0 100.0 100.0 100.0 Sanitary with Water Seal 22.1 50.3 21.7 46.1 26.8 54.0 15.7 30.3 Sanitary without Water Seal 40.0 38.0 37.0 33.6 61.0 40.7 33.9 38.0 Non-Sanitary/Kutcha 32.1 10.7 35.0 18.2 11.5 5.0 39.9 28.8 Open Space 5.8 1.0 6.4 2.1 0.8 0.2 10.5 2.9 Waste Disposal 100.0 100.0 100.0 100.0 100.0 100.0 100.0 100.0 Managed Dustbin 15.0 63.5 12.0 43.2 36.2 78.2 8.5 26.6 Unmanaged Dump Site 61.7 27.4 63.0 40.5 50.7 17.4 70.3 59.0 Bury Inside Pit 22.7 9.1 24.4 16.1 12.9 4.4 21.1 14.3 Burn 0.6 0.1 0.7 0.2 0.2 0.0 0.1 0.1 Source of Light 100.0 100.0 100.0 100.0 100.0 100.0 100.0 100.0 Electricity 56.3 94.7 50.4 88.4 96.3 99.5 47.4 78.6 Solar Energy 4.1 0.1 4.7 0.3 0.5 0 2.1 0.2 Kerosene 38.4 5.1 43.5 11.2 3.1 0.4 49.0 21.1
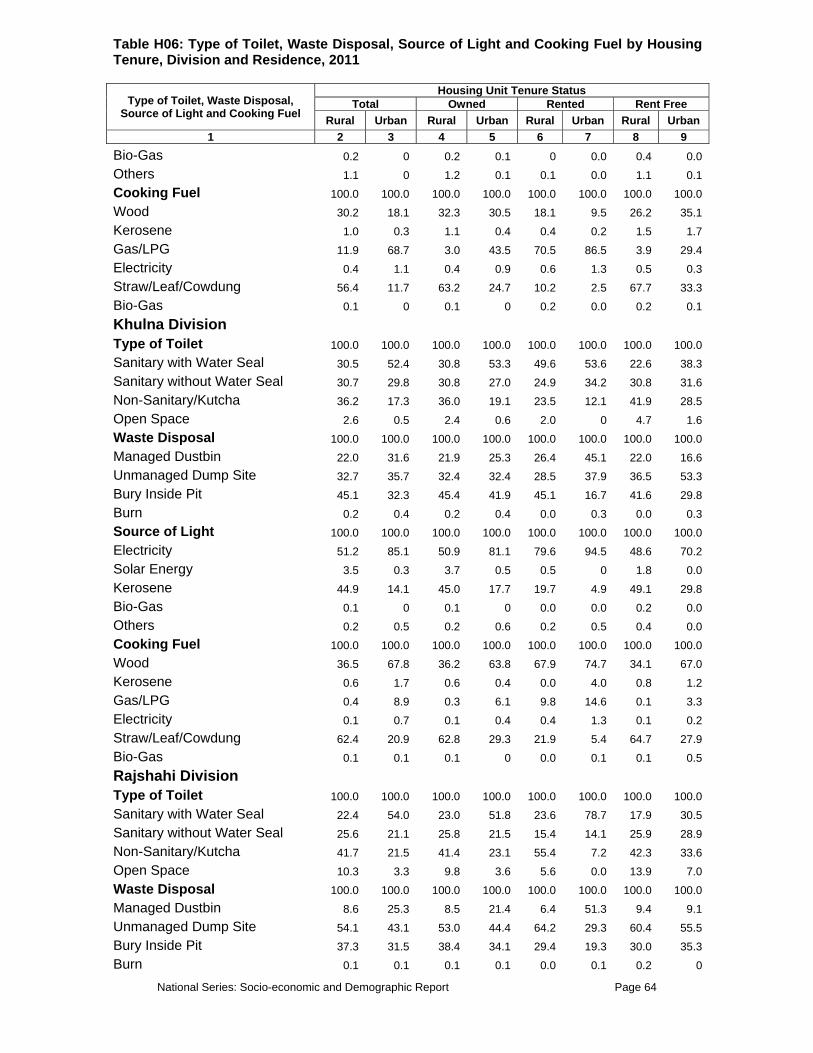
National Series: Socio-economic and Demographic Report Page 64
Table H06: Type of Toilet, Waste Disposal, Source of Light and Cooking Fuel by Housing Tenure, Division and Residence, 2011
Type of Toilet, Waste Disposal, Source of Light and Cooking Fuel
Housing Unit Tenure Status Total Owned Rented Rent Free
Rural Urban Rural Urban Rural Urban Rural Urban 1 2 3 4 5 6 7 8 9
Bio-Gas 0.2 0 0.2 0.1 0 0.0 0.4 0.0 Others 1.1 0 1.2 0.1 0.1 0.0 1.1 0.1 Cooking Fuel 100.0 100.0 100.0 100.0 100.0 100.0 100.0 100.0 Wood 30.2 18.1 32.3 30.5 18.1 9.5 26.2 35.1 Kerosene 1.0 0.3 1.1 0.4 0.4 0.2 1.5 1.7 Gas/LPG 11.9 68.7 3.0 43.5 70.5 86.5 3.9 29.4 Electricity 0.4 1.1 0.4 0.9 0.6 1.3 0.5 0.3 Straw/Leaf/Cowdung 56.4 11.7 63.2 24.7 10.2 2.5 67.7 33.3 Bio-Gas 0.1 0 0.1 0 0.2 0.0 0.2 0.1
Khulna Division Type of Toilet 100.0 100.0 100.0 100.0 100.0 100.0 100.0 100.0 Sanitary with Water Seal 30.5 52.4 30.8 53.3 49.6 53.6 22.6 38.3 Sanitary without Water Seal 30.7 29.8 30.8 27.0 24.9 34.2 30.8 31.6 Non-Sanitary/Kutcha 36.2 17.3 36.0 19.1 23.5 12.1 41.9 28.5 Open Space 2.6 0.5 2.4 0.6 2.0 0 4.7 1.6 Waste Disposal 100.0 100.0 100.0 100.0 100.0 100.0 100.0 100.0 Managed Dustbin 22.0 31.6 21.9 25.3 26.4 45.1 22.0 16.6 Unmanaged Dump Site 32.7 35.7 32.4 32.4 28.5 37.9 36.5 53.3 Bury Inside Pit 45.1 32.3 45.4 41.9 45.1 16.7 41.6 29.8 Burn 0.2 0.4 0.2 0.4 0.0 0.3 0.0 0.3 Source of Light 100.0 100.0 100.0 100.0 100.0 100.0 100.0 100.0 Electricity 51.2 85.1 50.9 81.1 79.6 94.5 48.6 70.2 Solar Energy 3.5 0.3 3.7 0.5 0.5 0 1.8 0.0 Kerosene 44.9 14.1 45.0 17.7 19.7 4.9 49.1 29.8 Bio-Gas 0.1 0 0.1 0 0.0 0.0 0.2 0.0 Others 0.2 0.5 0.2 0.6 0.2 0.5 0.4 0.0 Cooking Fuel 100.0 100.0 100.0 100.0 100.0 100.0 100.0 100.0 Wood 36.5 67.8 36.2 63.8 67.9 74.7 34.1 67.0 Kerosene 0.6 1.7 0.6 0.4 0.0 4.0 0.8 1.2 Gas/LPG 0.4 8.9 0.3 6.1 9.8 14.6 0.1 3.3 Electricity 0.1 0.7 0.1 0.4 0.4 1.3 0.1 0.2 Straw/Leaf/Cowdung 62.4 20.9 62.8 29.3 21.9 5.4 64.7 27.9 Bio-Gas 0.1 0.1 0.1 0 0.0 0.1 0.1 0.5
Rajshahi Division Type of Toilet 100.0 100.0 100.0 100.0 100.0 100.0 100.0 100.0 Sanitary with Water Seal 22.4 54.0 23.0 51.8 23.6 78.7 17.9 30.5 Sanitary without Water Seal 25.6 21.1 25.8 21.5 15.4 14.1 25.9 28.9 Non-Sanitary/Kutcha 41.7 21.5 41.4 23.1 55.4 7.2 42.3 33.6 Open Space 10.3 3.3 9.8 3.6 5.6 0.0 13.9 7.0 Waste Disposal 100.0 100.0 100.0 100.0 100.0 100.0 100.0 100.0 Managed Dustbin 8.6 25.3 8.5 21.4 6.4 51.3 9.4 9.1 Unmanaged Dump Site 54.1 43.1 53.0 44.4 64.2 29.3 60.4 55.5 Bury Inside Pit 37.3 31.5 38.4 34.1 29.4 19.3 30.0 35.3 Burn 0.1 0.1 0.1 0.1 0.0 0.1 0.2 0

National Series: Socio-economic and Demographic Report Page 65
Table H06: Type of Toilet, Waste Disposal, Source of Light and Cooking Fuel by Housing Tenure, Division and Residence, 2011
Type of Toilet, Waste Disposal, Source of Light and Cooking Fuel
Housing Unit Tenure Status Total Owned Rented Rent Free
Rural Urban Rural Urban Rural Urban Rural Urban 1 2 3 4 5 6 7 8 9
Source of Light 100.0 100.0 100.0 100.0 100.0 100.0 100.0 100.0 Electricity 49.3 79.9 50.5 76.4 42.3 95.8 41.9 75.6 Solar Energy 2.4 0.1 2.4 0.1 5.5 0.0 1.8 0.3 Kerosene 47.8 19.8 46.5 23.4 51.3 3.6 56.1 23.7 Bio-Gas 0.2 0 0.2 0.0 0.9 0.0 0.1 0.2 Others 0.3 0.2 0.4 0.1 0.0 0.5 0.1 0.2 Cooking Fuel 100.0 100.0 100.0 100.0 100.0 100.0 100.0 100.0 Wood 7.3 32.7 7.6 30.7 21.5 40.8 4.0 31.4 Kerosene 0.9 1.4 0.8 0.9 1.1 3.8 1.2 0.4 Gas/LPG 0.2 15.7 0.2 12.5 2.2 37.0 0.0 2.9 Electricity 0.2 0.6 0.2 0.2 0.0 2.4 0.2 0.6 Straw/Leaf/Cowdung 91.4 49.5 91.1 55.6 75.1 15.8 94.6 64.7 Bio-Gas 0 0.1 0 0.1 0.0 0.2 0 0.0
Rangpur Division Type of Toilet 100.0 100.0 100.0 100.0 100.0 100.0 100.0 100.0 Sanitary with Water Seal 25.3 36.7 25.6 37.8 59.9 54.8 21.3 18.0 Sanitary without Water Seal 16.5 21.0 16.5 20.3 9.7 22.9 16.4 22.0 Non-Sanitary/Kutcha 37.1 30.7 37.8 31.3 16.9 21.0 33.5 36.7 Open Space 21.1 11.6 20.1 10.7 13.5 1.3 28.9 23.4 Waste Disposal 100.0 100.0 100.0 100.0 100.0 100.0 100.0 100.0 Managed Dustbin 9.4 15.3 9.8 15.5 10.1 24.4 6.5 7.1 Unmanaged Dump Site 38.1 48.5 37.4 45.6 46.3 45.3 42.5 61.7 Bury Inside Pit 51.9 35.8 52.2 38.5 41.5 30.1 50.0 30.6 Burn 0.7 0.4 0.6 0.4 2.1 0.2 1.0 0.6 Source of Light 100.0 100.0 100.0 100.0 100.0 100.0 100.0 100.0 Electricity 29.4 69.8 29.7 69.5 69.8 91.8 25.1 52.9 Solar Energy 2.1 0.0 2.3 0.0 0.0 0.0 0.8 0.0 Kerosene 68.2 30.1 67.6 30.4 30.2 8.2 73.5 46.8 Bio-Gas 0.2 0 0.1 0.1 0.0 0.0 0.5 0.0 Others 0.2 0.1 0.2 0.0 0.0 0.0 0.1 0.3 Cooking Fuel 100.0 100.0 100.0 100.0 100.0 100.0 100.0 100.0 Wood 22.4 56.9 23.2 53.4 47.0 69.1 15.8 59.9 Kerosene 1.4 1.5 1.4 1.3 1.5 3.4 1.1 0.7 Gas/LPG 0.2 5.4 0.1 4.2 7.0 16.8 0.0 0.5 Electricity 0.2 1.0 0.2 0.8 2.9 2.1 0.1 0.8 Straw/Leaf/Cowdung 75.8 35.0 75.0 40.2 41.7 8.6 83.1 37.7 Bio-Gas 0 0.1 0 0.0 0.0 0.0 0.0 0.4
Sylhet Division Type of Toilet 100.0 100.0 100.0 100.0 100.0 100.0 100.0 100.0 Sanitary with Water Seal 15.6 42.4 16.2 43.0 35.5 44.9 5.9 8.8 Sanitary without Water Seal 30.8 35.6 32.6 34.5 28.7 38.1 15.1 24.8 Non-Sanitary/Kutcha 44.0 20.8 43.1 21.4 28.6 16.8 55.9 54.2 Open Space 9.5 1.2 8.1 1.1 7.2 0.2 23.1 12.2 Waste Disposal 100.0 100.0 100.0 100.0 100.0 100.0 100.0 100.0

National Series: Socio-economic and Demographic Report Page 66
Table H06: Type of Toilet, Waste Disposal, Source of Light and Cooking Fuel by Housing Tenure, Division and Residence, 2011
Type of Toilet, Waste Disposal, Source of Light and Cooking Fuel
Housing Unit Tenure Status Total Owned Rented Rent Free
Rural Urban Rural Urban Rural Urban Rural Urban 1 2 3 4 5 6 7 8 9
Managed Dustbin 18.0 51.1 18.3 44.9 21.0 62.3 14.5 12.8 Unmanaged Dump Site 65.5 42.9 64.8 48.2 70.2 32.6 71.0 81.4 Bury Inside Pit 16.1 5.7 16.6 6.4 8.8 4.9 14.2 5.8 Burn 0.3 0.3 0.4 0.4 0.0 0.2 0.2 0.0 Source of Light 100.0 100.0 100.0 100.0 100.0 100.0 100.0 100.0 Electricity 43.2 88.8 43.6 83.0 75.9 98.4 30.9 61.9 Solar Energy 5.1 2.0 5.5 3.9 0.5 0.0 2.7 0.0 Kerosene 51.5 9.1 50.6 13.1 23.6 1.5 66.3 38.1 Bio-Gas 0.1 0.0 0.1 0.0 0.0 0.0 0.0 0.0 Others 0.2 0 0.2 0.0 0.0 0 0.1 0.0 Cooking Fuel 100.0 100.0 100.0 100.0 100.0 100.0 100.0 100.0 Wood 52.6 34.7 51.2 46.1 56.4 18.2 64.2 61.9 Kerosene 0.9 0.2 0.9 0.1 0.0 0.2 1.8 1.6 Gas/LPG 2.0 54.0 1.6 39.3 20.0 75.5 0.3 13.7 Electricity 0.2 0.9 0.3 0.7 0.0 1.2 0.0 0.4 Straw/Leaf/Cowdung 44.1 10.3 45.9 13.9 22.7 4.8 33.7 22.4 Bio-Gas 0.1 0.0 0.1 0.0 0.9 0.0 0.0 0.0

National Series: Socio-economic and Demographic Report Page 67
Table H07: Type of Toilet, Waste Disposal, Source of Light and Cooking Fuel by Housing Tenure and Zila, 2011
Zila Housing Unit Tenure Status Total Owned Rented Rent Free
1 2 3 4 5 Barguna Type of Toilet Number 214594 202777 6177 5640Sanitary with Water Seal 28.2 27.6 59.4 15.9Sanitary Without Water Seal 39.7 40.3 37.7 22.2Non-sanitary/Kutcha 27.3 27.6 1.4 44.4Open Space 4.7 4.5 1.4 17.5Waste Disposal Total 100 100 100 100Managed Dustbin 29 28.7 43.5 23.8Unmanaged Dump Site 60.8 60.8 52.2 73Bury/Inside Pit 9.3 9.7 4.3 3.2Burn 0.8 0.8 0 0Source of Light Total 100 100 100 100Electricity 17.1 15.5 78.3 4.8Solar Energy 17.9 18.5 4.3 11.1Kerosene 64.6 65.5 17.4 82.5Biogas 0.5 0.4 0 1.6Other 0 0 0 0Cooking Fuel Total 100 100 100 100Wood 67.5 67.3 88.4 49.2Kerosene 1.7 1.8 0 0Gas/LPG 0.8 0.5 11.6 0Electricity 0 0 0 0Straw/Dried Cow Dung 30 30.4 0 50.8Bio-gas 0 0 0 0Barisal Type of Toilet Number 508586 446656 46668 15262Sanitary with Water Seal 35.6 34 54.6 22.7Sanitary Without Water Seal 37.7 37.9 35.1 40.5Non-sanitary/Kutcha 24.9 26.3 10.1 31.4Open Space 1.8 1.8 0.2 5.4Waste Disposal Total 100 100 100 100Managed Dustbin 11.1 7.1 52 4.9Unmanaged Dump Site 59.7 61.3 39.2 74.9Bury/Inside Pit 27.7 29.9 8.5 20.1Burn 1.5 1.7 0.3 0

National Series: Socio-economic and Demographic Report Page 68
Table H07: Type of Toilet, Waste Disposal, Source of Light and Cooking Fuel by Housing Tenure and Zila, 2011
Zila Housing Unit Tenure Status Total Owned Rented Rent Free
1 2 3 4 5 Source of Light Total 100 100 100 100Electricity 49 44 97.8 47Solar Energy 7.3 8 0 9.6Kerosene 43.5 47.8 2.1 43.4Biogas 0.1 0.1 0 0Other 0.1 0.1 0.1 0Cooking Fuel Total 100 100 100 100Wood 72.5 72.2 75.9 73Kerosene 0.9 0.9 0.8 0.2Gas/LPG 3.7 1.9 22.2 0.2Electricity 0.1 0.1 0.2 0Straw/Dried Cow Dung 22.8 25 0.9 26.6Bio-gas 0 0 0 0Bhola Type of Toilet Number 370560 334464 8520 27575Sanitary with Water Seal 11.3 11.3 29.1 6.2Sanitary Without Water Seal 40.7 41.2 47.3 32Non-sanitary/Kutcha 37.2 37.3 23.6 39.9Open Space 10.9 10.2 0 21.9Waste Disposal Total 100 100 100 100Managed Dustbin 7.4 7.4 18.2 3.9Unmanaged Dump Site 81.4 80.9 60 94.9Bury/Inside Pit 10.3 10.8 20 1.1Burn 0.8 0.9 1.8 0Source of Light Total 100 100 100 100Electricity 27.3 27 83.6 13.5Solar Energy 5.4 5.7 1.8 2.8Kerosene 67 66.9 14.5 83.7Biogas 0.3 0.3 0 0Other 0 0 0 0Cooking Fuel Total 100 100 100 100Wood 78.9 79.9 85.5 64.6Kerosene 3.2 2.9 3.6 6.2Gas/LPG 1 0.7 10.9 1.1Electricity 0.2 0.2 0 0Straw/Dried Cow Dung 16.6 16 0 28.1

National Series: Socio-economic and Demographic Report Page 69
Table H07: Type of Toilet, Waste Disposal, Source of Light and Cooking Fuel by Housing Tenure and Zila, 2011
Zila Housing Unit Tenure Status Total Owned Rented Rent Free
1 2 3 4 5 Bio-gas 0.2 0.2 0 0Jhalokati Type of Toilet Number 157231 146136 7156 3939Sanitary with Water Seal 45.7 44.6 78 28.3Sanitary Without Water Seal 39.4 40.1 21.1 48.3Non-sanitary/Kutcha 13.8 14.2 0.9 21.7Open Space 1.1 1.2 0 1.7Waste Disposal Total 100 100 100 100Managed Dustbin 21.7 20.3 55 13.3Unmanaged Dump Site 57.7 58.2 43.1 66.7Bury/Inside Pit 19.6 20.5 1.8 20Burn 0.9 1 0 0Source of Light Total 100 100 100 100Electricity 48.8 46.9 97.2 30Solar Energy 3.4 3.5 0 6.7Kerosene 47.3 49.1 2.8 61.7Biogas 0.2 0.2 0 1.7Other 0.4 0.4 0 0Cooking Fuel Total 100 100 100 100Wood 83.5 83.4 83.5 88.3Kerosene 1.1 1.2 0 0Gas/LPG 1.1 0.6 11.9 0Electricity 0 0 0 0Straw/Dried Cow Dung 14.3 14.8 4.6 11.7Bio-gas 0 0 0 0Patuakhali Type of Toilet Number 343963 326707 9634 7621Sanitary with Water Seal 18.1 17.8 34.3 7.5Sanitary Without Water Seal 51.8 51.8 50.7 54.7Non-sanitary/Kutcha 26.2 26.6 14.9 22.6Open Space 3.9 3.7 0 15.1Waste Disposal Total 100 100 100 100Managed Dustbin 4.1 3.9 11.9 0Unmanaged Dump Site 80.3 79.8 83.6 98.1Bury/Inside Pit 14.4 15 4.5 1.9Burn 1.3 1.3 0 0

National Series: Socio-economic and Demographic Report Page 70
Table H07: Type of Toilet, Waste Disposal, Source of Light and Cooking Fuel by Housing Tenure and Zila, 2011
Zila Housing Unit Tenure Status Total Owned Rented Rent Free
1 2 3 4 5 Source of Light Total 100 100 100 100Electricity 23.2 21.4 83.6 22.6Solar Energy 15.6 16.1 6 5.7Kerosene 61.1 62.4 10.4 71.7Biogas 0.1 0.1 0 0Other 0.1 0.1 0 0Cooking Fuel Total 100 100 100 100Wood 68 67.6 88.1 60.4Kerosene 1.5 1.5 1.5 0Gas/LPG 0.3 0.2 1.5 1.9Electricity 0 0 0 0Straw/Dried Cow Dung 30.2 30.6 9 37.7Bio-gas 0 0 0 0Pirojpur Type of Toilet Number 254421 239437 11053 3932Sanitary with Water Seal 33.2 31.9 65.4 21.6Sanitary Without Water Seal 42.5 43.2 28.8 37.8Non-sanitary/Kutcha 22.4 22.9 5.8 40.5Open Space 2 2.1 0 0Waste Disposal Total 100 100 100 100Managed Dustbin 17.8 16.7 42.3 18.9Unmanaged Dump Site 57.1 57.4 50 54.1Bury/Inside Pit 24.4 25.1 7.7 27Burn 0.7 0.8 0 0Source of Light Total 100 100 100 100Electricity 41.8 39.7 90.4 32.4Solar Energy 4.2 4.3 1 2.7Kerosene 53.6 55.5 8.7 64.9Biogas 0 0 0 0Other 0.4 0.4 0 0Cooking Fuel Total 100 100 100 100Wood 88.8 88.9 90.4 81.1Kerosene 0.8 0.8 0 2.7Gas/LPG 0.7 0.4 6.7 0Electricity 0.1 0 1.9 0Straw/Dried Cow Dung 9.6 9.9 1 16.2

National Series: Socio-economic and Demographic Report Page 71
Table H07: Type of Toilet, Waste Disposal, Source of Light and Cooking Fuel by Housing Tenure and Zila, 2011
Zila Housing Unit Tenure Status Total Owned Rented Rent Free
1 2 3 4 5 Bio-gas 0 0 0 0Bandarban Type of Toilet Number 77566 68940 4788 3837Sanitary with Water Seal 7.5 5.7 36.3 4.3Sanitary Without Water Seal 20.6 20.2 31.5 13.7Non-sanitary/Kutcha 37.4 38.8 24.7 27.4Open Space 34.5 35.3 7.5 54.7Waste Disposal Total 100 100 100 100Managed Dustbin 13.4 13.4 22.6 3.4Unmanaged Dump Site 68.2 67.4 66.4 85.5Bury/Inside Pit 12.4 12.8 11 6Burn 6 6.4 0 5.1Source of Light Total 100 100 100 100Electricity 16.2 11.5 76 25.6Solar Energy 12.8 14.2 0.7 2.6Kerosene 70.2 73.4 23.3 71.8Biogas 0.5 0.5 0 0Other 0.3 0.3 0 0Cooking Fuel Total 100 100 100 100Wood 97 97.6 85.6 99.1Kerosene 2 2 2.1 0.9Gas/LPG 1 0.2 12.3 0Electricity 0 0 0 0Straw/Dried Cow Dung 0.1 0.1 0 0Bio-gas 0 0 0 0Brahmanbaria Type of Toilet Number 536664 480220 40765 15679Sanitary with Water Seal 23.4 21.9 46.7 10Sanitary Without Water Seal 40.7 40.9 41.8 31.4Non-sanitary/Kutcha 33.1 34.5 11 50Open Space 2.8 2.8 0.5 8.6Waste Disposal Total 100 100 100 100Managed Dustbin 28.7 26.4 58.2 21.4Unmanaged Dump Site 47.5 48 35.7 62.9Bury/Inside Pit 23.6 25.3 6 15.7Burn 0.2 0.2 0 0

National Series: Socio-economic and Demographic Report Page 72
Table H07: Type of Toilet, Waste Disposal, Source of Light and Cooking Fuel by Housing Tenure and Zila, 2011
Zila Housing Unit Tenure Status Total Owned Rented Rent Free
1 2 3 4 5 Source of Light Total 100 100 100 100Electricity 75.3 74.2 95.1 60Solar Energy 3.5 3.8 0 2.9Kerosene 20.8 21.6 4.9 35.7Biogas 0 0 0 0Other 0.4 0.4 0 1.4Cooking Fuel Total 100 100 100 100Wood 22.5 21.8 32.4 17.1Kerosene 0.7 0.7 1.1 1.4Gas/LPG 9.3 5.6 53.3 7.1Electricity 0.3 0.3 0.5 0Straw/Dried Cow Dung 67.2 71.5 12.6 74.3Bio-gas 0 0 0 0Chandpur Type of Toilet Number 501332 470681 15535 15116Sanitary with Water Seal 11.3 10.2 43.2 12.5Sanitary Without Water Seal 57.2 58.2 31.1 52.8Non-sanitary/Kutcha 29.7 29.8 24.3 33.3Open Space 1.8 1.9 1.4 1.4Waste Disposal Total 100 100 100 100Managed Dustbin 3.3 2.9 18.9 1.4Unmanaged Dump Site 59.5 58.8 70.3 69.4Bury/Inside Pit 34 35 8.1 29.2Burn 3.2 3.3 2.7 0Source of Light Total 100 100 100 100Electricity 50.2 48.9 94.6 44.4Solar Energy 6.7 7 0 1.4Kerosene 41.5 42.3 5.4 54.2Biogas 0.1 0.1 0 0Other 1.5 1.6 0 0Cooking Fuel Total 100 100 100 100Wood 47.7 48.4 36.5 37.5Kerosene 1.6 1.7 0 0Gas/LPG 4.3 2.6 54.1 5.6Electricity 0.3 0.3 0 0Straw/Dried Cow Dung 46.1 47 9.5 56.9
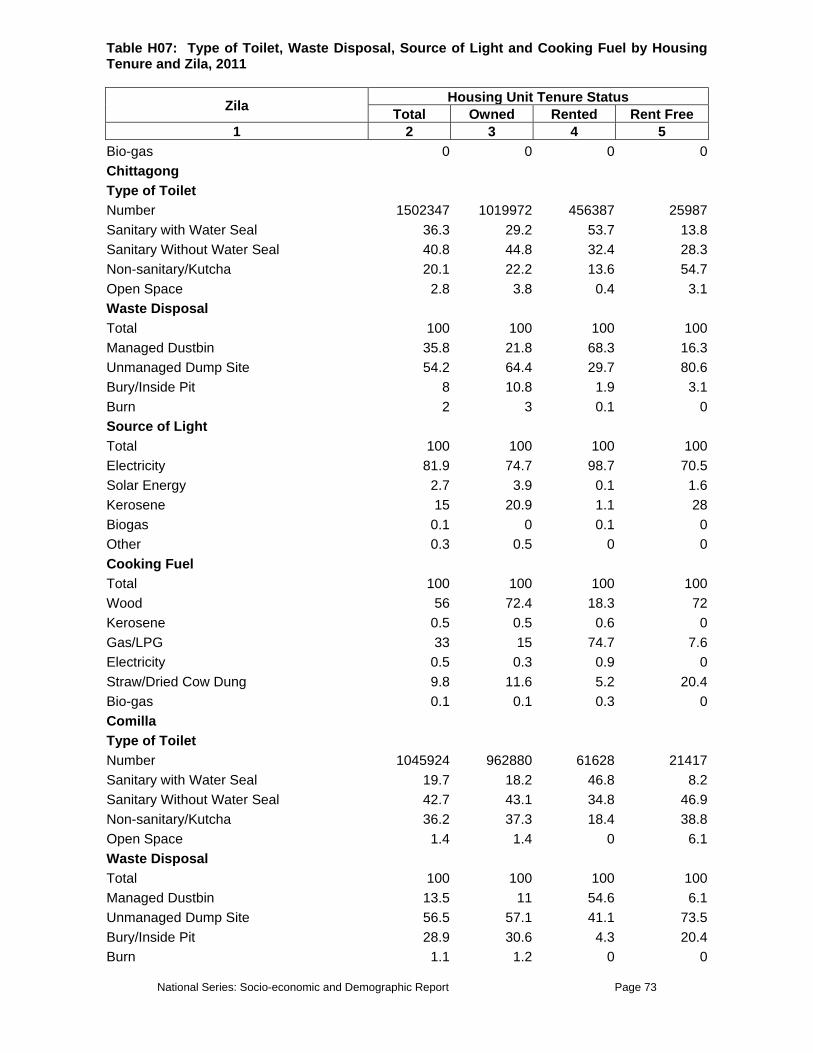
National Series: Socio-economic and Demographic Report Page 73
Table H07: Type of Toilet, Waste Disposal, Source of Light and Cooking Fuel by Housing Tenure and Zila, 2011
Zila Housing Unit Tenure Status Total Owned Rented Rent Free
1 2 3 4 5 Bio-gas 0 0 0 0Chittagong Type of Toilet Number 1502347 1019972 456387 25987Sanitary with Water Seal 36.3 29.2 53.7 13.8Sanitary Without Water Seal 40.8 44.8 32.4 28.3Non-sanitary/Kutcha 20.1 22.2 13.6 54.7Open Space 2.8 3.8 0.4 3.1Waste Disposal Total 100 100 100 100Managed Dustbin 35.8 21.8 68.3 16.3Unmanaged Dump Site 54.2 64.4 29.7 80.6Bury/Inside Pit 8 10.8 1.9 3.1Burn 2 3 0.1 0Source of Light Total 100 100 100 100Electricity 81.9 74.7 98.7 70.5Solar Energy 2.7 3.9 0.1 1.6Kerosene 15 20.9 1.1 28Biogas 0.1 0 0.1 0Other 0.3 0.5 0 0Cooking Fuel Total 100 100 100 100Wood 56 72.4 18.3 72Kerosene 0.5 0.5 0.6 0Gas/LPG 33 15 74.7 7.6Electricity 0.5 0.3 0.9 0Straw/Dried Cow Dung 9.8 11.6 5.2 20.4Bio-gas 0.1 0.1 0.3 0Comilla Type of Toilet Number 1045924 962880 61628 21417Sanitary with Water Seal 19.7 18.2 46.8 8.2Sanitary Without Water Seal 42.7 43.1 34.8 46.9Non-sanitary/Kutcha 36.2 37.3 18.4 38.8Open Space 1.4 1.4 0 6.1Waste Disposal Total 100 100 100 100Managed Dustbin 13.5 11 54.6 6.1Unmanaged Dump Site 56.5 57.1 41.1 73.5Bury/Inside Pit 28.9 30.6 4.3 20.4Burn 1.1 1.2 0 0

National Series: Socio-economic and Demographic Report Page 74
Table H07: Type of Toilet, Waste Disposal, Source of Light and Cooking Fuel by Housing Tenure and Zila, 2011
Zila Housing Unit Tenure Status Total Owned Rented Rent Free
1 2 3 4 5 Source of Light Total 100 100 100 100Electricity 76.7 75.9 97.2 53.1Solar Energy 1.9 2.1 0 0Kerosene 21.1 21.7 2.8 44.9Biogas 0.1 0 0 2Other 0.2 0.2 0 0Cooking Fuel Total 100 100 100 100Wood 32.2 34.3 3.5 20.4Kerosene 1.5 1.6 0 0Gas/LPG 11.2 6.9 79.4 10.2Electricity 0.3 0.3 0 0Straw/Dried Cow Dung 54.7 56.8 17 69.4Bio-gas 0.1 0.1 0 0Cox's Bazar Type of Toilet Number 410474 352253 21359 36862Sanitary with Water Seal 16.5 17 29 4.7Sanitary Without Water Seal 30.6 32.1 22.6 21Non-sanitary/Kutcha 37.3 38 21.8 39.7Open Space 15.5 12.8 26.6 34.6Waste Disposal Total 100 100 100 100Managed Dustbin 8 7.8 19.4 2.8Unmanaged Dump Site 59.5 58.4 41.1 80.4Bury/Inside Pit 25.2 25.9 33.1 14Burn 7.3 7.9 6.5 2.8Source of Light Total 100 100 100 100Electricity 35.8 35.6 73.4 15.9Solar Energy 3.4 3.9 0 0.9Kerosene 59.1 58.8 26.6 80.8Biogas 0.4 0.4 0 0.5Other 1.3 1.3 0 1.9Cooking Fuel Total 100 100 100 100Wood 76.5 76.1 72.6 82.2Kerosene 1.7 1.8 0.8 1.9Gas/LPG 3.5 3.1 15.3 0.9Electricity 0.6 0.5 4 0Straw/Dried Cow Dung 17.6 18.5 7.3 15
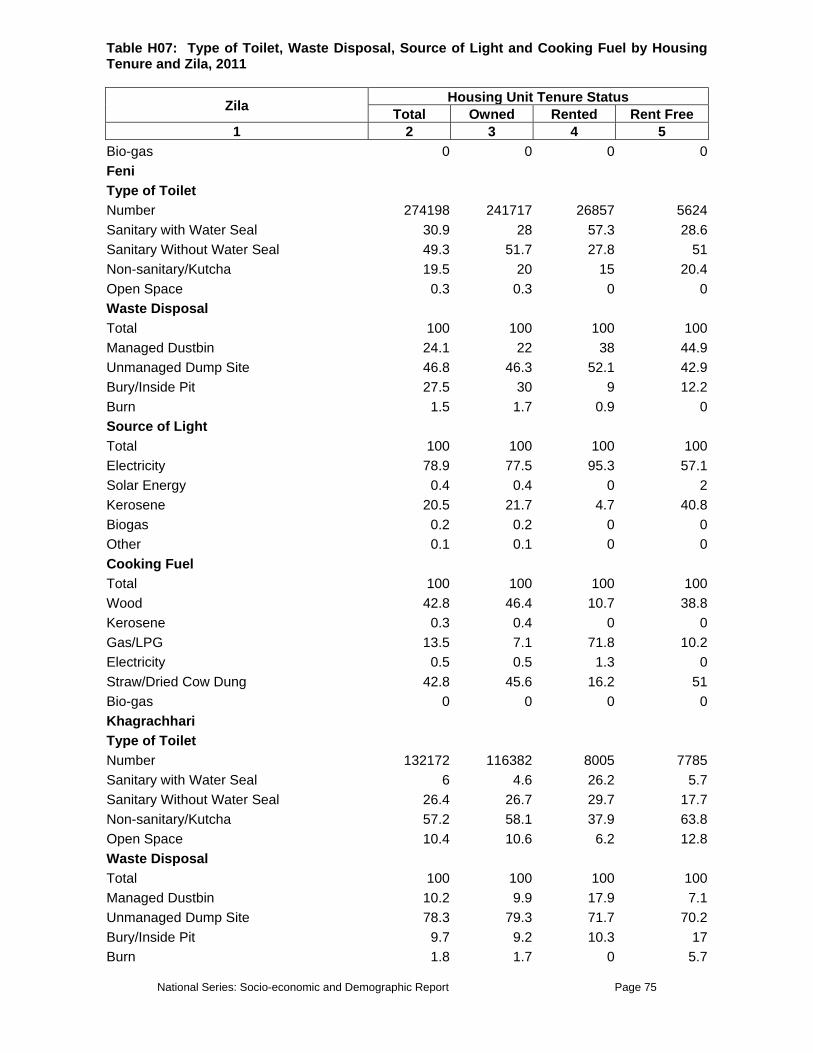
National Series: Socio-economic and Demographic Report Page 75
Table H07: Type of Toilet, Waste Disposal, Source of Light and Cooking Fuel by Housing Tenure and Zila, 2011
Zila Housing Unit Tenure Status Total Owned Rented Rent Free
1 2 3 4 5 Bio-gas 0 0 0 0Feni Type of Toilet Number 274198 241717 26857 5624Sanitary with Water Seal 30.9 28 57.3 28.6Sanitary Without Water Seal 49.3 51.7 27.8 51Non-sanitary/Kutcha 19.5 20 15 20.4Open Space 0.3 0.3 0 0Waste Disposal Total 100 100 100 100Managed Dustbin 24.1 22 38 44.9Unmanaged Dump Site 46.8 46.3 52.1 42.9Bury/Inside Pit 27.5 30 9 12.2Burn 1.5 1.7 0.9 0Source of Light Total 100 100 100 100Electricity 78.9 77.5 95.3 57.1Solar Energy 0.4 0.4 0 2Kerosene 20.5 21.7 4.7 40.8Biogas 0.2 0.2 0 0Other 0.1 0.1 0 0Cooking Fuel Total 100 100 100 100Wood 42.8 46.4 10.7 38.8Kerosene 0.3 0.4 0 0Gas/LPG 13.5 7.1 71.8 10.2Electricity 0.5 0.5 1.3 0Straw/Dried Cow Dung 42.8 45.6 16.2 51Bio-gas 0 0 0 0Khagrachhari Type of Toilet Number 132172 116382 8005 7785Sanitary with Water Seal 6 4.6 26.2 5.7Sanitary Without Water Seal 26.4 26.7 29.7 17.7Non-sanitary/Kutcha 57.2 58.1 37.9 63.8Open Space 10.4 10.6 6.2 12.8Waste Disposal Total 100 100 100 100Managed Dustbin 10.2 9.9 17.9 7.1Unmanaged Dump Site 78.3 79.3 71.7 70.2Bury/Inside Pit 9.7 9.2 10.3 17Burn 1.8 1.7 0 5.7
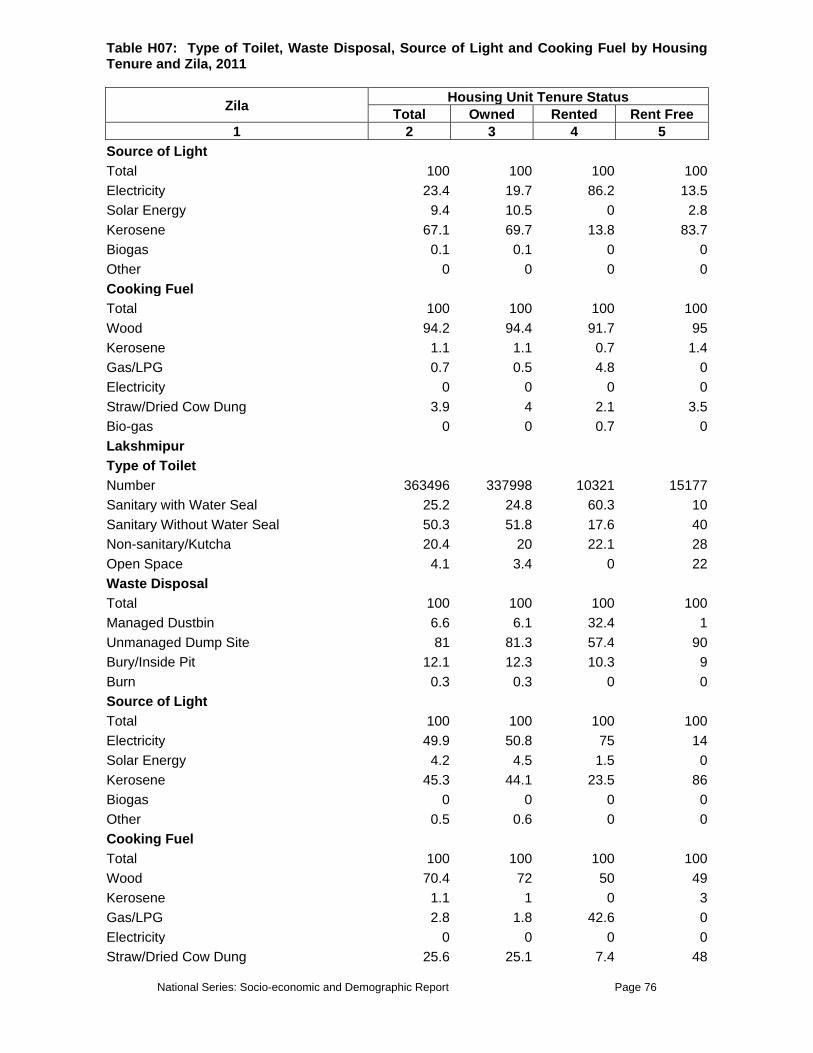
National Series: Socio-economic and Demographic Report Page 76
Table H07: Type of Toilet, Waste Disposal, Source of Light and Cooking Fuel by Housing Tenure and Zila, 2011
Zila Housing Unit Tenure Status Total Owned Rented Rent Free
1 2 3 4 5 Source of Light Total 100 100 100 100Electricity 23.4 19.7 86.2 13.5Solar Energy 9.4 10.5 0 2.8Kerosene 67.1 69.7 13.8 83.7Biogas 0.1 0.1 0 0Other 0 0 0 0Cooking Fuel Total 100 100 100 100Wood 94.2 94.4 91.7 95Kerosene 1.1 1.1 0.7 1.4Gas/LPG 0.7 0.5 4.8 0Electricity 0 0 0 0Straw/Dried Cow Dung 3.9 4 2.1 3.5Bio-gas 0 0 0.7 0Lakshmipur Type of Toilet Number 363496 337998 10321 15177Sanitary with Water Seal 25.2 24.8 60.3 10Sanitary Without Water Seal 50.3 51.8 17.6 40Non-sanitary/Kutcha 20.4 20 22.1 28Open Space 4.1 3.4 0 22Waste Disposal Total 100 100 100 100Managed Dustbin 6.6 6.1 32.4 1Unmanaged Dump Site 81 81.3 57.4 90Bury/Inside Pit 12.1 12.3 10.3 9Burn 0.3 0.3 0 0Source of Light Total 100 100 100 100Electricity 49.9 50.8 75 14Solar Energy 4.2 4.5 1.5 0Kerosene 45.3 44.1 23.5 86Biogas 0 0 0 0Other 0.5 0.6 0 0Cooking Fuel Total 100 100 100 100Wood 70.4 72 50 49Kerosene 1.1 1 0 3Gas/LPG 2.8 1.8 42.6 0Electricity 0 0 0 0Straw/Dried Cow Dung 25.6 25.1 7.4 48
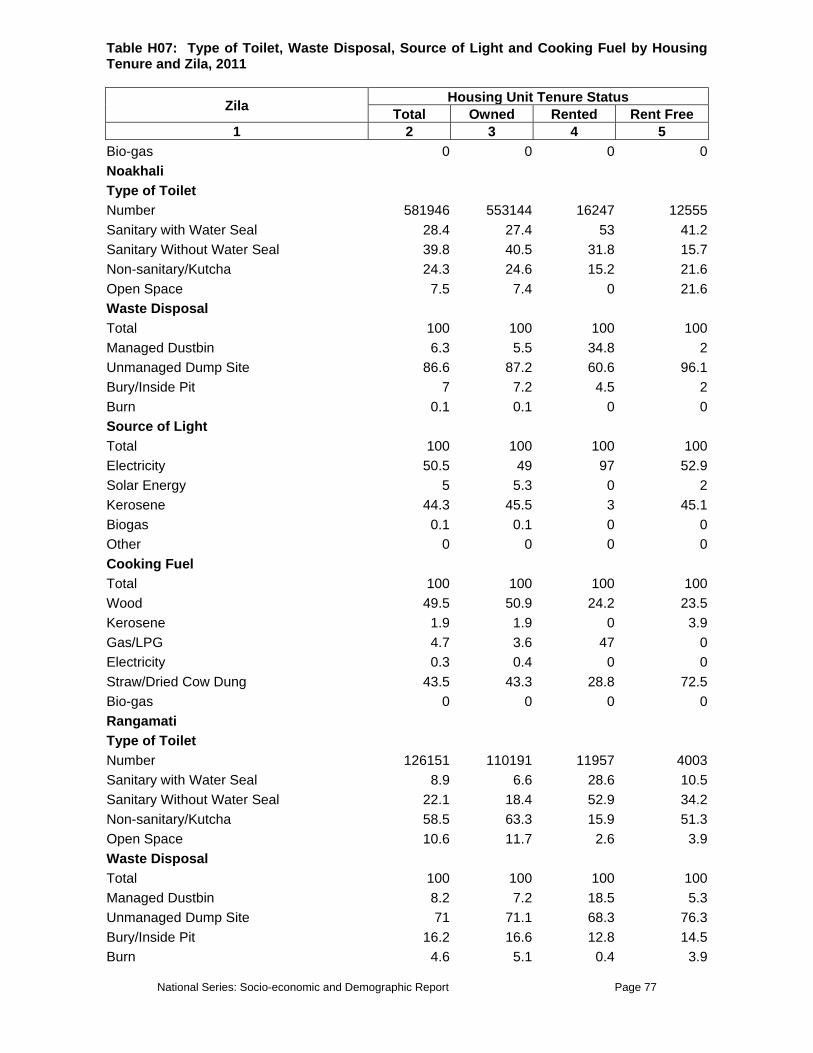
National Series: Socio-economic and Demographic Report Page 77
Table H07: Type of Toilet, Waste Disposal, Source of Light and Cooking Fuel by Housing Tenure and Zila, 2011
Zila Housing Unit Tenure Status Total Owned Rented Rent Free
1 2 3 4 5 Bio-gas 0 0 0 0Noakhali Type of Toilet Number 581946 553144 16247 12555Sanitary with Water Seal 28.4 27.4 53 41.2Sanitary Without Water Seal 39.8 40.5 31.8 15.7Non-sanitary/Kutcha 24.3 24.6 15.2 21.6Open Space 7.5 7.4 0 21.6Waste Disposal Total 100 100 100 100Managed Dustbin 6.3 5.5 34.8 2Unmanaged Dump Site 86.6 87.2 60.6 96.1Bury/Inside Pit 7 7.2 4.5 2Burn 0.1 0.1 0 0Source of Light Total 100 100 100 100Electricity 50.5 49 97 52.9Solar Energy 5 5.3 0 2Kerosene 44.3 45.5 3 45.1Biogas 0.1 0.1 0 0Other 0 0 0 0Cooking Fuel Total 100 100 100 100Wood 49.5 50.9 24.2 23.5Kerosene 1.9 1.9 0 3.9Gas/LPG 4.7 3.6 47 0Electricity 0.3 0.4 0 0Straw/Dried Cow Dung 43.5 43.3 28.8 72.5Bio-gas 0 0 0 0Rangamati Type of Toilet Number 126151 110191 11957 4003Sanitary with Water Seal 8.9 6.6 28.6 10.5Sanitary Without Water Seal 22.1 18.4 52.9 34.2Non-sanitary/Kutcha 58.5 63.3 15.9 51.3Open Space 10.6 11.7 2.6 3.9Waste Disposal Total 100 100 100 100Managed Dustbin 8.2 7.2 18.5 5.3Unmanaged Dump Site 71 71.1 68.3 76.3Bury/Inside Pit 16.2 16.6 12.8 14.5Burn 4.6 5.1 0.4 3.9
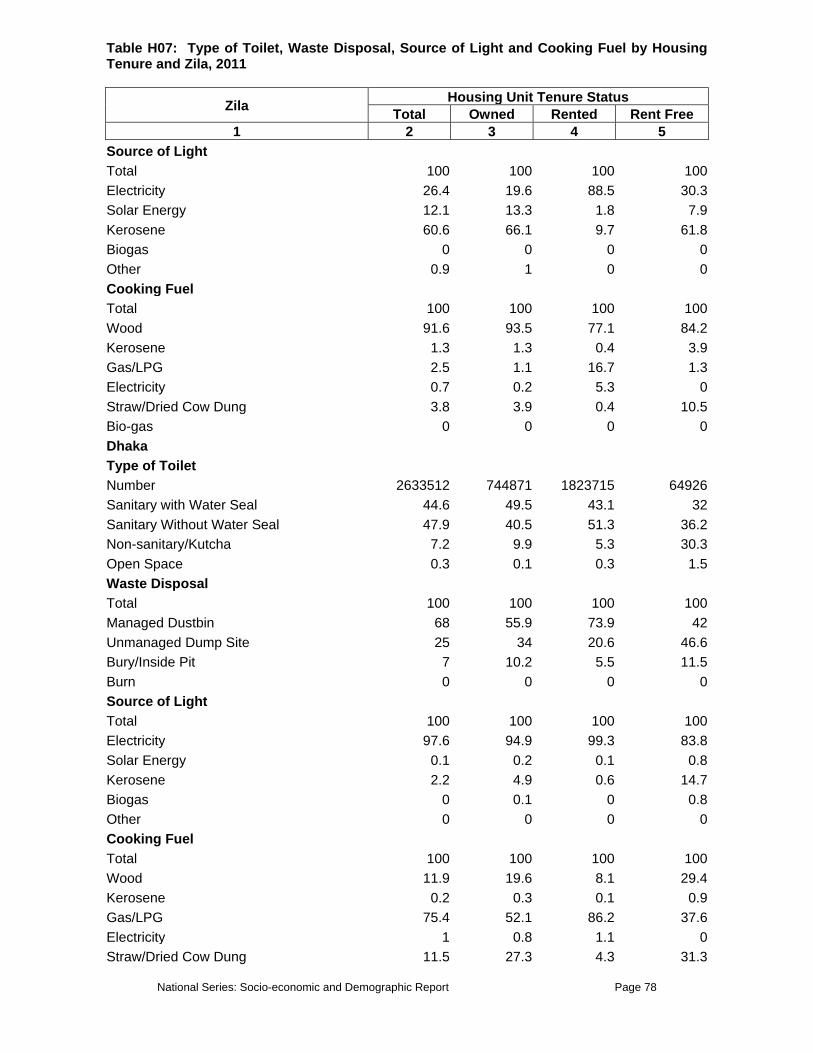
National Series: Socio-economic and Demographic Report Page 78
Table H07: Type of Toilet, Waste Disposal, Source of Light and Cooking Fuel by Housing Tenure and Zila, 2011
Zila Housing Unit Tenure Status Total Owned Rented Rent Free
1 2 3 4 5 Source of Light Total 100 100 100 100Electricity 26.4 19.6 88.5 30.3Solar Energy 12.1 13.3 1.8 7.9Kerosene 60.6 66.1 9.7 61.8Biogas 0 0 0 0Other 0.9 1 0 0Cooking Fuel Total 100 100 100 100Wood 91.6 93.5 77.1 84.2Kerosene 1.3 1.3 0.4 3.9Gas/LPG 2.5 1.1 16.7 1.3Electricity 0.7 0.2 5.3 0Straw/Dried Cow Dung 3.8 3.9 0.4 10.5Bio-gas 0 0 0 0Dhaka Type of Toilet Number 2633512 744871 1823715 64926Sanitary with Water Seal 44.6 49.5 43.1 32Sanitary Without Water Seal 47.9 40.5 51.3 36.2Non-sanitary/Kutcha 7.2 9.9 5.3 30.3Open Space 0.3 0.1 0.3 1.5Waste Disposal Total 100 100 100 100Managed Dustbin 68 55.9 73.9 42Unmanaged Dump Site 25 34 20.6 46.6Bury/Inside Pit 7 10.2 5.5 11.5Burn 0 0 0 0Source of Light Total 100 100 100 100Electricity 97.6 94.9 99.3 83.8Solar Energy 0.1 0.2 0.1 0.8Kerosene 2.2 4.9 0.6 14.7Biogas 0 0.1 0 0.8Other 0 0 0 0Cooking Fuel Total 100 100 100 100Wood 11.9 19.6 8.1 29.4Kerosene 0.2 0.3 0.1 0.9Gas/LPG 75.4 52.1 86.2 37.6Electricity 1 0.8 1.1 0Straw/Dried Cow Dung 11.5 27.3 4.3 31.3
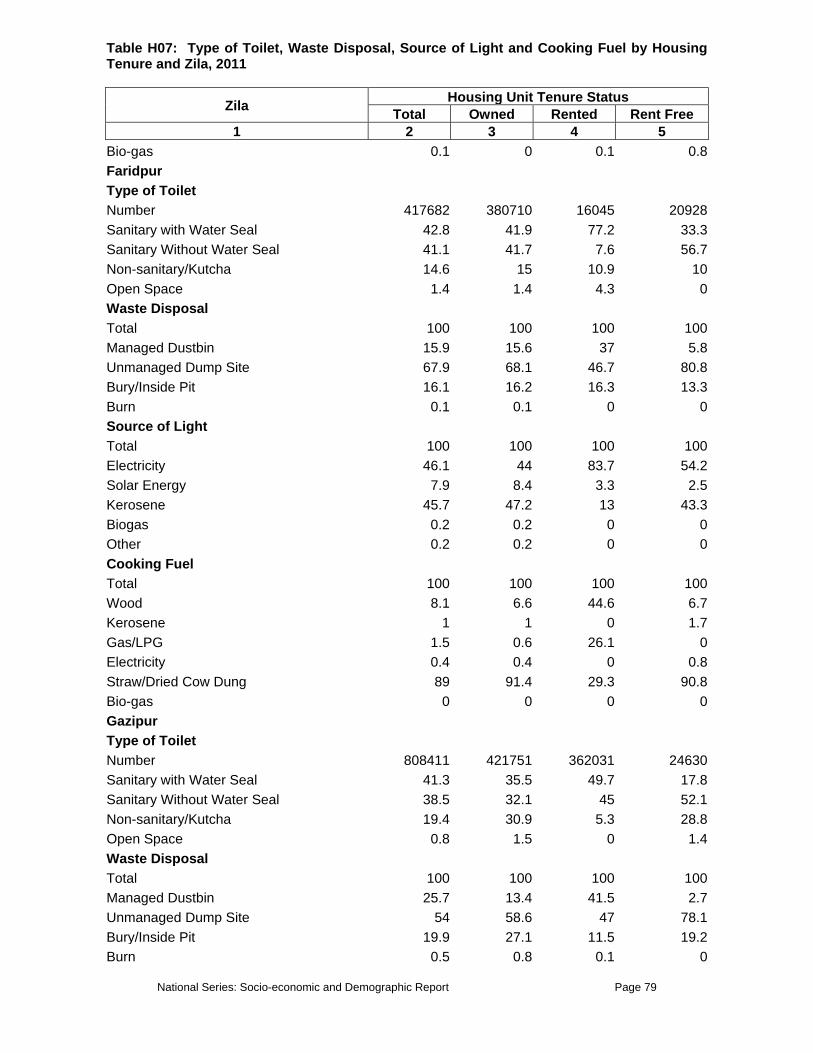
National Series: Socio-economic and Demographic Report Page 79
Table H07: Type of Toilet, Waste Disposal, Source of Light and Cooking Fuel by Housing Tenure and Zila, 2011
Zila Housing Unit Tenure Status Total Owned Rented Rent Free
1 2 3 4 5 Bio-gas 0.1 0 0.1 0.8Faridpur Type of Toilet Number 417682 380710 16045 20928Sanitary with Water Seal 42.8 41.9 77.2 33.3Sanitary Without Water Seal 41.1 41.7 7.6 56.7Non-sanitary/Kutcha 14.6 15 10.9 10Open Space 1.4 1.4 4.3 0Waste Disposal Total 100 100 100 100Managed Dustbin 15.9 15.6 37 5.8Unmanaged Dump Site 67.9 68.1 46.7 80.8Bury/Inside Pit 16.1 16.2 16.3 13.3Burn 0.1 0.1 0 0Source of Light Total 100 100 100 100Electricity 46.1 44 83.7 54.2Solar Energy 7.9 8.4 3.3 2.5Kerosene 45.7 47.2 13 43.3Biogas 0.2 0.2 0 0Other 0.2 0.2 0 0Cooking Fuel Total 100 100 100 100Wood 8.1 6.6 44.6 6.7Kerosene 1 1 0 1.7Gas/LPG 1.5 0.6 26.1 0Electricity 0.4 0.4 0 0.8Straw/Dried Cow Dung 89 91.4 29.3 90.8Bio-gas 0 0 0 0Gazipur Type of Toilet Number 808411 421751 362031 24630Sanitary with Water Seal 41.3 35.5 49.7 17.8Sanitary Without Water Seal 38.5 32.1 45 52.1Non-sanitary/Kutcha 19.4 30.9 5.3 28.8Open Space 0.8 1.5 0 1.4Waste Disposal Total 100 100 100 100Managed Dustbin 25.7 13.4 41.5 2.7Unmanaged Dump Site 54 58.6 47 78.1Bury/Inside Pit 19.9 27.1 11.5 19.2Burn 0.5 0.8 0.1 0
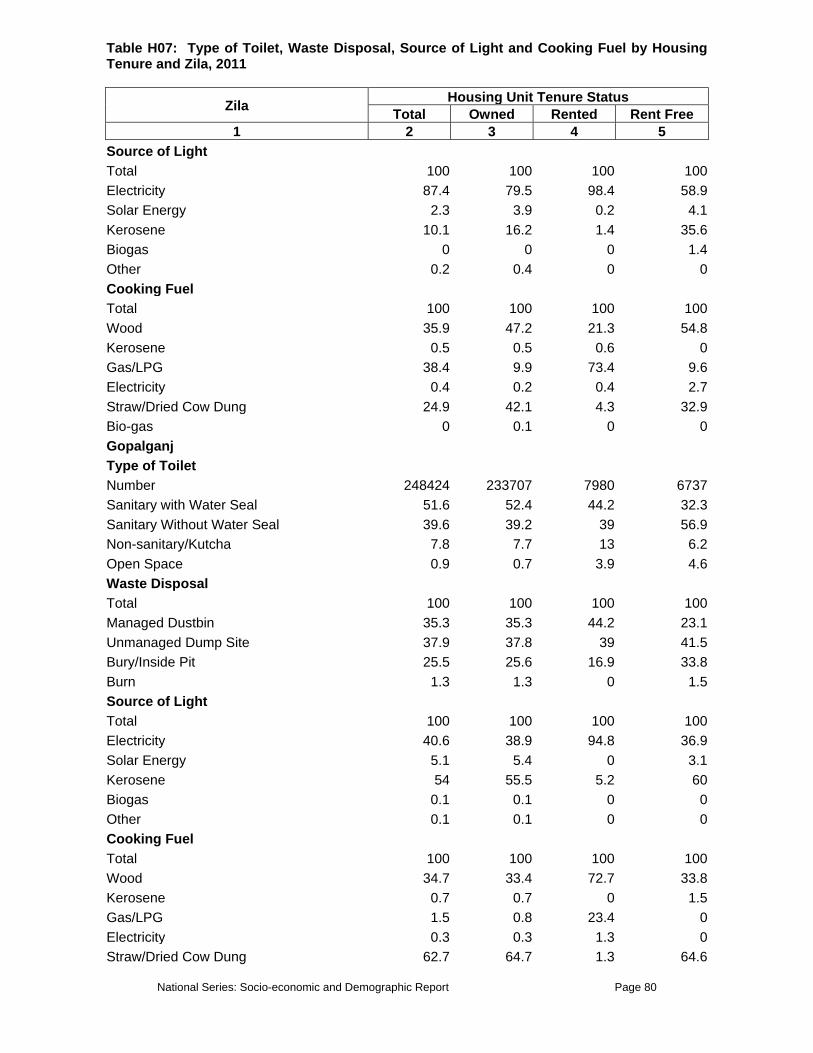
National Series: Socio-economic and Demographic Report Page 80
Table H07: Type of Toilet, Waste Disposal, Source of Light and Cooking Fuel by Housing Tenure and Zila, 2011
Zila Housing Unit Tenure Status Total Owned Rented Rent Free
1 2 3 4 5 Source of Light Total 100 100 100 100Electricity 87.4 79.5 98.4 58.9Solar Energy 2.3 3.9 0.2 4.1Kerosene 10.1 16.2 1.4 35.6Biogas 0 0 0 1.4Other 0.2 0.4 0 0Cooking Fuel Total 100 100 100 100Wood 35.9 47.2 21.3 54.8Kerosene 0.5 0.5 0.6 0Gas/LPG 38.4 9.9 73.4 9.6Electricity 0.4 0.2 0.4 2.7Straw/Dried Cow Dung 24.9 42.1 4.3 32.9Bio-gas 0 0.1 0 0Gopalganj Type of Toilet Number 248424 233707 7980 6737Sanitary with Water Seal 51.6 52.4 44.2 32.3Sanitary Without Water Seal 39.6 39.2 39 56.9Non-sanitary/Kutcha 7.8 7.7 13 6.2Open Space 0.9 0.7 3.9 4.6Waste Disposal Total 100 100 100 100Managed Dustbin 35.3 35.3 44.2 23.1Unmanaged Dump Site 37.9 37.8 39 41.5Bury/Inside Pit 25.5 25.6 16.9 33.8Burn 1.3 1.3 0 1.5Source of Light Total 100 100 100 100Electricity 40.6 38.9 94.8 36.9Solar Energy 5.1 5.4 0 3.1Kerosene 54 55.5 5.2 60Biogas 0.1 0.1 0 0Other 0.1 0.1 0 0Cooking Fuel Total 100 100 100 100Wood 34.7 33.4 72.7 33.8Kerosene 0.7 0.7 0 1.5Gas/LPG 1.5 0.8 23.4 0Electricity 0.3 0.3 1.3 0Straw/Dried Cow Dung 62.7 64.7 1.3 64.6

National Series: Socio-economic and Demographic Report Page 81
Table H07: Type of Toilet, Waste Disposal, Source of Light and Cooking Fuel by Housing Tenure and Zila, 2011
Zila Housing Unit Tenure Status Total Owned Rented Rent Free
1 2 3 4 5 Bio-gas 0 0 1.3 0Jamalpur Type of Toilet Number 561712 526575 7730 27406Sanitary with Water Seal 23.1 22.9 75.8 12.8Sanitary Without Water Seal 31.3 31.9 18.2 24.8Non-sanitary/Kutcha 35.6 35.6 6.1 43.6Open Space 10 9.7 0 18.8Waste Disposal Total 100 100 100 100Managed Dustbin 6.4 6.2 39.4 1.7Unmanaged Dump Site 37.8 37.2 36.4 48.7Bury/Inside Pit 55 55.7 24.2 49.6Burn 0.8 0.8 0 0Source of Light Total 100 100 100 100Electricity 37 36.7 90.9 28.2Solar Energy 4.2 4.5 0 0Kerosene 57 57.1 9.1 67.5Biogas 0.2 0.2 0 0Other 1.6 1.5 0 4.3Cooking Fuel Total 100 100 100 100Wood 23.5 23.5 69.7 11.1Kerosene 1.2 1.2 0 2.6Gas/LPG 1 0.8 18.2 0Electricity 0.4 0.4 3 0Straw/Dried Cow Dung 73.8 74.1 9.1 86.3Bio-gas 0.1 0.1 0 0Kishoreganj Type of Toilet Number 622614 566462 32755 23397Sanitary with Water Seal 12 10.2 46 6.7Sanitary Without Water Seal 33.7 34.2 33.3 21.1Non-sanitary/Kutcha 44.8 46 15.1 58.9Open Space 9.5 9.5 5.6 13.3Waste Disposal Total 100 100 100 100Managed Dustbin 11.9 11.6 20.6 7.8Unmanaged Dump Site 43.2 42.3 46.8 61.1Bury/Inside Pit 43.8 44.9 32.5 31.1Burn 1.1 1.2 0 0

National Series: Socio-economic and Demographic Report Page 82
Table H07: Type of Toilet, Waste Disposal, Source of Light and Cooking Fuel by Housing Tenure and Zila, 2011
Zila Housing Unit Tenure Status Total Owned Rented Rent Free
1 2 3 4 5 Source of Light Total 100 100 100 100Electricity 46.6 44.4 90.5 38.9Solar Energy 4.3 4.5 0.8 3.3Kerosene 44.9 46.5 7.1 57.8Biogas 0.1 0.1 0 0Other 4.1 4.5 1.6 0Cooking Fuel Total 100 100 100 100Wood 27.2 27.7 23.8 18.9Kerosene 1 0.9 2.4 2.2Gas/LPG 4.9 1.9 57.9 3.3Electricity 0.2 0.2 0 0Straw/Dried Cow Dung 66.6 69.2 15.9 75.6Bio-gas 0.1 0.1 0 0Madaripur Type of Toilet Number 251057 236067 13208 1782Sanitary with Water Seal 27 25.4 51.6 52.9Sanitary Without Water Seal 44.8 45.6 34.1 23.5Non-sanitary/Kutcha 27.7 28.5 13.5 23.5Open Space 0.5 0.5 0.8 0Waste Disposal Total 100 100 100 100Managed Dustbin 14.3 13.2 34.9 11.8Unmanaged Dump Site 60.9 61.4 50 70.6Bury/Inside Pit 23.7 24.3 13.5 17.6Burn 1.1 1.1 1.6 0Source of Light Total 100 100 100 100Electricity 57.7 56.3 88.1 23.5Solar Energy 7.1 7.3 3.2 5.9Kerosene 34.4 35.6 8.7 64.7Biogas 0.2 0.2 0 0Other 0.7 0.7 0 5.9Cooking Fuel Total 100 100 100 100Wood 39.7 38.9 54.8 23.5Kerosene 0.6 0.5 0 11.8Gas/LPG 1.2 0.3 18.3 0Electricity 0.2 0.2 0 0Straw/Dried Cow Dung 58.4 60.1 27 64.7

National Series: Socio-economic and Demographic Report Page 83
Table H07: Type of Toilet, Waste Disposal, Source of Light and Cooking Fuel by Housing Tenure and Zila, 2011
Zila Housing Unit Tenure Status Total Owned Rented Rent Free
1 2 3 4 5 Bio-gas 0 0 0 0Manikganj Type of Toilet Number 321583 300944 8633 12005Sanitary with Water Seal 19.1 19.1 32.8 9Sanitary Without Water Seal 40.4 40.4 34.4 43.8Non-sanitary/Kutcha 36.7 36.9 29.7 36Open Space 3.9 3.6 3.1 11.2Waste Disposal Total 100 100 100 100Managed Dustbin 6.9 6.5 15.6 11.2Unmanaged Dump Site 70.1 69.7 79.7 71.9Bury/Inside Pit 23.1 23.8 4.7 16.9Burn 0 0 0 0Source of Light Total 100 100 100 100Electricity 49.6 50.1 57.8 31.5Solar Energy 4 4 3.1 4.5Kerosene 44.9 44.4 39.1 62.9Biogas 0.7 0.8 0 0Other 0.7 0.7 0 1.1Cooking Fuel Total 100 100 100 100Wood 6 5.8 10.9 6.7Kerosene 0.5 0.5 1.6 0Gas/LPG 2.1 1 37.5 3.4Electricity 0.3 0.4 0 0Straw/Dried Cow Dung 91.1 92.3 50 88.8Bio-gas 0 0 0 1.1Munshiganj Type of Toilet Number 310146 247755 38056 24335Sanitary with Water Seal 20.4 20 25.9 16Sanitary Without Water Seal 64.4 63.8 66.3 66.5Non-sanitary/Kutcha 14 14.8 7.1 16.5Open Space 1.2 1.3 0.7 1.1Waste Disposal Total 100 100 100 100Managed Dustbin 10.9 8.5 27.2 9Unmanaged Dump Site 79.6 82.3 58.5 85.1Bury/Inside Pit 9.3 8.8 14.3 5.9Burn 0.3 0.3 0 0

National Series: Socio-economic and Demographic Report Page 84
Table H07: Type of Toilet, Waste Disposal, Source of Light and Cooking Fuel by Housing Tenure and Zila, 2011
Zila Housing Unit Tenure Status Total Owned Rented Rent Free
1 2 3 4 5 Source of Light Total 100 100 100 100Electricity 93.2 93.2 95.2 89.9Solar Energy 1.1 1.4 0 0.5Kerosene 5.2 4.8 4.8 9.6Biogas 0 0.1 0 0Other 0.5 0.6 0 0Cooking Fuel Total 100 100 100 100Wood 50.3 50.6 41.8 60.1Kerosene 0.1 0.1 0 0Gas/LPG 13.7 9.4 44.6 9Electricity 0.1 0.1 0.3 0.5Straw/Dried Cow Dung 35.9 39.9 13.3 30.3Bio-gas 0 0 0 0Mymensingh Type of Toilet Number 1149136 1042708 44585 61843Sanitary with Water Seal 16.7 15.2 72 3.1Sanitary Without Water Seal 27.3 27.3 22.6 31Non-sanitary/Kutcha 44.2 45.5 5.4 50.4Open Space 11.8 12.1 0 15.5Waste Disposal Total 100 100 100 100Managed Dustbin 17.8 16.6 58.1 9.3Unmanaged Dump Site 59.6 59.9 32.3 74.4Bury/Inside Pit 22.4 23.3 9.7 16.3Burn 0.2 0.2 0 0Source of Light Total 100 100 100 100Electricity 42.3 39.6 96.8 48.8Solar Energy 3.2 3.5 0 0Kerosene 52.3 54.6 3.2 48.8Biogas 0.2 0.2 0 0Other 2 2.1 0 2.3Cooking Fuel Total 100 100 100 100Wood 54.5 56.3 26.9 44.2Kerosene 1.6 1.6 0 3.1Gas/LPG 5 2.5 69.9 0.8Electricity 0.6 0.5 2.2 0.8Straw/Dried Cow Dung 38.3 39.2 1.1 51.2

National Series: Socio-economic and Demographic Report Page 85
Table H07: Type of Toilet, Waste Disposal, Source of Light and Cooking Fuel by Housing Tenure and Zila, 2011
Zila Housing Unit Tenure Status Total Owned Rented Rent Free
1 2 3 4 5 Bio-gas 0 0 0 0Narayanganj Type of Toilet Number 618606 360830 230423 27352Sanitary with Water Seal 22.3 15.7 32.5 23.2Sanitary Without Water Seal 42.7 39.6 49 30.3Non-sanitary/Kutcha 32.7 40.9 18.5 44.4Open Space 2.3 3.8 0 2Waste Disposal Total 100 100 100 100Managed Dustbin 15.3 6.1 30.6 7.1Unmanaged Dump Site 76.9 85.1 62.7 88.9Bury/Inside Pit 6.7 7.4 6 4Burn 1.1 1.5 0.7 0Source of Light Total 100 100 100 100Electricity 95.9 93.6 99.8 93.9Solar Energy 0.1 0.1 0.1 1Kerosene 3.8 6.1 0.1 4Biogas 0 0.1 0 0Other 0.1 0.1 0 1Cooking Fuel Total 100 100 100 100Wood 27.9 38.3 11.5 29.3Kerosene 0.5 0.3 0.6 3Gas/LPG 46.8 25.6 81.4 35.4Electricity 1.2 0.9 1.8 0Straw/Dried Cow Dung 23.4 34.8 4.7 32.3Bio-gas 0.1 0.2 0 0Narsingdi Type of Toilet Number 472950 388233 53120 31596Sanitary with Water Seal 22.1 20.4 37.2 16.9Sanitary Without Water Seal 34.4 34 35.7 36.9Non-sanitary/Kutcha 38.2 39.7 26.4 38.7Open Space 5.4 5.8 0.7 7.5Waste Disposal Total 100 100 100 100Managed Dustbin 19.4 15.7 49.8 13.7Unmanaged Dump Site 59.2 62.8 30.9 63.7Bury/Inside Pit 21.3 21.5 19.3 22.5Burn 0 0.1 0 0
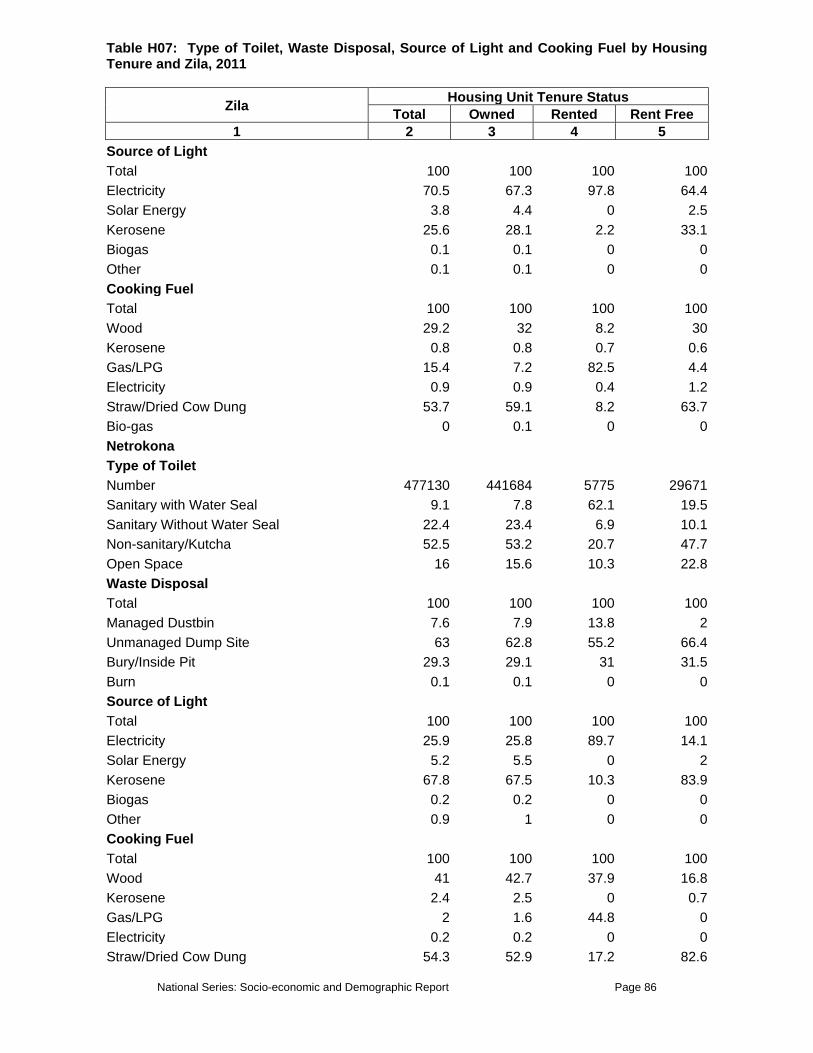
National Series: Socio-economic and Demographic Report Page 86
Table H07: Type of Toilet, Waste Disposal, Source of Light and Cooking Fuel by Housing Tenure and Zila, 2011
Zila Housing Unit Tenure Status Total Owned Rented Rent Free
1 2 3 4 5 Source of Light Total 100 100 100 100Electricity 70.5 67.3 97.8 64.4Solar Energy 3.8 4.4 0 2.5Kerosene 25.6 28.1 2.2 33.1Biogas 0.1 0.1 0 0Other 0.1 0.1 0 0Cooking Fuel Total 100 100 100 100Wood 29.2 32 8.2 30Kerosene 0.8 0.8 0.7 0.6Gas/LPG 15.4 7.2 82.5 4.4Electricity 0.9 0.9 0.4 1.2Straw/Dried Cow Dung 53.7 59.1 8.2 63.7Bio-gas 0 0.1 0 0Netrokona Type of Toilet Number 477130 441684 5775 29671Sanitary with Water Seal 9.1 7.8 62.1 19.5Sanitary Without Water Seal 22.4 23.4 6.9 10.1Non-sanitary/Kutcha 52.5 53.2 20.7 47.7Open Space 16 15.6 10.3 22.8Waste Disposal Total 100 100 100 100Managed Dustbin 7.6 7.9 13.8 2Unmanaged Dump Site 63 62.8 55.2 66.4Bury/Inside Pit 29.3 29.1 31 31.5Burn 0.1 0.1 0 0Source of Light Total 100 100 100 100Electricity 25.9 25.8 89.7 14.1Solar Energy 5.2 5.5 0 2Kerosene 67.8 67.5 10.3 83.9Biogas 0.2 0.2 0 0Other 0.9 1 0 0Cooking Fuel Total 100 100 100 100Wood 41 42.7 37.9 16.8Kerosene 2.4 2.5 0 0.7Gas/LPG 2 1.6 44.8 0Electricity 0.2 0.2 0 0Straw/Dried Cow Dung 54.3 52.9 17.2 82.6

National Series: Socio-economic and Demographic Report Page 87
Table H07: Type of Toilet, Waste Disposal, Source of Light and Cooking Fuel by Housing Tenure and Zila, 2011
Zila Housing Unit Tenure Status Total Owned Rented Rent Free
1 2 3 4 5 Bio-gas 0 0 0 0Rajbari Type of Toilet Number 236462 204419 13054 18988Sanitary with Water Seal 40.9 40.4 53 38Sanitary Without Water Seal 38.5 40.5 14.4 33.9Non-sanitary/Kutcha 17 16.3 22.7 21.4Open Space 3.5 2.8 9.8 6.8Waste Disposal Total 100 100 100 100Managed Dustbin 7.6 7.6 12.9 4.2Unmanaged Dump Site 72.3 72.7 50.8 82.8Bury/Inside Pit 20 19.6 36.4 13Burn 0.1 0.1 0 0Source of Light Total 100 100 100 100Electricity 49.6 49 63.6 45.8Solar Energy 1.3 1.4 0.8 1.6Kerosene 48.8 49.3 34.8 52.1Biogas 0.3 0.3 0.8 0Other 0 0 0 0.5Cooking Fuel Total 100 100 100 100Wood 11 9.4 45.5 4.2Kerosene 0.9 0.8 2.3 1Gas/LPG 0.7 0.3 8.3 0Electricity 0.2 0.1 0.8 0.5Straw/Dried Cow Dung 87.1 89.3 43.2 93.8Bio-gas 0.1 0.1 0 0.5Shariatpur Type of Toilet Number 245816 226504 10067 9245Sanitary with Water Seal 32.5 32.7 50 8.9Sanitary Without Water Seal 48.1 49.4 22.4 43.3Non-sanitary/Kutcha 18.5 17 27.6 44.4Open Space 1 0.9 0 3.3Waste Disposal Total 100 100 100 100Managed Dustbin 25.4 25.4 33.7 16.7Unmanaged Dump Site 44 44.1 29.6 58.9Bury/Inside Pit 30.2 30.2 36.7 21.1Burn 0.3 0.2 0 3.3

National Series: Socio-economic and Demographic Report Page 88
Table H07: Type of Toilet, Waste Disposal, Source of Light and Cooking Fuel by Housing Tenure and Zila, 2011
Zila Housing Unit Tenure Status Total Owned Rented Rent Free
1 2 3 4 5 Source of Light Total 100 100 100 100Electricity 36.7 35.8 72.4 18.9Solar Energy 17.5 18.3 10.2 6.7Kerosene 42.8 42.9 17.3 68.9Biogas 0.3 0.3 0 1.1Other 2.6 2.7 0 4.4Cooking Fuel Total 100 100 100 100Wood 23.4 22.4 55.1 15.6Kerosene 1.3 1.3 1 1.1Gas/LPG 0.3 0.1 5.1 0Electricity 0.3 0.3 1 0Straw/Dried Cow Dung 74.6 75.9 37.8 83.3Bio-gas 0 0 0 0Sherpur Type of Toilet Number 340343 324298 1562 14483Sanitary with Water Seal 15.3 15.1 45.5 15.7Sanitary Without Water Seal 40.1 40.8 27.3 26.5Non-sanitary/Kutcha 39.5 39.3 18.2 48Open Space 5 4.8 9.1 9.8Waste Disposal Total 100 100 100 100Managed Dustbin 3.6 3.7 0 2Unmanaged Dump Site 83.3 83.2 90.9 84.3Bury/Inside Pit 13 13 9.1 13.7Burn 0.1 0.1 0 0Source of Light Total 100 100 100 100Electricity 46.4 46.5 90.9 39.2Solar Energy 2.3 2.4 0 0Kerosene 51.2 51 9.1 60.8Biogas 0.1 0.1 0 0Other 0 0 0 0Cooking Fuel Total 100 100 100 100Wood 44.6 45.3 54.5 27.5Kerosene 0.7 0.7 9.1 0Gas/LPG 0.1 0.1 0 1Electricity 0.1 0.1 0 0Straw/Dried Cow Dung 54.3 53.7 36.4 70.6
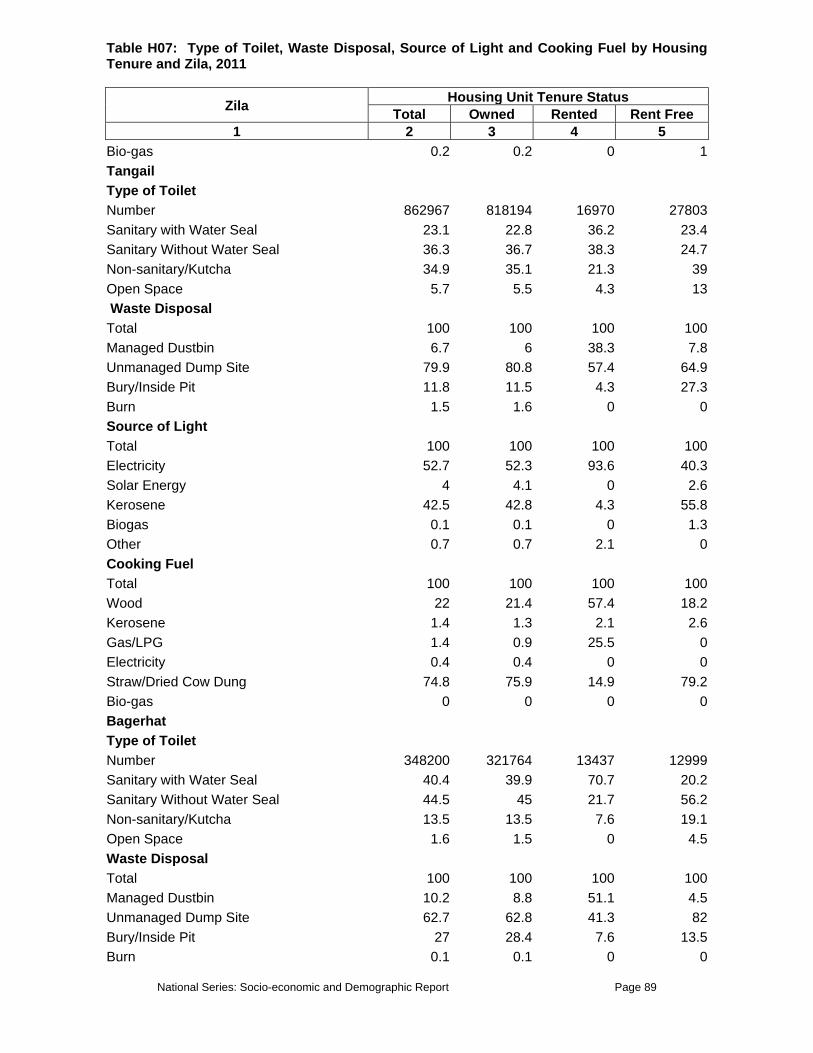
National Series: Socio-economic and Demographic Report Page 89
Table H07: Type of Toilet, Waste Disposal, Source of Light and Cooking Fuel by Housing Tenure and Zila, 2011
Zila Housing Unit Tenure Status Total Owned Rented Rent Free
1 2 3 4 5 Bio-gas 0.2 0.2 0 1Tangail Type of Toilet Number 862967 818194 16970 27803Sanitary with Water Seal 23.1 22.8 36.2 23.4Sanitary Without Water Seal 36.3 36.7 38.3 24.7Non-sanitary/Kutcha 34.9 35.1 21.3 39Open Space 5.7 5.5 4.3 13 Waste Disposal Total 100 100 100 100Managed Dustbin 6.7 6 38.3 7.8Unmanaged Dump Site 79.9 80.8 57.4 64.9Bury/Inside Pit 11.8 11.5 4.3 27.3Burn 1.5 1.6 0 0Source of Light Total 100 100 100 100Electricity 52.7 52.3 93.6 40.3Solar Energy 4 4.1 0 2.6Kerosene 42.5 42.8 4.3 55.8Biogas 0.1 0.1 0 1.3Other 0.7 0.7 2.1 0Cooking Fuel Total 100 100 100 100Wood 22 21.4 57.4 18.2Kerosene 1.4 1.3 2.1 2.6Gas/LPG 1.4 0.9 25.5 0Electricity 0.4 0.4 0 0Straw/Dried Cow Dung 74.8 75.9 14.9 79.2Bio-gas 0 0 0 0Bagerhat Type of Toilet Number 348200 321764 13437 12999Sanitary with Water Seal 40.4 39.9 70.7 20.2Sanitary Without Water Seal 44.5 45 21.7 56.2Non-sanitary/Kutcha 13.5 13.5 7.6 19.1Open Space 1.6 1.5 0 4.5Waste Disposal Total 100 100 100 100Managed Dustbin 10.2 8.8 51.1 4.5Unmanaged Dump Site 62.7 62.8 41.3 82Bury/Inside Pit 27 28.4 7.6 13.5Burn 0.1 0.1 0 0
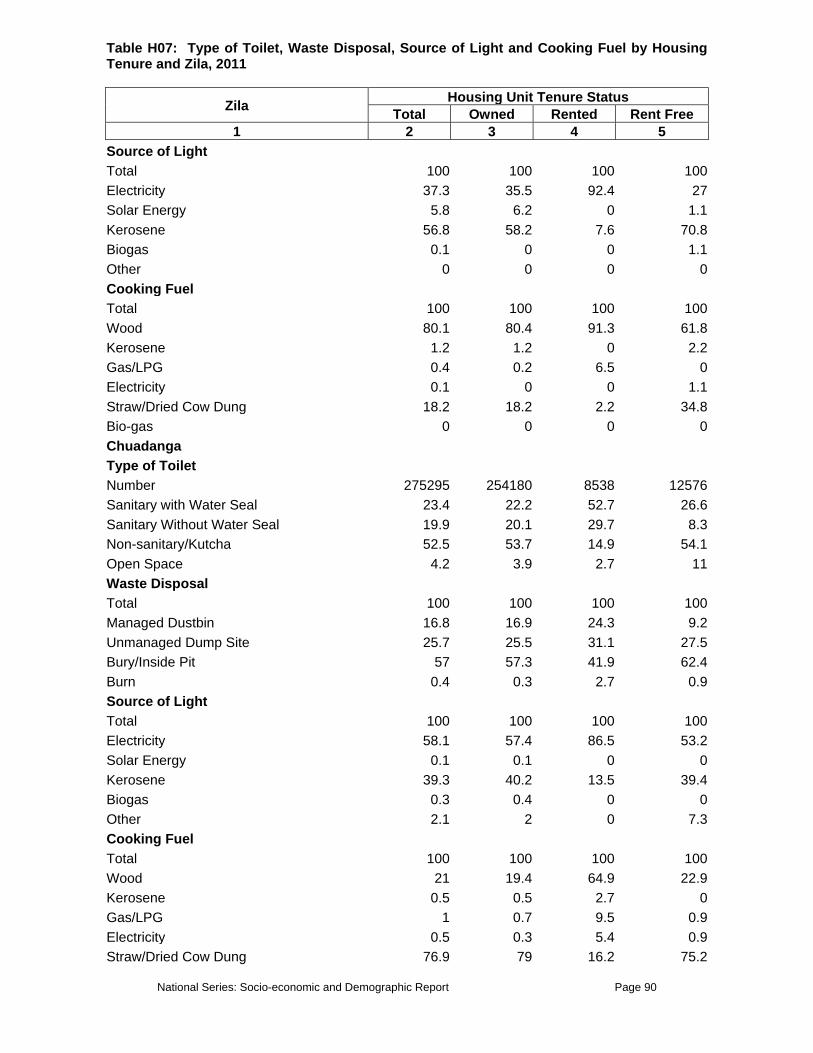
National Series: Socio-economic and Demographic Report Page 90
Table H07: Type of Toilet, Waste Disposal, Source of Light and Cooking Fuel by Housing Tenure and Zila, 2011
Zila Housing Unit Tenure Status Total Owned Rented Rent Free
1 2 3 4 5 Source of Light Total 100 100 100 100Electricity 37.3 35.5 92.4 27Solar Energy 5.8 6.2 0 1.1Kerosene 56.8 58.2 7.6 70.8Biogas 0.1 0 0 1.1Other 0 0 0 0Cooking Fuel Total 100 100 100 100Wood 80.1 80.4 91.3 61.8Kerosene 1.2 1.2 0 2.2Gas/LPG 0.4 0.2 6.5 0Electricity 0.1 0 0 1.1Straw/Dried Cow Dung 18.2 18.2 2.2 34.8Bio-gas 0 0 0 0Chuadanga Type of Toilet Number 275295 254180 8538 12576Sanitary with Water Seal 23.4 22.2 52.7 26.6Sanitary Without Water Seal 19.9 20.1 29.7 8.3Non-sanitary/Kutcha 52.5 53.7 14.9 54.1Open Space 4.2 3.9 2.7 11Waste Disposal Total 100 100 100 100Managed Dustbin 16.8 16.9 24.3 9.2Unmanaged Dump Site 25.7 25.5 31.1 27.5Bury/Inside Pit 57 57.3 41.9 62.4Burn 0.4 0.3 2.7 0.9Source of Light Total 100 100 100 100Electricity 58.1 57.4 86.5 53.2Solar Energy 0.1 0.1 0 0Kerosene 39.3 40.2 13.5 39.4Biogas 0.3 0.4 0 0Other 2.1 2 0 7.3Cooking Fuel Total 100 100 100 100Wood 21 19.4 64.9 22.9Kerosene 0.5 0.5 2.7 0Gas/LPG 1 0.7 9.5 0.9Electricity 0.5 0.3 5.4 0.9Straw/Dried Cow Dung 76.9 79 16.2 75.2

National Series: Socio-economic and Demographic Report Page 91
Table H07: Type of Toilet, Waste Disposal, Source of Light and Cooking Fuel by Housing Tenure and Zila, 2011
Zila Housing Unit Tenure Status Total Owned Rented Rent Free
1 2 3 4 5 Bio-gas 0.1 0.1 1.4 0Jessore Type of Toilet Number 652878 518927 62347 71604Sanitary with Water Seal 34.6 33.5 55 25.1Sanitary Without Water Seal 33.4 33.7 28.4 36.1Non-sanitary/Kutcha 29.6 30.5 16.6 34.6Open Space 2.3 2.3 0 4.2Waste Disposal Total 100 100 100 100Managed Dustbin 30.9 30.9 36.2 26.2Unmanaged Dump Site 35.4 33.7 41 43Bury/Inside Pit 33.4 35 22.3 30.8Burn 0.3 0.4 0.4 0Source of Light Total 100 100 100 100Electricity 65.8 63.7 89.5 60.1Solar Energy 0.6 0.8 0 0Kerosene 33.6 35.5 10.5 39.9Biogas 0 0.1 0 0Other 0 0 0 0Cooking Fuel Total 100 100 100 100Wood 52.4 52.2 60.7 46.8Kerosene 1.3 0.4 9.6 0.8Gas/LPG 2.6 1.5 14.8 0.4Electricity 0.2 0.1 1.3 0Straw/Dried Cow Dung 43.4 45.9 13.5 51.7Bio-gas 0.1 0.1 0 0.4Jhenaidah Type of Toilet Number 417438 384261 14570 18607Sanitary with Water Seal 30.1 28.8 75.9 20.8Sanitary Without Water Seal 25 25.8 15.7 15.1Non-sanitary/Kutcha 42.1 42.7 8.4 57.5Open Space 2.8 2.7 0 6.6Waste Disposal Total 100 100 100 100Managed Dustbin 21.3 20.3 63.9 8.5Unmanaged Dump Site 26.9 27.1 16.9 30.2Bury/Inside Pit 51.8 52.6 19.3 61.3Burn 0 0 0 0
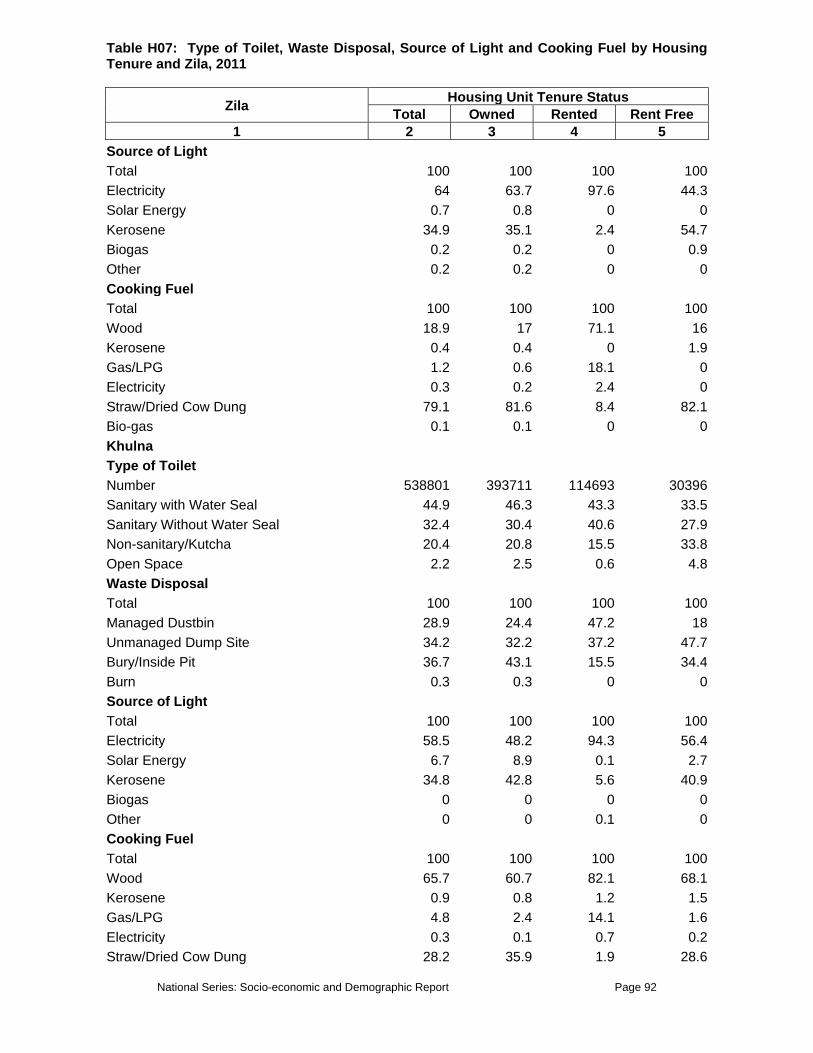
National Series: Socio-economic and Demographic Report Page 92
Table H07: Type of Toilet, Waste Disposal, Source of Light and Cooking Fuel by Housing Tenure and Zila, 2011
Zila Housing Unit Tenure Status Total Owned Rented Rent Free
1 2 3 4 5 Source of Light Total 100 100 100 100Electricity 64 63.7 97.6 44.3Solar Energy 0.7 0.8 0 0Kerosene 34.9 35.1 2.4 54.7Biogas 0.2 0.2 0 0.9Other 0.2 0.2 0 0Cooking Fuel Total 100 100 100 100Wood 18.9 17 71.1 16Kerosene 0.4 0.4 0 1.9Gas/LPG 1.2 0.6 18.1 0Electricity 0.3 0.2 2.4 0Straw/Dried Cow Dung 79.1 81.6 8.4 82.1Bio-gas 0.1 0.1 0 0Khulna Type of Toilet Number 538801 393711 114693 30396Sanitary with Water Seal 44.9 46.3 43.3 33.5Sanitary Without Water Seal 32.4 30.4 40.6 27.9Non-sanitary/Kutcha 20.4 20.8 15.5 33.8Open Space 2.2 2.5 0.6 4.8Waste Disposal Total 100 100 100 100Managed Dustbin 28.9 24.4 47.2 18Unmanaged Dump Site 34.2 32.2 37.2 47.7Bury/Inside Pit 36.7 43.1 15.5 34.4Burn 0.3 0.3 0 0Source of Light Total 100 100 100 100Electricity 58.5 48.2 94.3 56.4Solar Energy 6.7 8.9 0.1 2.7Kerosene 34.8 42.8 5.6 40.9Biogas 0 0 0 0Other 0 0 0.1 0Cooking Fuel Total 100 100 100 100Wood 65.7 60.7 82.1 68.1Kerosene 0.9 0.8 1.2 1.5Gas/LPG 4.8 2.4 14.1 1.6Electricity 0.3 0.1 0.7 0.2Straw/Dried Cow Dung 28.2 35.9 1.9 28.6
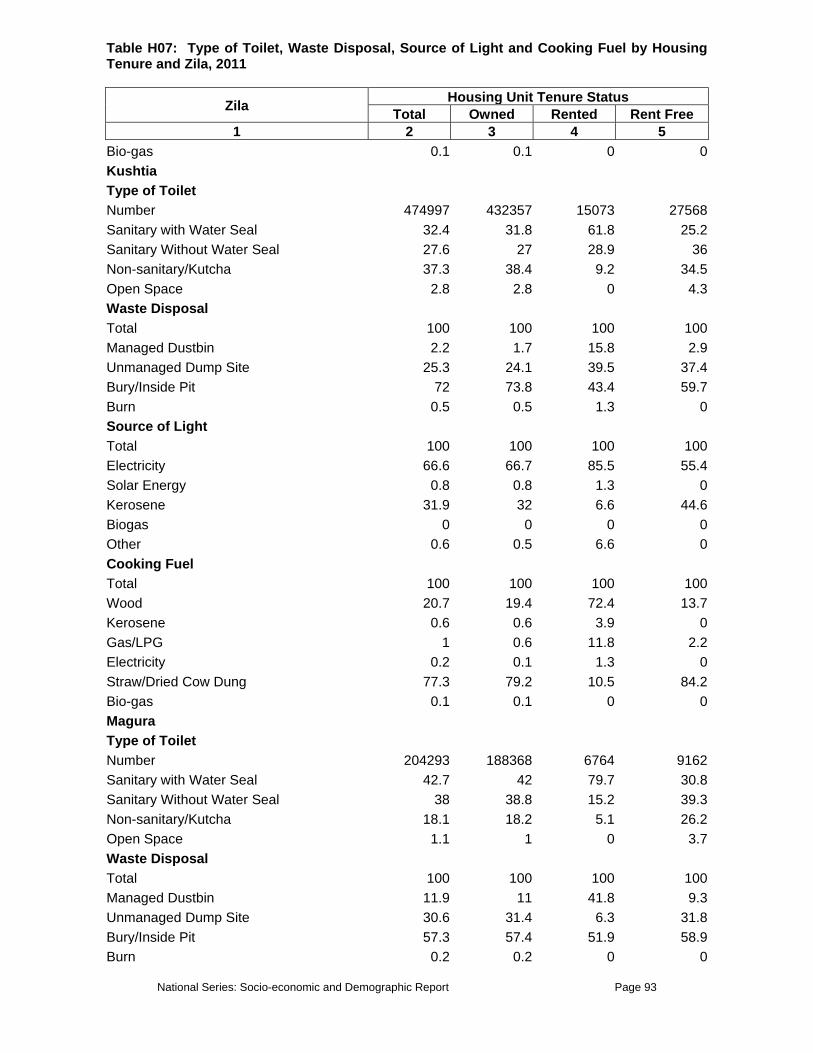
National Series: Socio-economic and Demographic Report Page 93
Table H07: Type of Toilet, Waste Disposal, Source of Light and Cooking Fuel by Housing Tenure and Zila, 2011
Zila Housing Unit Tenure Status Total Owned Rented Rent Free
1 2 3 4 5 Bio-gas 0.1 0.1 0 0Kushtia Type of Toilet Number 474997 432357 15073 27568Sanitary with Water Seal 32.4 31.8 61.8 25.2Sanitary Without Water Seal 27.6 27 28.9 36Non-sanitary/Kutcha 37.3 38.4 9.2 34.5Open Space 2.8 2.8 0 4.3Waste Disposal Total 100 100 100 100Managed Dustbin 2.2 1.7 15.8 2.9Unmanaged Dump Site 25.3 24.1 39.5 37.4Bury/Inside Pit 72 73.8 43.4 59.7Burn 0.5 0.5 1.3 0Source of Light Total 100 100 100 100Electricity 66.6 66.7 85.5 55.4Solar Energy 0.8 0.8 1.3 0Kerosene 31.9 32 6.6 44.6Biogas 0 0 0 0Other 0.6 0.5 6.6 0Cooking Fuel Total 100 100 100 100Wood 20.7 19.4 72.4 13.7Kerosene 0.6 0.6 3.9 0Gas/LPG 1 0.6 11.8 2.2Electricity 0.2 0.1 1.3 0Straw/Dried Cow Dung 77.3 79.2 10.5 84.2Bio-gas 0.1 0.1 0 0Magura Type of Toilet Number 204293 188368 6764 9162Sanitary with Water Seal 42.7 42 79.7 30.8Sanitary Without Water Seal 38 38.8 15.2 39.3Non-sanitary/Kutcha 18.1 18.2 5.1 26.2Open Space 1.1 1 0 3.7Waste Disposal Total 100 100 100 100Managed Dustbin 11.9 11 41.8 9.3Unmanaged Dump Site 30.6 31.4 6.3 31.8Bury/Inside Pit 57.3 57.4 51.9 58.9Burn 0.2 0.2 0 0

National Series: Socio-economic and Demographic Report Page 94
Table H07: Type of Toilet, Waste Disposal, Source of Light and Cooking Fuel by Housing Tenure and Zila, 2011
Zila Housing Unit Tenure Status Total Owned Rented Rent Free
1 2 3 4 5 Source of Light Total 100 100 100 100Electricity 47.4 46.1 92.4 40.2Solar Energy 0.8 0.8 0 0.9Kerosene 51.9 53.1 7.6 58.9Biogas 0 0 0 0Other 0 0 0 0Cooking Fuel Total 100 100 100 100Wood 16.3 15 60.8 11.2Kerosene 0.6 0.6 1.3 0.9Gas/LPG 1.5 0.7 24.1 0Electricity 0.2 0.2 0 0Straw/Dried Cow Dung 81.3 83.5 13.9 87.9Bio-gas 0 0 0 0Meherpur Type of Toilet Number 165697 141977 2006 21715Sanitary with Water Seal 22.2 21.8 75.9 19.4Sanitary Without Water Seal 14.9 14.7 6.9 16.9Non-sanitary/Kutcha 59.2 60 17.2 57.6Open Space 3.8 3.5 0 6.1Waste Disposal Total 100 100 100 100Managed Dustbin 15.4 15.6 6.9 15.3Unmanaged Dump Site 31.8 32.1 58.6 27.4Bury/Inside Pit 52.8 52.3 34.5 57.3Burn 0 0 0 0Source of Light Total 100 100 100 100Electricity 68.7 68.9 89.7 65.6Solar Energy 0 0 0 0Kerosene 31.1 30.8 10.3 34.4Biogas 0.2 0.2 0 0Other 0 0 0 0Cooking Fuel Total 100 100 100 100Wood 12 11.3 62.1 12.1Kerosene 0.3 0.2 0 0.3Gas/LPG 0.9 0.7 17.2 0.6Electricity 0.1 0.1 3.4 0Straw/Dried Cow Dung 86.6 87.6 17.2 86.9

National Series: Socio-economic and Demographic Report Page 95
Table H07: Type of Toilet, Waste Disposal, Source of Light and Cooking Fuel by Housing Tenure and Zila, 2011
Zila Housing Unit Tenure Status Total Owned Rented Rent Free
1 2 3 4 5 Bio-gas 0.1 0.1 0 0Narail Type of Toilet Number 161961 150262 4396 7303Sanitary with Water Seal 33.6 32.4 55.4 46.3Sanitary Without Water Seal 40.1 40.7 36.9 30.6Non-sanitary/Kutcha 25.2 25.9 7.7 22.2Open Space 1 1.1 0 0.9Waste Disposal Total 100 100 100 100Managed Dustbin 10.2 9 21.5 27.8Unmanaged Dump Site 52.1 52.7 33.8 50Bury/Inside Pit 37.4 37.9 44.6 22.2Burn 0.3 0.4 0 0Source of Light Total 100 100 100 100Electricity 49.2 48.7 93.8 31.5Solar Energy 1.1 1.2 0 0Kerosene 49.3 49.7 4.6 68.5Biogas 0.2 0.2 0 0Other 0.2 0.2 1.5 0Cooking Fuel Total 100 100 100 100Wood 25.2 24.4 44.6 30.6Kerosene 1.1 1 0 3.7Gas/LPG 0.8 0.6 9.2 0Electricity 0.1 0.1 0 0Straw/Dried Cow Dung 72.7 73.9 46.2 65.7Bio-gas 0.1 0.1 0 0Satkhira Type of Toilet Number 467486 415326 8596 43564Sanitary with Water Seal 27.4 27.5 56.8 20.2Sanitary Without Water Seal 27.5 27 29.5 32.3Non-sanitary/Kutcha 44.3 44.6 13.6 47.1Open Space 0.9 0.9 0 0.4Waste Disposal Total 100 100 100 100Managed Dustbin 57.2 58.9 40.9 44.4Unmanaged Dump Site 19.8 18.6 31.8 28.3Bury/Inside Pit 22.9 22.3 27.3 27.4Burn 0.2 0.2 0 0

National Series: Socio-economic and Demographic Report Page 96
Table H07: Type of Toilet, Waste Disposal, Source of Light and Cooking Fuel by Housing Tenure and Zila, 2011
Zila Housing Unit Tenure Status Total Owned Rented Rent Free
1 2 3 4 5 Source of Light Total 100 100 100 100Electricity 40.4 39.1 84.1 43.5Solar Energy 8.9 9.3 0 6.3Kerosene 50.6 51.4 15.9 50.2Biogas 0.1 0.1 0 0Other 0 0 0 0Cooking Fuel Total 100 100 100 100Wood 49.9 49.3 65.9 52.5Kerosene 0.5 0.5 0 0.4Gas/LPG 0.3 0.2 6.8 0Electricity 0 0 0 0Straw/Dried Cow Dung 49.2 49.9 27.3 46.6Bio-gas 0 0 0 0.4Bogra Type of Toilet Number 862161 702395 44979 114787Sanitary with Water Seal 30.2 29.2 71.2 20.1Sanitary Without Water Seal 24.4 25.5 6.4 24.5Non-sanitary/Kutcha 37.7 37.9 20 43.9Open Space 7.7 7.4 2.4 11.6Waste Disposal Total 100 100 100 100Managed Dustbin 6.6 5 45.6 0.6Unmanaged Dump Site 92.4 94 53.6 98.4Bury/Inside Pit 1 1 0.8 0.9Burn 0 0 0 0Source of Light Total 100 100 100 100Electricity 57.9 57.3 84 51.1Solar Energy 3 2.9 1.6 4.1Kerosene 39 39.7 13.6 44.8Biogas 0.1 0.2 0 0Other 0 0 0.8 0Cooking Fuel Total 100 100 100 100Wood 14.5 13.9 44 6.9Kerosene 0.5 0.5 0 0.6Gas/LPG 3.9 2.7 32 0Electricity 0 0 0 0Straw/Dried Cow Dung 81.1 82.9 24 92.5

National Series: Socio-economic and Demographic Report Page 97
Table H07: Type of Toilet, Waste Disposal, Source of Light and Cooking Fuel by Housing Tenure and Zila, 2011
Zila Housing Unit Tenure Status Total Owned Rented Rent Free
1 2 3 4 5 Bio-gas 0 0 0 0Joypurhat Type of Toilet Number 241792 222231 7966 11596Sanitary with Water Seal 35.2 34 87.3 22.6Sanitary Without Water Seal 12.2 12.6 5.1 9.6Non-sanitary/Kutcha 33.7 34.9 5.1 30.4Open Space 18.9 18.5 2.5 37.4Waste Disposal Total 100 100 100 100Managed Dustbin 9.2 8 44.3 7.8Unmanaged Dump Site 12.3 10.9 38 21.7Bury/Inside Pit 78.4 81 16.5 70.4Burn 0.1 0.1 1.3 0Source of Light Total 100 100 100 100Electricity 55.3 55.1 97.5 30.4Solar Energy 0.8 0.9 0 0.9Kerosene 43.6 43.8 2.5 68.7Biogas 0.2 0.2 0 0Other 0 0 0 0Cooking Fuel Total 100 100 100 100Wood 8.4 8.1 19 7Kerosene 0.5 0.5 1.3 0Gas/LPG 1.8 0.7 35.4 0Electricity 0.5 0.2 10.1 0Straw/Dried Cow Dung 88.2 90 34.2 92.2Bio-gas 0.5 0.5 0 0.9Naogaon Type of Toilet Number 653457 589393 10087 53978Sanitary with Water Seal 20.8 20.3 73 16.2Sanitary Without Water Seal 12.3 11.9 16.2 16.7Non-sanitary/Kutcha 38.2 39.7 8.1 27.3Open Space 28.7 28.1 2.7 39.9Waste Disposal Total 100 100 100 100Managed Dustbin 19.6 19.1 24.3 23.7Unmanaged Dump Site 30.5 29.2 48.6 41.4Bury/Inside Pit 49.8 51.6 27 34.8Burn 0 0 0 0

National Series: Socio-economic and Demographic Report Page 98
Table H07: Type of Toilet, Waste Disposal, Source of Light and Cooking Fuel by Housing Tenure and Zila, 2011
Zila Housing Unit Tenure Status Total Owned Rented Rent Free
1 2 3 4 5 Source of Light Total 100 100 100 100Electricity 36.7 36.3 97.3 30.3Solar Energy 2.5 2.6 0 1.5Kerosene 60.2 60.5 2.7 68.2Biogas 0.3 0.3 0 0Other 0.3 0.4 0 0Cooking Fuel Total 100 100 100 100Wood 5.5 4 70.3 9.1Kerosene 1.3 1.2 0 3.5Gas/LPG 0.3 0.3 2.7 0Electricity 0.2 0.1 0 1Straw/Dried Cow Dung 92.7 94.4 27 86.4Bio-gas 0 0 0 0Natore Type of Toilet Number 422040 326883 8635 86523Sanitary with Water Seal 34.4 34.8 83.7 27.9Sanitary Without Water Seal 41.3 41.3 16.3 43.8Non-sanitary/Kutcha 22 21.7 0 25.5Open Space 2.3 2.2 0 2.9Waste Disposal Total 100 100 100 100Managed Dustbin 8.7 9.5 10.2 5.5Unmanaged Dump Site 53.9 52.1 53.1 60.7Bury/Inside Pit 37.4 38.4 36.7 33.8Burn 0 0.1 0 0Source of Light Total 100 100 100 100Electricity 58.5 58.8 98 53.8Solar Energy 1.5 1.7 0 0.8Kerosene 39.2 38.8 2 44.8Biogas 0.2 0.2 0 0.4Other 0.5 0.6 0 0.2Cooking Fuel Total 100 100 100 100Wood 13 14.8 30.6 4.5Kerosene 0.9 0.7 4.1 1.4Gas/LPG 0.9 0.8 12.2 0Electricity 0.5 0.5 0 0.2Straw/Dried Cow Dung 84.7 83.1 53.1 93.9

National Series: Socio-economic and Demographic Report Page 99
Table H07: Type of Toilet, Waste Disposal, Source of Light and Cooking Fuel by Housing Tenure and Zila, 2011
Zila Housing Unit Tenure Status Total Owned Rented Rent Free
1 2 3 4 5 Bio-gas 0 0 0 0Chapai Nawabganj Type of Toilet Number 353227 277759 9527 65942Sanitary with Water Seal 18.2 18.8 45.3 12Sanitary Without Water Seal 13.9 14.8 6.2 11.1Non-sanitary/Kutcha 55.2 54.7 48.4 58.2Open Space 12.7 11.7 0 18.7Waste Disposal Total 100 100 100 100Managed Dustbin 12.3 10.9 32.8 15.3Unmanaged Dump Site 63.4 65.1 57.8 57.1Bury/Inside Pit 23.8 23.6 9.4 26.6Burn 0.5 0.4 0 0.9Source of Light Total 100 100 100 100Electricity 49.7 51 50 44.2Solar Energy 0.1 0.2 0 0Kerosene 49.8 48.6 45.3 55.3Biogas 0.2 0.1 1.6 0.2Other 0.3 0.2 3.1 0.2Cooking Fuel Total 100 100 100 100Wood 13.1 14 18.7 8.6Kerosene 0.9 0.9 1.6 1.1Gas/LPG 0.5 0.2 14.1 0Electricity 0.2 0.2 0 0.2Straw/Dried Cow Dung 85.2 84.7 65.6 90.1Bio-gas 0 0 0 0Pabna Type of Toilet Number 587664 488043 24292 75329Sanitary with Water Seal 24.2 24 57.6 15Sanitary Without Water Seal 43.2 43.6 31.3 44Non-sanitary/Kutcha 30.9 31.1 11.1 36.2Open Space 1.7 1.3 0 4.9Waste Disposal Total 100 100 100 100Managed Dustbin 9.9 8.5 47.5 6.8Unmanaged Dump Site 69.4 70.1 37.4 74.9Bury/Inside Pit 20.3 21 15.2 17.9Burn 0.4 0.4 0 0.3

National Series: Socio-economic and Demographic Report Page 100
Table H07: Type of Toilet, Waste Disposal, Source of Light and Cooking Fuel by Housing Tenure and Zila, 2011
Zila Housing Unit Tenure Status Total Owned Rented Rent Free
1 2 3 4 5 Source of Light Total 100 100 100 100Electricity 62.3 63.1 89.9 47.9Solar Energy 1.6 1.5 2 2.3Kerosene 35 34.2 8.1 49.2Biogas 0.2 0.2 0 0.3Other 0.8 1 0 0.3Cooking Fuel Total 100 100 100 100Wood 11.9 9.9 44.4 14.7Kerosene 0.4 0.4 1 0Gas/LPG 4.1 2.7 38.4 2Electricity 0.3 0.3 1 0Straw/Dried Cow Dung 83.3 86.7 15.2 83.4Bio-gas 0 0 0 0Rajshahi Type of Toilet Number 630068 502357 38003 89708Sanitary with Water Seal 30.8 27.7 77.8 28.5Sanitary Without Water Seal 18.3 18.6 16.8 17.3Non-sanitary/Kutcha 46.4 49.4 5.5 46.9Open Space 4.4 4.3 0 7.3Waste Disposal Total 100 100 100 100Managed Dustbin 16.9 14 65.7 12.3Unmanaged Dump Site 26.5 27.2 22.9 24.1Bury/Inside Pit 56.6 58.8 11.4 63.5Burn 0 0 0 0Source of Light Total 100 100 100 100Electricity 71.1 71.3 97.1 59Solar Energy 0.6 0.7 0 0Kerosene 28.2 27.9 2.8 40.9Biogas 0.1 0.1 0 0Other 0 0 0.1 0Cooking Fuel Total 100 100 100 100Wood 11.5 9.8 37.8 9.6Kerosene 1.4 0.8 11.5 0.4Gas/LPG 4.2 2.7 31.4 1Electricity 0.4 0.3 1.7 0.2Straw/Dried Cow Dung 82.4 86.2 17.1 88.7

National Series: Socio-economic and Demographic Report Page 101
Table H07: Type of Toilet, Waste Disposal, Source of Light and Cooking Fuel by Housing Tenure and Zila, 2011
Zila Housing Unit Tenure Status Total Owned Rented Rent Free
1 2 3 4 5 Bio-gas 0.1 0.1 0.5 0Sirajganj Type of Toilet Number 710687 624822 36247 49617Sanitary with Water Seal 27.6 28.2 36.1 13.2Sanitary Without Water Seal 28 29.1 13.9 25.1Non-sanitary/Kutcha 41.9 40.9 46.7 50.3Open Space 2.5 1.8 3.3 11.4Waste Disposal Total 100 100 100 100Managed Dustbin 6.8 6.3 9 11.4Unmanaged Dump Site 39.7 40.3 27 40.7Bury/Inside Pit 53.5 53.3 63.9 47.9Burn 0 0 0 0Source of Light Total 100 100 100 100Electricity 43.4 43.6 51.6 34.7Solar Energy 3.6 3.7 4.1 1.2Kerosene 52.4 52 43.4 64.1Biogas 0.3 0.2 0.8 0Other 0.4 0.5 0 0Cooking Fuel Total 100 100 100 100Wood 11.4 11.3 16.4 9Kerosene 1.4 1.5 0.8 1.2Gas/LPG 3.3 2.4 23 0.6Electricity 0.3 0.1 4.1 0.6Straw/Dried Cow Dung 83.5 84.7 55.7 88.6Bio-gas 0 0 0 0Dinajpur Type of Toilet Number 707906 585761 21100 101044Sanitary with Water Seal 39.2 39.2 54.9 36.2Sanitary Without Water Seal 11.1 10.1 7 17.6Non-sanitary/Kutcha 27.2 28 26.8 22.6Open Space 22.5 22.7 11.3 23.5Waste Disposal Total 100 100 100 100Managed Dustbin 6.8 7.4 12.7 1.8Unmanaged Dump Site 71.8 69.6 80.3 82.9Bury/Inside Pit 21.4 23 7 15Burn 0.1 0.1 0 0.3
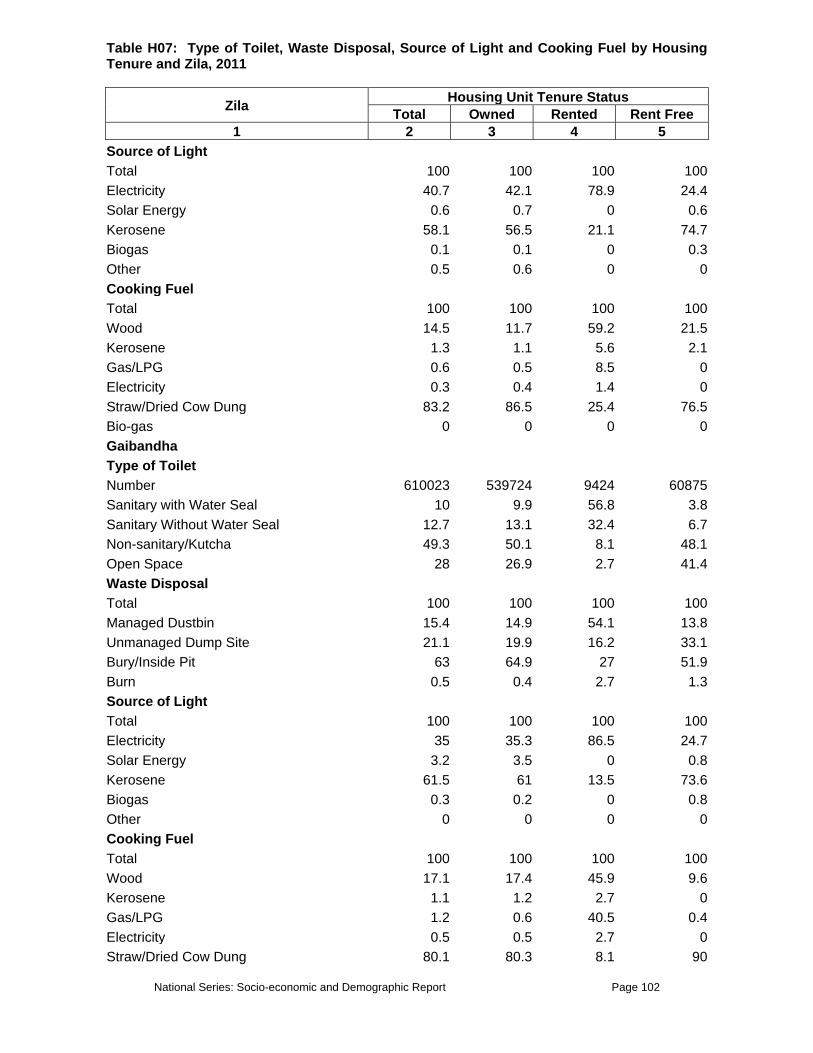
National Series: Socio-economic and Demographic Report Page 102
Table H07: Type of Toilet, Waste Disposal, Source of Light and Cooking Fuel by Housing Tenure and Zila, 2011
Zila Housing Unit Tenure Status Total Owned Rented Rent Free
1 2 3 4 5 Source of Light Total 100 100 100 100Electricity 40.7 42.1 78.9 24.4Solar Energy 0.6 0.7 0 0.6Kerosene 58.1 56.5 21.1 74.7Biogas 0.1 0.1 0 0.3Other 0.5 0.6 0 0Cooking Fuel Total 100 100 100 100Wood 14.5 11.7 59.2 21.5Kerosene 1.3 1.1 5.6 2.1Gas/LPG 0.6 0.5 8.5 0Electricity 0.3 0.4 1.4 0Straw/Dried Cow Dung 83.2 86.5 25.4 76.5Bio-gas 0 0 0 0Gaibandha Type of Toilet Number 610023 539724 9424 60875Sanitary with Water Seal 10 9.9 56.8 3.8Sanitary Without Water Seal 12.7 13.1 32.4 6.7Non-sanitary/Kutcha 49.3 50.1 8.1 48.1Open Space 28 26.9 2.7 41.4Waste Disposal Total 100 100 100 100Managed Dustbin 15.4 14.9 54.1 13.8Unmanaged Dump Site 21.1 19.9 16.2 33.1Bury/Inside Pit 63 64.9 27 51.9Burn 0.5 0.4 2.7 1.3Source of Light Total 100 100 100 100Electricity 35 35.3 86.5 24.7Solar Energy 3.2 3.5 0 0.8Kerosene 61.5 61 13.5 73.6Biogas 0.3 0.2 0 0.8Other 0 0 0 0Cooking Fuel Total 100 100 100 100Wood 17.1 17.4 45.9 9.6Kerosene 1.1 1.2 2.7 0Gas/LPG 1.2 0.6 40.5 0.4Electricity 0.5 0.5 2.7 0Straw/Dried Cow Dung 80.1 80.3 8.1 90
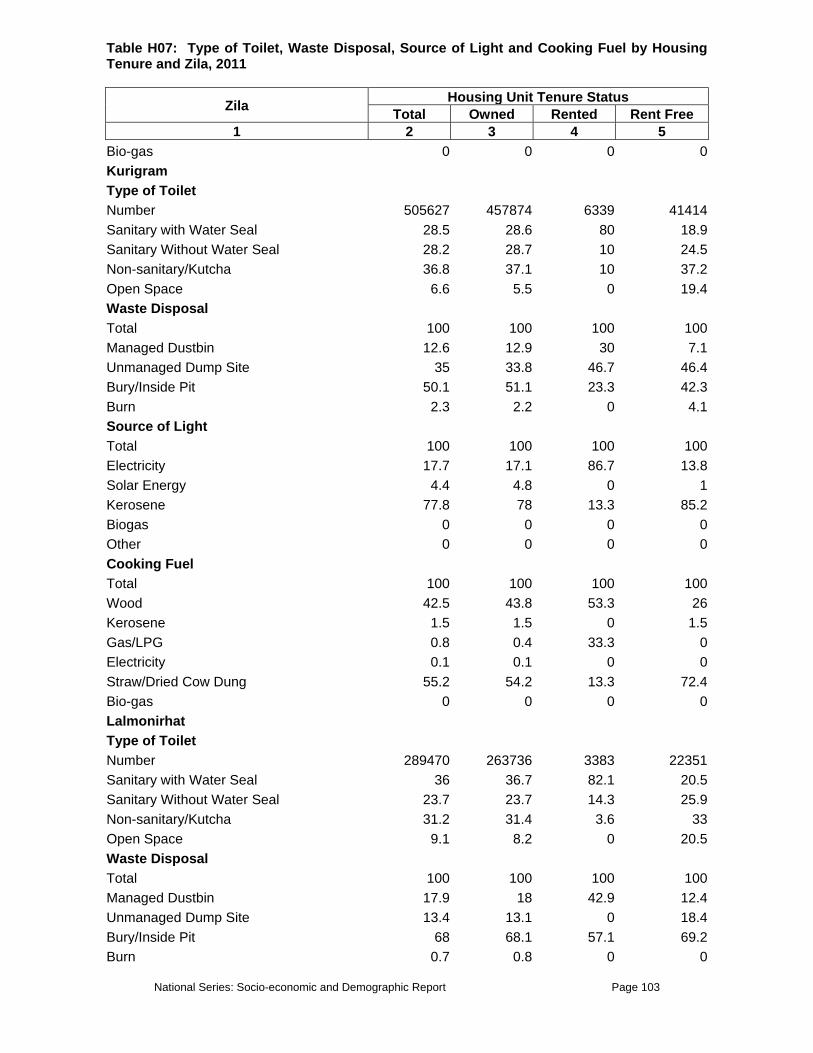
National Series: Socio-economic and Demographic Report Page 103
Table H07: Type of Toilet, Waste Disposal, Source of Light and Cooking Fuel by Housing Tenure and Zila, 2011
Zila Housing Unit Tenure Status Total Owned Rented Rent Free
1 2 3 4 5 Bio-gas 0 0 0 0Kurigram Type of Toilet Number 505627 457874 6339 41414Sanitary with Water Seal 28.5 28.6 80 18.9Sanitary Without Water Seal 28.2 28.7 10 24.5Non-sanitary/Kutcha 36.8 37.1 10 37.2Open Space 6.6 5.5 0 19.4Waste Disposal Total 100 100 100 100Managed Dustbin 12.6 12.9 30 7.1Unmanaged Dump Site 35 33.8 46.7 46.4Bury/Inside Pit 50.1 51.1 23.3 42.3Burn 2.3 2.2 0 4.1Source of Light Total 100 100 100 100Electricity 17.7 17.1 86.7 13.8Solar Energy 4.4 4.8 0 1Kerosene 77.8 78 13.3 85.2Biogas 0 0 0 0Other 0 0 0 0Cooking Fuel Total 100 100 100 100Wood 42.5 43.8 53.3 26Kerosene 1.5 1.5 0 1.5Gas/LPG 0.8 0.4 33.3 0Electricity 0.1 0.1 0 0Straw/Dried Cow Dung 55.2 54.2 13.3 72.4Bio-gas 0 0 0 0Lalmonirhat Type of Toilet Number 289470 263736 3383 22351Sanitary with Water Seal 36 36.7 82.1 20.5Sanitary Without Water Seal 23.7 23.7 14.3 25.9Non-sanitary/Kutcha 31.2 31.4 3.6 33Open Space 9.1 8.2 0 20.5Waste Disposal Total 100 100 100 100Managed Dustbin 17.9 18 42.9 12.4Unmanaged Dump Site 13.4 13.1 0 18.4Bury/Inside Pit 68 68.1 57.1 69.2Burn 0.7 0.8 0 0

National Series: Socio-economic and Demographic Report Page 104
Table H07: Type of Toilet, Waste Disposal, Source of Light and Cooking Fuel by Housing Tenure and Zila, 2011
Zila Housing Unit Tenure Status Total Owned Rented Rent Free
1 2 3 4 5 Source of Light Total 100 100 100 100Electricity 19.1 18.9 92.9 10.3Solar Energy 3 3.2 0 1.6Kerosene 77.6 77.6 7.1 88.1Biogas 0.3 0.3 0 0Other 0 0 0 0Cooking Fuel Total 100 100 100 100Wood 44.9 45.6 85.7 31.4Kerosene 2.6 2.6 3.6 3.2Gas/LPG 0.3 0.2 3.6 0.5Electricity 0.2 0.2 0 0Straw/Dried Cow Dung 52 51.4 7.1 64.9Bio-gas 0 0 0 0Nilphamari Type of Toilet Number 420555 360576 11575 48404Sanitary with Water Seal 26.2 26.1 51.5 20.7Sanitary Without Water Seal 11.7 10.7 31.8 14.1Non-sanitary/Kutcha 35.7 36.5 16.7 34.1Open Space 26.5 26.7 0 31.2Waste Disposal Total 100 100 100 100Managed Dustbin 5.6 5.2 27.3 3.6Unmanaged Dump Site 16.6 13.6 47 31.5Bury/Inside Pit 77.5 81.1 25.8 63Burn 0.3 0.1 0 1.8Source of Light Total 100 100 100 100Electricity 36.4 35.2 92.4 32.2Solar Energy 0.8 0.9 0 0Kerosene 62.7 63.8 7.6 67.4Biogas 0.1 0.1 0 0.4Other 0 0 0 0Cooking Fuel Total 100 100 100 100Wood 31.4 30.9 72.7 25.7Kerosene 1 1 3 1.1Gas/LPG 0.9 0.6 15.2 0Electricity 0.3 0.2 1.5 0.7Straw/Dried Cow Dung 66.3 67.3 7.6 72.5

National Series: Socio-economic and Demographic Report Page 105
Table H07: Type of Toilet, Waste Disposal, Source of Light and Cooking Fuel by Housing Tenure and Zila, 2011
Zila Housing Unit Tenure Status Total Owned Rented Rent Free
1 2 3 4 5 Bio-gas 0 0 0 0Panchagarh Type of Toilet Number 227694 212774 5797 9123Sanitary with Water Seal 48.7 48.7 67.2 37.5Sanitary Without Water Seal 26.6 27 13.1 26Non-sanitary/Kutcha 14.7 14.6 19.7 13.5Open Space 9.9 9.6 0 22.9Waste Disposal Total 100 100 100 100Managed Dustbin 10.4 10.5 18 4.2Unmanaged Dump Site 62.4 62.7 49.2 64.6Bury/Inside Pit 25.3 24.9 31.1 29.2Burn 1.9 1.9 1.6 2.1Source of Light Total 100 100 100 100Electricity 28.8 27.6 86.9 17.7Solar Energy 2.7 2.9 0 0Kerosene 68 68.9 13.1 82.3Biogas 0.2 0.2 0 0Other 0.4 0.4 0 0Cooking Fuel Total 100 100 100 100Wood 14.4 13.4 63.9 7.3Kerosene 1.5 1.7 0 0Gas/LPG 0.3 0.1 6.6 0Electricity 0.4 0.3 4.9 0Straw/Dried Cow Dung 83.3 84.5 24.6 92.7Bio-gas 0 0 0 0Rangpur Type of Toilet Number 715270 527859 19429 167982Sanitary with Water Seal 20.5 20.3 47.7 17.8Sanitary Without Water Seal 19.3 18.9 26.2 19.8Non-sanitary/Kutcha 38.7 40 24.6 36.3Open Space 21.6 20.8 1.5 26.2Waste Disposal Total 100 100 100 100Managed Dustbin 7.7 7.9 9.2 6.9Unmanaged Dump Site 21.8 20.6 20 25.8Bury/Inside Pit 70.3 71.4 70.8 66.9Burn 0.2 0.1 0 0.4

National Series: Socio-economic and Demographic Report Page 106
Table H07: Type of Toilet, Waste Disposal, Source of Light and Cooking Fuel by Housing Tenure and Zila, 2011
Zila Housing Unit Tenure Status Total Owned Rented Rent Free
1 2 3 4 5 Source of Light Total 100 100 100 100Electricity 42.7 41.3 92.3 41.3Solar Energy 0.7 0.7 0 0.7Kerosene 56.4 57.9 7.7 57.3Biogas 0.2 0.1 0 0.5Other 0.1 0.1 0 0.2Cooking Fuel Total 100 100 100 100Wood 36 36.1 76.9 31.1Kerosene 1.1 1.2 3.1 0.5Gas/LPG 1 1 9.2 0Electricity 0.4 0.3 4.6 0.4Straw/Dried Cow Dung 61.4 61.4 6.2 67.8Bio-gas 0 0 0 0.2Thakurgaon Type of Toilet Number 318063 278205 6798 33059Sanitary with Water Seal 17.4 16.7 43.1 18.1Sanitary Without Water Seal 9.5 8.9 25.5 10.9Non-sanitary/Kutcha 47.6 49.8 27.5 33.1Open Space 25.6 24.6 3.9 37.9Waste Disposal Total 100 100 100 100Managed Dustbin 7.3 7.2 13.7 6.5Unmanaged Dump Site 85 84.8 66.7 89.9Bury/Inside Pit 7.7 8 17.6 3.2Burn 0.1 0 2 0.4Source of Light Total 100 100 100 100Electricity 39 38.8 90.2 29.8Solar Energy 0.6 0.7 0 0.4Kerosene 60 60.2 9.8 68.5Biogas 0 0 0 0Other 0.4 0.3 0 1.2Cooking Fuel Total 100 100 100 100Wood 9.1 8.4 58.8 4.8Kerosene 1.6 1.8 0 0Gas/LPG 0.6 0.4 9.8 0Electricity 0.3 0.3 0 0Straw/Dried Cow Dung 88.4 89 31.4 95.2

National Series: Socio-economic and Demographic Report Page 107
Table H07: Type of Toilet, Waste Disposal, Source of Light and Cooking Fuel by Housing Tenure and Zila, 2011
Zila Housing Unit Tenure Status Total Owned Rented Rent Free
1 2 3 4 5 Bio-gas 0.1 0.1 0 0Habiganj Type of Toilet Number 389046 338294 10281 40471Sanitary with Water Seal 15 14.9 68.3 2.4Sanitary Without Water Seal 32.1 34.2 11.1 19.4Non-sanitary/Kutcha 48.5 48.2 19 58.5Open Space 4.4 2.6 1.6 19.8Waste Disposal Total 100 100 100 100Managed Dustbin 24.5 23.7 68.3 20.2Unmanaged Dump Site 46.3 46.9 17.5 48.8Bury/Inside Pit 28 28.1 14.3 30.6Burn 1.2 1.3 0 0.4Source of Light Total 100 100 100 100Electricity 46.6 47.3 87.3 30.6Solar Energy 4.7 4.7 0 6Kerosene 48.7 48 12.7 63.3Biogas 0 0 0 0Other 0 0 0 0Cooking Fuel Total 100 100 100 100Wood 33.3 31.4 30.2 50Kerosene 1.2 1.3 0 1.2Gas/LPG 3.2 1.9 58.7 0Electricity 0.3 0.3 0 0Straw/Dried Cow Dung 62 65.1 11.1 48.8Bio-gas 0 0 0 0Maulvibazar Type of Toilet Number 353120 260793 18435 73891Sanitary with Water Seal 23.7 27.1 37.4 8.3Sanitary Without Water Seal 31.2 34.8 47.2 14.4Non-sanitary/Kutcha 38.8 35.7 15.4 55.8Open Space 6.3 2.5 0 21.5Waste Disposal Total 100 100 100 100Managed Dustbin 20.5 20.3 39 16.4Unmanaged Dump Site 69.3 68.7 42.3 78.1Bury/Inside Pit 10.2 11 18.7 5.5Burn 0 0 0 0

National Series: Socio-economic and Demographic Report Page 108
Table H07: Type of Toilet, Waste Disposal, Source of Light and Cooking Fuel by Housing Tenure and Zila, 2011
Zila Housing Unit Tenure Status Total Owned Rented Rent Free
1 2 3 4 5 Source of Light Total 100 100 100 100Electricity 56 58 93.5 39.8Solar Energy 2.8 3.3 0 1.8Kerosene 41.1 38.7 6.5 58.4Biogas 0 0 0 0Other 0 0.1 0 0Cooking Fuel Total 100 100 100 100Wood 82.4 84.4 31.7 88Kerosene 0.6 0.4 0 1.2Gas/LPG 5.9 3.4 62.6 0.6Electricity 0.1 0.1 0 0Straw/Dried Cow Dung 10.9 11.5 4.9 10.1Bio-gas 0.2 0.2 0.8 0Sunamganj Type of Toilet Number 436741 398716 12066 25959Sanitary with Water Seal 5.3 4.6 39.4 0.7Sanitary Without Water Seal 26.4 27.6 25.8 7.7Non-sanitary/Kutcha 51.7 51.7 31.8 60.6Open Space 16.7 16.1 3 31Waste Disposal Total 100 100 100 100Managed Dustbin 10 8.8 62.1 2.8Unmanaged Dump Site 75.5 76.5 34.8 79.6Bury/Inside Pit 14.3 14.5 3 16.9Burn 0.2 0.2 0 0.7Source of Light Total 100 100 100 100Electricity 26.7 26.2 74.2 12Solar Energy 11.1 12 1.5 0.7Kerosene 61.7 61.2 24.2 87.3Biogas 0.3 0.3 0 0Other 0.3 0.3 0 0Cooking Fuel Total 100 100 100 100Wood 20.3 20.8 16.7 14.8Kerosene 0.8 0.6 0 4.2Gas/LPG 1.6 0.4 47 0Electricity 0.3 0.3 1.5 0Straw/Dried Cow Dung 76.9 77.9 34.8 81

National Series: Socio-economic and Demographic Report Page 109
Table H07: Type of Toilet, Waste Disposal, Source of Light and Cooking Fuel by Housing Tenure and Zila, 2011
Zila Housing Unit Tenure Status Total Owned Rented Rent Free
1 2 3 4 5 Bio-gas 0 0 0 0Sylhet Type of Toilet Number 583850 469711 94767 19372Sanitary with Water Seal 29.1 27.4 40.7 12.7Sanitary Without Water Seal 34.9 35 37 23.2Non-sanitary/Kutcha 29.5 30.9 19.7 43.8Open Space 6.4 6.6 2.6 20.3Waste Disposal Total 100 100 100 100Managed Dustbin 30.8 27.9 49.3 10Unmanaged Dump Site 60 61.5 47.5 84.3Bury/Inside Pit 9.2 10.6 3 5.7Burn 0.1 0 0.2 0Source of Light Total 100 100 100 100Electricity 62.8 57.4 94.4 38.6Solar Energy 1.1 1.4 0 0Kerosene 35.8 40.9 5.5 60.4Biogas 0 0 0 0Other 0.3 0.3 0 1.1Cooking Fuel Total 100 100 100 100Wood 64.8 71.7 30.2 68.4Kerosene 0.8 0.9 0.2 2.1Gas/LPG 18.7 10.8 60.7 6.5Electricity 0.5 0.3 1.1 0.2Straw/Dried Cow Dung 15 16.2 7.7 22.7Bio-gas 0.2 0.2 0.2 0

National Series: Socio-economic and Demographic Report Page 110
Table H08: Main Source of Drinking Water by Distance to Source of Water, Division and Residence, 2011
Main Source of Drinking Water
Distance to Source of Water
Total Inside
Dwelling Within 200
Meters 200+
Meters 1 2 3 4 5
Bangladesh Total 31705684 60.7 31.6 7.7Tap 2560503 82.0 15.2 2.8Tubewell 28234360 60.0 32.6 7.4Well 226248 21.7 45.6 32.7Pond 410011 20.3 49.3 30.4River/Ditch/Canal 120636 13.7 52.9 33.4Others 153926 27.3 48.5 24.2Rural 25535877 57.6 33.8 8.7Tap 532922 63.8 28.7 7.6Tubewell 24148181 58.8 33.3 7.9Well 215350 20.8 46.3 32.9Pond 389887 18.5 50.5 31.0River/Ditch/Canal 108954 12.8 51.8 35.3Others 140583 25.6 49.8 24.6Urban 6169807 73.6 22.8 3.7Tap 2027582 86.7 11.7 1.6Tubewell 4086179 67.4 28.1 4.5Well 10897 39.4 32.9 27.7Pond 20124 54.6 26.5 18.9River/Ditch/Canal 11681 22.0 63.1 15.0Others 13344 45.3 34.7 20.0Barisal Division Total 1849355 15.5 58.4 26.1Tap 28135 53.7 26.7 19.6Tubewell 1740138 15.2 58.7 26.1Well 1562 13.6 68.1 18.3Pond 57359 9.4 69.0 21.6River/Ditch/Canal 19620 8.3 43.7 47.9Others 2542 20.2 32.8 47.0Rural 1610041 14.1 58.7 27.2Tap 5722 16.7 56.1 27.2Tubewell 1529944 14.3 58.5 27.1Well 1456 7.3 73.1 19.6Pond 52139 9.4 70.3 20.3River/Ditch/Canal 19195 7.9 44.2 47.9Others 1586 12.3 39.2 48.5Urban 239315 25.2 55.8 18.9Tap 22413 63.2 19.2 17.6Tubewell 210194 21.5 60.0 18.5Well 106 100.0 0.0 0.0Pond 5220 9.5 56.5 34.0River/Ditch/Canal 425 25.0 25.0 50.0Others 956 33.3 22.2 44.4

National Series: Socio-economic and Demographic Report Page 111
Table H08: Main Source of Drinking Water by Distance to Source of Water, Division and Residence, 2011
Main Source of Drinking Water
Distance to Source of Water
Total Inside
Dwelling Within 200
Meters 200+
Meters 1 2 3 4 5
Barguna Total 214594 18.1 54.2 27.8Tap 5640 22.2 52.4 25.4Tubewell 193198 18.9 53.2 27.9Well 179 0.0 0.0 100.0Pond 12713 7.7 66.2 26.1River/Ditch/Canal 2686 0.0 70.0 30.0Others 179 50.0 50.0 0.0Barisal Total 508586 13.5 62.9 23.6Tap 6633 67.6 23.5 8.9Tubewell 499570 12.9 63.5 23.6Well 183 0.0 100.0 0.0Pond 1833 0.0 30.0 70.0River/Ditch/Canal 367 0.0 50.0 50.0Others 0 0.0 0.0 0.0Bhola Total 370560 18.0 57.1 24.8Tap 2324 100.0 0.0 0.0Tubewell 362814 17.8 58.1 24.2Well 775 0.0 100.0 0.0Pond 465 0.0 0.0 100.0River/Ditch/Canal 4183 0.0 7.4 92.6Others 0 0.0 0.0 0.0Jhalokati Total 157231 41.0 43.7 15.4Tap 591 77.8 22.2 0.0Tubewell 151519 39.9 44.7 15.4Well 0 0.0 0.0 0.0Pond 3020 71.7 19.6 8.7River/Ditch/Canal 1969 66.7 13.3 20.0Others 131 0.0 0.0 100.0Patuakhali Total 343963 3.8 64.0 32.2Tap 1150 37.5 0.0 62.5Tubewell 339936 3.7 64.1 32.2Well 0 0.0 0.0 0.0Pond 431 0.0 66.7 33.3River/Ditch/Canal 2445 0.0 82.4 17.6Others 0 0.0 0.0 0.0Pirojpur Total 254421 13.8 56.1 30.1Tap 11796 52.3 24.3 23.4Tubewell 193101 13.4 54.5 32.1
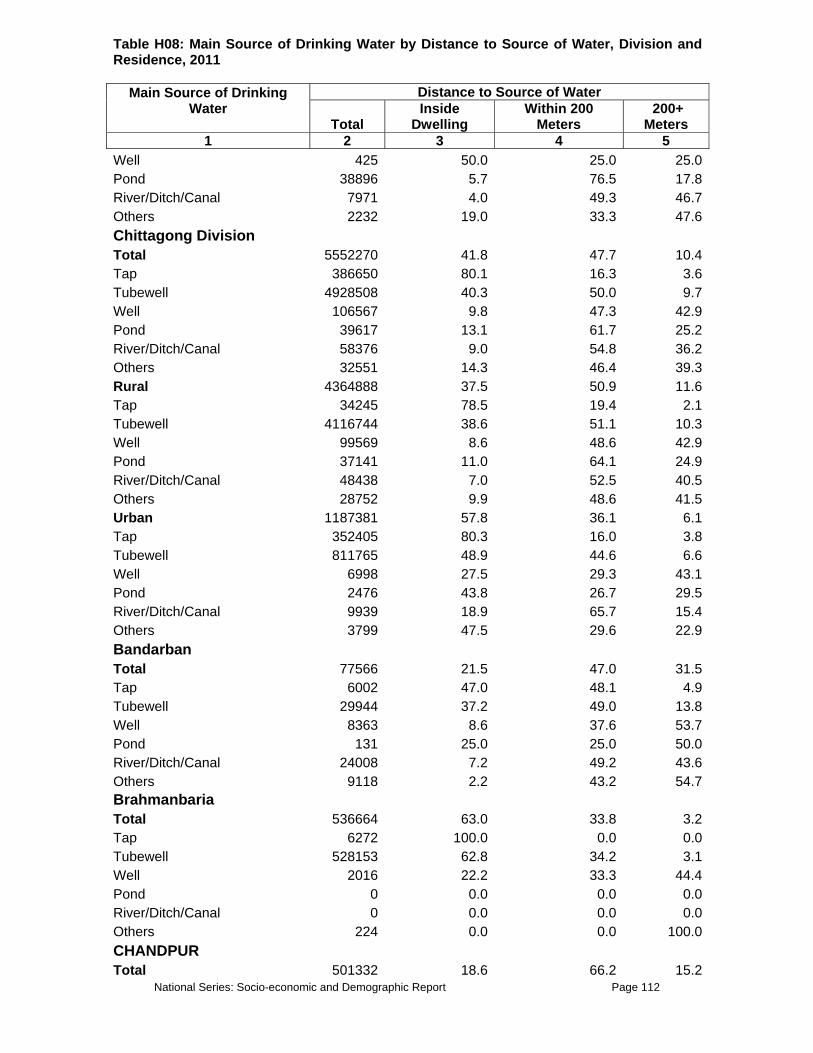
National Series: Socio-economic and Demographic Report Page 112
Table H08: Main Source of Drinking Water by Distance to Source of Water, Division and Residence, 2011
Main Source of Drinking Water
Distance to Source of Water
Total Inside
Dwelling Within 200
Meters 200+
Meters 1 2 3 4 5
Well 425 50.0 25.0 25.0Pond 38896 5.7 76.5 17.8River/Ditch/Canal 7971 4.0 49.3 46.7Others 2232 19.0 33.3 47.6Chittagong Division Total 5552270 41.8 47.7 10.4Tap 386650 80.1 16.3 3.6Tubewell 4928508 40.3 50.0 9.7Well 106567 9.8 47.3 42.9Pond 39617 13.1 61.7 25.2River/Ditch/Canal 58376 9.0 54.8 36.2Others 32551 14.3 46.4 39.3Rural 4364888 37.5 50.9 11.6Tap 34245 78.5 19.4 2.1Tubewell 4116744 38.6 51.1 10.3Well 99569 8.6 48.6 42.9Pond 37141 11.0 64.1 24.9River/Ditch/Canal 48438 7.0 52.5 40.5Others 28752 9.9 48.6 41.5Urban 1187381 57.8 36.1 6.1Tap 352405 80.3 16.0 3.8Tubewell 811765 48.9 44.6 6.6Well 6998 27.5 29.3 43.1Pond 2476 43.8 26.7 29.5River/Ditch/Canal 9939 18.9 65.7 15.4Others 3799 47.5 29.6 22.9Bandarban Total 77566 21.5 47.0 31.5Tap 6002 47.0 48.1 4.9Tubewell 29944 37.2 49.0 13.8Well 8363 8.6 37.6 53.7Pond 131 25.0 25.0 50.0River/Ditch/Canal 24008 7.2 49.2 43.6Others 9118 2.2 43.2 54.7Brahmanbaria Total 536664 63.0 33.8 3.2Tap 6272 100.0 0.0 0.0Tubewell 528153 62.8 34.2 3.1Well 2016 22.2 33.3 44.4Pond 0 0.0 0.0 0.0River/Ditch/Canal 0 0.0 0.0 0.0Others 224 0.0 0.0 100.0CHANDPUR Total 501332 18.6 66.2 15.2

National Series: Socio-economic and Demographic Report Page 113
Table H08: Main Source of Drinking Water by Distance to Source of Water, Division and Residence, 2011
Main Source of Drinking Water
Distance to Source of Water
Total Inside
Dwelling Within 200
Meters 200+
Meters 1 2 3 4 5
Tap 11127 60.4 37.7 1.9Tubewell 461234 18.4 65.8 15.8Well 210 0.0 100.0 0.0Pond 17215 2.4 96.3 1.2River/Ditch/Canal 10917 7.7 67.3 25.0Others 630 0.0 33.3 66.7CHITTAGONG Total 1502347 41.1 50.6 8.4Tap 277325 82.3 14.3 3.5Tubewell 1216394 31.8 58.9 9.2Well 2469 9.1 90.9 0.0Pond 2338 0.0 19.3 80.7River/Ditch/Canal 629 0.0 35.8 64.2Others 3192 47.9 0.0 52.1COMILLA Total 1045924 54.9 39.2 6.0Tap 48516 78.4 18.0 3.6Tubewell 989979 53.8 40.1 6.1Well 874 0.0 50.0 50.0Pond 3060 57.1 42.9 0.0River/Ditch/Canal 2622 33.3 66.7 0.0Others 874 100.0 0.0 0.0COX'S BAZAR Total 410474 48.2 43.6 8.2Tap 2239 100.0 0.0 0.0Tubewell 396521 48.9 43.8 7.3Well 7407 16.3 30.2 53.5Pond 0 0.0 0.0 0.0River/Ditch/Canal 0 0.0 0.0 0.0Others 4306 16.0 64.0 20.0FENI Total 274198 44.1 47.3 8.6Tap 7690 71.6 25.4 3.0Tubewell 265935 43.2 48.0 8.8Well 0 0.0 0.0 0.0Pond 0 0.0 0.0 0.0River/Ditch/Canal 0 0.0 0.0 0.0Others 574 80.0 20.0 0.0Khagrachhari Total 132172 26.9 46.7 26.4Tap 1270 91.3 8.7 0.0Tubewell 90985 35.4 50.8 13.8Well 35831 5.5 40.5 53.9Pond 221 0.0 25.0 75.0

National Series: Socio-economic and Demographic Report Page 114
Table H08: Main Source of Drinking Water by Distance to Source of Water, Division and Residence, 2011
Main Source of Drinking Water
Distance to Source of Water
Total Inside
Dwelling Within 200
Meters 200+
Meters 1 2 3 4 5
River/Ditch/Canal 3147 3.5 26.3 70.2Others 718 7.7 0.0 92.3Lakshmipur Total 363496 38.6 47.2 14.2Tap 15177 72.0 20.0 8.0Tubewell 341489 37.6 47.8 14.5Well 759 0.0 80.0 20.0Pond 2428 31.2 56.2 12.5River/Ditch/Canal 3339 0.0 95.5 4.5Others 304 50.0 50.0 0.0Noakhali Total 581946 28.8 54.0 17.1Tap 4923 90.0 5.0 5.0Tubewell 556098 28.5 55.4 16.1Well 2708 100.0 0.0 0.0Pond 13539 16.4 30.9 52.7River/Ditch/Canal 1231 0.0 20.0 80.0Others 3446 0.0 50.0 50.0Dhaka Division Total 10578551 65.6 29.2 5.2Tap 1846769 84.5 14.0 1.5Tubewell 8659551 61.9 32.3 5.8Well 17922 58.1 37.8 4.1Pond 2480 41.4 16.6 42.0River/Ditch/Canal 18426 0.6 84.0 15.4Others 33403 41.5 35.3 23.1Rural 7801801 59.7 33.8 6.5Tap 397272 64.0 29.5 6.5Tubewell 7337871 59.7 33.9 6.4Well 17036 61.1 34.5 4.4Pond 2376 38.9 17.3 43.9River/Ditch/Canal 18426 0.6 84.0 15.4Others 28820 41.0 35.4 23.6Urban 2776749 82.2 16.4 1.4Tap 1449497 90.1 9.7 0.2Tubewell 1321680 73.8 23.5 2.6Well 886 0.0 100.0 0.0Pond 104 100.0 0.0 0.0River/Ditch/Canal 0 0.0 0.0 0.0Others 4583 44.7 34.8 20.4Dhaka Total 2633512 80.3 17.7 2.0Tap 1602669 84.8 13.5 1.7Tubewell 1029013 73.5 24.0 2.5

National Series: Socio-economic and Demographic Report Page 115
Table H08: Main Source of Drinking Water by Distance to Source of Water, Division and Residence, 2011
Main Source of Drinking Water
Distance to Source of Water
Total Inside
Dwelling Within 200
Meters 200+
Meters 1 2 3 4 5
Well 610 0.0 100.0 0.0Pond 0 0.0 0.0 0.0River/Ditch/Canal 0 0.0 0.0 0.0Others 1220 0.0 100.0 0.0Faridpur Total 417682 78.8 17.7 3.5Tap 7499 97.7 0.0 2.3Tubewell 409137 78.6 17.9 3.5Well 0 0.0 0.0 0.0Pond 0 0.0 0.0 0.0River/Ditch/Canal 0 0.0 0.0 0.0Others 1046 16.7 33.3 50.0Gazipur Total 808411 71.6 26.4 2.0Tap 97171 85.1 14.9 0.0Tubewell 709216 70.0 27.9 2.1Well 337 0.0 0.0 100.0Pond 0 0.0 0.0 0.0River/Ditch/Canal 0 0.0 0.0 0.0Others 1687 0.0 80.0 20.0Gopalganj Total 248424 52.4 34.2 13.5Tap 11504 73.9 18.9 7.2Tubewell 234847 51.7 35.0 13.2Well 0 0.0 0.0 0.0Pond 415 25.0 50.0 25.0River/Ditch/Canal 518 0.0 40.0 60.0Others 1140 0.0 0.0 100.0Jamalpur Total 561712 84.4 13.5 2.1Tap 3748 100.0 0.0 0.0Tubewell 556558 84.5 13.6 1.9Well 468 50.0 50.0 0.0Pond 0 0.0 0.0 0.0River/Ditch/Canal 0 0.0 0.0 0.0Others 937 0.0 0.0 100.0Kishoreganj Total 622614 48.1 43.4 8.5Tap 1300 80.0 20.0 0.0Tubewell 619235 48.0 43.5 8.5Well 1040 50.0 50.0 0.0Pond 260 0.0 0.0 100.0River/Ditch/Canal 0 0.0 0.0 0.0Others 780 33.3 66.7 0.0

National Series: Socio-economic and Demographic Report Page 116
Table H08: Main Source of Drinking Water by Distance to Source of Water, Division and Residence, 2011
Main Source of Drinking Water
Distance to Source of Water
Total Inside
Dwelling Within 200
Meters 200+
Meters 1 2 3 4 5
Madaripur Total 251057 44.9 48.0 7.1Tap 2097 75.0 25.0 0.0Tubewell 243405 45.5 47.3 7.1Well 0 0.0 0.0 0.0Pond 419 75.0 25.0 0.0River/Ditch/Canal 105 100.0 0.0 0.0Others 5032 0.0 91.7 8.3Manikganj Total 321583 84.5 13.6 1.8Tap 7419 90.9 9.1 0.0Tubewell 312005 84.6 13.6 1.8Well 2158 50.0 31.2 18.7Pond 0 0.0 0.0 0.0River/Ditch/Canal 0 0.0 0.0 0.0Others 0 0.0 0.0 0.0Munshiganj Total 310146 58.2 34.2 7.6Tap 4660 86.1 13.9 0.0Tubewell 305227 57.7 34.6 7.7Well 0 0.0 0.0 0.0Pond 129 100.0 0.0 0.0River/Ditch/Canal 0 0.0 0.0 0.0Others 129 100.0 0.0 0.0Mymensingh Total 1149136 19.0 67.8 13.2Tap 20614 88.4 11.6 0.0Tubewell 1113180 17.0 69.4 13.6Well 3835 37.5 62.5 0.0Pond 959 50.0 0.0 50.0River/Ditch/Canal 0 0.0 0.0 0.0Others 10547 81.8 13.6 4.5Narayanganj Total 618606 58.2 38.7 3.1Tap 72663 72.6 27.4 0.0Tubewell 538206 57.1 39.4 3.5Well 553 0.0 100.0 0.0Pond 0 0.0 0.0 0.0River/Ditch/Canal 6907 0.0 100.0 0.0Others 276 0.0 100.0 0.0Narsingdi Total 472950 93.0 5.8 1.2Tap 7307 97.3 2.7 0.0Tubewell 465248 93.0 5.8 1.2
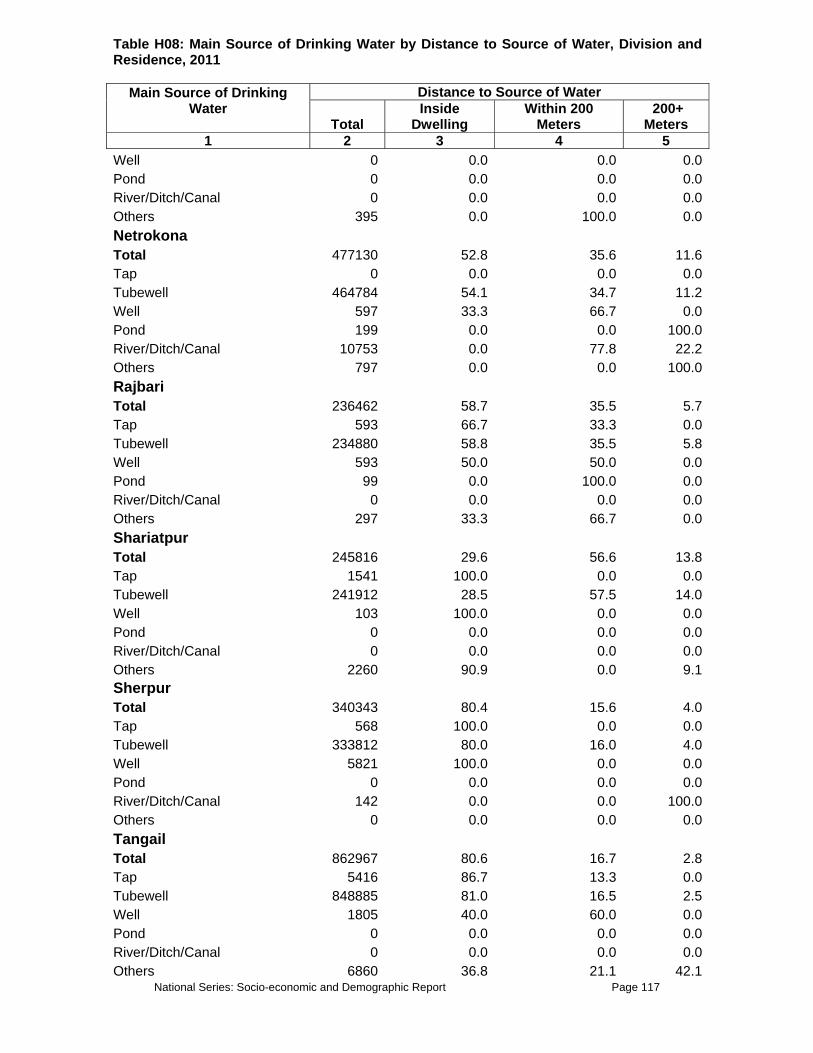
National Series: Socio-economic and Demographic Report Page 117
Table H08: Main Source of Drinking Water by Distance to Source of Water, Division and Residence, 2011
Main Source of Drinking Water
Distance to Source of Water
Total Inside
Dwelling Within 200
Meters 200+
Meters 1 2 3 4 5
Well 0 0.0 0.0 0.0Pond 0 0.0 0.0 0.0River/Ditch/Canal 0 0.0 0.0 0.0Others 395 0.0 100.0 0.0Netrokona Total 477130 52.8 35.6 11.6Tap 0 0.0 0.0 0.0Tubewell 464784 54.1 34.7 11.2Well 597 33.3 66.7 0.0Pond 199 0.0 0.0 100.0River/Ditch/Canal 10753 0.0 77.8 22.2Others 797 0.0 0.0 100.0Rajbari Total 236462 58.7 35.5 5.7Tap 593 66.7 33.3 0.0Tubewell 234880 58.8 35.5 5.8Well 593 50.0 50.0 0.0Pond 99 0.0 100.0 0.0River/Ditch/Canal 0 0.0 0.0 0.0Others 297 33.3 66.7 0.0Shariatpur Total 245816 29.6 56.6 13.8Tap 1541 100.0 0.0 0.0Tubewell 241912 28.5 57.5 14.0Well 103 100.0 0.0 0.0Pond 0 0.0 0.0 0.0River/Ditch/Canal 0 0.0 0.0 0.0Others 2260 90.9 0.0 9.1Sherpur Total 340343 80.4 15.6 4.0Tap 568 100.0 0.0 0.0Tubewell 333812 80.0 16.0 4.0Well 5821 100.0 0.0 0.0Pond 0 0.0 0.0 0.0River/Ditch/Canal 142 0.0 0.0 100.0Others 0 0.0 0.0 0.0Tangail Total 862967 80.6 16.7 2.8Tap 5416 86.7 13.3 0.0Tubewell 848885 81.0 16.5 2.5Well 1805 40.0 60.0 0.0Pond 0 0.0 0.0 0.0River/Ditch/Canal 0 0.0 0.0 0.0Others 6860 36.8 21.1 42.1
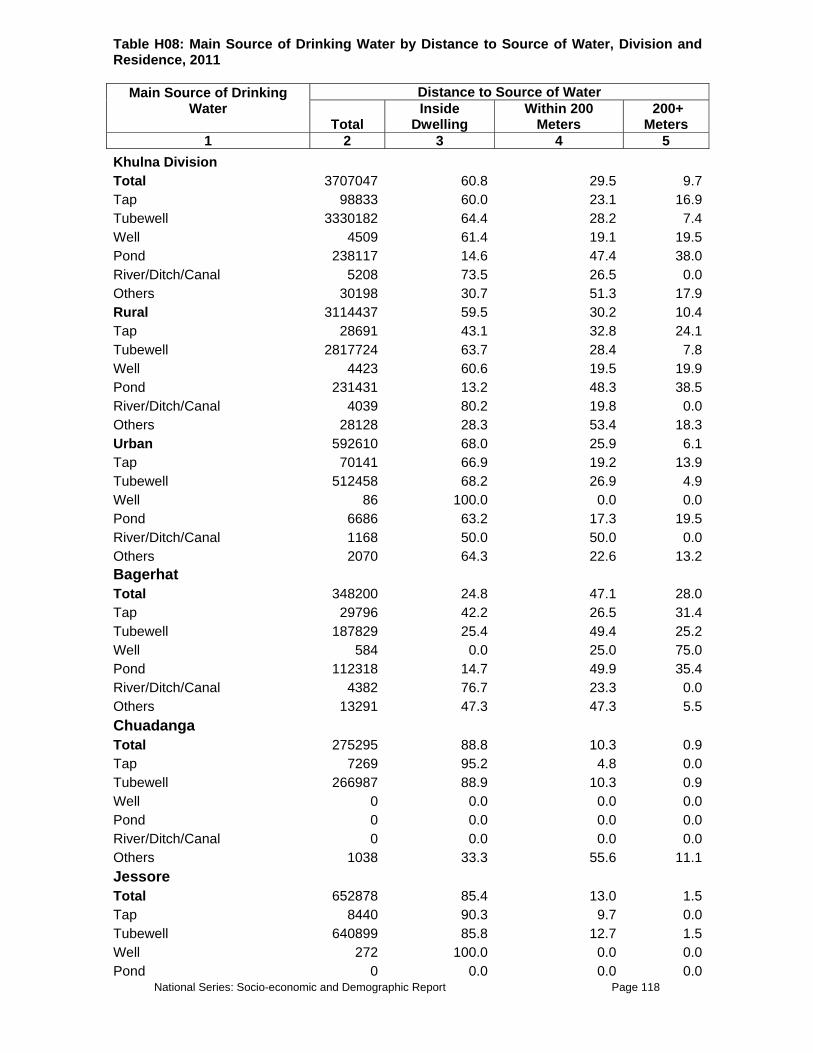
National Series: Socio-economic and Demographic Report Page 118
Table H08: Main Source of Drinking Water by Distance to Source of Water, Division and Residence, 2011
Main Source of Drinking Water
Distance to Source of Water
Total Inside
Dwelling Within 200
Meters 200+
Meters 1 2 3 4 5
Khulna Division Total 3707047 60.8 29.5 9.7Tap 98833 60.0 23.1 16.9Tubewell 3330182 64.4 28.2 7.4Well 4509 61.4 19.1 19.5Pond 238117 14.6 47.4 38.0River/Ditch/Canal 5208 73.5 26.5 0.0Others 30198 30.7 51.3 17.9Rural 3114437 59.5 30.2 10.4Tap 28691 43.1 32.8 24.1Tubewell 2817724 63.7 28.4 7.8Well 4423 60.6 19.5 19.9Pond 231431 13.2 48.3 38.5River/Ditch/Canal 4039 80.2 19.8 0.0Others 28128 28.3 53.4 18.3Urban 592610 68.0 25.9 6.1Tap 70141 66.9 19.2 13.9Tubewell 512458 68.2 26.9 4.9Well 86 100.0 0.0 0.0Pond 6686 63.2 17.3 19.5River/Ditch/Canal 1168 50.0 50.0 0.0Others 2070 64.3 22.6 13.2Bagerhat Total 348200 24.8 47.1 28.0Tap 29796 42.2 26.5 31.4Tubewell 187829 25.4 49.4 25.2Well 584 0.0 25.0 75.0Pond 112318 14.7 49.9 35.4River/Ditch/Canal 4382 76.7 23.3 0.0Others 13291 47.3 47.3 5.5Chuadanga Total 275295 88.8 10.3 0.9Tap 7269 95.2 4.8 0.0Tubewell 266987 88.9 10.3 0.9Well 0 0.0 0.0 0.0Pond 0 0.0 0.0 0.0River/Ditch/Canal 0 0.0 0.0 0.0Others 1038 33.3 55.6 11.1Jessore Total 652878 85.4 13.0 1.5Tap 8440 90.3 9.7 0.0Tubewell 640899 85.8 12.7 1.5Well 272 100.0 0.0 0.0Pond 0 0.0 0.0 0.0

National Series: Socio-economic and Demographic Report Page 119
Table H08: Main Source of Drinking Water by Distance to Source of Water, Division and Residence, 2011
Main Source of Drinking Water
Distance to Source of Water
Total Inside
Dwelling Within 200
Meters 200+
Meters 1 2 3 4 5
River/Ditch/Canal 0 0.0 0.0 0.0Others 3267 8.3 83.3 8.3Jhenaidah Total 417438 58.1 38.0 4.0Tap 5968 94.1 0.0 5.9Tubewell 406379 58.1 38.4 3.5Well 0 0.0 0.0 0.0Pond 4213 16.7 50.0 33.3River/Ditch/Canal 0 0.0 0.0 0.0Others 878 20.0 40.0 40.0Khulna Total 538801 34.7 44.1 21.2Tap 6947 69.0 24.5 6.5Tubewell 463875 37.0 44.1 18.9Well 2428 66.7 26.7 6.7Pond 64580 12.8 46.9 40.4River/Ditch/Canal 162 0.0 100.0 0.0Others 809 80.0 0.0 20.0Kushtia Total 474997 75.5 21.4 3.1Tap 1190 83.3 16.7 0.0Tubewell 472419 75.5 21.4 3.1Well 595 100.0 0.0 0.0Pond 0 0.0 0.0 0.0River/Ditch/Canal 595 66.7 33.3 0.0Others 198 0.0 100.0 0.0Magura Total 204293 76.9 19.2 3.9Tap 3168 97.3 2.7 0.0Tubewell 200954 76.7 19.5 3.9Well 171 50.0 0.0 50.0Pond 0 0.0 0.0 0.0River/Ditch/Canal 0 0.0 0.0 0.0Others 0 0.0 0.0 0.0Meherpur Total 165697 93.2 6.0 0.8Tap 6293 89.0 6.6 4.4Tubewell 159266 93.4 6.0 0.6Well 0 0.0 0.0 0.0Pond 0 0.0 0.0 0.0River/Ditch/Canal 69 100.0 0.0 0.0Others 69 0.0 0.0 100.0Narail Total 161961 54.6 33.8 11.6

National Series: Socio-economic and Demographic Report Page 120
Table H08: Main Source of Drinking Water by Distance to Source of Water, Division and Residence, 2011
Main Source of Drinking Water
Distance to Source of Water
Total Inside
Dwelling Within 200
Meters 200+
Meters 1 2 3 4 5
Tap 1826 85.2 14.8 0.0Tubewell 158444 54.7 33.5 11.8Well 68 0.0 100.0 0.0Pond 744 18.2 63.6 18.2River/Ditch/Canal 0 0.0 0.0 0.0Others 879 0.0 100.0 0.0Satkhira Total 467486 38.2 45.8 16.1Tap 27936 37.8 39.9 22.4Tubewell 373129 42.0 46.7 11.3Well 391 50.0 0.0 50.0Pond 56262 16.3 42.7 41.0River/Ditch/Canal 0 0.0 0.0 0.0Others 9768 16.0 46.0 38.0Rajshahi Division Total 4461097 70.1 25.1 4.7Tap 91680 72.4 24.9 2.7Tubewell 4322666 70.6 24.8 4.7Well 21206 10.4 77.9 11.7Pond 965 41.3 58.7 0.0River/Ditch/Canal 1286 46.2 11.6 42.2Others 23295 38.6 46.4 15.0Rural 3753726 69.3 25.7 5.0Tap 39070 73.5 23.1 3.4Tubewell 3670980 69.8 25.3 4.9Well 19704 6.4 81.0 12.6Pond 547 72.8 27.2 0.0River/Ditch/Canal 1137 52.3 0.0 47.7Others 22289 39.3 45.6 15.1Urban 707371 74.4 22.3 3.3Tap 52610 71.6 26.2 2.2Tubewell 651686 74.8 21.8 3.4Well 1502 62.0 38.0 0.0Pond 418 0.0 100.0 0.0River/Ditch/Canal 149 0.0 100.0 0.0Others 1006 24.4 63.6 12.0Bogra Total 862161 84.1 14.4 1.5Tap 5038 92.9 7.1 0.0Tubewell 856403 84.1 14.4 1.5Well 0 0.0 0.0 0.0Pond 0 0.0 0.0 0.0River/Ditch/Canal 0 0.0 0.0 0.0Others 720 0.0 50.0 50.0

National Series: Socio-economic and Demographic Report Page 121
Table H08: Main Source of Drinking Water by Distance to Source of Water, Division and Residence, 2011
Main Source of Drinking Water
Distance to Source of Water
Total Inside
Dwelling Within 200
Meters 200+
Meters 1 2 3 4 5
Joypurhat Total 241792 85.1 12.6 2.4Tap 1311 100.0 0.0 0.0Tubewell 239473 85.3 12.5 2.2Well 0 0.0 0.0 0.0Pond 101 100.0 0.0 0.0River/Ditch/Canal 0 0.0 0.0 0.0Others 907 11.1 44.4 44.4Naogaon Total 653457 55.3 34.8 9.9Tap 5452 90.0 10.0 0.0Tubewell 632466 56.2 33.7 10.0Well 15539 3.5 87.7 8.8Pond 0 0.0 0.0 0.0River/Ditch/Canal 0 0.0 0.0 0.0Others 0 0.0 0.0 0.0Natore Total 422040 76.1 19.9 4.0Tap 1234 85.7 14.3 0.0Tubewell 420454 76.1 19.9 4.0Well 352 100.0 0.0 0.0Pond 0 0.0 0.0 0.0River/Ditch/Canal 0 0.0 0.0 0.0Others 0 0.0 0.0 0.0Chapai Nawabganj Total 353227 53.9 40.3 5.8Tap 28580 54.2 39.6 6.2Tubewell 319140 54.1 40.3 5.6Well 2828 21.1 47.4 31.6Pond 447 66.7 33.3 0.0River/Ditch/Canal 149 0.0 100.0 0.0Others 2084 71.4 28.6 0.0Pabna Total 587664 70.5 24.8 4.7Tap 3681 80.0 20.0 0.0Tubewell 567544 71.2 24.2 4.5Well 0 0.0 0.0 0.0Pond 0 0.0 0.0 0.0River/Ditch/Canal 245 0.0 0.0 100.0Others 16195 43.9 45.5 10.6Rajshahi Total 630068 55.2 38.5 6.3Tap 36580 72.4 25.6 2.0Tubewell 590760 54.3 39.2 6.6

National Series: Socio-economic and Demographic Report Page 122
Table H08: Main Source of Drinking Water by Distance to Source of Water, Division and Residence, 2011
Main Source of Drinking Water
Distance to Source of Water
Total Inside
Dwelling Within 200
Meters 200+
Meters 1 2 3 4 5
Well 2486 28.5 62.6 8.9Pond 121 0.0 100.0 0.0River/Ditch/Canal 0 0.0 0.0 0.0Others 121 0.0 0.0 100.0Sirajganj Total 710687 79.3 17.5 3.2Tap 9805 97.0 3.0 0.0Tubewell 696426 79.4 17.5 3.1Well 0 0.0 0.0 0.0Pond 297 0.0 100.0 0.0River/Ditch/Canal 891 66.7 0.0 33.3Others 3268 9.1 63.6 27.3Rangpur Division Total 3794607 91.3 7.5 1.3Tap 24618 86.7 9.7 3.6Tubewell 3734024 91.7 7.2 1.1Well 17153 84.2 14.3 1.6Pond 643 100.0 0.0 0.0River/Ditch/Canal 175 0.0 100.0 0.0Others 17994 11.8 57.4 30.8Rural 3350279 91.0 7.6 1.4Tap 4008 93.3 6.7 0.0Tubewell 3311980 91.5 7.3 1.2Well 16385 83.4 14.9 1.7Pond 510 100.0 0.0 0.0River/Ditch/Canal 175 0.0 100.0 0.0Others 17220 10.9 57.0 32.1Urban 444328 93.1 6.3 0.6Tap 20610 85.4 10.3 4.3Tubewell 422043 93.6 6.0 0.4Well 768 100.0 0.0 0.0Pond 133 100.0 0.0 0.0River/Ditch/Canal 0 0.0 0.0 0.0Others 774 32.8 67.2 0.0Dinajpur Total 707906 88.9 10.0 1.1Tap 2080 42.9 14.3 42.9Tubewell 702259 89.5 9.7 0.8Well 1486 0.0 100.0 0.0Pond 0 0.0 0.0 0.0River/Ditch/Canal 0 0.0 0.0 0.0Others 2080 0.0 42.9 57.1Gaibandha Total 610023 88.2 9.8 2.0

National Series: Socio-economic and Demographic Report Page 123
Table H08: Main Source of Drinking Water by Distance to Source of Water, Division and Residence, 2011
Main Source of Drinking Water
Distance to Source of Water
Total Inside
Dwelling Within 200
Meters 200+
Meters 1 2 3 4 5
Tap 11717 87.0 13.0 0.0Tubewell 590920 89.3 9.1 1.6Well 0 0.0 0.0 0.0Pond 0 0.0 0.0 0.0River/Ditch/Canal 0 0.0 0.0 0.0Others 7387 6.9 62.1 31.0Kurigram Total 505627 91.9 6.3 1.8Tap 3592 100.0 0.0 0.0Tubewell 500978 91.9 6.2 1.9Well 0 0.0 0.0 0.0Pond 211 100.0 0.0 0.0River/Ditch/Canal 0 0.0 0.0 0.0Others 845 25.0 75.0 0.0Lalmonirhat Total 289470 93.4 5.6 1.0Tap 483 75.0 25.0 0.0Tubewell 286208 93.6 5.5 0.9Well 2175 88.9 11.1 0.0Pond 0 0.0 0.0 0.0River/Ditch/Canal 0 0.0 0.0 0.0Others 604 20.0 0.0 80.0Nilphamari Total 420555 93.7 5.0 1.2Tap 877 60.0 40.0 0.0Tubewell 408279 94.2 4.7 1.0Well 8593 98.0 0.0 2.0Pond 0 0.0 0.0 0.0River/Ditch/Canal 175 0.0 100.0 0.0Others 2631 20.0 53.3 26.7Panchagarh Total 227694 91.0 8.0 1.0Tap 1616 94.1 5.9 0.0Tubewell 221422 91.9 7.4 0.7Well 2471 84.6 11.5 3.8Pond 0 0.0 0.0 0.0River/Ditch/Canal 0 0.0 0.0 0.0Others 2186 4.3 69.6 26.1Rangpur Total 715270 93.5 5.7 0.8Tap 3587 100.0 0.0 0.0Tubewell 708694 93.7 5.6 0.8Well 1495 80.0 20.0 0.0Pond 299 100.0 0.0 0.0

National Series: Socio-economic and Demographic Report Page 124
Table H08: Main Source of Drinking Water by Distance to Source of Water, Division and Residence, 2011
Main Source of Drinking Water
Distance to Source of Water
Total Inside
Dwelling Within 200
Meters 200+
Meters 1 2 3 4 5
River/Ditch/Canal 0 0.0 0.0 0.0Others 1196 0.0 75.0 25.0Thakurgaon Total 318063 91.5 7.7 0.9Tap 667 100.0 0.0 0.0Tubewell 315263 91.5 7.6 0.9Well 933 85.7 14.3 0.0Pond 133 100.0 0.0 0.0River/Ditch/Canal 0 0.0 0.0 0.0Others 1066 62.5 37.5 0.0Sylhet Division Total 1762758 47.7 40.4 11.9Tap 83820 79.8 14.8 5.5Tubewell 1519292 47.5 41.7 10.8Well 57329 15.0 43.9 41.2Pond 70829 50.5 34.3 15.2River/Ditch/Canal 17545 29.3 34.8 35.9Others 13943 18.3 73.8 7.9Rural 1540705 43.9 43.1 13.1Tap 23914 54.4 28.8 16.8Tubewell 1362939 45.2 43.4 11.4Well 56778 14.3 44.1 41.6Pond 65742 46.9 36.8 16.4River/Ditch/Canal 17545 29.3 34.8 35.9Others 13787 18.2 74.1 7.7Urban 222052 74.3 21.8 3.9Tap 59906 89.9 9.2 0.9Tubewell 156353 67.6 27.2 5.1Well 551 85.9 14.1 0.0Pond 5087 97.1 2.9 0.0River/Ditch/Canal 0 0.0 0.0 0.0Others 156 25.0 50.0 25.0Habiganj Total 389046 48.4 45.8 5.8Tap 15177 76.3 22.6 1.1Tubewell 358366 48.5 45.6 6.0Well 1795 9.1 90.9 0.0Pond 5222 3.1 81.2 15.6River/Ditch/Canal 653 75.0 25.0 0.0Others 7833 27.1 70.8 2.1Maulvibazar Total 353120 48.4 33.5 18.0Tap 12290 57.3 14.6 28.0Tubewell 290620 54.0 31.5 14.5

National Series: Socio-economic and Demographic Report Page 125
Table H08: Main Source of Drinking Water by Distance to Source of Water, Division and Residence, 2011
Main Source of Drinking Water
Distance to Source of Water
Total Inside
Dwelling Within 200
Meters 200+
Meters 1 2 3 4 5
Well 43915 14.0 47.1 38.9Pond 2998 25.0 60.0 15.0River/Ditch/Canal 1199 12.5 75.0 12.5Others 2098 0.0 85.7 14.3Sunamganj Total 436741 30.2 54.9 14.9Tap 5302 100.0 0.0 0.0Tubewell 419922 29.6 55.6 14.8Well 2742 33.3 40.0 26.7Pond 4936 14.8 51.9 33.3River/Ditch/Canal 3291 11.1 77.8 11.1Others 548 33.3 33.3 33.3Sylhet Total 583850 59.9 30.1 10.0Tap 51051 84.1 14.0 1.9Tubewell 450383 59.3 32.4 8.4Well 8876 15.3 19.5 65.2Pond 57673 59.1 27.2 13.6River/Ditch/Canal 12403 33.3 20.0 46.7Others 3463 7.1 79.8 13.1

National Series: Socio-economic and Demographic Report Page 126
Table H09: Main Sources of Drinking Water and Household Drinking Boiled/Bottled /Filtered Water by Zila, 2011
Main Sources of Drinking Water
Total Number of Household
Use of Drinking Water
Percentage of Household Drinking
Boiled/Bottled/Filtered Water
1 2 3 4 Bangladesh Total 31705684 100.0 7.8Tap 2560503 8.1 59.9Tubewell 28234360 89.1 2.9Well 226248 0.7 2.2Pond 410011 1.3 18.4River/ditch/canal 120636 0.4 12.3Others 153926 0.5 6.6Barguna Total 214594 100.0 2.6Tap 5640 2.6 0.0Tubewell 193198 90.0 1.1Well 179 0.1 0.0Pond 12713 5.9 28.2River/ditch/canal 2686 1.3 0.0Others 179 0.1 0.0Barisal Total 508586 100.0 1.5Tap 6633 1.3 8.5Tubewell 499570 98.2 1.4Well 183 0 0.0Pond 1833 0.4 0.0River/ditch/canal 367 0.1 0.0Others 0 0.0 0.0Bhola Total 370560 100.0 3.8Tap 2324 0.6 26.7Tubewell 362814 97.9 2.9Well 775 0.2 0.0Pond 465 0.1 0.0River/ditch/canal 4183 1.1 77.8Others 0 0.0 0.0Jhalokati Total 157231 100.0 1.7Tap 591 0.4 0.0Tubewell 151519 96.4 1.4Well 0 0.0 0.0Pond 3020 1.9 19.6River/ditch/canal 1969 1.3 0.0Others 131 0.1 0.0Patuakhali Total 343963 100.0 0.8

National Series: Socio-economic and Demographic Report Page 127
Table H09: Main Sources of Drinking Water and Household Drinking Boiled/Bottled /Filtered Water by Zila, 2011
Main Sources of Drinking Water
Total Number of Household
Use of Drinking Water
Percentage of Household Drinking
Boiled/Bottled/Filtered Water
1 2 3 4 Tap 1150 0.3 75.0Tubewell 339936 98.8 0.6Well 0 0.0 0.0Pond 431 0.1 0.0River/ditch/canal 2445 0.7 0.0Others 0 0.0 0.0Pirojpur Total 254421 100.0 9.9Tap 11796 4.6 36.9Tubewell 193101 75.9 1.3Well 425 0.2 0.0Pond 38896 15.3 42.1River/ditch/canal 7971 3.1 14.7Others 2232 0.9 33.3Chittagong Division Total 5552270 100.0 8.2Tap 386650 7.0 49.6Tubewell 4928508 88.8 5.0Well 106567 1.9 3.1Pond 39617 0.7 14.3River/ditch/canal 58376 1.1 14.3Others 32551 0.6 5.7Bandarban Total 77566 100.0 8.6Tap 6002 7.7 23.5Tubewell 29944 38.6 5.0Well 8363 10.8 5.9Pond 131 0.2 0.0River/ditch/canal 24008 31.0 12.3Others 9118 11.8 3.6Brahmanbaria Total 536664 100.0 2.8Tap 6272 1.2 39.3Tubewell 528153 98.4 2.4Well 2016 0.4 0.0Pond 0 0.0 0.0River/ditch/canal 0 0.0 0.0Others 224 0 0.0Chandpur Total 501332 100.0 4.4Tap 11127 2.2 30.2Tubewell 461234 92.0 3.6Well 210 0 0.0

National Series: Socio-economic and Demographic Report Page 128
Table H09: Main Sources of Drinking Water and Household Drinking Boiled/Bottled /Filtered Water by Zila, 2011
Main Sources of Drinking Water
Total Number of Household
Use of Drinking Water
Percentage of Household Drinking
Boiled/Bottled/Filtered Water
1 2 3 4 Pond 17215 3.4 1.2River/ditch/canal 10917 2.2 15.4Others 630 0.1 0.0Chittagong Total 1502347 100.0 18.1Tap 277325 18.5 57.6Tubewell 1216394 81.0 9.1Well 2469 0.2 0.0Pond 2338 0.2 44.2River/ditch/canal 629 0 35.8Others 3192 0.2 14.1Comilla Total 1045924 100.0 3.1Tap 48516 4.6 22.5Tubewell 989979 94.7 2.0Well 874 0.1 0.0Pond 3060 0.3 0.0River/ditch/canal 2622 0.3 50.0Others 874 0.1 50.0Cox's Bazar Total 410474 100.0 3.1Tap 2239 0.5 15.4Tubewell 396521 96.6 3.0Well 7407 1.8 7.0Pond 0 0.0 0.0River/ditch/canal 0 0.0 0.0Others 4306 1.0 0.0Feni Total 274198 100.0 13.3Tap 7690 2.8 59.7Tubewell 265935 97.0 12.0Well 0 0.0 0.0Pond 0 0.0 0.0River/ditch/canal 0 0.0 0.0Others 574 0.2 0.0Khagrachhari Total 132172 100.0 2.3Tap 1270 1.0 21.7Tubewell 90985 68.8 2.9Well 35831 27.1 0.3Pond 221 0.2 0.0River/ditch/canal 3147 2.4 0.0Others 718 0.5 7.7

National Series: Socio-economic and Demographic Report Page 129
Table H09: Main Sources of Drinking Water and Household Drinking Boiled/Bottled /Filtered Water by Zila, 2011
Main Sources of Drinking Water
Total Number of Household
Use of Drinking Water
Percentage of Household Drinking
Boiled/Bottled/Filtered Water
1 2 3 4 Lakshmipur Total 363496 100.0 5.8Tap 15177 4.2 38.0Tubewell 341489 93.9 4.4Well 759 0.2 0.0Pond 2428 0.7 6.2River/ditch/canal 3339 0.9 0.0Others 304 0.1 0.0Noakhali Total 581946 100.0 4.2Tap 4923 0.8 30.0Tubewell 556098 95.6 3.4Well 2708 0.5 0.0Pond 13539 2.3 30.9River/ditch/canal 1231 0.2 0.0Others 3446 0.6 0.0Rangamati Total 126151 100.0 8.5Tap 6110 4.8 24.1Tubewell 51777 41.0 8.1Well 45930 36.4 4.7Pond 685 0.5 15.4River/ditch/canal 12483 9.9 17.3Others 9165 7.3 6.3Dhaka Division Total 10578551 100.0 14.4Tap 1846769 17.5 68.0Tubewell 8659551 81.9 3.0Well 17922 0.2 4.2Pond 2480 0 22.0River/ditch/canal 18426 0.2 3.3Others 33403 0.3 2.1Dhaka Total 2633512 100.0 50.3Tap 1602669 60.9 75.1Tubewell 1029013 39.1 11.7Well 610 0 100.0Pond 0 0.0 0.0River/ditch/canal 0 0.0 0.0Others 1220 0 50.0Faridpur Total 417682 100.0 3.5Tap 7499 1.8 0.0

National Series: Socio-economic and Demographic Report Page 130
Table H09: Main Sources of Drinking Water and Household Drinking Boiled/Bottled /Filtered Water by Zila, 2011
Main Sources of Drinking Water
Total Number of Household
Use of Drinking Water
Percentage of Household Drinking
Boiled/Bottled/Filtered Water
1 2 3 4 Tubewell 409137 98.0 3.6Well 0 0.0 0.0Pond 0 0.0 0.0River/ditch/canal 0 0.0 0.0Others 1046 0.3 0.0Gazipur Total 808411 100.0 8.5Tap 97171 12.0 34.7Tubewell 709216 87.7 4.9Well 337 0 0.0Pond 0 0.0 0.0River/ditch/canal 0 0.0 0.0Others 1687 0.2 0.0Gopalganj Total 248424 100.0 4.8Tap 11504 4.6 31.5Tubewell 234847 94.5 3.2Well 0 0.0 0.0Pond 415 0.2 50.0River/ditch/canal 518 0.2 80.0Others 1140 0.5 0.0Jamalpur Total 561712 100.0 0.3Tap 3748 0.7 12.5Tubewell 556558 99.1 0.2Well 468 0.1 0.0Pond 0 0.0 0.0River/ditch/canal 0 0.0 0.0Others 937 0.2 0.0KIshoreganj Total 622614 100.0 0.4Tap 1300 0.2 0.0Tubewell 619235 99.5 0.4Well 1040 0.2 0.0Pond 260 0 0.0River/ditch/canal 0 0.0 0.0Others 780 0.1 0.0Madaripur Total 251057 100.0 2.1Tap 2097 0.8 20.0Tubewell 243405 97.0 1.9Well 0 0.0 0.0Pond 419 0.2 50.0

National Series: Socio-economic and Demographic Report Page 131
Table H09: Main Sources of Drinking Water and Household Drinking Boiled/Bottled /Filtered Water by Zila, 2011
Main Sources of Drinking Water
Total Number of Household
Use of Drinking Water
Percentage of Household Drinking
Boiled/Bottled/Filtered Water
1 2 3 4 River/ditch/canal 105 0 0.0Others 5032 2.0 0.0Manikganj Total 321583 100.0 2.9Tap 7419 2.3 16.4Tubewell 312005 97.0 2.6Well 2158 0.7 6.2Pond 0 0.0 0.0River/ditch/canal 0 0.0 0.0Others 0 0.0 0.0Munshiganj Total 310146 100.0 1.6Tap 4660 1.5 30.6Tubewell 305227 98.4 1.1Well 0 0.0 0.0Pond 129 0 100.0River/ditch/canal 0 0.0 0.0Others 129 0 0.0Mymensingh Total 1149136 100.0 0.9Tap 20614 1.8 2.3Tubewell 1113180 96.9 0.9Well 3835 0.3 0.0Pond 959 0.1 0.0River/ditch/canal 0 0.0 0.0Others 10547 0.9 0.0Narayanganj Total 618606 100.0 4.3Tap 72663 11.7 9.5Tubewell 538206 87.0 3.7Well 553 0.1 0.0Pond 0 0.0 0.0River/ditch/canal 6907 1.1 0.0Others 276 0 0.0Narsingdi Total 472950 100.0 0.6Tap 7307 1.5 8.1Tubewell 465248 98.4 0.5Well 0 0.0 0.0Pond 0 0.0 0.0River/ditch/canal 0 0.0 0.0Others 395 0.1 0.0Netrokona

National Series: Socio-economic and Demographic Report Page 132
Table H09: Main Sources of Drinking Water and Household Drinking Boiled/Bottled /Filtered Water by Zila, 2011
Main Sources of Drinking Water
Total Number of Household
Use of Drinking Water
Percentage of Household Drinking
Boiled/Bottled/Filtered Water
1 2 3 4 Total 477130 100.0 0.5Tap 0 0.0 0.0Tubewell 464784 97.4 0.5Well 597 0.1 0.0Pond 199 0 0.0River/ditch/canal 10753 2.3 1.9Others 797 0.2 0.0Rajbari Total 236462 100.0 0.9Tap 593 0.3 33.3Tubewell 234880 99.3 0.8Well 593 0.3 0.0Pond 99 0 0.0River/ditch/canal 0 0.0 0.0Others 297 0.1 33.3Shariatpur Total 245816 100.0 0.8Tap 1541 0.6 13.3Tubewell 241912 98.4 0.8Well 103 0 0.0Pond 0 0.0 0.0River/ditch/canal 0 0.0 0.0Others 2260 0.9 0.0Sherpur Total 340343 100.0 0.1Tap 568 0.2 0.0Tubewell 333812 98.1 0.1Well 5821 1.7 0.0Pond 0 0.0 0.0River/ditch/canal 142 0 0.0Others 0 0.0 0.0Tangail Total 862967 100.0 3.5Tap 5416 0.6 60.0Tubewell 848885 98.4 3.1Well 1805 0.2 0.0Pond 0 0.0 0.0River/ditch/canal 0 0.0 0.0Others 6860 0.8 0.0Khulna Division Total 3707047 100.0 5.0Tap 98833 2.7 32.7Tubewell 3330182 89.8 3.2

National Series: Socio-economic and Demographic Report Page 133
Table H09: Main Sources of Drinking Water and Household Drinking Boiled/Bottled /Filtered Water by Zila, 2011
Main Sources of Drinking Water
Total Number of Household
Use of Drinking Water
Percentage of Household Drinking
Boiled/Bottled/Filtered Water
1 2 3 4 Well 4509 0.1 6.5Pond 238117 6.4 16.0River/ditch/canal 5208 0.1 16.8Others 30198 0.8 19.8Bagerhat Total 348200 100.0 11.4Tap 29796 8.6 34.8Tubewell 187829 53.9 4.5Well 584 0.2 50.0Pond 112318 32.3 15.5River/ditch/canal 4382 1.3 20.0Others 13291 3.8 16.5Chuadanga Total 275295 100.0 2.9Tap 7269 2.6 39.7Tubewell 266987 97.0 1.9Well 0 0.0 0.0Pond 0 0.0 0.0River/ditch/canal 0 0.0 0.0Others 1038 0.4 0.0Jessore Total 652878 100.0 2.7Tap 8440 1.3 67.7Tubewell 640899 98.2 1.8Well 272 0 0.0Pond 0 0.0 0.0River/ditch/canal 0 0.0 0.0Others 3267 0.5 8.3Jhenaidah Total 417438 100.0 6.0Tap 5968 1.4 70.6Tubewell 406379 97.4 4.1Well 0 0.0 0.0Pond 4213 1.0 100.0River/ditch/canal 0 0.0 0.0Others 878 0.2 0.0Khulna Total 538801 100.0 7.6Tap 6947 1.3 5.5Tubewell 463875 86.1 7.5Well 2428 0.5 0.0Pond 64580 12.0 9.0River/ditch/canal 162 0 0.0
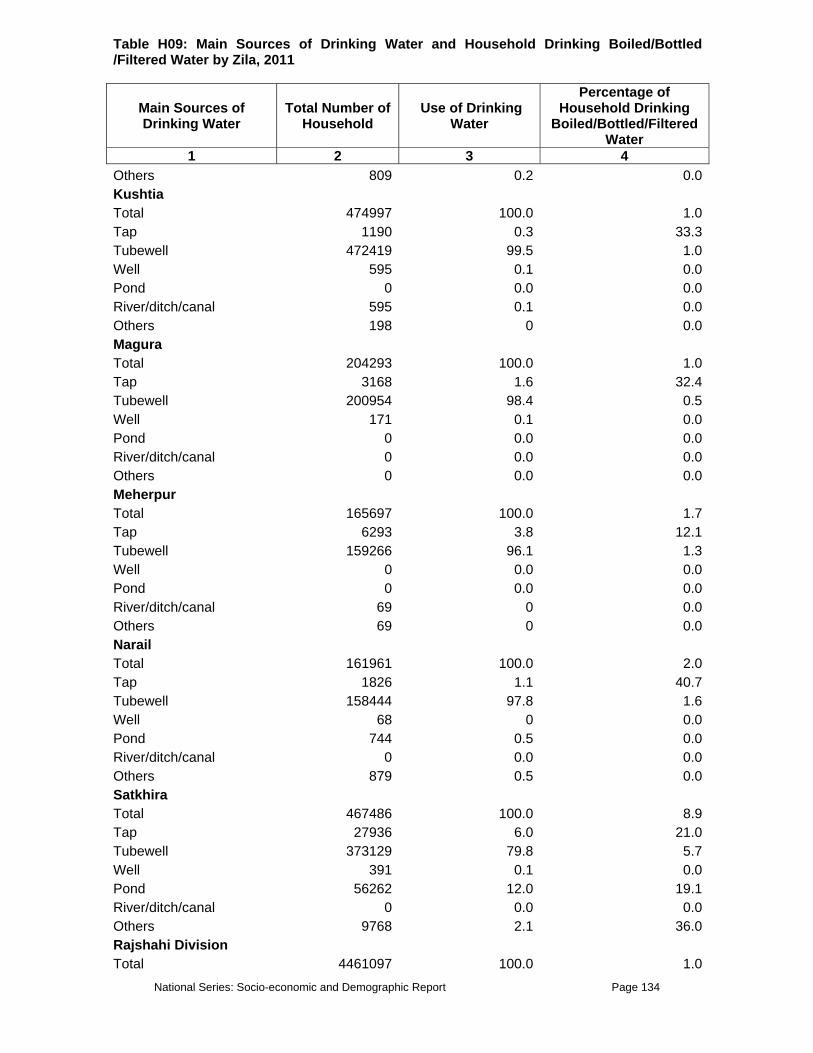
National Series: Socio-economic and Demographic Report Page 134
Table H09: Main Sources of Drinking Water and Household Drinking Boiled/Bottled /Filtered Water by Zila, 2011
Main Sources of Drinking Water
Total Number of Household
Use of Drinking Water
Percentage of Household Drinking
Boiled/Bottled/Filtered Water
1 2 3 4 Others 809 0.2 0.0Kushtia Total 474997 100.0 1.0Tap 1190 0.3 33.3Tubewell 472419 99.5 1.0Well 595 0.1 0.0Pond 0 0.0 0.0River/ditch/canal 595 0.1 0.0Others 198 0 0.0Magura Total 204293 100.0 1.0Tap 3168 1.6 32.4Tubewell 200954 98.4 0.5Well 171 0.1 0.0Pond 0 0.0 0.0River/ditch/canal 0 0.0 0.0Others 0 0.0 0.0Meherpur Total 165697 100.0 1.7Tap 6293 3.8 12.1Tubewell 159266 96.1 1.3Well 0 0.0 0.0Pond 0 0.0 0.0River/ditch/canal 69 0 0.0Others 69 0 0.0Narail Total 161961 100.0 2.0Tap 1826 1.1 40.7Tubewell 158444 97.8 1.6Well 68 0 0.0Pond 744 0.5 0.0River/ditch/canal 0 0.0 0.0Others 879 0.5 0.0Satkhira Total 467486 100.0 8.9Tap 27936 6.0 21.0Tubewell 373129 79.8 5.7Well 391 0.1 0.0Pond 56262 12.0 19.1River/ditch/canal 0 0.0 0.0Others 9768 2.1 36.0Rajshahi Division Total 4461097 100.0 1.0

National Series: Socio-economic and Demographic Report Page 135
Table H09: Main Sources of Drinking Water and Household Drinking Boiled/Bottled /Filtered Water by Zila, 2011
Main Sources of Drinking Water
Total Number of Household
Use of Drinking Water
Percentage of Household Drinking
Boiled/Bottled/Filtered Water
1 2 3 4 Tap 91680 2.1 7.7Tubewell 4322666 96.9 0.9Well 21206 0.5 0.2Pond 965 0 0.0River/ditch/canal 1286 0 0.0Others 23295 0.5 0.3Bogra Total 862161 100.0 0.3Tap 5038 0.6 0.0Tubewell 856403 99.3 0.3Well 0 0.0 0.0Pond 0 0.0 0.0River/ditch/canal 0 0.0 0.0Others 720 0.1 0.0Joypurhat Total 241792 100.0 1.3Tap 1311 0.5 23.1Tubewell 239473 99.0 1.1Well 0 0.0 0.0Pond 101 0 0.0River/ditch/canal 0 0.0 0.0Others 907 0.4 0.0Naogaon Total 653457 100.0 0.5Tap 5452 0.8 5.0Tubewell 632466 96.8 0.5Well 15539 2.4 0.0Pond 0 0.0 0.0River/ditch/canal 0 0.0 0.0Others 0 0.0 0.0Natore Total 422040 100.0 0.5Tap 1234 0.3 14.3Tubewell 420454 99.6 0.4Well 352 0.1 0.0Pond 0 0.0 0.0River/ditch/canal 0 0.0 0.0Others 0 0.0 0.0Chapai Nawabganj Total 353227 100.0 0.6Tap 28580 8.1 4.7Tubewell 319140 90.3 0.2Well 2828 0.8 0.0

National Series: Socio-economic and Demographic Report Page 136
Table H09: Main Sources of Drinking Water and Household Drinking Boiled/Bottled /Filtered Water by Zila, 2011
Main Sources of Drinking Water
Total Number of Household
Use of Drinking Water
Percentage of Household Drinking
Boiled/Bottled/Filtered Water
1 2 3 4 Pond 447 0.1 0.0River/ditch/canal 149 0 0.0Others 2084 0.6 0.0Pabna Total 587664 100.0 1.3Tap 3681 0.6 20.0Tubewell 567544 96.6 1.2Well 0 0.0 0.0Pond 0 0.0 0.0River/ditch/canal 245 0 0.0Others 16195 2.8 0.0Rajshahi Total 630068 100.0 2.2Tap 36580 5.8 9.2Tubewell 590760 93.8 1.8Well 2486 0.4 1.6Pond 121 0 0.0River/ditch/canal 0 0.0 0.0Others 121 0 66.7Sirajganj Total 710687 100.0 1.6Tap 9805 1.4 9.1Tubewell 696426 98.0 1.5Well 0 0.0 0.0Pond 297 0 0.0River/ditch/canal 891 0.1 0.0Others 3268 0.5 0.0Rangpur Division Total 3794607 100.0 1.1Tap 24618 0.6 30.7Tubewell 3734024 98.4 1.0Well 17153 0.5 0.0Pond 643 0 0.0River/ditch/canal 175 0 0.0Others 17994 0.5 1.4Dinajpur Total 707906 100.0 0.3Tap 2080 0.3 42.9Tubewell 702259 99.2 0.2Well 1486 0.2 0.0Pond 0 0.0 0.0River/ditch/canal 0 0.0 0.0Others 2080 0.3 0.0
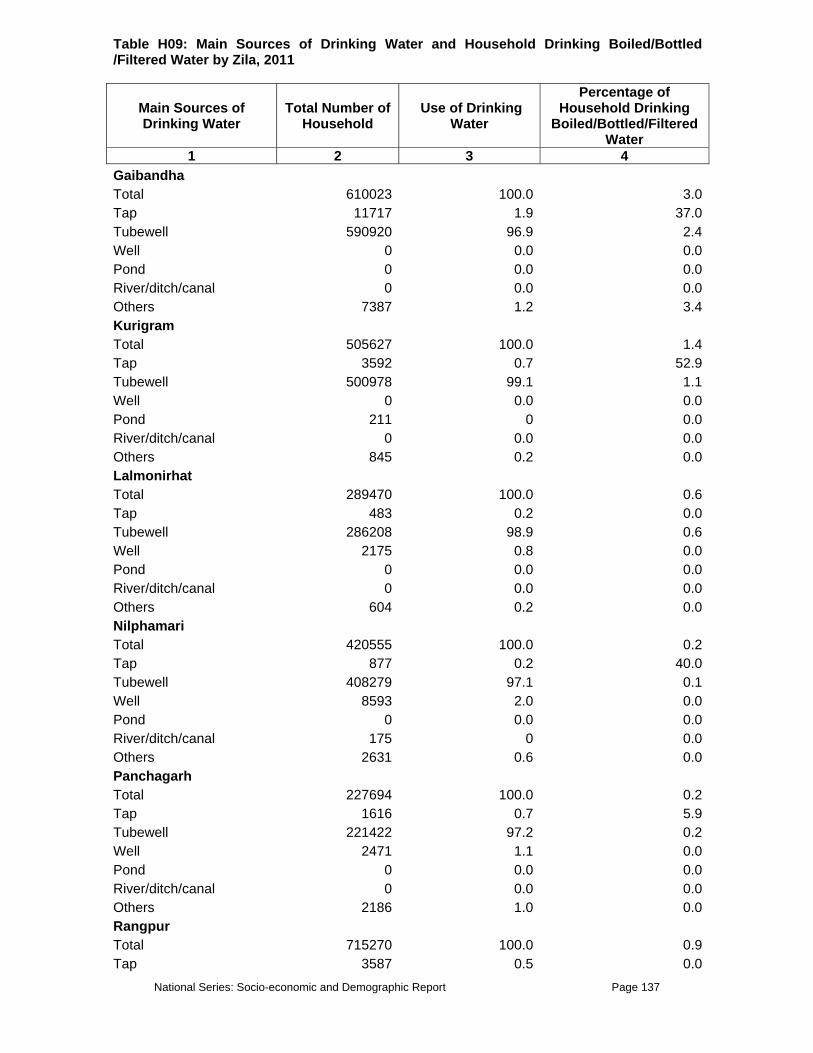
National Series: Socio-economic and Demographic Report Page 137
Table H09: Main Sources of Drinking Water and Household Drinking Boiled/Bottled /Filtered Water by Zila, 2011
Main Sources of Drinking Water
Total Number of Household
Use of Drinking Water
Percentage of Household Drinking
Boiled/Bottled/Filtered Water
1 2 3 4 Gaibandha Total 610023 100.0 3.0Tap 11717 1.9 37.0Tubewell 590920 96.9 2.4Well 0 0.0 0.0Pond 0 0.0 0.0River/ditch/canal 0 0.0 0.0Others 7387 1.2 3.4Kurigram Total 505627 100.0 1.4Tap 3592 0.7 52.9Tubewell 500978 99.1 1.1Well 0 0.0 0.0Pond 211 0 0.0River/ditch/canal 0 0.0 0.0Others 845 0.2 0.0Lalmonirhat Total 289470 100.0 0.6Tap 483 0.2 0.0Tubewell 286208 98.9 0.6Well 2175 0.8 0.0Pond 0 0.0 0.0River/ditch/canal 0 0.0 0.0Others 604 0.2 0.0Nilphamari Total 420555 100.0 0.2Tap 877 0.2 40.0Tubewell 408279 97.1 0.1Well 8593 2.0 0.0Pond 0 0.0 0.0River/ditch/canal 175 0 0.0Others 2631 0.6 0.0Panchagarh Total 227694 100.0 0.2Tap 1616 0.7 5.9Tubewell 221422 97.2 0.2Well 2471 1.1 0.0Pond 0 0.0 0.0River/ditch/canal 0 0.0 0.0Others 2186 1.0 0.0Rangpur Total 715270 100.0 0.9Tap 3587 0.5 0.0
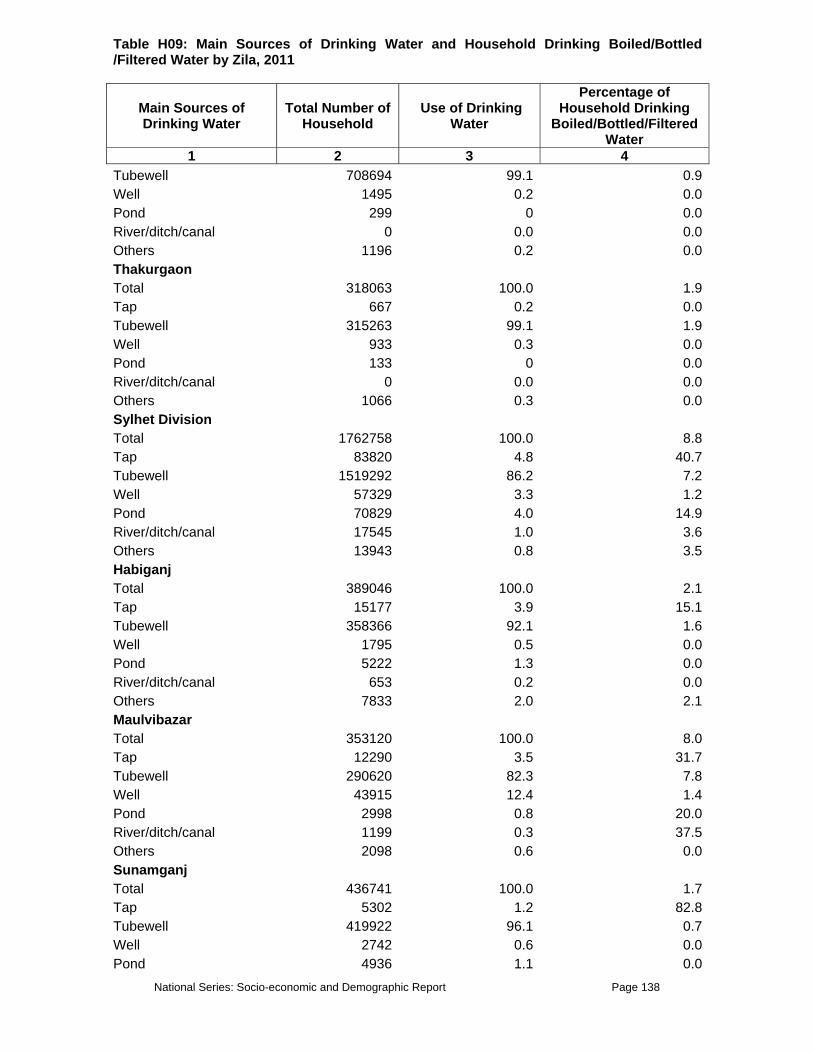
National Series: Socio-economic and Demographic Report Page 138
Table H09: Main Sources of Drinking Water and Household Drinking Boiled/Bottled /Filtered Water by Zila, 2011
Main Sources of Drinking Water
Total Number of Household
Use of Drinking Water
Percentage of Household Drinking
Boiled/Bottled/Filtered Water
1 2 3 4 Tubewell 708694 99.1 0.9Well 1495 0.2 0.0Pond 299 0 0.0River/ditch/canal 0 0.0 0.0Others 1196 0.2 0.0Thakurgaon Total 318063 100.0 1.9Tap 667 0.2 0.0Tubewell 315263 99.1 1.9Well 933 0.3 0.0Pond 133 0 0.0River/ditch/canal 0 0.0 0.0Others 1066 0.3 0.0Sylhet Division Total 1762758 100.0 8.8Tap 83820 4.8 40.7Tubewell 1519292 86.2 7.2Well 57329 3.3 1.2Pond 70829 4.0 14.9River/ditch/canal 17545 1.0 3.6Others 13943 0.8 3.5Habiganj Total 389046 100.0 2.1Tap 15177 3.9 15.1Tubewell 358366 92.1 1.6Well 1795 0.5 0.0Pond 5222 1.3 0.0River/ditch/canal 653 0.2 0.0Others 7833 2.0 2.1Maulvibazar Total 353120 100.0 8.0Tap 12290 3.5 31.7Tubewell 290620 82.3 7.8Well 43915 12.4 1.4Pond 2998 0.8 20.0River/ditch/canal 1199 0.3 37.5Others 2098 0.6 0.0Sunamganj Total 436741 100.0 1.7Tap 5302 1.2 82.8Tubewell 419922 96.1 0.7Well 2742 0.6 0.0Pond 4936 1.1 0.0

National Series: Socio-economic and Demographic Report Page 139
Table H09: Main Sources of Drinking Water and Household Drinking Boiled/Bottled /Filtered Water by Zila, 2011
Main Sources of Drinking Water
Total Number of Household
Use of Drinking Water
Percentage of Household Drinking
Boiled/Bottled/Filtered Water
1 2 3 4 River/ditch/canal 3291 0.8 5.6Others 548 0.1 0.0Sylhet Total 583850 100.0 19.1Tap 51051 8.7 46.0Tubewell 450383 77.1 17.3Well 8876 1.5 0.9Pond 57673 9.9 17.2River/ditch/canal 12403 2.1 0.0Others 3463 0.6 9.3
Table H10: Average Household Size by Residence, 1974 - 2011
Locality Year
1974 (Census)
1981 (Census)
1991 (Census)
2001 (Census)
2004 (Survey)
2011 (Survey)
1 2 3 4 5 6 7 Total 5.64 5.75 5.48 4.87 4.66 4.35Rural 5.62 5.73 5.48 4.89 4.68 4.36Urban 5.89 5.86 5.49 4.86 4.57 4.29

National Series: Socio-economic and Demographic Report Page 140
POPULATION CHARACTERISTICS TABLES TableP01 – TableP16

National Series: Socio-economic and Demographic Report Page 141
Table P01: Age at First Marriage of Ever Married Population by Age Group, Sex and Residence, 2011
Age
Group Number Age at First Marriage 15-19 20-24 25-29 30-34 35-39 40-44 45-49
1 2 3 4 5 6 7 8 9 Total 67662693 43.7 33.3 17.1 4.7 1 0.1 015-19 1911513 100 0 0 0 0 0 020-24 6651651 72.5 27.5 0 0 0 0 025-29 10128842 49.5 42 8.5 0 0 0 030-34 8811471 41.1 38 18.7 2.3 0 0 035-39 8927958 39.8 34.4 20 5.3 0.5 0 040-44 7397017 34.7 35.7 21.3 6.8 1.4 0.1 045-49 6332026 34.4 33.3 23.6 6.9 1.6 0.2 050-54 4976719 32.5 32.7 24.6 8.3 1.7 0.2 055-59 3478671 34.5 28.9 25.3 8.9 2.1 0.3 060-64 3470577 33.5 29.7 23.1 10.3 2.8 0.6 065+ 5576250 34.8 28.7 23.5 9.3 2.9 0.8 0.1 Male 32584426 10.5 46.3 31.8 9.2 1.9 0.3 015-19 223479 100 0 0 0 0 0 020-24 1669077 35.4 64.6 0 0 0 0 025-29 4132678 15.1 67.6 17.2 0 0 0 030-34 4349356 9.9 53.3 32.8 4 0 0 035-39 4448601 7.1 46.6 35.6 9.7 0.9 0 040-44 4103269 6.6 44.3 35.2 11.5 2.4 0.1 045-49 3462757 5.7 39.8 39.3 12.1 2.8 0.2 050-54 2872667 6.2 38 39.2 13.7 2.8 0.3 055-59 1937958 6.5 33.6 40.9 15.1 3.5 0.4 060-64 2027855 6.7 34.8 36.3 16.9 4.5 0.8 065+ 3356729 9.5 34.6 35.5 14.4 4.7 1.3 0.1 Female 35078267 74.6 21.2 3.4 0.6 0.1 0 015-19 1688034 100 0 0 0 0 0 020-24 4982574 84.9 15.1 0 0 0 0 025-29 5996164 73.2 24.4 2.5 0 0 0 030-34 4462115 71.5 23.1 4.9 0.5 0 0 035-39 4479357 72.3 22.2 4.5 1 0.1 0 040-44 3293747 69.8 25.1 4 0.8 0.3 0 045-49 2869269 69.1 25.4 4.5 0.7 0.1 0.1 050-54 2104052 68.5 25.4 4.8 1 0.2 0 055-59 1540713 69.8 23 5.7 1.1 0.3 0.3 060-64 1442722 71.3 22.5 4.6 1.1 0.4 0.2 065+ 2219521 73.2 19.6 5.3 1.5 0.3 0.1 0Rural Total 54564975 44.8 33.7 16.3 4.1 0.9 0.1 015-19 1556631 100 0 0 0 0 0 020-24 5413546 73 27 0 0 0 0 025-29 8088012 51 41.6 7.4 0 0 0 030-34 7031757 42.6 38.6 17 1.8 0 0 0

National Series: Socio-economic and Demographic Report Page 142
Table P01: Age at First Marriage of Ever Married Population by Age Group, Sex and Residence, 2011
Age
Group Number Age at First Marriage 15-19 20-24 25-29 30-34 35-39 40-44 45-49
1 2 3 4 5 6 7 8 9 35-39 7101056 40.7 35.6 19 4.3 0.4 0 040-44 5829707 35.7 36.9 20.6 5.6 1.2 0.1 045-49 5028451 35.6 34.1 22.9 6 1.3 0.1 050-54 4034304 33.7 33.7 23.8 7.3 1.4 0.2 055-59 2807799 36 29.9 24.1 7.9 1.9 0.3 060-64 2905089 34.5 30.3 22.6 9.7 2.3 0.5 065+ 4768623 35.1 29.5 23.3 8.6 2.8 0.8 0 Male 26177214 10.7 48.3 30.9 8.1 1.7 0.3 015-19 177258 100 0 0 0 0 0 020-24 1392924 34.9 65.1 0 0 0 0 025-29 3314521 15.4 69.1 15.5 0 0 0 030-34 3458793 10.2 56 30.5 3.3 0 0 035-39 3544886 7.5 49.7 34.2 7.9 0.6 0 040-44 3216461 6.8 46.8 34.7 9.7 1.9 0.1 045-49 2712159 5.9 42 39 10.5 2.4 0.2 050-54 2287598 6.3 40.3 38.7 12.1 2.4 0.2 055-59 1533736 6.8 35.9 40.1 13.7 3.3 0.3 060-64 1674247 6.9 36.1 36.2 16.1 3.8 0.8 065+ 2864630 9.6 35.8 35.5 13.3 4.4 1.2 0.1 Female 28387761 76.2 20.3 2.9 0.5 0.1 0 015-19 1379372 100 0 0 0 0 0 020-24 4020622 86.3 13.7 0 0 0 0 025-29 4773491 75.7 22.5 1.8 0 0 0 030-34 3572965 74 21.8 3.9 0.3 0 0 035-39 3556170 73.8 21.5 3.9 0.7 0.1 0 040-44 2613246 71.2 24.6 3.4 0.6 0.2 0 045-49 2316292 70.3 24.9 4.1 0.6 0.1 0.1 050-54 1746706 69.6 25 4.3 1 0.1 0 055-59 1274063 71.1 22.6 4.9 0.9 0.2 0.3 060-64 1230841 72 22.5 4.1 0.9 0.3 0.2 065+ 1903993 73.4 19.9 5 1.4 0.2 0.1 0Urban Total 13097718 39.3 31.3 20.4 7.3 1.5 0.2 015-19 354882 100 0 0 0 0 0 020-24 1238104 69.9 30.1 0 0 0 0 025-29 2040830 43.5 43.7 12.8 0 0 0 030-34 1779713 34.9 35.5 25.4 4.2 0 0 035-39 1826901 36.2 29.7 23.8 9.4 0.9 0 040-44 1567310 31.2 31.6 23.7 10.9 2.4 0.1 045-49 1303575 29.9 30.2 26.1 10.8 2.7 0.3 050-54 942415 27.6 28.4 28.1 12.7 2.9 0.2 055-59 670872 28.3 25 30.2 13.1 3 0.5 0

National Series: Socio-economic and Demographic Report Page 143
Table P01: Age at First Marriage of Ever Married Population by Age Group, Sex and Residence, 2011
Age
Group Number Age at First Marriage 15-19 20-24 25-29 30-34 35-39 40-44 45-49
1 2 3 4 5 6 7 8 9 60-64 565489 28.7 26.2 25.7 13.5 5.2 0.7 065+ 807627 33.4 24 24.3 13.4 3.9 0.9 0.2 Male 6407212 9.3 37.9 35.9 13.7 2.9 0.3 015-19 46220 100 0 0 0 0 0 020-24 276153 38 62 0 0 0 0 025-29 818157 14.2 61.7 24.1 0 0 0 030-34 890563 8.4 42.8 41.9 6.9 0 0 035-39 903715 5.6 34.5 41.4 16.7 1.8 0 040-44 886808 5.8 35.2 37 18.1 3.9 0.1 045-49 750599 4.8 32 40.7 17.8 4.5 0.4 050-54 585069 5.7 28.8 41 19.7 4.4 0.3 055-59 404222 5.2 25.2 43.9 20.4 4.6 0.7 060-64 353608 5.6 28.4 36.6 20.6 8 0.9 065+ 492099 8.6 27.7 35.2 20.8 6 1.4 0.3 Female 6690506 68.1 25.1 5.6 1.1 0.2 0 015-19 308662 100 0 0 0 0 0 020-24 961952 79 21 0 0 0 0 025-29 1222674 63.1 31.6 5.2 0 0 0 030-34 889151 61.4 28.2 8.8 1.5 0 0 035-39 923186 66.2 24.9 6.6 2.2 0.1 0 040-44 680502 64.4 27 6.4 1.6 0.6 0.1 045-49 552976 64.1 27.8 6.4 1.2 0.4 0.1 050-54 357346 63.5 27.7 7.1 1.2 0.4 0 055-59 266649 63.2 24.6 9.5 2 0.4 0.2 060-64 211881 67.2 22.5 7.6 1.8 0.6 0.3 065+ 315528 72 18.3 7.2 1.9 0.5 0.1 0
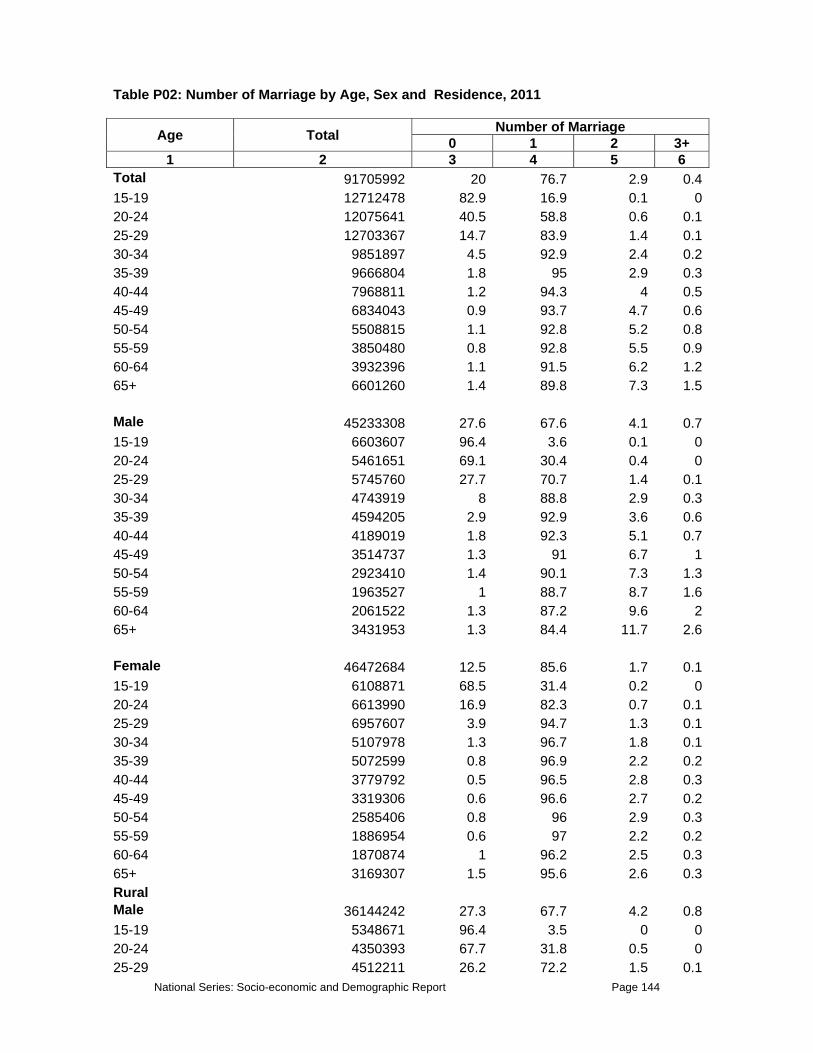
National Series: Socio-economic and Demographic Report Page 144
Table P02: Number of Marriage by Age, Sex and Residence, 2011
Age Total Number of Marriage 0 1 2 3+
1 2 3 4 5 6 Total 91705992 20 76.7 2.9 0.415-19 12712478 82.9 16.9 0.1 020-24 12075641 40.5 58.8 0.6 0.125-29 12703367 14.7 83.9 1.4 0.130-34 9851897 4.5 92.9 2.4 0.235-39 9666804 1.8 95 2.9 0.340-44 7968811 1.2 94.3 4 0.545-49 6834043 0.9 93.7 4.7 0.650-54 5508815 1.1 92.8 5.2 0.855-59 3850480 0.8 92.8 5.5 0.960-64 3932396 1.1 91.5 6.2 1.265+ 6601260 1.4 89.8 7.3 1.5 Male 45233308 27.6 67.6 4.1 0.715-19 6603607 96.4 3.6 0.1 020-24 5461651 69.1 30.4 0.4 025-29 5745760 27.7 70.7 1.4 0.130-34 4743919 8 88.8 2.9 0.335-39 4594205 2.9 92.9 3.6 0.640-44 4189019 1.8 92.3 5.1 0.745-49 3514737 1.3 91 6.7 150-54 2923410 1.4 90.1 7.3 1.355-59 1963527 1 88.7 8.7 1.660-64 2061522 1.3 87.2 9.6 265+ 3431953 1.3 84.4 11.7 2.6 Female 46472684 12.5 85.6 1.7 0.115-19 6108871 68.5 31.4 0.2 020-24 6613990 16.9 82.3 0.7 0.125-29 6957607 3.9 94.7 1.3 0.130-34 5107978 1.3 96.7 1.8 0.135-39 5072599 0.8 96.9 2.2 0.240-44 3779792 0.5 96.5 2.8 0.345-49 3319306 0.6 96.6 2.7 0.250-54 2585406 0.8 96 2.9 0.355-59 1886954 0.6 97 2.2 0.260-64 1870874 1 96.2 2.5 0.365+ 3169307 1.5 95.6 2.6 0.3Rural Male 36144242 27.3 67.7 4.2 0.815-19 5348671 96.4 3.5 0 020-24 4350393 67.7 31.8 0.5 025-29 4512211 26.2 72.2 1.5 0.1

National Series: Socio-economic and Demographic Report Page 145
Table P02: Number of Marriage by Age, Sex and Residence, 2011
Age Total Number of Marriage 0 1 2 3+
1 2 3 4 5 6 30-34 3738572 7.2 89.4 3 0.435-39 3651864 2.7 93 3.7 0.640-44 3282231 1.8 92.2 5.2 0.845-49 2751394 1.3 90.6 7 1.150-54 2328181 1.4 89.6 7.6 1.455-59 1555038 1 88.2 9.1 1.760-64 1700679 1.2 87 9.8 265+ 2925009 1.2 84.2 11.9 2.7 Female 37108586 11.5 86.6 1.7 0.215-19 4759853 66.9 32.9 0.2 020-24 5151186 14.3 84.9 0.7 0.125-29 5480128 3.1 95.6 1.2 0.130-34 4070351 1 97 1.8 0.235-39 4015082 0.7 96.8 2.3 0.240-44 2990659 0.5 96.4 2.8 0.345-49 2672578 0.5 96.4 2.8 0.250-54 2128941 0.8 96.1 2.9 0.355-59 1556629 0.6 96.9 2.3 0.260-64 1579152 1.1 96.1 2.5 0.465+ 2704027 1.6 95.5 2.7 0.3Urban Male 9089066 29.1 67 3.5 0.415-19 1254936 96 3.8 0.1 020-24 1111258 74.7 25.1 0.2 0.125-29 1233549 33.2 65.4 1.3 0.130-34 1005347 10.8 86.2 2.9 035-39 942341 3.8 92.4 3.4 0.440-44 906788 2.1 92.9 4.6 0.545-49 763343 1.5 92.6 5.4 0.550-54 595229 1.3 91.9 6 0.855-59 408488 0.8 91 7.2 160-64 360843 1.5 88.3 8.5 1.765+ 506943 1.8 85.8 10.5 1.8 Female 9364099 16.5 82 1.5 0.115-19 1349018 73.8 26.1 0 020-24 1462804 26.1 73.3 0.5 0.125-29 1477479 6.8 91.5 1.7 030-34 1037628 2.5 95.5 1.9 0.135-39 1057516 1.3 97.1 1.5 0.140-44 789132 0.8 96.6 2.6 045-49 646728 0.6 97 2.2 0.150-54 456465 1.1 95.6 3 0.2
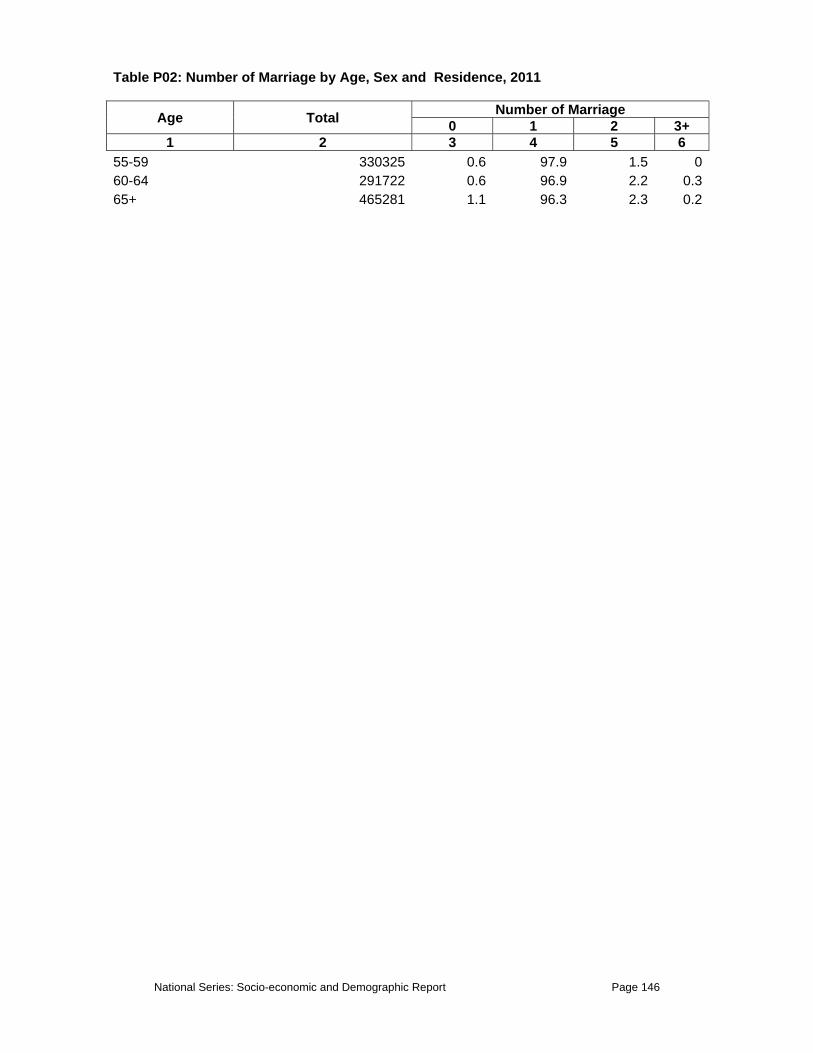
National Series: Socio-economic and Demographic Report Page 146
Table P02: Number of Marriage by Age, Sex and Residence, 2011
Age Total Number of Marriage 0 1 2 3+
1 2 3 4 5 6 55-59 330325 0.6 97.9 1.5 060-64 291722 0.6 96.9 2.2 0.365+ 465281 1.1 96.3 2.3 0.2

National Series: Socio-economic and Demographic Report Page 147
Table P03: Number of Wives for Ever Married Men by Age and Residence, 2011
Age Number Number of Wives 0 1 2 3+
1 2 3 4 5 6 Total 2158509 2.6 94.7 2.7 015-19 3830 13.6 86.4 0.0 0.020-24 23546 3.6 96.4 0.0 0.025-29 90022 3.3 96.6 0.2 0.030-34 153516 3.2 94.6 2.2 0.035-39 193559 2.1 94.3 3.6 0.040-44 245057 2.4 94.7 2.9 0.045-49 269830 2.1 95.4 2.5 0.050-54 249807 1.7 95.4 2.8 0.155-59 201684 1.6 94.4 4.0 0.060-64 238163 1.7 94.9 3.3 0.165+ 489494 4.0 93.9 2.0 0.1 Rural 1806077 2.6 94.5 2.8 0.115-19 1960 24.5 75.5 0.0 0.020-24 20755 2.0 98.0 0.0 0.025-29 72182 3.7 96.1 0.2 0.030-34 123751 3.3 94.7 1.9 0.035-39 157873 2.5 93.8 3.7 0.040-44 199265 2.8 93.7 3.5 0.045-49 224779 2.3 95.0 2.7 0.050-54 209199 1.2 95.9 2.7 0.155-59 168199 1.8 93.8 4.4 0.060-64 201329 1.3 95.0 3.5 0.265+ 426785 3.9 93.9 2.1 0.1 Urban 352432 2.4 95.7 1.9 0.015-19 1870 2.2 97.8 0.0 0.020-24 2791 15.7 84.3 0.0 0.025-29 17840 1.7 98.3 0.0 0.030-34 29765 2.6 93.9 3.4 0.035-39 35686 0.3 96.4 3.3 0.040-44 45792 0.6 98.9 0.4 0.045-49 45051 1.1 97.5 1.5 0.050-54 40608 4.0 92.8 3.2 0.055-59 33485 0.6 97.4 1.9 0.060-64 36833 3.8 94.2 2.0 0.065+ 62709 4.5 94.0 1.6 0.0

National Series: Socio-economic and Demographic Report Page 148
Table P04: Survival Status of Parents for Population Aged 0 to 18 by Age, Sex and Residence, 2011
Age Number
Survival Status
Only Father Alive
Only Mother Alive
Both Father and Mother
Alive
Both Father and Mother
Dead Unknown
1 2 3 4 5 6 7 Total 58316624 1.2 3.7 94.6 0.3 0.10-4 14326250 0.6 0.9 98.2 0.1 0.15-9 17201017 1.0 2.2 96.5 0.2 0.110-14 16019423 1.5 4.6 93.4 0.3 0.115-18 10769934 2.0 8.3 88.6 0.9 0.1 Male 30026135 1.2 3.7 94.8 0.3 0.10-4 7265907 0.6 0.9 98.3 0.1 0.15-9 8730750 1.0 2.2 96.5 0.1 0.110-14 8284907 1.4 4.6 93.5 0.3 0.115-18 5744572 1.9 8.0 89.5 0.5 0.1 Female 28290489 1.3 3.7 94.5 0.4 0.10-4 7060343 0.7 0.9 98.2 0.1 0.15-9 8470268 1.0 2.2 96.5 0.2 0.110-14 7734517 1.6 4.5 93.4 0.3 0.215-18 5025361 2.1 8.7 87.6 1.4 0.1Rural Total 47853549 1.3 3.6 94.6 0.3 0.10-4 11831377 0.6 0.9 98.2 0.1 0.15-9 14332668 1.1 2.2 96.4 0.2 0.110-14 13093281 1.6 4.6 93.4 0.3 0.115-18 8596223 2.1 8.2 88.7 0.9 0.1 Male 24778443 1.2 3.7 94.7 0.3 0.10-4 6007031 0.6 0.9 98.2 0.1 0.15-9 7297698 1.1 2.3 96.4 0.2 0.110-14 6797507 1.5 4.7 93.4 0.3 0.115-18 4676207 2.0 7.9 89.4 0.6 0.1 Female 23075106 1.3 3.6 94.6 0.4 0.10-4 5824346 0.7 0.9 98.2 0.1 0.15-9 7034970 1.1 2.2 96.5 0.2 0.110-14 6295774 1.6 4.5 93.4 0.3 0.215-18 3920016 2.2 8.6 87.7 1.4 0.1Urban Total 10463075 1.1 3.9 94.5 0.4 0.10-4 2494873 0.6 0.9 98.4 0 0.15-9 2868349 0.7 2.3 96.8 0.1 0.110-14 2926142 1.4 4.5 93.5 0.4 0.1

National Series: Socio-economic and Demographic Report Page 149
Table P04: Survival Status of Parents for Population Aged 0 to 18 by Age, Sex and Residence, 2011
Age Number
Survival Status
Only Father Alive
Only Mother Alive
Both Father and Mother
Alive
Both Father and Mother
Dead Unknown
1 2 3 4 5 6 7 15-18 2173711 1.7 8.7 88.4 1.0 0.3 Male 5247693 1.0 3.7 95.0 0.3 0.10-4 1258876 0.5 0.9 98.5 0 0.15-9 1433052 0.7 2.0 97.1 0.1 0.110-14 1487399 1.3 4.5 93.8 0.5 0.115-18 1068365 1.6 8.2 89.7 0.4 0.2 Female 5215383 1.2 4.1 94.0 0.5 0.20-4 1235997 0.7 1.0 98.3 0 0.15-9 1435298 0.8 2.6 96.4 0.2 0.110-14 1438743 1.6 4.5 93.3 0.4 0.215-18 1105345 1.8 9.2 87.2 1.5 0.4
Table P05: Percent with Bangla as Mother Tongue by Sex and Residence, 2011
Sex Number Total Rural Urban
Mother Tongue Mother Tongue Mother Tongue Bangla Other Bangla Other Bangla Other
1 2 3 4 5 6 7 8 Total 107725415 98.8 1.2 98.9 1.1 98.8 1.2Male 53518214 98.8 1.2 98.8 1.2 98.8 1.2Female 54207201 98.9 1.1 98.9 1.1 98.8 1.2
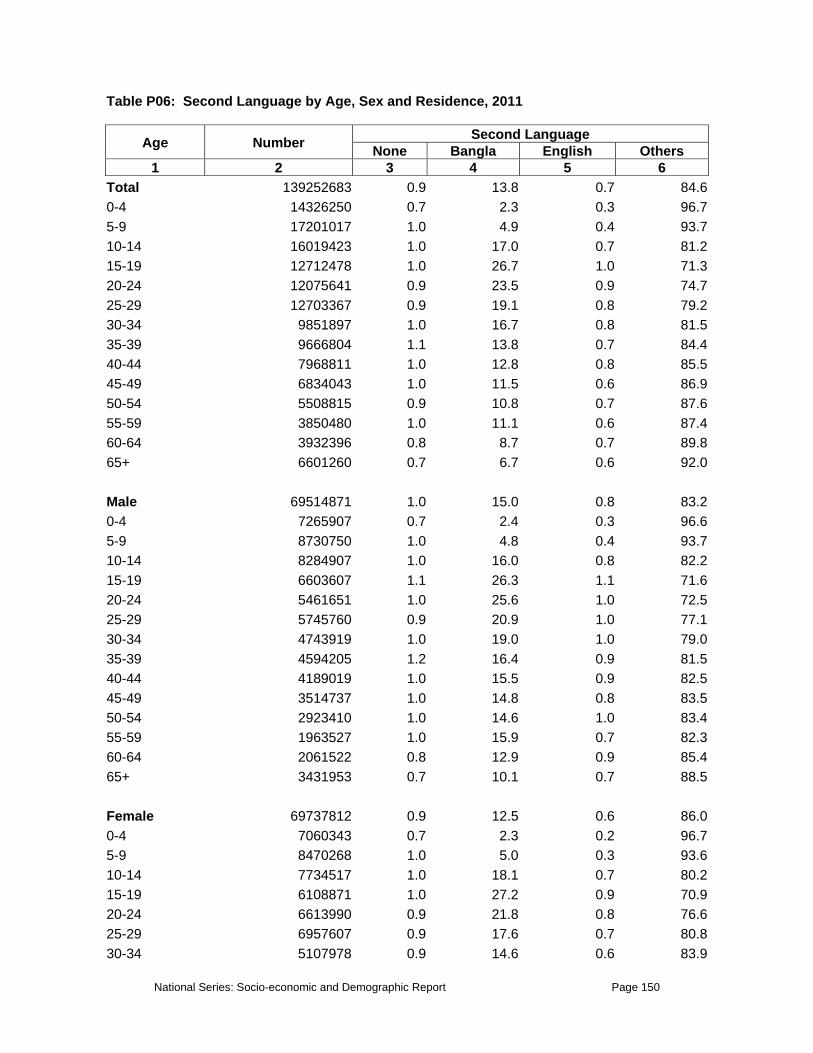
National Series: Socio-economic and Demographic Report Page 150
Table P06: Second Language by Age, Sex and Residence, 2011
Age Number Second Language None Bangla English Others
1 2 3 4 5 6 Total 139252683 0.9 13.8 0.7 84.60-4 14326250 0.7 2.3 0.3 96.75-9 17201017 1.0 4.9 0.4 93.710-14 16019423 1.0 17.0 0.7 81.215-19 12712478 1.0 26.7 1.0 71.320-24 12075641 0.9 23.5 0.9 74.725-29 12703367 0.9 19.1 0.8 79.230-34 9851897 1.0 16.7 0.8 81.535-39 9666804 1.1 13.8 0.7 84.440-44 7968811 1.0 12.8 0.8 85.545-49 6834043 1.0 11.5 0.6 86.950-54 5508815 0.9 10.8 0.7 87.655-59 3850480 1.0 11.1 0.6 87.460-64 3932396 0.8 8.7 0.7 89.865+ 6601260 0.7 6.7 0.6 92.0 Male 69514871 1.0 15.0 0.8 83.20-4 7265907 0.7 2.4 0.3 96.65-9 8730750 1.0 4.8 0.4 93.710-14 8284907 1.0 16.0 0.8 82.215-19 6603607 1.1 26.3 1.1 71.620-24 5461651 1.0 25.6 1.0 72.525-29 5745760 0.9 20.9 1.0 77.130-34 4743919 1.0 19.0 1.0 79.035-39 4594205 1.2 16.4 0.9 81.540-44 4189019 1.0 15.5 0.9 82.545-49 3514737 1.0 14.8 0.8 83.550-54 2923410 1.0 14.6 1.0 83.455-59 1963527 1.0 15.9 0.7 82.360-64 2061522 0.8 12.9 0.9 85.465+ 3431953 0.7 10.1 0.7 88.5 Female 69737812 0.9 12.5 0.6 86.00-4 7060343 0.7 2.3 0.2 96.75-9 8470268 1.0 5.0 0.3 93.610-14 7734517 1.0 18.1 0.7 80.215-19 6108871 1.0 27.2 0.9 70.920-24 6613990 0.9 21.8 0.8 76.625-29 6957607 0.9 17.6 0.7 80.830-34 5107978 0.9 14.6 0.6 83.9
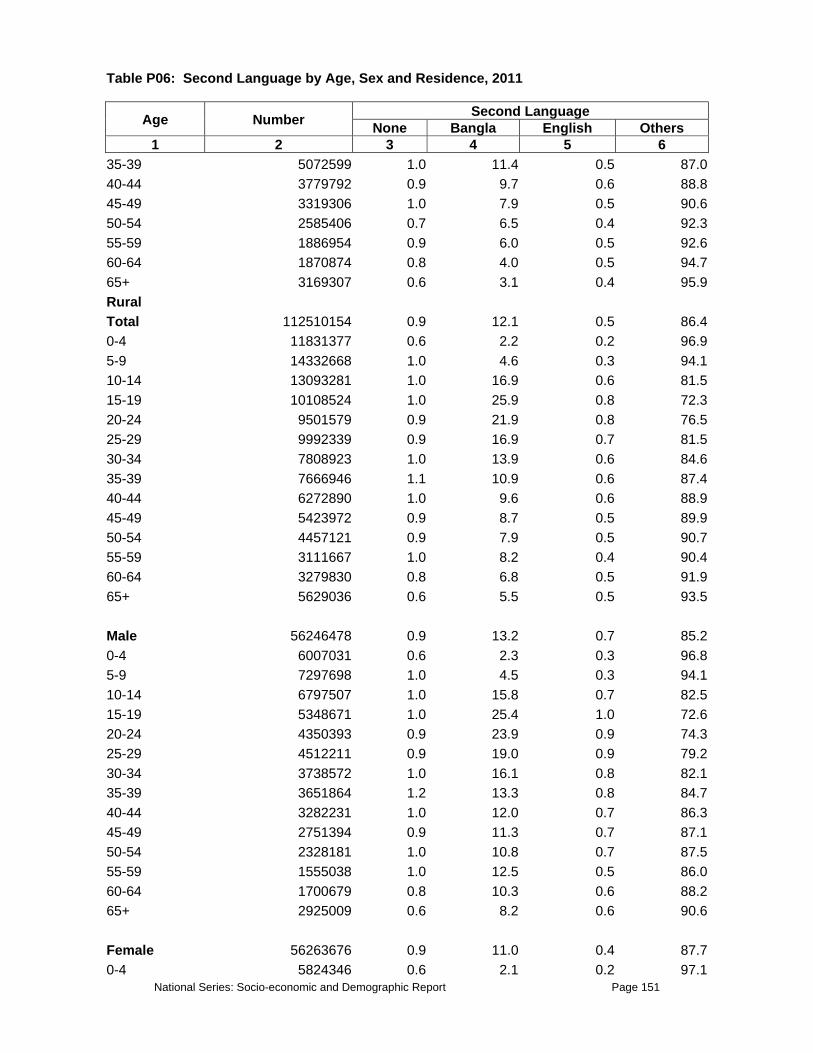
National Series: Socio-economic and Demographic Report Page 151
Table P06: Second Language by Age, Sex and Residence, 2011
Age Number Second Language None Bangla English Others
1 2 3 4 5 6 35-39 5072599 1.0 11.4 0.5 87.040-44 3779792 0.9 9.7 0.6 88.845-49 3319306 1.0 7.9 0.5 90.650-54 2585406 0.7 6.5 0.4 92.355-59 1886954 0.9 6.0 0.5 92.660-64 1870874 0.8 4.0 0.5 94.765+ 3169307 0.6 3.1 0.4 95.9Rural Total 112510154 0.9 12.1 0.5 86.40-4 11831377 0.6 2.2 0.2 96.95-9 14332668 1.0 4.6 0.3 94.110-14 13093281 1.0 16.9 0.6 81.515-19 10108524 1.0 25.9 0.8 72.320-24 9501579 0.9 21.9 0.8 76.525-29 9992339 0.9 16.9 0.7 81.530-34 7808923 1.0 13.9 0.6 84.635-39 7666946 1.1 10.9 0.6 87.440-44 6272890 1.0 9.6 0.6 88.945-49 5423972 0.9 8.7 0.5 89.950-54 4457121 0.9 7.9 0.5 90.755-59 3111667 1.0 8.2 0.4 90.460-64 3279830 0.8 6.8 0.5 91.965+ 5629036 0.6 5.5 0.5 93.5 Male 56246478 0.9 13.2 0.7 85.20-4 6007031 0.6 2.3 0.3 96.85-9 7297698 1.0 4.5 0.3 94.110-14 6797507 1.0 15.8 0.7 82.515-19 5348671 1.0 25.4 1.0 72.620-24 4350393 0.9 23.9 0.9 74.325-29 4512211 0.9 19.0 0.9 79.230-34 3738572 1.0 16.1 0.8 82.135-39 3651864 1.2 13.3 0.8 84.740-44 3282231 1.0 12.0 0.7 86.345-49 2751394 0.9 11.3 0.7 87.150-54 2328181 1.0 10.8 0.7 87.555-59 1555038 1.0 12.5 0.5 86.060-64 1700679 0.8 10.3 0.6 88.265+ 2925009 0.6 8.2 0.6 90.6 Female 56263676 0.9 11.0 0.4 87.70-4 5824346 0.6 2.1 0.2 97.1
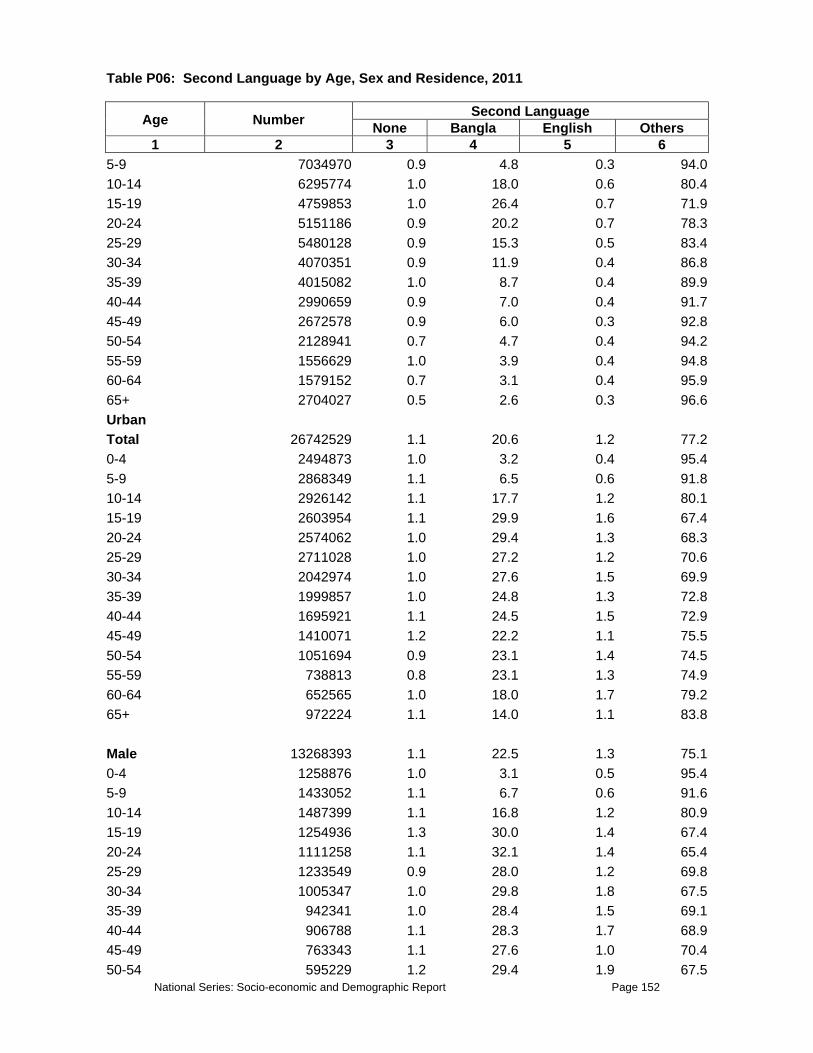
National Series: Socio-economic and Demographic Report Page 152
Table P06: Second Language by Age, Sex and Residence, 2011
Age Number Second Language None Bangla English Others
1 2 3 4 5 6 5-9 7034970 0.9 4.8 0.3 94.010-14 6295774 1.0 18.0 0.6 80.415-19 4759853 1.0 26.4 0.7 71.920-24 5151186 0.9 20.2 0.7 78.325-29 5480128 0.9 15.3 0.5 83.430-34 4070351 0.9 11.9 0.4 86.835-39 4015082 1.0 8.7 0.4 89.940-44 2990659 0.9 7.0 0.4 91.745-49 2672578 0.9 6.0 0.3 92.850-54 2128941 0.7 4.7 0.4 94.255-59 1556629 1.0 3.9 0.4 94.860-64 1579152 0.7 3.1 0.4 95.965+ 2704027 0.5 2.6 0.3 96.6Urban Total 26742529 1.1 20.6 1.2 77.20-4 2494873 1.0 3.2 0.4 95.45-9 2868349 1.1 6.5 0.6 91.810-14 2926142 1.1 17.7 1.2 80.115-19 2603954 1.1 29.9 1.6 67.420-24 2574062 1.0 29.4 1.3 68.325-29 2711028 1.0 27.2 1.2 70.630-34 2042974 1.0 27.6 1.5 69.935-39 1999857 1.0 24.8 1.3 72.840-44 1695921 1.1 24.5 1.5 72.945-49 1410071 1.2 22.2 1.1 75.550-54 1051694 0.9 23.1 1.4 74.555-59 738813 0.8 23.1 1.3 74.960-64 652565 1.0 18.0 1.7 79.265+ 972224 1.1 14.0 1.1 83.8 Male 13268393 1.1 22.5 1.3 75.10-4 1258876 1.0 3.1 0.5 95.45-9 1433052 1.1 6.7 0.6 91.610-14 1487399 1.1 16.8 1.2 80.915-19 1254936 1.3 30.0 1.4 67.420-24 1111258 1.1 32.1 1.4 65.425-29 1233549 0.9 28.0 1.2 69.830-34 1005347 1.0 29.8 1.8 67.535-39 942341 1.0 28.4 1.5 69.140-44 906788 1.1 28.3 1.7 68.945-49 763343 1.1 27.6 1.0 70.450-54 595229 1.2 29.4 1.9 67.5
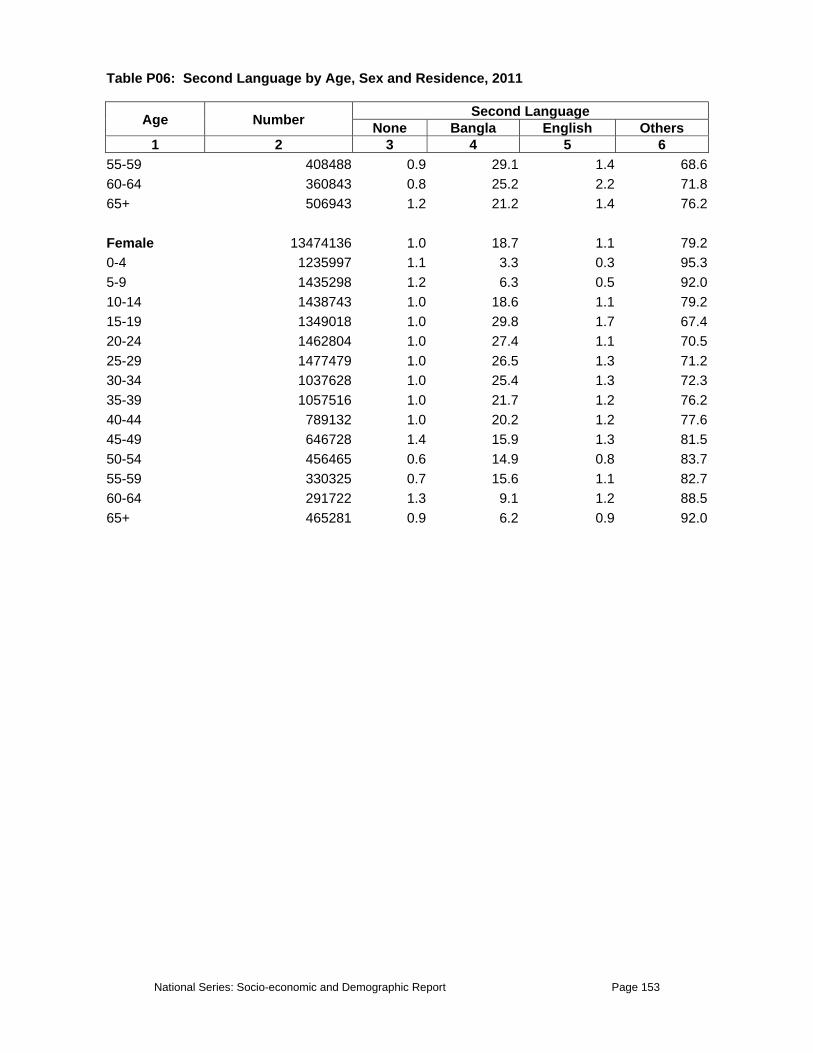
National Series: Socio-economic and Demographic Report Page 153
Table P06: Second Language by Age, Sex and Residence, 2011
Age Number Second Language None Bangla English Others
1 2 3 4 5 6 55-59 408488 0.9 29.1 1.4 68.660-64 360843 0.8 25.2 2.2 71.865+ 506943 1.2 21.2 1.4 76.2 Female 13474136 1.0 18.7 1.1 79.20-4 1235997 1.1 3.3 0.3 95.35-9 1435298 1.2 6.3 0.5 92.010-14 1438743 1.0 18.6 1.1 79.215-19 1349018 1.0 29.8 1.7 67.420-24 1462804 1.0 27.4 1.1 70.525-29 1477479 1.0 26.5 1.3 71.230-34 1037628 1.0 25.4 1.3 72.335-39 1057516 1.0 21.7 1.2 76.240-44 789132 1.0 20.2 1.2 77.645-49 646728 1.4 15.9 1.3 81.550-54 456465 0.6 14.9 0.8 83.755-59 330325 0.7 15.6 1.1 82.760-64 291722 1.3 9.1 1.2 88.565+ 465281 0.9 6.2 0.9 92.0

National Series: Socio-economic and Demographic Report Page 154
Table P07: Percentage of Literate Population Aged 7 Years and above by Age, Sex and Zila, 2011
Age Number Literacy
Cannot Read and Write Can Read Only Can Read and
Write 1 2 3 4 5
Total 118360739 36.1 7.8 56.17-9 10635324 31.4 29.8 38.710-14 16019423 11.6 10.7 77.715-19 12712478 13.4 4.1 82.520-24 12075641 19.5 5.1 75.425-29 12703367 28.9 5.5 65.630-34 9851897 38.8 5.5 55.835-39 9666804 47.6 5.2 47.240-44 7968811 53.4 4.9 41.745-49 6834043 56.0 4.8 39.250-54 5508815 60.5 4.5 35.055-59 3850480 61.1 4.1 34.860-64 3932396 68.6 4.0 27.365+ 6601260 73.7 3.5 22.8 Male 58939466 33.2 8.0 58.87-9 5421252 32.7 29.6 37.710-14 8284907 13.7 11.7 74.615-19 6603607 14.8 4.5 80.720-24 5461651 18.6 5.1 76.325-29 5745760 26.9 5.4 67.730-34 4743919 35.2 5.1 59.735-39 4594205 42.6 4.8 52.640-44 4189019 47.5 4.7 47.845-49 3514737 48.9 4.4 46.750-54 2923410 52.0 4.4 43.655-59 1963527 49.3 3.8 46.960-64 2061522 56.8 4.3 38.965+ 3431953 62.9 4.0 33.2 Female 59421273 38.9 7.7 53.47-9 5214072 30.2 30.1 39.810-14 7734517 9.4 9.6 81.015-19 6108871 11.9 3.7 84.420-24 6613990 20.3 5.0 74.725-29 6957607 30.5 5.7 63.830-34 5107978 42.1 5.8 52.235-39 5072599 52.2 5.5 42.340-44 3779792 60.0 5.1 35.045-49 3319306 63.5 5.2 31.250-54 2585406 70.2 4.5 25.3
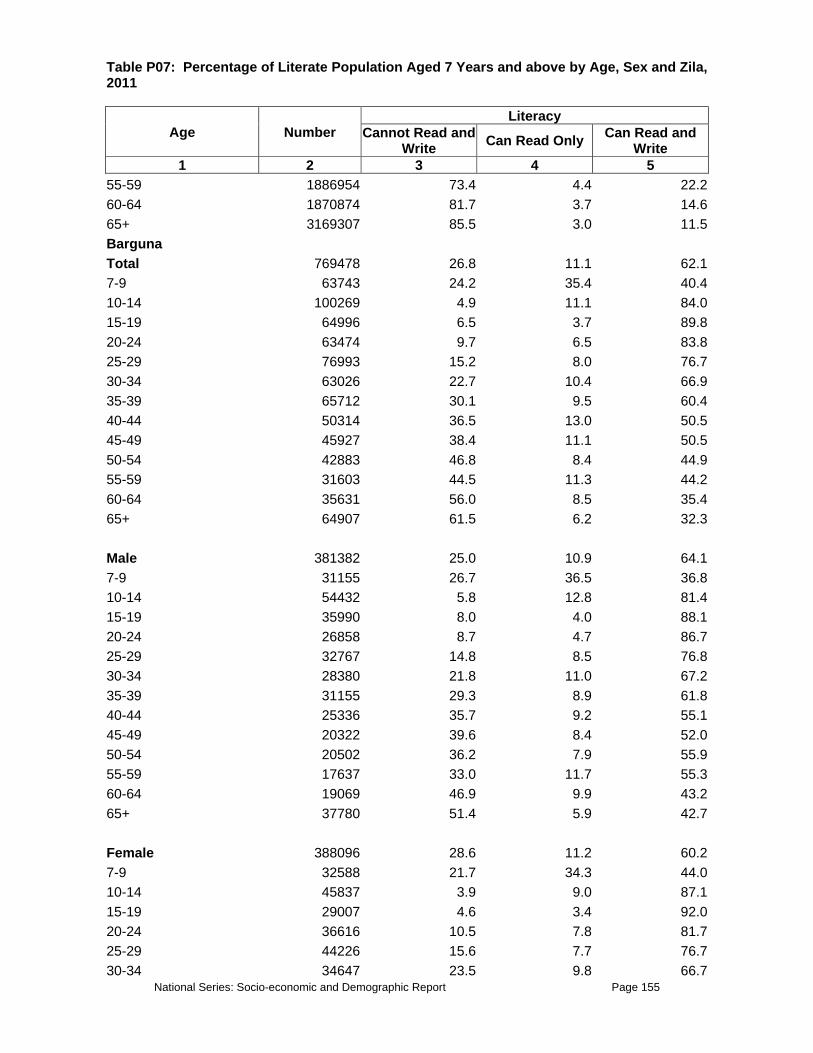
National Series: Socio-economic and Demographic Report Page 155
Table P07: Percentage of Literate Population Aged 7 Years and above by Age, Sex and Zila, 2011
Age Number Literacy
Cannot Read and Write Can Read Only Can Read and
Write 1 2 3 4 5
55-59 1886954 73.4 4.4 22.260-64 1870874 81.7 3.7 14.665+ 3169307 85.5 3.0 11.5Barguna Total 769478 26.8 11.1 62.17-9 63743 24.2 35.4 40.410-14 100269 4.9 11.1 84.015-19 64996 6.5 3.7 89.820-24 63474 9.7 6.5 83.825-29 76993 15.2 8.0 76.730-34 63026 22.7 10.4 66.935-39 65712 30.1 9.5 60.440-44 50314 36.5 13.0 50.545-49 45927 38.4 11.1 50.550-54 42883 46.8 8.4 44.955-59 31603 44.5 11.3 44.260-64 35631 56.0 8.5 35.465+ 64907 61.5 6.2 32.3 Male 381382 25.0 10.9 64.17-9 31155 26.7 36.5 36.810-14 54432 5.8 12.8 81.415-19 35990 8.0 4.0 88.120-24 26858 8.7 4.7 86.725-29 32767 14.8 8.5 76.830-34 28380 21.8 11.0 67.235-39 31155 29.3 8.9 61.840-44 25336 35.7 9.2 55.145-49 20322 39.6 8.4 52.050-54 20502 36.2 7.9 55.955-59 17637 33.0 11.7 55.360-64 19069 46.9 9.9 43.265+ 37780 51.4 5.9 42.7 Female 388096 28.6 11.2 60.27-9 32588 21.7 34.3 44.010-14 45837 3.9 9.0 87.115-19 29007 4.6 3.4 92.020-24 36616 10.5 7.8 81.725-29 44226 15.6 7.7 76.730-34 34647 23.5 9.8 66.7

National Series: Socio-economic and Demographic Report Page 156
Table P07: Percentage of Literate Population Aged 7 Years and above by Age, Sex and Zila, 2011
Age Number Literacy
Cannot Read and Write Can Read Only Can Read and
Write 1 2 3 4 5
35-39 34557 30.8 10.1 59.140-44 24978 37.3 16.8 45.945-49 25605 37.4 13.3 49.350-54 22382 56.4 8.8 34.855-59 13966 59.0 10.9 30.160-64 16562 66.5 7.0 26.565+ 27126 75.6 6.6 17.8 Barisal Total 2025987 27.2 8.6 64.27-9 179022 27.9 25.9 46.210-14 300867 9.3 7.9 82.715-19 226138 10.2 3.3 86.520-24 179965 12.1 5.1 82.825-29 171029 17.0 6.3 76.730-34 154787 21.4 7.6 71.135-39 163015 29.7 8.1 62.240-44 140180 38.0 9.1 52.945-49 117224 38.9 9.4 51.750-54 99434 46.4 8.2 45.555-59 73256 46.6 8.2 45.360-64 80703 59.9 8.0 32.065+ 140366 64.1 5.5 30.4 Male 1025050 25.5 8.6 65.97-9 94159 28.3 26.4 45.310-14 156454 12.5 8.7 78.815-19 123078 12.7 3.8 83.520-24 88832 14.4 5.1 80.525-29 76642 15.1 6.8 78.230-34 69701 19.9 5.3 74.835-39 75319 28.6 6.3 65.140-44 77498 32.9 9.4 57.745-49 57391 33.2 10.2 56.750-54 54289 38.7 6.6 54.755-59 36606 41.0 7.0 52.060-64 41634 52.1 8.9 39.065+ 73446 51.3 5.3 43.4 Female 1000937 28.9 8.6 62.57-9 84862 27.5 25.3 47.210-14 144413 5.9 7.1 87.0
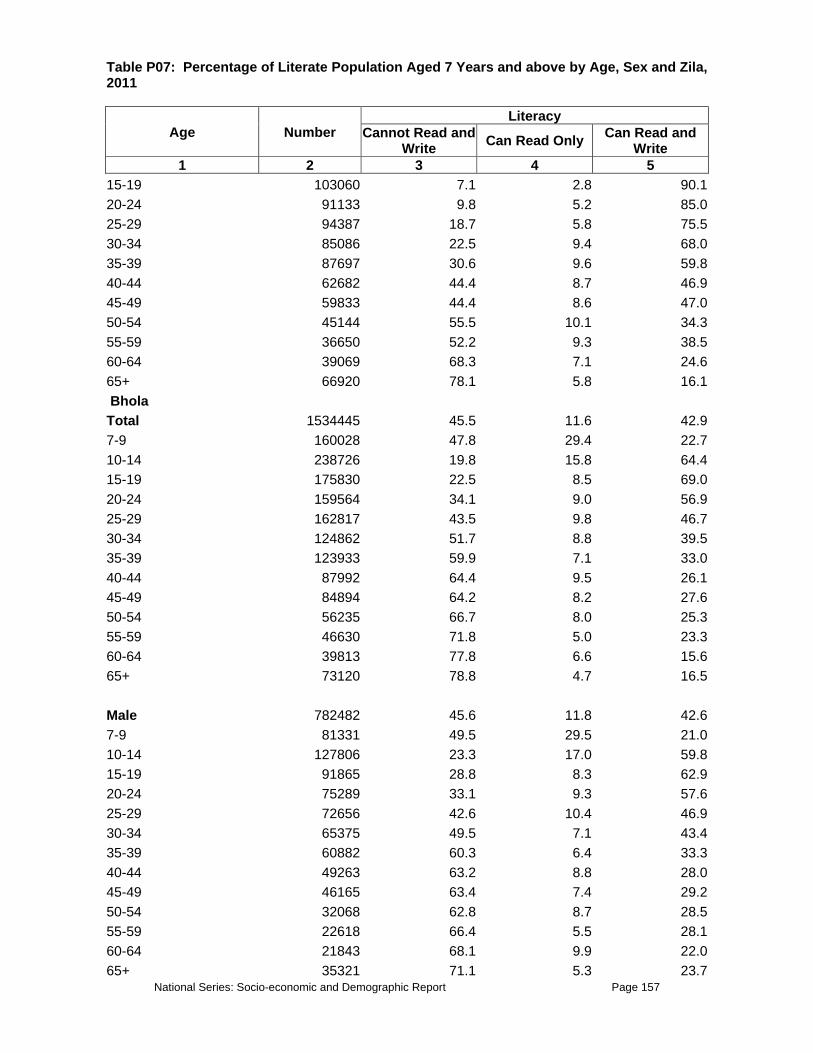
National Series: Socio-economic and Demographic Report Page 157
Table P07: Percentage of Literate Population Aged 7 Years and above by Age, Sex and Zila, 2011
Age Number Literacy
Cannot Read and Write Can Read Only Can Read and
Write 1 2 3 4 5
15-19 103060 7.1 2.8 90.120-24 91133 9.8 5.2 85.025-29 94387 18.7 5.8 75.530-34 85086 22.5 9.4 68.035-39 87697 30.6 9.6 59.840-44 62682 44.4 8.7 46.945-49 59833 44.4 8.6 47.050-54 45144 55.5 10.1 34.355-59 36650 52.2 9.3 38.560-64 39069 68.3 7.1 24.665+ 66920 78.1 5.8 16.1 Bhola Total 1534445 45.5 11.6 42.97-9 160028 47.8 29.4 22.710-14 238726 19.8 15.8 64.415-19 175830 22.5 8.5 69.020-24 159564 34.1 9.0 56.925-29 162817 43.5 9.8 46.730-34 124862 51.7 8.8 39.535-39 123933 59.9 7.1 33.040-44 87992 64.4 9.5 26.145-49 84894 64.2 8.2 27.650-54 56235 66.7 8.0 25.355-59 46630 71.8 5.0 23.360-64 39813 77.8 6.6 15.665+ 73120 78.8 4.7 16.5 Male 782482 45.6 11.8 42.67-9 81331 49.5 29.5 21.010-14 127806 23.3 17.0 59.815-19 91865 28.8 8.3 62.920-24 75289 33.1 9.3 57.625-29 72656 42.6 10.4 46.930-34 65375 49.5 7.1 43.435-39 60882 60.3 6.4 33.340-44 49263 63.2 8.8 28.045-49 46165 63.4 7.4 29.250-54 32068 62.8 8.7 28.555-59 22618 66.4 5.5 28.160-64 21843 68.1 9.9 22.065+ 35321 71.1 5.3 23.7

National Series: Socio-economic and Demographic Report Page 158
Table P07: Percentage of Literate Population Aged 7 Years and above by Age, Sex and Zila, 2011
Age Number Literacy
Cannot Read and Write Can Read Only Can Read and
Write 1 2 3 4 5
Female 751963 45.3 11.5 43.27-9 78697 46.1 29.3 24.610-14 110920 15.8 14.5 69.715-19 83965 15.5 8.9 75.620-24 84274 34.9 8.8 56.325-29 90161 44.2 9.3 46.630-34 59488 54.2 10.7 35.235-39 63051 59.5 7.9 32.740-44 38729 66.0 10.4 23.645-49 38729 65.2 9.2 25.650-54 24167 71.8 7.1 21.255-59 24012 76.8 4.5 18.760-64 17970 89.7 2.6 7.865+ 37800 86.1 4.1 9.8Jhalokati Total 593800 22.8 9.8 67.47-9 49894 25.4 35.3 39.310-14 87380 5.3 9.2 85.515-19 62827 4.7 2.1 93.220-24 49172 8.0 3.7 88.325-29 55671 14.2 5.7 80.230-34 45758 22.0 7.7 70.335-39 43788 24.6 8.7 66.740-44 37026 29.6 9.4 61.045-49 37092 32.0 10.6 57.350-54 27179 38.6 8.0 53.455-59 25209 34.6 11.2 54.260-64 25669 50.6 10.7 38.665+ 47136 58.6 8.1 33.3 Male 291615 21.6 9.6 68.87-9 25472 27.6 35.8 36.610-14 44970 6.4 10.1 83.515-19 32037 6.4 2.5 91.220-24 22321 7.4 4.1 88.525-29 23306 13.5 7.0 79.430-34 20417 20.9 5.1 74.035-39 20089 24.8 6.5 68.640-44 19235 28.0 8.2 63.845-49 17857 29.0 8.1 62.9
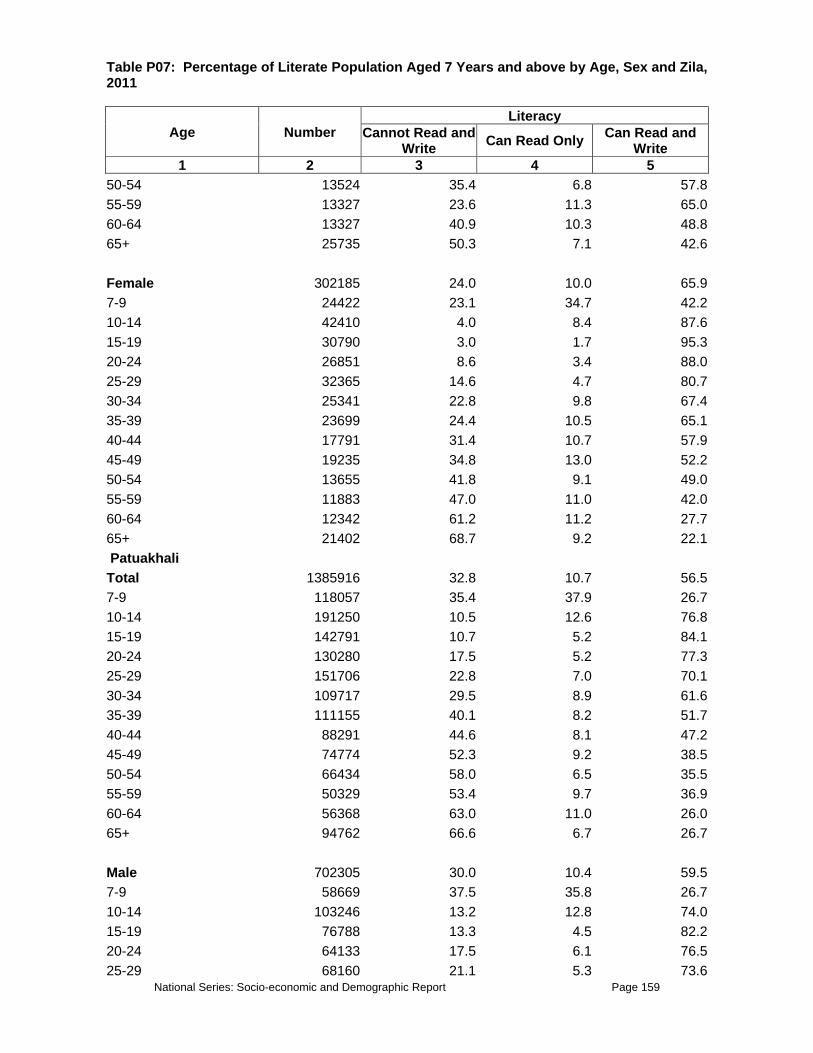
National Series: Socio-economic and Demographic Report Page 159
Table P07: Percentage of Literate Population Aged 7 Years and above by Age, Sex and Zila, 2011
Age Number Literacy
Cannot Read and Write Can Read Only Can Read and
Write 1 2 3 4 5
50-54 13524 35.4 6.8 57.855-59 13327 23.6 11.3 65.060-64 13327 40.9 10.3 48.865+ 25735 50.3 7.1 42.6 Female 302185 24.0 10.0 65.97-9 24422 23.1 34.7 42.210-14 42410 4.0 8.4 87.615-19 30790 3.0 1.7 95.320-24 26851 8.6 3.4 88.025-29 32365 14.6 4.7 80.730-34 25341 22.8 9.8 67.435-39 23699 24.4 10.5 65.140-44 17791 31.4 10.7 57.945-49 19235 34.8 13.0 52.250-54 13655 41.8 9.1 49.055-59 11883 47.0 11.0 42.060-64 12342 61.2 11.2 27.765+ 21402 68.7 9.2 22.1 Patuakhali Total 1385916 32.8 10.7 56.57-9 118057 35.4 37.9 26.710-14 191250 10.5 12.6 76.815-19 142791 10.7 5.2 84.120-24 130280 17.5 5.2 77.325-29 151706 22.8 7.0 70.130-34 109717 29.5 8.9 61.635-39 111155 40.1 8.2 51.740-44 88291 44.6 8.1 47.245-49 74774 52.3 9.2 38.550-54 66434 58.0 6.5 35.555-59 50329 53.4 9.7 36.960-64 56368 63.0 11.0 26.065+ 94762 66.6 6.7 26.7 Male 702305 30.0 10.4 59.57-9 58669 37.5 35.8 26.710-14 103246 13.2 12.8 74.015-19 76788 13.3 4.5 82.220-24 64133 17.5 6.1 76.525-29 68160 21.1 5.3 73.6

National Series: Socio-economic and Demographic Report Page 160
Table P07: Percentage of Literate Population Aged 7 Years and above by Age, Sex and Zila, 2011
Age Number Literacy
Cannot Read and Write Can Read Only Can Read and
Write 1 2 3 4 5
30-34 54212 26.0 10.1 63.935-39 54212 39.5 7.2 53.340-44 48028 39.8 7.8 52.445-49 38969 44.6 7.7 47.650-54 31060 45.8 6.0 48.155-59 24302 49.1 8.9 42.060-64 28616 50.3 15.1 34.765+ 51911 51.8 6.9 41.3 Female 683611 35.6 11.0 53.47-9 59388 33.4 40.0 26.610-14 88004 7.4 12.4 80.215-19 66003 7.6 6.1 86.320-24 66147 17.6 4.3 78.025-29 83546 24.3 8.4 67.330-34 55506 32.9 7.8 59.335-39 56944 40.7 9.1 50.340-44 40263 50.4 8.6 41.145-49 35805 60.6 10.8 28.550-54 35374 68.7 6.9 24.455-59 26027 57.5 10.5 32.060-64 27753 76.2 6.7 17.165+ 42852 84.6 6.4 9.1Pirojpur Total 971775 18.2 8.1 73.77-9 78962 14.5 26.5 59.010-14 129442 4.3 5.7 90.115-19 101599 6.5 2.9 90.620-24 90333 6.8 5.1 88.125-29 89164 9.7 5.8 84.530-34 75349 16.9 6.8 76.335-39 77262 18.8 8.1 73.040-44 65784 23.1 6.8 70.145-49 67803 26.3 7.2 66.550-54 49418 29.7 11.2 59.155-59 36558 33.7 7.6 58.760-64 35921 39.9 10.9 49.165+ 74180 49.3 6.6 44.1 Male 487694 17.3 8.2 74.57-9 37940 16.2 27.5 56.3

National Series: Socio-economic and Demographic Report Page 161
Table P07: Percentage of Literate Population Aged 7 Years and above by Age, Sex and Zila, 2011
Age Number Literacy
Cannot Read and Write Can Read Only Can Read and
Write 1 2 3 4 5
10-14 69185 6.3 6.6 87.115-19 55688 7.3 3.4 89.320-24 40597 8.4 6.3 85.325-29 39215 8.9 6.8 84.330-34 33051 17.4 7.7 74.935-39 37409 17.9 6.8 75.340-44 33583 21.5 5.1 73.445-49 35708 20.8 5.7 73.550-54 26887 25.7 11.1 63.255-59 18917 30.3 7.3 62.460-64 19023 34.1 8.9 57.065+ 40491 41.5 7.1 51.4 Female 484081 19.0 8.1 72.97-9 41022 13.0 25.6 61.410-14 60258 1.9 4.6 93.515-19 45911 5.6 2.3 92.120-24 49737 5.6 4.1 90.425-29 49949 10.2 5.1 84.730-34 42297 16.6 6.0 77.435-39 39853 19.7 9.3 70.940-44 32201 24.8 8.6 66.745-49 32095 32.5 8.9 58.650-54 22530 34.4 11.3 54.255-59 17642 37.3 7.8 54.860-64 16898 46.5 13.2 40.365+ 33689 58.7 6.0 35.3 Bandarban Total 306788 54.9 7.6 37.57-9 35880 39.4 26.2 34.410-14 48376 25.8 10.7 63.515-19 33191 41.0 4.2 54.820-24 27714 49.2 3.7 47.125-29 31912 53.0 5.1 41.830-34 25254 65.3 5.2 29.535-39 27124 72.2 3.6 24.240-44 20794 78.9 2.8 18.345-49 16530 74.8 4.4 20.850-54 13217 79.7 2.2 18.155-59 8462 79.1 4.7 16.360-64 8265 84.5 1.6 13.9

National Series: Socio-economic and Demographic Report Page 162
Table P07: Percentage of Literate Population Aged 7 Years and above by Age, Sex and Zila, 2011
Age Number Literacy
Cannot Read and Write Can Read Only Can Read and
Write 1 2 3 4 5
65+ 10069 85.7 1.3 13.0 Male 158576 50.4 8.2 41.47-9 18924 37.6 28.9 33.410-14 26992 25.3 12.3 62.515-19 17120 40.0 4.4 55.620-24 12266 46.8 2.7 50.525-29 13873 39.5 5.2 55.330-34 12496 56.7 4.5 38.835-39 14398 66.5 4.1 29.440-44 10725 70.6 3.4 26.045-49 8724 68.0 4.1 27.850-54 7773 72.2 1.7 26.255-59 4690 75.5 5.6 18.960-64 4657 79.6 2.1 18.365+ 5936 81.8 1.7 16.6 Female 148212 59.8 6.8 33.47-9 16956 41.4 23.2 35.410-14 21384 26.5 8.7 64.715-19 16071 42.0 3.9 54.120-24 15448 51.2 4.5 44.425-29 18039 63.5 5.1 31.530-34 12758 73.8 5.9 20.335-39 12725 78.6 3.1 18.340-44 10069 87.6 2.3 10.145-49 7806 82.4 4.6 13.050-54 5444 90.4 3.0 6.655-59 3772 83.5 3.5 13.060-64 3608 90.9 0.9 8.265+ 4132 91.3 0.8 7.9Brahmanbaria Total 2191453 41.1 7.4 51.57-9 264748 43.0 27.8 29.210-14 354118 15.3 11.4 73.315-19 253773 17.7 3.6 78.620-24 180755 22.9 3.2 73.925-29 194194 35.8 3.8 60.430-34 171123 41.8 4.5 53.835-39 148949 52.5 3.5 44.140-44 135958 58.2 1.3 40.5

National Series: Socio-economic and Demographic Report Page 163
Table P07: Percentage of Literate Population Aged 7 Years and above by Age, Sex and Zila, 2011
Age Number Literacy
Cannot Read and Write Can Read Only Can Read and
Write 1 2 3 4 5
45-49 113784 63.2 3.1 33.750-54 99673 66.5 3.1 30.355-59 59580 70.3 2.3 27.460-64 68091 75.7 2.3 22.065+ 146709 78.8 1.7 19.5 Male 1057425 39.4 7.4 53.17-9 135734 43.6 27.6 28.910-14 175827 18.3 11.8 69.815-19 132598 20.1 4.1 75.820-24 79290 26.6 2.5 70.925-29 80858 36.6 3.3 60.130-34 73691 41.6 3.3 55.035-39 63163 46.1 2.8 51.140-44 64059 47.2 1.4 51.445-49 58236 55.8 3.1 41.250-54 54204 57.9 1.2 40.955-59 29790 56.4 0.8 42.960-64 34045 67.8 3.3 28.965+ 75930 72.0 1.8 26.3 Female 1134028 42.6 7.4 50.07-9 129014 42.4 28.1 29.510-14 178291 12.3 10.9 76.815-19 121175 15.2 3.1 81.720-24 101464 20.1 3.8 76.225-29 113336 35.2 4.2 60.730-34 97433 41.8 5.3 52.935-39 85786 57.2 3.9 38.940-44 71899 67.9 1.2 30.845-49 55548 71.0 3.2 25.850-54 45469 76.8 5.4 17.755-59 29790 84.2 3.8 12.060-64 34045 83.6 1.3 15.165+ 70779 86.1 1.6 12.3Chandpur Total 2042066 33.1 8.5 58.57-9 182856 33.2 30.8 36.110-14 313437 12.3 8.2 79.515-19 250036 10.4 4.1 85.520-24 211407 17.1 6.0 77.0

National Series: Socio-economic and Demographic Report Page 164
Table P07: Percentage of Literate Population Aged 7 Years and above by Age, Sex and Zila, 2011
Age Number Literacy
Cannot Read and Write Can Read Only Can Read and
Write 1 2 3 4 5
25-29 187894 22.2 5.0 72.730-34 148216 30.5 7.8 61.835-39 141918 42.6 6.8 50.640-44 120294 49.6 4.5 45.945-49 116725 50.5 7.6 41.950-54 89853 59.6 6.5 33.955-59 68440 56.7 7.1 36.260-64 80406 73.1 3.9 23.065+ 130581 74.4 6.9 18.6 Male 998045 31.6 8.8 59.67-9 96362 33.8 31.2 35.110-14 153675 15.6 8.7 75.715-19 131421 14.1 5.0 81.020-24 97201 19.7 7.1 73.225-29 88594 23.0 4.5 72.530-34 61932 29.8 7.8 62.435-39 63191 36.5 8.3 55.140-44 63821 48.4 4.6 47.045-49 53114 42.7 4.7 52.650-54 43247 46.6 7.3 46.155-59 38209 47.8 4.4 47.860-64 39888 62.1 3.7 34.265+ 67390 63.6 7.5 29.0 Female 1044021 34.5 8.1 57.47-9 86494 32.5 30.3 37.110-14 159763 9.2 7.6 83.215-19 118615 6.4 3.2 90.420-24 114206 14.9 5.0 80.125-29 99301 21.6 5.5 72.930-34 86284 30.9 7.8 61.335-39 78727 47.5 5.6 46.940-44 56473 50.9 4.5 44.645-49 63611 57.1 9.9 33.050-54 46606 71.6 5.9 22.555-59 30231 68.1 10.4 21.560-64 40518 83.9 4.1 11.965+ 63191 86.0 6.3 7.6Chittagong Total 6070068 26.7 6.7 66.6

National Series: Socio-economic and Demographic Report Page 165
Table P07: Percentage of Literate Population Aged 7 Years and above by Age, Sex and Zila, 2011
Age Number Literacy
Cannot Read and Write Can Read Only Can Read and
Write 1 2 3 4 5
7-9 499527 26.8 27.8 45.310-14 885197 9.1 10.3 80.615-19 760734 8.6 3.3 88.020-24 710951 13.4 3.4 83.225-29 646573 20.3 3.9 75.830-34 484876 27.5 4.6 67.935-39 466388 34.6 5.0 60.440-44 391148 39.5 4.3 56.245-49 313033 43.1 3.4 53.550-54 266115 51.4 3.8 44.855-59 174096 50.6 3.1 46.360-64 204936 62.0 3.0 35.065+ 266495 65.8 2.9 31.3 Male 3005965 22.7 7.4 69.97-9 257372 28.3 29.2 42.510-14 461549 10.0 11.8 78.215-19 374197 8.1 3.5 88.520-24 331434 11.8 4.6 83.625-29 298237 16.3 4.4 79.330-34 224450 22.9 4.1 73.035-39 225115 28.6 4.4 67.040-44 196443 30.7 4.5 64.945-49 163441 37.7 3.8 58.550-54 133481 40.6 3.2 56.255-59 92564 37.1 3.8 59.160-64 102704 45.9 3.5 50.565+ 144978 50.4 3.6 46.0 Female 3064103 30.5 6.1 63.47-9 242155 25.3 26.4 48.310-14 423648 8.2 8.6 83.215-19 386537 9.1 3.2 87.720-24 379517 14.7 2.4 82.925-29 348336 23.6 3.6 72.830-34 260426 31.4 5.1 63.535-39 241273 40.1 5.5 54.440-44 194705 48.4 4.1 47.545-49 149592 49.0 3.0 48.050-54 132634 62.3 4.4 33.355-59 81532 66.0 2.3 31.8

National Series: Socio-economic and Demographic Report Page 166
Table P07: Percentage of Literate Population Aged 7 Years and above by Age, Sex and Zila, 2011
Age Number Literacy
Cannot Read and Write Can Read Only Can Read and
Write 1 2 3 4 5
60-64 102232 78.1 2.4 19.465+ 121517 84.2 2.1 13.8 Comilla Total 4381694 32.3 6.7 60.97-9 445818 33.4 27.0 39.610-14 682277 10.6 8.4 81.015-19 541101 11.1 2.7 86.120-24 451500 13.3 3.5 83.325-29 424839 22.3 3.4 74.330-34 289782 31.8 4.4 63.835-39 313821 40.7 4.0 55.340-44 239518 50.4 2.2 47.445-49 224657 53.7 5.3 41.150-54 198433 60.1 4.0 35.955-59 136368 61.5 4.2 34.360-64 170023 69.4 3.3 27.265+ 263557 75.1 3.8 21.1 Male 2114140 30.1 7.0 62.97-9 229028 35.9 25.8 38.410-14 355780 13.5 9.8 76.715-19 269239 13.8 3.4 82.820-24 207611 11.6 4.0 84.425-29 187943 22.1 3.5 74.430-34 132871 31.9 4.3 63.835-39 122381 38.9 3.2 57.940-44 120196 41.1 2.5 56.445-49 104461 44.8 3.3 51.950-54 93097 52.1 2.3 45.555-59 62939 49.3 4.2 46.560-64 92223 54.5 4.7 40.865+ 136368 64.7 3.2 32.1 Female 2267554 34.4 6.5 59.27-9 216790 30.8 28.2 40.910-14 326496 7.5 6.8 85.715-19 271862 8.5 2.1 89.420-24 243889 14.7 3.0 82.325-29 236896 22.5 3.3 74.230-34 156911 31.8 4.5 63.835-39 191440 41.8 4.6 53.7

National Series: Socio-economic and Demographic Report Page 167
Table P07: Percentage of Literate Population Aged 7 Years and above by Age, Sex and Zila, 2011
Age Number Literacy
Cannot Read and Write Can Read Only Can Read and
Write 1 2 3 4 5
40-44 119322 59.7 1.8 38.545-49 120196 61.5 6.9 31.650-54 105335 67.2 5.4 27.455-59 73429 72.0 4.2 23.860-64 77800 87.1 1.7 11.265+ 127189 86.3 4.5 9.3 Cox's Bazar Total 1714585 39.7 8.5 51.87-9 204289 34.0 31.4 34.710-14 288520 15.3 12.9 71.815-19 217897 18.6 4.0 77.520-24 186031 29.5 4.7 65.725-29 182414 40.0 3.8 56.230-34 131083 50.7 3.3 46.035-39 111102 57.2 3.9 38.940-44 86125 63.2 1.6 35.245-49 75963 63.3 2.7 34.050-54 66489 72.0 3.4 24.655-59 45302 64.3 5.3 30.460-64 48575 73.4 3.9 22.765+ 70795 74.9 2.9 22.1 Male 864699 37.5 8.8 53.77-9 100767 36.8 30.6 32.610-14 144691 17.4 14.3 68.315-19 109379 20.5 3.9 75.620-24 89743 25.9 5.4 68.725-29 86642 32.4 5.0 62.630-34 69934 48.5 3.7 47.835-39 55809 50.9 3.7 45.440-44 46508 55.6 2.6 41.945-49 37034 59.1 2.8 38.150-54 32211 66.3 2.1 31.655-59 23082 50.7 6.7 42.560-64 26354 64.1 3.3 32.765+ 42546 65.6 3.2 31.2 Female 849886 42.0 8.2 49.87-9 103523 31.3 32.1 36.610-14 143829 13.3 11.5 75.215-19 108518 16.7 4.0 79.4

National Series: Socio-economic and Demographic Report Page 168
Table P07: Percentage of Literate Population Aged 7 Years and above by Age, Sex and Zila, 2011
Age Number Literacy
Cannot Read and Write Can Read Only Can Read and
Write 1 2 3 4 5
20-24 96288 32.9 4.1 63.025-29 95771 46.9 2.7 50.430-34 61149 53.2 2.8 43.935-39 55293 63.6 4.0 32.440-44 39618 72.2 0.4 27.445-49 38929 67.3 2.7 30.150-54 34278 77.4 4.5 18.155-59 22220 78.3 3.9 17.860-64 22220 84.5 4.7 10.965+ 28249 89.0 2.4 8.5Feni Total 1090252 22.1 6.1 71.87-9 93083 19.7 25.4 54.910-14 161374 4.7 6.6 88.715-19 141059 5.9 2.0 92.120-24 113972 8.8 2.9 88.325-29 103183 14.5 3.1 82.430-34 75063 19.3 3.8 76.935-39 78392 25.3 4.0 70.740-44 65537 30.6 7.5 61.845-49 63241 37.0 4.2 58.850-54 45336 41.5 5.3 53.255-59 37187 42.6 4.3 53.160-64 39253 58.2 4.7 37.165+ 73571 63.2 4.4 32.4 Male 525327 18.2 6.4 75.37-9 46254 21.3 25.6 53.110-14 82638 4.6 8.2 87.215-19 73227 6.6 2.7 90.820-24 54289 7.2 1.9 90.925-29 43959 12.5 4.2 83.330-34 31219 18.8 3.7 77.635-39 32596 20.8 3.2 76.140-44 31448 25.9 6.2 67.945-49 27317 28.2 2.9 68.950-54 24677 29.8 6.5 63.755-59 19397 24.3 4.7 71.060-64 20086 38.3 6.3 55.465+ 38220 51.4 4.5 44.1

National Series: Socio-economic and Demographic Report Page 169
Table P07: Percentage of Literate Population Aged 7 Years and above by Age, Sex and Zila, 2011
Age Number Literacy
Cannot Read and Write Can Read Only Can Read and
Write 1 2 3 4 5
Female 564925 25.7 5.7 68.57-9 46828 18.1 25.2 56.610-14 78736 4.8 5.0 90.215-19 67832 5.1 1.4 93.620-24 59683 10.2 3.8 86.025-29 59224 15.9 2.3 81.830-34 43844 19.6 3.9 76.435-39 45795 28.6 4.5 66.940-44 34088 35.0 8.8 56.245-49 35925 43.8 5.1 51.150-54 20660 55.6 3.9 40.655-59 17790 62.6 3.9 33.560-64 19167 79.0 3.0 18.065+ 35351 76.0 4.2 19.8 Khagrachhari Total 506769 41.7 8.1 50.27-9 55983 33.9 30.3 35.810-14 73705 14.4 9.5 76.115-19 56755 18.8 3.7 77.520-24 48088 28.7 4.7 66.625-29 56093 35.4 5.7 58.930-34 40082 45.0 3.7 51.235-39 44554 56.5 5.8 37.740-44 29924 60.3 4.6 35.145-49 27053 65.3 5.3 29.450-54 18771 73.8 4.4 21.855-59 17005 74.0 2.6 23.460-64 14465 82.8 2.3 14.965+ 24292 83.4 4.1 12.5 Male 253412 35.9 8.8 55.37-9 28378 34.6 30.4 35.010-14 36714 14.6 11.6 73.815-19 30034 17.6 3.9 78.520-24 21532 22.1 4.4 73.625-29 26004 28.7 6.4 65.030-34 20538 34.4 2.2 63.435-39 21311 46.9 6.7 46.440-44 16342 49.3 4.7 45.945-49 13913 51.2 9.1 39.750-54 10103 61.2 4.4 34.4

National Series: Socio-economic and Demographic Report Page 170
Table P07: Percentage of Literate Population Aged 7 Years and above by Age, Sex and Zila, 2011
Age Number Literacy
Cannot Read and Write Can Read Only Can Read and
Write 1 2 3 4 5
55-59 8392 60.5 2.6 36.860-64 7177 71.5 3.1 25.465+ 12974 73.6 6.8 19.6 Female 253357 47.6 7.4 45.07-9 27605 33.2 30.2 36.610-14 36990 14.2 7.5 78.415-19 26721 20.0 3.5 76.420-24 26556 34.1 5.0 60.925-29 30089 41.3 5.1 53.630-34 19544 56.2 5.4 38.435-39 23243 65.3 5.0 29.740-44 13582 73.6 4.5 22.045-49 13140 80.3 1.3 18.550-54 8668 88.5 4.5 7.055-59 8613 87.2 2.6 10.360-64 7288 93.9 1.5 4.565+ 11318 94.6 1.0 4.4 Lakshmipur Total 1429094 35.8 10.8 53.47-9 151621 44.5 29.2 26.210-14 210205 15.7 14.7 69.615-19 166647 15.2 6.9 77.920-24 143729 17.7 6.9 75.425-29 145550 27.2 8.4 64.330-34 108366 36.8 8.0 55.235-39 107303 41.6 8.9 49.540-44 79377 52.0 7.8 40.245-49 76342 50.5 7.0 42.550-54 60254 55.7 8.8 35.555-59 41738 62.2 4.0 33.860-64 46291 64.9 9.5 25.665+ 91671 72.8 5.1 22.0 Male 696486 34.1 10.9 55.07-9 76494 45.8 25.2 29.010-14 104875 16.6 16.2 67.115-19 87269 16.3 8.3 75.320-24 63896 16.4 6.9 76.725-29 62379 27.5 8.3 64.230-34 52210 36.3 8.7 54.9

National Series: Socio-economic and Demographic Report Page 171
Table P07: Percentage of Literate Population Aged 7 Years and above by Age, Sex and Zila, 2011
Age Number Literacy
Cannot Read and Write Can Read Only Can Read and
Write 1 2 3 4 5
35-39 51906 41.8 7.0 51.240-44 36122 45.8 7.6 46.645-49 37184 48.2 6.5 45.350-54 30506 43.8 10.9 45.355-59 19427 51.6 2.3 46.160-64 24284 53.1 10.6 36.365+ 49933 62.9 6.1 31.0 Female 732608 37.5 10.8 51.87-9 75128 43.2 33.3 23.410-14 105330 14.8 13.1 72.015-19 79377 14.0 5.4 80.720-24 79833 18.8 6.8 74.325-29 83172 27.0 8.6 64.430-34 56156 37.3 7.3 55.435-39 55397 41.4 10.7 47.940-44 43255 57.2 8.1 34.745-49 39157 52.7 7.4 39.950-54 29747 67.9 6.6 25.555-59 22311 71.4 5.4 23.160-64 22007 77.9 8.3 13.865+ 41738 84.7 4.0 11.3Noakhali Total 2467608 35.6 8.3 56.07-9 257986 49.3 22.7 28.010-14 386487 21.1 14.1 64.815-19 299589 14.6 3.9 81.420-24 263156 19.4 5.0 75.725-29 243462 28.5 6.2 65.330-34 184628 35.6 4.8 59.635-39 175765 40.8 7.8 51.440-44 141794 47.2 3.6 49.145-49 122100 53.0 5.8 41.150-54 101914 57.2 4.1 38.655-59 66712 48.3 1.5 50.260-64 76559 64.0 5.8 30.265+ 147456 66.3 5.2 28.5 Male 1218049 34.0 8.4 57.67-9 134655 49.0 24.7 26.310-14 200382 22.9 13.0 64.1

National Series: Socio-economic and Demographic Report Page 172
Table P07: Percentage of Literate Population Aged 7 Years and above by Age, Sex and Zila, 2011
Age Number Literacy
Cannot Read and Write Can Read Only Can Read and
Write 1 2 3 4 5
15-19 158780 15.2 3.6 81.220-24 119392 20.2 4.3 75.525-29 105115 30.9 6.6 62.530-34 81236 33.3 5.8 60.935-39 84190 38.3 7.6 54.140-44 70651 42.5 4.2 53.345-49 60558 51.2 5.3 43.550-54 49726 53.5 4.0 42.655-59 37172 37.1 0.7 62.360-64 41849 51.2 3.5 45.365+ 74343 52.6 5.6 41.7 Female 1249559 37.3 8.2 54.57-9 123331 49.7 20.6 29.710-14 186105 19.3 15.2 65.515-19 140809 14.0 4.4 81.620-24 143763 18.7 5.5 75.925-29 138348 26.7 5.9 67.430-34 103391 37.4 4.0 58.635-39 91575 43.0 8.1 48.940-44 71143 51.9 3.1 45.045-49 61542 54.8 6.4 38.850-54 52188 60.8 4.2 34.955-59 29540 62.5 2.5 35.060-64 34710 79.4 8.5 12.165+ 73112 80.1 4.7 15.2Rangamati Total 469470 38.4 6.1 55.47-9 45930 22.7 27.6 49.710-14 64524 13.4 4.7 81.915-19 49249 21.6 2.8 75.620-24 48090 29.5 3.6 66.925-29 51672 33.6 5.2 61.230-34 44192 41.2 4.3 54.535-39 43191 48.8 3.9 47.340-44 31551 56.8 3.7 39.645-49 27074 60.7 2.7 36.650-54 19436 65.6 3.8 30.655-59 13800 70.6 2.3 27.160-64 12536 74.8 2.1 23.165+ 18225 74.9 2.3 22.8

National Series: Socio-economic and Demographic Report Page 173
Table P07: Percentage of Literate Population Aged 7 Years and above by Age, Sex and Zila, 2011
Age Number Literacy
Cannot Read and Write Can Read Only Can Read and
Write 1 2 3 4 5
Male 238817 32.5 6.6 60.97-9 23913 22.2 28.4 49.310-14 33289 13.9 5.2 80.915-19 25704 21.9 2.9 75.220-24 20595 24.0 3.6 72.425-29 24914 28.3 6.1 65.530-34 21332 30.4 4.2 65.435-39 23229 40.4 4.1 55.640-44 16750 43.4 4.4 52.245-49 14748 47.5 2.5 50.050-54 10956 52.9 5.3 41.855-59 7058 55.2 3.0 41.860-64 7058 64.9 2.2 32.865+ 9270 61.4 2.8 35.8 Female 230653 44.5 5.7 49.87-9 22017 23.2 26.8 50.010-14 31235 12.8 4.2 83.015-19 23545 21.3 2.7 76.120-24 27495 33.5 3.6 62.825-29 26758 38.6 4.3 57.130-34 22860 51.4 4.4 44.235-39 19963 58.6 3.7 37.740-44 14801 71.9 2.8 25.345-49 12325 76.5 3.0 20.550-54 8480 82.0 1.9 16.155-59 6742 86.7 1.6 11.760-64 5478 87.5 1.9 10.665+ 8954 88.8 1.8 9.4Dhaka Total 9604659 23.6 5.6 70.87-9 691246 36.3 19.8 43.910-14 1139171 14.8 10.0 75.115-19 1097136 11.1 3.7 85.220-24 1164933 12.6 4.2 83.225-29 1297492 18.1 4.1 77.730-34 913937 19.6 3.9 76.635-39 864699 29.6 3.1 67.340-44 677133 31.7 3.9 64.445-49 547462 33.5 2.9 63.6

National Series: Socio-economic and Demographic Report Page 174
Table P07: Percentage of Literate Population Aged 7 Years and above by Age, Sex and Zila, 2011
Age Number Literacy
Cannot Read and Write Can Read Only Can Read and
Write 1 2 3 4 5
50-54 397300 36.3 4.5 59.355-59 278903 37.6 2.2 60.260-64 228844 42.9 3.2 54.065+ 306402 54.0 3.0 43.0 Male 4715357 20.5 5.5 73.97-9 352124 38.5 18.0 43.510-14 556977 15.3 12.1 72.615-19 483724 9.2 3.7 87.120-24 463343 9.3 3.7 87.025-29 600208 15.8 4.2 80.030-34 475881 16.5 3.4 80.135-39 414701 22.3 2.9 74.840-44 372907 25.6 3.8 70.545-49 311298 26.8 2.3 70.950-54 228809 27.8 4.8 67.455-59 157475 25.8 1.1 73.160-64 135486 31.3 3.8 64.965+ 162425 41.1 2.0 56.9 Female 4889302 26.6 5.7 67.77-9 339122 33.9 21.8 44.310-14 582194 14.4 8.0 77.615-19 613412 12.6 3.7 83.720-24 701590 14.8 4.5 80.825-29 697285 20.1 4.1 75.830-34 438055 22.9 4.4 72.735-39 449998 36.3 3.3 60.440-44 304226 39.2 3.9 56.845-49 236165 42.3 3.6 54.050-54 168491 47.8 4.1 48.255-59 121429 52.8 3.6 43.560-64 93358 59.7 2.2 38.165+ 143977 68.6 4.1 27.3Faridpur Total 1588587 37.7 7.3 55.07-9 158702 34.2 29.9 35.910-14 224798 10.0 8.5 81.515-19 161492 12.3 3.1 84.620-24 142657 17.5 5.4 77.125-29 168817 28.0 4.3 67.7

National Series: Socio-economic and Demographic Report Page 175
Table P07: Percentage of Literate Population Aged 7 Years and above by Age, Sex and Zila, 2011
Age Number Literacy
Cannot Read and Write Can Read Only Can Read and
Write 1 2 3 4 5
30-34 128705 39.7 4.2 56.135-39 123997 50.8 4.9 44.340-44 108998 55.2 6.2 38.645-49 87896 60.3 4.2 35.550-54 71677 66.7 2.4 30.955-59 51098 65.5 3.4 31.160-64 58074 74.5 2.7 22.865+ 101674 76.8 2.1 21.1 Male 794381 34.7 7.1 58.27-9 80920 36.0 27.6 36.410-14 118242 14.5 8.7 76.815-19 85804 14.2 3.7 82.120-24 66097 13.5 5.3 81.325-29 76212 27.0 3.0 70.030-34 59121 33.3 5.0 61.735-39 61039 45.4 5.1 49.440-44 52494 48.8 4.7 46.545-49 49354 50.2 4.9 44.950-54 38193 58.9 4.1 37.055-59 26160 53.3 3.3 43.360-64 28776 64.8 1.8 33.365+ 51970 66.4 2.3 31.2 Female 794206 40.7 7.4 51.97-9 77781 32.3 32.3 35.410-14 106557 5.1 8.2 86.715-19 75689 10.1 2.5 87.320-24 76561 21.0 5.5 73.625-29 92605 28.8 5.5 65.730-34 69585 45.1 3.5 51.435-39 62957 56.0 4.7 39.340-44 56505 61.1 7.7 31.245-49 38542 73.3 3.2 23.550-54 33484 75.5 0.5 24.055-59 24939 78.3 3.5 18.260-64 29299 83.9 3.6 12.565+ 49703 87.7 1.8 10.5 Gazipur Total 2742728 28.7 6.5 64.87-9 219310 24.6 30.9 44.5

National Series: Socio-economic and Demographic Report Page 176
Table P07: Percentage of Literate Population Aged 7 Years and above by Age, Sex and Zila, 2011
Age Number Literacy
Cannot Read and Write Can Read Only Can Read and
Write 1 2 3 4 5
10-14 315132 9.1 9.4 81.515-19 270933 11.3 3.5 85.220-24 332002 13.2 3.4 83.425-29 362705 19.6 4.6 75.830-34 271270 27.9 4.4 67.835-39 235843 35.8 3.4 60.840-44 194005 48.7 2.8 48.545-49 148119 50.8 2.3 46.950-54 107293 48.1 4.4 47.555-59 75915 52.4 5.3 42.260-64 78614 63.1 3.9 33.065+ 131586 67.9 1.8 30.3 Male 1339817 25.7 7.0 67.37-9 113704 24.9 32.6 42.410-14 159590 10.1 10.8 79.115-19 119440 10.7 4.2 85.020-24 118428 9.7 2.8 87.525-29 161952 15.8 4.4 79.830-34 140696 23.0 5.3 71.735-39 116403 24.9 3.2 71.940-44 103919 40.9 3.2 55.845-49 81988 45.3 2.1 52.750-54 65456 42.3 2.6 55.255-59 38801 43.5 5.2 51.360-64 43187 51.6 3.9 44.565+ 76252 55.3 2.2 42.5 Female 1402911 31.6 6.0 62.37-9 105606 24.3 29.1 46.610-14 155542 8.0 8.0 83.915-19 151493 11.8 2.9 85.320-24 213574 15.2 3.6 81.225-29 200753 22.7 4.7 72.630-34 130574 33.1 3.4 63.635-39 119440 46.3 3.7 50.040-44 90086 57.7 2.2 40.145-49 66130 57.7 2.6 39.850-54 41838 57.3 7.3 35.555-59 37114 61.8 5.5 32.760-64 35427 77.1 3.8 19.0

National Series: Socio-economic and Demographic Report Page 177
Table P07: Percentage of Literate Population Aged 7 Years and above by Age, Sex and Zila, 2011
Age Number Literacy
Cannot Read and Write Can Read Only Can Read and
Write 1 2 3 4 5
65+ 55334 85.4 1.2 13.4Gopalganj Total 1020539 28.8 7.5 63.77-9 94208 20.2 27.9 51.810-14 144888 8.1 6.4 85.515-19 112138 10.6 3.3 86.020-24 104158 14.9 4.2 80.925-29 103329 21.0 7.0 72.030-34 81046 29.3 6.5 64.235-39 76797 33.7 6.3 59.940-44 62287 47.6 3.5 48.945-49 53685 46.5 5.6 47.950-54 47260 52.6 5.9 41.455-59 35548 51.3 5.8 42.960-64 35030 58.3 4.1 37.665+ 70164 65.9 4.9 29.2 Male 516643 25.8 7.5 66.77-9 47985 22.9 28.1 49.010-14 75346 8.8 7.4 83.815-19 64982 11.5 3.5 85.020-24 48711 15.5 4.0 80.425-29 45601 17.7 5.5 76.830-34 40730 26.7 7.1 66.235-39 38139 27.4 7.1 65.540-44 32439 41.9 3.5 54.645-49 26221 42.3 5.5 52.250-54 25081 47.9 6.6 45.555-59 18759 42.5 5.0 52.560-64 17308 44.9 3.6 51.565+ 35341 53.1 5.0 41.9 Female 503896 31.9 7.4 60.87-9 46223 17.5 27.8 54.710-14 69542 7.3 5.4 87.315-19 47156 9.5 3.1 87.520-24 55447 14.4 4.3 81.325-29 57727 23.5 8.3 68.230-34 40316 31.9 5.9 62.235-39 38658 39.9 5.6 54.440-44 29848 53.8 3.5 42.7
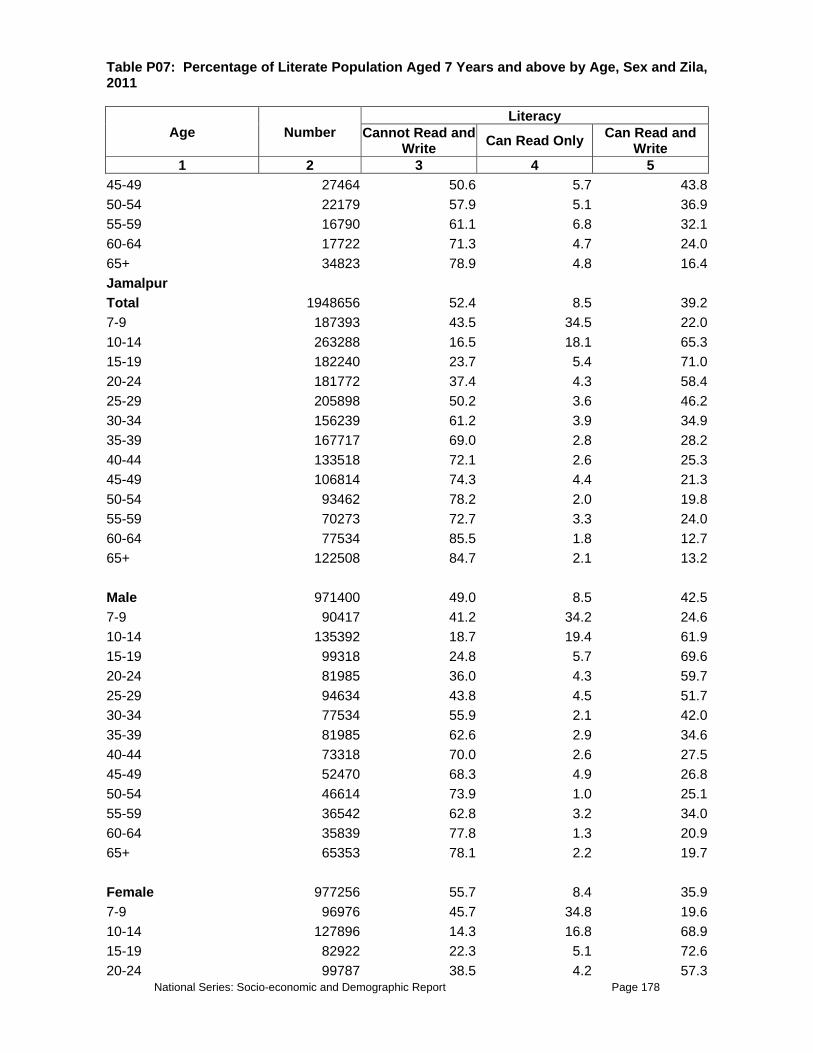
National Series: Socio-economic and Demographic Report Page 178
Table P07: Percentage of Literate Population Aged 7 Years and above by Age, Sex and Zila, 2011
Age Number Literacy
Cannot Read and Write Can Read Only Can Read and
Write 1 2 3 4 5
45-49 27464 50.6 5.7 43.850-54 22179 57.9 5.1 36.955-59 16790 61.1 6.8 32.160-64 17722 71.3 4.7 24.065+ 34823 78.9 4.8 16.4Jamalpur Total 1948656 52.4 8.5 39.27-9 187393 43.5 34.5 22.010-14 263288 16.5 18.1 65.315-19 182240 23.7 5.4 71.020-24 181772 37.4 4.3 58.425-29 205898 50.2 3.6 46.230-34 156239 61.2 3.9 34.935-39 167717 69.0 2.8 28.240-44 133518 72.1 2.6 25.345-49 106814 74.3 4.4 21.350-54 93462 78.2 2.0 19.855-59 70273 72.7 3.3 24.060-64 77534 85.5 1.8 12.765+ 122508 84.7 2.1 13.2 Male 971400 49.0 8.5 42.57-9 90417 41.2 34.2 24.610-14 135392 18.7 19.4 61.915-19 99318 24.8 5.7 69.620-24 81985 36.0 4.3 59.725-29 94634 43.8 4.5 51.730-34 77534 55.9 2.1 42.035-39 81985 62.6 2.9 34.640-44 73318 70.0 2.6 27.545-49 52470 68.3 4.9 26.850-54 46614 73.9 1.0 25.155-59 36542 62.8 3.2 34.060-64 35839 77.8 1.3 20.965+ 65353 78.1 2.2 19.7 Female 977256 55.7 8.4 35.97-9 96976 45.7 34.8 19.610-14 127896 14.3 16.8 68.915-19 82922 22.3 5.1 72.620-24 99787 38.5 4.2 57.3
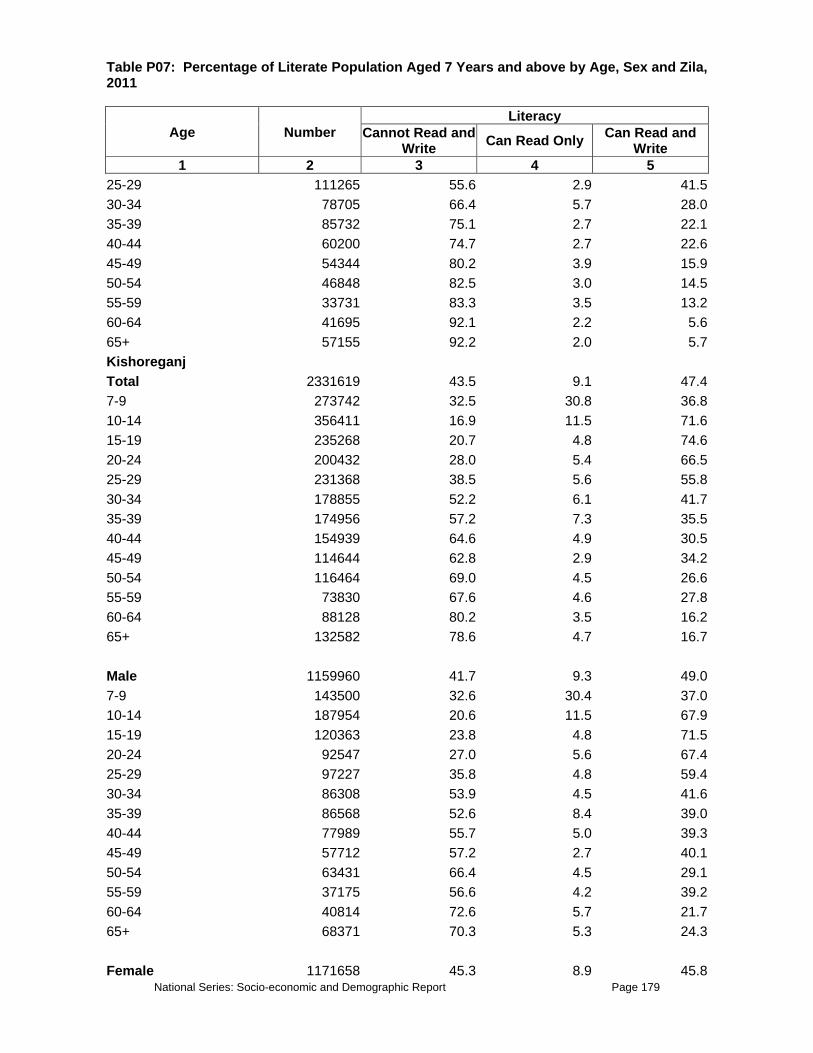
National Series: Socio-economic and Demographic Report Page 179
Table P07: Percentage of Literate Population Aged 7 Years and above by Age, Sex and Zila, 2011
Age Number Literacy
Cannot Read and Write Can Read Only Can Read and
Write 1 2 3 4 5
25-29 111265 55.6 2.9 41.530-34 78705 66.4 5.7 28.035-39 85732 75.1 2.7 22.140-44 60200 74.7 2.7 22.645-49 54344 80.2 3.9 15.950-54 46848 82.5 3.0 14.555-59 33731 83.3 3.5 13.260-64 41695 92.1 2.2 5.665+ 57155 92.2 2.0 5.7Kishoreganj Total 2331619 43.5 9.1 47.47-9 273742 32.5 30.8 36.810-14 356411 16.9 11.5 71.615-19 235268 20.7 4.8 74.620-24 200432 28.0 5.4 66.525-29 231368 38.5 5.6 55.830-34 178855 52.2 6.1 41.735-39 174956 57.2 7.3 35.540-44 154939 64.6 4.9 30.545-49 114644 62.8 2.9 34.250-54 116464 69.0 4.5 26.655-59 73830 67.6 4.6 27.860-64 88128 80.2 3.5 16.265+ 132582 78.6 4.7 16.7 Male 1159960 41.7 9.3 49.07-9 143500 32.6 30.4 37.010-14 187954 20.6 11.5 67.915-19 120363 23.8 4.8 71.520-24 92547 27.0 5.6 67.425-29 97227 35.8 4.8 59.430-34 86308 53.9 4.5 41.635-39 86568 52.6 8.4 39.040-44 77989 55.7 5.0 39.345-49 57712 57.2 2.7 40.150-54 63431 66.4 4.5 29.155-59 37175 56.6 4.2 39.260-64 40814 72.6 5.7 21.765+ 68371 70.3 5.3 24.3 Female 1171658 45.3 8.9 45.8

National Series: Socio-economic and Demographic Report Page 180
Table P07: Percentage of Literate Population Aged 7 Years and above by Age, Sex and Zila, 2011
Age Number Literacy
Cannot Read and Write Can Read Only Can Read and
Write 1 2 3 4 5
7-9 130242 32.3 31.1 36.510-14 168457 12.8 11.4 75.815-19 114904 17.4 4.8 77.820-24 107885 28.9 5.3 65.825-29 134142 40.5 6.2 53.330-34 92547 50.6 7.6 41.935-39 88388 61.8 6.2 32.140-44 76949 73.6 4.7 21.645-49 56932 68.5 3.2 28.350-54 53033 72.1 4.4 23.555-59 36655 78.7 5.0 16.360-64 47313 86.8 1.6 11.565+ 64211 87.4 4.0 8.5Madaripur Total 969530 35.5 8.8 55.77-9 92456 31.1 34.0 34.910-14 140781 10.8 11.7 77.515-19 99584 12.4 4.1 83.520-24 89102 19.5 4.9 75.525-29 98221 28.6 5.9 65.530-34 75579 37.3 5.3 57.435-39 77676 40.2 7.2 52.640-44 61428 51.9 7.0 41.145-49 57340 55.6 3.7 40.850-54 51574 62.2 6.1 31.755-59 33230 64.0 2.2 33.860-64 39100 68.1 3.5 28.465+ 53461 72.5 3.9 23.5 Male 490793 33.0 8.9 58.17-9 47486 32.9 32.2 34.910-14 72434 12.7 12.3 75.015-19 53985 14.2 4.9 81.020-24 42454 20.5 4.9 74.625-29 46333 24.4 6.1 69.530-34 33334 34.0 5.7 60.435-39 36689 37.1 5.7 57.140-44 32706 44.2 7.4 48.445-49 27988 44.2 3.7 52.150-54 24215 53.7 6.5 39.855-59 17296 55.2 3.0 41.8

National Series: Socio-economic and Demographic Report Page 181
Table P07: Percentage of Literate Population Aged 7 Years and above by Age, Sex and Zila, 2011
Age Number Literacy
Cannot Read and Write Can Read Only Can Read and
Write 1 2 3 4 5
60-64 23062 57.7 4.5 37.765+ 32810 65.8 4.2 30.0 Female 478738 38.0 8.7 53.37-9 44970 29.1 35.9 35.010-14 68346 8.7 11.0 80.215-19 45599 10.3 3.2 86.420-24 46647 18.7 4.9 76.425-29 51889 32.3 5.7 62.030-34 42245 40.0 5.0 55.135-39 40987 43.0 8.4 48.640-44 28722 60.6 6.6 32.845-49 29351 66.4 3.6 30.050-54 27359 69.7 5.7 24.555-59 15933 73.7 1.3 25.060-64 16038 83.0 2.0 15.065+ 20651 83.2 3.6 13.2 Manikganj Total 1189074 40.5 6.1 53.47-9 103597 24.6 29.2 46.210-14 145818 6.6 8.0 85.515-19 105755 10.6 3.2 86.220-24 113984 17.8 3.7 78.625-29 124236 23.3 4.6 72.130-34 99146 40.5 3.4 56.135-39 96178 55.4 4.2 40.440-44 84982 64.9 2.7 32.445-49 74191 70.0 3.1 26.950-54 66367 70.7 2.6 26.655-59 43031 75.5 4.1 20.460-64 48022 75.6 2.5 21.965+ 83768 82.8 1.6 15.6 Male 587590 35.7 7.0 57.37-9 54496 23.0 31.7 45.310-14 75270 7.0 9.5 83.515-19 57734 12.6 3.3 84.120-24 52608 16.4 3.6 80.025-29 55710 18.9 5.3 75.830-34 44649 35.3 4.2 60.435-39 45054 46.7 3.6 49.7
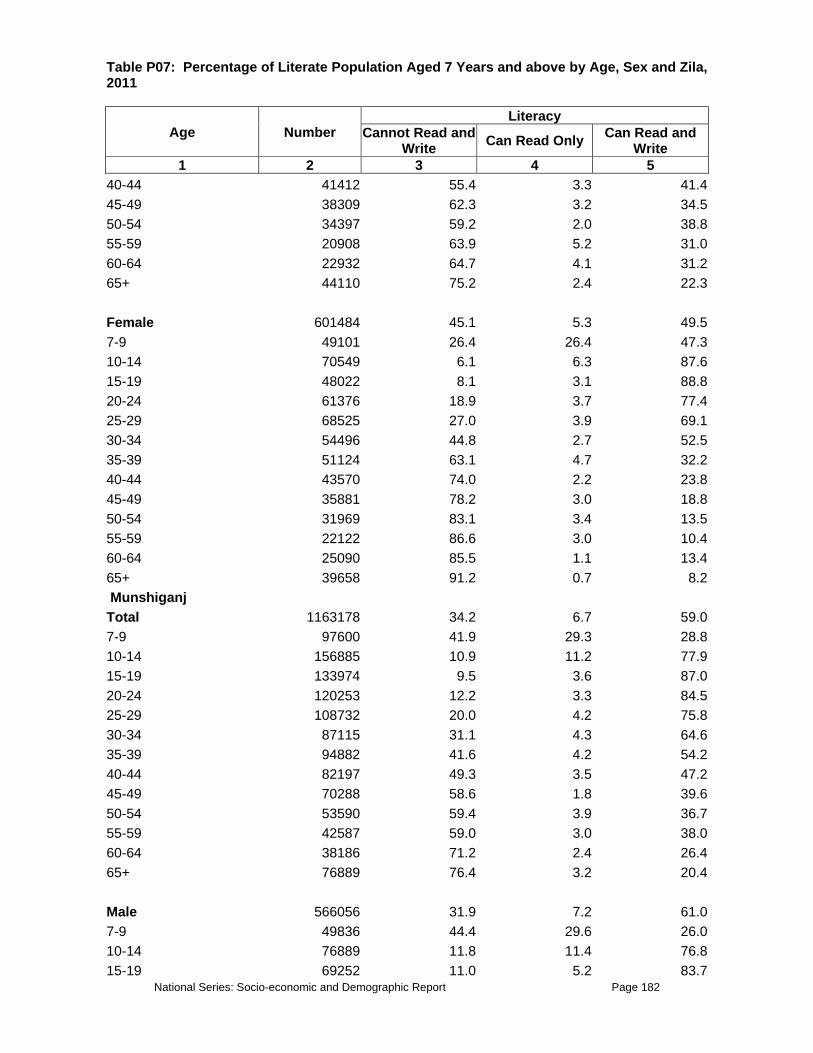
National Series: Socio-economic and Demographic Report Page 182
Table P07: Percentage of Literate Population Aged 7 Years and above by Age, Sex and Zila, 2011
Age Number Literacy
Cannot Read and Write Can Read Only Can Read and
Write 1 2 3 4 5
40-44 41412 55.4 3.3 41.445-49 38309 62.3 3.2 34.550-54 34397 59.2 2.0 38.855-59 20908 63.9 5.2 31.060-64 22932 64.7 4.1 31.265+ 44110 75.2 2.4 22.3 Female 601484 45.1 5.3 49.57-9 49101 26.4 26.4 47.310-14 70549 6.1 6.3 87.615-19 48022 8.1 3.1 88.820-24 61376 18.9 3.7 77.425-29 68525 27.0 3.9 69.130-34 54496 44.8 2.7 52.535-39 51124 63.1 4.7 32.240-44 43570 74.0 2.2 23.845-49 35881 78.2 3.0 18.850-54 31969 83.1 3.4 13.555-59 22122 86.6 3.0 10.460-64 25090 85.5 1.1 13.465+ 39658 91.2 0.7 8.2 Munshiganj Total 1163178 34.2 6.7 59.07-9 97600 41.9 29.3 28.810-14 156885 10.9 11.2 77.915-19 133974 9.5 3.6 87.020-24 120253 12.2 3.3 84.525-29 108732 20.0 4.2 75.830-34 87115 31.1 4.3 64.635-39 94882 41.6 4.2 54.240-44 82197 49.3 3.5 47.245-49 70288 58.6 1.8 39.650-54 53590 59.4 3.9 36.755-59 42587 59.0 3.0 38.060-64 38186 71.2 2.4 26.465+ 76889 76.4 3.2 20.4 Male 566056 31.9 7.2 61.07-9 49836 44.4 29.6 26.010-14 76889 11.8 11.4 76.815-19 69252 11.0 5.2 83.7

National Series: Socio-economic and Demographic Report Page 183
Table P07: Percentage of Literate Population Aged 7 Years and above by Age, Sex and Zila, 2011
Age Number Literacy
Cannot Read and Write Can Read Only Can Read and
Write 1 2 3 4 5
20-24 54496 12.8 4.0 83.125-29 45435 18.5 4.6 76.930-34 39998 27.5 4.2 68.335-39 41940 34.0 3.7 62.340-44 43493 43.7 3.9 52.445-49 34432 52.6 1.5 45.950-54 29513 54.8 2.6 42.555-59 22911 46.9 2.3 50.860-64 19287 59.1 4.0 36.965+ 38574 65.8 4.0 30.2 Female 597122 36.5 6.3 57.27-9 47765 39.3 29.0 31.710-14 79996 10.0 11.0 79.015-19 64722 7.8 1.8 90.420-24 65757 11.6 2.8 85.625-29 63298 21.1 3.9 75.130-34 47117 34.1 4.4 61.535-39 52942 47.7 4.6 47.740-44 38704 55.5 3.0 41.545-49 35856 64.3 2.2 33.650-54 24076 65.1 5.4 29.655-59 19675 73.0 3.9 23.060-64 18899 83.6 0.7 15.865+ 38315 87.2 2.4 10.5Mymensingh Total 4248974 41.5 8.1 50.47-9 451121 29.5 26.8 43.710-14 599737 11.7 10.1 78.315-19 463585 18.9 4.3 76.720-24 405098 24.6 5.3 70.125-29 440095 38.8 7.3 53.930-34 330790 48.6 6.4 45.135-39 327434 55.5 5.0 39.540-44 288602 63.8 4.3 31.945-49 215733 63.6 4.9 31.650-54 207583 68.1 5.1 26.855-59 130878 71.8 1.5 26.760-64 142384 77.4 3.4 19.265+ 245935 78.8 3.9 17.3
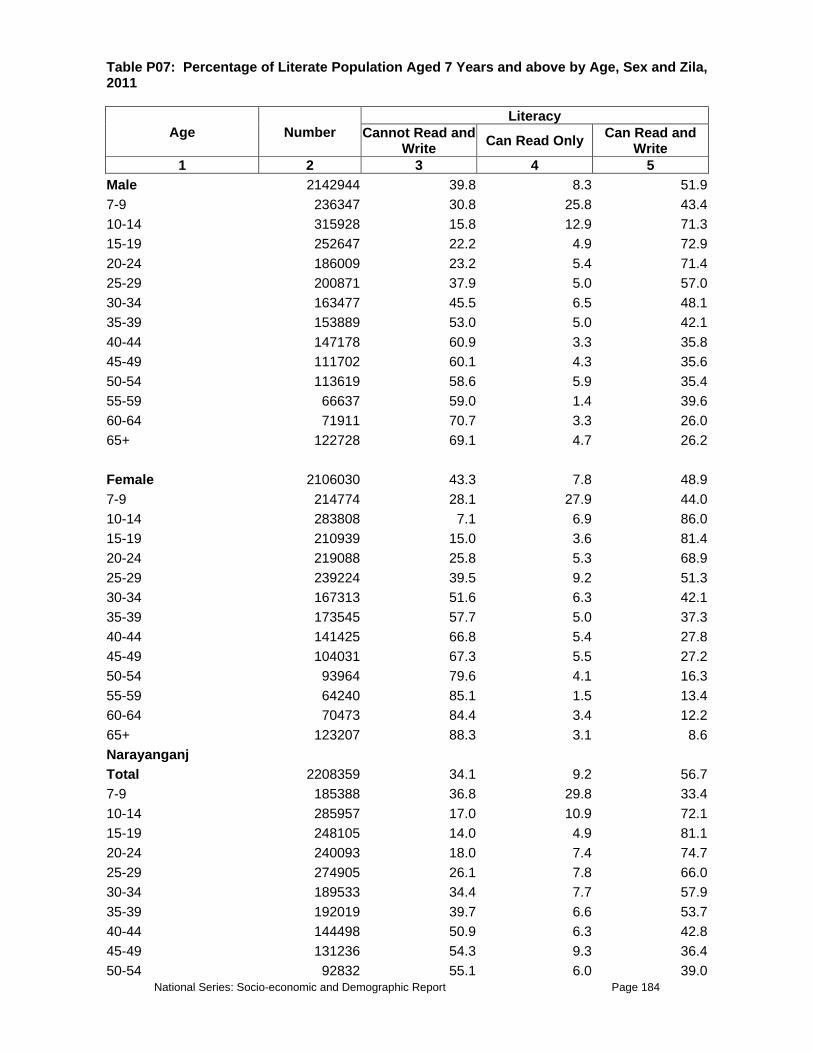
National Series: Socio-economic and Demographic Report Page 184
Table P07: Percentage of Literate Population Aged 7 Years and above by Age, Sex and Zila, 2011
Age Number Literacy
Cannot Read and Write Can Read Only Can Read and
Write 1 2 3 4 5
Male 2142944 39.8 8.3 51.97-9 236347 30.8 25.8 43.410-14 315928 15.8 12.9 71.315-19 252647 22.2 4.9 72.920-24 186009 23.2 5.4 71.425-29 200871 37.9 5.0 57.030-34 163477 45.5 6.5 48.135-39 153889 53.0 5.0 42.140-44 147178 60.9 3.3 35.845-49 111702 60.1 4.3 35.650-54 113619 58.6 5.9 35.455-59 66637 59.0 1.4 39.660-64 71911 70.7 3.3 26.065+ 122728 69.1 4.7 26.2 Female 2106030 43.3 7.8 48.97-9 214774 28.1 27.9 44.010-14 283808 7.1 6.9 86.015-19 210939 15.0 3.6 81.420-24 219088 25.8 5.3 68.925-29 239224 39.5 9.2 51.330-34 167313 51.6 6.3 42.135-39 173545 57.7 5.0 37.340-44 141425 66.8 5.4 27.845-49 104031 67.3 5.5 27.250-54 93964 79.6 4.1 16.355-59 64240 85.1 1.5 13.460-64 70473 84.4 3.4 12.265+ 123207 88.3 3.1 8.6Narayanganj Total 2208359 34.1 9.2 56.77-9 185388 36.8 29.8 33.410-14 285957 17.0 10.9 72.115-19 248105 14.0 4.9 81.120-24 240093 18.0 7.4 74.725-29 274905 26.1 7.8 66.030-34 189533 34.4 7.7 57.935-39 192019 39.7 6.6 53.740-44 144498 50.9 6.3 42.845-49 131236 54.3 9.3 36.450-54 92832 55.1 6.0 39.0

National Series: Socio-economic and Demographic Report Page 185
Table P07: Percentage of Literate Population Aged 7 Years and above by Age, Sex and Zila, 2011
Age Number Literacy
Cannot Read and Write Can Read Only Can Read and
Write 1 2 3 4 5
55-59 70453 63.1 4.7 32.260-64 63822 62.8 7.4 29.965+ 89517 71.6 3.7 24.7 Male 1099621 31.6 9.6 58.87-9 88964 37.0 31.7 31.410-14 146985 19.9 13.3 66.715-19 127092 15.4 4.8 79.820-24 107476 17.2 6.7 76.125-29 121566 25.2 7.7 67.030-34 92280 30.8 7.5 61.735-39 100292 31.1 7.2 61.740-44 79571 47.9 7.3 44.845-49 67967 43.5 9.8 46.750-54 48074 46.6 6.9 46.655-59 35917 49.2 7.7 43.160-64 34536 52.8 2.4 44.865+ 48903 62.1 3.4 34.5 Female 1108738 36.6 8.8 54.67-9 96424 36.7 28.1 35.210-14 138972 13.9 8.3 77.715-19 121014 12.6 5.0 82.420-24 132618 18.5 7.9 73.525-29 153339 26.8 7.9 65.230-34 97253 37.8 8.0 54.335-39 91727 49.1 6.0 44.940-44 64927 54.5 5.1 40.445-49 63270 65.9 8.7 25.350-54 44758 64.2 4.9 30.955-59 34536 77.6 1.6 20.860-64 29286 74.5 13.2 12.365+ 40614 83.0 4.1 12.9 Narsingdi Total 1788322 35.9 8.6 55.57-9 189377 33.5 28.3 38.310-14 265800 12.6 10.9 76.515-19 194709 13.7 4.2 82.220-24 187008 20.1 5.4 74.625-29 181478 28.5 6.3 65.230-34 146328 42.8 6.5 50.7

National Series: Socio-economic and Demographic Report Page 186
Table P07: Percentage of Literate Population Aged 7 Years and above by Age, Sex and Zila, 2011
Age Number Literacy
Cannot Read and Write Can Read Only Can Read and
Write 1 2 3 4 5
35-39 146526 47.7 5.7 46.640-44 105451 51.7 5.6 42.745-49 93800 56.8 6.3 36.850-54 78989 61.2 3.8 35.055-59 57267 68.6 5.5 25.960-64 56872 72.2 6.3 21.565+ 84716 72.0 2.8 25.2 Male 883498 35.2 8.4 56.47-9 97750 36.6 30.1 33.310-14 134085 14.7 10.5 74.815-19 103081 15.9 4.0 80.120-24 84124 19.2 4.7 76.125-29 76817 30.1 5.9 64.030-34 68326 41.0 5.5 53.535-39 72078 44.4 5.5 50.140-44 55885 50.2 4.2 45.645-49 46209 50.0 5.6 44.450-54 41667 54.0 2.4 43.655-59 28239 62.9 4.2 32.960-64 31991 63.0 6.8 30.265+ 43247 65.3 3.2 31.5 Female 904825 36.7 8.8 54.67-9 91628 30.2 26.3 43.510-14 131715 10.3 11.4 78.315-19 91628 11.2 4.3 84.520-24 102884 20.7 6.0 73.325-29 104661 27.4 6.6 66.030-34 78002 44.3 7.3 48.435-39 74448 50.9 5.8 43.240-44 49566 53.4 7.2 39.445-49 47591 63.5 7.1 29.550-54 37323 69.3 5.3 25.455-59 29029 74.1 6.8 19.060-64 24882 84.1 5.6 10.365+ 41469 79.0 2.4 18.6 Netrokona Total 1811941 47.7 8.5 43.77-9 203119 35.8 29.4 34.810-14 275804 16.2 9.7 74.2

National Series: Socio-economic and Demographic Report Page 187
Table P07: Percentage of Literate Population Aged 7 Years and above by Age, Sex and Zila, 2011
Age Number Literacy
Cannot Read and Write Can Read Only Can Read and
Write 1 2 3 4 5
15-19 179820 24.6 6.4 69.020-24 168469 36.4 5.0 58.625-29 169266 45.4 8.2 46.430-34 141785 58.3 6.7 35.035-39 140391 61.4 6.2 32.340-44 123265 68.8 4.4 26.845-49 99966 67.3 2.6 30.150-54 85031 74.9 3.0 22.055-59 49187 71.7 3.6 24.760-64 56754 80.7 2.8 16.565+ 119083 83.3 1.8 14.9 Male 929966 46.1 8.5 45.47-9 108529 38.3 29.4 32.310-14 140789 21.4 10.5 68.215-19 106538 26.4 6.5 67.120-24 85031 34.2 4.9 60.925-29 71689 47.2 6.1 46.730-34 71291 58.4 6.4 35.235-39 68503 55.2 5.5 39.240-44 66711 63.9 3.9 32.245-49 57750 63.4 2.1 34.550-54 46399 70.8 3.0 26.255-59 23100 57.8 5.2 37.160-64 28476 70.6 3.5 25.965+ 55161 74.7 2.5 22.7 Female 881974 49.4 8.6 42.07-9 94590 32.8 29.5 37.710-14 135014 10.8 8.8 80.415-19 73282 22.0 6.2 71.720-24 83438 38.7 5.0 56.325-29 97577 44.1 9.8 46.130-34 70494 58.2 7.1 34.735-39 71888 67.3 6.9 25.840-44 56555 74.6 4.9 20.445-49 42217 72.6 3.3 24.150-54 38632 79.9 3.1 17.055-59 26087 84.0 2.3 13.760-64 28277 90.8 2.1 7.065+ 63923 90.7 1.2 8.1

National Series: Socio-economic and Demographic Report Page 188
Table P07: Percentage of Literate Population Aged 7 Years and above by Age, Sex and Zila, 2011
Age Number Literacy
Cannot Read and Write Can Read Only Can Read and
Write 1 2 3 4 5
Rajbari Total 889378 39.2 4.1 56.67-9 77436 25.9 18.4 55.710-14 114918 8.1 4.2 87.715-19 88710 11.7 1.6 86.720-24 87919 20.5 2.0 77.525-29 96622 31.8 2.7 65.530-34 77832 40.0 2.5 57.435-39 66162 55.6 3.3 41.140-44 59734 61.3 3.3 35.445-49 48558 66.2 2.6 31.250-54 47174 67.3 2.7 30.055-59 29471 62.8 2.0 35.260-64 33229 76.5 3.6 19.965+ 61613 77.8 2.6 19.6 Male 448397 36.9 4.1 59.07-9 38570 28.2 18.5 53.310-14 60624 10.6 4.2 85.215-19 49448 15.4 1.0 83.620-24 40449 20.8 2.9 76.325-29 42624 32.0 3.0 65.030-34 40251 35.6 1.2 63.135-39 30460 51.9 3.6 44.540-44 30955 56.2 2.9 40.945-49 23340 58.5 3.0 38.650-54 25614 59.8 1.5 38.655-59 16516 52.7 3.0 44.360-64 18395 67.2 4.8 28.065+ 31152 67.6 2.5 29.8 Female 440980 41.5 4.2 54.37-9 38866 23.7 18.3 58.010-14 54294 5.3 4.2 90.515-19 39262 7.1 2.3 90.720-24 47470 20.2 1.2 78.525-29 53998 31.7 2.4 65.930-34 37581 44.7 3.9 51.335-39 35702 58.7 3.0 38.240-44 28779 66.7 3.8 29.645-49 25219 73.3 2.4 24.3
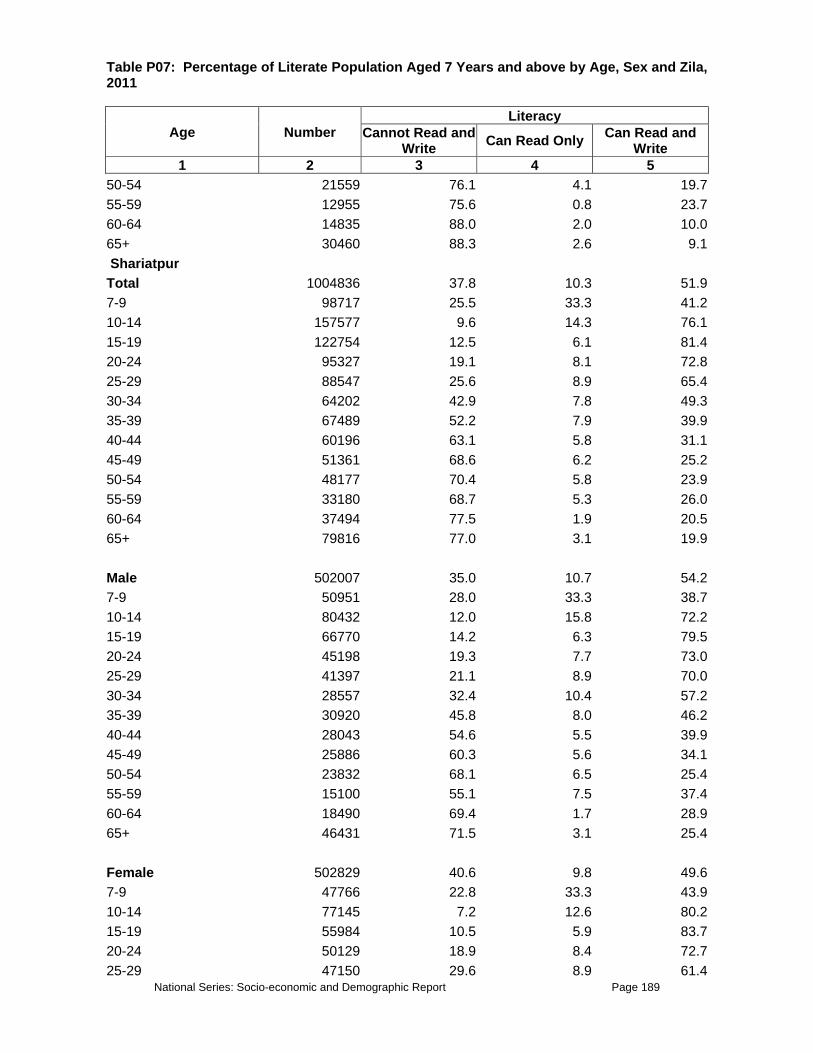
National Series: Socio-economic and Demographic Report Page 189
Table P07: Percentage of Literate Population Aged 7 Years and above by Age, Sex and Zila, 2011
Age Number Literacy
Cannot Read and Write Can Read Only Can Read and
Write 1 2 3 4 5
50-54 21559 76.1 4.1 19.755-59 12955 75.6 0.8 23.760-64 14835 88.0 2.0 10.065+ 30460 88.3 2.6 9.1 Shariatpur Total 1004836 37.8 10.3 51.97-9 98717 25.5 33.3 41.210-14 157577 9.6 14.3 76.115-19 122754 12.5 6.1 81.420-24 95327 19.1 8.1 72.825-29 88547 25.6 8.9 65.430-34 64202 42.9 7.8 49.335-39 67489 52.2 7.9 39.940-44 60196 63.1 5.8 31.145-49 51361 68.6 6.2 25.250-54 48177 70.4 5.8 23.955-59 33180 68.7 5.3 26.060-64 37494 77.5 1.9 20.565+ 79816 77.0 3.1 19.9 Male 502007 35.0 10.7 54.27-9 50951 28.0 33.3 38.710-14 80432 12.0 15.8 72.215-19 66770 14.2 6.3 79.520-24 45198 19.3 7.7 73.025-29 41397 21.1 8.9 70.030-34 28557 32.4 10.4 57.235-39 30920 45.8 8.0 46.240-44 28043 54.6 5.5 39.945-49 25886 60.3 5.6 34.150-54 23832 68.1 6.5 25.455-59 15100 55.1 7.5 37.460-64 18490 69.4 1.7 28.965+ 46431 71.5 3.1 25.4 Female 502829 40.6 9.8 49.67-9 47766 22.8 33.3 43.910-14 77145 7.2 12.6 80.215-19 55984 10.5 5.9 83.720-24 50129 18.9 8.4 72.725-29 47150 29.6 8.9 61.4
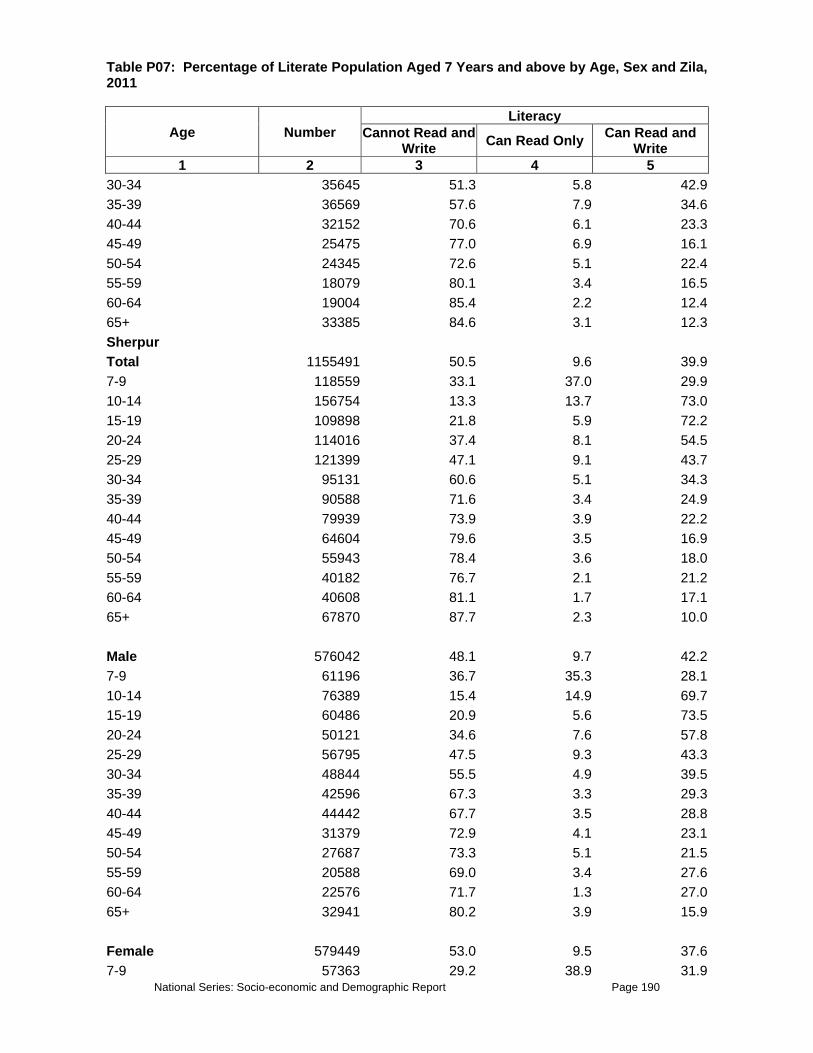
National Series: Socio-economic and Demographic Report Page 190
Table P07: Percentage of Literate Population Aged 7 Years and above by Age, Sex and Zila, 2011
Age Number Literacy
Cannot Read and Write Can Read Only Can Read and
Write 1 2 3 4 5
30-34 35645 51.3 5.8 42.935-39 36569 57.6 7.9 34.640-44 32152 70.6 6.1 23.345-49 25475 77.0 6.9 16.150-54 24345 72.6 5.1 22.455-59 18079 80.1 3.4 16.560-64 19004 85.4 2.2 12.465+ 33385 84.6 3.1 12.3Sherpur Total 1155491 50.5 9.6 39.97-9 118559 33.1 37.0 29.910-14 156754 13.3 13.7 73.015-19 109898 21.8 5.9 72.220-24 114016 37.4 8.1 54.525-29 121399 47.1 9.1 43.730-34 95131 60.6 5.1 34.335-39 90588 71.6 3.4 24.940-44 79939 73.9 3.9 22.245-49 64604 79.6 3.5 16.950-54 55943 78.4 3.6 18.055-59 40182 76.7 2.1 21.260-64 40608 81.1 1.7 17.165+ 67870 87.7 2.3 10.0 Male 576042 48.1 9.7 42.27-9 61196 36.7 35.3 28.110-14 76389 15.4 14.9 69.715-19 60486 20.9 5.6 73.520-24 50121 34.6 7.6 57.825-29 56795 47.5 9.3 43.330-34 48844 55.5 4.9 39.535-39 42596 67.3 3.3 29.340-44 44442 67.7 3.5 28.845-49 31379 72.9 4.1 23.150-54 27687 73.3 5.1 21.555-59 20588 69.0 3.4 27.660-64 22576 71.7 1.3 27.065+ 32941 80.2 3.9 15.9 Female 579449 53.0 9.5 37.67-9 57363 29.2 38.9 31.9

National Series: Socio-economic and Demographic Report Page 191
Table P07: Percentage of Literate Population Aged 7 Years and above by Age, Sex and Zila, 2011
Age Number Literacy
Cannot Read and Write Can Read Only Can Read and
Write 1 2 3 4 5
10-14 80365 11.3 12.5 76.115-19 49412 23.0 6.3 70.720-24 63894 39.6 8.4 52.025-29 64604 46.8 9.0 44.230-34 46288 66.0 5.2 28.835-39 47992 75.4 3.6 21.040-44 35497 81.6 4.4 14.045-49 33225 85.9 3.0 11.150-54 28255 83.4 2.0 14.655-59 19594 84.8 0.7 14.560-64 18032 92.9 2.4 4.765+ 34929 94.7 0.8 4.5Tangail Total 3078157 41.0 7.6 51.47-9 245169 26.7 33.6 39.810-14 375878 8.9 11.9 79.215-19 301497 10.4 5.3 84.320-24 289220 20.2 6.1 73.725-29 313773 32.7 5.8 61.630-34 238309 43.9 5.2 50.935-39 243003 52.9 4.0 43.140-44 224227 60.9 4.2 34.945-49 211228 63.2 3.6 33.250-54 167538 67.7 3.7 28.755-59 120599 65.6 3.6 30.860-64 116266 78.9 1.9 19.365+ 231449 78.6 2.0 19.3 Male 1519039 36.4 7.3 56.37-9 118071 27.8 32.7 39.410-14 211228 10.6 12.0 77.415-19 163928 9.7 4.8 85.520-24 124571 17.7 5.5 76.825-29 131070 27.8 5.2 66.930-34 116988 40.1 4.3 55.635-39 110489 44.1 3.3 52.640-44 107961 54.2 4.0 41.845-49 101823 54.6 1.8 43.650-54 85214 57.6 4.7 37.755-59 68604 56.3 3.7 40.060-64 59938 70.5 1.8 27.7

National Series: Socio-economic and Demographic Report Page 192
Table P07: Percentage of Literate Population Aged 7 Years and above by Age, Sex and Zila, 2011
Age Number Literacy
Cannot Read and Write Can Read Only Can Read and
Write 1 2 3 4 5
65+ 119154 70.3 2.4 27.3 Female 1559118 45.4 8.0 46.67-9 127098 25.6 34.4 40.110-14 164650 6.8 11.8 81.415-19 137569 11.3 5.8 82.920-24 164650 22.1 6.6 71.325-29 182704 36.2 6.1 57.730-34 121321 47.6 6.0 46.435-39 132514 60.2 4.6 35.140-44 116266 67.1 4.3 28.645-49 109405 71.3 5.3 23.450-54 82325 78.1 2.6 19.355-59 51995 77.8 3.5 18.860-64 56328 87.8 1.9 10.365+ 112294 87.5 1.6 10.9 Bagerhat Total 1326198 26.4 10.2 63.47-9 108666 20.6 39.2 40.210-14 170303 7.1 9.7 83.215-19 135979 9.0 4.2 86.820-24 122250 10.5 5.5 84.025-29 124295 16.5 8.8 74.730-34 101072 22.8 9.0 68.235-39 108666 29.6 10.6 59.840-44 93184 37.5 6.1 56.445-49 87780 39.8 9.7 50.650-54 66748 44.9 7.7 47.555-59 52581 47.8 6.4 45.860-64 51996 47.5 6.2 46.365+ 102678 63.4 5.8 30.7 Male 661054 24.5 10.0 65.57-9 53603 21.3 40.3 38.410-14 84421 9.0 10.9 80.115-19 72882 10.6 5.2 84.220-24 56962 12.1 5.4 82.625-29 56086 19.0 9.1 71.930-34 45716 23.0 6.7 70.335-39 48929 26.9 7.8 65.440-44 49805 34.3 5.6 60.1

National Series: Socio-economic and Demographic Report Page 193
Table P07: Percentage of Literate Population Aged 7 Years and above by Age, Sex and Zila, 2011
Age Number Literacy
Cannot Read and Write Can Read Only Can Read and
Write 1 2 3 4 5
45-49 47907 35.7 8.5 55.850-54 36368 37.8 8.4 53.855-59 25706 36.9 5.1 58.060-64 30234 38.6 4.3 57.065+ 52434 47.9 7.0 45.1 Female 665144 28.2 10.4 61.47-9 55064 19.9 38.2 41.910-14 85882 5.3 8.5 86.215-19 63097 7.2 3.0 89.820-24 65288 9.2 5.6 85.225-29 68209 14.3 8.6 77.130-34 55356 22.7 10.8 66.535-39 59737 31.8 13.0 55.340-44 43379 41.1 6.7 52.245-49 39874 44.7 11.0 44.350-54 30380 53.4 6.7 39.955-59 26875 58.2 7.6 34.260-64 21763 59.7 8.7 31.565+ 50244 79.7 4.7 15.7Chuadanga Total 951301 43.9 7.2 48.97-9 74189 42.5 28.9 28.610-14 116302 16.4 13.5 70.115-19 89188 13.6 4.7 81.820-24 94265 21.2 5.1 73.725-29 107072 33.1 5.4 61.530-34 90919 46.2 5.1 48.735-39 90227 58.4 3.5 38.140-44 74304 63.8 2.8 33.445-49 56190 70.0 3.3 26.750-54 47998 69.5 3.6 26.955-59 31729 68.4 3.3 28.460-64 32075 77.7 2.2 20.165+ 46844 82.3 3.0 14.8 Male 468555 43.6 7.0 49.47-9 36229 43.3 27.4 29.310-14 57690 21.2 12.6 66.215-19 43613 19.8 5.0 75.120-24 40960 23.1 4.8 72.1
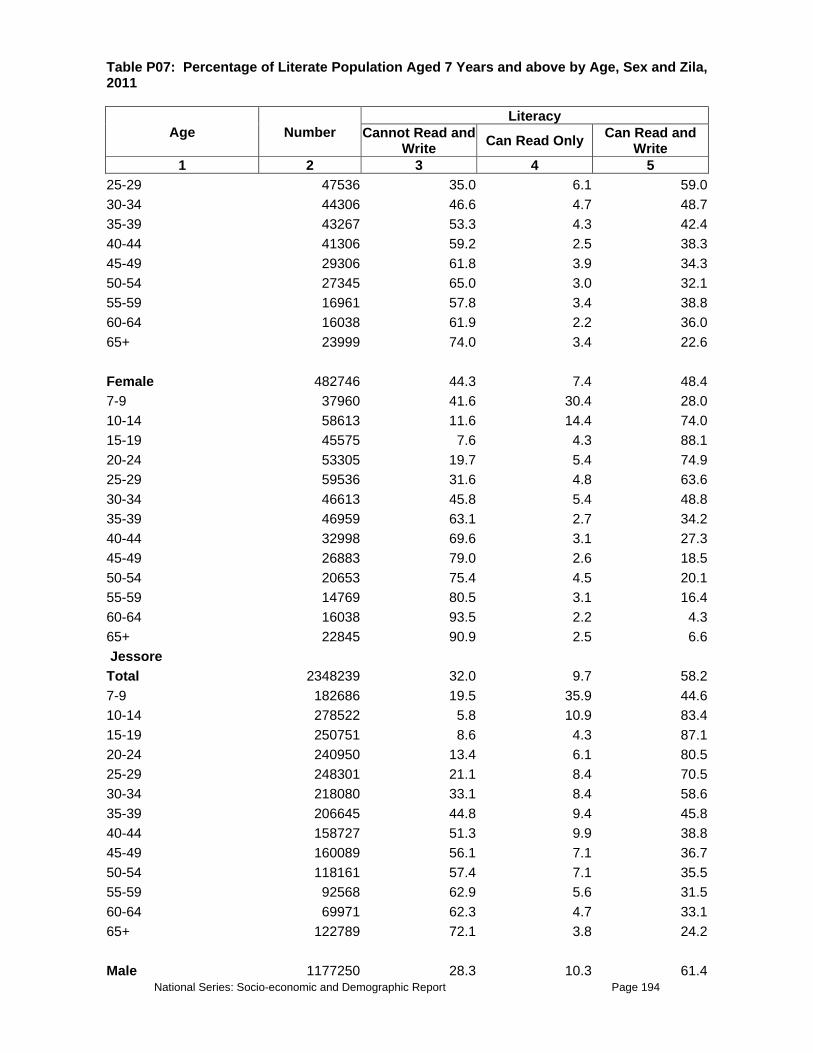
National Series: Socio-economic and Demographic Report Page 194
Table P07: Percentage of Literate Population Aged 7 Years and above by Age, Sex and Zila, 2011
Age Number Literacy
Cannot Read and Write Can Read Only Can Read and
Write 1 2 3 4 5
25-29 47536 35.0 6.1 59.030-34 44306 46.6 4.7 48.735-39 43267 53.3 4.3 42.440-44 41306 59.2 2.5 38.345-49 29306 61.8 3.9 34.350-54 27345 65.0 3.0 32.155-59 16961 57.8 3.4 38.860-64 16038 61.9 2.2 36.065+ 23999 74.0 3.4 22.6 Female 482746 44.3 7.4 48.47-9 37960 41.6 30.4 28.010-14 58613 11.6 14.4 74.015-19 45575 7.6 4.3 88.120-24 53305 19.7 5.4 74.925-29 59536 31.6 4.8 63.630-34 46613 45.8 5.4 48.835-39 46959 63.1 2.7 34.240-44 32998 69.6 3.1 27.345-49 26883 79.0 2.6 18.550-54 20653 75.4 4.5 20.155-59 14769 80.5 3.1 16.460-64 16038 93.5 2.2 4.365+ 22845 90.9 2.5 6.6 Jessore Total 2348239 32.0 9.7 58.27-9 182686 19.5 35.9 44.610-14 278522 5.8 10.9 83.415-19 250751 8.6 4.3 87.120-24 240950 13.4 6.1 80.525-29 248301 21.1 8.4 70.530-34 218080 33.1 8.4 58.635-39 206645 44.8 9.4 45.840-44 158727 51.3 9.9 38.845-49 160089 56.1 7.1 36.750-54 118161 57.4 7.1 35.555-59 92568 62.9 5.6 31.560-64 69971 62.3 4.7 33.165+ 122789 72.1 3.8 24.2 Male 1177250 28.3 10.3 61.4

National Series: Socio-economic and Demographic Report Page 195
Table P07: Percentage of Literate Population Aged 7 Years and above by Age, Sex and Zila, 2011
Age Number Literacy
Cannot Read and Write Can Read Only Can Read and
Write 1 2 3 4 5
7-9 94202 23.4 38.2 38.410-14 142936 7.2 12.2 80.615-19 129596 8.2 6.5 85.320-24 111626 13.2 7.1 79.825-29 113805 21.3 8.4 70.330-34 108904 28.0 7.3 64.835-39 96380 38.7 8.2 53.140-44 78683 42.2 9.3 48.445-49 89301 49.7 6.1 44.250-54 59080 45.2 8.3 46.555-59 44651 45.1 5.5 49.460-64 44651 51.8 4.3 43.965+ 63436 56.2 6.4 37.3 Female 1170988 35.8 9.2 55.07-9 88484 15.4 33.5 51.110-14 135585 4.2 9.4 86.315-19 121156 9.0 2.0 89.020-24 129323 13.7 5.3 81.125-29 134496 20.9 8.5 70.630-34 109176 38.2 9.5 52.435-39 110265 50.1 10.4 39.540-44 80044 60.2 10.5 29.345-49 70787 64.2 8.5 27.350-54 59080 69.6 6.0 24.455-59 47918 79.5 5.7 14.860-64 25320 80.6 5.4 14.065+ 59353 89.0 0.9 10.1Jhenaidah Total 1477183 37.4 9.3 53.27-9 113400 26.0 41.3 32.710-14 193271 8.7 12.3 79.015-19 150439 9.2 5.0 85.820-24 143944 14.4 8.4 77.225-29 154301 28.2 7.5 64.330-34 127268 41.5 7.2 51.335-39 137625 54.3 5.2 40.440-44 112522 57.3 4.4 38.445-49 96197 61.5 4.6 33.950-54 71445 63.1 4.9 31.955-59 48976 72.0 2.5 25.4

National Series: Socio-economic and Demographic Report Page 196
Table P07: Percentage of Literate Population Aged 7 Years and above by Age, Sex and Zila, 2011
Age Number Literacy
Cannot Read and Write Can Read Only Can Read and
Write 1 2 3 4 5
60-64 45641 74.6 3.8 21.565+ 82154 76.7 4.7 18.6 Male 740610 34.7 9.3 56.07-9 53716 25.5 41.8 32.710-14 102516 11.5 12.8 75.715-19 78467 13.4 5.6 81.020-24 72148 15.6 7.3 77.125-29 67232 28.2 8.9 62.930-34 60913 35.7 6.9 57.335-39 60035 52.9 4.1 43.040-44 60386 47.1 6.1 46.845-49 54242 53.7 3.6 42.750-54 38093 52.5 4.1 43.355-59 27911 65.4 1.9 32.760-64 21416 60.7 4.1 35.265+ 43534 64.5 5.6 29.8 Female 736573 40.3 9.3 50.47-9 59684 26.5 40.9 32.610-14 90755 5.6 11.6 82.815-19 71972 4.6 4.4 91.020-24 71797 13.2 9.5 77.325-29 87069 28.2 6.5 65.330-34 66355 46.8 7.4 45.835-39 77589 55.4 6.1 38.540-44 52136 69.0 2.4 28.645-49 41954 71.5 5.9 22.650-54 33353 75.3 5.8 18.955-59 21065 80.8 3.3 15.860-64 24225 87.0 3.6 9.465+ 38619 90.5 3.6 5.9Khulna Total 2012539 27.6 6.3 66.17-9 141656 20.6 30.5 48.910-14 245107 6.2 6.1 87.715-19 194274 6.7 2.3 91.020-24 203393 11.1 3.8 85.125-29 214012 20.3 3.5 76.230-34 176368 23.8 4.1 72.135-39 182153 34.6 6.0 59.3
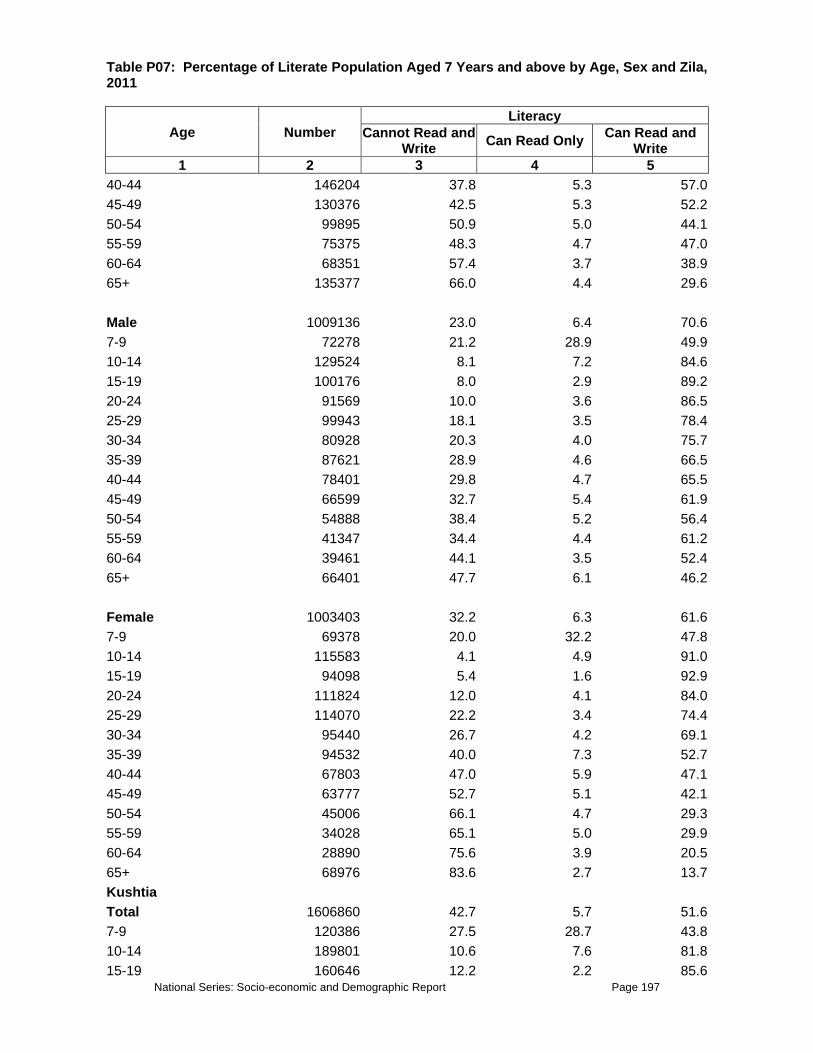
National Series: Socio-economic and Demographic Report Page 197
Table P07: Percentage of Literate Population Aged 7 Years and above by Age, Sex and Zila, 2011
Age Number Literacy
Cannot Read and Write Can Read Only Can Read and
Write 1 2 3 4 5
40-44 146204 37.8 5.3 57.045-49 130376 42.5 5.3 52.250-54 99895 50.9 5.0 44.155-59 75375 48.3 4.7 47.060-64 68351 57.4 3.7 38.965+ 135377 66.0 4.4 29.6 Male 1009136 23.0 6.4 70.67-9 72278 21.2 28.9 49.910-14 129524 8.1 7.2 84.615-19 100176 8.0 2.9 89.220-24 91569 10.0 3.6 86.525-29 99943 18.1 3.5 78.430-34 80928 20.3 4.0 75.735-39 87621 28.9 4.6 66.540-44 78401 29.8 4.7 65.545-49 66599 32.7 5.4 61.950-54 54888 38.4 5.2 56.455-59 41347 34.4 4.4 61.260-64 39461 44.1 3.5 52.465+ 66401 47.7 6.1 46.2 Female 1003403 32.2 6.3 61.67-9 69378 20.0 32.2 47.810-14 115583 4.1 4.9 91.015-19 94098 5.4 1.6 92.920-24 111824 12.0 4.1 84.025-29 114070 22.2 3.4 74.430-34 95440 26.7 4.2 69.135-39 94532 40.0 7.3 52.740-44 67803 47.0 5.9 47.145-49 63777 52.7 5.1 42.150-54 45006 66.1 4.7 29.355-59 34028 65.1 5.0 29.960-64 28890 75.6 3.9 20.565+ 68976 83.6 2.7 13.7Kushtia Total 1606860 42.7 5.7 51.67-9 120386 27.5 28.7 43.810-14 189801 10.6 7.6 81.815-19 160646 12.2 2.2 85.6
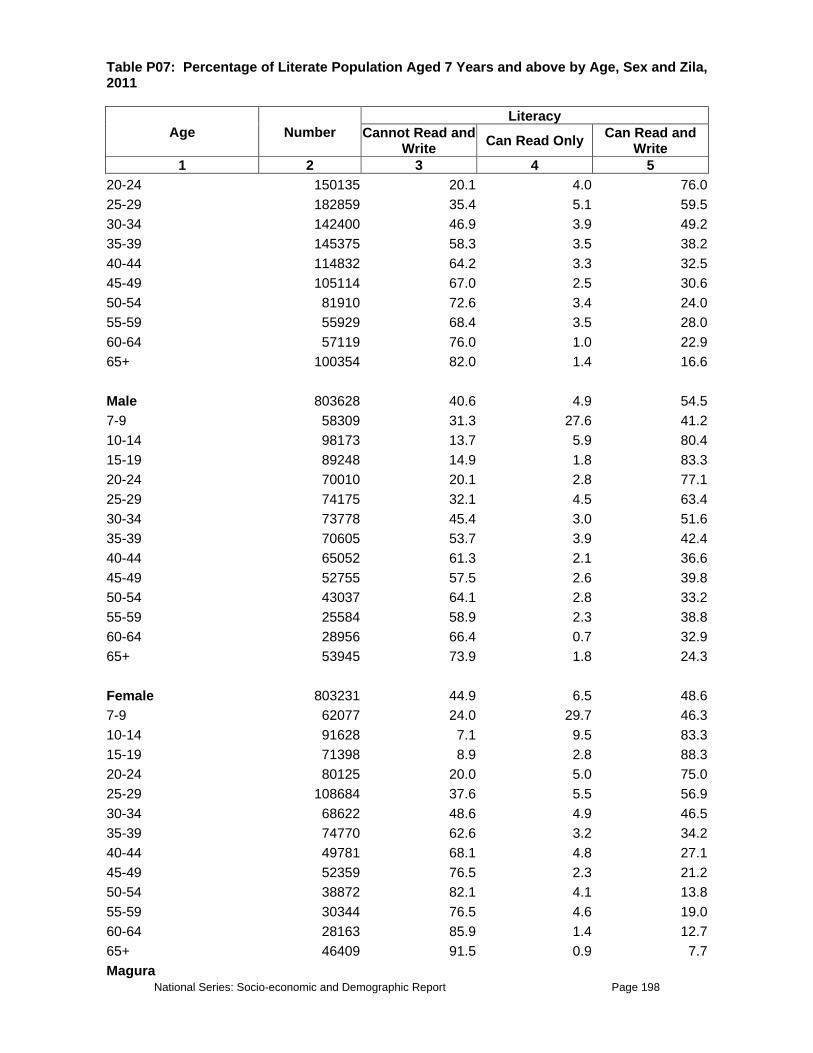
National Series: Socio-economic and Demographic Report Page 198
Table P07: Percentage of Literate Population Aged 7 Years and above by Age, Sex and Zila, 2011
Age Number Literacy
Cannot Read and Write Can Read Only Can Read and
Write 1 2 3 4 5
20-24 150135 20.1 4.0 76.025-29 182859 35.4 5.1 59.530-34 142400 46.9 3.9 49.235-39 145375 58.3 3.5 38.240-44 114832 64.2 3.3 32.545-49 105114 67.0 2.5 30.650-54 81910 72.6 3.4 24.055-59 55929 68.4 3.5 28.060-64 57119 76.0 1.0 22.965+ 100354 82.0 1.4 16.6 Male 803628 40.6 4.9 54.57-9 58309 31.3 27.6 41.210-14 98173 13.7 5.9 80.415-19 89248 14.9 1.8 83.320-24 70010 20.1 2.8 77.125-29 74175 32.1 4.5 63.430-34 73778 45.4 3.0 51.635-39 70605 53.7 3.9 42.440-44 65052 61.3 2.1 36.645-49 52755 57.5 2.6 39.850-54 43037 64.1 2.8 33.255-59 25584 58.9 2.3 38.860-64 28956 66.4 0.7 32.965+ 53945 73.9 1.8 24.3 Female 803231 44.9 6.5 48.67-9 62077 24.0 29.7 46.310-14 91628 7.1 9.5 83.315-19 71398 8.9 2.8 88.320-24 80125 20.0 5.0 75.025-29 108684 37.6 5.5 56.930-34 68622 48.6 4.9 46.535-39 74770 62.6 3.2 34.240-44 49781 68.1 4.8 27.145-49 52359 76.5 2.3 21.250-54 38872 82.1 4.1 13.855-59 30344 76.5 4.6 19.060-64 28163 85.9 1.4 12.765+ 46409 91.5 0.9 7.7Magura

National Series: Socio-economic and Demographic Report Page 199
Table P07: Percentage of Literate Population Aged 7 Years and above by Age, Sex and Zila, 2011
Age Number Literacy
Cannot Read and Write Can Read Only Can Read and
Write 1 2 3 4 5
Total 752614 38.6 7.9 53.57-9 64302 33.6 31.3 35.210-14 104887 10.7 11.7 77.615-19 72522 9.2 3.1 87.720-24 71751 16.8 5.3 77.925-29 77488 30.3 5.3 64.430-34 64901 45.6 4.9 49.535-39 61562 52.3 4.9 42.840-44 54199 58.6 4.6 36.845-49 48291 62.9 4.6 32.450-54 40071 61.5 5.3 33.155-59 27485 68.5 4.4 27.160-64 23118 71.1 4.1 24.865+ 42040 76.0 3.9 20.2 Male 378191 35.2 7.6 57.37-9 34163 35.1 29.3 35.610-14 55226 14.3 11.0 74.715-19 40328 11.5 3.8 84.720-24 34163 18.0 4.8 77.225-29 34591 28.5 5.0 66.630-34 29454 42.7 4.1 53.235-39 30824 46.9 4.4 48.640-44 26115 49.8 4.9 45.245-49 23888 56.3 3.6 40.150-54 21919 52.7 4.7 42.655-59 15669 55.7 2.2 42.160-64 11559 58.5 4.4 37.065+ 20292 59.1 5.1 35.9 Female 374424 42.1 8.2 49.77-9 30139 31.8 33.5 34.710-14 49661 6.7 12.4 80.915-19 32194 6.4 2.1 91.520-24 37588 15.7 5.7 78.625-29 42896 31.7 5.6 62.730-34 35447 48.1 5.6 46.435-39 30738 57.7 5.3 37.040-44 28084 66.8 4.3 29.045-49 24402 69.5 5.6 24.950-54 18152 72.2 6.1 21.7

National Series: Socio-economic and Demographic Report Page 200
Table P07: Percentage of Literate Population Aged 7 Years and above by Age, Sex and Zila, 2011
Age Number Literacy
Cannot Read and Write Can Read Only Can Read and
Write 1 2 3 4 5
55-59 11816 85.5 7.2 7.260-64 11559 83.7 3.7 12.665+ 21748 91.7 2.8 5.5 Meherpur Total 565626 47.5 8.1 44.47-9 38935 32.7 36.4 30.910-14 66805 12.3 14.1 73.615-19 57123 14.0 3.3 82.720-24 54979 27.3 6.5 66.225-29 59197 41.1 7.9 50.930-34 48478 55.2 5.3 39.535-39 52143 63.1 5.4 31.440-44 49861 69.6 5.8 24.545-49 40110 71.9 3.3 24.850-54 29045 72.6 3.6 23.855-59 18395 78.9 4.1 16.960-64 18810 78.3 2.2 19.565+ 31743 83.9 1.5 14.6 Male 280634 45.7 8.5 45.97-9 20539 35.0 38.0 26.910-14 36376 13.7 16.2 70.215-19 27801 18.4 3.7 77.920-24 25933 27.7 6.1 66.125-29 25034 38.7 8.0 53.330-34 20470 53.4 4.1 42.635-39 23859 59.4 4.6 35.940-44 25104 65.0 5.2 29.845-49 22545 68.1 2.8 29.150-54 17358 65.7 3.2 31.155-59 9958 72.2 3.5 24.360-64 9059 66.4 3.8 29.865+ 16597 75.8 1.7 22.5 Female 284991 49.3 7.8 42.97-9 18395 30.1 34.6 35.310-14 30429 10.7 11.6 77.715-19 29322 9.9 2.8 87.320-24 29045 26.9 6.9 66.225-29 34163 42.9 7.9 49.230-34 28008 56.5 6.2 37.3

National Series: Socio-economic and Demographic Report Page 201
Table P07: Percentage of Literate Population Aged 7 Years and above by Age, Sex and Zila, 2011
Age Number Literacy
Cannot Read and Write Can Read Only Can Read and
Write 1 2 3 4 5
35-39 28285 66.3 6.1 27.640-44 24758 74.3 6.4 19.345-49 17566 76.8 3.9 19.350-54 11687 82.8 4.1 13.055-59 8437 86.9 4.9 8.260-64 9751 89.4 0.7 9.965+ 15145 92.7 1.4 5.9Narail Total 603144 33.7 6.0 60.37-9 52477 18.4 22.7 58.910-14 82975 5.9 5.4 88.815-19 54911 10.1 1.7 88.220-24 58495 18.4 2.8 78.825-29 59510 25.0 3.9 71.130-34 47540 35.6 6.0 58.535-39 52680 41.2 5.5 53.340-44 42942 52.8 3.9 43.345-49 39831 55.9 5.8 38.450-54 26035 61.0 5.2 33.855-59 23601 63.0 2.9 34.160-64 21099 66.3 5.4 28.265+ 41048 71.3 4.8 23.9 Male 298089 30.9 5.8 63.37-9 26441 17.4 23.3 59.310-14 43415 8.6 5.9 85.515-19 30499 12.9 1.3 85.820-24 27726 19.8 2.9 77.325-29 27456 25.6 3.0 71.430-34 19814 30.7 4.8 64.535-39 25021 40.0 5.4 54.640-44 21775 50.6 2.5 46.945-49 20625 46.6 5.6 47.950-54 13525 51.0 6.0 43.055-59 11226 53.0 1.8 45.260-64 10279 54.6 5.3 40.165+ 20287 60.3 5.0 34.7 Female 305054 36.4 6.2 57.47-9 26035 19.5 22.1 58.410-14 39560 2.9 4.8 92.3

National Series: Socio-economic and Demographic Report Page 202
Table P07: Percentage of Literate Population Aged 7 Years and above by Age, Sex and Zila, 2011
Age Number Literacy
Cannot Read and Write Can Read Only Can Read and
Write 1 2 3 4 5
15-19 24412 6.6 2.2 91.120-24 30769 17.1 2.6 80.225-29 32054 24.5 4.6 70.930-34 27726 39.0 6.8 54.135-39 27658 42.3 5.6 52.140-44 21166 55.0 5.4 39.645-49 19205 65.8 6.0 28.250-54 12511 71.9 4.3 23.855-59 12375 72.1 3.8 24.060-64 10820 77.5 5.6 16.965+ 20761 82.1 4.6 13.4Satkhira Total 1778711 34.5 10.0 55.67-9 140656 21.8 38.3 39.910-14 213133 5.6 12.1 82.315-19 178555 8.6 3.3 88.120-24 185197 14.3 7.7 78.025-29 184220 24.1 8.3 67.730-34 154721 35.7 8.0 56.335-39 156089 50.1 6.6 43.340-44 128349 54.0 9.6 36.445-49 116823 57.2 7.7 35.150-54 88301 59.3 6.0 34.755-59 61146 62.6 7.0 30.460-64 65444 67.2 6.3 26.665+ 106078 75.1 4.8 20.1 Male 898244 29.3 10.7 60.17-9 70328 22.8 40.8 36.410-14 110376 7.4 14.0 78.615-19 98850 9.5 3.8 86.820-24 88496 11.9 8.4 79.725-29 86347 20.8 8.1 71.030-34 73649 30.0 8.2 61.835-39 75798 41.8 6.7 51.540-44 67984 45.1 9.5 45.445-49 62123 50.6 6.9 42.550-54 48448 47.2 7.3 45.655-59 29499 47.0 6.6 46.460-64 30085 48.7 7.1 44.265+ 56262 59.4 6.9 33.7

National Series: Socio-economic and Demographic Report Page 203
Table P07: Percentage of Literate Population Aged 7 Years and above by Age, Sex and Zila, 2011
Age Number Literacy
Cannot Read and Write Can Read Only Can Read and
Write 1 2 3 4 5
Female 880467 39.8 9.3 50.97-9 70328 20.8 35.8 43.310-14 102757 3.6 10.1 86.315-19 79705 7.6 2.7 89.720-24 96701 16.6 7.1 76.425-29 97873 26.9 8.4 64.730-34 81072 41.0 7.7 51.335-39 80291 57.9 6.6 35.540-44 60365 64.1 9.7 26.245-49 54700 64.6 8.6 26.850-54 39853 74.0 4.4 21.655-59 31648 77.2 7.4 15.460-64 35359 82.9 5.5 11.665+ 49816 92.9 2.4 4.7 Bogra Total 2919688 37.7 6.5 55.87-9 224896 27.4 33.0 39.710-14 349398 9.3 11.6 79.115-19 270954 12.4 3.7 83.920-24 301180 20.9 3.2 75.925-29 333925 29.5 3.4 67.030-34 264837 39.5 3.3 57.235-39 238210 52.7 2.0 45.340-44 207264 55.6 2.6 41.845-49 186753 63.8 3.7 32.650-54 151490 60.1 3.1 36.855-59 105791 61.9 4.1 34.060-64 111908 64.0 3.9 32.265+ 173080 69.2 2.3 28.5 Male 1457325 34.2 6.2 59.67-9 111548 27.4 28.7 43.910-14 178837 11.3 14.5 74.215-19 139255 15.8 3.9 80.420-24 141055 18.1 3.3 78.625-29 154368 27.3 2.8 69.930-34 137096 36.5 3.7 59.835-39 110109 49.7 0.3 50.040-44 111908 46.0 2.9 51.145-49 93197 55.2 3.1 41.7

National Series: Socio-economic and Demographic Report Page 204
Table P07: Percentage of Literate Population Aged 7 Years and above by Age, Sex and Zila, 2011
Age Number Literacy
Cannot Read and Write Can Read Only Can Read and
Write 1 2 3 4 5
50-54 79523 50.2 2.3 47.555-59 48577 50.4 2.2 47.460-64 57213 52.2 3.8 44.065+ 94636 58.9 2.3 38.8 Female 1462363 41.3 6.7 52.07-9 113347 27.3 37.1 35.610-14 170561 7.2 8.6 84.215-19 131699 8.7 3.6 87.720-24 160126 23.4 3.1 73.525-29 179557 31.5 4.0 64.530-34 127741 42.8 2.8 54.435-39 128101 55.3 3.4 41.340-44 95356 66.8 2.3 30.945-49 93557 72.3 4.2 23.550-54 71967 71.0 4.0 25.055-59 57213 71.7 5.7 22.660-64 54695 76.3 3.9 19.765+ 78444 81.7 2.3 16.1 Joypurhat Total 773574 33.0 5.7 61.27-9 51323 19.6 23.2 57.210-14 79858 6.4 5.7 87.915-19 70985 8.2 1.6 90.220-24 74211 11.0 3.3 85.725-29 87521 22.7 4.1 73.230-34 72800 33.0 6.1 60.935-39 73304 44.3 6.3 49.440-44 64128 48.7 3.8 47.545-49 48600 46.9 7.5 45.650-54 44971 59.4 4.5 36.155-59 29745 56.9 3.7 39.360-64 27628 67.2 2.9 29.965+ 48500 69.0 3.7 27.2 Male 386182 29.0 5.6 65.47-9 25208 20.4 23.2 56.410-14 41341 7.1 6.3 86.615-19 39324 10.3 1.8 87.920-24 32165 10.0 4.1 85.925-29 40635 22.1 2.7 75.2

National Series: Socio-economic and Demographic Report Page 205
Table P07: Percentage of Literate Population Aged 7 Years and above by Age, Sex and Zila, 2011
Age Number Literacy
Cannot Read and Write Can Read Only Can Read and
Write 1 2 3 4 5
30-34 32871 29.1 6.7 64.135-39 37307 38.6 4.9 56.540-44 35896 44.9 2.8 52.245-49 24603 38.1 7.8 54.150-54 22485 49.8 3.6 46.655-59 15931 39.2 4.4 56.360-64 13310 55.3 1.5 43.265+ 25107 53.4 4.8 41.8 Female 387392 37.0 5.9 57.17-9 26115 18.9 23.2 57.910-14 38517 5.8 5.0 89.315-19 31661 5.7 1.3 93.020-24 42046 11.8 2.6 85.625-29 46886 23.2 5.4 71.430-34 39929 36.1 5.6 58.335-39 35997 50.1 7.8 42.040-44 28233 53.6 5.0 41.445-49 23998 55.9 7.1 37.050-54 22485 69.1 5.4 25.655-59 13814 77.4 2.9 19.760-64 14318 78.2 4.2 17.665+ 23393 85.8 2.6 11.6 Naogaon Total 2200818 39.0 7.6 53.47-9 165477 23.2 31.8 45.010-14 247807 9.8 10.8 79.415-19 211276 11.1 3.7 85.220-24 231450 20.8 5.4 73.725-29 244808 33.3 6.0 60.730-34 187014 42.9 6.9 50.335-39 202280 53.0 5.4 41.640-44 170657 60.5 4.6 34.845-49 139579 56.3 5.5 38.350-54 110954 59.7 4.9 35.455-59 69789 59.8 4.7 35.560-64 79876 71.7 2.0 26.365+ 139851 77.0 2.3 20.7 Male 1095093 35.9 7.7 56.47-9 79603 24.3 33.2 42.5

National Series: Socio-economic and Demographic Report Page 206
Table P07: Percentage of Literate Population Aged 7 Years and above by Age, Sex and Zila, 2011
Age Number Literacy
Cannot Read and Write Can Read Only Can Read and
Write 1 2 3 4 5
10-14 130310 12.8 11.3 75.915-19 111499 11.0 5.6 83.420-24 107138 20.1 5.6 74.325-29 110954 32.4 5.2 62.430-34 88327 42.3 5.2 52.535-39 89963 46.7 5.5 47.940-44 91326 57.6 3.9 38.545-49 73879 50.9 4.1 45.050-54 65973 52.1 5.4 42.655-59 32169 43.2 5.1 51.760-64 42255 58.1 2.6 39.465+ 71698 63.1 3.8 33.1 Female 1105725 42.0 7.5 50.57-9 85874 22.2 30.5 47.310-14 117497 6.5 10.2 83.315-19 99777 11.2 1.6 87.220-24 124312 21.5 5.3 73.225-29 133854 34.0 6.7 59.330-34 98686 43.4 8.3 48.335-39 112317 58.0 5.3 36.740-44 79331 63.9 5.5 30.645-49 65700 62.2 7.1 30.750-54 44981 70.9 4.2 24.855-59 37621 73.9 4.3 21.760-64 37621 87.0 1.4 11.665+ 68154 91.6 0.8 7.6Natore Total 1470179 35.6 5.6 58.87-9 109431 20.9 22.9 56.210-14 171107 7.4 5.4 87.215-19 154719 9.5 2.7 87.820-24 156481 21.5 3.0 75.525-29 165292 30.1 4.2 65.830-34 125114 38.6 4.6 56.835-39 128638 49.3 5.6 45.140-44 113836 53.1 3.9 43.045-49 90223 57.4 3.7 38.950-54 74892 58.8 5.4 35.855-59 53041 65.4 5.3 29.260-64 46345 60.1 3.8 36.1

National Series: Socio-economic and Demographic Report Page 207
Table P07: Percentage of Literate Population Aged 7 Years and above by Age, Sex and Zila, 2011
Age Number Literacy
Cannot Read and Write Can Read Only Can Read and
Write 1 2 3 4 5
65+ 81060 73.0 3.5 23.5 Male 742931 32.4 5.3 62.47-9 56918 22.3 21.1 56.710-14 88109 8.4 5.6 86.015-19 81941 8.6 3.4 88.020-24 72073 20.3 3.4 76.325-29 78240 29.3 3.4 67.330-34 62557 35.8 3.9 60.335-39 60090 44.9 4.4 50.740-44 54627 48.1 2.9 49.045-49 48460 51.3 2.5 46.250-54 44230 50.6 5.2 44.255-59 26256 54.4 4.7 40.960-64 28019 46.5 4.4 49.165+ 41411 61.7 3.8 34.5 Female 727248 38.9 5.9 55.17-9 52513 19.5 24.8 55.710-14 82998 6.4 5.1 88.515-19 72778 10.4 1.9 87.720-24 84408 22.5 2.7 74.725-29 87051 30.8 4.9 64.430-34 62557 41.4 5.4 53.235-39 68548 53.2 6.7 40.140-44 59209 57.7 4.8 37.545-49 41763 64.6 5.1 30.450-54 30662 70.7 5.7 23.655-59 26785 76.3 5.9 17.860-64 18327 80.8 2.9 16.365+ 39649 84.9 3.1 12.0 Chapai Nawabganj Total 1355302 43.4 9.3 47.47-9 112979 44.9 27.8 27.310-14 194848 16.1 14.4 69.415-19 159570 15.4 7.6 77.020-24 128311 23.0 7.9 69.125-29 153616 37.1 8.3 54.630-34 109555 51.4 6.9 41.735-39 115510 62.1 5.3 32.640-44 98243 60.6 6.5 32.9

National Series: Socio-economic and Demographic Report Page 208
Table P07: Percentage of Literate Population Aged 7 Years and above by Age, Sex and Zila, 2011
Age Number Literacy
Cannot Read and Write Can Read Only Can Read and
Write 1 2 3 4 5
45-49 82167 67.9 3.8 28.350-54 53885 69.6 5.5 24.955-59 39297 74.2 2.3 23.560-64 36320 77.0 2.9 20.165+ 71003 79.5 4.2 16.4 Male 680702 44.4 9.1 46.57-9 58946 47.2 28.5 24.210-14 101666 21.1 15.2 63.715-19 83655 19.9 10.7 69.420-24 59392 27.1 5.8 67.225-29 65644 38.1 8.4 53.530-34 52991 55.1 3.1 41.935-39 51354 62.9 4.3 32.840-44 53587 61.4 5.3 33.345-49 47633 62.5 2.8 34.750-54 26793 57.8 5.6 36.755-59 21435 68.7 0.7 30.660-64 20244 67.6 5.1 27.265+ 37362 72.5 3.6 23.9 Female 674600 42.3 9.4 48.37-9 54033 42.4 27.0 30.610-14 93182 10.7 13.6 75.715-19 75915 10.4 4.3 85.320-24 68919 19.4 9.7 70.825-29 87972 36.4 8.3 55.330-34 56564 47.9 10.5 41.635-39 64155 61.5 6.0 32.540-44 44656 59.7 8.0 32.345-49 34534 75.4 5.2 19.450-54 27091 81.3 5.5 13.255-59 17862 80.8 4.2 15.060-64 16076 88.9 0.0 11.165+ 33641 87.2 4.9 8.0 Pabna Total 2150924 44.5 8.0 47.57-9 187464 33.9 33.5 32.610-14 271871 13.8 12.1 74.115-19 209302 17.8 5.7 76.420-24 217399 26.1 5.9 68.1

National Series: Socio-economic and Demographic Report Page 209
Table P07: Percentage of Literate Population Aged 7 Years and above by Age, Sex and Zila, 2011
Age Number Literacy
Cannot Read and Write Can Read Only Can Read and
Write 1 2 3 4 5
25-29 242918 37.5 7.0 55.630-34 190163 49.5 4.5 45.935-39 189181 60.7 3.5 35.840-44 147713 66.3 4.2 29.645-49 126366 66.2 3.3 30.550-54 97412 67.3 2.5 30.255-59 76556 76.0 1.9 22.160-64 73366 75.3 3.3 21.465+ 121213 83.0 3.0 14.0 Male 1089694 43.2 7.9 48.97-9 85880 36.0 30.9 33.110-14 145751 15.8 14.1 70.015-19 113362 21.0 8.0 71.020-24 100357 26.4 5.4 68.225-29 112135 40.7 5.5 53.830-34 94713 46.1 4.9 49.035-39 95449 56.6 3.1 40.440-44 81954 62.9 4.2 32.945-49 66741 59.6 2.9 37.550-54 56435 59.6 3.0 37.455-59 37296 71.1 0.7 28.360-64 39014 64.2 3.8 32.165+ 60607 76.9 2.8 20.2 Female 1061231 45.8 8.2 46.07-9 101584 32.1 35.7 32.110-14 126121 11.5 9.7 78.815-19 95940 14.1 3.1 82.920-24 117042 25.8 6.3 67.925-29 130783 34.7 8.3 57.030-34 95449 53.0 4.1 42.935-39 93732 64.9 3.9 31.240-44 65759 70.5 4.1 25.445-49 59625 73.7 3.7 22.650-54 40977 77.8 1.8 20.455-59 39259 80.6 3.1 16.360-64 34352 87.9 2.9 9.365+ 60607 89.1 3.2 7.7Rajshahi Total 2118748 34.6 7.7 57.7

National Series: Socio-economic and Demographic Report Page 210
Table P07: Percentage of Literate Population Aged 7 Years and above by Age, Sex and Zila, 2011
Age Number Literacy
Cannot Read and Write Can Read Only Can Read and
Write 1 2 3 4 5
7-9 145970 26.5 33.0 40.510-14 249601 7.2 12.1 80.815-19 211985 7.7 2.9 89.520-24 216296 12.4 5.7 81.925-29 234604 24.6 5.8 69.630-34 208879 39.0 5.8 55.235-39 195177 51.1 5.6 43.340-44 165069 53.0 5.2 41.845-49 142180 55.4 4.4 40.250-54 102077 57.9 4.8 37.355-59 71916 59.1 4.6 36.360-64 65516 62.1 4.9 32.965+ 109478 77.9 3.0 19.1 Male 1057404 32.1 7.7 60.27-9 73258 26.1 34.9 39.010-14 126787 9.3 13.8 76.915-19 111593 9.0 2.9 88.120-24 97936 14.6 4.3 81.025-29 103856 25.8 5.7 68.430-34 101180 34.8 4.1 61.135-39 97561 46.7 5.7 47.640-44 85920 45.6 3.7 50.645-49 76061 49.9 4.8 45.250-54 55497 50.5 4.8 44.655-59 38338 45.3 4.3 50.460-64 34000 45.8 4.9 49.365+ 55417 69.0 3.8 27.3 Female 1061344 37.0 7.7 55.37-9 72712 26.8 31.1 42.110-14 122813 5.0 10.3 84.815-19 100392 6.2 2.8 91.020-24 118359 10.5 6.9 82.725-29 130748 23.6 5.9 70.530-34 107700 42.9 7.4 49.735-39 97617 55.5 5.5 39.040-44 79149 61.0 6.7 32.245-49 66119 61.7 3.9 34.450-54 46580 66.7 4.8 28.555-59 33577 74.9 4.8 20.3

National Series: Socio-economic and Demographic Report Page 211
Table P07: Percentage of Literate Population Aged 7 Years and above by Age, Sex and Zila, 2011
Age Number Literacy
Cannot Read and Write Can Read Only Can Read and
Write 1 2 3 4 5
60-64 31517 79.8 4.9 15.265+ 54062 87.2 2.2 10.6 Sirajganj Total 2604466 43.2 7.9 48.97-9 255217 24.8 34.2 41.010-14 332169 10.9 10.2 78.915-19 241848 14.6 2.2 83.220-24 274233 30.3 5.0 64.725-29 284928 36.8 5.7 57.530-34 229666 51.9 5.7 42.435-39 207977 61.9 3.0 35.140-44 184505 66.2 4.3 29.545-49 145584 66.5 3.7 29.850-54 123004 72.9 2.4 24.655-59 83488 69.0 3.9 27.060-64 87647 76.9 4.7 18.365+ 154200 78.8 3.3 17.9 Male 1315603 39.1 8.1 52.97-9 128649 24.2 36.5 39.310-14 170244 13.4 11.5 75.015-19 136671 15.2 1.3 83.520-24 126866 26.9 4.0 69.125-29 139642 31.9 6.0 62.130-34 106960 43.6 6.1 50.335-39 98046 54.8 3.0 42.140-44 103691 59.6 4.6 35.845-49 72792 60.0 4.1 35.950-54 69524 66.7 2.1 31.255-59 43972 60.1 2.0 37.860-64 41298 67.6 2.9 29.565+ 77249 69.6 4.6 25.8 Female 1288863 47.5 7.7 44.97-9 126569 25.4 31.9 42.710-14 161925 8.3 8.8 82.915-19 105177 13.8 3.4 82.820-24 147367 33.3 5.8 60.925-29 145287 41.5 5.5 53.030-34 122706 59.1 5.3 35.635-39 109931 68.1 3.0 28.9

National Series: Socio-economic and Demographic Report Page 212
Table P07: Percentage of Literate Population Aged 7 Years and above by Age, Sex and Zila, 2011
Age Number Literacy
Cannot Read and Write Can Read Only Can Read and
Write 1 2 3 4 5
40-44 80814 74.6 4.0 21.345-49 72792 73.1 3.3 23.750-54 53480 81.1 2.8 16.155-59 39516 78.9 6.0 15.060-64 46349 85.3 6.4 8.365+ 76951 88.0 1.9 10.0 Dinajpur Total 2442898 38.0 8.2 53.87-9 198225 24.0 29.5 46.510-14 299270 9.2 8.1 82.615-19 238346 13.7 4.6 81.720-24 243398 20.1 6.6 73.325-29 279655 29.2 6.6 64.230-34 222892 44.4 8.1 47.535-39 214571 53.7 6.8 39.540-44 188715 56.5 6.9 36.545-49 160780 55.6 6.8 37.550-54 119173 65.6 4.7 29.755-59 84402 63.0 4.9 32.060-64 76675 72.5 1.9 25.665+ 116796 79.1 4.1 16.8 Male 1223232 35.0 8.5 56.57-9 96884 23.6 31.9 44.510-14 149486 10.3 8.0 81.715-19 124820 14.8 6.4 78.820-24 115310 19.1 7.5 73.525-29 131358 29.0 7.5 63.630-34 104908 39.7 8.2 52.135-39 106097 51.3 4.8 44.040-44 107880 54.0 6.6 39.445-49 77864 46.2 7.3 46.650-54 66570 56.3 4.0 39.755-59 43390 47.9 6.2 45.960-64 38337 54.3 1.6 44.265+ 60329 70.0 3.9 26.1 Female 1219666 41.0 8.0 51.07-9 101342 24.3 27.3 48.410-14 149784 8.1 8.3 83.515-19 113526 12.6 2.6 84.8
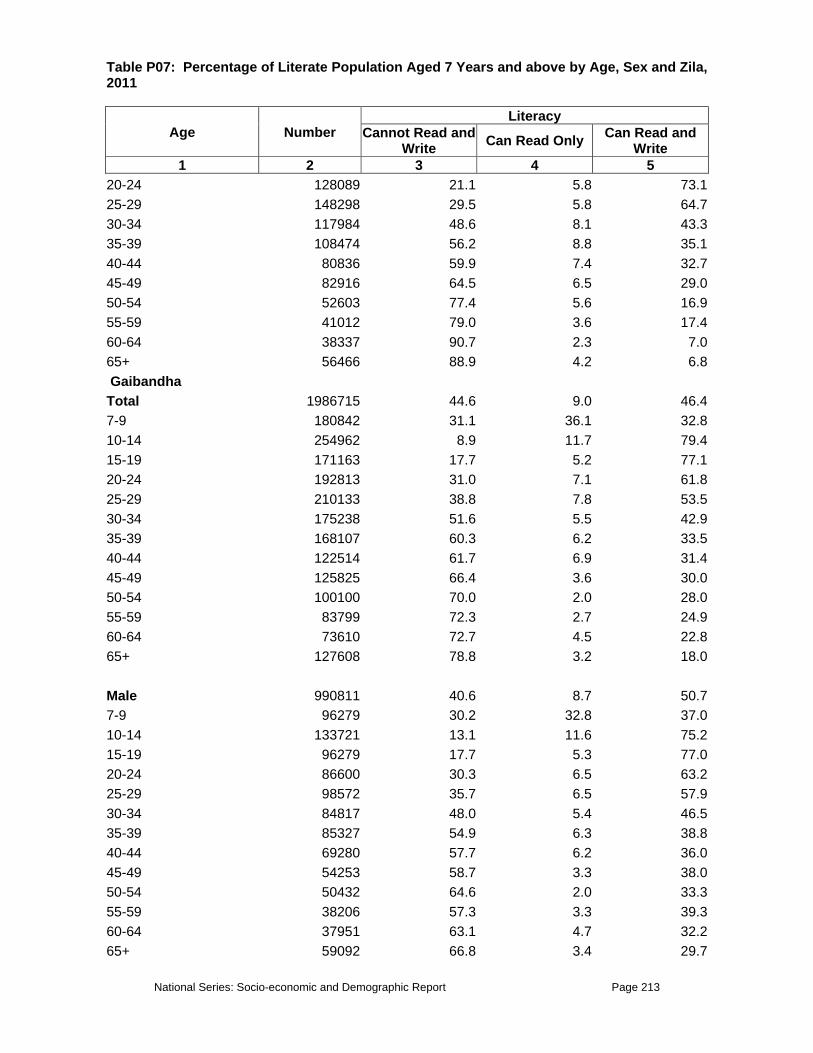
National Series: Socio-economic and Demographic Report Page 213
Table P07: Percentage of Literate Population Aged 7 Years and above by Age, Sex and Zila, 2011
Age Number Literacy
Cannot Read and Write Can Read Only Can Read and
Write 1 2 3 4 5
20-24 128089 21.1 5.8 73.125-29 148298 29.5 5.8 64.730-34 117984 48.6 8.1 43.335-39 108474 56.2 8.8 35.140-44 80836 59.9 7.4 32.745-49 82916 64.5 6.5 29.050-54 52603 77.4 5.6 16.955-59 41012 79.0 3.6 17.460-64 38337 90.7 2.3 7.065+ 56466 88.9 4.2 6.8 Gaibandha Total 1986715 44.6 9.0 46.47-9 180842 31.1 36.1 32.810-14 254962 8.9 11.7 79.415-19 171163 17.7 5.2 77.120-24 192813 31.0 7.1 61.825-29 210133 38.8 7.8 53.530-34 175238 51.6 5.5 42.935-39 168107 60.3 6.2 33.540-44 122514 61.7 6.9 31.445-49 125825 66.4 3.6 30.050-54 100100 70.0 2.0 28.055-59 83799 72.3 2.7 24.960-64 73610 72.7 4.5 22.865+ 127608 78.8 3.2 18.0 Male 990811 40.6 8.7 50.77-9 96279 30.2 32.8 37.010-14 133721 13.1 11.6 75.215-19 96279 17.7 5.3 77.020-24 86600 30.3 6.5 63.225-29 98572 35.7 6.5 57.930-34 84817 48.0 5.4 46.535-39 85327 54.9 6.3 38.840-44 69280 57.7 6.2 36.045-49 54253 58.7 3.3 38.050-54 50432 64.6 2.0 33.355-59 38206 57.3 3.3 39.360-64 37951 63.1 4.7 32.265+ 59092 66.8 3.4 29.7
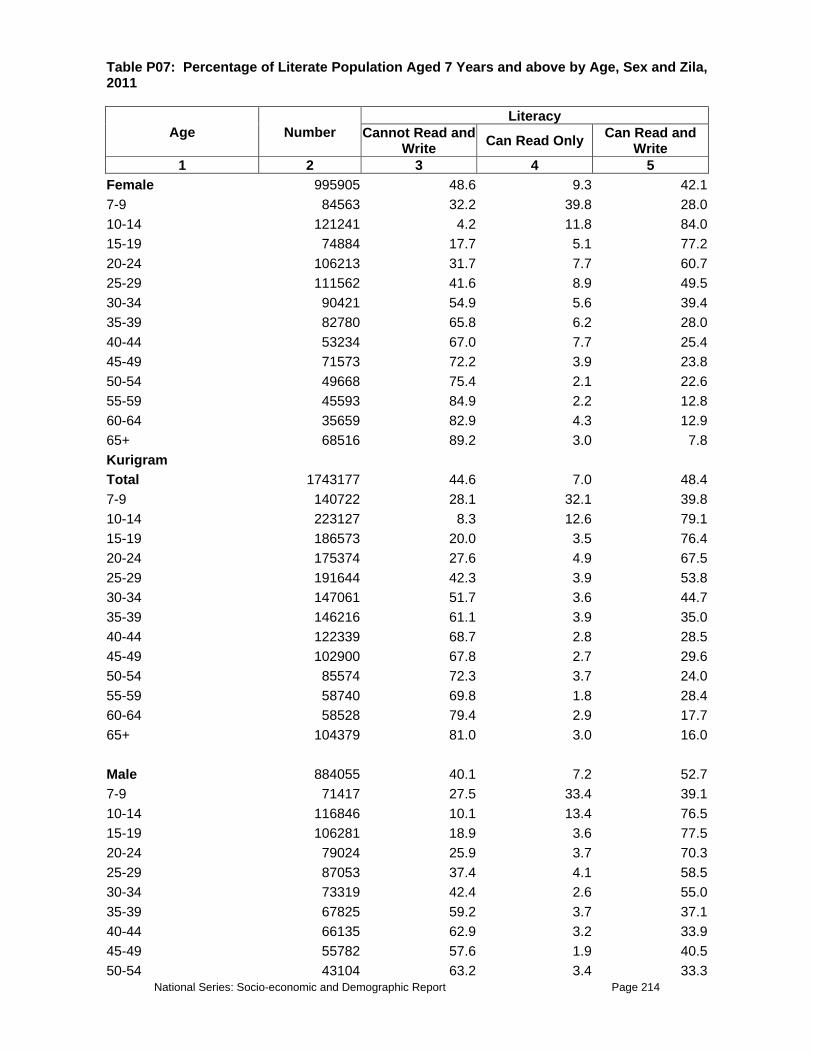
National Series: Socio-economic and Demographic Report Page 214
Table P07: Percentage of Literate Population Aged 7 Years and above by Age, Sex and Zila, 2011
Age Number Literacy
Cannot Read and Write Can Read Only Can Read and
Write 1 2 3 4 5
Female 995905 48.6 9.3 42.17-9 84563 32.2 39.8 28.010-14 121241 4.2 11.8 84.015-19 74884 17.7 5.1 77.220-24 106213 31.7 7.7 60.725-29 111562 41.6 8.9 49.530-34 90421 54.9 5.6 39.435-39 82780 65.8 6.2 28.040-44 53234 67.0 7.7 25.445-49 71573 72.2 3.9 23.850-54 49668 75.4 2.1 22.655-59 45593 84.9 2.2 12.860-64 35659 82.9 4.3 12.965+ 68516 89.2 3.0 7.8Kurigram Total 1743177 44.6 7.0 48.47-9 140722 28.1 32.1 39.810-14 223127 8.3 12.6 79.115-19 186573 20.0 3.5 76.420-24 175374 27.6 4.9 67.525-29 191644 42.3 3.9 53.830-34 147061 51.7 3.6 44.735-39 146216 61.1 3.9 35.040-44 122339 68.7 2.8 28.545-49 102900 67.8 2.7 29.650-54 85574 72.3 3.7 24.055-59 58740 69.8 1.8 28.460-64 58528 79.4 2.9 17.765+ 104379 81.0 3.0 16.0 Male 884055 40.1 7.2 52.77-9 71417 27.5 33.4 39.110-14 116846 10.1 13.4 76.515-19 106281 18.9 3.6 77.520-24 79024 25.9 3.7 70.325-29 87053 37.4 4.1 58.530-34 73319 42.4 2.6 55.035-39 67825 59.2 3.7 37.140-44 66135 62.9 3.2 33.945-49 55782 57.6 1.9 40.550-54 43104 63.2 3.4 33.3

National Series: Socio-economic and Demographic Report Page 215
Table P07: Percentage of Literate Population Aged 7 Years and above by Age, Sex and Zila, 2011
Age Number Literacy
Cannot Read and Write Can Read Only Can Read and
Write 1 2 3 4 5
55-59 30426 56.9 2.1 41.060-64 27680 68.7 4.6 26.765+ 59162 70.0 4.6 25.4 Female 859122 49.3 6.8 43.97-9 69304 28.7 30.8 40.510-14 106281 6.4 11.7 81.915-19 80292 21.6 3.4 75.020-24 96350 28.9 5.9 65.125-29 104591 46.5 3.6 49.930-34 73742 61.0 4.6 34.435-39 78390 62.8 4.0 33.240-44 56204 75.6 2.3 22.245-49 47119 79.8 3.6 16.650-54 42470 81.6 4.0 14.455-59 28313 83.6 1.5 14.960-64 30849 89.0 1.4 9.665+ 45217 95.3 0.9 3.7 Lalmonirhat Total 999975 38.5 8.9 52.67-9 98946 25.2 38.0 36.910-14 125284 8.2 10.7 81.115-19 93751 12.0 3.7 84.320-24 98946 24.1 4.9 71.125-29 110907 32.2 5.7 62.130-34 92423 43.9 5.5 50.635-39 82637 55.4 4.7 39.940-44 69468 58.3 6.6 35.145-49 61736 63.0 4.1 32.950-54 49654 63.7 5.4 30.955-59 38660 65.3 3.4 31.260-64 33707 71.3 3.6 25.165+ 43855 73.3 4.7 22.0 Male 506451 33.7 9.1 57.27-9 52312 27.5 35.8 36.710-14 67293 9.3 11.5 79.215-19 53520 12.2 3.8 84.020-24 42285 21.7 5.4 72.925-29 52796 31.8 4.6 63.630-34 44943 38.7 6.2 55.1

National Series: Socio-economic and Demographic Report Page 216
Table P07: Percentage of Literate Population Aged 7 Years and above by Age, Sex and Zila, 2011
Age Number Literacy
Cannot Read and Write Can Read Only Can Read and
Write 1 2 3 4 5
35-39 41802 46.2 4.6 49.140-44 34553 48.6 7.0 44.445-49 31412 56.5 4.2 39.250-54 25733 50.2 5.6 44.155-59 19089 51.9 4.4 43.760-64 18968 56.1 3.2 40.865+ 21746 59.4 6.1 34.4 Female 493524 43.4 8.7 47.97-9 46634 22.5 40.4 37.010-14 57991 6.9 9.8 83.315-19 40231 11.7 3.6 84.720-24 56662 25.8 4.5 69.725-29 58111 32.6 6.7 60.730-34 47480 48.9 4.8 46.335-39 40835 64.8 4.7 30.540-44 34915 67.8 6.2 26.045-49 30324 69.7 4.0 26.350-54 23921 78.3 5.1 16.755-59 19572 78.4 2.5 19.160-64 14739 91.0 4.1 4.965+ 22109 86.9 3.3 9.8Nilphamari Total 1516314 41.8 8.9 49.37-9 145914 24.4 45.0 30.610-14 208699 9.1 13.3 77.615-19 157664 15.9 2.4 81.620-24 152578 23.3 5.3 71.425-29 170467 39.3 4.3 56.430-34 141705 54.6 3.2 42.235-39 136794 63.3 3.5 33.240-44 97510 67.8 2.9 29.345-49 84883 68.8 3.1 28.150-54 63311 72.9 1.9 25.255-59 46475 68.3 5.7 26.060-64 47703 76.5 4.0 19.565+ 62610 77.6 2.8 19.6 Male 774292 37.1 9.4 53.57-9 73483 25.1 45.1 29.810-14 115048 10.5 14.9 74.5

National Series: Socio-economic and Demographic Report Page 217
Table P07: Percentage of Literate Population Aged 7 Years and above by Age, Sex and Zila, 2011
Age Number Literacy
Cannot Read and Write Can Read Only Can Read and
Write 1 2 3 4 5
15-19 86286 17.7 2.6 79.720-24 69449 23.7 4.8 71.525-29 78043 32.6 4.3 63.130-34 72782 48.0 2.9 49.235-39 70853 55.4 4.2 40.340-44 55244 61.6 2.9 35.645-49 40512 57.6 4.3 38.150-54 33146 60.3 2.1 37.655-59 23150 53.0 7.6 39.460-64 24202 64.5 5.1 30.465+ 32094 63.4 3.3 33.3 Female 742022 46.7 8.4 44.97-9 72431 23.7 44.8 31.510-14 93652 7.3 11.2 81.515-19 71379 13.8 2.2 84.020-24 83129 23.0 5.7 71.325-29 92424 45.0 4.4 50.730-34 68923 61.6 3.6 34.935-39 65942 71.8 2.7 25.540-44 42266 75.9 2.9 21.245-49 44371 79.1 2.0 19.050-54 30165 86.6 1.7 11.655-59 23325 83.5 3.8 12.860-64 23501 88.8 3.0 8.265+ 30516 92.5 2.3 5.2Panchagarh Total 827624 36.9 8.9 54.27-9 71178 23.9 32.0 44.110-14 112707 5.9 14.0 80.115-19 91800 9.5 4.3 86.120-24 91135 21.2 6.5 72.425-29 99877 33.4 6.6 60.030-34 74409 49.4 5.4 45.235-39 70608 58.7 4.8 36.540-44 55308 58.8 6.0 35.245-49 47991 63.4 5.3 31.350-54 34591 62.6 4.9 32.455-59 25658 65.9 3.0 31.160-64 19291 73.9 6.4 19.765+ 33071 79.3 4.3 16.4
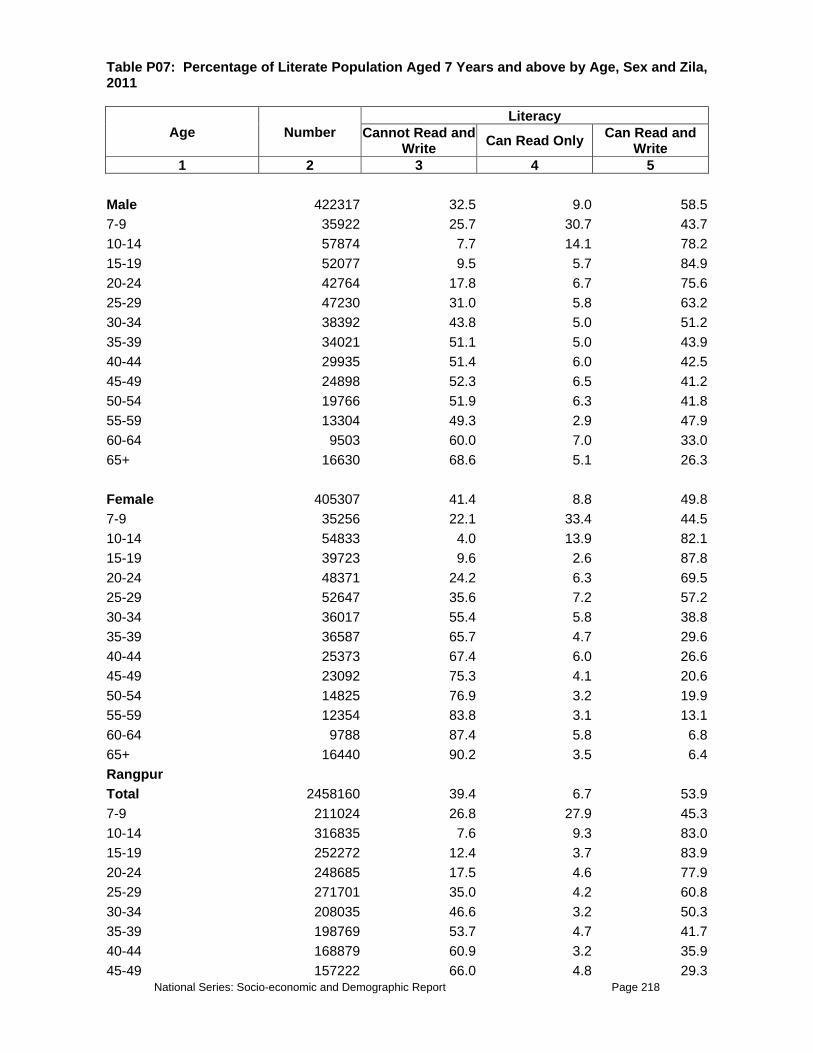
National Series: Socio-economic and Demographic Report Page 218
Table P07: Percentage of Literate Population Aged 7 Years and above by Age, Sex and Zila, 2011
Age Number Literacy
Cannot Read and Write Can Read Only Can Read and
Write 1 2 3 4 5
Male 422317 32.5 9.0 58.57-9 35922 25.7 30.7 43.710-14 57874 7.7 14.1 78.215-19 52077 9.5 5.7 84.920-24 42764 17.8 6.7 75.625-29 47230 31.0 5.8 63.230-34 38392 43.8 5.0 51.235-39 34021 51.1 5.0 43.940-44 29935 51.4 6.0 42.545-49 24898 52.3 6.5 41.250-54 19766 51.9 6.3 41.855-59 13304 49.3 2.9 47.960-64 9503 60.0 7.0 33.065+ 16630 68.6 5.1 26.3 Female 405307 41.4 8.8 49.87-9 35256 22.1 33.4 44.510-14 54833 4.0 13.9 82.115-19 39723 9.6 2.6 87.820-24 48371 24.2 6.3 69.525-29 52647 35.6 7.2 57.230-34 36017 55.4 5.8 38.835-39 36587 65.7 4.7 29.640-44 25373 67.4 6.0 26.645-49 23092 75.3 4.1 20.650-54 14825 76.9 3.2 19.955-59 12354 83.8 3.1 13.160-64 9788 87.4 5.8 6.865+ 16440 90.2 3.5 6.4Rangpur Total 2458160 39.4 6.7 53.97-9 211024 26.8 27.9 45.310-14 316835 7.6 9.3 83.015-19 252272 12.4 3.7 83.920-24 248685 17.5 4.6 77.925-29 271701 35.0 4.2 60.830-34 208035 46.6 3.2 50.335-39 198769 53.7 4.7 41.740-44 168879 60.9 3.2 35.945-49 157222 66.0 4.8 29.3
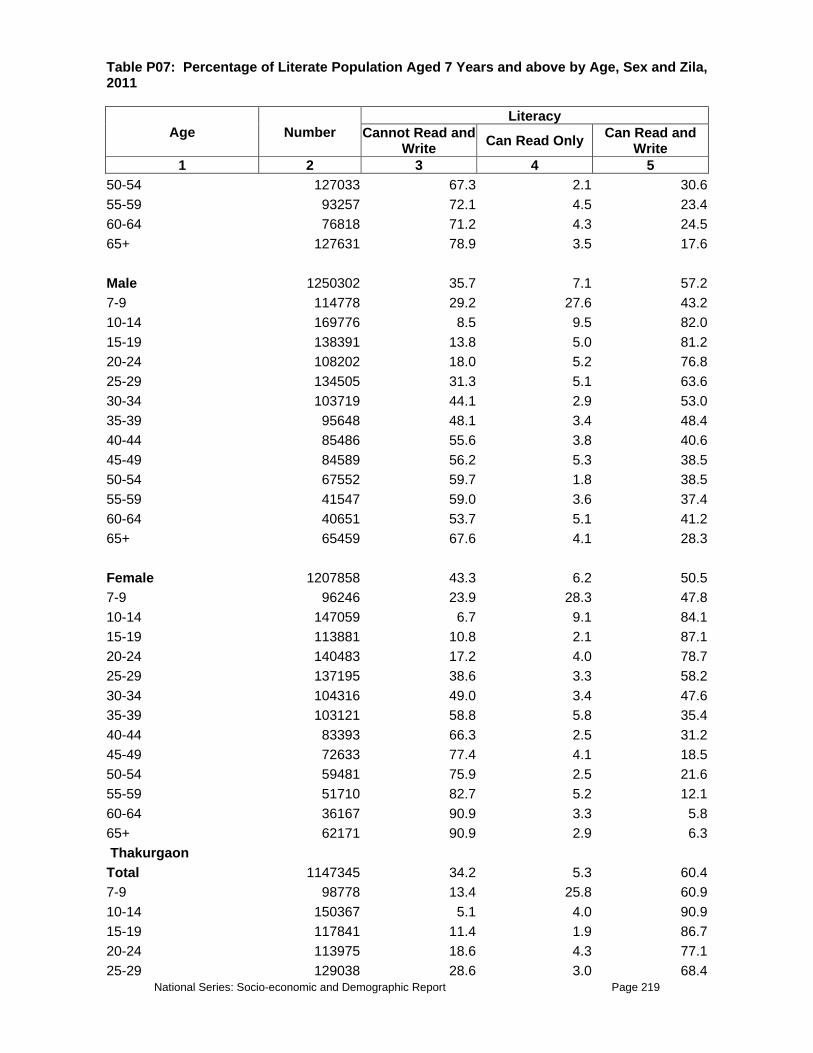
National Series: Socio-economic and Demographic Report Page 219
Table P07: Percentage of Literate Population Aged 7 Years and above by Age, Sex and Zila, 2011
Age Number Literacy
Cannot Read and Write Can Read Only Can Read and
Write 1 2 3 4 5
50-54 127033 67.3 2.1 30.655-59 93257 72.1 4.5 23.460-64 76818 71.2 4.3 24.565+ 127631 78.9 3.5 17.6 Male 1250302 35.7 7.1 57.27-9 114778 29.2 27.6 43.210-14 169776 8.5 9.5 82.015-19 138391 13.8 5.0 81.220-24 108202 18.0 5.2 76.825-29 134505 31.3 5.1 63.630-34 103719 44.1 2.9 53.035-39 95648 48.1 3.4 48.440-44 85486 55.6 3.8 40.645-49 84589 56.2 5.3 38.550-54 67552 59.7 1.8 38.555-59 41547 59.0 3.6 37.460-64 40651 53.7 5.1 41.265+ 65459 67.6 4.1 28.3 Female 1207858 43.3 6.2 50.57-9 96246 23.9 28.3 47.810-14 147059 6.7 9.1 84.115-19 113881 10.8 2.1 87.120-24 140483 17.2 4.0 78.725-29 137195 38.6 3.3 58.230-34 104316 49.0 3.4 47.635-39 103121 58.8 5.8 35.440-44 83393 66.3 2.5 31.245-49 72633 77.4 4.1 18.550-54 59481 75.9 2.5 21.655-59 51710 82.7 5.2 12.160-64 36167 90.9 3.3 5.865+ 62171 90.9 2.9 6.3 Thakurgaon Total 1147345 34.2 5.3 60.47-9 98778 13.4 25.8 60.910-14 150367 5.1 4.0 90.915-19 117841 11.4 1.9 86.720-24 113975 18.6 4.3 77.125-29 129038 28.6 3.0 68.4
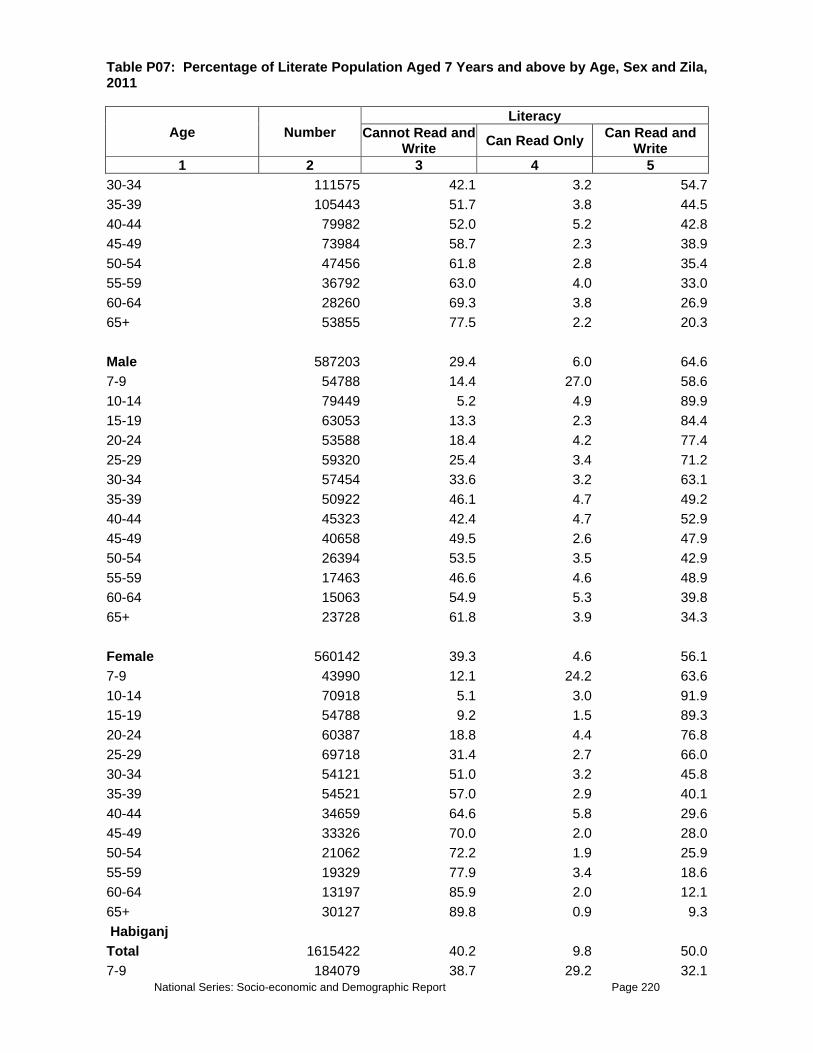
National Series: Socio-economic and Demographic Report Page 220
Table P07: Percentage of Literate Population Aged 7 Years and above by Age, Sex and Zila, 2011
Age Number Literacy
Cannot Read and Write Can Read Only Can Read and
Write 1 2 3 4 5
30-34 111575 42.1 3.2 54.735-39 105443 51.7 3.8 44.540-44 79982 52.0 5.2 42.845-49 73984 58.7 2.3 38.950-54 47456 61.8 2.8 35.455-59 36792 63.0 4.0 33.060-64 28260 69.3 3.8 26.965+ 53855 77.5 2.2 20.3 Male 587203 29.4 6.0 64.67-9 54788 14.4 27.0 58.610-14 79449 5.2 4.9 89.915-19 63053 13.3 2.3 84.420-24 53588 18.4 4.2 77.425-29 59320 25.4 3.4 71.230-34 57454 33.6 3.2 63.135-39 50922 46.1 4.7 49.240-44 45323 42.4 4.7 52.945-49 40658 49.5 2.6 47.950-54 26394 53.5 3.5 42.955-59 17463 46.6 4.6 48.960-64 15063 54.9 5.3 39.865+ 23728 61.8 3.9 34.3 Female 560142 39.3 4.6 56.17-9 43990 12.1 24.2 63.610-14 70918 5.1 3.0 91.915-19 54788 9.2 1.5 89.320-24 60387 18.8 4.4 76.825-29 69718 31.4 2.7 66.030-34 54121 51.0 3.2 45.835-39 54521 57.0 2.9 40.140-44 34659 64.6 5.8 29.645-49 33326 70.0 2.0 28.050-54 21062 72.2 1.9 25.955-59 19329 77.9 3.4 18.660-64 13197 85.9 2.0 12.165+ 30127 89.8 0.9 9.3 Habiganj Total 1615422 40.2 9.8 50.07-9 184079 38.7 29.2 32.1

National Series: Socio-economic and Demographic Report Page 221
Table P07: Percentage of Literate Population Aged 7 Years and above by Age, Sex and Zila, 2011
Age Number Literacy
Cannot Read and Write Can Read Only Can Read and
Write 1 2 3 4 5
10-14 242338 12.7 14.2 73.115-19 171840 15.5 7.8 76.720-24 149319 19.9 6.3 73.825-29 148993 31.9 7.2 60.930-34 122066 48.4 7.0 44.735-39 126799 52.3 6.6 41.240-44 107379 57.9 4.7 37.445-49 84369 58.6 6.8 34.650-54 76373 68.6 4.3 27.155-59 44551 67.8 3.7 28.660-64 56627 80.7 2.3 17.065+ 100688 78.4 2.6 19.0 Male 793758 36.7 10.4 52.87-9 92039 40.2 27.5 32.310-14 127778 13.7 16.0 70.415-19 92529 18.2 8.6 73.220-24 67561 17.9 7.7 74.425-29 65276 29.0 6.0 65.030-34 47325 37.6 9.0 53.435-39 60870 48.0 7.2 44.840-44 57117 49.4 6.3 44.345-49 40798 53.2 6.8 40.050-54 37534 57.0 5.7 37.455-59 21215 52.3 4.6 43.160-64 28885 71.2 2.8 26.065+ 54832 71.7 2.1 26.2 Female 821664 43.6 9.2 47.27-9 92039 37.2 30.9 31.910-14 114560 11.5 12.3 76.215-19 79311 12.3 6.8 80.920-24 81758 21.6 5.2 73.325-29 83717 34.1 8.2 57.730-34 74741 55.2 5.7 39.135-39 65929 56.2 5.9 37.940-44 50263 67.5 2.9 29.545-49 43572 63.7 6.7 29.650-54 38839 79.8 2.9 17.255-59 23336 81.8 2.8 15.460-64 27742 90.6 1.8 7.6

National Series: Socio-economic and Demographic Report Page 222
Table P07: Percentage of Literate Population Aged 7 Years and above by Age, Sex and Zila, 2011
Age Number Literacy
Cannot Read and Write Can Read Only Can Read and
Write 1 2 3 4 5
65+ 45857 86.5 3.2 10.3 Maulvibazar Total 1461492 38.2 8.8 53.07-9 141188 39.4 30.1 30.510-14 211482 14.0 12.7 73.415-19 177310 14.7 4.9 80.420-24 140289 23.9 6.0 70.125-29 142387 31.6 6.0 62.430-34 108514 41.4 5.2 53.335-39 110163 47.9 4.6 47.540-44 99221 52.6 8.0 39.445-49 81985 58.5 4.2 37.350-54 68046 61.7 5.3 33.055-59 39868 67.7 4.9 27.460-64 55306 71.5 6.0 22.565+ 85732 73.1 2.6 24.3 Male 713735 34.5 9.3 56.27-9 74341 44.0 28.8 27.210-14 110762 16.0 13.5 70.515-19 89329 13.9 6.5 79.520-24 65648 22.6 5.7 71.725-29 64899 28.4 6.9 64.730-34 44814 34.4 5.4 60.235-39 48412 39.3 5.3 55.440-44 47662 44.7 7.5 47.845-49 40768 52.2 3.3 44.550-54 35072 50.4 4.7 44.955-59 21283 59.9 3.5 36.660-64 27578 59.2 8.2 32.665+ 43166 60.4 3.8 35.8 Female 747758 41.8 8.2 49.97-9 66847 34.3 31.6 34.110-14 100720 11.8 11.8 76.515-19 87980 15.5 3.2 81.320-24 74641 25.1 6.2 68.725-29 77489 34.2 5.2 60.530-34 63700 46.4 5.2 48.535-39 61751 54.6 4.1 41.340-44 51559 59.9 8.4 31.7
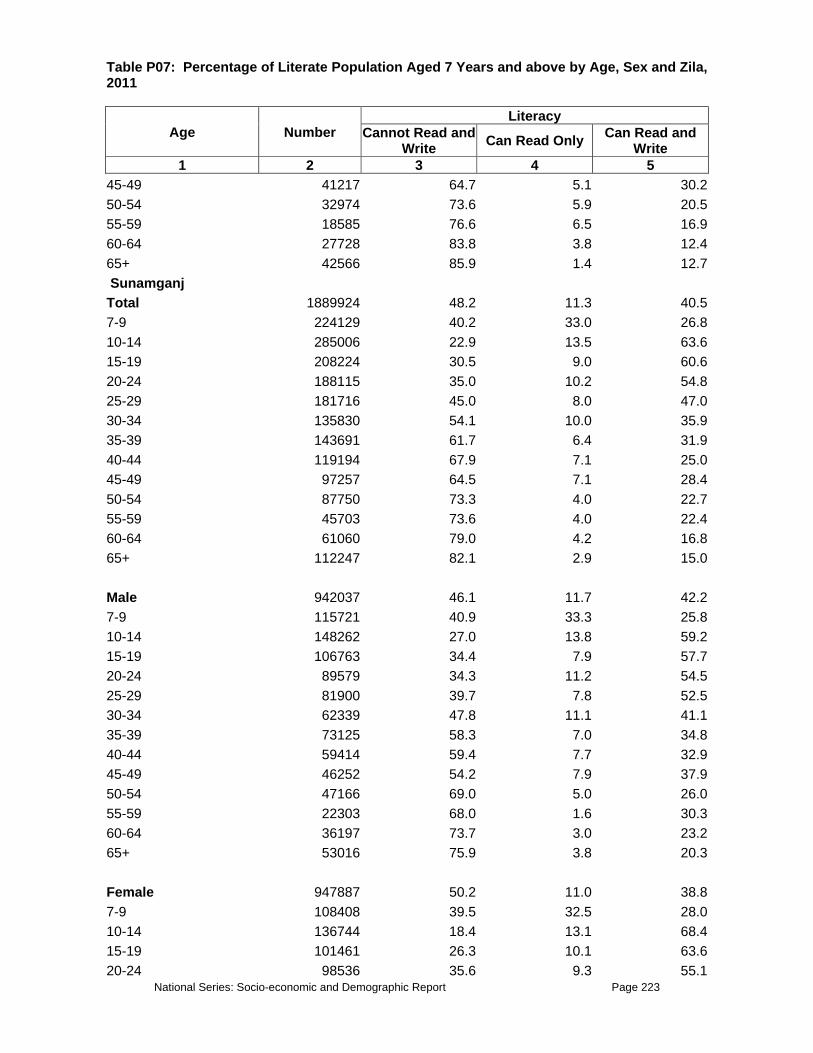
National Series: Socio-economic and Demographic Report Page 223
Table P07: Percentage of Literate Population Aged 7 Years and above by Age, Sex and Zila, 2011
Age Number Literacy
Cannot Read and Write Can Read Only Can Read and
Write 1 2 3 4 5
45-49 41217 64.7 5.1 30.250-54 32974 73.6 5.9 20.555-59 18585 76.6 6.5 16.960-64 27728 83.8 3.8 12.465+ 42566 85.9 1.4 12.7 Sunamganj Total 1889924 48.2 11.3 40.57-9 224129 40.2 33.0 26.810-14 285006 22.9 13.5 63.615-19 208224 30.5 9.0 60.620-24 188115 35.0 10.2 54.825-29 181716 45.0 8.0 47.030-34 135830 54.1 10.0 35.935-39 143691 61.7 6.4 31.940-44 119194 67.9 7.1 25.045-49 97257 64.5 7.1 28.450-54 87750 73.3 4.0 22.755-59 45703 73.6 4.0 22.460-64 61060 79.0 4.2 16.865+ 112247 82.1 2.9 15.0 Male 942037 46.1 11.7 42.27-9 115721 40.9 33.3 25.810-14 148262 27.0 13.8 59.215-19 106763 34.4 7.9 57.720-24 89579 34.3 11.2 54.525-29 81900 39.7 7.8 52.530-34 62339 47.8 11.1 41.135-39 73125 58.3 7.0 34.840-44 59414 59.4 7.7 32.945-49 46252 54.2 7.9 37.950-54 47166 69.0 5.0 26.055-59 22303 68.0 1.6 30.360-64 36197 73.7 3.0 23.265+ 53016 75.9 3.8 20.3 Female 947887 50.2 11.0 38.87-9 108408 39.5 32.5 28.010-14 136744 18.4 13.1 68.415-19 101461 26.3 10.1 63.620-24 98536 35.6 9.3 55.1

National Series: Socio-economic and Demographic Report Page 224
Table P07: Percentage of Literate Population Aged 7 Years and above by Age, Sex and Zila, 2011
Age Number Literacy
Cannot Read and Write Can Read Only Can Read and
Write 1 2 3 4 5
25-29 99816 49.3 8.2 42.530-34 73491 59.5 9.0 31.635-39 70566 65.3 5.7 29.040-44 59780 76.5 6.4 17.145-49 51005 73.8 6.5 19.750-54 40585 78.4 2.7 18.955-59 23400 78.9 6.2 14.860-64 24863 86.8 5.9 7.465+ 59232 87.7 2.2 10.2Sylhet Total 2560302 37.5 7.8 54.77-9 275618 39.1 28.2 32.710-14 395834 14.8 10.4 74.815-19 318857 16.6 4.5 78.920-24 261471 23.5 3.8 72.725-29 245932 29.9 4.4 65.830-34 200406 43.6 4.4 52.035-39 189835 48.7 5.1 46.240-44 154754 53.7 6.4 39.945-49 131716 58.3 4.3 37.450-54 112130 64.4 3.0 32.755-59 67261 61.0 3.7 35.460-64 80113 71.5 3.1 25.465+ 126373 76.5 2.4 21.1 Male 1265966 34.5 8.3 57.27-9 146015 38.6 29.2 32.210-14 207856 15.6 11.5 72.815-19 156511 18.8 3.9 77.320-24 126139 21.9 5.1 73.025-29 109725 26.7 3.5 69.830-34 93169 37.7 4.8 57.535-39 88985 42.0 4.8 53.240-44 80041 51.4 5.5 43.145-49 63326 50.5 2.9 46.650-54 54289 54.5 3.3 42.255-59 32811 48.9 4.3 46.960-64 42576 61.5 4.1 34.565+ 64524 68.5 3.1 28.4 Female 1294336 40.5 7.3 52.2
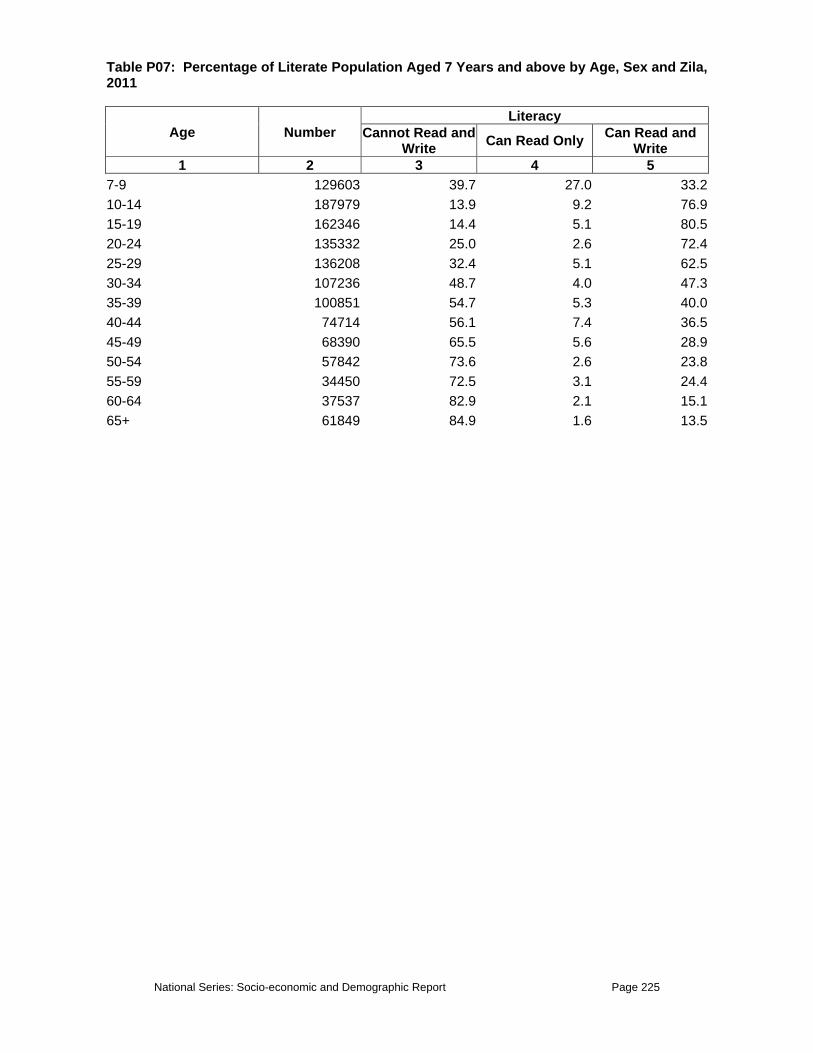
National Series: Socio-economic and Demographic Report Page 225
Table P07: Percentage of Literate Population Aged 7 Years and above by Age, Sex and Zila, 2011
Age Number Literacy
Cannot Read and Write Can Read Only Can Read and
Write 1 2 3 4 5
7-9 129603 39.7 27.0 33.210-14 187979 13.9 9.2 76.915-19 162346 14.4 5.1 80.520-24 135332 25.0 2.6 72.425-29 136208 32.4 5.1 62.530-34 107236 48.7 4.0 47.335-39 100851 54.7 5.3 40.040-44 74714 56.1 7.4 36.545-49 68390 65.5 5.6 28.950-54 57842 73.6 2.6 23.855-59 34450 72.5 3.1 24.460-64 37537 82.9 2.1 15.165+ 61849 84.9 1.6 13.5

National Series: Socio-economic and Demographic Report Page 226
Table P08: Occupation of Population Aged 15 Years and above by Age, Sex and Residence, 2011
Age Number
Occupation Managerial Professional Technicians and
Associate Professionals
Clerical Support Workers
Service and Sales Workers
Skilled Agricultural, Forestry and
Fishery Workers
Craft and Related Trade
Workers
Plant and Machine
Operators and Assemblers
Elementary Occupations
Other Occupations
1 2 3 4 5 6 7 8 9 10 11 12 Total 39924862 12.5 5.7 1.8 2.8 8.9 30.4 12.7 8.5 16.5 0.2 15-19 3153704 7.7 2.8 0.9 1.7 11.3 21.5 25.4 7.0 21.5 0.1 20-24 4381743 10.0 5.1 1.5 2.9 9.0 22.7 21.1 9.2 18.1 0.3 25-29 5946934 11.5 6.0 2.0 3.3 8.7 23.7 16.3 11.1 17.1 0.3 30-34 5164317 13.8 6.8 2.2 3.1 8.7 25.9 12.8 11.0 15.6 0.3 35-39 5079668 13.7 6.6 2.0 2.9 8.5 28.8 11.0 10.1 16.2 0.3 40-44 4456996 14.4 6.3 2.0 3.0 9.1 32.3 8.6 8.7 15.4 0.2 45-49 3677440 14.3 6.2 1.9 3.1 8.7 34.8 8.2 7.2 15.4 0.3 50-54 2920546 14.0 5.6 1.9 2.9 8.7 39.4 6.8 5.6 14.9 0.1 55-59 1812796 13.9 6.9 1.7 2.7 8.4 41.1 6.1 4.8 14.3 0.1 60-64 1618361 12.7 4.2 1.6 1.9 8.2 46.1 5.3 4.3 15.6 0 65+ 1712356 10.6 3.8 1.0 1.0 7.4 52.0 5.1 3.4 15.7 0 Male 34752440 13.6 4.8 1.8 2.6 7.9 33.0 11.0 9.3 15.8 0.2 15-19 2526540 9.1 1.7 0.9 1.7 10.2 24.8 21.9 7.7 21.8 0.1 20-24 3641450 11.3 3.7 1.5 2.7 8.9 25.5 18.1 10.2 17.8 0.4 25-29 5003615 12.7 4.5 1.9 3.0 8.3 26.0 14.2 12.4 16.7 0.3 30-34 4462428 14.8 5.3 2.2 2.9 7.9 27.8 11.4 12.3 15.2 0.3 35-39 4391835 14.9 5.3 2.0 2.7 7.3 31.1 9.5 11.3 15.6 0.4 40-44 3984371 15.5 5.4 2.0 2.6 7.9 34.1 8.0 9.5 14.7 0.3 45-49 3318248 15.3 5.6 1.9 2.9 7.4 36.8 7.5 7.8 14.4 0.3 50-54 2660934 14.7 5.2 1.9 2.9 7.3 41.5 6.4 6.1 13.9 0.2 55-59 1668122 14.8 6.7 1.6 2.8 7.0 42.8 5.8 5.0 13.5 0.1 60-64 1503349 13.1 4.4 1.5 2.0 6.6 48.1 4.9 4.7 14.8 0
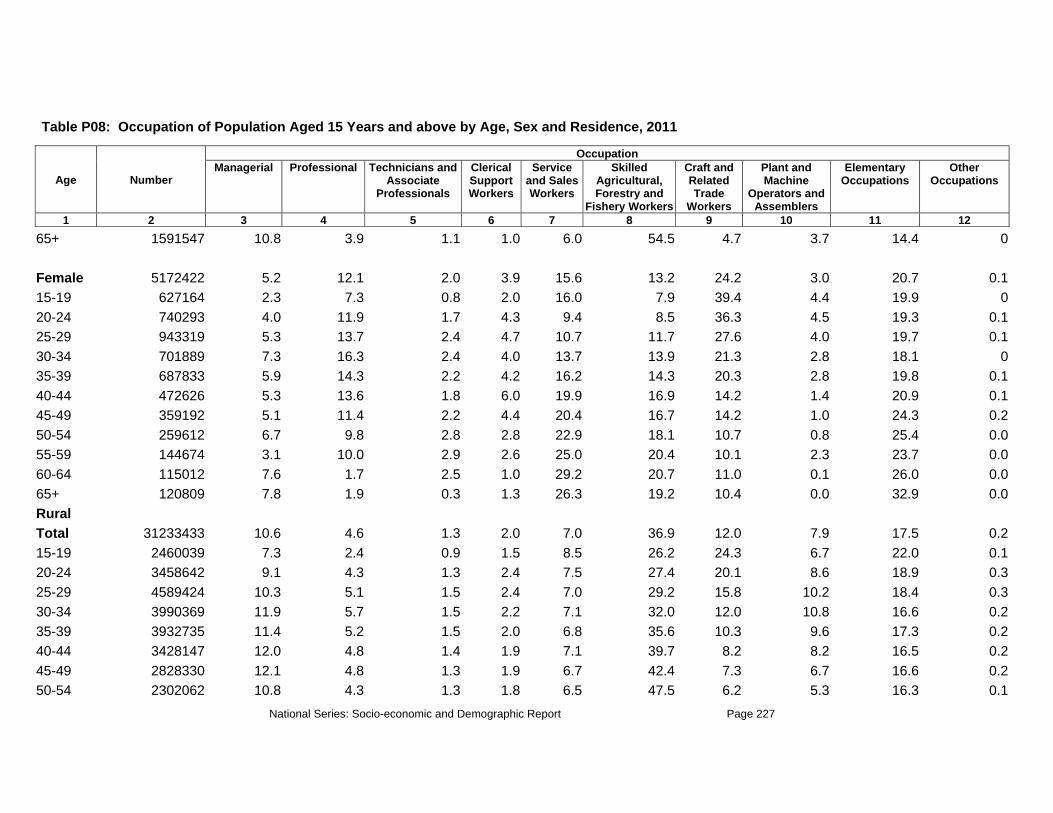
National Series: Socio-economic and Demographic Report Page 227
Table P08: Occupation of Population Aged 15 Years and above by Age, Sex and Residence, 2011
Age Number
Occupation Managerial Professional Technicians and
Associate Professionals
Clerical Support Workers
Service and Sales Workers
Skilled Agricultural, Forestry and
Fishery Workers
Craft and Related Trade
Workers
Plant and Machine
Operators and Assemblers
Elementary Occupations
Other Occupations
1 2 3 4 5 6 7 8 9 10 11 12 65+ 1591547 10.8 3.9 1.1 1.0 6.0 54.5 4.7 3.7 14.4 0 Female 5172422 5.2 12.1 2.0 3.9 15.6 13.2 24.2 3.0 20.7 0.1 15-19 627164 2.3 7.3 0.8 2.0 16.0 7.9 39.4 4.4 19.9 0 20-24 740293 4.0 11.9 1.7 4.3 9.4 8.5 36.3 4.5 19.3 0.1 25-29 943319 5.3 13.7 2.4 4.7 10.7 11.7 27.6 4.0 19.7 0.1 30-34 701889 7.3 16.3 2.4 4.0 13.7 13.9 21.3 2.8 18.1 0 35-39 687833 5.9 14.3 2.2 4.2 16.2 14.3 20.3 2.8 19.8 0.1 40-44 472626 5.3 13.6 1.8 6.0 19.9 16.9 14.2 1.4 20.9 0.1 45-49 359192 5.1 11.4 2.2 4.4 20.4 16.7 14.2 1.0 24.3 0.2 50-54 259612 6.7 9.8 2.8 2.8 22.9 18.1 10.7 0.8 25.4 0.0 55-59 144674 3.1 10.0 2.9 2.6 25.0 20.4 10.1 2.3 23.7 0.0 60-64 115012 7.6 1.7 2.5 1.0 29.2 20.7 11.0 0.1 26.0 0.0 65+ 120809 7.8 1.9 0.3 1.3 26.3 19.2 10.4 0.0 32.9 0.0 Rural Total 31233433 10.6 4.6 1.3 2.0 7.0 36.9 12.0 7.9 17.5 0.2 15-19 2460039 7.3 2.4 0.9 1.5 8.5 26.2 24.3 6.7 22.0 0.1 20-24 3458642 9.1 4.3 1.3 2.4 7.5 27.4 20.1 8.6 18.9 0.3 25-29 4589424 10.3 5.1 1.5 2.4 7.0 29.2 15.8 10.2 18.4 0.3 30-34 3990369 11.9 5.7 1.5 2.2 7.1 32.0 12.0 10.8 16.6 0.2 35-39 3932735 11.4 5.2 1.5 2.0 6.8 35.6 10.3 9.6 17.3 0.2 40-44 3428147 12.0 4.8 1.4 1.9 7.1 39.7 8.2 8.2 16.5 0.2 45-49 2828330 12.1 4.8 1.3 1.9 6.7 42.4 7.3 6.7 16.6 0.2 50-54 2302062 10.8 4.3 1.3 1.8 6.5 47.5 6.2 5.3 16.3 0.1

National Series: Socio-economic and Demographic Report Page 228
Table P08: Occupation of Population Aged 15 Years and above by Age, Sex and Residence, 2011
Age Number
Occupation Managerial Professional Technicians and
Associate Professionals
Clerical Support Workers
Service and Sales Workers
Skilled Agricultural, Forestry and
Fishery Workers
Craft and Related Trade
Workers
Plant and Machine
Operators and Assemblers
Elementary Occupations
Other Occupations
1 2 3 4 5 6 7 8 9 10 11 12 55-59 1428841 11.0 5.3 1.4 1.7 7.0 49.0 5.4 3.9 15.1 0.1 60-64 1343430 9.8 3.8 1.1 1.3 6.6 52.6 4.9 3.5 16.5 0 65+ 1471414 9.0 3.3 0.7 0.7 6.0 56.9 4.8 2.9 15.9 0 Male 27800148 11.4 3.9 1.3 1.8 6.4 39.1 10.3 8.7 16.9 0.2 15-19 2075302 8.3 1.5 0.9 1.4 8.4 28.8 21.0 7.5 22.1 0.1 20-24 2976006 10.0 3.1 1.2 2.2 7.7 29.8 17.2 9.6 18.8 0.4 25-29 3966146 11.2 3.9 1.5 2.2 6.9 31.2 13.6 11.4 17.9 0.3 30-34 3515336 12.7 4.5 1.4 2.1 6.5 33.8 10.6 11.9 16.3 0.2 35-39 3482029 12.3 4.4 1.4 1.9 6.0 37.5 8.8 10.6 16.7 0.3 40-44 3114928 12.7 4.3 1.4 1.7 6.2 41.3 7.5 8.9 15.8 0.2 45-49 2588275 12.8 4.5 1.3 1.8 5.8 44.2 6.6 7.2 15.5 0.2 50-54 2119307 11.3 4.0 1.2 1.8 5.6 49.5 5.7 5.6 15.2 0.1 55-59 1327129 11.6 5.3 1.3 1.7 6.0 50.8 4.9 4.1 14.2 0.1 60-64 1257898 10.1 3.9 1.1 1.3 5.3 54.3 4.4 3.8 15.8 0 65+ 1377791 9.1 3.4 0.7 0.6 4.8 59.2 4.3 3.1 14.7 0 Female 3433286 4.5 10.3 1.5 3.0 11.9 18.7 25.5 1.9 22.6 0.1 15-19 384737 2.2 7.3 0.8 2.0 9.2 12.2 42.4 2.0 21.9 0.0 20-24 482636 3.8 12.2 1.7 3.9 5.8 12.5 37.9 2.6 19.6 0 25-29 623278 4.6 12.2 1.4 3.6 7.5 16.6 29.9 2.7 21.3 0.1 30-34 475033 6.4 14.2 1.8 3.1 11.0 19.3 22.5 2.4 19.2 0 35-39 450706 4.6 11.2 1.8 2.7 13.0 20.9 21.8 1.7 22.2 0.1 40-44 313219 4.9 9.6 1.5 4.3 16.6 23.9 14.8 1.2 23.0 0.1
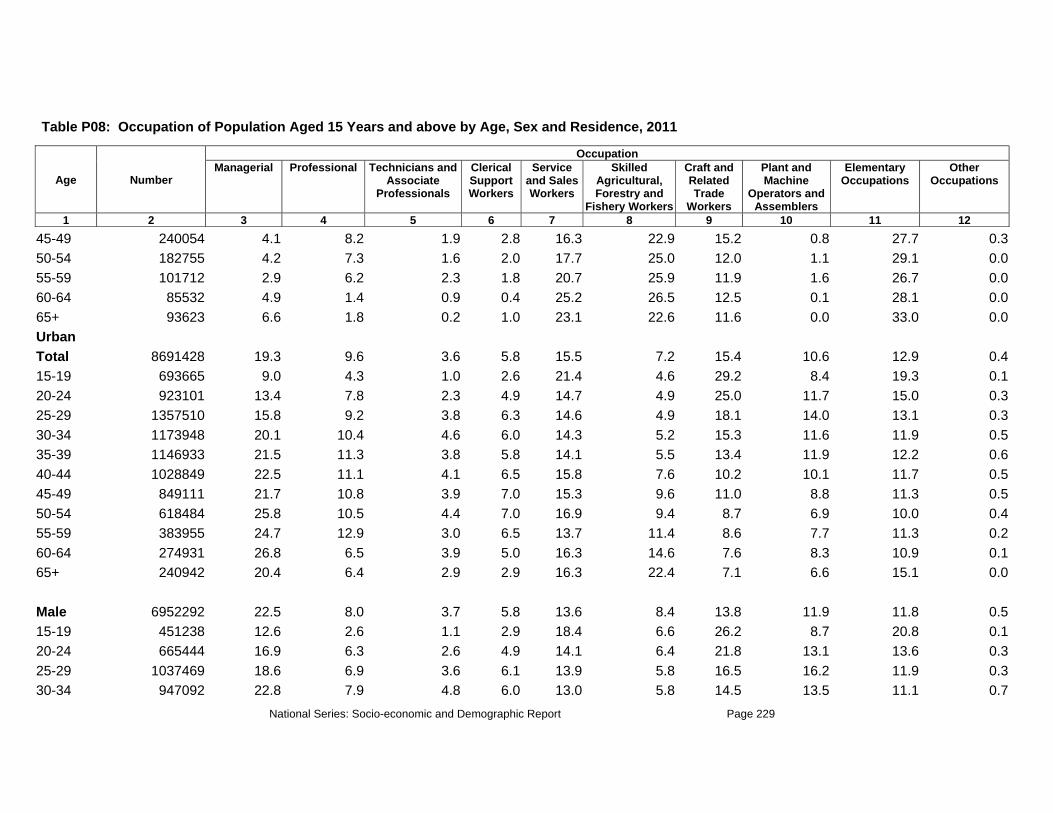
National Series: Socio-economic and Demographic Report Page 229
Table P08: Occupation of Population Aged 15 Years and above by Age, Sex and Residence, 2011
Age Number
Occupation Managerial Professional Technicians and
Associate Professionals
Clerical Support Workers
Service and Sales Workers
Skilled Agricultural, Forestry and
Fishery Workers
Craft and Related Trade
Workers
Plant and Machine
Operators and Assemblers
Elementary Occupations
Other Occupations
1 2 3 4 5 6 7 8 9 10 11 12 45-49 240054 4.1 8.2 1.9 2.8 16.3 22.9 15.2 0.8 27.7 0.3 50-54 182755 4.2 7.3 1.6 2.0 17.7 25.0 12.0 1.1 29.1 0.0 55-59 101712 2.9 6.2 2.3 1.8 20.7 25.9 11.9 1.6 26.7 0.0 60-64 85532 4.9 1.4 0.9 0.4 25.2 26.5 12.5 0.1 28.1 0.0 65+ 93623 6.6 1.8 0.2 1.0 23.1 22.6 11.6 0.0 33.0 0.0 Urban Total 8691428 19.3 9.6 3.6 5.8 15.5 7.2 15.4 10.6 12.9 0.4 15-19 693665 9.0 4.3 1.0 2.6 21.4 4.6 29.2 8.4 19.3 0.1 20-24 923101 13.4 7.8 2.3 4.9 14.7 4.9 25.0 11.7 15.0 0.3 25-29 1357510 15.8 9.2 3.8 6.3 14.6 4.9 18.1 14.0 13.1 0.3 30-34 1173948 20.1 10.4 4.6 6.0 14.3 5.2 15.3 11.6 11.9 0.5 35-39 1146933 21.5 11.3 3.8 5.8 14.1 5.5 13.4 11.9 12.2 0.6 40-44 1028849 22.5 11.1 4.1 6.5 15.8 7.6 10.2 10.1 11.7 0.5 45-49 849111 21.7 10.8 3.9 7.0 15.3 9.6 11.0 8.8 11.3 0.5 50-54 618484 25.8 10.5 4.4 7.0 16.9 9.4 8.7 6.9 10.0 0.4 55-59 383955 24.7 12.9 3.0 6.5 13.7 11.4 8.6 7.7 11.3 0.2 60-64 274931 26.8 6.5 3.9 5.0 16.3 14.6 7.6 8.3 10.9 0.1 65+ 240942 20.4 6.4 2.9 2.9 16.3 22.4 7.1 6.6 15.1 0.0 Male 6952292 22.5 8.0 3.7 5.8 13.6 8.4 13.8 11.9 11.8 0.5 15-19 451238 12.6 2.6 1.1 2.9 18.4 6.6 26.2 8.7 20.8 0.1 20-24 665444 16.9 6.3 2.6 4.9 14.1 6.4 21.8 13.1 13.6 0.3 25-29 1037469 18.6 6.9 3.6 6.1 13.9 5.8 16.5 16.2 11.9 0.3 30-34 947092 22.8 7.9 4.8 6.0 13.0 5.8 14.5 13.5 11.1 0.7
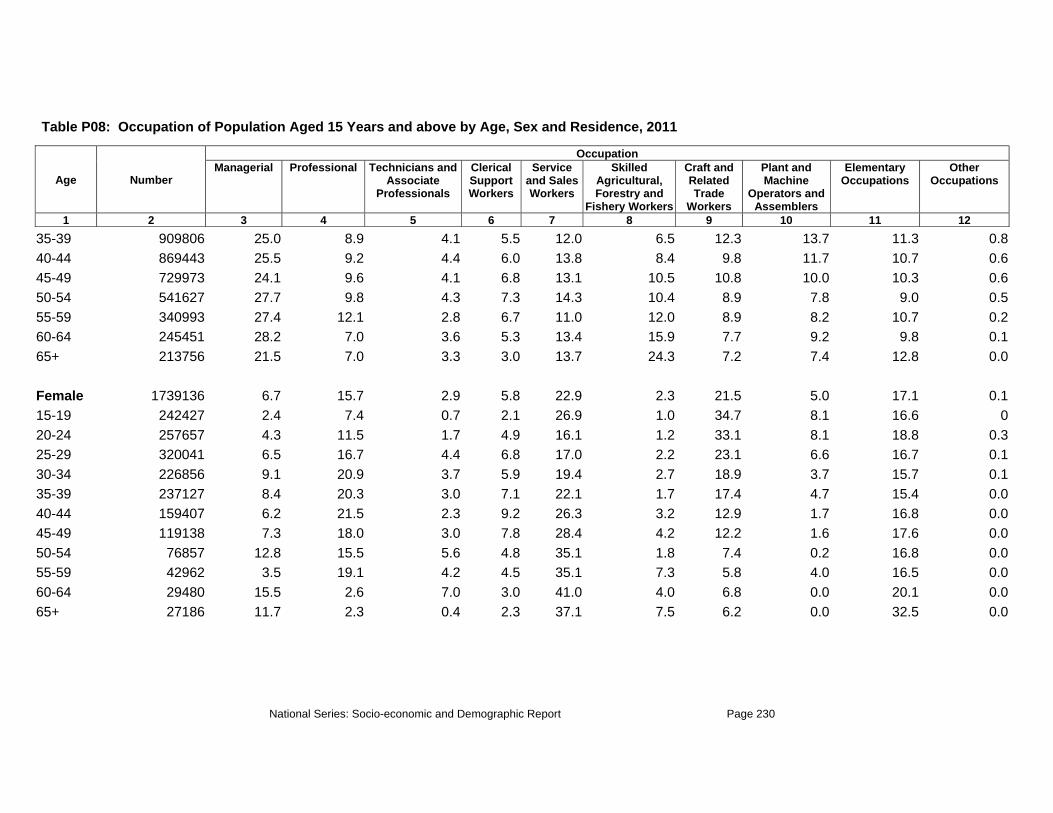
National Series: Socio-economic and Demographic Report Page 230
Table P08: Occupation of Population Aged 15 Years and above by Age, Sex and Residence, 2011
Age Number
Occupation Managerial Professional Technicians and
Associate Professionals
Clerical Support Workers
Service and Sales Workers
Skilled Agricultural, Forestry and
Fishery Workers
Craft and Related Trade
Workers
Plant and Machine
Operators and Assemblers
Elementary Occupations
Other Occupations
1 2 3 4 5 6 7 8 9 10 11 12 35-39 909806 25.0 8.9 4.1 5.5 12.0 6.5 12.3 13.7 11.3 0.8 40-44 869443 25.5 9.2 4.4 6.0 13.8 8.4 9.8 11.7 10.7 0.6 45-49 729973 24.1 9.6 4.1 6.8 13.1 10.5 10.8 10.0 10.3 0.6 50-54 541627 27.7 9.8 4.3 7.3 14.3 10.4 8.9 7.8 9.0 0.5 55-59 340993 27.4 12.1 2.8 6.7 11.0 12.0 8.9 8.2 10.7 0.2 60-64 245451 28.2 7.0 3.6 5.3 13.4 15.9 7.7 9.2 9.8 0.1 65+ 213756 21.5 7.0 3.3 3.0 13.7 24.3 7.2 7.4 12.8 0.0 Female 1739136 6.7 15.7 2.9 5.8 22.9 2.3 21.5 5.0 17.1 0.1 15-19 242427 2.4 7.4 0.7 2.1 26.9 1.0 34.7 8.1 16.6 0 20-24 257657 4.3 11.5 1.7 4.9 16.1 1.2 33.1 8.1 18.8 0.3 25-29 320041 6.5 16.7 4.4 6.8 17.0 2.2 23.1 6.6 16.7 0.1 30-34 226856 9.1 20.9 3.7 5.9 19.4 2.7 18.9 3.7 15.7 0.1 35-39 237127 8.4 20.3 3.0 7.1 22.1 1.7 17.4 4.7 15.4 0.0 40-44 159407 6.2 21.5 2.3 9.2 26.3 3.2 12.9 1.7 16.8 0.0 45-49 119138 7.3 18.0 3.0 7.8 28.4 4.2 12.2 1.6 17.6 0.0 50-54 76857 12.8 15.5 5.6 4.8 35.1 1.8 7.4 0.2 16.8 0.0 55-59 42962 3.5 19.1 4.2 4.5 35.1 7.3 5.8 4.0 16.5 0.0 60-64 29480 15.5 2.6 7.0 3.0 41.0 4.0 6.8 0.0 20.1 0.0 65+ 27186 11.7 2.3 0.4 2.3 37.1 7.5 6.2 0.0 32.5 0.0

National Series: Socio-economic and Demographic Report Page 231
Table P09: Educational Attainment of Population Aged 15 Years and above by Occupation, Sex and Residence, 2011
Educational Attainment Total
Occupation Managerial Professional Technicians
and Associate
Professionals
Clerical Support Workers
Service and Sales
Workers
Skilled Agricultural, Forestry and
Fishery Workers
Craft and
Related Trade
Workers
Plant and Machine
Operators and
Assemblers
Elementary Occupations
Other Occupation
s
1 2 3 4 5 6 7 8 9 10 11 12Total 39924862 4991488 2279406 718755 1109750 3541421 12135531 5085149 3393421 6580151 89789 No Class 6.0 4.0 1.0 2.0 2.0 7.0 8.0 5.0 7.0 8.0 2.0 Primary 33.0 27.0 5.0 17.0 13.0 32.0 38.0 37.0 39.0 39.0 3.0 Junior Secondary 21.0 20.0 6.0 15.0 14.0 20.0 21.0 27.0 23.0 22.0 6.0 Secondary/Higher Secondary 31.0 37.0 42.0 44.0 47.0 33.0 29.0 27.0 26.0 27.0 78.0 Graduate 6.0 8.0 30.0 16.0 18.0 5.0 3.0 3.0 3.0 3.0 9.0 Masters and Higher 2.0 4.0 16.0 6.0 6.0 2.0 1.0 1.0 1.0 0.2 0 Male 34752440 4722638 1652873 615327 906515 2734803 11452827 3834181 3240360 5507178 85738 No Class 6.0 4.0 1.0 2.0 2.0 5.0 8.0 4.0 7.0 7.0 1.0 Primary 33.0 27.0 6.0 17.0 12.0 31.0 38.0 37.0 38.0 39.0 3.0 Junior Secondary 21.0 20.0 6.0 15.0 15.0 21.0 21.0 26.0 23.0 22.0 7.0 Secondary/Higher Secondary 32.0 37.0 40.0 44.0 47.0 36.0 30.0 29.0 26.0 28.0 79.0 Graduate 6.0 8.0 31.0 16.0 19.0 6.0 3.0 3.0 4.0 4.0 9.0 Masters and Higher 2.0 3.0 17.0 6.0 6.0 2.0 1.0 1.0 1.0 1.0 2.0 Female 5172422 268851 626534 103428 203235 806618 682704 1250968 153061 1072973 4051 No Class 10.0 8.0 2.0 2.0 5.0 15.0 14.0 7.0 10.0 13.0 18.0

National Series: Socio-economic and Demographic Report Page 232
Table P09: Educational Attainment of Population Aged 15 Years and above by Occupation, Sex and Residence, 2011
Educational Attainment Total
Occupation Managerial Professional Technicians
and Associate
Professionals
Clerical Support Workers
Service and Sales
Workers
Skilled Agricultural, Forestry and
Fishery Workers
Craft and
Related Trade
Workers
Plant and Machine
Operators and
Assemblers
Elementary Occupations
Other Occupation
s
1 2 3 4 5 6 7 8 9 10 11 12Primary 33.0 26.0 4.0 15.0 20.0 36.0 39.0 39.0 43.0 41.0 6.0 Junior Secondary 22.0 19.0 6.0 13.0 13.0 18.0 23.0 31.0 24.0 25.0 3.0 Secondary/Higher Secondary 27.0 33.0 49.0 45.0 43.0 25.0 23.0 23.0 21.0 20.0 54.0 Graduate 6.0 9.0 26.0 17.0 14.0 4.0 1.0 1.0 2.0 1.0 20.0 Masters and Higher 3.0 6.0 13.0 8.0 5.0 3.0 0 0 0 0 0.0 Rural Total 39924862 4991488 2279406 718755 1109750 3541421 12135531 5085149 3393421 6580151 89789 No Class 6.0 4.0 1.0 2.0 2.0 7.0 8.0 5.0 7.0 8.0 2.0 Primary 33.0 27.0 5.0 17.0 13.0 32.0 38.0 37.0 39.0 39.0 3.0 Junior Secondary 21.0 20.0 6.0 15.0 14.0 20.0 21.0 27.0 23.0 22.0 6.0 Secondary/Higher Secondary 31.0 37.0 42.0 44.0 47.0 33.0 29.0 27.0 26.0 27.0 78.0 Graduate 6.0 8.0 30.0 16.0 18.0 5.0 3.0 3.0 3.0 3.0 9.0 Masters and Higher 2.0 4.0 16.0 6.0 6.0 2.0 1.0 1.0 1.0 1.0 2.0 Male 34752440 4722638 1652873 615327 906515 2734803 11452827 3834181 3240360 5507178 85738 No Class 6.0 4.0 1.0 2.0 2.0 5.0 8.0 4.0 7.0 7.0 1.0 Primary 33.0 27.0 6.0 17.0 12.0 31.0 38.0 37.0 38.0 39.0 3.0 Junior Secondary 21.0 20.0 6.0 15.0 15.0 21.0 21.0 26.0 23.0 22.0 7.0

National Series: Socio-economic and Demographic Report Page 233
Table P09: Educational Attainment of Population Aged 15 Years and above by Occupation, Sex and Residence, 2011
Educational Attainment Total
Occupation Managerial Professional Technicians
and Associate
Professionals
Clerical Support Workers
Service and Sales
Workers
Skilled Agricultural, Forestry and
Fishery Workers
Craft and
Related Trade
Workers
Plant and Machine
Operators and
Assemblers
Elementary Occupations
Other Occupation
s
1 2 3 4 5 6 7 8 9 10 11 12Secondary/Higher Secondary 32.0 37.0 40.0 44.0 47.0 36.0 30.0 29.0 26.0 28.0 79.0 Graduate 6.0 8.0 31.0 16.0 19.0 6.0 3.0 3.0 4.0 4.0 9.0 Masters and Higher 2.0 3.0 17.0 6.0 6.0 2.0 1.0 1.0 1.0 1.0 2.0 Female 5172422 268851 626534 103428 203235 806618 682704 1250968 153061 1072973 4051 No Class 10.0 8.0 2.0 2.0 5.0 15.0 14.0 7.0 10.0 13.0 18.0 Primary 33.0 26.0 4.0 15.0 20.0 36.0 39.0 39.0 43.0 41.0 6.0 Junior Secondary 22.0 19.0 6.0 13.0 13.0 18.0 23.0 31.0 24.0 25.0 3.0 Secondary/Higher Secondary 27.0 33.0 49.0 45.0 43.0 25.0 23.0 23.0 21.0 20.0 54.0 Graduate 6.0 9.0 26.0 17.0 14.0 4.0 1.0 1.0 2.0 1.0 20.0 Masters and Higher 3.0 6.0 13.0 8.0 5.0 3.0 0 0 0 0 0.0 Urban Total 39924862 4991488 2279406 718755 1109750 3541421 12135531 5085149 3393421 6580151 89789 No Class 6.0 4.0 1.0 2.0 2.0 7.0 8.0 5.0 7.0 8.0 2.0 Primary 33.0 27.0 5.0 17.0 13.0 32.0 38.0 37.0 39.0 39.0 3.0 Junior Secondary 21.0 20.0 6.0 15.0 14.0 20.0 21.0 27.0 23.0 22.0 6.0 Secondary/Higher Secondary 31.0 37.0 42.0 44.0 47.0 33.0 29.0 27.0 26.0 27.0 78.0 Graduate 6.0 8.0 30.0 16.0 18.0 5.0 3.0 3.0 3.0 3.0 9.0 Masters and 2.0 4.0 16.0 6.0 6.0 2.0 1.0 1.0 1.0 1.0 2.0
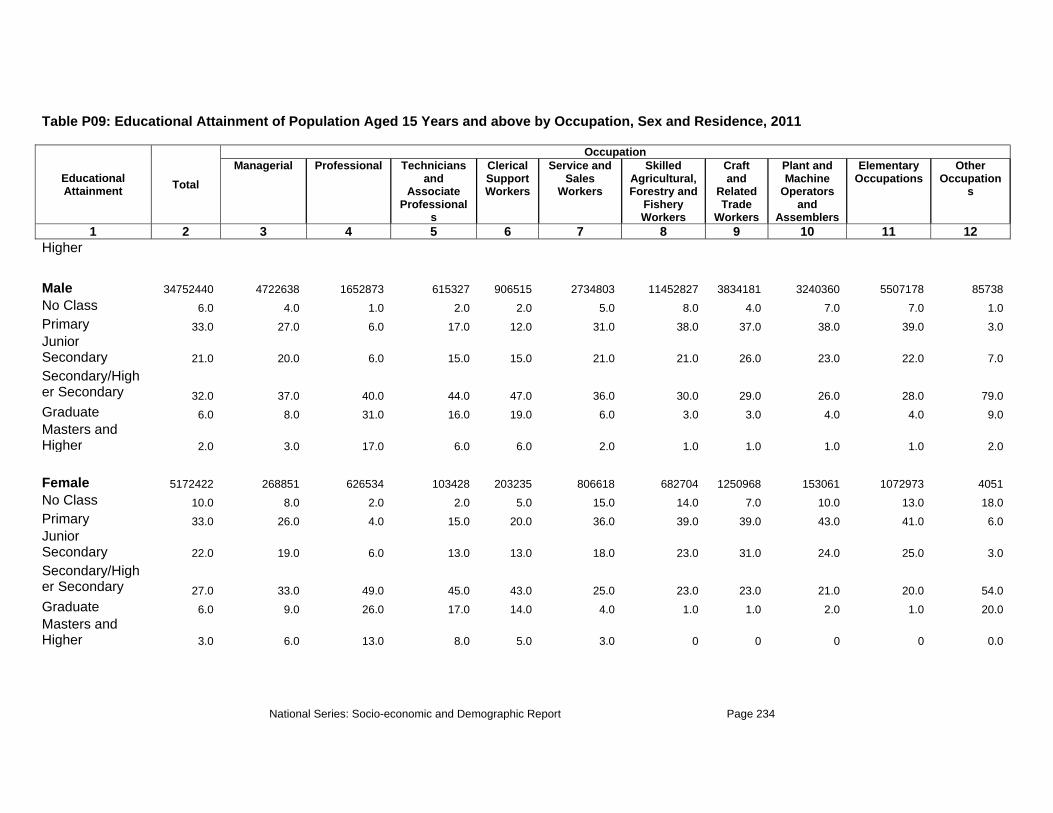
National Series: Socio-economic and Demographic Report Page 234
Table P09: Educational Attainment of Population Aged 15 Years and above by Occupation, Sex and Residence, 2011
Educational Attainment Total
Occupation Managerial Professional Technicians
and Associate
Professionals
Clerical Support Workers
Service and Sales
Workers
Skilled Agricultural, Forestry and
Fishery Workers
Craft and
Related Trade
Workers
Plant and Machine
Operators and
Assemblers
Elementary Occupations
Other Occupation
s
1 2 3 4 5 6 7 8 9 10 11 12Higher Male 34752440 4722638 1652873 615327 906515 2734803 11452827 3834181 3240360 5507178 85738 No Class 6.0 4.0 1.0 2.0 2.0 5.0 8.0 4.0 7.0 7.0 1.0 Primary 33.0 27.0 6.0 17.0 12.0 31.0 38.0 37.0 38.0 39.0 3.0 Junior Secondary 21.0 20.0 6.0 15.0 15.0 21.0 21.0 26.0 23.0 22.0 7.0 Secondary/Higher Secondary 32.0 37.0 40.0 44.0 47.0 36.0 30.0 29.0 26.0 28.0 79.0 Graduate 6.0 8.0 31.0 16.0 19.0 6.0 3.0 3.0 4.0 4.0 9.0 Masters and Higher 2.0 3.0 17.0 6.0 6.0 2.0 1.0 1.0 1.0 1.0 2.0 Female 5172422 268851 626534 103428 203235 806618 682704 1250968 153061 1072973 4051 No Class 10.0 8.0 2.0 2.0 5.0 15.0 14.0 7.0 10.0 13.0 18.0 Primary 33.0 26.0 4.0 15.0 20.0 36.0 39.0 39.0 43.0 41.0 6.0 Junior Secondary 22.0 19.0 6.0 13.0 13.0 18.0 23.0 31.0 24.0 25.0 3.0 Secondary/Higher Secondary 27.0 33.0 49.0 45.0 43.0 25.0 23.0 23.0 21.0 20.0 54.0 Graduate 6.0 9.0 26.0 17.0 14.0 4.0 1.0 1.0 2.0 1.0 20.0 Masters and Higher 3.0 6.0 13.0 8.0 5.0 3.0 0 0 0 0 0.0

National Series: Socio-economic and Demographic Report Page 235
Table P10: Occupation of Head of Household by Highest Class Passed, Sex and Residence, 2011
Highest Class Passed Number
Occupation Managerial Professional Technicia
ns and Associate Professio
nals
Clerical Support Workers
Service and
Sales Workers
Skilled Agricultural, Forestry and
Fishery Workers
Craft and Related Trade
Workers
Plant and Machine
Operators and Assemblers
Elementary Occupations
Other Occupatio
ns
1 2 3 4 5 6 7 8 9 10 11 12 Total 25961780 13.3 4.6 1.7 2.4 7.6 35.2 9.1 9.6 16.2 0.2 No Class 1881705 9.5 0.8 0.8 0.8 7.7 42.3 7.9 11.3 18.9 0 Primary 8757625 11.2 0.9 1.0 0.9 7.4 39.6 9.8 10.9 18.3 0 Junior Secondary 4974840 12.9 1.3 1.2 1.7 7.2 36.4 11.2 10.9 17.0 0.1 Secondary/Higher Secondary 8047529 15.1 5.6 2.3 3.6 8.3 33.3 8.5 8.1 14.6 0.5 Graduate 1675577 18.2 22.9 4.2 7.0 7.1 18.3 5.6 6.0 10.4 0.3 Masters and Higher 624504 19.9 32.4 4.5 5.5 5.5 13.2 4.6 6.0 8.2 0.2 Male 25027638 13.6 4.6 1.7 2.4 7.0 35.9 8.9 9.9 15.8 0.2 No Class 1742264 10.0 0.7 0.8 0.7 6.3 43.8 7.4 12.1 18.2 0 Primary 8396811 11.5 0.9 0.9 0.8 6.6 40.5 9.6 11.3 17.9 0 Junior Secondary 4791591 13.2 1.3 1.1 1.7 6.7 37.2 10.9 11.3 16.5 0.1 Secondary/Higher Secondary 7841729 15.4 5.4 2.3 3.6 7.9 33.8 8.4 8.2 14.4 0.5 Graduate 1641875 18.2 22.6 4.2 7.1 7.0 18.6 5.7 6.1 10.4 0.3 Masters and Higher 613367 20.0 32.2 4.5 5.6 5.2 13.5 4.6 6.1 8.1 0.2 Female 934142 5.7 6.6 1.7 3.1 23.2 17.1 14.1 1.5 26.8 0.1 No Class 139440 4.2 1.7 1.0 1.6 25.8 23.2 13.8 1.4 27.1 0.3 Primary 360815 5.0 1.9 1.4 2.9 25.2 18.7 13.9 2.1 28.9 0.0

National Series: Socio-economic and Demographic Report Page 236
Table P10: Occupation of Head of Household by Highest Class Passed, Sex and Residence, 2011
Highest Class Passed Number
Occupation Managerial Professional Technicia
ns and Associate Professio
nals
Clerical Support Workers
Service and
Sales Workers
Skilled Agricultural, Forestry and
Fishery Workers
Craft and Related Trade
Workers
Plant and Machine
Operators and Assemblers
Elementary Occupations
Other Occupatio
ns
1 2 3 4 5 6 7 8 9 10 11 12 Junior Secondary 183248 6.4 2.7 1.6 1.8 20.3 16.7 18.7 1.0 30.8 0.0 Secondary/Higher Secondary 205800 5.2 14.4 2.3 5.3 22.1 13.7 12.8 1.0 22.9 0.3 Graduate 33702 15.2 37.4 4.1 5.8 14.6 4.2 5.2 2.9 10.7 0.0 Masters and Higher 11137 13.1 46.0 1.0 2.0 21.2 0.0 2.2 0.0 14.4 0.0 Rural Total 20746734 11.0 3.7 1.2 1.5 6.2 41.8 8.3 8.9 17.3 0.1 No Class 1541641 8.8 0.8 0.6 0.5 6.2 48.1 6.6 9.6 18.6 0.1 Primary 7526409 10.2 0.9 0.8 0.6 6.3 44.0 8.8 9.7 18.8 0 Junior Secondary 4128725 11.3 1.3 1.0 1.3 6.2 41.7 10.0 9.7 17.4 0.1 Secondary/Higher Secondary 6287016 12.3 5.5 1.7 2.5 6.4 40.4 7.7 7.6 15.7 0.3 Graduate 997926 11.3 21.9 2.5 4.4 5.0 28.6 5.4 6.8 13.9 0.1 Masters and Higher 265017 8.8 26.2 1.3 2.8 3.9 29.1 5.6 8.1 14.1 0.0 Male 20070754 11.2 3.6 1.2 1.5 5.7 42.5 8.1 9.2 16.8 0.1 No Class 1437799 9.2 0.7 0.6 0.4 5.1 49.5 6.2 10.2 18.0 0 Primary 7243948 10.4 0.8 0.8 0.6 5.6 44.8 8.6 10.1 18.2 0 Junior Secondary 3991539 11.6 1.3 1.0 1.3 5.7 42.4 9.7 10.0 16.9 0.1 Secondary/Higher Secondary 6151860 12.5 5.3 1.7 2.5 6.1 40.9 7.5 7.7 15.5 0.3

National Series: Socio-economic and Demographic Report Page 237
Table P10: Occupation of Head of Household by Highest Class Passed, Sex and Residence, 2011
Highest Class Passed Number
Occupation Managerial Professional Technicia
ns and Associate Professio
nals
Clerical Support Workers
Service and
Sales Workers
Skilled Agricultural, Forestry and
Fishery Workers
Craft and Related Trade
Workers
Plant and Machine
Operators and Assemblers
Elementary Occupations
Other Occupatio
ns
1 2 3 4 5 6 7 8 9 10 11 12 Graduate 983357 11.4 21.6 2.5 4.4 4.9 28.9 5.4 6.9 13.8 0.1 Masters and Higher 262252 8.9 26.3 1.3 2.9 3.6 29.4 5.6 8.2 13.9 0.0 Female 675980 4.2 5.2 1.3 1.9 21.2 21.8 13.9 0.9 29.4 0.1 No Class 103842 3.8 2.2 1.1 1.4 21.3 29.0 11.8 1.1 27.9 0.4 Primary 282461 4.2 1.7 0.9 1.5 23.9 22.0 12.8 1.3 31.8 0.0 Junior Secondary 137186 5.2 2.2 1.9 1.0 20.0 20.2 18.1 0.4 31.0 0.0 Secondary/Higher Secondary 135156 3.8 13.6 1.6 3.5 18.0 19.3 14.6 0.5 25.0 0.1 Graduate 14570 4.1 43.2 2.0 5.2 8.0 9.4 7.4 0.0 20.8 0.0 Masters and Higher 2765 0.0 22.4 0.0 0.0 32.7 0.0 6.6 0.0 38.3 0.0 Urban Total 5215046 22.4 8.3 3.7 5.8 13.2 9.1 12.4 12.5 12.1 0.5 No Class 340064 12.7 0.6 1.6 1.9 14.5 15.8 13.6 19.3 20 0 Primary 1231217 17.3 1.1 2.1 2.4 14.2 13.1 16.1 18 15.7 0.1 Junior Secondary 846115 20.8 1.5 1.9 3.8 12.3 10.6 16.7 17 15.1 0.2 Secondary/Higher Secondary 1760513 25.2 6.2 4.5 7.6 15.1 8 11.6 9.9 10.9 1.1 Graduate 677650 28.2 24.2 6.7 10.8 10.3 3.2 6 4.9 5.2 0.6 Masters and Higher 359486 28.1 37 6.8 7.5 6.6 1.6 3.8 4.5 3.8 0.3
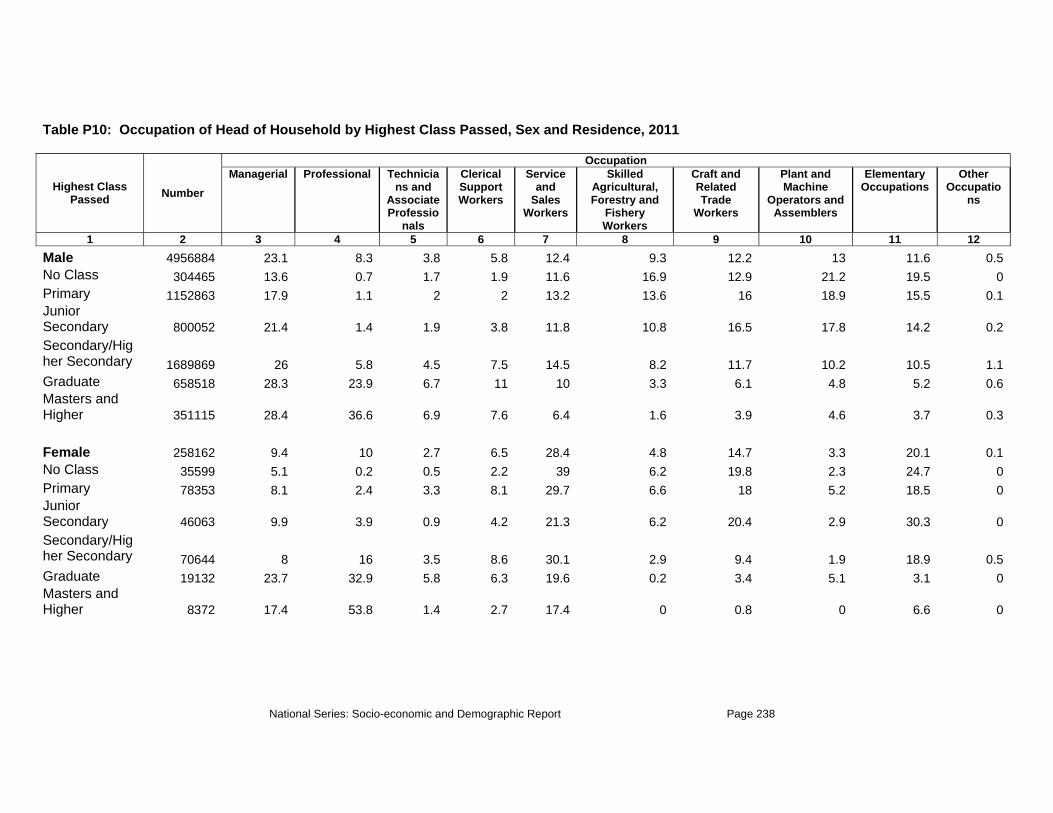
National Series: Socio-economic and Demographic Report Page 238
Table P10: Occupation of Head of Household by Highest Class Passed, Sex and Residence, 2011
Highest Class Passed Number
Occupation Managerial Professional Technicia
ns and Associate Professio
nals
Clerical Support Workers
Service and
Sales Workers
Skilled Agricultural, Forestry and
Fishery Workers
Craft and Related Trade
Workers
Plant and Machine
Operators and Assemblers
Elementary Occupations
Other Occupatio
ns
1 2 3 4 5 6 7 8 9 10 11 12 Male 4956884 23.1 8.3 3.8 5.8 12.4 9.3 12.2 13 11.6 0.5 No Class 304465 13.6 0.7 1.7 1.9 11.6 16.9 12.9 21.2 19.5 0 Primary 1152863 17.9 1.1 2 2 13.2 13.6 16 18.9 15.5 0.1 Junior Secondary 800052 21.4 1.4 1.9 3.8 11.8 10.8 16.5 17.8 14.2 0.2 Secondary/Higher Secondary 1689869 26 5.8 4.5 7.5 14.5 8.2 11.7 10.2 10.5 1.1 Graduate 658518 28.3 23.9 6.7 11 10 3.3 6.1 4.8 5.2 0.6 Masters and Higher 351115 28.4 36.6 6.9 7.6 6.4 1.6 3.9 4.6 3.7 0.3 Female 258162 9.4 10 2.7 6.5 28.4 4.8 14.7 3.3 20.1 0.1 No Class 35599 5.1 0.2 0.5 2.2 39 6.2 19.8 2.3 24.7 0 Primary 78353 8.1 2.4 3.3 8.1 29.7 6.6 18 5.2 18.5 0 Junior Secondary 46063 9.9 3.9 0.9 4.2 21.3 6.2 20.4 2.9 30.3 0 Secondary/Higher Secondary 70644 8 16 3.5 8.6 30.1 2.9 9.4 1.9 18.9 0.5 Graduate 19132 23.7 32.9 5.8 6.3 19.6 0.2 3.4 5.1 3.1 0 Masters and Higher 8372 17.4 53.8 1.4 2.7 17.4 0 0.8 0 6.6 0

National Series: Socio-economic and Demographic Report Page 239
Table P11: Sector Wise Population Aged 15 Years and above by Employment Status, Sex and Residence, 2011
Sector Number
Employment Status
Employer
Employee
Self-Employed Agriculture
Self-Employed Non-Agriculture
Family Helper Others
1 2 3 4 5 6 7 8 Total 39924862 2.5 29.4 28.8 25.2 3.9 10.2 Agriculture 15470839 1.0 9.6 66.4 8.6 5.5 9.0 Non-Agriculture 24454023 3.5 41.9 5.0 35.7 2.9 11.0 Male 34752440 2.7 26.5 31.6 26.4 2.8 10.1 Agriculture 14544788 0.9 9.3 68.0 8.6 4.3 8.9 Non-Agriculture 20207651 3.9 38.8 5.4 39.2 1.7 10.9 Female 5172422 1.7 49.2 9.6 17.0 11.4 11.1 Agriculture 926051 1.1 14.7 41.0 8.9 23.9 10.4 Non-Agriculture 4246371 1.8 56.7 2.7 18.8 8.7 11.3 Rural Total 31233433 2.1 23.7 34.5 24.6 4.3 10.9 Agriculture 14682742 0.9 9.4 66.8 8.3 5.5 9.1 Non-Agriculture 16550692 3.1 36.4 5.8 39.0 3.2 12.5 Male 27800148 2.1 21.7 37.1 25.3 3.1 10.7 Agriculture 13812496 0.9 9.1 68.4 8.3 4.4 9.0 Non-Agriculture 13987652 3.3 34.2 6.3 42.0 1.8 12.4 Female 3433286 1.8 39.8 13.1 18.8 14.0 12.5 Agriculture 870246 1.1 14.0 41.6 8.7 24.2 10.5 Non-Agriculture 2563039 2.0 48.5 3.4 22.3 10.6 13.2 Urban Total 8691428 4.2 50.0 8.2 27.4 2.5 7.7 Agriculture 788097 1.9 13.5 58.6 14.1 4.6 7.4 Non-Agriculture 7903331 4.4 53.6 3.2 28.7 2.3 7.8 Male 6952292 4.9 45.5 9.6 30.9 1.6 7.6 Agriculture 732293 1.8 12.5 60.6 14.3 3.4 7.4 Non-Agriculture 6219999 5.2 49.3 3.6 32.9 1.4 7.6 Female 1739136 1.5 67.9 2.6 13.4 6.3 8.4 Agriculture 55805 2.3 25.8 31.3 12.1 20.2 8.2 Non-Agriculture 1683332 1.5 69.3 1.6 13.5 5.8 8.4

National Series: Socio-economic and Demographic Report Page 240
Table P12: Occupational Status of Population by Highest Class Passed, Sex and Residence, 2011
Educational Attainment Number
Employment Status
Employer Employee Self-
Employed Agriculture
Self-Employed
Non-Agriculture
Family Helper Others
1 2 3 4 5 6 7 8
Total 39924862 2.5 29.4 28.8 25.2 3.9 10.2 No Class 2512222 2.4 25.6 33.7 22.9 4.2 11.1 Primary 13226101 1.9 25.2 32.0 25.9 4.1 10.9 Junior Secondary 8335942 2.0 27.7 29.3 25.9 4.9 10.2 Secondary/Higher Secondary 12442754 2.9 30.0 27.7 25.9 3.7 9.8 Graduate 2442588 5.0 47.8 16.6 20.7 1.4 8.5 Masters and Higher 965255 4.5 57.5 11.4 17.3 1.4 7.9 Male 34752440 2.7 26.5 31.6 26.4 2.8 10.1 No Class 2016427 2.7 21.0 39.0 25.0 1.8 10.5 Primary 11534723 2.0 22.2 35.0 27.1 2.9 10.7 Junior Secondary 7217580 2.1 24.9 32.3 27.0 3.5 10.2 Secondary/Higher Secondary 11029946 3.0 27.4 30.2 26.9 2.8 9.7 Graduate 2141176 5.3 44.5 18.5 22.0 1.1 8.6 Masters and Higher 812589 4.9 54.1 12.8 19.0 1.1 8.1 Female 5172422 1.7 49.2 9.6 17.0 11.4 11.1 No Class 495795 1.4 44.7 12.2 14.1 13.8 13.8 Primary 1691378 1.5 45.1 11.1 17.5 12.6 12.1 Junior Secondary 1118362 1.3 45.9 10.2 18.6 13.6 10.4 Secondary/Higher Secondary 1412808 2.0 50.6 8.3 18.3 10.0 10.8 Graduate 301412 2.9 71.7 3.1 11.1 3.0 8.1 Masters and Higher 152666 2.3 75.9 3.5 8.5 3.2 6.7 Rural Total 31233433 2.1 23.7 34.5 24.6 4.3 10.9 No Class 1985857 2.0 20.5 39.8 21.7 4.6 11.4 Primary 11096194 1.8 21.0 36.3 25.2 4.4 11.4 Junior Secondary 6804873 1.8 23.3 33.8 25.2 5.2 10.7 Secondary/Higher Secondary 9523866 2.4 24.7 33.7 24.7 4.0 10.5 Graduate 1419906 3.4 38.9 24.9 20.8 1.6 10.4 Masters and Higher 402737 3.0 44.0 22.2 18.6 1.8 10.4 Male 27800148 2.1 21.7 37.1 25.3 3.1 10.7 No Class 1659738 2.2 17.8 44.2 22.9 2.1 10.8 Primary 9878884 1.8 19.1 39.0 26.0 3.1 11.1 Junior Secondary 5987646 1.9 21.1 36.6 25.9 3.8 10.6 Secondary/Higher Secondary 8623480 2.4 22.8 36.0 25.2 3.1 10.4 Graduate 1286039 3.4 36.2 27.0 21.7 1.4 10.3

National Series: Socio-economic and Demographic Report Page 241
Table P12: Occupational Status of Population by Highest Class Passed, Sex and Residence, 2011
Educational Attainment Number
Employment Status
Employer Employee Self-
Employed Agriculture
Self-Employed
Non-Agriculture
Family Helper Others
1 2 3 4 5 6 7 8 Masters and Higher 364360 3.1 41.9 23.6 19.4 1.4 10.5 Female 3433286 1.8 39.8 13.1 18.8 14.0 12.5 No Class 326120 1.4 33.8 17.3 15.8 17.3 14.3 Primary 1217309 1.6 36.2 14.3 19.3 14.9 13.7 Junior Secondary 817227 1.4 38.7 13.2 19.9 15.3 11.5 Secondary/Higher Secondary 900386 2.2 43.0 11.4 19.7 12.3 11.5 Graduate 133867 3.5 65.1 3.9 12.5 3.9 11.1 Masters and Higher 38377 1.8 63.7 8.7 10.7 5.5 9.7 Urban Total 8691428 4.2 50.0 8.2 27.4 2.5 7.7 No Class 526364 3.8 45.2 11.0 27.2 2.8 9.9 Primary 2129907 2.7 47.0 9.7 29.2 2.8 8.6 Junior Secondary 1531069 3.0 47.5 9.2 28.8 3.5 8.0 Secondary/Higher Secondary 2918888 4.6 47.3 8.1 30.0 2.6 7.5 Graduate 1022681 7.3 60.2 5.1 20.5 1.0 5.9 Masters and Higher 562519 5.5 67.2 3.6 16.4 1.2 6.1 Male 6952292 4.9 45.5 9.6 30.9 1.6 7.6 No Class 356689 5.1 35.5 15.1 34.9 0.8 8.6 Primary 1655838 3.1 41.0 11.6 33.8 1.7 8.9 Junior Secondary 1229933 3.6 43.1 10.9 32.1 2.1 8.2 Secondary/Higher Secondary 2406466 5.2 43.7 9.2 33.0 1.8 7.1 Graduate 855137 8.3 56.9 5.6 22.6 0.7 5.9 Masters and Higher 448229 6.3 63.9 4.1 18.6 0.8 6.3 Female 1739136 1.5 67.9 2.6 13.4 6.3 8.4 No Class 169676 1.3 65.6 2.4 10.9 7.1 12.7 Primary 474069 1.2 68.2 3.0 13.1 6.7 7.8 Junior Secondary 301135 0.9 65.5 1.9 15.2 9.1 7.5 Secondary/Higher Secondary 512423 1.7 64.0 2.9 15.9 6.0 9.5 Graduate 167545 2.5 77.0 2.5 10.1 2.3 5.6 Masters and Higher 114289 2.4 80.0 1.7 7.7 2.5 5.6
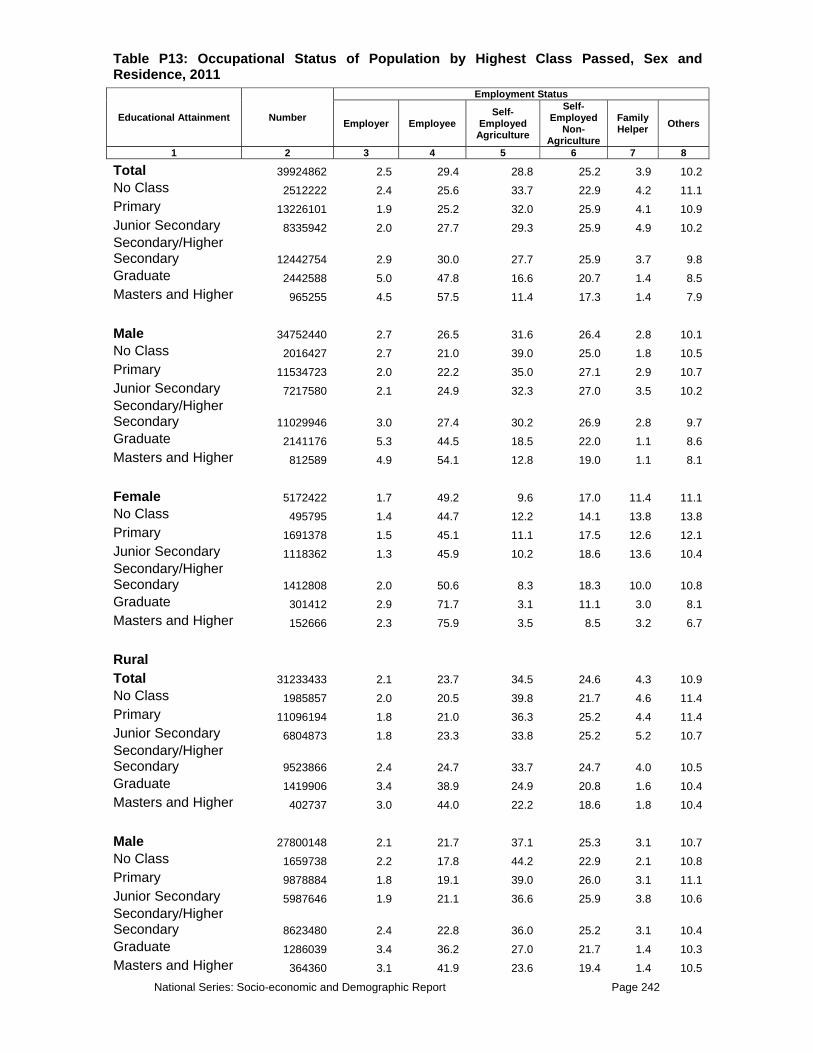
National Series: Socio-economic and Demographic Report Page 242
Table P13: Occupational Status of Population by Highest Class Passed, Sex and Residence, 2011
Educational Attainment Number
Employment Status
Employer Employee Self-
Employed Agriculture
Self-Employed
Non-Agriculture
Family Helper Others
1 2 3 4 5 6 7 8
Total 39924862 2.5 29.4 28.8 25.2 3.9 10.2 No Class 2512222 2.4 25.6 33.7 22.9 4.2 11.1 Primary 13226101 1.9 25.2 32.0 25.9 4.1 10.9 Junior Secondary 8335942 2.0 27.7 29.3 25.9 4.9 10.2 Secondary/Higher Secondary 12442754 2.9 30.0 27.7 25.9 3.7 9.8 Graduate 2442588 5.0 47.8 16.6 20.7 1.4 8.5 Masters and Higher 965255 4.5 57.5 11.4 17.3 1.4 7.9 Male 34752440 2.7 26.5 31.6 26.4 2.8 10.1 No Class 2016427 2.7 21.0 39.0 25.0 1.8 10.5 Primary 11534723 2.0 22.2 35.0 27.1 2.9 10.7 Junior Secondary 7217580 2.1 24.9 32.3 27.0 3.5 10.2 Secondary/Higher Secondary 11029946 3.0 27.4 30.2 26.9 2.8 9.7 Graduate 2141176 5.3 44.5 18.5 22.0 1.1 8.6 Masters and Higher 812589 4.9 54.1 12.8 19.0 1.1 8.1 Female 5172422 1.7 49.2 9.6 17.0 11.4 11.1 No Class 495795 1.4 44.7 12.2 14.1 13.8 13.8 Primary 1691378 1.5 45.1 11.1 17.5 12.6 12.1 Junior Secondary 1118362 1.3 45.9 10.2 18.6 13.6 10.4 Secondary/Higher Secondary 1412808 2.0 50.6 8.3 18.3 10.0 10.8 Graduate 301412 2.9 71.7 3.1 11.1 3.0 8.1 Masters and Higher 152666 2.3 75.9 3.5 8.5 3.2 6.7 Rural Total 31233433 2.1 23.7 34.5 24.6 4.3 10.9 No Class 1985857 2.0 20.5 39.8 21.7 4.6 11.4 Primary 11096194 1.8 21.0 36.3 25.2 4.4 11.4 Junior Secondary 6804873 1.8 23.3 33.8 25.2 5.2 10.7 Secondary/Higher Secondary 9523866 2.4 24.7 33.7 24.7 4.0 10.5 Graduate 1419906 3.4 38.9 24.9 20.8 1.6 10.4 Masters and Higher 402737 3.0 44.0 22.2 18.6 1.8 10.4 Male 27800148 2.1 21.7 37.1 25.3 3.1 10.7 No Class 1659738 2.2 17.8 44.2 22.9 2.1 10.8 Primary 9878884 1.8 19.1 39.0 26.0 3.1 11.1 Junior Secondary 5987646 1.9 21.1 36.6 25.9 3.8 10.6 Secondary/Higher Secondary 8623480 2.4 22.8 36.0 25.2 3.1 10.4 Graduate 1286039 3.4 36.2 27.0 21.7 1.4 10.3 Masters and Higher 364360 3.1 41.9 23.6 19.4 1.4 10.5

National Series: Socio-economic and Demographic Report Page 243
Table P13: Occupational Status of Population by Highest Class Passed, Sex and Residence, 2011
Educational Attainment Number
Employment Status
Employer Employee Self-
Employed Agriculture
Self-Employed
Non-Agriculture
Family Helper Others
1 2 3 4 5 6 7 8
Female 3433286 1.8 39.8 13.1 18.8 14.0 12.5 No Class 326120 1.4 33.8 17.3 15.8 17.3 14.3 Primary 1217309 1.6 36.2 14.3 19.3 14.9 13.7 Junior Secondary 817227 1.4 38.7 13.2 19.9 15.3 11.5 Secondary/Higher Secondary 900386 2.2 43.0 11.4 19.7 12.3 11.5 Graduate 133867 3.5 65.1 3.9 12.5 3.9 11.1 Masters and Higher 38377 1.8 63.7 8.7 10.7 5.5 9.7 Urban Total 8691428 4.2 50.0 8.2 27.4 2.5 7.7 No Class 526364 3.8 45.2 11.0 27.2 2.8 9.9 Primary 2129907 2.7 47.0 9.7 29.2 2.8 8.6 Junior Secondary 1531069 3.0 47.5 9.2 28.8 3.5 8.0 Secondary/Higher Secondary 2918888 4.6 47.3 8.1 30.0 2.6 7.5 Graduate 1022681 7.3 60.2 5.1 20.5 1.0 5.9 Masters and Higher 562519 5.5 67.2 3.6 16.4 1.2 6.1 Male 6952292 4.9 45.5 9.6 30.9 1.6 7.6 No Class 356689 5.1 35.5 15.1 34.9 0.8 8.6 Primary 1655838 3.1 41.0 11.6 33.8 1.7 8.9 Junior Secondary 1229933 3.6 43.1 10.9 32.1 2.1 8.2 Secondary/Higher Secondary 2406466 5.2 43.7 9.2 33.0 1.8 7.1 Graduate 855137 8.3 56.9 5.6 22.6 0.7 5.9 Masters and Higher 448229 6.3 63.9 4.1 18.6 0.8 6.3 Female 1739136 1.5 67.9 2.6 13.4 6.3 8.4 No Class 169676 1.3 65.6 2.4 10.9 7.1 12.7 Primary 474069 1.2 68.2 3.0 13.1 6.7 7.8 Junior Secondary 301135 0.9 65.5 1.9 15.2 9.1 7.5 Secondary/Higher Secondary 512423 1.7 64.0 2.9 15.9 6.0 9.5 Graduate 167545 2.5 77.0 2.5 10.1 2.3 5.6 Masters and Higher 114289 2.4 80.0 1.7 7.7 2.5 5.6
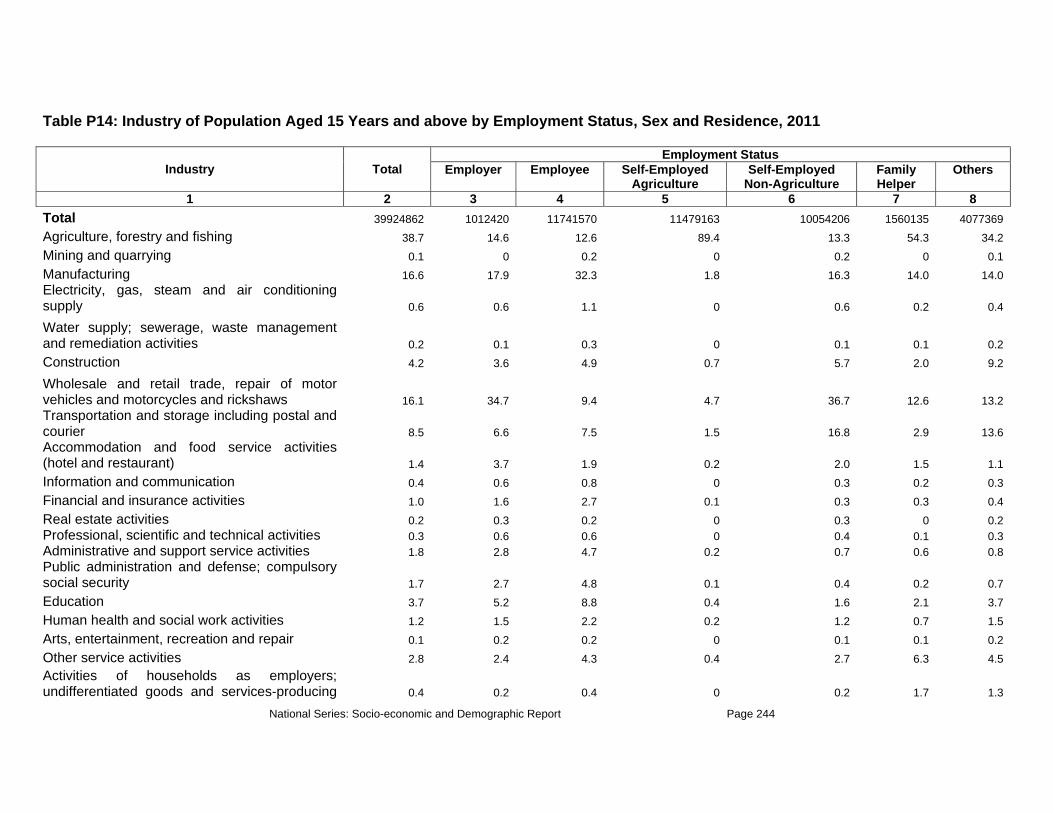
National Series: Socio-economic and Demographic Report Page 244
Table P14: Industry of Population Aged 15 Years and above by Employment Status, Sex and Residence, 2011
Industry Total Employment Status
Employer Employee Self-Employed Agriculture
Self-Employed Non-Agriculture
Family Helper
Others
1 2 3 4 5 6 7 8Total 39924862 1012420 11741570 11479163 10054206 1560135 4077369 Agriculture, forestry and fishing 38.7 14.6 12.6 89.4 13.3 54.3 34.2 Mining and quarrying 0.1 0 0.2 0 0.2 0 0.1 Manufacturing 16.6 17.9 32.3 1.8 16.3 14.0 14.0 Electricity, gas, steam and air conditioning supply 0.6 0.6 1.1 0 0.6 0.2 0.4
Water supply; sewerage, waste management and remediation activities 0.2 0.1 0.3 0 0.1 0.1 0.2 Construction 4.2 3.6 4.9 0.7 5.7 2.0 9.2
Wholesale and retail trade, repair of motor vehicles and motorcycles and rickshaws 16.1 34.7 9.4 4.7 36.7 12.6 13.2 Transportation and storage including postal and courier 8.5 6.6 7.5 1.5 16.8 2.9 13.6 Accommodation and food service activities (hotel and restaurant) 1.4 3.7 1.9 0.2 2.0 1.5 1.1 Information and communication 0.4 0.6 0.8 0 0.3 0.2 0.3 Financial and insurance activities 1.0 1.6 2.7 0.1 0.3 0.3 0.4 Real estate activities 0.2 0.3 0.2 0 0.3 0 0.2 Professional, scientific and technical activities 0.3 0.6 0.6 0 0.4 0.1 0.3 Administrative and support service activities 1.8 2.8 4.7 0.2 0.7 0.6 0.8 Public administration and defense; compulsory social security 1.7 2.7 4.8 0.1 0.4 0.2 0.7 Education 3.7 5.2 8.8 0.4 1.6 2.1 3.7 Human health and social work activities 1.2 1.5 2.2 0.2 1.2 0.7 1.5 Arts, entertainment, recreation and repair 0.1 0.2 0.2 0 0.1 0.1 0.2 Other service activities 2.8 2.4 4.3 0.4 2.7 6.3 4.5 Activities of households as employers; undifferentiated goods and services-producing 0.4 0.2 0.4 0 0.2 1.7 1.3

National Series: Socio-economic and Demographic Report Page 245
Table P14: Industry of Population Aged 15 Years and above by Employment Status, Sex and Residence, 2011
Industry Total Employment Status
Employer Employee Self-Employed Agriculture
Self-Employed Non-Agriculture
Family Helper
Others
1 2 3 4 5 6 7 8activities of households for own use
Activities of exterritorial organizations and bodies 0.1 0.1 0.1 0 0 0 0 Male 34752440 925312 9196272 10984917 9173572 970454 3501913 Agriculture, forestry and fishing 41.9 14.8 14.7 90.0 13.6 64.5 37.0 Mining and quarrying 0.1 0 0.2 0 0.2 0.0 0.1 Manufacturing 13.4 16.3 28.3 1.5 13.7 6.9 11.6 Electricity, gas, steam and air conditioning supply 0.6 0.6 1.3 0 0.6 0.3 0.5
Water supply; sewerage, waste management and remediation activities 0.1 0.1 0.3 0 0.1 0.1 0.2 Construction 4.4 3.8 5.6 0.6 5.9 2.2 9.7 Wholesale and retail trade, repair of motor vehicles and motorcycles and rickshaws 17.5 37.0 11.2 4.7 38.5 16.3 14.6 Transportation and storage including postal and courier 9.6 7.0 9.2 1.6 18.1 4.3 15.5
Accommodation and food service activities (hotel and restaurant) 1.4 3.9 2.0 0.2 2.0 1.6 1.1 Information and communication 0.4 0.7 0.9 0 0.3 0.2 0.3 Financial and insurance activities 0.9 1.6 2.8 0.1 0.3 0.2 0.3 Real estate activities 0.2 0.3 0.2 0 0.3 0 0.3 Professional, scientific and technical activities 0.4 0.6 0.7 0 0.4 0.1 0.3 Administrative and support service activities 1.7 2.8 5.1 0.2 0.7 0.3 0.8 Public administration and defense; compulsory social security 1.7 2.7 5.5 0.1 0.4 0.2 0.6 Education 2.8 4.3 7.5 0.4 1.1 1.1 2.6

National Series: Socio-economic and Demographic Report Page 246
Table P14: Industry of Population Aged 15 Years and above by Employment Status, Sex and Residence, 2011
Industry Total Employment Status
Employer Employee Self-Employed Agriculture
Self-Employed Non-Agriculture
Family Helper
Others
1 2 3 4 5 6 7 8Human health and social work activities 1.0 1.2 1.6 0.2 1.1 0.3 1.2 Arts, entertainment, recreation and repair 0.1 0.2 0.2 0 0.1 0.1 0.2 Other service activities 1.6 2.0 2.4 0.3 2.3 1.0 2.4 Activities of households as employers; undifferentiated goods and services-producing activities of households for own use 0.1 0 0.1 0 0.1 0.2 0.4 Activities of exterritorial organizations and bodies 0.1 0.1 0.2 0 0 0 0 Female 5172422 87107 2545298 494246 880634 589681 575456 Agriculture, forestry and fishing 17.9 12.1 5.4 76.8 9.3 37.6 16.7 Mining and quarrying 0.1 0.0 0.2 0.1 0.1 0 0 Manufacturing 38.1 34.3 46.8 10.2 43.3 25.7 28.6 Electricity, gas, steam and air conditioning supply 0.3 0.1 0.4 0.1 0.3 0.1 0.4
Water supply; sewerage, waste management and remediation activities 0.2 0.2 0.2 0.0 0.2 0.2 0.3 Construction 2.6 1.6 2.0 1.5 3.7 1.6 5.7
Wholesale and retail trade, repair of motor vehicles and motorcycles and rickshaws 6.3 10.9 2.9 4.1 17.8 6.5 4.8 Transportation and storage including postal and courier 1.5 2.6 1.2 0.4 2.9 0.5 2.3 Accommodation and food service activities (hotel and restaurant) 1.4 2.4 1.4 0.1 2.5 1.4 0.8 Information and communication 0.3 0 0.5 0.0 0.3 0.1 0.2 Financial and insurance activities 1.5 1.3 2.3 0.3 0.7 0.6 0.9 Real estate activities 0 0.0 0 0.0 0 0.0 0.0 Professional, scientific and technical activities 0.2 0.2 0.2 0.1 0.3 0.1 0.2

National Series: Socio-economic and Demographic Report Page 247
Table P14: Industry of Population Aged 15 Years and above by Employment Status, Sex and Residence, 2011
Industry Total Employment Status
Employer Employee Self-Employed Agriculture
Self-Employed Non-Agriculture
Family Helper
Others
1 2 3 4 5 6 7 8Administrative and support service activities 2.2 3.1 3.4 0.4 1.3 1.1 0.8
Public administration and defense; compulsory social security 1.4 3.2 2.3 0.2 0.5 0.4 0.8 Education 9.6 14.9 13.4 1.5 6.3 3.6 9.9 Human health and social work activities 3.1 4.6 4.3 1.0 1.8 1.4 2.8 Arts, entertainment, recreation and repair 0.1 0.0 0.1 0 0.2 0 0.3 Other service activities 10.7 6.4 11.4 2.6 6.9 14.9 17.3 Activities of households as employers; undifferentiated goods and services-producing activities of households for own use 2.3 2.1 1.4 0.6 1.5 4.2 7.1
Activities of exterritorial organizations and bodies 0.1 0.0 0.1 0 0 0 0.1 Rural Total 31233433 648124 7400171 10767149 7671937 1341151 3404902 Agriculture, forestry and fishing 47.0 20.4 18.6 91.1 15.9 60.5 39.2 Mining and quarrying 0.2 0 0.3 0 0.3 0 0.1 Manufacturing 14.7 17.2 32.1 1.6 16.8 12.9 13.7
Electricity, gas, steam and air conditioning supply 0.4 0.6 0.8 0 0.5 0.2 0.3
Water supply; sewerage, waste management and remediation activities 0.1 0.1 0.2 0 0.1 0.1 0.2 Construction 4.0 3.3 5.6 0.6 5.6 2.1 8.8
Wholesale and retail trade, repair of motor vehicles and motorcycles and rickshaws 14.2 31.1 8.2 3.8 34.4 10.8 12.3 Transportation and storage including postal and courier 8.1 6.8 7.2 1.4 17.2 2.7 12.7 Accommodation and food service activities 1.2 3.1 1.9 0.1 1.8 1.0 0.9
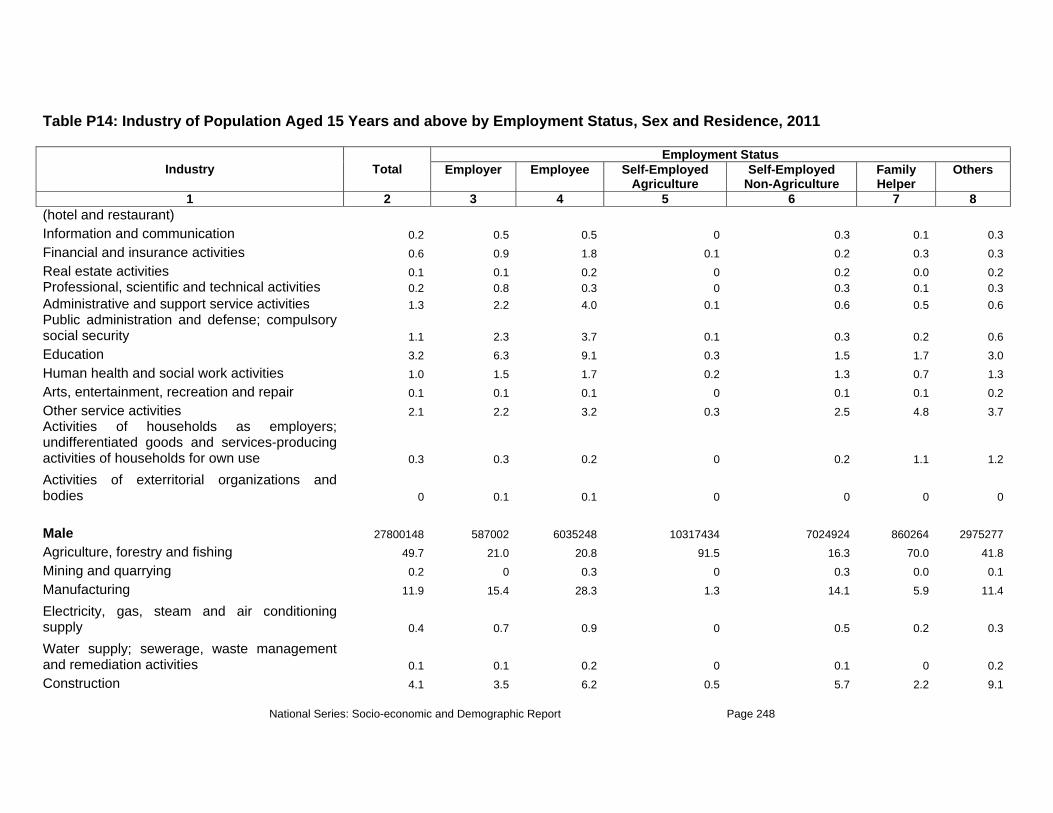
National Series: Socio-economic and Demographic Report Page 248
Table P14: Industry of Population Aged 15 Years and above by Employment Status, Sex and Residence, 2011
Industry Total Employment Status
Employer Employee Self-Employed Agriculture
Self-Employed Non-Agriculture
Family Helper
Others
1 2 3 4 5 6 7 8(hotel and restaurant) Information and communication 0.2 0.5 0.5 0 0.3 0.1 0.3 Financial and insurance activities 0.6 0.9 1.8 0.1 0.2 0.3 0.3 Real estate activities 0.1 0.1 0.2 0 0.2 0.0 0.2 Professional, scientific and technical activities 0.2 0.8 0.3 0 0.3 0.1 0.3 Administrative and support service activities 1.3 2.2 4.0 0.1 0.6 0.5 0.6 Public administration and defense; compulsory social security 1.1 2.3 3.7 0.1 0.3 0.2 0.6 Education 3.2 6.3 9.1 0.3 1.5 1.7 3.0 Human health and social work activities 1.0 1.5 1.7 0.2 1.3 0.7 1.3 Arts, entertainment, recreation and repair 0.1 0.1 0.1 0 0.1 0.1 0.2 Other service activities 2.1 2.2 3.2 0.3 2.5 4.8 3.7 Activities of households as employers; undifferentiated goods and services-producing activities of households for own use 0.3 0.3 0.2 0 0.2 1.1 1.2
Activities of exterritorial organizations and bodies 0 0.1 0.1 0 0 0 0 Male 27800148 587002 6035248 10317434 7024924 860264 2975277 Agriculture, forestry and fishing 49.7 21.0 20.8 91.5 16.3 70.0 41.8 Mining and quarrying 0.2 0 0.3 0 0.3 0.0 0.1 Manufacturing 11.9 15.4 28.3 1.3 14.1 5.9 11.4
Electricity, gas, steam and air conditioning supply 0.4 0.7 0.9 0 0.5 0.2 0.3
Water supply; sewerage, waste management and remediation activities 0.1 0.1 0.2 0 0.1 0 0.2 Construction 4.1 3.5 6.2 0.5 5.7 2.2 9.1

National Series: Socio-economic and Demographic Report Page 249
Table P14: Industry of Population Aged 15 Years and above by Employment Status, Sex and Residence, 2011
Industry Total Employment Status
Employer Employee Self-Employed Agriculture
Self-Employed Non-Agriculture
Family Helper
Others
1 2 3 4 5 6 7 8
Wholesale and retail trade, repair of motor vehicles and motorcycles and rickshaws 15.2 33.3 9.4 3.9 36.2 13.5 13.4 Transportation and storage including postal and courier 8.9 7.4 8.6 1.4 18.5 4.0 14.2 Accommodation and food service activities (hotel and restaurant) 1.2 3.2 2.0 0.1 1.9 1.1 1.0 Information and communication 0.2 0.6 0.6 0 0.3 0.1 0.3 Financial and insurance activities 0.5 0.9 1.9 0.1 0.2 0.2 0.2 Real estate activities 0.1 0.1 0.2 0 0.2 0.0 0.3 Professional, scientific and technical activities 0.2 0.8 0.4 0 0.3 0.1 0.3 Administrative and support service activities 1.2 2.3 4.2 0.1 0.5 0.3 0.6 Public administration and defense; compulsory social security 1.1 2.2 4.1 0.1 0.3 0.1 0.5 Education 2.5 5.0 8.0 0.3 1.1 0.9 2.3 Human health and social work activities 0.8 1.2 1.4 0.2 1.3 0.3 1.2 Arts, entertainment, recreation and repair 0.1 0.2 0.1 0 0.1 0.1 0.2 Other service activities 1.4 2.0 2.2 0.2 2.1 1.0 2.2 Activities of households as employers; undifferentiated goods and services-producing activities of households for own use 0.1 0.1 0 0 0 0.1 0.4 Activities of exterritorial organizations and bodies 0 0.1 0.1 0 0 0.1 0 Female 3433286 61122 1364923 449715 647013 480887 429625 Agriculture, forestry and fishing 25.3 15.1 8.9 80.5 11.7 43.7 21.3 Mining and quarrying 0.2 0.0 0.2 0.1 0.2 0 0 Manufacturing 37.1 34.8 48.7 9.3 45.9 25.6 29.6

National Series: Socio-economic and Demographic Report Page 250
Table P14: Industry of Population Aged 15 Years and above by Employment Status, Sex and Residence, 2011
Industry Total Employment Status
Employer Employee Self-Employed Agriculture
Self-Employed Non-Agriculture
Family Helper
Others
1 2 3 4 5 6 7 8
Electricity, gas, steam and air conditioning supply 0.2 0.0 0.2 0.0 0.2 0.2 0.2
Water supply; sewerage, waste management and remediation activities 0.2 0.3 0.2 0.0 0.2 0.2 0.4 Construction 3.3 2.1 2.9 1.5 4.0 1.9 6.7
Wholesale and retail trade, repair of motor vehicles and motorcycles and rickshaws 6.1 9.5 2.9 3.2 15.5 6.0 4.6 Transportation and storage including postal and courier 1.5 0.7 1.3 0.4 3.0 0.5 2.4
Accommodation and food service activities (hotel and restaurant) 1.1 2.5 1.4 0.0 1.6 0.9 0.7 Information and communication 0.2 0.0 0.2 0.0 0.3 0.1 0.2 Financial and insurance activities 0.9 0.7 1.5 0.1 0.6 0.6 0.8 Real estate activities 0 0.0 0.0 0.0 0 0.0 0.0 Professional, scientific and technical activities 0.1 0.3 0.1 0.1 0.1 0 0.2 Administrative and support service activities 1.9 1.1 3.5 0.4 1.1 0.9 0.5
Public administration and defense; compulsory social security 0.9 2.9 1.6 0.2 0.4 0.4 0.8 Education 8.5 17.9 13.9 0.9 5.7 3.1 8.2 Human health and social work activities 2.2 4.8 3.3 0.7 1.5 1.3 2.2 Arts, entertainment, recreation and repair 0.1 0.0 0.1 0 0.2 0 0.2 Other service activities 7.9 4.3 7.7 2.0 6.3 11.5 13.8 Activities of households as employers; undifferentiated goods and services-producing activities of households for own use 2.1 2.9 1.2 0.5 1.6 2.8 7.0 Activities of exterritorial organizations and bodies 0.1 0.0 0.1 0 0 0 0.1 Urban

National Series: Socio-economic and Demographic Report Page 251
Table P14: Industry of Population Aged 15 Years and above by Employment Status, Sex and Residence, 2011
Industry Total Employment Status
Employer Employee Self-Employed Agriculture
Self-Employed Non-Agriculture
Family Helper
Others
1 2 3 4 5 6 7 8Total 8691428 364296 4341399 712014 2382269 218984 672468 Agriculture, forestry and fishing 9.1 4.1 2.4 64.8 4.7 16.4 8.7 Mining and quarrying 0.1 0.0 0.1 0.0 0 0.0 0.0 Manufacturing 23.3 19.1 32.7 5.1 14.7 20.6 15.9
Electricity, gas, steam and air conditioning supply 1.2 0.4 1.7 0.2 0.9 0.4 1.2
Water supply; sewerage, waste management and remediation activities 0.3 0.2 0.4 0 0.2 0.1 0.2 Construction 4.7 4.1 3.6 1.6 6.3 1.4 11.2 Wholesale and retail trade, repair of motor vehicles and motorcycles and rickshaws 22.9 41.2 11.4 17.6 44.1 23.7 17.9 Transportation and storage including postal and courier 10.3 6.4 8.0 3.8 15.4 3.6 18.3
Accommodation and food service activities (hotel and restaurant) 2.2 4.9 1.9 1.1 2.6 4.5 1.7 Information and communication 1.0 0.8 1.4 0.3 0.5 0.3 0.5 Financial and insurance activities 2.5 2.8 4.3 0.3 0.6 0.3 0.9 Real estate activities 0.4 0.5 0.2 0.2 0.6 0.1 0.2 Professional, scientific and technical activities 0.7 0.1 1.0 0.2 0.7 0.2 0.4 Administrative and support service activities 3.6 3.8 5.8 0.7 1.2 1.2 1.7
Public administration and defense; compulsory social security 3.8 3.5 6.7 0.4 0.6 0.5 1.0 Education 5.5 3.4 8.2 1.4 2.0 4.5 6.9 Human health and social work activities 2.1 1.4 3.0 0.7 0.9 1.1 2.3 Arts, entertainment, recreation and repair 0.2 0.4 0.3 0 0.2 0.0 0.4 Other service activities 5.3 2.8 6.1 1.2 3.4 15.6 8.7
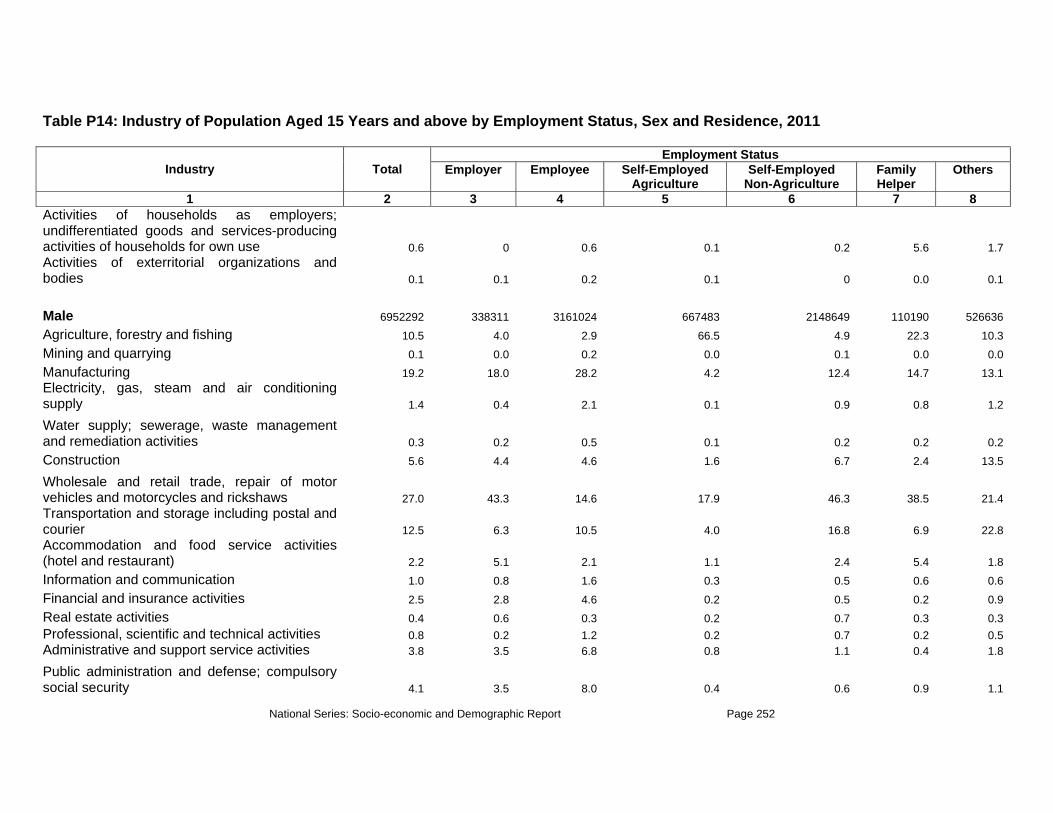
National Series: Socio-economic and Demographic Report Page 252
Table P14: Industry of Population Aged 15 Years and above by Employment Status, Sex and Residence, 2011
Industry Total Employment Status
Employer Employee Self-Employed Agriculture
Self-Employed Non-Agriculture
Family Helper
Others
1 2 3 4 5 6 7 8Activities of households as employers; undifferentiated goods and services-producing activities of households for own use 0.6 0 0.6 0.1 0.2 5.6 1.7 Activities of exterritorial organizations and bodies 0.1 0.1 0.2 0.1 0 0.0 0.1 Male 6952292 338311 3161024 667483 2148649 110190 526636 Agriculture, forestry and fishing 10.5 4.0 2.9 66.5 4.9 22.3 10.3 Mining and quarrying 0.1 0.0 0.2 0.0 0.1 0.0 0.0 Manufacturing 19.2 18.0 28.2 4.2 12.4 14.7 13.1 Electricity, gas, steam and air conditioning supply 1.4 0.4 2.1 0.1 0.9 0.8 1.2
Water supply; sewerage, waste management and remediation activities 0.3 0.2 0.5 0.1 0.2 0.2 0.2 Construction 5.6 4.4 4.6 1.6 6.7 2.4 13.5
Wholesale and retail trade, repair of motor vehicles and motorcycles and rickshaws 27.0 43.3 14.6 17.9 46.3 38.5 21.4 Transportation and storage including postal and courier 12.5 6.3 10.5 4.0 16.8 6.9 22.8 Accommodation and food service activities (hotel and restaurant) 2.2 5.1 2.1 1.1 2.4 5.4 1.8 Information and communication 1.0 0.8 1.6 0.3 0.5 0.6 0.6 Financial and insurance activities 2.5 2.8 4.6 0.2 0.5 0.2 0.9 Real estate activities 0.4 0.6 0.3 0.2 0.7 0.3 0.3 Professional, scientific and technical activities 0.8 0.2 1.2 0.2 0.7 0.2 0.5 Administrative and support service activities 3.8 3.5 6.8 0.8 1.1 0.4 1.8
Public administration and defense; compulsory social security 4.1 3.5 8.0 0.4 0.6 0.9 1.1

National Series: Socio-economic and Demographic Report Page 253
Table P14: Industry of Population Aged 15 Years and above by Employment Status, Sex and Residence, 2011
Industry Total Employment Status
Employer Employee Self-Employed Agriculture
Self-Employed Non-Agriculture
Family Helper
Others
1 2 3 4 5 6 7 8Education 4.0 3.0 6.4 1.1 1.3 3.3 4.7 Human health and social work activities 1.5 1.2 2.2 0.6 0.8 0.6 1.6 Arts, entertainment, recreation and repair 0.3 0.4 0.3 0 0.2 0.0 0.4 Other service activities 2.5 2.2 2.6 0.7 2.9 1.5 3.5 Activities of households as employers; undifferentiated goods and services-producing activities of households for own use 0.2 0.0 0.2 0 0.1 0.9 0.2
Activities of exterritorial organizations and bodies 0.1 0.1 0.2 0.1 0 0.0 0.1 Female 1739136 25985 1180375 44531 233621 108794 145831 Agriculture, forestry and fishing 3.2 5.0 1.2 39.2 2.9 10.4 3.1 Mining and quarrying 0 0.0 0.1 0.0 0.0 0.0 0.0 Manufacturing 39.9 33.2 44.6 18.9 35.9 26.4 25.7
Electricity, gas, steam and air conditioning supply 0.6 0.3 0.7 1.4 0.5 0.0 0.9 Water supply; sewerage, waste management and remediation activities 0.1 0.0 0.2 0.0 0.3 0.0 0.0 Construction 1.4 0.2 1.0 1.8 3.0 0.3 2.8
Wholesale and retail trade, repair of motor vehicles and motorcycles and rickshaws 6.7 14.4 2.9 13.2 24.2 8.6 5.4 Transportation and storage including postal and courier 1.5 7.0 1.1 1.0 2.8 0.2 2.0
Accommodation and food service activities (hotel and restaurant) 2.1 2.0 1.5 0.9 5.1 3.5 1.3 Information and communication 0.6 0.2 0.9 0.0 0.2 0.0 0 Financial and insurance activities 2.6 2.6 3.3 2.3 1.0 0.4 1.0
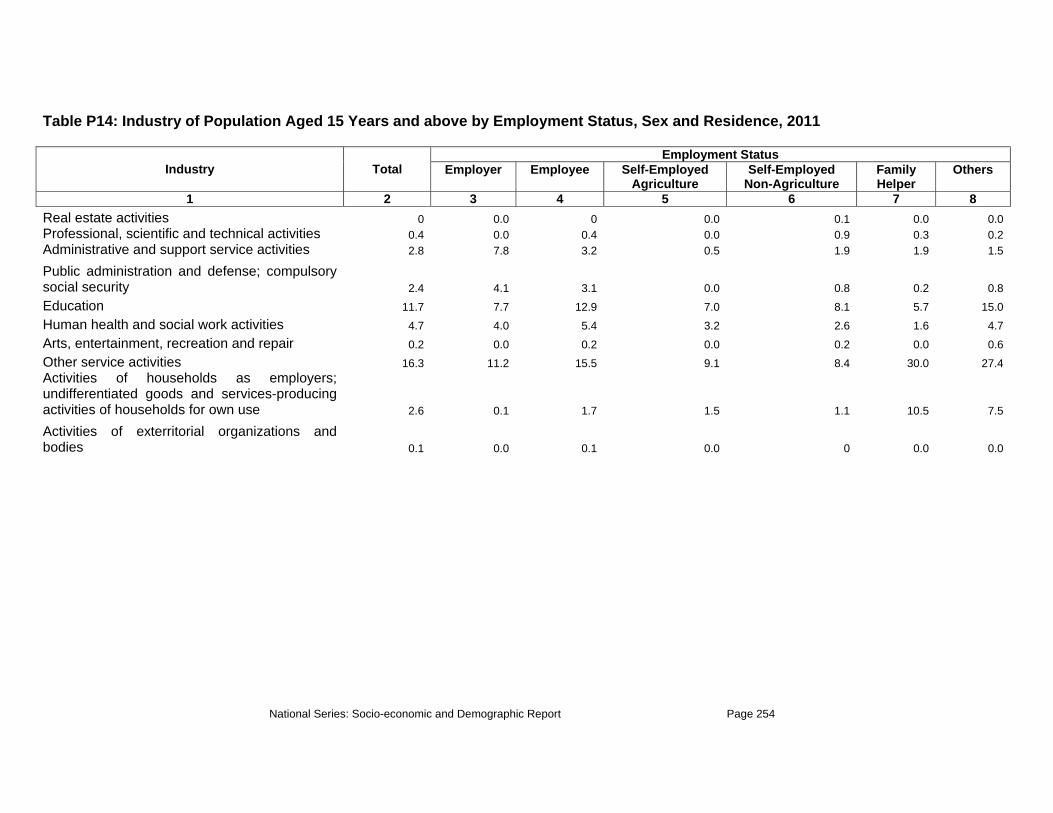
National Series: Socio-economic and Demographic Report Page 254
Table P14: Industry of Population Aged 15 Years and above by Employment Status, Sex and Residence, 2011
Industry Total Employment Status
Employer Employee Self-Employed Agriculture
Self-Employed Non-Agriculture
Family Helper
Others
1 2 3 4 5 6 7 8Real estate activities 0 0.0 0 0.0 0.1 0.0 0.0 Professional, scientific and technical activities 0.4 0.0 0.4 0.0 0.9 0.3 0.2 Administrative and support service activities 2.8 7.8 3.2 0.5 1.9 1.9 1.5
Public administration and defense; compulsory social security 2.4 4.1 3.1 0.0 0.8 0.2 0.8 Education 11.7 7.7 12.9 7.0 8.1 5.7 15.0 Human health and social work activities 4.7 4.0 5.4 3.2 2.6 1.6 4.7 Arts, entertainment, recreation and repair 0.2 0.0 0.2 0.0 0.2 0.0 0.6 Other service activities 16.3 11.2 15.5 9.1 8.4 30.0 27.4 Activities of households as employers; undifferentiated goods and services-producing activities of households for own use 2.6 0.1 1.7 1.5 1.1 10.5 7.5
Activities of exterritorial organizations and bodies 0.1 0.0 0.1 0.0 0 0.0 0.0
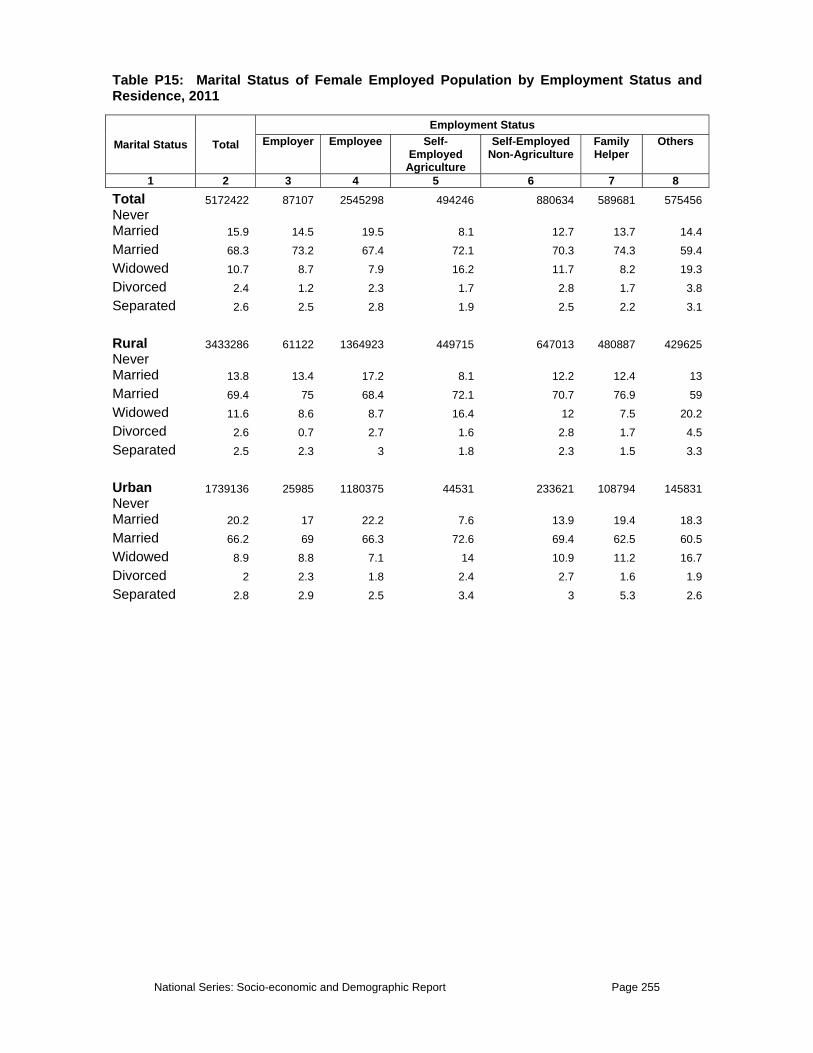
National Series: Socio-economic and Demographic Report Page 255
Table P15: Marital Status of Female Employed Population by Employment Status and Residence, 2011
Marital Status Total
Employment Status Employer Employee Self-
Employed Agriculture
Self-Employed Non-Agriculture
Family Helper
Others
1 2 3 4 5 6 7 8Total 5172422 87107 2545298 494246 880634 589681 575456 Never Married 15.9 14.5 19.5 8.1 12.7 13.7 14.4 Married 68.3 73.2 67.4 72.1 70.3 74.3 59.4 Widowed 10.7 8.7 7.9 16.2 11.7 8.2 19.3 Divorced 2.4 1.2 2.3 1.7 2.8 1.7 3.8 Separated 2.6 2.5 2.8 1.9 2.5 2.2 3.1 Rural 3433286 61122 1364923 449715 647013 480887 429625 Never Married 13.8 13.4 17.2 8.1 12.2 12.4 13 Married 69.4 75 68.4 72.1 70.7 76.9 59 Widowed 11.6 8.6 8.7 16.4 12 7.5 20.2 Divorced 2.6 0.7 2.7 1.6 2.8 1.7 4.5 Separated 2.5 2.3 3 1.8 2.3 1.5 3.3 Urban 1739136 25985 1180375 44531 233621 108794 145831 Never Married 20.2 17 22.2 7.6 13.9 19.4 18.3 Married 66.2 69 66.3 72.6 69.4 62.5 60.5 Widowed 8.9 8.8 7.1 14 10.9 11.2 16.7 Divorced 2 2.3 1.8 2.4 2.7 1.6 1.9 Separated 2.8 2.9 2.5 3.4 3 5.3 2.6
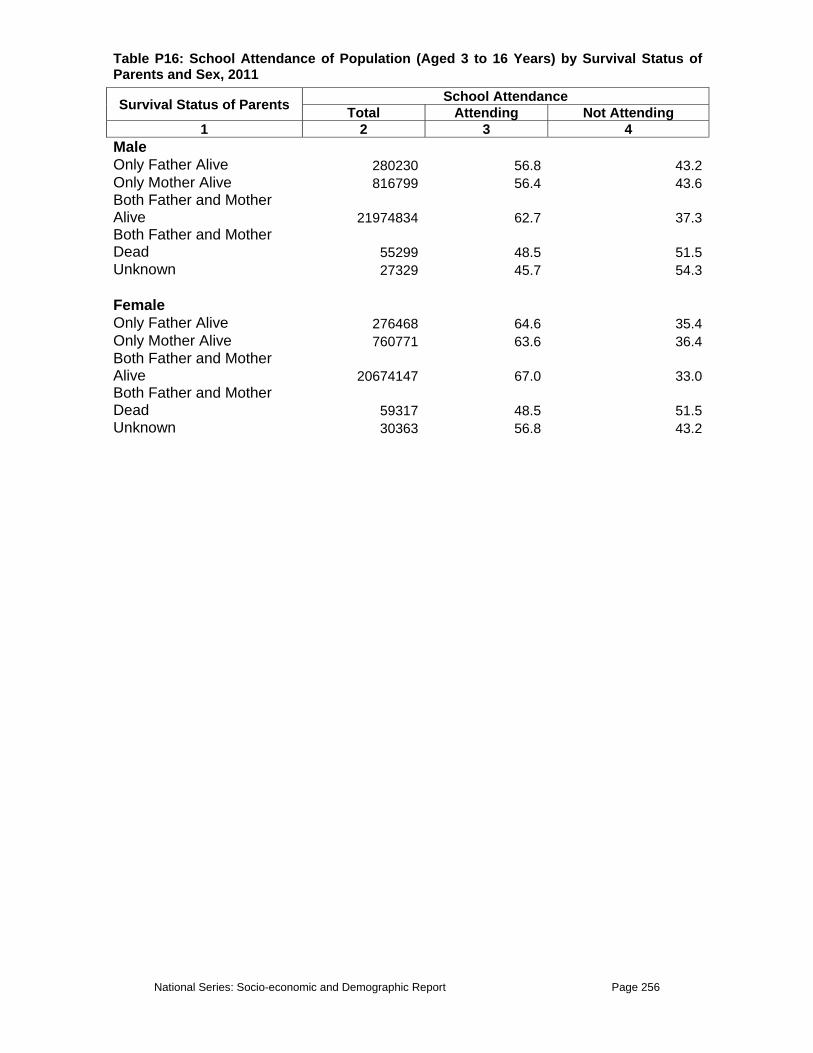
National Series: Socio-economic and Demographic Report Page 256
Table P16: School Attendance of Population (Aged 3 to 16 Years) by Survival Status of Parents and Sex, 2011
Survival Status of Parents School Attendance Total Attending Not Attending
1 2 3 4 Male Only Father Alive 280230 56.8 43.2Only Mother Alive 816799 56.4 43.6Both Father and Mother Alive 21974834 62.7 37.3Both Father and Mother Dead 55299 48.5 51.5Unknown 27329 45.7 54.3 Female Only Father Alive 276468 64.6 35.4Only Mother Alive 760771 63.6 36.4Both Father and Mother Alive 20674147 67.0 33.0Both Father and Mother Dead 59317 48.5 51.5Unknown 30363 56.8 43.2

National Series: Socio-economic and Demographic Report Page 257
FERTILITY TABLES TableF01 – TableF09
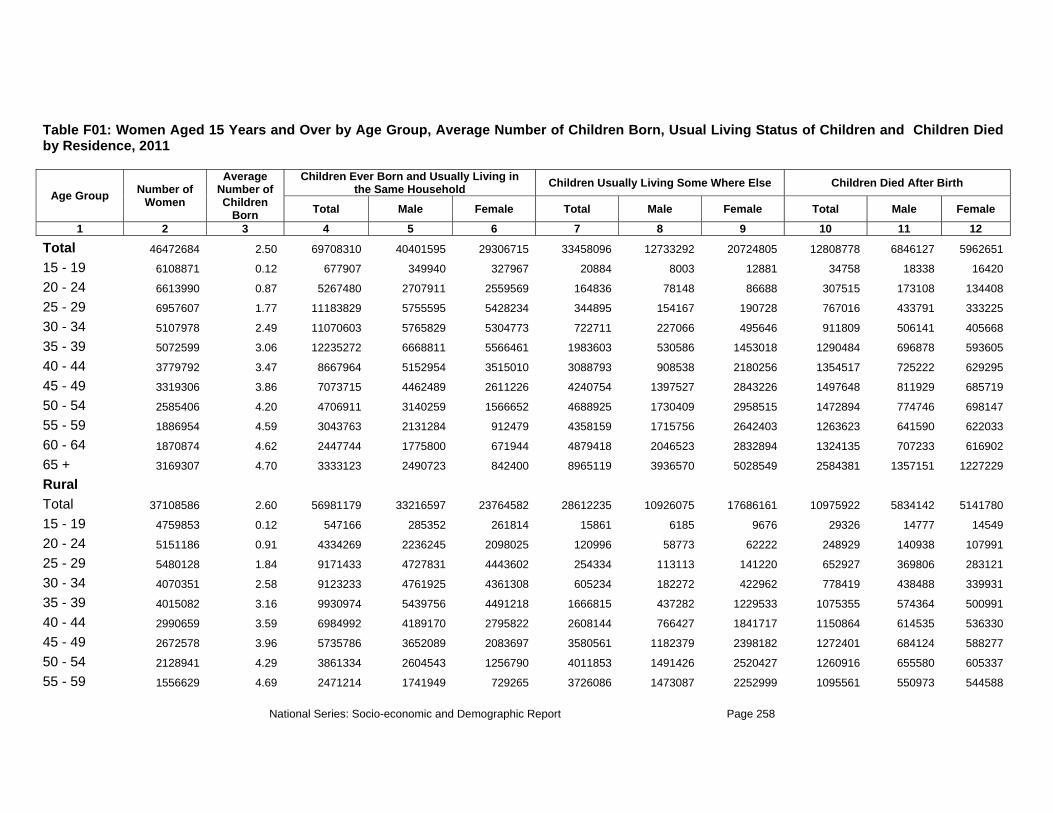
National Series: Socio-economic and Demographic Report Page 258
Table F01: Women Aged 15 Years and Over by Age Group, Average Number of Children Born, Usual Living Status of Children and Children Died by Residence, 2011
Age Group Number of Women
Average Number of Children
Born
Children Ever Born and Usually Living in the Same Household Children Usually Living Some Where Else Children Died After Birth
Total Male Female Total Male Female Total Male Female
1 2 3 4 5 6 7 8 9 10 11 12
Total 46472684 2.50 69708310 40401595 29306715 33458096 12733292 20724805 12808778 6846127 5962651
15 - 19 6108871 0.12 677907 349940 327967 20884 8003 12881 34758 18338 16420
20 - 24 6613990 0.87 5267480 2707911 2559569 164836 78148 86688 307515 173108 134408
25 - 29 6957607 1.77 11183829 5755595 5428234 344895 154167 190728 767016 433791 333225
30 - 34 5107978 2.49 11070603 5765829 5304773 722711 227066 495646 911809 506141 405668
35 - 39 5072599 3.06 12235272 6668811 5566461 1983603 530586 1453018 1290484 696878 593605
40 - 44 3779792 3.47 8667964 5152954 3515010 3088793 908538 2180256 1354517 725222 629295
45 - 49 3319306 3.86 7073715 4462489 2611226 4240754 1397527 2843226 1497648 811929 685719
50 - 54 2585406 4.20 4706911 3140259 1566652 4688925 1730409 2958515 1472894 774746 698147
55 - 59 1886954 4.59 3043763 2131284 912479 4358159 1715756 2642403 1263623 641590 622033
60 - 64 1870874 4.62 2447744 1775800 671944 4879418 2046523 2832894 1324135 707233 616902
65 + 3169307 4.70 3333123 2490723 842400 8965119 3936570 5028549 2584381 1357151 1227229
Rural
Total 37108586 2.60 56981179 33216597 23764582 28612235 10926075 17686161 10975922 5834142 5141780
15 - 19 4759853 0.12 547166 285352 261814 15861 6185 9676 29326 14777 14549
20 - 24 5151186 0.91 4334269 2236245 2098025 120996 58773 62222 248929 140938 107991
25 - 29 5480128 1.84 9171433 4727831 4443602 254334 113113 141220 652927 369806 283121
30 - 34 4070351 2.58 9123233 4761925 4361308 605234 182272 422962 778419 438488 339931
35 - 39 4015082 3.16 9930974 5439756 4491218 1666815 437282 1229533 1075355 574364 500991
40 - 44 2990659 3.59 6984992 4189170 2795822 2608144 766427 1841717 1150864 614535 536330
45 - 49 2672578 3.96 5735786 3652089 2083697 3580561 1182379 2398182 1272401 684124 588277
50 - 54 2128941 4.29 3861334 2604543 1256790 4011853 1491426 2520427 1260916 655580 605337
55 - 59 1556629 4.69 2471214 1741949 729265 3726086 1473087 2252999 1095561 550973 544588

National Series: Socio-economic and Demographic Report Page 259
Table F01: Women Aged 15 Years and Over by Age Group, Average Number of Children Born, Usual Living Status of Children and Children Died by Residence, 2011
Age Group Number of Women
Average Number of Children
Born
Children Ever Born and Usually Living in the Same Household Children Usually Living Some Where Else Children Died After Birth
Total Male Female Total Male Female Total Male Female
1 2 3 4 5 6 7 8 9 10 11 12
60 - 64 1579152 4.70 2039490 1481092 558398 4216481 1775533 2440948 1162421 616269 546152
65 + 2704027 4.75 2781288 2096644 684644 7805871 3439598 4366273 2248802 1174288 1074514
Urban
Total 9364099 2.07 12727131 7184998 5542133 4845861 1807217 3038644 1832856 1011985 820871
15 - 19 1349018 0.10 130741 64588 66152 5023 1818 3205 5432 3561 1871
20 - 24 1462804 0.71 933210 471666 461544 43840 19375 24466 58586 32169 26417
25 - 29 1477479 1.50 2012396 1027764 984632 90561 41053 49508 114089 63984 50104
30 - 34 1037628 2.12 1947369 1003904 943465 117477 44793 72684 133390 67652 65738
35 - 39 1057516 2.68 2304298 1229054 1075244 316789 93304 223484 215129 122514 92614
40 - 44 789132 3.00 1682972 963784 719189 480649 142110 338539 203652 110687 92965
45 - 49 646728 3.44 1337929 810400 527529 660193 215148 445044 225246 127805 97442
50 - 54 456465 3.80 845577 535715 309862 677071 238983 438088 211978 119167 92811
55 - 59 330325 4.16 572549 389335 183214 632073 242670 389403 168062 90617 77445
60 - 64 291722 4.23 408254 294708 113546 662937 270991 391946 161713 90964 70749
65 + 465281 4.40 551835 394079 157756 1159247 496971 662276 335578 182863 152715
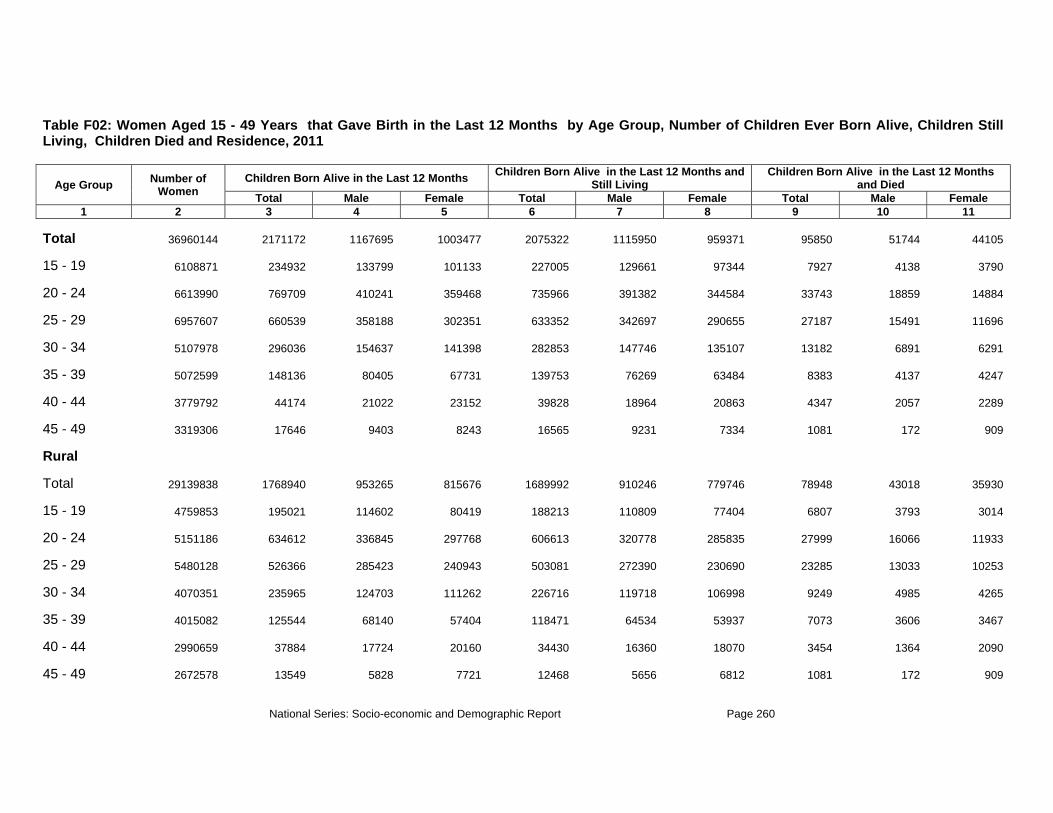
National Series: Socio-economic and Demographic Report Page 260
Table F02: Women Aged 15 - 49 Years that Gave Birth in the Last 12 Months by Age Group, Number of Children Ever Born Alive, Children Still Living, Children Died and Residence, 2011
Age Group Number of Women
Children Born Alive in the Last 12 Months Children Born Alive in the Last 12 Months and Still Living
Children Born Alive in the Last 12 Months and Died
Total Male Female Total Male Female Total Male Female 1 2 3 4 5 6 7 8 9 10 11
Total 36960144 2171172 1167695 1003477 2075322 1115950 959371 95850 51744 44105
15 - 19 6108871 234932 133799 101133 227005 129661 97344 7927 4138 3790
20 - 24 6613990 769709 410241 359468 735966 391382 344584 33743 18859 14884
25 - 29 6957607 660539 358188 302351 633352 342697 290655 27187 15491 11696
30 - 34 5107978 296036 154637 141398 282853 147746 135107 13182 6891 6291
35 - 39 5072599 148136 80405 67731 139753 76269 63484 8383 4137 4247
40 - 44 3779792 44174 21022 23152 39828 18964 20863 4347 2057 2289
45 - 49 3319306 17646 9403 8243 16565 9231 7334 1081 172 909
Rural
Total 29139838 1768940 953265 815676 1689992 910246 779746 78948 43018 35930
15 - 19 4759853 195021 114602 80419 188213 110809 77404 6807 3793 3014
20 - 24 5151186 634612 336845 297768 606613 320778 285835 27999 16066 11933
25 - 29 5480128 526366 285423 240943 503081 272390 230690 23285 13033 10253
30 - 34 4070351 235965 124703 111262 226716 119718 106998 9249 4985 4265
35 - 39 4015082 125544 68140 57404 118471 64534 53937 7073 3606 3467
40 - 44 2990659 37884 17724 20160 34430 16360 18070 3454 1364 2090
45 - 49 2672578 13549 5828 7721 12468 5656 6812 1081 172 909

National Series: Socio-economic and Demographic Report Page 261
Table F02: Women Aged 15 - 49 Years that Gave Birth in the Last 12 Months by Age Group, Number of Children Ever Born Alive, Children Still Living, Children Died and Residence, 2011
Age Group Number of Women
Children Born Alive in the Last 12 Months Children Born Alive in the Last 12 Months and Still Living
Children Born Alive in the Last 12 Months and Died
Total Male Female Total Male Female Total Male Female 1 2 3 4 5 6 7 8 9 10 11
Urban
Total 7820306 402231 214430 187801 385330 205704 179626 16902 8726 8175
15 - 19 1349018 39911 19196 20715 38791 18852 19940 1120 345 775
20 - 24 1462804 135097 73396 61700 129353 70604 58749 5744 2793 2951
25 - 29 1477479 134173 72765 61408 130272 70307 59965 3902 2458 1444
30 - 34 1037628 60071 29935 30136 56138 28028 28110 3933 1906 2027
35 - 39 1057516 22592 12265 10327 21282 11735 9547 1310 530 780
40 - 44 789132 6290 3298 2992 5397 2604 2793 893 694 199
45 - 49 646728 4097 3575 522 4097 3575 522 0 0 0

National Series: Socio-economic and Demographic Report Page 262
Table F03: Women Aged 15 - 49 Years who Gave Birth in the last 12 Months by Age Group, Residence and Persons Assisted in Delivery, 2011
Age Group
Number of Women
Persons Assisted in Delivery Skilled Unskilled
Birth Attendant
Other Total Doctor Nurse / Health Worker
Skilled Birth Attendant
1 2 3 4 5 6 7 8
Total 2171172 73.88 21.11 11.45 41.32 20.57 5.55
15 - 19 234932 74.72 21.60 12.57 40.55 20.29 4.99
20 - 24 769709 74.73 20.92 12.55 41.26 19.40 5.87
25 - 29 660539 73.96 22.65 11.27 40.04 20.43 5.61
30 - 34 296036 73.48 20.02 10.46 43.00 20.81 5.71
35 - 39 148136 70.83 18.58 8.86 43.39 24.48 4.69
40 - 44 44174 74.80 17.26 4.93 52.61 21.53 3.66
45 - 49 17646 51.93 14.08 9.71 28.14 41.77 6.30
Rural
Total 1768940 71.21 17.05 10.05 44.11 22.74 6.05
15 - 19 195021 73.63 20.26 10.95 42.42 21.64 4.74
20 - 24 634612 72.25 17.85 11.16 43.24 21.40 6.33
25 - 29 526366 71.06 17.74 10.22 43.10 22.55 6.40
30 - 34 235965 69.43 12.61 9.13 47.69 24.14 6.42
35 - 39 125544 68.27 15.12 6.47 46.68 26.63 5.11
40 - 44 37884 73.50 15.26 3.13 55.11 22.34 4.17
45 - 49 13549 45.05 6.70 6.64 31.71 49.39 5.55
Urban
Total 402231 85.60 38.96 17.60 29.04 11.04 3.37
15 - 19 39911 80.06 28.15 20.49 31.42 13.70 6.23
20 - 24 135097 86.31 35.33 19.04 31.94 9.97 3.72
25 - 29 134173 85.38 41.94 15.39 28.05 12.12 2.50
30 - 34 60071 89.37 49.11 15.68 24.58 7.73 2.91
35 - 39 22592 85.06 37.86 22.13 25.07 12.59 2.35
40 - 44 6290 82.71 29.32 15.81 37.58 16.67 0.62
45 - 49 4097 74.66 38.46 19.83 16.37 16.56 8.78

National Series: Socio-economic and Demographic Report Page 263
Table F04. Women Aged 15 - 49 Years Who Gave Birth in the Last 12 Months by Age Group, Residence and Place of Delivery, 2011
Age Group
Number of Women
Place of Delivery Government
Hospital/Health Clinic
NGO Health Care Clinic
Private Hospital/Health
Care Center At Home
1 2 3 4 5 6
Total 2171172 13.44 2.39 13.52 70.65
15 - 19 234932 15.06 1.59 13.75 69.60
20 - 24 769709 13.77 2.69 13.10 70.45
25 - 29 660539 13.91 2.21 15.05 68.83
30 - 34 296036 11.53 3.31 13.34 71.82
35 - 39 148136 11.35 1.51 11.66 75.48
40 - 44 44174 9.96 1.56 7.34 81.15
45 - 49 17646 17.45 0.59 6.08 75.87
Rural
Total 1768940 11.83 1.61 10.72 75.83
15 - 19 195021 13.24 0.95 12.83 72.97
20 - 24 634612 12.27 1.96 11.33 74.44
25 - 29 526366 12.08 1.63 11.77 74.52
30 - 34 235965 10.73 1.44 7.71 80.13
35 - 39 125544 9.16 1.66 7.98 81.20
40 - 44 37884 10.25 0.00 5.85 83.90
45 - 49 13549 10.12 0.77 2.90 86.20
Urban
Total 402231 20.48 5.81 25.83 47.88
15 - 19 39911 23.93 4.70 18.25 53.12
20 - 24 135097 20.82 6.11 21.38 51.69
25 - 29 134173 21.11 4.48 27.91 46.50
30 - 34 60071 14.70 10.64 35.49 39.17
35 - 39 22592 23.52 0.69 32.10 43.68
40 - 44 6290 8.22 10.93 16.28 64.56
45 - 49 4097 41.71 0.00 16.58 41.71

National Series: Socio-economic and Demographic Report Page 264
Table F05: Total Fertility Rates (TFRs) by Residence, 1982 – 2011
Year Residence Total Rural Urban
1 2 3 4 1982 5.24 5.26 4.191991 3.67 3.82 2.772004 2.63 2.78 2.252011 2.10 2.17 1.85
Table F06: Crude Birth Rates (CBRs) by Residence, 1982 – 2011
Residence Year
1982 1991 2004 2011
1 2 3 4 5
Bangladesh 34.4 28.5 22.2 17.88
Rural 35 30.5 22.8 17.91
Urban 29 24 20.6 17.74 Table F07: Age Specific Fertility Rates (ASFRs) by Residence, 1982 – 2011
Age
Year 1982 1991 2004 2011
Total Rural Urban Total Rural Urban Total Rural Urban Total Rural Urban
1 2 3 4 5 6 7 8 9 10 11 12 13
15-19 145 150 110 79 82 58 54 58 40 46 49 36 20-24 247 253 205 195 210 150 162 173 129 139 146 115 25-29 226 229 201 179 193 146 142 147 125 112 112 114 30-34 196 200 159 117 131 109 88 92 77 70 71 67 35-39 124 127 97 81 83 60 48 51 38 34 36 27 40-45 59 60 40 43 45 21 20 22 14 13 14 6 45-49 31 32 23 19 20 10 9 11 4 5 5 6

National Series: Socio-economic and Demographic Report Page 265
Table F08: Level of Education of Women Aged 15 - 49 Years who Gave Birth in the Last 12 Months by Persons Assisted in Delivery and Residence, 2011
Level of Education Number of Women
Persons Assisted in Delivery Skilled
Unskilled Birth
Attendant Others
Total Doctor Nurse/ Health Worker
Skilled Birth
Attendant Total 2171928 73.86 21.10 11.46 41.30 20.57 5.57 Never Attended 84423 64.35 9.02 8.69 46.64 30.22 5.43 Primary 689211 67.65 12.70 8.76 46.19 26.35 6.01 Junior Secondary 655509 75.43 17.86 11.78 45.79 18.25 6.32 Secondary 674581 78.44 31.02 14.13 33.29 16.91 4.65 Graduate 45764 85.26 50.53 12.10 22.63 10.98 3.76 Masters and Higher 22440 94.27 61.15 13.97 19.15 4.14 1.59 Rural Total 1769509 71.21 17.04 10.07 44.10 22.73 6.06 Never Attended 67351 62.88 6.51 5.97 50.40 31.93 5.19 Primary 594553 65.82 11.11 7.71 47.00 28.02 6.16 Junior Secondary 567727 74.11 16.69 10.65 46.77 19.19 6.70 Secondary 512419 74.96 24.97 12.49 37.50 19.74 5.31 Graduate 20234 76.90 34.20 10.68 32.02 15.75 7.34 Masters and Higher 7226 82.20 20.83 23.34 38.03 12.85 4.95 Urban Total 402419 85.55 38.94 17.59 29.02 11.04 3.40 Never Attended 17072 70.14 18.94 19.42 31.78 23.48 6.38 Primary 94658 79.06 22.66 15.34 41.06 15.85 5.09 Junior Secondary 87782 83.97 25.40 19.11 39.46 12.15 3.88 Secondary 162162 89.48 50.14 19.33 20.01 7.97 2.55 Graduate 25531 91.88 63.47 13.23 15.18 7.20 0.92 Masters and Higher 15214 100.01 80.30 9.53 10.18 0.00 0.00

National Series: Socio-economic and Demographic Report Page 266
Table F09: Age Specific Fertility Rates (ASFRs) and Total Fertility Rates (TFRs) by Division and Zila, 2011
Age Group Number of Women
Number of Live Births in
the Last 12 Months
Number of Births in the
Last 12 Months Still
Alive
Number of Death
Among the Births in the
Last 12 Months
ASFR TFR
1 2 3 4 5 6 7 Bangladesh Total 36960144 2577051 2484381 92670 70 2.1015 - 19 6108871 283719 274042 9677 46 20 - 24 6613990 917250 882316 34934 139 25 - 29 6957607 779507 752683 26824 112 30 - 34 5107978 357526 342275 15251 70 35 - 39 5072599 173460 168526 4934 3440 - 44 3779792 47872 46994 878 13 45 - 49 3319306 17717 17545 172 5 Barisal Division Total 2144238 134389 128682 5707 63 1.9415 - 19 358734 10104 9862 242 28 20 - 24 354758 44433 42319 2114 125 25 - 29 394634 43320 41441 1879 110 30 - 34 302364 22042 21244 798 73 35 - 39 305801 10960 10286 674 36 40 - 44 216645 2413 2413 0 11 45 - 49 211303 1118 1118 0 5 Barguna Zila Total 229635 11818 11549 269 51 1.5915 - 19 29007 627 627 0 2220 - 24 36616 4924 4834 90 134 25 - 29 44226 3581 3581 0 81 30 - 34 34647 1790 1611 179 52 35 - 39 34557 627 627 0 18 40 - 44 24978 0 0 0 0 45 - 49 25605 269 269 0 10 Barisal Zila Total 583878 37712 36376 1336 65 2.0915 - 19 103060 2943 2701 242 29 20 - 24 91133 12563 12108 455 138 25 - 29 94387 10717 10321 396 114 30 - 34 85086 6823 6764 59 80 35 - 39 87697 3814 3631 183 43 40 - 44 62682 668 668 0 1145 - 49 59833 183 183 0 3 Bhola Zila Total 458397 31293 28969 2324 68 1.9915 - 19 83965 2324 2324 0 28 20 - 24 84274 10534 9450 1084 125 25 - 29 90161 12238 11309 929 136 30 - 34 59488 4338 4028 310 73 35 - 39 63051 1239 1239 0 20 40 - 44 38729 310 310 0 8 45 - 49 38729 310 310 0 8 Jhalokati Zila Total 176072 8797 8337 460 50 1.61

National Series: Socio-economic and Demographic Report Page 267
Table F09: Age Specific Fertility Rates (ASFRs) and Total Fertility Rates (TFRs) by Division and Zila, 2011
Age Group Number of Women
Number of Live Births in
the Last 12 Months
Number of Births in the
Last 12 Months Still
Alive
Number of Death
Among the Births in the
Last 12 Months
ASFR TFR
1 2 3 4 5 6 7 15 - 19 30790 460 460 0 15 20 - 24 26851 3283 3086 197 122 25 - 29 32365 2692 2495 197 83 30 - 34 25341 1182 1182 0 47 35 - 39 23699 854 788 66 36 40 - 44 17791 328 328 0 18 45 - 49 19235 0 0 0 0 Patuakhali Zila Total 404214 28615 28040 575 71 2.1615 - 19 66003 2157 2157 0 33 20 - 24 66147 8772 8484 288 133 25 - 29 83546 9203 9059 144 110 30 - 34 55506 5464 5320 144 98 35 - 39 56944 2301 2301 0 40 40 - 44 40263 575 575 0 14 45 - 49 35805 144 144 0 4 Pirojpur Zila Total 292043 16154 15410 744 55 1.7715 - 19 45911 1594 1594 0 35 20 - 24 49737 4357 4357 0 88 25 - 29 49949 4889 4676 213 98 30 - 34 42297 2444 2338 106 58 35 - 39 39853 2125 1700 425 53 40 - 44 32201 531 531 0 17 45 - 49 32095 213 213 0 7 Chittagong Division Total 6987172 544979 521710 23269 78 2.3615 - 19 1361063 57189 55491 1698 42 20 - 24 1288142 189594 181186 8408 147 25 - 29 1249268 166376 161170 5206 133 30 - 34 920757 76999 71410 5589 84 35 - 39 901216 42036 40483 1553 47 40 - 44 668955 9728 9085 643 15 45 - 49 597771 3057 2885 172 5 Bandarban Zila Total 92915 7445 7314 131 80 2.5015 - 19 16071 262 262 0 16 20 - 24 15448 3378 3345 33 219 25 - 29 18039 1804 1771 33 100 30 - 34 12758 820 820 0 64 35 - 39 12725 853 820 33 67 40 - 44 10069 263 230 33 26 45 - 49 7806 66 66 0 8 Brahmanbaria Zila Total 646640 69659 67643 2016 108 3.3815 - 19 121175 7615 7391 224 63 20 - 24 101464 18367 17471 896 181 25 - 29 113336 24190 23742 448 213 30 - 34 97433 11871 11423 448 122

National Series: Socio-economic and Demographic Report Page 268
Table F09: Age Specific Fertility Rates (ASFRs) and Total Fertility Rates (TFRs) by Division and Zila, 2011
Age Group Number of Women
Number of Live Births in
the Last 12 Months
Number of Births in the
Last 12 Months Still
Alive
Number of Death
Among the Births in the
Last 12 Months
ASFR TFR
1 2 3 4 5 6 7 35 - 39 85786 4928 4928 0 57 40 - 44 71899 2240 2240 0 31 45 - 49 55548 448 448 0 8 Chandpur Zila Total 617217 43877 42617 1260 71 2.1615 - 19 118615 4619 4619 0 39 20 - 24 114206 18265 17215 1050 160 25 - 29 99301 11757 11757 0 118 30 - 34 86284 5878 5668 210 68 35 - 39 78727 2729 2729 0 35 40 - 44 56473 630 630 0 11 45 - 49 63611 0 0 0 0 Chittagong Zila Total 1960386 131160 128465 2695 67 1.9615 - 19 386537 13566 13341 225 35 20 - 24 379517 47751 46718 1033 126 25 - 29 348336 43526 42493 1033 125 30 - 34 260426 17604 17604 0 68 35 - 39 241273 6694 6694 0 28 40 - 44 194705 2019 1615 404 10 45 - 49 149592 0 0 0 0 Comilla Zila Total 1340514 105336 102276 3060 79 2.3615 - 19 271862 16609 16609 0 61 20 - 24 243889 34529 32781 1748 142 25 - 29 236896 30158 29721 437 127 30 - 34 156911 11364 10927 437 72 35 - 39 191440 11364 10927 437 59 40 - 44 119322 1311 1311 0 11 45 - 49 120196 0 0 0 0 Cox's Bazar Zila Total 495566 51503 48747 2756 104 3.0915 - 19 108518 3618 3273 345 33 20 - 24 96288 19464 18603 861 202 25 - 29 95771 17915 16881 1034 187 30 - 34 61149 4479 4479 0 73 35 - 39 55293 4307 3962 345 78 40 - 44 39618 517 517 0 13 45 - 49 38929 1206 1034 172 31 Feni Zila Total 346392 23644 22726 918 68 2.1415 - 19 67832 1722 1722 0 25 20 - 24 59683 11134 10904 230 187 25 - 29 59224 5394 5394 0 91 30 - 34 43844 3788 3099 689 86 35 - 39 45795 1148 1148 0 25 40 - 44 34088 230 230 0 7 45 - 49 35925 230 230 0 6 Khagrachhari Zila

National Series: Socio-economic and Demographic Report Page 269
Table F09: Age Specific Fertility Rates (ASFRs) and Total Fertility Rates (TFRs) by Division and Zila, 2011
Age Group Number of Women
Number of Live Births in
the Last 12 Months
Number of Births in the
Last 12 Months Still
Alive
Number of Death
Among the Births in the
Last 12 Months
ASFR TFR
1 2 3 4 5 6 7 Total 152875 11705 10766 939 77 2.3015 - 19 26721 1049 883 166 39 20 - 24 26556 4030 3699 331 152 25 - 29 30089 3754 3423 331 125 30 - 34 19544 1380 1325 55 71 35 - 39 23243 1215 1215 0 52 40 - 44 13582 221 166 55 16 45 - 49 13140 55 55 0 4 Lakshmipur Zila Total 436347 35818 34604 1214 82 2.5415 - 19 79377 2732 2732 0 34 20 - 24 79833 11231 11079 152 141 25 - 29 83172 11231 10624 607 135 30 - 34 56156 6982 6678 304 124 35 - 39 55397 2277 2277 0 41 40 - 44 43255 911 759 152 21 45 - 49 39157 455 455 0 12 Noakhali Zila Total 750572 55142 47018 8124 73 2.2915 - 19 140809 4924 4185 739 35 20 - 24 143763 17232 15263 1969 120 25 - 29 138348 13540 12309 1231 98 30 - 34 103391 11570 8124 3446 112 35 - 39 91575 6155 5416 739 67 40 - 44 71143 1231 1231 0 17 45 - 49 61542 492 492 0 8 Rangamati Zila Total 147746 9692 9534 158 66 1.9115 - 19 23545 474 474 0 20 20 - 24 27495 4213 4108 105 153 25 - 29 26758 3108 3055 53 116 30 - 34 22860 1264 1264 0 55 35 - 39 19963 369 369 0 18 40 - 44 14801 158 158 0 11 45 - 49 12325 105 105 0 9 Dhaka Division Total 12323770 865119 837070 28049 70 2.0815 - 19 2023006 90617 87402 3215 45 20 - 24 2292796 311645 300505 11140 136 25 - 29 2420744 259963 252841 7122 107 30 - 34 1647537 120198 114669 5529 73 35 - 39 1654611 60371 59328 1043 36 40 - 44 1253977 15641 15641 0 12 45 - 49 1031099 6685 6685 0 6 Dhaka Zila Total 3440732 223749 218250 5499 65 1.8615 - 19 613412 25684 25194 490 42 20 - 24 701590 80547 78347 2200 115 25 - 29 697285 67554 66334 1220 97

National Series: Socio-economic and Demographic Report Page 270
Table F09: Age Specific Fertility Rates (ASFRs) and Total Fertility Rates (TFRs) by Division and Zila, 2011
Age Group Number of Women
Number of Live Births in
the Last 12 Months
Number of Births in the
Last 12 Months Still
Alive
Number of Death
Among the Births in the
Last 12 Months
ASFR TFR
1 2 3 4 5 6 7 30 - 34 438055 32858 31268 1590 75 35 - 39 449998 14178 14178 0 32 40 - 44 304226 1100 1100 0 4 45 - 49 236165 1830 1830 0 8 Faridpur Zila Total 472443 29299 28601 698 62 1.8915 - 19 75689 2790 2790 0 37 20 - 24 76561 12731 12208 523 166 25 - 29 92605 8022 7848 174 87 30 - 34 69585 2965 2965 0 43 35 - 39 62957 2267 2267 0 36 40 - 44 56505 523 523 0 9 45 - 49 38542 0 0 0 0 Gazipur Zila Total 972051 52634 49935 2699 54 1.5415 - 19 151493 6073 5736 337 40 20 - 24 213574 21594 20244 1350 101 25 - 29 200753 13158 12146 1012 66 30 - 34 130574 7760 7760 0 59 35 - 39 119440 1350 1350 0 11 40 - 44 90086 2362 2362 0 26 45 - 49 66130 337 337 0 5 Gopalganj Zila Total 296616 23215 22697 518 78 2.3315 - 19 47156 2799 2695 104 59 20 - 24 55447 9120 8809 311 164 25 - 29 57727 6426 6322 104 111 30 - 34 40316 2176 2176 0 54 35 - 39 38658 1762 1762 0 46 40 - 44 29848 622 622 0 21 45 - 49 27464 311 311 0 11 Jamalpur Zila Total 572955 44506 43803 703 78 2.3115 - 19 82922 5856 5856 0 71 20 - 24 99787 19442 18974 468 195 25 - 29 111265 12883 12649 234 116 30 - 34 78705 3045 3045 0 39 35 - 39 85732 2577 2577 0 30 40 - 44 60200 703 703 0 12 45 - 49 54344 0 0 0 0 Kishoreganj Zila Total 671747 61872 58752 3120 92 2.8415 - 19 114904 7019 6239 780 61 20 - 24 107885 18977 18197 780 176 25 - 29 134142 20277 19497 780 151 30 - 34 92547 9619 8839 780 104 35 - 39 88388 2860 2860 0 32 40 - 44 76949 2340 2340 0 30 45 - 49 56932 780 780 0 14
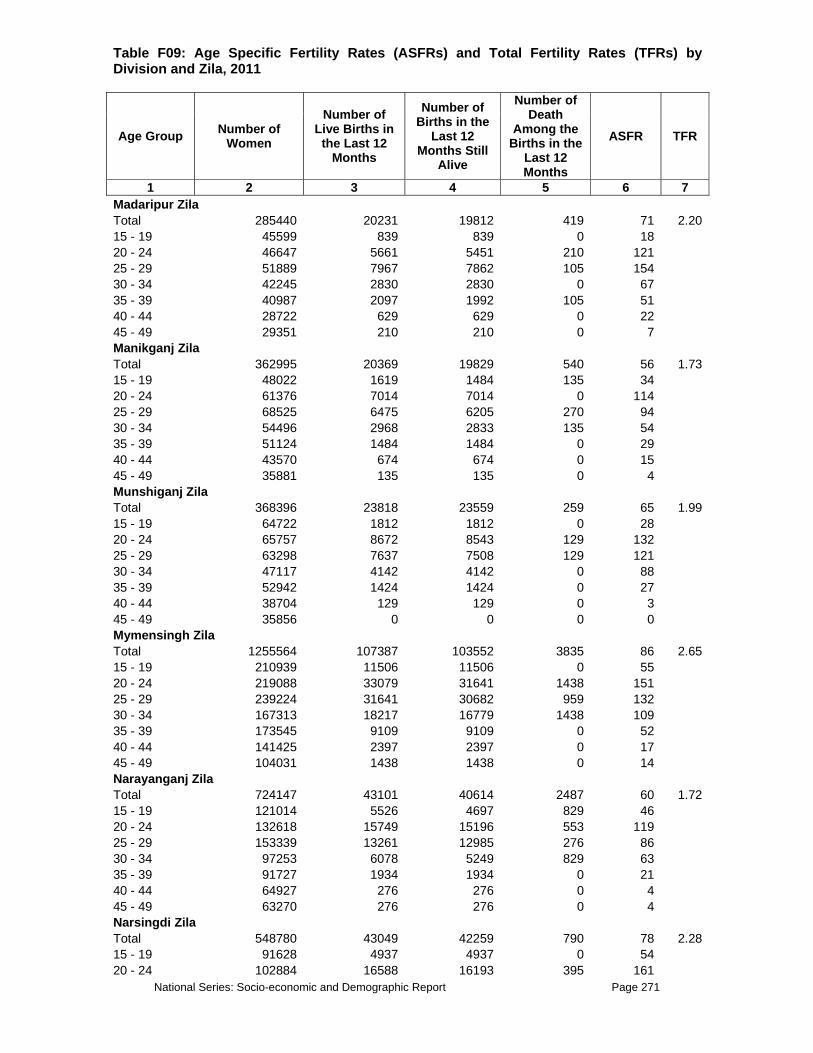
National Series: Socio-economic and Demographic Report Page 271
Table F09: Age Specific Fertility Rates (ASFRs) and Total Fertility Rates (TFRs) by Division and Zila, 2011
Age Group Number of Women
Number of Live Births in
the Last 12 Months
Number of Births in the
Last 12 Months Still
Alive
Number of Death
Among the Births in the
Last 12 Months
ASFR TFR
1 2 3 4 5 6 7 Madaripur Zila Total 285440 20231 19812 419 71 2.2015 - 19 45599 839 839 0 18 20 - 24 46647 5661 5451 210 121 25 - 29 51889 7967 7862 105 154 30 - 34 42245 2830 2830 0 67 35 - 39 40987 2097 1992 105 51 40 - 44 28722 629 629 0 22 45 - 49 29351 210 210 0 7 Manikganj Zila Total 362995 20369 19829 540 56 1.7315 - 19 48022 1619 1484 135 34 20 - 24 61376 7014 7014 0 114 25 - 29 68525 6475 6205 270 94 30 - 34 54496 2968 2833 135 54 35 - 39 51124 1484 1484 0 29 40 - 44 43570 674 674 0 15 45 - 49 35881 135 135 0 4 Munshiganj Zila Total 368396 23818 23559 259 65 1.9915 - 19 64722 1812 1812 0 28 20 - 24 65757 8672 8543 129 132 25 - 29 63298 7637 7508 129 121 30 - 34 47117 4142 4142 0 88 35 - 39 52942 1424 1424 0 27 40 - 44 38704 129 129 0 3 45 - 49 35856 0 0 0 0 Mymensingh Zila Total 1255564 107387 103552 3835 86 2.6515 - 19 210939 11506 11506 0 55 20 - 24 219088 33079 31641 1438 151 25 - 29 239224 31641 30682 959 132 30 - 34 167313 18217 16779 1438 109 35 - 39 173545 9109 9109 0 52 40 - 44 141425 2397 2397 0 17 45 - 49 104031 1438 1438 0 14 Narayanganj Zila Total 724147 43101 40614 2487 60 1.7215 - 19 121014 5526 4697 829 46 20 - 24 132618 15749 15196 553 119 25 - 29 153339 13261 12985 276 86 30 - 34 97253 6078 5249 829 63 35 - 39 91727 1934 1934 0 21 40 - 44 64927 276 276 0 4 45 - 49 63270 276 276 0 4 Narsingdi Zila Total 548780 43049 42259 790 78 2.2815 - 19 91628 4937 4937 0 54 20 - 24 102884 16588 16193 395 161

National Series: Socio-economic and Demographic Report Page 272
Table F09: Age Specific Fertility Rates (ASFRs) and Total Fertility Rates (TFRs) by Division and Zila, 2011
Age Group Number of Women
Number of Live Births in
the Last 12 Months
Number of Births in the
Last 12 Months Still
Alive
Number of Death
Among the Births in the
Last 12 Months
ASFR TFR
1 2 3 4 5 6 7 25 - 29 104661 11650 11453 197 111 30 - 34 78002 6319 6122 197 81 35 - 39 74448 3357 3357 0 45 40 - 44 49566 0 0 0 0 45 - 49 47591 197 197 0 4 Netrokona Zila Total 495451 49585 45801 3784 100 3.1015 - 19 73282 2987 2589 398 41 20 - 24 83438 15931 14338 1593 191 25 - 29 97577 14338 13541 797 147 30 - 34 70494 6970 6771 199 99 35 - 39 71888 6970 6173 797 97 40 - 44 56555 1991 1991 0 35 45 - 49 42217 398 398 0 9 Rajbari Zila Total 268010 17010 16812 198 63 1.8915 - 19 39262 1681 1681 0 43 20 - 24 47470 6725 6527 198 142 25 - 29 53998 5242 5242 0 97 30 - 34 37581 1780 1780 0 47 35 - 39 35702 989 989 0 28 40 - 44 28779 593 593 0 21 45 - 49 25219 0 0 0 0 Shariatpur Zila Total 283104 20852 20647 205 74 2.4015 - 19 55984 1027 1027 0 18 20 - 24 50129 6779 6574 205 135 25 - 29 47150 6472 6472 0 137 30 - 34 35645 3801 3801 0 107 35 - 39 36569 1849 1849 0 51 40 - 44 32152 514 514 0 16 45 - 49 25475 411 411 0 16 Sherpur Zila Total 340911 28114 27262 852 82 2.4815 - 19 49412 3408 3266 142 69 20 - 24 63894 10649 10223 426 167 25 - 29 64604 7099 6957 142 110 30 - 34 46288 3976 3976 0 86 35 - 39 47992 2556 2414 142 53 40 - 44 35497 426 426 0 12 45 - 49 33225 0 0 0 0 Tangail Zila Total 964429 56327 54883 1444 58 1.7715 - 19 137569 5055 5055 0 37 20 - 24 164650 22387 22026 361 136 25 - 29 182704 19859 19137 722 109 30 - 34 121321 4694 4333 361 39 35 - 39 132514 3611 3611 0 27 40 - 44 116266 361 361 0 3
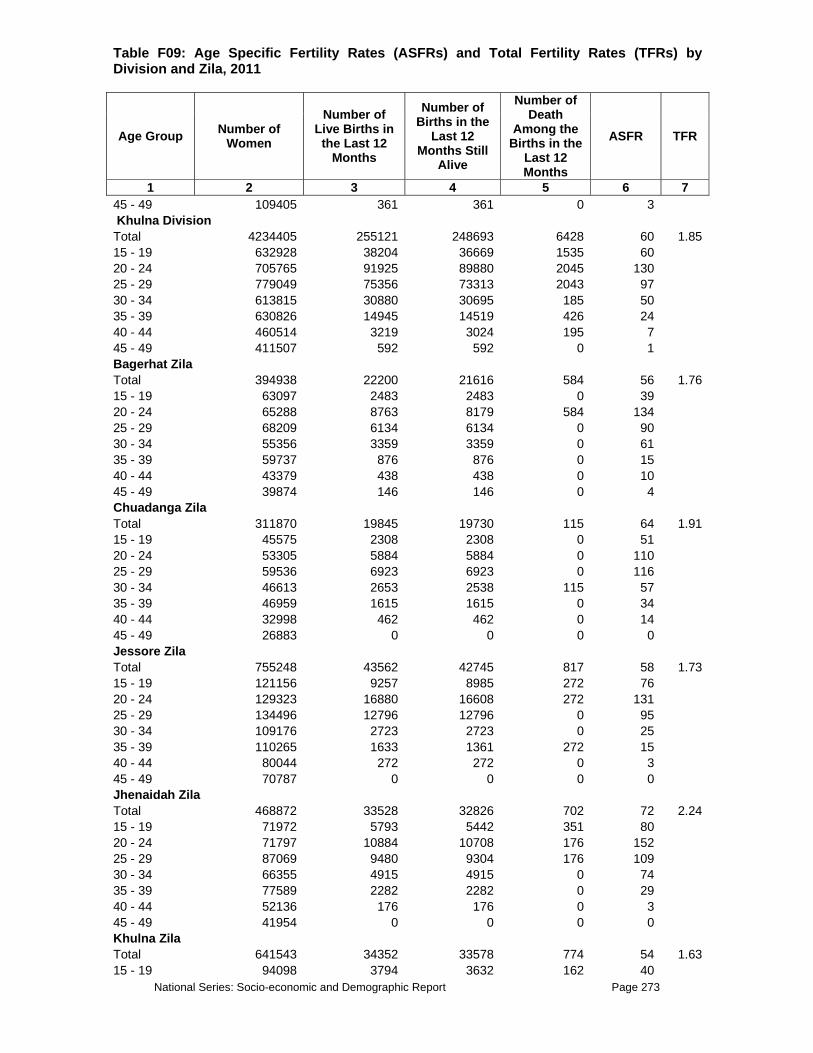
National Series: Socio-economic and Demographic Report Page 273
Table F09: Age Specific Fertility Rates (ASFRs) and Total Fertility Rates (TFRs) by Division and Zila, 2011
Age Group Number of Women
Number of Live Births in
the Last 12 Months
Number of Births in the
Last 12 Months Still
Alive
Number of Death
Among the Births in the
Last 12 Months
ASFR TFR
1 2 3 4 5 6 7 45 - 49 109405 361 361 0 3 Khulna Division Total 4234405 255121 248693 6428 60 1.8515 - 19 632928 38204 36669 1535 60 20 - 24 705765 91925 89880 2045 130 25 - 29 779049 75356 73313 2043 97 30 - 34 613815 30880 30695 185 50 35 - 39 630826 14945 14519 426 24 40 - 44 460514 3219 3024 195 7 45 - 49 411507 592 592 0 1 Bagerhat Zila Total 394938 22200 21616 584 56 1.7615 - 19 63097 2483 2483 0 39 20 - 24 65288 8763 8179 584 134 25 - 29 68209 6134 6134 0 90 30 - 34 55356 3359 3359 0 61 35 - 39 59737 876 876 0 15 40 - 44 43379 438 438 0 10 45 - 49 39874 146 146 0 4 Chuadanga Zila Total 311870 19845 19730 115 64 1.9115 - 19 45575 2308 2308 0 51 20 - 24 53305 5884 5884 0 110 25 - 29 59536 6923 6923 0 116 30 - 34 46613 2653 2538 115 57 35 - 39 46959 1615 1615 0 34 40 - 44 32998 462 462 0 14 45 - 49 26883 0 0 0 0 Jessore Zila Total 755248 43562 42745 817 58 1.7315 - 19 121156 9257 8985 272 76 20 - 24 129323 16880 16608 272 131 25 - 29 134496 12796 12796 0 95 30 - 34 109176 2723 2723 0 25 35 - 39 110265 1633 1361 272 15 40 - 44 80044 272 272 0 3 45 - 49 70787 0 0 0 0 Jhenaidah Zila Total 468872 33528 32826 702 72 2.2415 - 19 71972 5793 5442 351 80 20 - 24 71797 10884 10708 176 152 25 - 29 87069 9480 9304 176 109 30 - 34 66355 4915 4915 0 74 35 - 39 77589 2282 2282 0 29 40 - 44 52136 176 176 0 3 45 - 49 41954 0 0 0 0 Khulna Zila Total 641543 34352 33578 774 54 1.6315 - 19 94098 3794 3632 162 40

National Series: Socio-economic and Demographic Report Page 274
Table F09: Age Specific Fertility Rates (ASFRs) and Total Fertility Rates (TFRs) by Division and Zila, 2011
Age Group Number of Women
Number of Live Births in
the Last 12 Months
Number of Births in the
Last 12 Months Still
Alive
Number of Death
Among the Births in the
Last 12 Months
ASFR TFR
1 2 3 4 5 6 7 20 - 24 111824 13913 13688 225 124 25 - 29 114070 9128 8741 387 80 30 - 34 95440 5370 5370 0 56 35 - 39 94532 1760 1760 0 19 40 - 44 67803 387 387 0 6 45 - 49 63777 0 0 0 0 Kushtia Zila Total 505738 34707 32724 1983 69 2.0615 - 19 71398 4958 4363 595 69 20 - 24 80125 10512 10115 397 131 25 - 29 108684 12495 11503 992 115 30 - 34 68622 3768 3768 0 55 35 - 39 74770 2578 2578 0 34 40 - 44 49781 397 397 0 8 45 - 49 52359 0 0 0 0 Magura Zila Total 231350 16183 15926 257 70 2.1915 - 19 32194 2055 1969 86 64 20 - 24 37588 5822 5822 0 155 25 - 29 42896 4881 4795 86 114 30 - 34 35447 1627 1627 0 46 35 - 39 30738 1456 1370 86 47 40 - 44 28084 171 171 0 6 45 - 49 24402 171 171 0 7 Meherpur Zila Total 191147 10304 9958 346 54 1.7115 - 19 29322 2628 2559 69 90 20 - 24 29045 2420 2420 0 83 25 - 29 34163 3526 3319 207 103 30 - 34 28008 1106 1037 69 40 35 - 39 28285 415 415 0 15 40 - 44 24758 0 0 0 0 45 - 49 17566 207 207 0 12 Narail Zila Total 182992 12308 12240 68 67 2.1215 - 19 24412 1217 1217 0 50 20 - 24 30769 4734 4734 0 154 25 - 29 32054 2570 2570 0 80 30 - 34 27726 2232 2232 0 80 35 - 39 27658 1353 1285 68 49 40 - 44 21166 135 135 0 6 45 - 49 19205 68 68 0 4 Satkhira Zila Total 550707 28131 27350 781 51 1.5615 - 19 79705 3712 3712 0 47 20 - 24 96701 12112 11721 391 125 25 - 29 97873 7423 7228 195 76 30 - 34 81072 3126 3126 0 39 35 - 39 80291 977 977 0 12
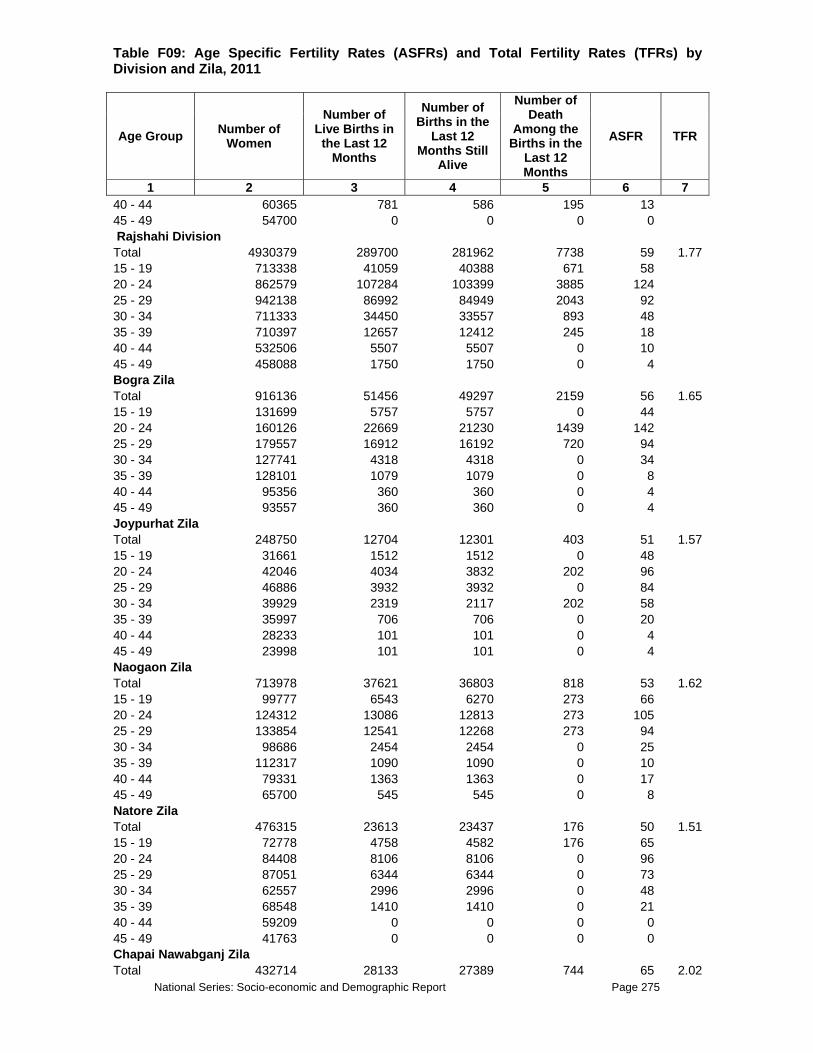
National Series: Socio-economic and Demographic Report Page 275
Table F09: Age Specific Fertility Rates (ASFRs) and Total Fertility Rates (TFRs) by Division and Zila, 2011
Age Group Number of Women
Number of Live Births in
the Last 12 Months
Number of Births in the
Last 12 Months Still
Alive
Number of Death
Among the Births in the
Last 12 Months
ASFR TFR
1 2 3 4 5 6 7 40 - 44 60365 781 586 195 13 45 - 49 54700 0 0 0 0 Rajshahi Division Total 4930379 289700 281962 7738 59 1.7715 - 19 713338 41059 40388 671 58 20 - 24 862579 107284 103399 3885 124 25 - 29 942138 86992 84949 2043 92 30 - 34 711333 34450 33557 893 48 35 - 39 710397 12657 12412 245 18 40 - 44 532506 5507 5507 0 10 45 - 49 458088 1750 1750 0 4 Bogra Zila Total 916136 51456 49297 2159 56 1.6515 - 19 131699 5757 5757 0 44 20 - 24 160126 22669 21230 1439 142 25 - 29 179557 16912 16192 720 94 30 - 34 127741 4318 4318 0 34 35 - 39 128101 1079 1079 0 8 40 - 44 95356 360 360 0 4 45 - 49 93557 360 360 0 4 Joypurhat Zila Total 248750 12704 12301 403 51 1.5715 - 19 31661 1512 1512 0 48 20 - 24 42046 4034 3832 202 96 25 - 29 46886 3932 3932 0 84 30 - 34 39929 2319 2117 202 58 35 - 39 35997 706 706 0 20 40 - 44 28233 101 101 0 4 45 - 49 23998 101 101 0 4 Naogaon Zila Total 713978 37621 36803 818 53 1.6215 - 19 99777 6543 6270 273 66 20 - 24 124312 13086 12813 273 105 25 - 29 133854 12541 12268 273 94 30 - 34 98686 2454 2454 0 25 35 - 39 112317 1090 1090 0 10 40 - 44 79331 1363 1363 0 17 45 - 49 65700 545 545 0 8 Natore Zila Total 476315 23613 23437 176 50 1.5115 - 19 72778 4758 4582 176 65 20 - 24 84408 8106 8106 0 96 25 - 29 87051 6344 6344 0 73 30 - 34 62557 2996 2996 0 48 35 - 39 68548 1410 1410 0 21 40 - 44 59209 0 0 0 0 45 - 49 41763 0 0 0 0 Chapai Nawabganj Zila Total 432714 28133 27389 744 65 2.02

National Series: Socio-economic and Demographic Report Page 276
Table F09: Age Specific Fertility Rates (ASFRs) and Total Fertility Rates (TFRs) by Division and Zila, 2011
Age Group Number of Women
Number of Live Births in
the Last 12 Months
Number of Births in the
Last 12 Months Still
Alive
Number of Death
Among the Births in the
Last 12 Months
ASFR TFR
1 2 3 4 5 6 7 15 - 19 75915 5359 5359 0 71 20 - 24 68919 9080 8485 595 132 25 - 29 87972 7443 7443 0 85 30 - 34 56564 4466 4317 149 79 35 - 39 64155 744 744 0 12 40 - 44 44656 595 595 0 13 45 - 49 34534 447 447 0 13 Pabna Zila Total 658331 46620 45639 981 71 2.1515 - 19 95940 4662 4662 0 49 20 - 24 117042 17176 17176 0 147 25 - 29 130783 13005 12514 491 99 30 - 34 95449 5643 5398 245 59 35 - 39 93732 3680 3435 245 39 40 - 44 65759 2454 2454 0 37 45 - 49 59625 0 0 0 0 Rajshahi Zila Total 700083 35477 34507 970 51 1.5215 - 19 100392 6525 6303 222 65 20 - 24 118359 12930 12445 485 109 25 - 29 130748 11961 11698 263 91 30 - 34 107700 2747 2747 0 26 35 - 39 97617 1273 1273 0 13 40 - 44 79149 40 40 0 1 45 - 49 66119 0 0 0 0 Sirajganj Zila Total 784073 54074 52588 1486 69 2.0515 - 19 105177 5942 5942 0 57 20 - 24 147367 20203 19312 891 137 25 - 29 145287 14855 14558 297 102 30 - 34 122706 9507 9210 297 77 35 - 39 109931 2674 2674 0 24 40 - 44 80814 594 594 0 7 45 - 49 72792 297 297 0 4 Rangpur Division Total 4062820 292567 276705 15862 72 2.1615 - 19 588704 37796 35630 2166 64 20 - 24 719683 110007 105346 4661 153 25 - 29 774546 85026 78407 6619 110 30 - 34 593005 38562 36690 1872 65 35 - 39 570650 15387 14844 543 27 40 - 44 410880 3974 3974 0 10 45 - 49 405353 1814 1814 0 4 Dinajpur Zila Total 780123 49928 48145 1783 64 1.9615 - 19 113526 7430 7430 0 65 20 - 24 128089 19020 18723 297 148 25 - 29 148298 14563 13374 1189 98 30 - 34 117984 5646 5349 297 48

National Series: Socio-economic and Demographic Report Page 277
Table F09: Age Specific Fertility Rates (ASFRs) and Total Fertility Rates (TFRs) by Division and Zila, 2011
Age Group Number of Women
Number of Live Births in
the Last 12 Months
Number of Births in the
Last 12 Months Still
Alive
Number of Death
Among the Births in the
Last 12 Months
ASFR TFR
1 2 3 4 5 6 7 35 - 39 108474 2378 2378 0 22 40 - 44 80836 594 594 0 7 45 - 49 82916 297 297 0 4 Gaibandha Zila Total 590666 49413 44064 5349 84 2.5615 - 19 74884 6113 5349 764 82 20 - 24 106213 17829 16301 1528 168 25 - 29 111562 14009 11717 2292 126 30 - 34 90421 7641 6877 764 85 35 - 39 82780 2292 2292 0 28 40 - 44 53234 764 764 0 14 45 - 49 71573 764 764 0 11 Kurigram Zila Total 536687 39090 37822 1268 73 2.2015 - 19 80292 5071 4860 211 63 20 - 24 96350 13945 13734 211 145 25 - 29 104591 10565 10142 423 101 30 - 34 73742 4437 4437 0 60 35 - 39 78390 3804 3381 423 49 40 - 44 56204 1268 1268 0 23 45 - 49 47119 0 0 0 0 Lalmonirhat Zila Total 308558 21988 21142 846 71 2.1615 - 19 40231 2537 2537 0 63 20 - 24 56662 8457 8215 242 149 25 - 29 58111 5437 5195 242 94 30 - 34 47480 3746 3504 242 79 35 - 39 40835 1208 1087 121 30 40 - 44 34915 483 483 0 14 45 - 49 30324 121 121 0 4 Nilphamari Zila Total 468433 33848 31393 2455 72 2.1215 - 19 71379 4210 3508 702 59 20 - 24 83129 14907 13679 1228 179 25 - 29 92424 8243 7892 351 89 30 - 34 68923 4735 4560 175 69 35 - 39 65942 1578 1578 0 24 40 - 44 42266 0 0 0 0 45 - 49 44371 175 175 0 4 Panchagarh Zila Total 261810 19671 19101 570 75 2.1815 - 19 39723 2661 2471 190 67 20 - 24 48371 7222 7032 190 149 25 - 29 52647 6177 6082 95 117 30 - 34 36017 2186 2091 95 61 35 - 39 36587 1235 1235 0 34 40 - 44 25373 0 0 0 0 45 - 49 23092 190 190 0 8 Rangpur Zila

National Series: Socio-economic and Demographic Report Page 278
Table F09: Age Specific Fertility Rates (ASFRs) and Total Fertility Rates (TFRs) by Division and Zila, 2011
Age Group Number of Women
Number of Live Births in
the Last 12 Months
Number of Births in the
Last 12 Months Still
Alive
Number of Death
Among the Births in the
Last 12 Months
ASFR TFR
1 2 3 4 5 6 7 Total 755024 54101 51710 2391 72 2.1315 - 19 113881 6576 6277 299 58 20 - 24 140483 19429 19130 299 138 25 - 29 137195 17636 16141 1495 129 30 - 34 104316 7772 7473 299 75 35 - 39 103121 2092 2092 0 20 40 - 44 83393 598 598 0 7 45 - 49 72633 0 0 0 0 Thakurgaon Zila Total 361520 24528 23328 1200 68 2.0315 - 19 54788 3199 3199 0 58 20 - 24 60387 9198 8531 667 152 25 - 29 69718 8398 7865 533 120 30 - 34 54121 2399 2399 0 44 35 - 39 54521 800 800 0 15 40 - 44 34659 267 267 0 8 45 - 49 33326 267 267 0 8 Sylhet Division Total 2277359 195176 189559 5617 86 2.7315 - 19 431098 8749 8599 150 20 20 - 24 390267 62361 59680 2681 160 25 - 29 397229 62475 60562 1913 157 30 - 34 319168 34395 34010 385 108 35 - 39 299097 17105 16655 450 57 40 - 44 236315 7390 7351 39 31 45 - 49 204184 2701 2701 0 13 Habiganj Zila Total 479290 39982 38676 1306 83 2.5815 - 19 79311 1795 1795 0 23 20 - 24 81758 12076 11423 653 148 25 - 29 83717 15014 14524 490 179 30 - 34 74741 6691 6528 163 90 35 - 39 65929 2448 2448 0 37 40 - 44 50263 1469 1469 0 29 45 - 49 43572 490 490 0 11 Maulvibazar Zila Total 458337 31325 29976 1349 68 2.2315 - 19 87980 1499 1349 150 17 20 - 24 74641 10792 10492 300 145 25 - 29 77489 8394 7944 450 108 30 - 34 63700 5096 5096 0 80 35 - 39 61751 4497 4047 450 73 40 - 44 51559 450 450 0 9 45 - 49 41217 600 600 0 15 Sunamganj Zila Total 554656 59415 57952 1463 107 3.4515 - 19 101461 2559 2559 0 25 20 - 24 98536 18647 17733 914 189 25 - 29 99816 17368 17002 366 174

National Series: Socio-economic and Demographic Report Page 279
Table F09: Age Specific Fertility Rates (ASFRs) and Total Fertility Rates (TFRs) by Division and Zila, 2011
Age Group Number of Women
Number of Live Births in
the Last 12 Months
Number of Births in the
Last 12 Months Still
Alive
Number of Death
Among the Births in the
Last 12 Months
ASFR TFR
1 2 3 4 5 6 7 30 - 34 73491 11700 11517 183 159 35 - 39 70566 5302 5302 0 75 40 - 44 59780 2925 2925 0 49 45 - 49 51005 914 914 0 18 Sylhet Zila Total 785076 64454 62954 1500 82 2.6315 - 19 162346 2896 2896 0 18 20 - 24 135332 20847 20032 815 154 25 - 29 136208 21701 21093 608 159 30 - 34 107236 10909 10870 39 102 35 - 39 100851 4859 4859 0 48 40 - 44 74714 2546 2507 39 34 45 - 49 68390 698 698 0 10
National Series: Socio-economic and Demographic Report Page 280
MORTALITY TABLES Table M01 – Table M05

National Series: Socio-economic and Demographic Report Page 281
Table M01: Deaths in the Last 12 Months by Residence, Age and Sex of the Deceased, 2011
Age Total Population Deaths Within 12 Months Prior to the Survey Age Specific Mortality Rates (Total Deaths/1,000)
Total Males Female Total Male Female Total Male Female 1 2 3 4 5 6 7 8 9 10
Bangladesh Total 139252683 69514871 69737812 667709 381223 286486 4.8 5.5 4.1 0 2489791 1260897 1228895 92946 57200 35746 37.3 45.4 29.1 1 2268088 1147758 1120330 18415 10888 7527 8.1 9.5 6.7 2 3036723 1561786 1474938 6479 4305 2174 2.1 2.8 1.5 3 3276859 1653656 1623203 4190 1946 2244 1.3 1.2 1.4 4 3254788 1641811 1612977 2941 1387 1554 0.9 0.8 1.0 1-4 11836459 6005011 5831448 32025 18526 13498 2.7 3.1 2.3 5-9 17201017 8730750 8470268 14729 9005 5724 0.9 1.0 0.7 10-14 16019423 8284907 7734517 9930 6400 3529 0.6 0.8 0.5 15-19 12712478 6603607 6108871 15283 8358 6926 1.2 1.3 1.1 20-24 12075641 5461651 6613990 13236 6249 6988 1.1 1.1 1.1 25-29 12703367 5745760 6957607 13281 6658 6623 1.0 1.2 1.0 30-34 9851897 4743919 5107978 11658 6404 5254 1.2 1.3 1.0 35-39 9666804 4594205 5072599 16680 8594 8086 1.7 1.9 1.6 40-44 7968811 4189019 3779792 20060 12155 7905 2.5 2.9 2.1 45-49 6834043 3514737 3319306 25967 14392 11575 3.8 4.1 3.5 50-54 5508815 2923410 2585406 26705 18678 8028 4.8 6.4 3.1 55-59 3850480 1963527 1886954 31949 19970 11979 8.3 10.2 6.3 60-64 3932396 2061522 1870874 47579 33431 14147 12.1 16.2 7.6 65+ 6601260 3431953 3169307 295681 155204 140478 44.8 45.2 44.3 Rural Total 112510154 56246478 56263676 530771 302414 228356 4.7 5.4 4.1 0 2015487 1030154 985333 76325 46995 29330 37.9 45.6 29.8 1 1832561 923378 909183 15021 9348 5673 8.2 10.1 6.2 2 2532936 1308256 1224680 6053 3879 2174 2.4 3.0 1.8 3 2716191 1367555 1348636 3408 1519 1889 1.3 1.1 1.4 4 2734202 1377689 1356513 2064 1072 992 0.8 0.8 0.7 1-4 9815890 4976878 4839012 26546 15818 10728 2.7 3.2 2.2

National Series: Socio-economic and Demographic Report Page 282
Table M01: Deaths in the Last 12 Months by Residence, Age and Sex of the Deceased, 2011
Age Total Population Deaths Within 12 Months Prior to the Survey Age Specific Mortality Rates (Total Deaths/1,000)
Total Males Female Total Male Female Total Male Female 1 2 3 4 5 6 7 8 9 10
5-9 14332668 7297698 7034970 11998 6656 5342 0.8 0.9 0.8 10-14 13093281 6797507 6295774 7928 5012 2916 0.6 0.7 0.5 15-19 10108524 5348671 4759853 12011 5920 6090 1.2 1.1 1.3 20-24 9501579 4350393 5151186 9294 4744 4550 1.0 1.1 0.9 25-29 9992339 4512211 5480128 10751 5222 5529 1.1 1.2 1.0 30-34 7808923 3738572 4070351 9334 5026 4308 1.2 1.3 1.1 35-39 7666946 3651864 4015082 12372 6626 5746 1.6 1.8 1.4 40-44 6272890 3282231 2990659 15609 10281 5328 2.5 3.1 1.8 45-49 5423972 2751394 2672578 18659 9105 9554 3.4 3.3 3.6 50-54 4457121 2328181 2128941 20819 14122 6697 4.7 6.1 3.1 55-59 3111667 1555038 1556629 22479 13487 8993 7.2 8.7 5.8 60-64 3279830 1700679 1579152 39175 27400 11775 11.9 16.1 7.5 65+ 5629036 2925009 2704027 237470 126000 111470 42.2 43.1 41.2 Urban Total 26742529 13268393 13474136 136938 78809 58129 5.1 5.9 4.3 0 474304 230743 243561 16621 10205 6416 35.0 44.2 26.3 1 435527 224381 211146 3394 1540 1854 7.8 6.9 8.8 2 503787 253529 250258 426 426 0 0.8 1.7 0.0 3 560669 286101 274568 782 427 355 1.4 1.5 1.3 4 520586 264122 256464 877 315 561 1.7 1.2 2.2 1-4 2020569 1028133 992436 5478 2708 2770 2.7 2.6 2.8 5-9 2868349 1433052 1435298 2730 2348 382 1.0 1.6 0.3 10-14 2926142 1487399 1438743 2002 1388 613 0.7 0.9 0.4 15-19 2603954 1254936 1349018 3273 2437 835 1.3 1.9 0.6 20-24 2574062 1111258 1462804 3942 1504 2437 1.5 1.4 1.7 25-29 2711028 1233549 1477479 2530 1436 1094 0.9 1.2 0.7 30-34 2042974 1005347 1037628 2324 1378 946 1.1 1.4 0.9 35-39 1999857 942341 1057516 4308 1968 2340 2.2 2.1 2.2

National Series: Socio-economic and Demographic Report Page 283
Table M01: Deaths in the Last 12 Months by Residence, Age and Sex of the Deceased, 2011
Age Total Population Deaths Within 12 Months Prior to the Survey Age Specific Mortality Rates (Total Deaths/1,000)
Total Males Female Total Male Female Total Male Female 1 2 3 4 5 6 7 8 9 10
40-44 1695921 906788 789132 4451 1874 2577 2.6 2.1 3.3 45-49 1410071 763343 646728 7309 5287 2021 5.2 6.9 3.1 50-54 1051694 595229 456465 5886 4555 1330 5.6 7.7 2.9 55-59 738813 408488 330325 9470 6484 2986 12.8 15.9 9.0 60-64 652565 360843 291722 8404 6032 2372 12.9 16.7 8.1 65+ 972224 506943 465281 58211 29203 29008 59.9 57.6 62.3 Barisal Total 8489476 4281289 4208187 45169 23589 21581 5.3 5.5 5.1 0 128682 62795 65888 5707 3815 1892 44.3 60.8 28.7 1 116957 62820 54136 2021 884 1137 17.3 14.1 21.0 2 178654 90486 88168 418 263 155 2.3 2.9 1.8 3 189606 94634 94972 327 183 144 1.7 1.9 1.5 4 203912 102566 101345 310 0 310 1.5 0.0 3.1 1-4 689129 350507 338622 3076 1330 1746 4.5 3.8 5.2 5-9 1039969 526186 513783 967 338 629 0.9 0.6 1.2 10-14 1047935 556093 491842 885 547 338 0.8 1.0 0.7 15-19 774180 415446 358734 1424 482 942 1.8 1.2 2.6 20-24 672788 318031 354758 967 90 878 1.4 0.3 2.5 25-29 707380 312745 394634 792 201 591 1.1 0.6 1.5 30-34 573499 271136 302364 788 604 183 1.4 2.2 0.6 35-39 584866 279065 305801 1091 569 522 1.9 2.0 1.7 40-44 469588 252943 216645 1814 1275 539 3.9 5.0 2.5 45-49 427715 216413 211303 1554 651 903 3.6 3.0 4.3 50-54 341582 178330 163252 1892 909 982 5.5 5.1 6.0 55-59 263586 133406 130180 1606 1059 547 6.1 7.9 4.2 60-64 274106 143512 130595 3231 1905 1326 11.8 13.3 10.2 65+ 494471 264683 229788 19378 9814 9563 39.2 37.1 41.6 Rural

National Series: Socio-economic and Demographic Report Page 284
Table M01: Deaths in the Last 12 Months by Residence, Age and Sex of the Deceased, 2011
Age Total Population Deaths Within 12 Months Prior to the Survey Age Specific Mortality Rates (Total Deaths/1,000)
Total Males Female Total Male Female Total Male Female 1 2 3 4 5 6 7 8 9 10
Total 7426175 3745640 3680535 39219 19738 19481 5.3 5.3 5.3 0 110746 53418 57329 4939 3195 1743 44.6 59.8 30.4 1 102366 54077 48289 2021 884 1137 19.7 16.3 23.5 2 157863 79854 78009 388 233 155 2.5 2.9 2.0 3 168550 83075 85476 327 183 144 1.9 2.2 1.7 4 181461 91898 89564 155 0 155 0.9 0.0 1.7 1-4 610241 308904 301337 2891 1300 1591 4.7 4.2 5.3 5-9 927729 471056 456673 599 155 445 0.6 0.3 1.0 10-14 923484 490647 432837 428 90 338 0.5 0.2 0.8 15-19 674746 365440 309306 1358 482 876 2.0 1.3 2.8 20-24 579175 276066 303109 772 0 772 1.3 0.0 2.5 25-29 612761 270773 341988 656 66 591 1.1 0.2 1.7 30-34 490301 230528 259773 575 392 183 1.2 1.7 0.7 35-39 505658 243030 262628 1061 539 522 2.1 2.2 2.0 40-44 401612 214785 186828 1784 1246 539 4.4 5.8 2.9 45-49 368960 185085 183875 1340 496 844 3.6 2.7 4.6 50-54 298299 154142 144156 1435 703 732 4.8 4.6 5.1 55-59 231059 116293 114766 1440 923 517 6.2 7.9 4.5 60-64 247375 129453 117922 2904 1667 1237 11.7 12.9 10.5 65+ 444030 236020 208009 17037 8486 8551 38.4 36.0 41.1 Urban Total 1063301 535649 527652 5950 3850 2100 5.6 7.2 4.0 0 17936 9377 8559 768 620 149 42.8 66.1 17.4 1 14591 8743 5848 0 0 0 0.0 0.0 0.0 2 20791 10632 10159 29 29 0 1.4 2.7 0.0 3 21056 11559 9496 0 0 0 0.0 0.0 0.0 4 22450 10669 11782 155 0 155 6.9 0.0 13.2 1-4 78888 41603 37285 184 29 155 2.3 0.7 4.2
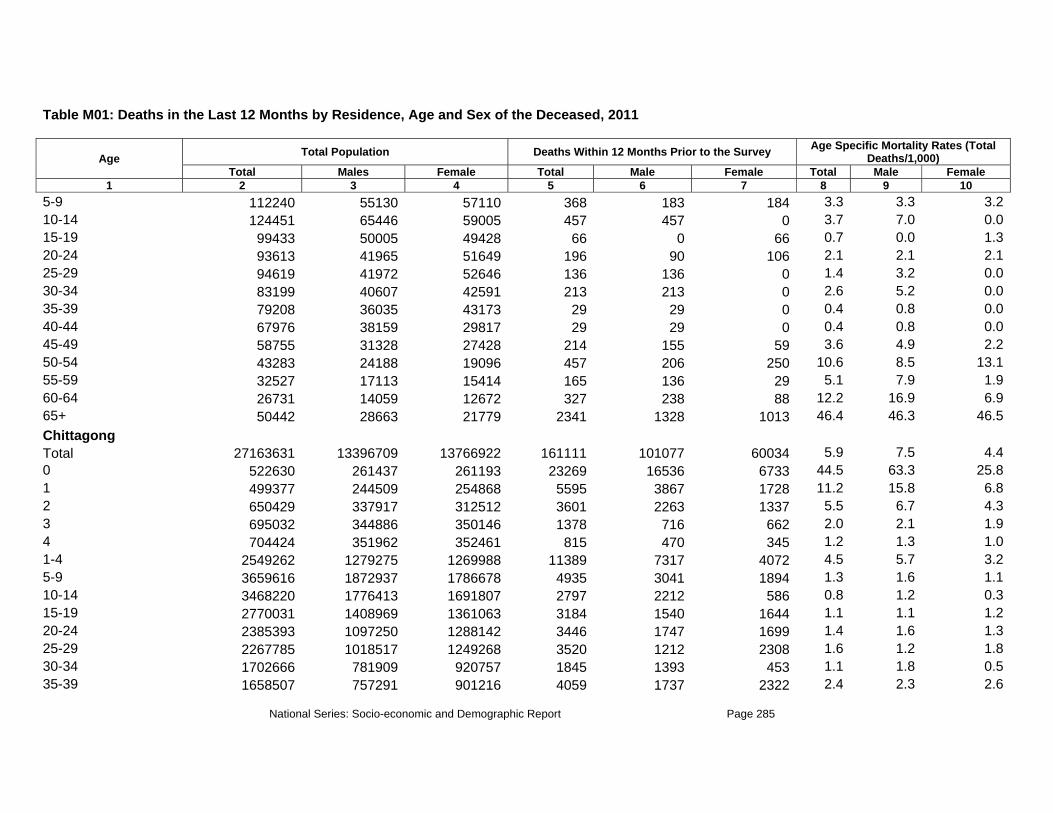
National Series: Socio-economic and Demographic Report Page 285
Table M01: Deaths in the Last 12 Months by Residence, Age and Sex of the Deceased, 2011
Age Total Population Deaths Within 12 Months Prior to the Survey Age Specific Mortality Rates (Total Deaths/1,000)
Total Males Female Total Male Female Total Male Female 1 2 3 4 5 6 7 8 9 10
5-9 112240 55130 57110 368 183 184 3.3 3.3 3.2 10-14 124451 65446 59005 457 457 0 3.7 7.0 0.0 15-19 99433 50005 49428 66 0 66 0.7 0.0 1.3 20-24 93613 41965 51649 196 90 106 2.1 2.1 2.1 25-29 94619 41972 52646 136 136 0 1.4 3.2 0.0 30-34 83199 40607 42591 213 213 0 2.6 5.2 0.0 35-39 79208 36035 43173 29 29 0 0.4 0.8 0.0 40-44 67976 38159 29817 29 29 0 0.4 0.8 0.0 45-49 58755 31328 27428 214 155 59 3.6 4.9 2.2 50-54 43283 24188 19096 457 206 250 10.6 8.5 13.1 55-59 32527 17113 15414 165 136 29 5.1 7.9 1.9 60-64 26731 14059 12672 327 238 88 12.2 16.9 6.9 65+ 50442 28663 21779 2341 1328 1013 46.4 46.3 46.5 Chittagong Total 27163631 13396709 13766922 161111 101077 60034 5.9 7.5 4.4 0 522630 261437 261193 23269 16536 6733 44.5 63.3 25.8 1 499377 244509 254868 5595 3867 1728 11.2 15.8 6.8 2 650429 337917 312512 3601 2263 1337 5.5 6.7 4.3 3 695032 344886 350146 1378 716 662 2.0 2.1 1.9 4 704424 351962 352461 815 470 345 1.2 1.3 1.0 1-4 2549262 1279275 1269988 11389 7317 4072 4.5 5.7 3.2 5-9 3659616 1872937 1786678 4935 3041 1894 1.3 1.6 1.1 10-14 3468220 1776413 1691807 2797 2212 586 0.8 1.2 0.3 15-19 2770031 1408969 1361063 3184 1540 1644 1.1 1.1 1.2 20-24 2385393 1097250 1288142 3446 1747 1699 1.4 1.6 1.3 25-29 2267785 1018517 1249268 3520 1212 2308 1.6 1.2 1.8 30-34 1702666 781909 920757 1845 1393 453 1.1 1.8 0.5 35-39 1658507 757291 901216 4059 1737 2322 2.4 2.3 2.6

National Series: Socio-economic and Demographic Report Page 286
Table M01: Deaths in the Last 12 Months by Residence, Age and Sex of the Deceased, 2011
Age Total Population Deaths Within 12 Months Prior to the Survey Age Specific Mortality Rates (Total Deaths/1,000)
Total Males Female Total Male Female Total Male Female 1 2 3 4 5 6 7 8 9 10
40-44 1342020 673065 668955 3698 2199 1499 2.8 3.3 2.2 45-49 1176501 578730 597771 6810 3582 3228 5.8 6.2 5.4 50-54 979492 489983 489510 6970 5981 989 7.1 12.2 2.0 55-59 668688 342719 325969 9458 6692 2766 14.1 19.5 8.5 60-64 769399 400326 369073 8808 6295 2513 11.4 15.7 6.8 65+ 1243421 657890 585531 66922 39595 27327 53.8 60.2 46.7 Rural Total 21620590 10661132 10959458 123508 77678 45830 5.7 7.3 4.2 0 426077 215945 210132 17615 13453 4163 41.3 62.3 19.8 1 398301 195267 203034 4558 2830 1728 11.4 14.5 8.5 2 540141 280351 259789 3204 1867 1337 5.9 6.7 5.1 3 577862 288158 289704 907 470 437 1.6 1.6 1.5 4 578091 289363 288728 642 470 172 1.1 1.6 0.6 1-4 2094395 1053139 1041255 9312 5638 3674 4.4 5.4 3.5 5-9 3026747 1554154 1472593 4327 2433 1894 1.4 1.6 1.3 10-14 2809935 1436654 1373281 2453 2039 414 0.9 1.4 0.3 15-19 2192047 1131346 1060701 2692 1048 1644 1.2 0.9 1.5 20-24 1808428 841302 967126 2163 1297 866 1.2 1.5 0.9 25-29 1729543 775758 953786 3122 1039 2083 1.8 1.3 2.2 30-34 1319052 590646 728406 1845 1393 453 1.4 2.4 0.6 35-39 1286622 580962 705659 2905 1333 1572 2.3 2.3 2.2 40-44 1028026 512158 515868 2356 1764 592 2.3 3.4 1.1 45-49 916736 443039 473697 4324 1725 2599 4.7 3.9 5.5 50-54 779002 377871 401131 5622 4747 874 7.2 12.6 2.2 55-59 530839 265414 265426 6052 3949 2104 11.4 14.9 7.9 60-64 625934 323531 302403 5621 4027 1594 9.0 12.4 5.3 65+ 1047207 559212 487995 53099 31794 21305 50.7 56.9 43.7 Urban

National Series: Socio-economic and Demographic Report Page 287
Table M01: Deaths in the Last 12 Months by Residence, Age and Sex of the Deceased, 2011
Age Total Population Deaths Within 12 Months Prior to the Survey Age Specific Mortality Rates (Total Deaths/1,000)
Total Males Female Total Male Female Total Male Female 1 2 3 4 5 6 7 8 9 10
Total 5543041 2735578 2807464 37602 23398 14204 6.8 8.6 5.1 0 96553 45492 51061 5654 3083 2570 58.6 67.8 50.3 1 101076 49242 51834 1037 1037 0 10.3 21.1 0.0 2 110288 57566 52723 396 396 0 3.6 6.9 0.0 3 117170 56728 60442 472 246 225 4.0 4.3 3.7 4 126333 62600 63734 172 0 172 1.4 0.0 2.7 1-4 454868 226135 228732 2077 1679 398 4.6 7.4 1.7 5-9 632869 318783 314086 608 608 0 1.0 1.9 0.0 10-14 658286 339759 318527 345 172 172 0.5 0.5 0.5 15-19 577985 277623 300362 492 492 0 0.9 1.8 0.0 20-24 576965 255948 321016 1284 451 833 2.2 1.8 2.6 25-29 538241 242760 295482 398 172 225 0.7 0.7 0.8 30-34 383613 191263 192351 0 0 0 0.0 0.0 0.0 35-39 371885 176328 195557 1154 404 750 3.1 2.3 3.8 40-44 313994 160907 153087 1343 435 907 4.3 2.7 5.9 45-49 259766 135691 124075 2486 1857 629 9.6 13.7 5.1 50-54 200490 112111 88379 1348 1233 115 6.7 11.0 1.3 55-59 137849 77305 60544 3406 2743 662 24.7 35.5 10.9 60-64 143465 76794 66670 3187 2267 919 22.2 29.5 13.8 65+ 196214 98678 97536 13823 7801 6022 70.4 79.1 61.7 Dhaka Total 45568835 22718879 22849956 209901 120109 89792 4.6 5.3 3.9 0 839032 421606 417426 28325 17511 10814 33.8 41.5 25.9 1 757093 390153 366940 3452 1652 1800 4.6 4.2 4.9 2 993864 507297 486567 246 246 0 0.2 0.5 0.0 3 1059056 537170 521886 1104 576 528 1.0 1.1 1.0 4 1056117 533910 522207 1047 553 494 1.0 1.0 0.9 1-4 3866130 1968531 1897600 5848 3026 2822 1.5 1.5 1.5

National Series: Socio-economic and Demographic Report Page 288
Table M01: Deaths in the Last 12 Months by Residence, Age and Sex of the Deceased, 2011
Age Total Population Deaths Within 12 Months Prior to the Survey Age Specific Mortality Rates (Total Deaths/1,000)
Total Males Female Total Male Female Total Male Female 1 2 3 4 5 6 7 8 9 10
5-9 5606787 2866079 2740708 5716 3340 2376 1.0 1.2 0.9 10-14 5119596 2624554 2495042 1881 1739 142 0.4 0.7 0.1 15-19 4107599 2084593 2023006 4917 3305 1612 1.2 1.6 0.8 20-24 4036442 1743646 2292796 3227 1320 1907 0.8 0.8 0.8 25-29 4386885 1966141 2420744 4136 2682 1454 0.9 1.4 0.6 30-34 3275802 1628266 1647537 5241 2460 2782 1.6 1.5 1.7 35-39 3186356 1531744 1654611 6520 3606 2915 2.0 2.4 1.8 40-44 2645398 1391421 1253977 7754 4872 2882 2.9 3.5 2.3 45-49 2176927 1145827 1031099 7429 5397 2032 3.4 4.7 2.0 50-54 1788255 967815 820440 7894 5668 2226 4.4 5.9 2.7 55-59 1235632 650728 584904 8818 6221 2597 7.1 9.6 4.4 60-64 1238962 653004 585958 16305 11791 4514 13.2 18.1 7.7 65+ 2059033 1074924 984109 95888 47171 48717 46.6 43.9 49.5 Rural Total 33696716 16835863 16860853 155181 89044 66137 4.6 5.3 3.9 0 611677 309224 302453 22599 13567 9032 36.9 43.9 29.9 1 569274 289100 280174 1956 1652 304 3.4 5.7 1.1 2 781276 399572 381704 246 246 0 0.3 0.6 0.0 3 804566 408601 395965 833 434 398 1.0 1.1 1.0 4 846945 422546 424400 536 276 260 0.6 0.7 0.6 1-4 3002062 1519819 1482243 3570 2608 962 1.2 1.7 0.6 5-9 4361194 2247075 2114119 3961 1783 2179 0.9 0.8 1.0 10-14 3857725 1995384 1862341 1271 1129 142 0.3 0.6 0.1 15-19 2958806 1546118 1412688 3161 2158 1002 1.1 1.4 0.7 20-24 2869526 1260863 1608663 1975 1121 855 0.7 0.9 0.5 25-29 3107131 1387661 1719469 3050 1793 1257 1.0 1.3 0.7 30-34 2336539 1155397 1181142 3892 1720 2171 1.7 1.5 1.8 35-39 2265307 1096690 1168617 4764 2797 1967 2.1 2.6 1.7

National Series: Socio-economic and Demographic Report Page 289
Table M01: Deaths in the Last 12 Months by Residence, Age and Sex of the Deceased, 2011
Age Total Population Deaths Within 12 Months Prior to the Survey Age Specific Mortality Rates (Total Deaths/1,000)
Total Males Female Total Male Female Total Male Female 1 2 3 4 5 6 7 8 9 10
40-44 1879200 975853 903347 5839 4178 1662 3.1 4.3 1.8 45-49 1555940 796696 759245 5134 3712 1422 3.3 4.7 1.9 50-54 1327026 704157 622869 5311 3359 1952 4.0 4.8 3.1 55-59 911630 467093 444537 6145 4767 1379 6.7 10.2 3.1 60-64 968993 495771 473222 13724 9514 4210 14.2 19.2 8.9 65+ 1683959 878061 805898 70786 34840 35946 42.0 39.7 44.6 Urban Total 11872119 5883016 5989103 54719 31065 23655 4.6 5.3 3.9 0 227355 112382 114973 5726 3944 1782 25.2 35.1 15.5 1 187819 101053 86766 1496 0 1496 8.0 0.0 17.2 2 212588 107725 104863 0 0 0 0.0 0.0 0.0 3 254490 128569 125921 271 142 129 1.1 1.1 1.0 4 209172 111365 97808 511 276 234 2.4 2.5 2.4 1-4 864068 448712 415357 2278 418 1860 2.6 0.9 4.5 5-9 1245593 619004 626589 1755 1557 197 1.4 2.5 0.3 10-14 1261870 629170 632701 610 610 0 0.5 1.0 0.0 15-19 1148793 538474 610318 1757 1147 610 1.5 2.1 1.0 20-24 1166916 482783 684133 1251 199 1052 1.1 0.4 1.5 25-29 1279754 578480 701274 1087 889 197 0.8 1.5 0.3 30-34 939264 472869 466395 1350 739 610 1.4 1.6 1.3 35-39 921048 435054 485994 1757 809 947 1.9 1.9 1.9 40-44 766198 415568 350630 1914 694 1220 2.5 1.7 3.5 45-49 620986 349132 271855 2295 1685 610 3.7 4.8 2.2 50-54 461228 263658 197571 2583 2310 273 5.6 8.8 1.4 55-59 324001 183635 140367 2673 1454 1219 8.2 7.9 8.7 60-64 269969 157233 112736 2581 2277 304 9.6 14.5 2.7 65+ 375074 196863 178211 25103 12331 12772 66.9 62.6 71.7 Khulna
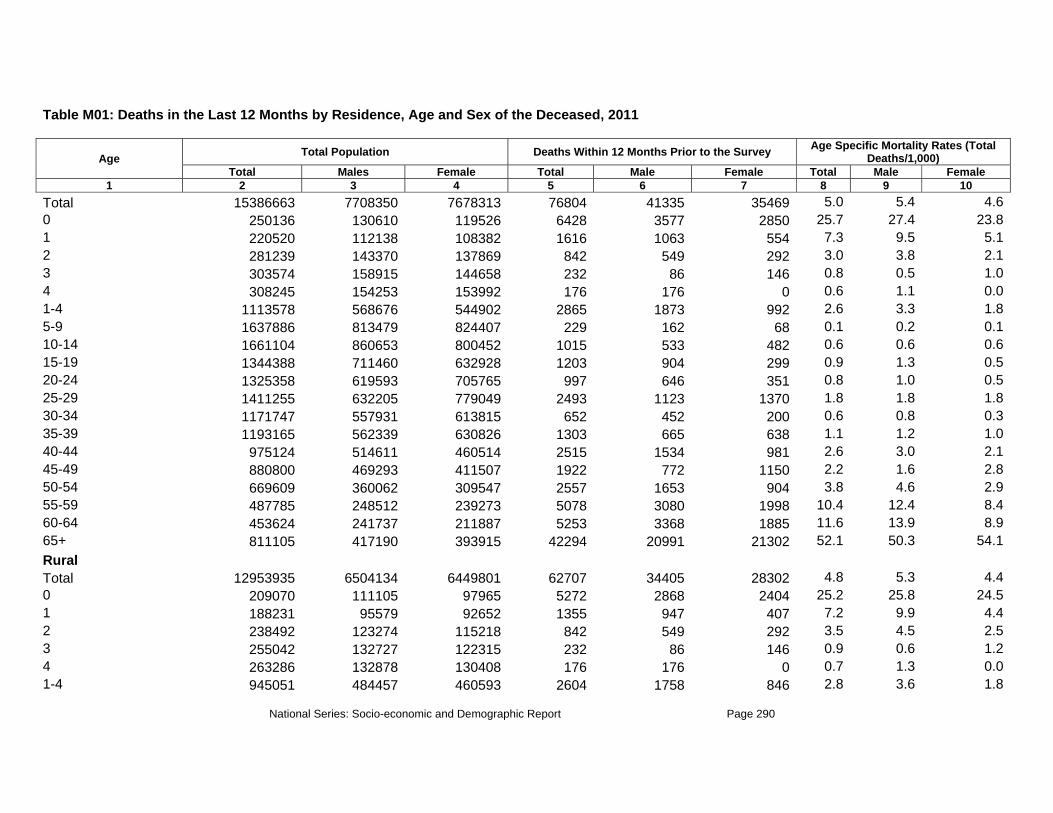
National Series: Socio-economic and Demographic Report Page 290
Table M01: Deaths in the Last 12 Months by Residence, Age and Sex of the Deceased, 2011
Age Total Population Deaths Within 12 Months Prior to the Survey Age Specific Mortality Rates (Total Deaths/1,000)
Total Males Female Total Male Female Total Male Female 1 2 3 4 5 6 7 8 9 10
Total 15386663 7708350 7678313 76804 41335 35469 5.0 5.4 4.6 0 250136 130610 119526 6428 3577 2850 25.7 27.4 23.8 1 220520 112138 108382 1616 1063 554 7.3 9.5 5.1 2 281239 143370 137869 842 549 292 3.0 3.8 2.1 3 303574 158915 144658 232 86 146 0.8 0.5 1.0 4 308245 154253 153992 176 176 0 0.6 1.1 0.0 1-4 1113578 568676 544902 2865 1873 992 2.6 3.3 1.8 5-9 1637886 813479 824407 229 162 68 0.1 0.2 0.1 10-14 1661104 860653 800452 1015 533 482 0.6 0.6 0.6 15-19 1344388 711460 632928 1203 904 299 0.9 1.3 0.5 20-24 1325358 619593 705765 997 646 351 0.8 1.0 0.5 25-29 1411255 632205 779049 2493 1123 1370 1.8 1.8 1.8 30-34 1171747 557931 613815 652 452 200 0.6 0.8 0.3 35-39 1193165 562339 630826 1303 665 638 1.1 1.2 1.0 40-44 975124 514611 460514 2515 1534 981 2.6 3.0 2.1 45-49 880800 469293 411507 1922 772 1150 2.2 1.6 2.8 50-54 669609 360062 309547 2557 1653 904 3.8 4.6 2.9 55-59 487785 248512 239273 5078 3080 1998 10.4 12.4 8.4 60-64 453624 241737 211887 5253 3368 1885 11.6 13.9 8.9 65+ 811105 417190 393915 42294 20991 21302 52.1 50.3 54.1 Rural Total 12953935 6504134 6449801 62707 34405 28302 4.8 5.3 4.4 0 209070 111105 97965 5272 2868 2404 25.2 25.8 24.5 1 188231 95579 92652 1355 947 407 7.2 9.9 4.4 2 238492 123274 115218 842 549 292 3.5 4.5 2.5 3 255042 132727 122315 232 86 146 0.9 0.6 1.2 4 263286 132878 130408 176 176 0 0.7 1.3 0.0 1-4 945051 484457 460593 2604 1758 846 2.8 3.6 1.8

National Series: Socio-economic and Demographic Report Page 291
Table M01: Deaths in the Last 12 Months by Residence, Age and Sex of the Deceased, 2011
Age Total Population Deaths Within 12 Months Prior to the Survey Age Specific Mortality Rates (Total Deaths/1,000)
Total Males Female Total Male Female Total Male Female 1 2 3 4 5 6 7 8 9 10
5-9 1399008 692740 706268 229 162 68 0.2 0.2 0.1 10-14 1398848 724481 674367 952 533 419 0.7 0.7 0.6 15-19 1126690 605501 521189 1041 742 299 0.9 1.2 0.6 20-24 1118485 529215 589270 934 583 351 0.8 1.1 0.6 25-29 1181145 532325 648819 1833 885 949 1.6 1.7 1.5 30-34 972064 466719 505345 589 452 137 0.6 1.0 0.3 35-39 996108 468607 527501 750 322 429 0.8 0.7 0.8 40-44 808049 425060 382989 2008 1226 783 2.5 2.9 2.0 45-49 731547 389893 341654 1669 645 1023 2.3 1.7 3.0 50-54 559998 298386 261612 1960 1411 549 3.5 4.7 2.1 55-59 410448 203157 207291 3930 2403 1526 9.6 11.8 7.4 60-64 393569 208884 184685 4497 3166 1331 11.4 15.2 7.2 65+ 703856 363605 340250 34438 17249 17189 48.9 47.4 50.5 Urban Total 2432728 1204215 1228512 14098 6930 7167 5.8 5.8 5.8 0 41066 19505 21561 1156 709 446 28.1 36.3 20.7 1 32289 16559 15730 261 115 146 8.1 6.9 9.3 2 42747 20096 22651 0 0 0 0.0 0.0 0.0 3 48532 26188 22343 0 0 0 0.0 0.0 0.0 4 44959 21375 23584 0 0 0 0.0 0.0 0.0 1-4 168527 84219 84308 261 115 146 1.5 1.4 1.7 5-9 238878 120739 118139 0 0 0 0.0 0.0 0.0 10-14 262256 136172 126084 63 0 63 0.2 0.0 0.5 15-19 217698 105959 111739 162 162 0 0.7 1.5 0.0 20-24 206873 90378 116495 63 63 0 0.3 0.7 0.0 25-29 230110 99880 130230 660 239 421 2.9 2.4 3.2 30-34 199683 91212 108470 63 0 63 0.3 0.0 0.6 35-39 197057 93732 103325 553 343 209 2.8 3.7 2.0

National Series: Socio-economic and Demographic Report Page 292
Table M01: Deaths in the Last 12 Months by Residence, Age and Sex of the Deceased, 2011
Age Total Population Deaths Within 12 Months Prior to the Survey Age Specific Mortality Rates (Total Deaths/1,000)
Total Males Female Total Male Female Total Male Female 1 2 3 4 5 6 7 8 9 10
40-44 167075 89551 77524 506 308 198 3.0 3.4 2.6 45-49 149253 79400 69853 253 127 127 1.7 1.6 1.8 50-54 109611 61676 47935 596 242 354 5.4 3.9 7.4 55-59 77337 45355 31982 1148 677 471 14.8 14.9 14.7 60-64 60054 32853 27202 756 202 554 12.6 6.1 20.4 65+ 107249 53585 53664 7856 3743 4113 73.3 69.9 76.6 Rajshahi Total 18027522 9026491 9001031 70530 39337 31192 3.9 4.4 3.5 0 282807 152216 130591 7738 4872 2866 27.4 32.0 21.9 1 270711 130554 140157 1800 677 1123 6.6 5.2 8.0 2 366110 186009 180101 570 570 0 1.6 3.1 0.0 3 382832 192795 190036 0 0 0 0.0 0.0 0.0 4 366604 176853 189751 222 0 222 0.6 0.0 1.2 1-4 1386257 686211 700046 2593 1247 1346 1.9 1.8 1.9 5-9 2017516 983139 1034377 575 399 176 0.3 0.4 0.2 10-14 1896658 983044 913614 1026 622 404 0.5 0.6 0.4 15-19 1530638 817300 713338 902 360 542 0.6 0.4 0.8 20-24 1599560 736981 862579 2296 1628 668 1.4 2.2 0.8 25-29 1747612 805474 942138 694 449 245 0.4 0.6 0.3 30-34 1388028 676695 711333 1736 547 1189 1.3 0.8 1.7 35-39 1350277 639880 710397 2126 1260 867 1.6 2.0 1.2 40-44 1151415 618910 532506 1358 400 958 1.2 0.6 1.8 45-49 961453 503364 458088 3043 1632 1411 3.2 3.2 3.1 50-54 758685 420461 338223 3673 2259 1414 4.8 5.4 4.2 55-59 529623 263975 265648 3433 1573 1860 6.5 6.0 7.0 60-64 528607 275353 253254 5648 3945 1703 10.7 14.3 6.7 65+ 898385 463486 434899 33688 18145 15544 37.5 39.1 35.7 Rural

National Series: Socio-economic and Demographic Report Page 293
Table M01: Deaths in the Last 12 Months by Residence, Age and Sex of the Deceased, 2011
Age Total Population Deaths Within 12 Months Prior to the Survey Age Specific Mortality Rates (Total Deaths/1,000)
Total Males Female Total Male Female Total Male Female 1 2 3 4 5 6 7 8 9 10
Total 15137596 7600602 7536994 59075 33120 25956 3.9 4.4 3.4 0 241560 131907 109652 6741 4213 2528 27.9 31.9 23.1 1 224583 109503 115079 1760 637 1123 7.8 5.8 9.8 2 308029 158609 149421 570 570 0 1.9 3.6 0.0 3 329492 166756 162735 0 0 0 0.0 0.0 0.0 4 314624 150082 164541 222 0 222 0.7 0.0 1.3 1-4 1176728 584951 591777 2553 1207 1346 2.2 2.1 2.3 5-9 1720462 839300 881162 575 399 176 0.3 0.5 0.2 10-14 1599437 836193 763244 796 473 323 0.5 0.6 0.4 15-19 1264971 686003 578968 902 360 542 0.7 0.5 0.9 20-24 1328724 615807 712917 1484 965 519 1.1 1.6 0.7 25-29 1459756 667897 791860 694 449 245 0.5 0.7 0.3 30-34 1162065 570048 592016 1463 547 916 1.3 1.0 1.5 35-39 1135312 539701 595611 1390 916 473 1.2 1.7 0.8 40-44 955197 515600 439597 1278 360 918 1.3 0.7 2.1 45-49 790566 413262 377304 2021 832 1189 2.6 2.0 3.2 50-54 637349 349063 288286 3187 1773 1414 5.0 5.1 4.9 55-59 443570 221720 221850 1988 694 1294 4.5 3.1 5.8 60-64 447869 231683 216186 4762 3527 1235 10.6 15.2 5.7 65+ 774032 397467 376565 29240 16405 12835 37.8 41.3 34.1 Urban Total 2889925 1425889 1464036 11455 6218 5237 4.0 4.4 3.6 0 41247 20309 20938 997 659 337 24.2 32.4 16.1 1 46129 21051 25078 40 40 0 0.9 1.9 0.0 2 58081 27401 30680 0 0 0 0.0 0.0 0.0 3 53340 26039 27301 0 0 0 0.0 0.0 0.0 4 51980 26770 25209 0 0 0 0.0 0.0 0.0 1-4 209529 101261 108269 40 40 0 0.2 0.4 0.0
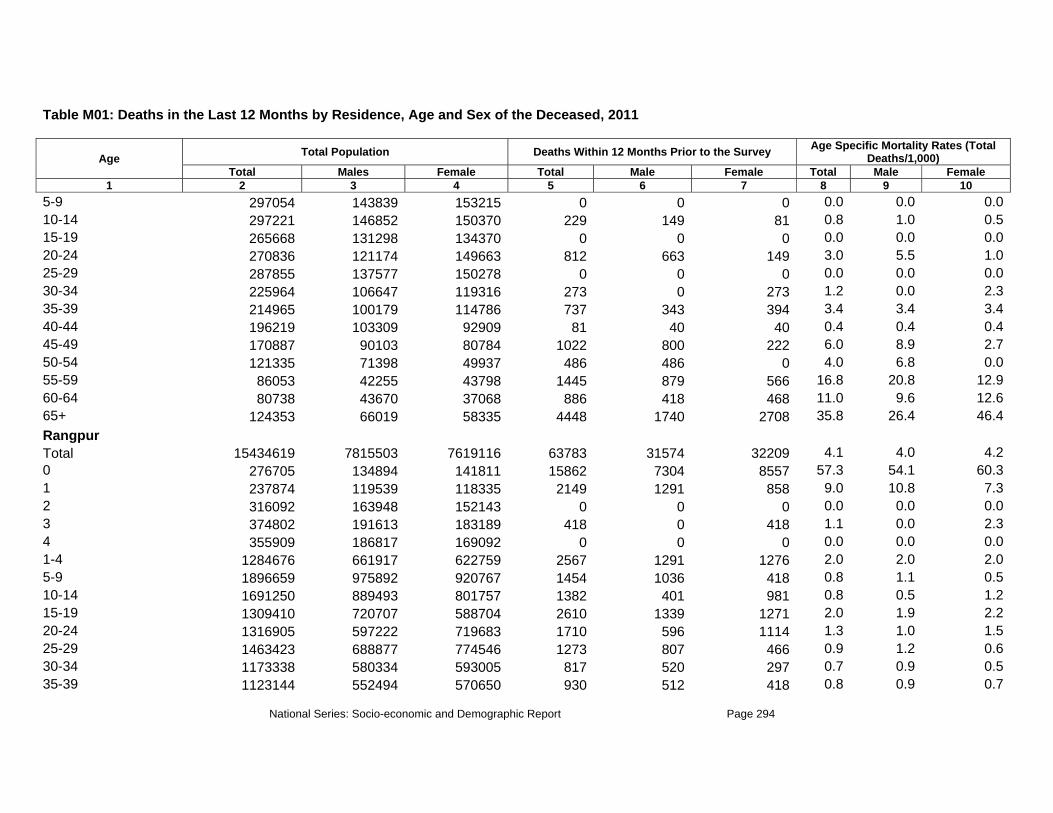
National Series: Socio-economic and Demographic Report Page 294
Table M01: Deaths in the Last 12 Months by Residence, Age and Sex of the Deceased, 2011
Age Total Population Deaths Within 12 Months Prior to the Survey Age Specific Mortality Rates (Total Deaths/1,000)
Total Males Female Total Male Female Total Male Female 1 2 3 4 5 6 7 8 9 10
5-9 297054 143839 153215 0 0 0 0.0 0.0 0.0 10-14 297221 146852 150370 229 149 81 0.8 1.0 0.5 15-19 265668 131298 134370 0 0 0 0.0 0.0 0.0 20-24 270836 121174 149663 812 663 149 3.0 5.5 1.0 25-29 287855 137577 150278 0 0 0 0.0 0.0 0.0 30-34 225964 106647 119316 273 0 273 1.2 0.0 2.3 35-39 214965 100179 114786 737 343 394 3.4 3.4 3.4 40-44 196219 103309 92909 81 40 40 0.4 0.4 0.4 45-49 170887 90103 80784 1022 800 222 6.0 8.9 2.7 50-54 121335 71398 49937 486 486 0 4.0 6.8 0.0 55-59 86053 42255 43798 1445 879 566 16.8 20.8 12.9 60-64 80738 43670 37068 886 418 468 11.0 9.6 12.6 65+ 124353 66019 58335 4448 1740 2708 35.8 26.4 46.4 Rangpur Total 15434619 7815503 7619116 63783 31574 32209 4.1 4.0 4.2 0 276705 134894 141811 15862 7304 8557 57.3 54.1 60.3 1 237874 119539 118335 2149 1291 858 9.0 10.8 7.3 2 316092 163948 152143 0 0 0 0.0 0.0 0.0 3 374802 191613 183189 418 0 418 1.1 0.0 2.3 4 355909 186817 169092 0 0 0 0.0 0.0 0.0 1-4 1284676 661917 622759 2567 1291 1276 2.0 2.0 2.0 5-9 1896659 975892 920767 1454 1036 418 0.8 1.1 0.5 10-14 1691250 889493 801757 1382 401 981 0.8 0.5 1.2 15-19 1309410 720707 588704 2610 1339 1271 2.0 1.9 2.2 20-24 1316905 597222 719683 1710 596 1114 1.3 1.0 1.5 25-29 1463423 688877 774546 1273 807 466 0.9 1.2 0.6 30-34 1173338 580334 593005 817 520 297 0.7 0.9 0.5 35-39 1123144 552494 570650 930 512 418 0.8 0.9 0.7
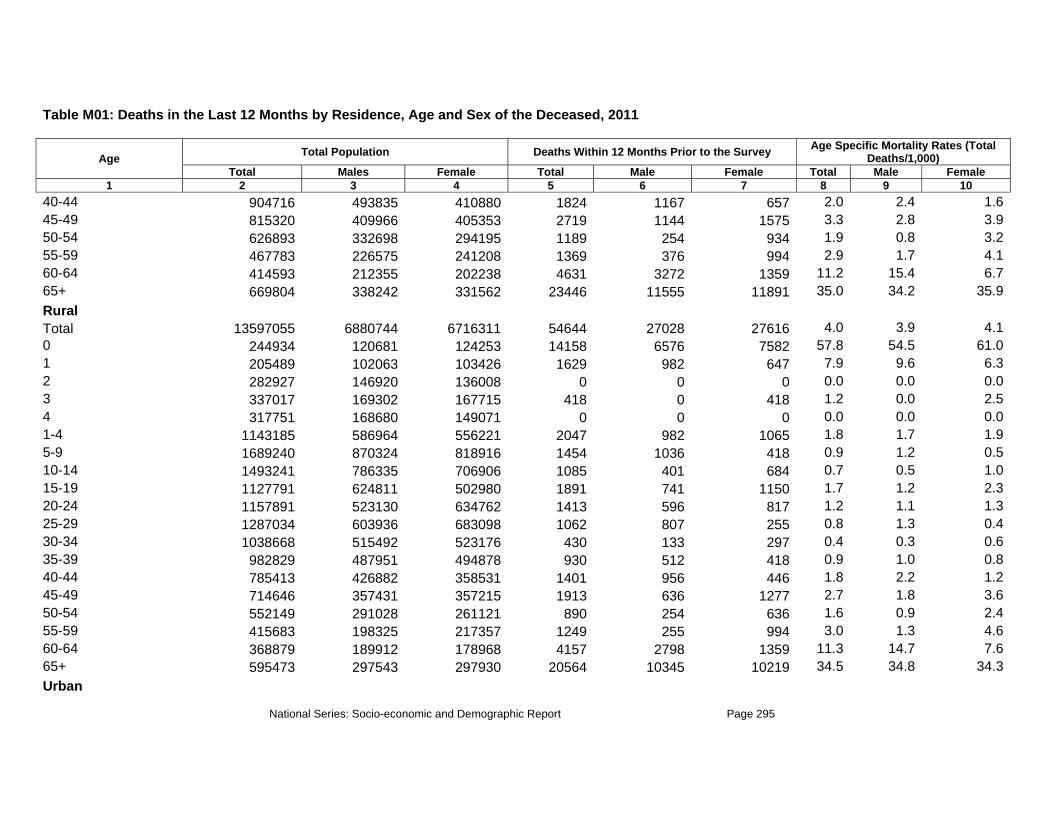
National Series: Socio-economic and Demographic Report Page 295
Table M01: Deaths in the Last 12 Months by Residence, Age and Sex of the Deceased, 2011
Age Total Population Deaths Within 12 Months Prior to the Survey Age Specific Mortality Rates (Total Deaths/1,000)
Total Males Female Total Male Female Total Male Female 1 2 3 4 5 6 7 8 9 10
40-44 904716 493835 410880 1824 1167 657 2.0 2.4 1.6 45-49 815320 409966 405353 2719 1144 1575 3.3 2.8 3.9 50-54 626893 332698 294195 1189 254 934 1.9 0.8 3.2 55-59 467783 226575 241208 1369 376 994 2.9 1.7 4.1 60-64 414593 212355 202238 4631 3272 1359 11.2 15.4 6.7 65+ 669804 338242 331562 23446 11555 11891 35.0 34.2 35.9 Rural Total 13597055 6880744 6716311 54644 27028 27616 4.0 3.9 4.1 0 244934 120681 124253 14158 6576 7582 57.8 54.5 61.0 1 205489 102063 103426 1629 982 647 7.9 9.6 6.3 2 282927 146920 136008 0 0 0 0.0 0.0 0.0 3 337017 169302 167715 418 0 418 1.2 0.0 2.5 4 317751 168680 149071 0 0 0 0.0 0.0 0.0 1-4 1143185 586964 556221 2047 982 1065 1.8 1.7 1.9 5-9 1689240 870324 818916 1454 1036 418 0.9 1.2 0.5 10-14 1493241 786335 706906 1085 401 684 0.7 0.5 1.0 15-19 1127791 624811 502980 1891 741 1150 1.7 1.2 2.3 20-24 1157891 523130 634762 1413 596 817 1.2 1.1 1.3 25-29 1287034 603936 683098 1062 807 255 0.8 1.3 0.4 30-34 1038668 515492 523176 430 133 297 0.4 0.3 0.6 35-39 982829 487951 494878 930 512 418 0.9 1.0 0.8 40-44 785413 426882 358531 1401 956 446 1.8 2.2 1.2 45-49 714646 357431 357215 1913 636 1277 2.7 1.8 3.6 50-54 552149 291028 261121 890 254 636 1.6 0.9 2.4 55-59 415683 198325 217357 1249 255 994 3.0 1.3 4.6 60-64 368879 189912 178968 4157 2798 1359 11.3 14.7 7.6 65+ 595473 297543 297930 20564 10345 10219 34.5 34.8 34.3 Urban

National Series: Socio-economic and Demographic Report Page 296
Table M01: Deaths in the Last 12 Months by Residence, Age and Sex of the Deceased, 2011
Age Total Population Deaths Within 12 Months Prior to the Survey Age Specific Mortality Rates (Total Deaths/1,000)
Total Males Female Total Male Female Total Male Female 1 2 3 4 5 6 7 8 9 10
Total 1837563 934758 902805 9139 4546 4593 5.0 4.9 5.1 0 31771 14213 17558 1704 728 976 53.6 51.2 55.6 1 32384 17476 14908 520 309 211 16.1 17.7 14.2 2 33164 17029 16135 0 0 0 0.0 0.0 0.0 3 37785 22311 15474 0 0 0 0.0 0.0 0.0 4 38158 18137 20021 0 0 0 0.0 0.0 0.0 1-4 141491 74952 66538 520 309 211 3.7 4.1 3.2 5-9 207419 105568 101851 0 0 0 0.0 0.0 0.0 10-14 198008 103157 94851 297 0 297 1.5 0.0 3.1 15-19 181619 95896 85723 719 598 121 4.0 6.2 1.4 20-24 159014 74093 84921 297 0 297 1.9 0.0 3.5 25-29 176389 84941 91448 211 0 211 1.2 0.0 2.3 30-34 134670 64841 69829 387 387 0 2.9 6.0 0.0 35-39 140316 64544 75772 0 0 0 0.0 0.0 0.0 40-44 119303 66954 52349 423 211 211 3.5 3.2 4.0 45-49 100674 52535 48138 806 508 297 8.0 9.7 6.2 50-54 74744 41670 33074 299 0 299 4.0 0.0 9.0 55-59 52100 28250 23851 121 121 0 2.3 4.3 0.0 60-64 45713 22444 23270 474 474 0 10.4 21.1 0.0 65+ 74332 40699 33632 2882 1210 1672 38.8 29.7 49.7 Sylhet Total 9181937 4567650 4614287 40411 24203 16208 4.4 5.3 3.5 0 189800 97340 92460 5617 3584 2033 29.6 36.8 22.0 1 165556 88045 77511 1781 1455 326 10.8 16.5 4.2 2 250335 132758 117578 803 413 390 3.2 3.1 3.3 3 271958 133643 138315 731 385 346 2.7 2.9 2.5 4 259578 135449 124129 372 189 183 1.4 1.4 1.5 1-4 947428 489895 457533 3686 2442 1245 3.9 5.0 2.7

National Series: Socio-economic and Demographic Report Page 297
Table M01: Deaths in the Last 12 Months by Residence, Age and Sex of the Deceased, 2011
Age Total Population Deaths Within 12 Months Prior to the Survey Age Specific Mortality Rates (Total Deaths/1,000)
Total Males Female Total Male Female Total Male Female 1 2 3 4 5 6 7 8 9 10
5-9 1342584 693037 649548 852 689 163 0.6 1.0 0.3 10-14 1134660 594658 540003 942 346 596 0.8 0.6 1.1 15-19 876231 445133 431098 1044 428 615 1.2 1.0 1.4 20-24 739194 348927 390267 592 222 370 0.8 0.6 0.9 25-29 719029 321800 397229 372 183 189 0.5 0.6 0.5 30-34 566816 247648 319168 578 428 150 1.0 1.7 0.5 35-39 570488 271392 299097 650 246 405 1.1 0.9 1.4 40-44 480549 244234 236315 1098 708 390 2.3 2.9 1.7 45-49 395327 191143 204184 2491 1215 1276 6.3 6.4 6.2 50-54 344300 174060 170239 2532 1953 578 7.4 11.2 3.4 55-59 197384 97612 99772 2187 969 1218 11.1 9.9 12.2 60-64 253106 135236 117870 3704 2857 848 14.6 21.1 7.2 65+ 425041 215537 209503 14066 7933 6133 33.1 36.8 29.3 Rural Total 8078086 4018363 4059723 36436 21402 15034 4.5 5.3 3.7 0 171423 87874 83549 5001 3123 1877 29.2 35.5 22.5 1 144317 77788 66529 1742 1416 326 12.1 18.2 4.9 2 224207 119676 104531 803 413 390 3.6 3.5 3.7 3 243662 118936 124725 692 346 346 2.8 2.9 2.8 4 232044 122243 109801 333 150 183 1.4 1.2 1.7 1-4 844230 438643 405587 3570 2325 1245 4.2 5.3 3.1 5-9 1208287 623048 585239 852 689 163 0.7 1.1 0.3 10-14 1010611 527813 482798 942 346 596 0.9 0.7 1.2 15-19 763473 389452 374021 966 390 577 1.3 1.0 1.5 20-24 639350 304010 335340 553 183 370 0.9 0.6 1.1 25-29 614969 273862 341108 333 183 150 0.5 0.7 0.4 30-34 490234 209741 280493 539 390 150 1.1 1.9 0.5 35-39 495110 234923 260188 572 207 366 1.2 0.9 1.4

National Series: Socio-economic and Demographic Report Page 298
Table M01: Deaths in the Last 12 Months by Residence, Age and Sex of the Deceased, 2011
Age Total Population Deaths Within 12 Months Prior to the Survey Age Specific Mortality Rates (Total Deaths/1,000)
Total Males Female Total Male Female Total Male Female 1 2 3 4 5 6 7 8 9 10
40-44 415393 211893 203500 942 553 390 2.3 2.6 1.9 45-49 345577 165989 179588 2258 1059 1198 6.5 6.4 6.7 50-54 303298 153533 149765 2415 1875 539 8.0 12.2 3.6 55-59 168438 83037 85402 1675 496 1179 9.9 6.0 13.8 60-64 227211 121445 105766 3510 2701 809 15.4 22.2 7.6 65+ 380480 193101 187380 12308 6882 5425 32.3 35.6 29.0 Urban Total 1103851 549288 554564 3975 2801 1174 3.6 5.1 2.1 0 18377 9465 8911 616 461 156 33.5 48.7 17.5 1 21239 10257 10982 39 39 0 1.8 3.8 0.0 2 26128 13082 13047 0 0 0 0.0 0.0 0.0 3 28297 14706 13590 39 39 0 1.4 2.7 0.0 4 27533 13206 14327 39 39 0 1.4 3.0 0.0 1-4 103197 51251 51946 117 117 0 1.1 2.3 0.0 5-9 134297 69989 64308 0 0 0 0.0 0.0 0.0 10-14 124049 66844 57205 0 0 0 0.0 0.0 0.0 15-19 112758 55680 57077 78 39 39 0.7 0.7 0.7 20-24 99844 44917 54927 39 39 0 0.4 0.9 0.0 25-29 104059 47938 56122 39 0 39 0.4 0.0 0.7 30-34 76582 37907 38675 39 39 0 0.5 1.0 0.0 35-39 75378 36469 38909 78 39 39 1.0 1.1 1.0 40-44 65157 32341 32816 156 156 0 2.4 4.8 0.0 45-49 49750 25155 24596 233 156 78 4.7 6.2 3.2 50-54 41002 20527 20474 117 78 39 2.9 3.8 1.9 55-59 28946 14575 14371 512 473 39 17.7 32.5 2.7 60-64 25895 13791 12104 194 156 39 7.5 11.3 3.2 65+ 44560 22437 22124 1758 1050 707 39.5 46.8 32.0

National Series: Socio-economic and Demographic Report Page 299
Table M02: Deaths in the Last 12 Months by Residence, Place of Death, Age and Sex of the Deceased, 2011
Age Place of Death
Total Home Hospital Others 1 2 3 4 5
Total 667709 77.0 17.3 5.70 92946 69.4 29.2 1.41-4 32025 77.7 13.6 8.75-9 14729 73.2 16.3 10.510-14 9930 62.2 19.5 18.315-29 41801 57.0 29.2 13.830-59 133019 65.9 23.6 10.560+ 343260 86.4 10.5 3.1 Male 381223 73.7 19.0 7.30 57200 66.8 31.3 2.01-4 18526 74.4 16.3 9.25-9 9005 72.2 15.4 12.510-14 6400 57.9 17.5 24.615-29 21264 52.0 27.1 20.930-59 80192 60.8 25.1 14.160+ 188635 84.3 12.2 3.5 Female 286486 81.4 15.1 3.50 35746 73.6 25.9 0.51-4 13498 82.2 9.8 8.05-9 5724 74.9 17.8 7.310-14 3529 69.9 23.1 7.015-29 20537 62.3 31.2 6.530-59 52827 73.5 21.4 5.060+ 154625 88.9 8.4 2.7Rural Total 530771 79.4 14.9 5.70 76325 70.2 28.7 1.11-4 26546 77.6 13.7 8.75-9 11998 68.9 18.3 12.810-14 7928 63.1 16.3 20.615-29 32056 60.7 25.9 13.430-59 99272 69.5 20.4 10.060+ 276645 88.7 7.9 3.5 Male 302414 76.6 16.1 7.30 46995 68.6 29.9 1.41-4 15818 76.6 14.6 8.85-9 6656 65.5 17.6 16.810-14 5012 57.7 13.8 28.415-29 15886 55.7 22.1 22.230-59 58646 65.2 20.9 13.960+ 153400 86.7 9.5 3.7 Female 228356 83.0 13.4 3.6

National Series: Socio-economic and Demographic Report Page 300
Table M02: Deaths in the Last 12 Months by Residence, Place of Death, Age and Sex of the Deceased, 2011
Age Place of Death
Total Home Hospital Others 1 2 3 4 5
0 29330 72.7 26.7 0.61-4 10728 79.2 12.3 8.55-9 5342 73.1 19.1 7.810-14 2916 72.3 20.6 7.115-29 16169 65.7 29.5 4.830-59 40626 75.8 19.7 4.560+ 123245 91.1 5.8 3.1Urban Total 136938 67.9 26.4 5.70 16621 65.6 31.6 2.81-4 5478 78.0 13.1 8.95-9 2730 92.3 7.7 0.010-14 2002 58.6 32.0 9.415-29 9745 44.8 40.0 15.230-59 33747 55.1 33.1 11.860+ 66615 76.7 21.4 1.9 Male 78809 62.5 30.0 7.50 10205 58.1 37.4 4.51-4 2708 61.9 26.5 11.65-9 2348 91.1 8.9 0.010-14 1388 58.5 30.8 10.715-29 5378 41.0 42.0 17.030-59 21546 49.0 36.4 14.660+ 35235 73.6 23.8 2.6
Female 58129 75.2 21.4 3.40 6416 77.6 22.4 0.01-4 2770 93.8 0.0 6.25-9 382 100.0 0.0 0.010-14 613 58.8 34.7 6.615-29 4367 49.5 37.6 12.930-59 12201 65.8 27.1 7.060+ 31380 80.3 18.6 1.1Barisal Division Total 45169 78.2 15.5 6.40 5707 62.3 34.4 3.21-4 3076 72.3 19.8 7.95-9 967 100.0 0.0 0.010-14 885 31.0 69.0 0.015-29 3183 60.1 25.6 14.330-59 8743 68.3 19.7 12.060+ 22608 90.3 5.6 4.2 Male 23589 74.4 16.9 8.70 3815 69.4 25.8 4.8
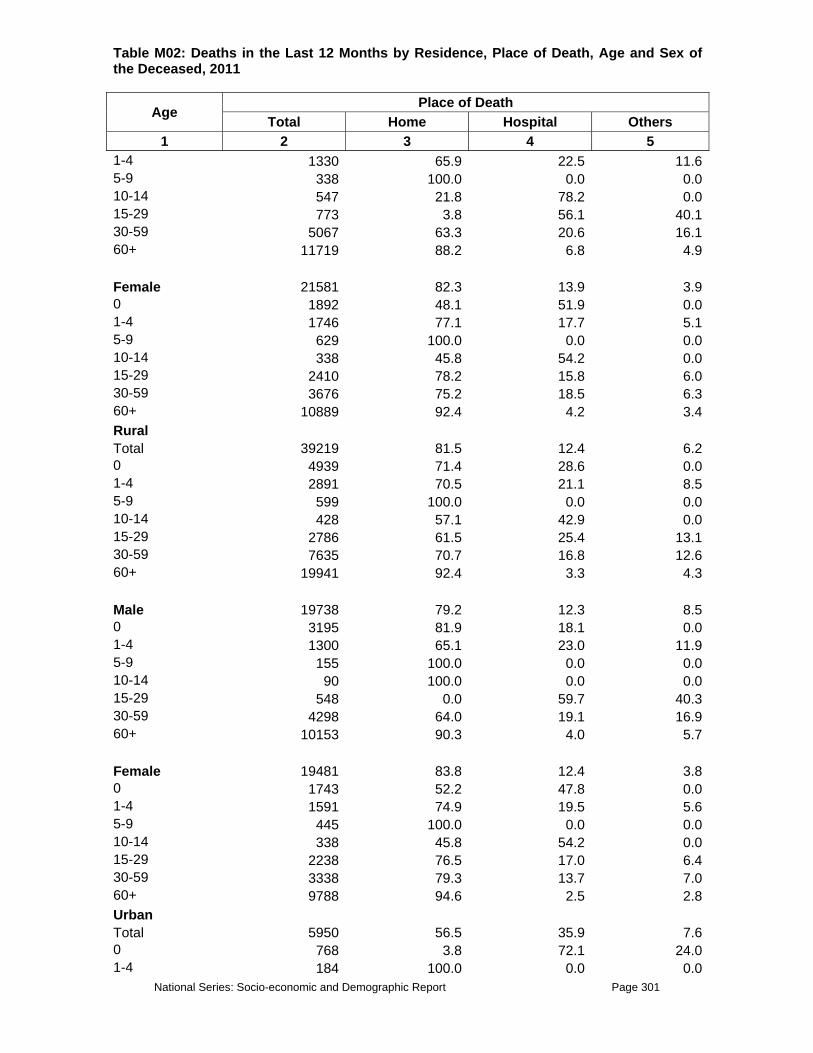
National Series: Socio-economic and Demographic Report Page 301
Table M02: Deaths in the Last 12 Months by Residence, Place of Death, Age and Sex of the Deceased, 2011
Age Place of Death
Total Home Hospital Others 1 2 3 4 5
1-4 1330 65.9 22.5 11.65-9 338 100.0 0.0 0.010-14 547 21.8 78.2 0.015-29 773 3.8 56.1 40.130-59 5067 63.3 20.6 16.160+ 11719 88.2 6.8 4.9 Female 21581 82.3 13.9 3.90 1892 48.1 51.9 0.01-4 1746 77.1 17.7 5.15-9 629 100.0 0.0 0.010-14 338 45.8 54.2 0.015-29 2410 78.2 15.8 6.030-59 3676 75.2 18.5 6.360+ 10889 92.4 4.2 3.4Rural Total 39219 81.5 12.4 6.20 4939 71.4 28.6 0.01-4 2891 70.5 21.1 8.55-9 599 100.0 0.0 0.010-14 428 57.1 42.9 0.015-29 2786 61.5 25.4 13.130-59 7635 70.7 16.8 12.660+ 19941 92.4 3.3 4.3 Male 19738 79.2 12.3 8.50 3195 81.9 18.1 0.01-4 1300 65.1 23.0 11.95-9 155 100.0 0.0 0.010-14 90 100.0 0.0 0.015-29 548 0.0 59.7 40.330-59 4298 64.0 19.1 16.960+ 10153 90.3 4.0 5.7 Female 19481 83.8 12.4 3.80 1743 52.2 47.8 0.01-4 1591 74.9 19.5 5.65-9 445 100.0 0.0 0.010-14 338 45.8 54.2 0.015-29 2238 76.5 17.0 6.430-59 3338 79.3 13.7 7.060+ 9788 94.6 2.5 2.8Urban Total 5950 56.5 35.9 7.60 768 3.8 72.1 24.01-4 184 100.0 0.0 0.0
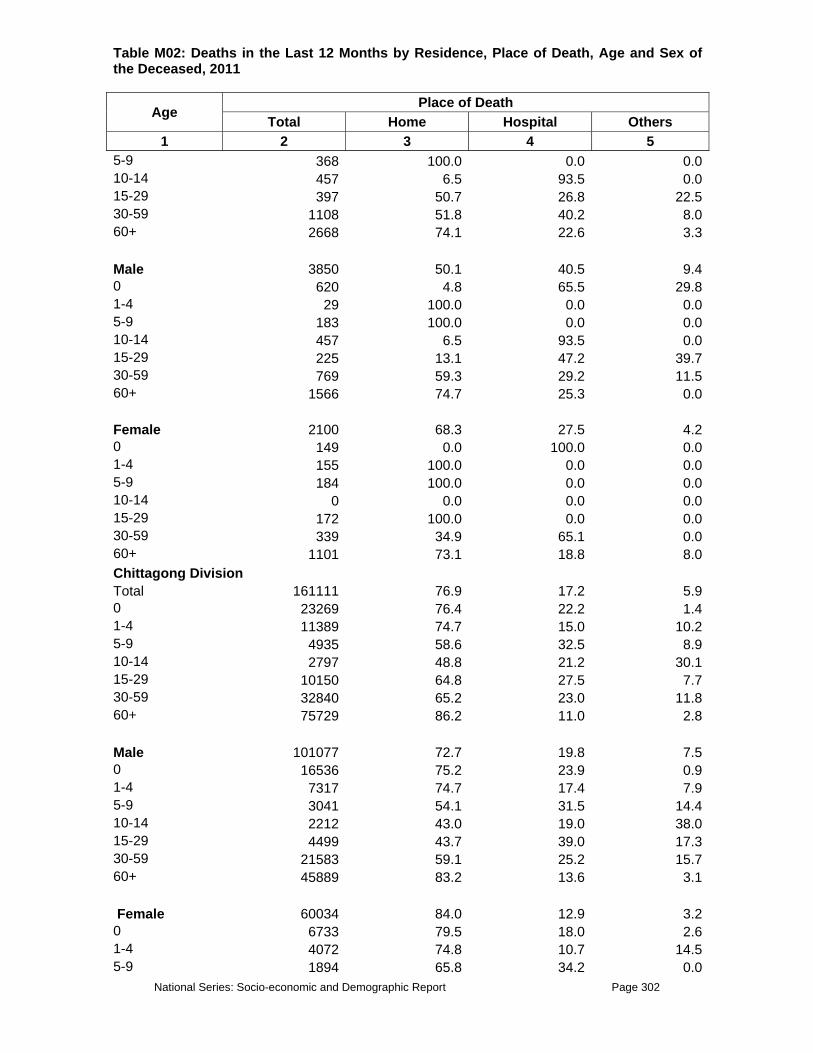
National Series: Socio-economic and Demographic Report Page 302
Table M02: Deaths in the Last 12 Months by Residence, Place of Death, Age and Sex of the Deceased, 2011
Age Place of Death
Total Home Hospital Others 1 2 3 4 5
5-9 368 100.0 0.0 0.010-14 457 6.5 93.5 0.015-29 397 50.7 26.8 22.530-59 1108 51.8 40.2 8.060+ 2668 74.1 22.6 3.3 Male 3850 50.1 40.5 9.40 620 4.8 65.5 29.81-4 29 100.0 0.0 0.05-9 183 100.0 0.0 0.010-14 457 6.5 93.5 0.015-29 225 13.1 47.2 39.730-59 769 59.3 29.2 11.560+ 1566 74.7 25.3 0.0 Female 2100 68.3 27.5 4.20 149 0.0 100.0 0.01-4 155 100.0 0.0 0.05-9 184 100.0 0.0 0.010-14 0 0.0 0.0 0.015-29 172 100.0 0.0 0.030-59 339 34.9 65.1 0.060+ 1101 73.1 18.8 8.0Chittagong Division Total 161111 76.9 17.2 5.90 23269 76.4 22.2 1.41-4 11389 74.7 15.0 10.25-9 4935 58.6 32.5 8.910-14 2797 48.8 21.2 30.115-29 10150 64.8 27.5 7.730-59 32840 65.2 23.0 11.860+ 75729 86.2 11.0 2.8 Male 101077 72.7 19.8 7.50 16536 75.2 23.9 0.91-4 7317 74.7 17.4 7.95-9 3041 54.1 31.5 14.410-14 2212 43.0 19.0 38.015-29 4499 43.7 39.0 17.330-59 21583 59.1 25.2 15.760+ 45889 83.2 13.6 3.1 Female 60034 84.0 12.9 3.20 6733 79.5 18.0 2.61-4 4072 74.8 10.7 14.55-9 1894 65.8 34.2 0.0

National Series: Socio-economic and Demographic Report Page 303
Table M02: Deaths in the Last 12 Months by Residence, Place of Death, Age and Sex of the Deceased, 2011
Age Place of Death
Total Home Hospital Others 1 2 3 4 5
10-14 586 70.6 29.4 0.015-29 5651 81.6 18.4 0.030-59 11257 76.9 18.7 4.360+ 29840 90.7 7.0 2.2Rural Total 123508 79.3 14.1 6.60 17615 76.9 21.3 1.81-4 9312 78.2 11.1 10.75-9 4327 57.6 32.3 10.110-14 2453 48.6 17.1 34.315-29 7977 71.8 18.4 9.830-59 23104 71.5 15.8 12.760+ 58720 87.1 9.7 3.2 Male 77678 76.0 15.4 8.60 13453 79.6 19.3 1.11-4 5638 79.2 10.6 10.25-9 2433 51.3 30.8 18.010-14 2039 38.2 20.6 41.215-29 3384 58.1 18.8 23.030-59 14911 62.9 19.0 18.160+ 35821 85.0 11.6 3.4 Female 45830 84.9 11.8 3.30 4163 68.1 27.8 4.11-4 3674 76.7 11.9 11.45-9 1894 65.8 34.2 0.010-14 414 100.0 0.0 0.015-29 4593 81.9 18.1 0.030-59 8193 87.1 10.0 2.960+ 22899 90.4 6.7 2.9Urban Total 37602 68.9 27.6 3.50 5654 75.1 24.9 0.01-4 2077 59.2 32.5 8.35-9 608 65.4 34.6 0.010-14 345 50.0 50.0 0.015-29 2173 39.0 61.0 0.030-59 9736 50.4 40.1 9.560+ 17010 83.0 15.7 1.3 Male 23398 61.7 34.5 3.90 3083 56.2 43.8 0.01-4 1679 59.7 40.3 0.05-9 608 65.4 34.6 0.010-14 172 100.0 0.0 0.0

National Series: Socio-economic and Demographic Report Page 304
Table M02: Deaths in the Last 12 Months by Residence, Place of Death, Age and Sex of the Deceased, 2011
Age Place of Death
Total Home Hospital Others 1 2 3 4 5
15-29 1115 0.0 100.0 0.030-59 6672 50.7 39.1 10.260+ 10068 76.9 20.9 2.2 Female 14204 80.9 16.2 2.90 2570 97.9 2.1 0.01-4 398 56.7 0.0 43.35-9 0 0.0 0.0 0.010-14 172 0.0 100.0 0.015-29 1058 80.2 19.8 0.030-59 3064 49.8 42.2 8.060+ 6941 91.9 8.1 0.0Dhaka Division Total 209901 74.0 18.6 7.40 28325 69.8 30.2 0.01-4 5848 74.3 5.2 20.65-9 5716 85.0 9.2 5.710-14 1881 66.4 7.5 26.015-29 12280 49.8 30.9 19.330-59 43656 60.1 25.2 14.760+ 112193 82.7 13.2 4.1 Male 120109 70.4 19.6 10.00 17511 64.2 35.8 0.01-4 3026 58.8 10.0 31.15-9 3340 80.3 9.8 9.810-14 1739 71.8 0.0 28.215-29 7307 54.7 22.5 22.830-59 28223 55.9 24.6 19.460+ 58962 81.2 13.6 5.2 Female 89792 78.8 17.4 3.90 10814 78.8 21.2 0.01-4 2822 90.8 0.0 9.25-9 2376 91.7 8.3 0.010-14 142 0.0 100.0 0.015-29 4973 42.7 43.2 14.130-59 15433 67.6 26.2 6.160+ 53231 84.4 12.7 2.9Rural Total 155181 77.0 15.9 7.10 22599 70.2 29.8 0.01-4 3570 65.6 8.5 25.95-9 3961 78.4 13.3 8.310-14 1271 50.3 11.2 38.515-29 8186 49.1 34.7 16.1

National Series: Socio-economic and Demographic Report Page 305
Table M02: Deaths in the Last 12 Months by Residence, Place of Death, Age and Sex of the Deceased, 2011
Age Place of Death
Total Home Hospital Others 1 2 3 4 5
30-59 31085 62.6 24.4 13.060+ 84509 87.6 7.8 4.6 Male 89044 73.6 16.6 9.80 13567 62.7 37.3 0.01-4 2608 62.8 11.7 25.55-9 1783 63.1 18.4 18.410-14 1129 56.6 0.0 43.415-29 5072 53.4 25.8 20.930-59 20532 61.0 21.0 18.160+ 44354 86.7 7.8 5.5 Female 66137 81.5 15.0 3.50 9032 81.4 18.6 0.01-4 962 73.0 0.0 27.05-9 2179 90.9 9.1 0.010-14 142 0.0 100.0 0.015-29 3114 42.3 49.4 8.330-59 10553 65.9 30.9 3.260+ 40155 88.7 7.7 3.6Urban Total 54719 65.6 26.3 8.10 5726 68.0 32.0 0.01-4 2278 87.9 0.0 12.15-9 1755 100.0 0.0 0.010-14 610 100.0 0.0 0.015-29 4095 51.2 23.1 25.730-59 12571 53.7 27.3 19.060+ 27683 67.8 29.7 2.6 Male 31065 61.3 28.2 10.50 3944 69.1 30.9 0.01-4 418 33.9 0.0 66.15-9 1557 100.0 0.0 0.010-14 610 100.0 0.0 0.015-29 2235 57.6 15.1 27.330-59 7692 42.5 34.4 23.160+ 14608 64.7 31.2 4.2Female Total 23655 71.2 23.9 4.90 1782 65.8 34.2 0.01-4 1860 100.0 0.0 0.05-9 197 100.0 0.0 0.010-14 0 0.0 0.0 0.015-29 1860 43.4 32.8 23.830-59 4880 71.4 16.1 12.5
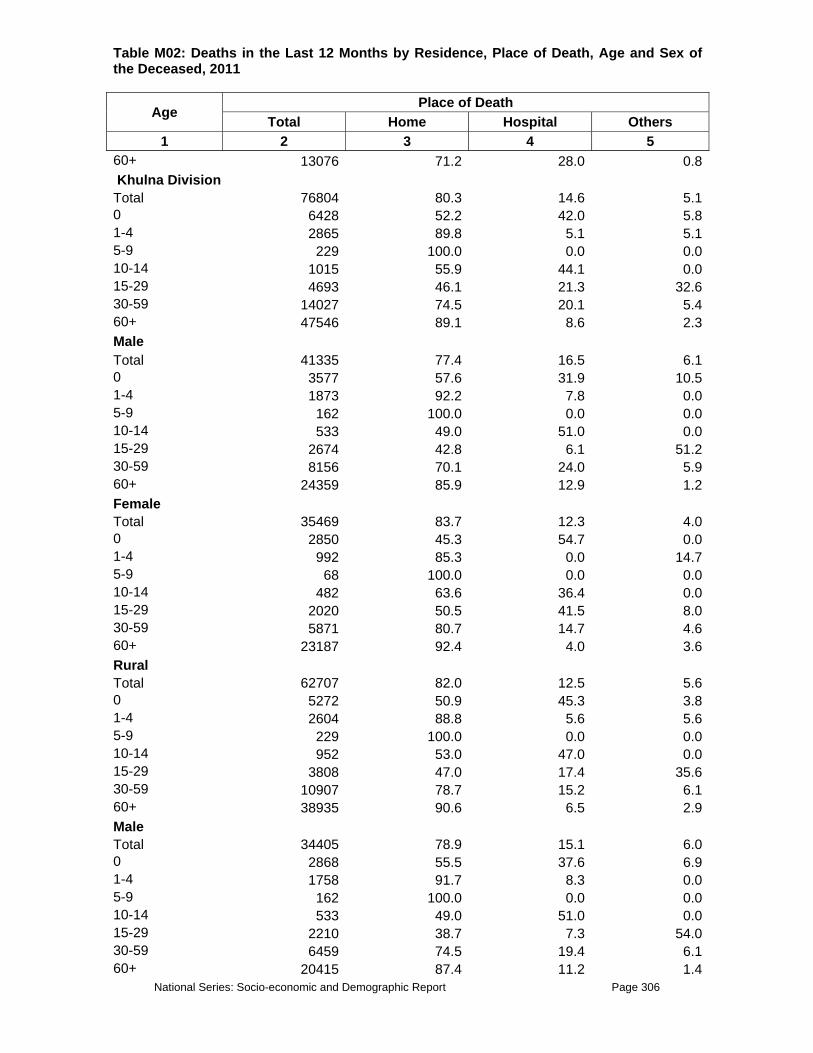
National Series: Socio-economic and Demographic Report Page 306
Table M02: Deaths in the Last 12 Months by Residence, Place of Death, Age and Sex of the Deceased, 2011
Age Place of Death
Total Home Hospital Others 1 2 3 4 5
60+ 13076 71.2 28.0 0.8 Khulna Division Total 76804 80.3 14.6 5.10 6428 52.2 42.0 5.81-4 2865 89.8 5.1 5.15-9 229 100.0 0.0 0.010-14 1015 55.9 44.1 0.015-29 4693 46.1 21.3 32.630-59 14027 74.5 20.1 5.460+ 47546 89.1 8.6 2.3Male Total 41335 77.4 16.5 6.10 3577 57.6 31.9 10.51-4 1873 92.2 7.8 0.05-9 162 100.0 0.0 0.010-14 533 49.0 51.0 0.015-29 2674 42.8 6.1 51.230-59 8156 70.1 24.0 5.960+ 24359 85.9 12.9 1.2Female Total 35469 83.7 12.3 4.00 2850 45.3 54.7 0.01-4 992 85.3 0.0 14.75-9 68 100.0 0.0 0.010-14 482 63.6 36.4 0.015-29 2020 50.5 41.5 8.030-59 5871 80.7 14.7 4.660+ 23187 92.4 4.0 3.6Rural Total 62707 82.0 12.5 5.60 5272 50.9 45.3 3.81-4 2604 88.8 5.6 5.65-9 229 100.0 0.0 0.010-14 952 53.0 47.0 0.015-29 3808 47.0 17.4 35.630-59 10907 78.7 15.2 6.160+ 38935 90.6 6.5 2.9Male Total 34405 78.9 15.1 6.00 2868 55.5 37.6 6.91-4 1758 91.7 8.3 0.05-9 162 100.0 0.0 0.010-14 533 49.0 51.0 0.015-29 2210 38.7 7.3 54.030-59 6459 74.5 19.4 6.160+ 20415 87.4 11.2 1.4

National Series: Socio-economic and Demographic Report Page 307
Table M02: Deaths in the Last 12 Months by Residence, Place of Death, Age and Sex of the Deceased, 2011
Age Place of Death
Total Home Hospital Others 1 2 3 4 5
Female Total 28302 85.7 9.3 5.00 2404 45.5 54.5 0.01-4 846 82.7 0.0 17.35-9 68 100.0 0.0 0.010-14 419 58.1 41.9 0.015-29 1599 58.5 31.4 10.130-59 4448 84.7 9.2 6.160+ 18520 94.2 1.3 4.5Urban Total 14098 73.1 23.8 3.10 1156 57.9 26.9 15.21-4 261 100.0 0.0 0.05-9 0 0.0 0.0 0.010-14 63 100.0 0.0 0.015-29 885 42.3 37.9 19.830-59 3120 60.1 37.1 2.760+ 8612 82.0 18.0 0.0Male Total 6930 70.2 23.5 6.30 709 66.3 8.9 24.71-4 115 100.0 0.0 0.05-9 0 0.0 0.0 0.010-14 0 0.0 0.0 0.015-29 464 62.2 0.0 37.830-59 1697 53.3 41.7 5.060+ 3944 78.3 21.7 0.0Female Total 7167 75.9 24.1 0.00 446 44.4 55.6 0.01-4 146 100.0 0.0 0.05-9 0 0.0 0.0 0.010-14 63 100.0 0.0 0.015-29 421 20.3 79.7 0.030-59 1423 68.3 31.7 0.060+ 4667 85.2 14.8 0.0Rajshahi Division Total 70530 80.1 16.6 3.30 7738 74.1 21.7 4.21-4 2593 82.2 17.8 0.05-9 575 43.4 30.7 25.910-14 1026 67.8 13.8 18.415-29 3893 43.8 48.1 8.030-59 15369 66.2 30.3 3.560+ 39336 91.0 6.9 2.1 Male

National Series: Socio-economic and Demographic Report Page 308
Table M02: Deaths in the Last 12 Months by Residence, Place of Death, Age and Sex of the Deceased, 2011
Age Place of Death
Total Home Hospital Others 1 2 3 4 5
Total 39337 77.5 18.8 3.80 4872 67.9 25.4 6.61-4 1247 63.0 37.0 0.05-9 399 62.7 0.0 37.310-14 622 76.1 0.0 23.915-29 2436 38.7 48.5 12.830-59 7671 57.4 38.7 3.960+ 22090 91.9 7.0 1.1Female Total 31192 83.4 13.9 2.70 2866 84.7 15.3 0.01-4 1346 100.0 0.0 0.05-9 176 0.0 100.0 0.010-14 404 55.1 35.0 10.015-29 1456 52.5 47.5 0.030-59 7699 74.9 22.0 3.260+ 17247 89.8 6.9 3.3Rural Total 59075 82.2 14.6 3.20 6741 76.0 20.7 3.31-4 2553 83.5 16.5 0.05-9 575 43.4 30.7 25.910-14 796 87.3 12.7 0.015-29 3081 48.2 43.0 8.830-59 11327 69.2 26.0 4.860+ 34003 91.3 6.6 2.1Male Total 33120 80.2 16.2 3.60 4213 71.1 23.6 5.31-4 1207 65.1 34.9 0.05-9 399 62.7 0.0 37.310-14 473 100.0 0.0 0.015-29 1774 40.6 44.1 15.430-59 5122 59.3 34.8 5.860+ 19932 91.9 6.9 1.2 Female Total 25956 84.7 12.5 2.70 2528 84.2 15.8 0.01-4 1346 100.0 0.0 0.05-9 176 0.0 100.0 0.010-14 323 68.8 31.2 0.015-29 1307 58.5 41.5 0.030-59 6205 77.3 18.8 4.060+ 14071 90.6 6.1 3.3Urban Total 11455 69.1 27.1 3.8

National Series: Socio-economic and Demographic Report Page 309
Table M02: Deaths in the Last 12 Months by Residence, Place of Death, Age and Sex of the Deceased, 2011
Age Place of Death
Total Home Hospital Others 1 2 3 4 5
0 997 61.2 28.7 10.11-4 40 0.0 100.0 0.05-9 0 0.0 0.0 0.010-14 229 0.0 17.6 82.415-29 812 27.4 67.6 5.030-59 4043 57.8 42.2 0.060+ 5334 89.0 9.1 1.9Male Total 6218 62.7 32.6 4.70 659 47.5 37.2 15.31-4 40 0.0 100.0 0.05-9 0 0.0 0.0 0.010-14 149 0.0 0.0 100.015-29 663 33.5 60.4 6.130-59 2549 53.6 46.4 0.060+ 2158 92.5 7.5 0.0Female Total 5237 76.7 20.6 2.70 337 88.1 11.9 0.01-4 0 0.0 0.0 0.05-9 0 0.0 0.0 0.010-14 81 0.0 50.0 50.015-29 149 0.0 100.0 0.030-59 1494 64.8 35.2 0.060+ 3176 86.6 10.3 3.2Rangpur Division Total Total 63783 79.2 16.6 4.20 15862 68.6 30.8 0.61-4 2567 100.0 0.0 0.05-9 1454 64.7 6.5 28.810-14 1382 93.1 0.0 6.915-29 5594 67.3 30.6 2.230-59 8848 73.2 17.3 9.560+ 28077 87.5 8.6 3.9Male Total 31574 75.5 19.1 5.40 7304 60.7 38.0 1.31-4 1291 100.0 0.0 0.05-9 1036 90.8 9.2 0.010-14 401 76.3 0.0 23.715-29 2742 78.3 21.7 0.030-59 3973 65.2 21.2 13.760+ 14827 81.9 11.6 6.6Female Total 32209 82.7 14.3 3.0

National Series: Socio-economic and Demographic Report Page 310
Table M02: Deaths in the Last 12 Months by Residence, Place of Death, Age and Sex of the Deceased, 2011
Age Place of Death
Total Home Hospital Others 1 2 3 4 5
0 8557 75.4 24.6 0.01-4 1276 100.0 0.0 0.05-9 418 0.0 0.0 100.010-14 981 100.0 0.0 0.015-29 2851 56.7 39.1 4.230-59 4875 79.7 14.1 6.160+ 13250 93.9 5.2 0.9Rural Total 54644 80.5 15.6 3.90 14158 69.1 30.2 0.71-4 2047 100.0 0.0 0.05-9 1454 64.7 6.5 28.810-14 1085 91.2 0.0 8.815-29 4367 74.5 25.5 0.030-59 6813 76.3 17.6 6.260+ 24720 88.1 7.4 4.4Male Total 27028 77.1 18.2 4.80 6576 60.9 37.6 1.41-4 982 100.0 0.0 0.05-9 1036 90.8 9.2 0.010-14 401 76.3 0.0 23.715-29 2144 86.1 13.9 0.030-59 2745 77.1 18.5 4.460+ 13143 80.9 11.7 7.4Female Total 27616 83.9 13.1 3.00 7582 76.2 23.8 0.01-4 1065 100.0 0.0 0.05-9 418 0.0 0.0 100.010-14 684 100.0 0.0 0.015-29 2222 63.2 36.8 0.030-59 4068 75.7 16.9 7.360+ 11578 96.4 2.6 1.0Urban Total 9139 71.1 22.9 5.90 1704 64.9 35.1 0.01-4 520 100.0 0.0 0.05-9 0 0.0 0.0 0.010-14 297 100.0 0.0 0.015-29 1227 41.6 48.6 9.830-59 2035 62.9 16.3 20.860+ 3356 83.0 17.0 0.0Male Total 4546 66.4 24.3 9.30 728 59.0 41.0 0.0

National Series: Socio-economic and Demographic Report Page 311
Table M02: Deaths in the Last 12 Months by Residence, Place of Death, Age and Sex of the Deceased, 2011
Age Place of Death
Total Home Hospital Others 1 2 3 4 5
1-4 309 100.0 0.0 0.05-9 0 0.0 0.0 0.010-14 0 0.0 0.0 0.015-29 598 50.0 50.0 0.030-59 1227 38.5 27.1 34.460+ 1684 89.6 10.4 0.0Female Total 4593 75.8 21.6 2.60 976 69.4 30.6 0.01-4 211 100.0 0.0 0.05-9 0 0.0 0.0 0.010-14 297 100.0 0.0 0.015-29 629 33.6 47.2 19.230-59 807 100.0 0.0 0.060+ 1672 76.4 23.6 0.0Sylhet Division Total 40411 77.0 19.9 3.10 5617 60.8 39.2 0.01-4 3686 68.8 30.2 1.15-9 852 75.8 0.0 24.210-14 942 78.1 0.0 21.915-29 2007 79.6 10.1 10.330-59 9535 72.4 22.7 4.960+ 17770 85.9 13.4 0.7 Male 24203 78.9 18.6 2.50 3584 57.7 42.3 0.01-4 2442 76.3 22.1 1.65-9 689 70.0 0.0 30.010-14 346 100.0 0.0 0.015-29 833 100.0 0.0 0.030-59 5519 78.3 16.6 5.260+ 10789 85.1 14.2 0.7 Female 16208 74.1 22.0 3.90 2033 66.3 33.7 0.01-4 1245 54.0 46.0 0.05-9 163 100.0 0.0 0.010-14 596 65.3 0.0 34.715-29 1174 65.2 17.2 17.630-59 4016 64.3 31.1 4.660+ 6981 87.2 12.2 0.6Rural Total 36436 76.9 20.3 2.80 5001 61.3 38.7 0.01-4 3570 68.9 31.1 0.0

National Series: Socio-economic and Demographic Report Page 312
Table M02: Deaths in the Last 12 Months by Residence, Place of Death, Age and Sex of the Deceased, 2011
Age Place of Death
Total Home Hospital Others 1 2 3 4 5
5-9 852 75.8 0.0 24.210-14 942 78.1 0.0 21.915-29 1852 80.0 8.8 11.230-59 8401 71.9 23.5 4.660+ 15818 85.9 14.1 0.0Male Total 21402 79.6 18.5 1.90 3123 58.8 41.2 0.01-4 2325 76.8 23.2 0.05-9 689 70.0 0.0 30.010-14 346 100.0 0.0 0.015-29 755 100.0 0.0 0.030-59 4580 78.9 16.6 4.560+ 9583 85.7 14.3 0.0Female Total 15034 73.1 22.9 4.00 1877 65.6 34.4 0.01-4 1245 54.0 46.0 0.05-9 163 100.0 0.0 0.010-14 596 65.3 0.0 34.715-29 1096 66.3 14.9 18.930-59 3822 63.5 31.7 4.860+ 6234 86.3 13.7 0.0Urban Total 3975 77.6 16.5 5.90 616 56.8 43.2 0.01-4 117 66.7 0.0 33.35-9 0 0.0 0.0 0.010-14 0 0.0 0.0 0.015-29 156 75.0 25.0 0.030-59 1134 76.0 17.1 6.960+ 1952 86.1 8.0 6.0Male Total 2801 73.8 19.2 6.90 461 50.6 49.4 0.01-4 117 66.7 0.0 33.35-9 0 0.0 0.0 0.010-14 0 0.0 0.0 0.015-29 78 100.0 0.0 0.030-59 940 75.2 16.5 8.360+ 1206 80.7 12.9 6.4Female Total 1174 86.8 9.9 3.30 156 75.0 25.0 0.01-4 0 0.0 0.0 0.05-9 0 0.0 0.0 0.0

National Series: Socio-economic and Demographic Report Page 313
Table M02: Deaths in the Last 12 Months by Residence, Place of Death, Age and Sex of the Deceased, 2011
Age Place of Death
Total Home Hospital Others 1 2 3 4 5
10-14 0 0.0 0.0 0.015-29 78 50.0 50.0 0.030-59 194 80.0 20.0 0.060+ 746 94.8 0.0 5.2
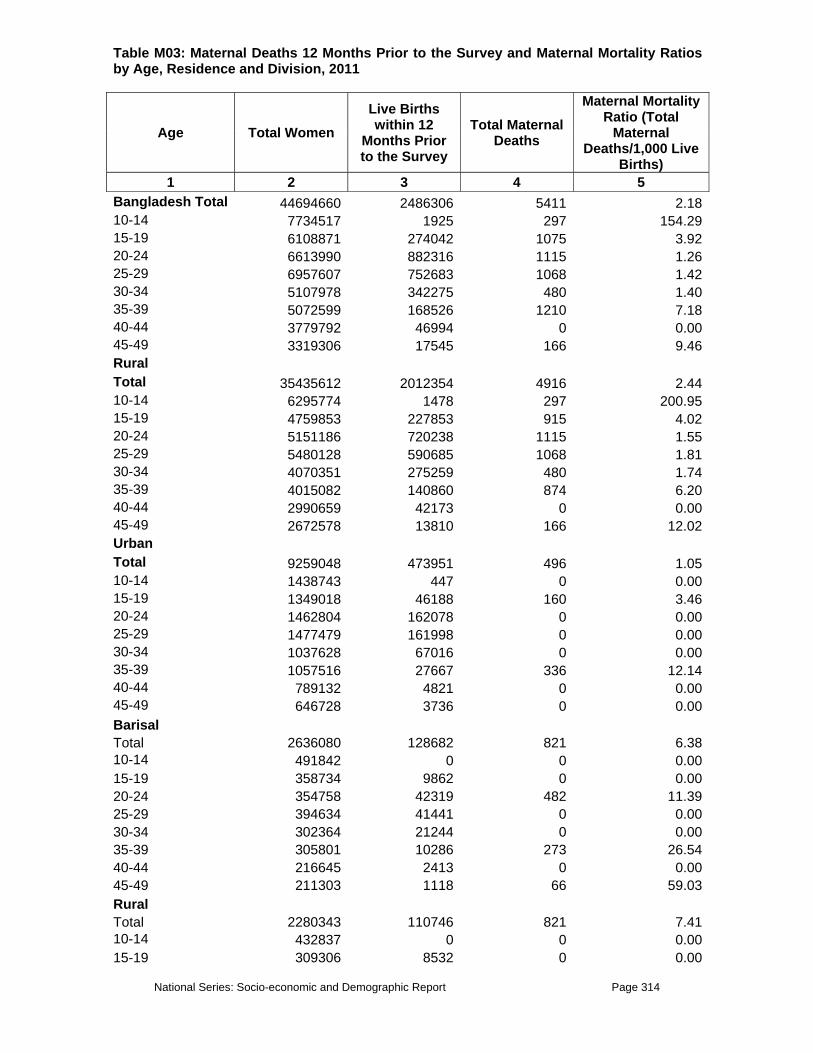
National Series: Socio-economic and Demographic Report Page 314
Table M03: Maternal Deaths 12 Months Prior to the Survey and Maternal Mortality Ratios by Age, Residence and Division, 2011
Age Total Women Live Births within 12
Months Prior to the Survey
Total Maternal Deaths
Maternal Mortality Ratio (Total
Maternal Deaths/1,000 Live
Births) 1 2 3 4 5
Bangladesh Total 44694660 2486306 5411 2.1810-14 7734517 1925 297 154.2915-19 6108871 274042 1075 3.9220-24 6613990 882316 1115 1.2625-29 6957607 752683 1068 1.4230-34 5107978 342275 480 1.4035-39 5072599 168526 1210 7.1840-44 3779792 46994 0 0.0045-49 3319306 17545 166 9.46Rural Total 35435612 2012354 4916 2.4410-14 6295774 1478 297 200.9515-19 4759853 227853 915 4.0220-24 5151186 720238 1115 1.5525-29 5480128 590685 1068 1.8130-34 4070351 275259 480 1.7435-39 4015082 140860 874 6.2040-44 2990659 42173 0 0.0045-49 2672578 13810 166 12.02Urban Total 9259048 473951 496 1.0510-14 1438743 447 0 0.0015-19 1349018 46188 160 3.4620-24 1462804 162078 0 0.0025-29 1477479 161998 0 0.0030-34 1037628 67016 0 0.0035-39 1057516 27667 336 12.1440-44 789132 4821 0 0.0045-49 646728 3736 0 0.00Barisal Total 2636080 128682 821 6.3810-14 491842 0 0 0.0015-19 358734 9862 0 0.0020-24 354758 42319 482 11.3925-29 394634 41441 0 0.0030-34 302364 21244 0 0.0035-39 305801 10286 273 26.5440-44 216645 2413 0 0.0045-49 211303 1118 66 59.03Rural Total 2280343 110746 821 7.4110-14 432837 0 0 0.0015-19 309306 8532 0 0.00

National Series: Socio-economic and Demographic Report Page 315
Table M03: Maternal Deaths 12 Months Prior to the Survey and Maternal Mortality Ratios by Age, Residence and Division, 2011
Age Total Women Live Births within 12
Months Prior to the Survey
Total Maternal Deaths
Maternal Mortality Ratio (Total
Maternal Deaths/1,000 Live
Births) 1 2 3 4 5
20-24 303109 37258 482 12.9425-29 341988 34415 0 0.0030-34 259773 18318 0 0.0035-39 262628 9055 273 30.1540-44 186828 2295 0 0.0045-49 183875 874 66 75.51Urban Total 355737 17936 0 0.0010-14 59005 0 0 0.0015-19 49428 1330 0 0.0020-24 51649 5061 0 0.0025-29 52646 7026 0 0.0030-34 42591 2925 0 0.0035-39 43173 1230 0 0.0040-44 29817 118 0 0.0045-49 27428 244 0 0.00Chittagong Total 275472 11549 1750 151.5310-14 45837 0 0 0.0015-19 29007 627 210 334.9320-24 36616 4834 470 97.2325-29 44226 3581 442 123.4330-34 34647 1611 210 130.3535-39 34557 627 418 666.6740-44 24978 0 0 0.0045-49 25605 269 0 0.00Rural Total 245929 10564 1750 165.6610-14 41630 0 0 0.0015-19 25157 627 210 334.9320-24 32409 4476 470 105.0025-29 39302 3133 442 141.0830-34 30708 1611 210 130.3535-39 31155 537 418 778.4040-44 22382 0 0 0.0045-49 23187 179 0 0.00Urban Total 29544 985 0 0.0010-14 4208 0 0 0.0015-19 3850 0 0 0.0020-24 4208 358 0 0.0025-29 4924 448 0 0.0030-34 3939 0 0 0.0035-39 3402 90 0 0.00
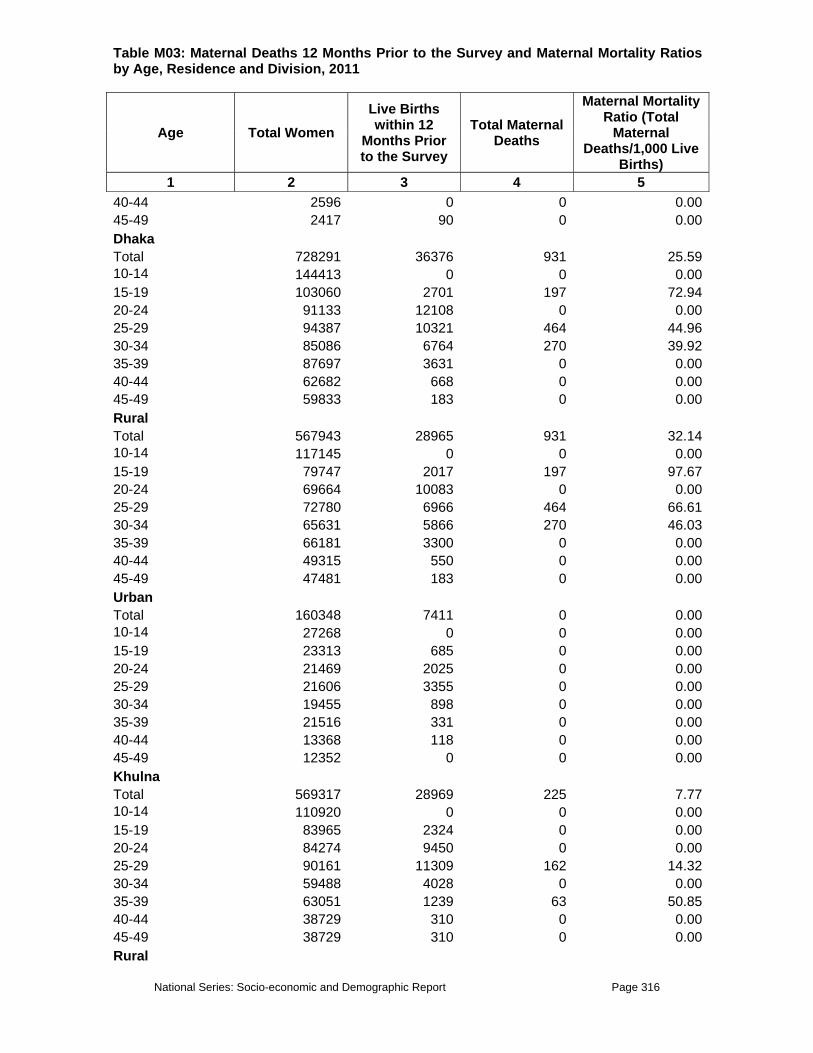
National Series: Socio-economic and Demographic Report Page 316
Table M03: Maternal Deaths 12 Months Prior to the Survey and Maternal Mortality Ratios by Age, Residence and Division, 2011
Age Total Women Live Births within 12
Months Prior to the Survey
Total Maternal Deaths
Maternal Mortality Ratio (Total
Maternal Deaths/1,000 Live
Births) 1 2 3 4 5
40-44 2596 0 0 0.0045-49 2417 90 0 0.00Dhaka Total 728291 36376 931 25.5910-14 144413 0 0 0.0015-19 103060 2701 197 72.9420-24 91133 12108 0 0.0025-29 94387 10321 464 44.9630-34 85086 6764 270 39.9235-39 87697 3631 0 0.0040-44 62682 668 0 0.0045-49 59833 183 0 0.00Rural Total 567943 28965 931 32.1410-14 117145 0 0 0.0015-19 79747 2017 197 97.6720-24 69664 10083 0 0.0025-29 72780 6966 464 66.6130-34 65631 5866 270 46.0335-39 66181 3300 0 0.0040-44 49315 550 0 0.0045-49 47481 183 0 0.00Urban Total 160348 7411 0 0.0010-14 27268 0 0 0.0015-19 23313 685 0 0.0020-24 21469 2025 0 0.0025-29 21606 3355 0 0.0030-34 19455 898 0 0.0035-39 21516 331 0 0.0040-44 13368 118 0 0.0045-49 12352 0 0 0.00Khulna Total 569317 28969 225 7.7710-14 110920 0 0 0.0015-19 83965 2324 0 0.0020-24 84274 9450 0 0.0025-29 90161 11309 162 14.3230-34 59488 4028 0 0.0035-39 63051 1239 63 50.8540-44 38729 310 0 0.0045-49 38729 310 0 0.00Rural

National Series: Socio-economic and Demographic Report Page 317
Table M03: Maternal Deaths 12 Months Prior to the Survey and Maternal Mortality Ratios by Age, Residence and Division, 2011
Age Total Women Live Births within 12
Months Prior to the Survey
Total Maternal Deaths
Maternal Mortality Ratio (Total
Maternal Deaths/1,000 Live
Births) 1 2 3 4 5
Total 532912 26491 162 6.1210-14 104104 0 0 0.0015-19 78233 2169 0 0.0020-24 79162 8985 0 0.0025-29 84739 10379 162 15.6130-34 56390 3563 0 0.0035-39 58403 929 0 0.0040-44 35786 310 0 0.0045-49 36095 155 0 0.00Urban Total 36405 2479 63 25.4110-14 6816 0 0 0.0015-19 5732 155 0 0.0020-24 5112 465 0 0.0025-29 5422 929 0 0.0030-34 3098 465 0 0.0035-39 4647 310 63 203.2340-44 2943 0 0 0.0045-49 2634 155 0 0.00Rajshahi Total 218482 8337 373 44.7410-14 42410 0 0 0.0015-19 30790 460 0 0.0020-24 26851 3086 0 0.0025-29 32365 2495 0 0.0030-34 25341 1182 0 0.0035-39 23699 788 273 346.4540-44 17791 328 0 0.0045-49 19235 0 101 0.00Rural Total 184607 6959 101 14.5110-14 36107 0 0 0.0015-19 26654 394 0 0.0020-24 22058 2298 0 0.0025-29 27376 2101 0 0.0030-34 21402 1050 0 0.0035-39 19957 788 0 0.0040-44 14640 328 0 0.0045-49 16412 0 101 0.00Urban Total 33875 1379 273 197.9710-14 6302 0 0 0.0015-19 4136 66 0 0.0020-24 4792 788 0 0.00

National Series: Socio-economic and Demographic Report Page 318
Table M03: Maternal Deaths 12 Months Prior to the Survey and Maternal Mortality Ratios by Age, Residence and Division, 2011
Age Total Women Live Births within 12
Months Prior to the Survey
Total Maternal Deaths
Maternal Mortality Ratio (Total
Maternal Deaths/1,000 Live
Births) 1 2 3 4 5
25-29 4989 394 0 0.0030-34 3939 131 0 0.0035-39 3742 0 273 0.0040-44 3151 0 0 0.0045-49 2823 0 0 0.00Rangpur Total 492217 28040 763 27.2110-14 88004 0 297 0.0015-19 66003 2157 465 215.5820-24 66147 8484 0 0.0025-29 83546 9059 0 0.0030-34 55506 5320 0 0.0035-39 56944 2301 0 0.0040-44 40263 575 0 0.0045-49 35805 144 0 0.00Rural Total 434699 24589 642 26.1110-14 78801 0 297 0.0015-19 58813 2157 345 159.9420-24 57519 7909 0 0.0025-29 73049 7477 0 0.0030-34 47597 4314 0 0.0035-39 50904 2013 0 0.0040-44 35374 575 0 0.0045-49 32642 144 0 0.00Urban Total 57519 3451 121 35.0610-14 9203 0 0 0.0015-19 7190 0 121 0.0020-24 8628 575 0 0.0025-29 10497 1582 0 0.0030-34 7909 1007 0 0.0035-39 6039 288 0 0.0040-44 4889 0 0 0.0045-49 3164 0 0 0.00Sylhet Total 352300 15410 548 0.0010-14 60258 0 0 0.0015-19 45911 1594 202 0.0020-24 49737 4357 163 0.0025-29 49949 4676 0 0.0030-34 42297 2338 0 0.0035-39 39853 1700 183 0.0040-44 32201 531 0 0.00

National Series: Socio-economic and Demographic Report Page 319
Table M03: Maternal Deaths 12 Months Prior to the Survey and Maternal Mortality Ratios by Age, Residence and Division, 2011
Age Total Women Live Births within 12
Months Prior to the Survey
Total Maternal Deaths
Maternal Mortality Ratio (Total
Maternal Deaths/1,000 Live
Births) 1 2 3 4 5
45-49 32095 213 0 0.00Rural Total 314254 13178 509 0.0010-14 55050 0 0 0.0015-19 40703 1169 163 0.0020-24 42297 3507 163 0.0025-29 44742 4357 0 0.0030-34 38046 1913 0 0.0035-39 36027 1488 183 0.0040-44 29332 531 0 0.0045-49 28056 213 0 0.00Urban Total 38046 2232 39 0.0010-14 5207 0 0 0.0015-19 5207 425 39 0.0020-24 7439 850 0 0.0025-29 5207 319 0 0.0030-34 4251 425 0 0.0035-39 3826 213 0 0.0040-44 2869 0 0 0.0045-49 4038 0 0 0.00

National Series: Socio-economic and Demographic Report Page 320
Table M04: Crude Death Rate (CDR) by Sex and Residence, 1991 - 2011
Year Total Rural Urban
Total Male Female Total Male Female Total Male Female 1 2 3 4 5 6 7 8 9 101991 9.70 10.20 8.90 9.60 10.50 9.20 6.90 7.10 6.702004 6.10 6.40 5.60 6.40 6.80 5.90 5.20 5.80 4.502011 4.79 5.48 4.11 4.72 5.38 4.06 5.12 5.94 4.31
Table M05: Child Death Rate by Sex and Residence, 1991-2011
Year Total Rural Urban
Total Male Female Total Male Female Total Male Female 1 2 3 4 5 6 7 8 9 10
1991 13.6 13.2 14.0 14.4 14.0 15.0 8.3 8.2 8.42004 4.4 4.2 4.7 4.6 4.3 4.9 3.9 3.9 3.82011 2.7 3.1 2.3 2.7 3.2 2.2 2.7 2.6 2.8

National Series: Socio-economic and Demographic Report Page 321
MIGRATION TABLES Table Mig01 – Table Mig07

National Series: Socio-economic and Demographic Report Page 322
Table Mig01: Lifetime Internal Migration by Place of Birth and Zila, 2011
Zila
Total Population
Living Within the Zila
Number of Migrants
Zila to Zila Life Time Migration
Urban to
Urban Urban
to Rural Rural
to Rural
Rural to
Urban
1 2 3 4 5 6 7 8
Bangladesh 139252683 90.29 13488973 0.86 0.36 4.20 4.29 Barguna 892129 95.4 40913 0.2 0.4 3.2 0.8 Barisal 2347223 96.3 86047 0.6 0.3 1.1 1.7 Bhola 1822125 99.0 18280 0.1 0.2 0.5 0.2 Jhalokati 680589 93.5 44182 1.1 1.0 3.8 0.6 Patuakhali 1624619 97.6 38681 0.1 0.2 1.7 0.4 Pirojpur 1122791 95.4 51756 0.2 0.2 3.2 1.0 Bandarban 378942 88.5 43293 0.7 1.0 7.2 2.6 Brahmanbaria 2710646 97.4 70779 0.3 0.3 1.6 0.3 Chandpur 2404209 97.2 66970 0.1 0.4 1.7 0.6 Chittagong 7117209 88.5 818805 1.7 0.1 1.4 8.4 Comilla 5239238 97.7 121944 0.3 0.2 1.5 0.4 Cox's Bazar 2115412 99.0 21704 0.3 0.1 0.4 0.2 Feni 1270793 95.4 58421 0.3 0.3 1.3 2.7 Khagrachhari 614869 87.5 76465 1.3 0.3 6.1 4.8 Lakshmipur 1709722 98.2 30051 0.2 0.2 1.0 0.3 Noakhali 3043892 98.2 53173 0.1 0.2 1.3 0.2 Rangamati 558697 89.5 58677 0.7 0.5 6.7 2.6 Dhaka 11158374 49.2 5644643 4.3 0.7 16.3 29.5 Faridpur 1872157 95.0 94523 0.7 0.3 3.5 0.6 Gazipur 3180674 59.1 1301016 2.8 1.8 18.9 17.5 Gopalganj 1201597 95.1 58349 0.3 0.2 3.9 0.5 Jamalpur 2295334 97.3 61840 0.2 0.1 2.0 0.4 Kishoreganj 2851027 97.4 73050 0.4 0.1 0.8 1.3 Madaripur 1142178 96.8 36794 0.3 0.6 1.9 0.4 Manikganj 1368076 96.3 50450 0.4 0.3 2.8 0.1 Munshiganj 1342198 91.3 117146 0.4 2.0 4.5 1.9 Mymensingh 5098481 96.0 201830 0.4 0.3 2.2 1.1 Narayanganj 2571400 75.8 621921 1.6 1.0 14.1 7.4 Narsingdi 2152464 92.0 171407 0.6 0.4 3.8 3.2 Netrokona 2194083 97.6 51576 0.2 0.1 1.7 0.4 Rajbari 1031591 91.3 89304 0.6 0.8 6.3 1.1 Shariatpur 1181930 97.6 28762 0.1 0.6 1.7 0.1 Sherpur 1369607 98.2 23996 0.1 0.1 1.3 0.2 Tangail 3557664 98.2 64271 0.1 0.3 1.1 0.2 Bagerhat 1523667 94.2 87634 0.8 0.6 3.5 0.9 Chuadanga 1095294 92.2 84919 0.6 0.3 4.2 2.6 Jessore 2678490 90.6 251568 0.7 0.4 5.4 2.9 Jhenaidah 1693099 91.7 140258 1.0 0.6 5.1 1.6 Khulna 2301947 86.2 316454 1.3 0.2 4.6 7.7 Kushtia 1862902 93.5 121972 0.4 0.3 4.7 1.1 Magura 868375 91.4 74320 0.4 0.4 6.5 1.2 Meherpur 645501 95.7 27731 0.4 0.3 3.0 0.6

National Series: Socio-economic and Demographic Report Page 323
Table Mig01: Lifetime Internal Migration by Place of Birth and Zila, 2011
Zila
Total Population
Living Within the Zila
Number of Migrants
Zila to Zila Life Time Migration
Urban to
Urban Urban
to Rural Rural
to Rural
Rural to
Urban
1 2 3 4 5 6 7 8
Narail 699171 91.5 59442 0.2 0.5 6.2 1.6 Satkhira 2018217 97.9 42392 0.1 0.1 1.5 0.4 Bogra 3345370 94.2 194310 0.8 0.5 3.5 1.0 Joypurhat 879850 91.1 78043 0.5 0.4 5.8 2.2 Naogaon 2515142 96.6 85056 0.1 0.1 2.8 0.4 Natore 1666133 93.3 111545 0.4 0.7 4.2 1.4 Chapai Nawabganj 1587512 97.4 40190 0.3 0.1 1.4 0.6 Pabna 2522907 96.4 91033 0.5 0.2 1.9 1.0 Rajshahi 2412047 92.8 171757 1.2 0.2 1.9 3.9 Sirajganj 3098560 98.4 49617 0.2 0.1 1.0 0.3 Dinajpur 2866691 94.6 152755 0.3 0.2 3.8 1.1 Gaibandha 2344069 97.2 66733 0.1 0.1 1.9 0.8 Kurigram 2049765 98.2 37188 0.4 0.3 0.9 0.2 Lalmonirhat 1177813 96.0 46876 0.2 0.3 3.0 0.5 Nilphamari 1807616 95.5 81200 0.7 0.2 2.3 1.2 Panchagarh 989651 93.6 62815 0.3 0.4 5.1 0.5 Rangpur 2842248 95.9 115974 0.4 0.1 2.5 1.0 Thakurgaon 1356766 95.0 67718 0.5 0.3 3.5 0.7 Habiganj 1957959 96.2 74252 0.1 0.2 3.3 0.2 Maulvibazar 1732477 95.3 80786 0.2 0.4 3.0 1.1 Sunamganj 2372186 97.3 63253 0.2 0.1 2.1 0.3 Sylhet 3119315 92.9 220163 0.8 0.1 2.2 4.0
Note: Migration within the Zila is not considered.

National Series: Socio-economic and Demographic Report Page 324
Table Mig02: Internal Migration by Place of Residence over the Last 5 Years by Zila, 2011
Zila
Internal Migration Over the Last 5 Years
Total Number of Migrants
Urban to Urban
Urban to Rural
Rural to Rural
Rural to Urban
1 2 3 4 5 6 Barguna 16562 17.8 25.9 44.3 11.9Barisal 47215 23.9 12.0 42.3 21.7Bhola 3718 0.0 45.8 25.0 29.2Jhalokati 13130 27.5 32.0 33.5 7.0Patuakhali 13373 3.2 6.5 65.6 24.7Pirojpur 21893 13.1 15.0 63.1 8.7Bandarban 10364 10.4 8.5 59.2 21.8Brahmanbaria 33374 2.7 22.8 67.8 6.7Chandpur 41988 22.0 26.5 40.5 11.0Chittagong 245526 34.3 4.1 12.5 49.1Comilla 53760 24.4 30.9 42.3 2.4Cox's Bazar 29455 32.2 48.0 6.4 13.5Feni 34892 14.5 3.9 29.3 52.3Khagrachhari 8944 8.0 2.5 43.8 45.7Lakshmipur 15177 6.0 27.0 47.0 20.0Noakhali 27079 10.0 23.6 60.0 6.4Rangamati 11061 17.1 7.6 42.4 32.9Dhaka 1768974 15.0 2.2 37.8 45.0Faridpur 35054 23.9 17.4 42.8 15.9Gazipur 646797 10.4 8.5 46.6 34.5Gopalganj 23630 13.2 6.6 60.5 19.7Jamalpur 17568 4.0 13.3 72.0 10.7Kishoreganj 28076 25.0 5.6 34.3 35.2Madaripur 24739 11.4 19.5 61.9 7.2Manikganj 15647 18.1 12.9 61.2 7.8Munshiganj 47765 3.3 30.6 45.3 20.9Mymensingh 79102 16.4 7.3 42.4 33.9Narayanganj 256670 9.3 7.1 53.6 30.0Narsingdi 58255 20.3 5.8 49.2 24.7Netrokona 18520 9.7 9.7 69.9 10.8Rajbari 19878 16.9 16.4 56.7 10.0Shariatpur 16847 7.9 39.0 50.6 2.4Sherpur 10649 9.3 29.3 53.3 8.0Tangail 35024 7.2 29.9 52.6 10.3Bagerhat 23807 11.0 20.9 59.5 8.6Chuadanga 14076 11.5 7.4 45.1 36.1Jessore 78955 27.2 4.5 40.3 27.9Jhenaidah 43008 25.3 18.8 42.0 13.9Khulna 58490 21.0 3.0 35.7 40.2Kushtia 20825 24.8 6.7 56.2 12.4Magura 17124 8.5 23.0 54.5 14.0Meherpur 5671 24.4 9.8 51.2 14.6Narail 12713 8.5 6.9 62.8 21.8Satkhira 9768 10.0 8.0 58.0 24.0Bogra 70167 14.9 13.3 42.6 29.2

National Series: Socio-economic and Demographic Report Page 325
Table Mig02: Internal Migration by Place of Residence over the Last 5 Years by Zila, 2011
Zila
Internal Migration Over the Last 5 Years
Total Number of Migrants
Urban to Urban
Urban to Rural
Rural to Rural
Rural to Urban
1 2 3 4 5 6 Joypurhat 21074 26.8 1.4 54.1 17.7Naogaon 23172 0.0 35.3 60.0 4.7Natore 30838 5.7 16.0 56.6 21.7Chapai Nawabganj 28431 36.6 2.6 45.5 15.2Pabna 33616 39.4 8.0 29.2 23.4Rajshahi 42992 33.6 1.0 24.3 41.1Sirajganj 26443 14.6 30.3 42.7 12.4Dinajpur 43092 4.8 17.2 40.0 37.9Gaibandha 27254 10.3 36.4 45.8 7.5Kurigram 11621 32.7 25.5 36.4 5.5Lalmonirhat 10873 12.2 13.3 74.4 0.0Nilphamari 20870 26.9 4.2 40.3 28.6Panchagarh 11879 17.6 27.2 49.6 5.6Rangpur 27200 20.9 12.1 58.2 8.8Thakurgaon 14130 18.9 20.8 49.1 11.3Habiganj 65766 3.7 14.6 78.7 3.0Maulvibazar 21283 14.1 12.0 59.2 14.8Sunamganj 25045 13.9 6.6 75.2 4.4Sylhet 75776 24.5 2.5 22.9 50.1
Note: Migration within the Zila is not considered.
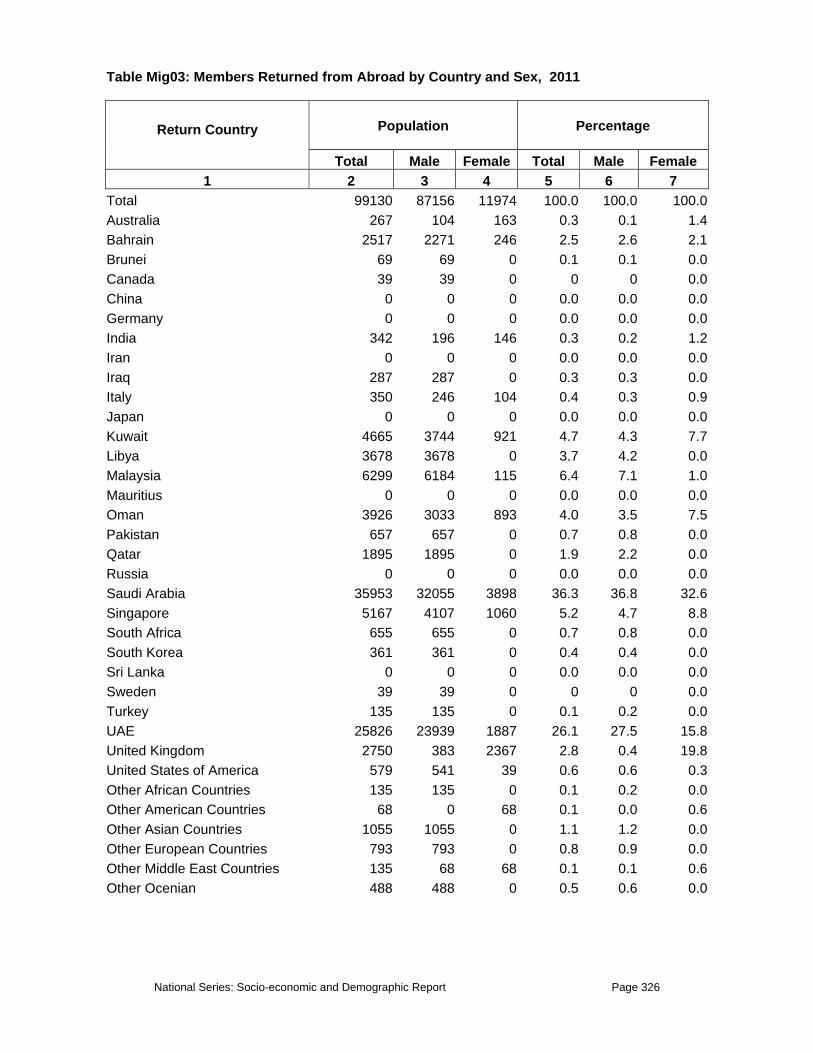
National Series: Socio-economic and Demographic Report Page 326
Table Mig03: Members Returned from Abroad by Country and Sex, 2011
Return Country
Population
Percentage
Total Male Female Total Male Female
1 2 3 4 5 6 7 Total 99130 87156 11974 100.0 100.0 100.0Australia 267 104 163 0.3 0.1 1.4Bahrain 2517 2271 246 2.5 2.6 2.1Brunei 69 69 0 0.1 0.1 0.0Canada 39 39 0 0 0 0.0China 0 0 0 0.0 0.0 0.0Germany 0 0 0 0.0 0.0 0.0India 342 196 146 0.3 0.2 1.2Iran 0 0 0 0.0 0.0 0.0Iraq 287 287 0 0.3 0.3 0.0Italy 350 246 104 0.4 0.3 0.9Japan 0 0 0 0.0 0.0 0.0Kuwait 4665 3744 921 4.7 4.3 7.7Libya 3678 3678 0 3.7 4.2 0.0Malaysia 6299 6184 115 6.4 7.1 1.0Mauritius 0 0 0 0.0 0.0 0.0Oman 3926 3033 893 4.0 3.5 7.5Pakistan 657 657 0 0.7 0.8 0.0Qatar 1895 1895 0 1.9 2.2 0.0Russia 0 0 0 0.0 0.0 0.0Saudi Arabia 35953 32055 3898 36.3 36.8 32.6Singapore 5167 4107 1060 5.2 4.7 8.8South Africa 655 655 0 0.7 0.8 0.0South Korea 361 361 0 0.4 0.4 0.0Sri Lanka 0 0 0 0.0 0.0 0.0Sweden 39 39 0 0 0 0.0Turkey 135 135 0 0.1 0.2 0.0UAE 25826 23939 1887 26.1 27.5 15.8United Kingdom 2750 383 2367 2.8 0.4 19.8United States of America 579 541 39 0.6 0.6 0.3Other African Countries 135 135 0 0.1 0.2 0.0Other American Countries 68 0 68 0.1 0.0 0.6Other Asian Countries 1055 1055 0 1.1 1.2 0.0Other European Countries 793 793 0 0.8 0.9 0.0Other Middle East Countries 135 68 68 0.1 0.1 0.6Other Ocenian 488 488 0 0.5 0.6 0.0

National Series: Socio-economic and Demographic Report Page 327
Table Mig04: Reasons for Return Members from Abroad by Country, 2011
Return Country
Reasons for Return
Total Number of Returnee
Completion of Tenure
Pushed Out/
Illegal Returned
IntentionallyHealth Reason
On Leave
Poor Salary Others
1 2 3 4 5 6 7 8 9
Total 99130 18.7 16.4 18.5 5.7 28.1 5.0 7.6Australia 267 0.0 0.0 38.8 0.0 61.2 0.0 0.0Bahrain 2517 27.4 30.6 1.5 25.6 14.8 0.0 0.0Brunei 69 0.0 100.0 0.0 0.0 0.0 0.0 0.0Canada 39 0.0 0.0 0.0 0.0 100.0 0.0 0.0China 0 0.0 0.0 0.0 0.0 0.0 0.0 0.0Germany 0 0.0 0.0 0.0 0.0 0.0 0.0 0.0India 342 0.0 0.0 73.8 0.0 26.2 0.0 0.0Iran 0 0.0 0.0 0.0 0.0 0.0 0.0 0.0Iraq 287 0.0 0.0 100.0 0.0 0.0 0.0 0.0Italy 350 0.0 0.0 0.0 0.0 100.0 0.0 0.0Japan 0 0.0 0.0 0.0 0.0 0.0 0.0 0.0Kuwait 4665 26.0 5.7 22.2 0.0 39.2 6.2 0.6Libya 3678 4.2 28.5 4.8 0.0 0.0 3.3 59.2Malaysia 6299 10.1 36.1 11.4 12.8 15.7 11.1 2.6Mauritius 0 0.0 0.0 0.0 0.0 0.0 0.0 0.0Oman 3926 36.0 0.0 19.5 1.4 33.4 6.3 3.4Pakistan 657 30.1 0.0 0.0 0.0 69.9 0.0 0.0Qatar 1895 4.7 39.7 14.6 0.0 13.7 9.7 17.6Russia 0 0.0 0.0 0.0 0.0 0.0 0.0 0.0Saudi Arabia 35953 14.3 14.9 18.4 5.2 35.8 5.4 6.0Singapore 5167 32.5 10.5 24.4 8.5 24.1 0.0 0.0South Africa 655 63.2 0.0 0.0 0.0 16.2 0.0 20.6South Korea 361 100.0 0.0 0.0 0.0 0.0 0.0 0.0Sri Lanka 0 0.0 0.0 0.0 0.0 0.0 0.0 0.0Sweden 39 0.0 0.0 0.0 0.0 100.0 0.0 0.0Turkey 135 0.0 100.0 0.0 0.0 0.0 0.0 0.0UAE 25826 24.2 16.7 16.8 5.6 24.9 5.7 6.1United Kingdom 2750 9.9 0.0 69.4 7.2 8.1 0.0 5.5United States of America 579 0.0 0.0 13.4 0.0 38.9 0.0 47.7Other African Countries 135 0.0 0.0 0.0 0.0 0.0 0.0 100.0Other American Countries 68 0.0 0.0 100.0 0.0 0.0 0.0 0.0Other Asian Countries 1055 0.0 36.5 39.8 0.0 10.9 0.0 12.8Other European Countries 793 0.0 26.1 0.0 0.0 60.7 0.0 13.2Other Middle East Countries 135 0.0 0.0 0.0 0.0 100.0 0.0 0.0Other Ocenian 488 0.0 35.3 0.0 43.0 21.8 0.0 0.0

National Series: Socio-economic and Demographic Report Page 328
Table Mig05: Educational Qualification of Returnee by Sex and Country from ReturnAbroad, 2011
Country of Return
Highest Class Passed
Total Number of Returnee
No Schooling Primary Junior
SecondarySecondary/
Higher Secondary
Graduate Masters and
Higher
1 2 3 4 5 6 7 8
Both Sexes Total 98481 3.7 25.0 25.9 37.9 4.2 3.3Saudi Arabia 35953 5.4 26.3 25.0 38.9 3.6 0.7UAE 25826 3.5 27.4 26.5 37.2 4.1 1.3Malaysia 6299 3.1 16.5 26.2 50.0 0.0 4.1Kuwait 4665 3.5 15.1 29.4 38.6 13.4 0.0Singapore 5167 2.0 26.0 44.6 14.6 12.8 0.0Libya 3678 0.0 28.4 8.6 59.8 3.1 0.0Oman 3926 0.0 26.1 30.1 38.1 0.0 5.7United Kingdom 2140 1.8 14.0 3.6 19.9 0.0 60.7Qatar 1895 0.0 14.6 38.8 32.0 0.0 14.6Bahrain 2478 0.0 23.1 42.9 25.5 0.0 8.5African Countries 790 0.0 17.1 0.0 69.5 13.4 0.0American Countries 686 0.0 0.0 0.0 26.9 32.9 40.3Asian Countries 2484 0.0 21.4 27.0 48.9 0.0 2.7European Countries 1316 0.0 60.0 15.8 21.2 0.0 3.0Middle East Countries 422 0.0 36.0 16.0 48.0 0.0 0.0Ocenian Countries 755 41.5 22.8 0.0 35.7 0.0 0.0 Male Total 87117 3.3 25.0 25.4 40.1 4.0 2.1Saudi Arabia 32055 5.3 27.0 24.4 39.1 3.5 0.8UAE 23939 1.7 26.5 26.2 40.0 4.2 1.4Malaysia 6184 3.2 16.8 26.7 49.1 0.0 4.2Kuwait 3744 4.4 18.1 27.8 42.1 7.7 0.0Singapore 4107 2.5 23.9 39.1 18.3 16.1 0.0Libya 3678 0.0 28.4 8.6 59.8 3.1 0.0Oman 3033 0.0 25.2 25.4 49.3 0.0 0.0United Kingdom 383 10.1 10.1 10.1 49.3 0.0 20.3Qatar 1895 0.0 14.6 38.8 32.0 0.0 14.6Bahrain 2232 0.0 14.6 47.7 28.3 0.0 9.4African Countries 790 0.0 17.1 0.0 69.5 13.4 0.0American Countries 579 0.0 0.0 0.0 13.4 38.9 47.7Asian Countries 2338 0.0 16.5 28.7 52.0 0.0 2.9European Countries 1213 0.0 65.2 8.6 23.0 0.0 3.2Middle East 354 0.0 42.8 19.1 38.1 0.0 0.0

National Series: Socio-economic and Demographic Report Page 329
Table Mig05: Educational Qualification of Returnee by Sex and Country from ReturnAbroad, 2011
Country of Return
Highest Class Passed
Total Number of Returnee
No Schooling Primary Junior
SecondarySecondary/
Higher Secondary
Graduate Masters and
Higher
1 2 3 4 5 6 7 8 Countries Ocenian Countries 592 53.0 29.1 0.0 17.9 0.0 0.0 Female Total 11364 6.6 25.0 29.2 21.3 5.3 12.7Saudi Arabia 3898 6.7 20.8 29.9 37.5 5.1 0.0UAE 1887 26.0 38.3 30.1 2.1 3.7 0.0Malaysia 115 0.0 0.0 0.0 100.0 0.0 0.0Kuwait 921 0.0 3.2 35.8 24.3 36.6 0.0Singapore 1060 0.0 34.1 65.9 0.0 0.0 0.0Libya 0 0.0 0.0 0.0 0.0 0.0 0.0Oman 893 0.0 29.1 45.8 0.0 0.0 25.1United Kingdom 1757 0.0 14.8 2.2 13.5 0.0 69.5Qatar 0 0.0 0.0 0.0 0.0 0.0 0.0Bahrain 246 0.0 100.0 0.0 0.0 0.0 0.0African Countries 0 0.0 0.0 0.0 0.0 0.0 0.0American Countries 107 0.0 0.0 0.0 100.0 0.0 0.0Asian Countries 146 0.0 100.0 0.0 0.0 0.0 0.0European Countries 104 0.0 0.0 100.0 0.0 0.0 0.0Middle East Countries 68 0.0 0.0 0.0 100.0 0.0 0.0Ocenian Countries 163 0.0 0.0 0.0 100.0 0.0 0.0

National Series: Socio-economic and Demographic Report Page 330
Table Mig06: Reasons for Immigration by Country of Destination and Sex, 2011
Country of Destination
Reasons for Immigration
Total Work Study Dependency Others 1 2 3 4 5 6
Both Sexes Total 4713870 92.0 2.4 3.8 1.8Saudi Arabia 1374757 95.7 0.3 3.7 0.4UAE 1231895 95.5 0.5 3.3 0.8Malaysia 481180 94.3 1.4 3.3 0.9Kuwait 231053 93.0 0.8 5.0 1.1Oman 243240 93.2 0.6 4.7 1.5Singapore 182919 94.4 3.1 2.0 0.5Bahrain 133739 99.1 0.0 0.9 0.0United Kingdom 87450 44.0 27.3 8.8 19.9Italy 80637 85.9 3.5 5.1 5.4Qatar 87803 97.1 0.2 2.4 0.3Other African Countries 83934 87.9 2.5 3.5 6.1Other American Countries 103858 59.9 18.3 9.2 12.6Other Asian Countries 356783 86.9 5.0 4.1 4.0Other European Countries 65659 81.5 11.5 3.8 3.3Other Middle East Countries 66611 88.6 4.1 6.3 0.9Other Ocenian Countries 85273 78.7 19.7 1.5 0.1Male Total 4529872 93.4 2.1 3.6 0.9Saudi Arabia 1350489 95.8 0.3 3.7 0.3UAE 1192587 95.9 0.5 3.3 0.3Malaysia 475309 94.6 1.2 3.3 0.9Kuwait 225904 93.5 0.5 4.8 1.2Oman 239845 93.6 0.6 4.5 1.3Singapore 175923 97.4 0.4 2.1 0.1Bahrain 132933 99.3 0.0 0.7 0.0United Kingdom 63254 53.0 30.5 7.9 8.6Italy 69476 95.2 1.5 3.0 0.3Qatar 86909 97.3 0.1 2.3 0.3Other African Countries 77269 88.7 2.3 3.3 5.7Other American Countries 82036 67.7 20.4 5.3 6.6Other Asian Countries 325924 90.7 3.6 3.6 2.1Other European Countries 63241 83.4 11.8 3.7 1.1Other Middle East Countries 61446 88.5 4.5 6.1 1.0Other Ocenian Countries 83248 79.2 20.2 0.6 0.0Female Total 183999 57.6 9.5 10.0 22.9Saudi Arabia 24268 89.2 0.2 1.6 9.1UAE 39308 82.0 0.0 2.7 15.2Malaysia 5871 70.3 23.3 4.7 1.7Kuwait 5149 70.6 14.8 14.7 0.0

National Series: Socio-economic and Demographic Report Page 331
Table Mig06: Reasons for Immigration by Country of Destination and Sex, 2011
Country of Destination
Reasons for Immigration
Total Work Study Dependency Others 1 2 3 4 5 6
Oman 3395 62.5 0.0 19.3 18.3Singapore 6996 19.4 70.3 0.0 10.3Bahrain 806 58.2 0.0 41.8 0.0United Kingdom 24196 20.6 18.6 11.3 49.5Italy 11161 28.3 16.3 18.2 37.2Qatar 894 74.3 4.4 17.0 4.4Other African Countries 6665 78.8 3.9 6.6 10.7Other American Countries 21822 30.8 10.5 23.7 35.0Other Asian Countries 30858 46.1 20.4 10.2 23.3Other European Countries 2418 31.1 2.6 5.4 60.8Other Middle East Countries 5165 90.7 0.0 9.3 0.0Other Ocenian Countries 2025 60.5 0.0 35.6 3.8

National Series: Socio-economic and Demographic Report Page 332
Table Mig07: Educational Qualification of Immigrant by Age and Sex, 2011
Age
Highest Class Passed
Total Number of Immigrants
No Schooling Primary Junior
Secondary Secondary/
Higher Secondary
Graduate Masters
and Higher
1 2 3 4 5 6 7 8 Bangladesh Total 4720756 8.3 26.5 21.6 38.4 4.0 1.35-9 33682 7.5 92.5 0.0 0.0 0.0 0.010-14 30938 3.3 36.1 54.4 6.2 0.0 0.015 - 19 643804 4.8 24.6 26.5 43.5 0.6 0.020 - 24 1422591 5.4 25.1 24.6 42.2 2.4 0.325 - 29 1046463 7.0 24.0 18.8 40.0 6.9 3.330 - 34 605846 11.0 27.3 19.5 33.6 6.8 1.835 - 39 460734 13.6 28.7 17.6 35.3 2.7 2.240 - 44 260379 17.1 28.5 17.9 30.7 5.3 0.645 - 49 131646 13.6 31.2 17.7 35.7 1.8 0.150 - 54 43017 18.9 30.1 19.5 23.3 7.4 0.855 - 59 24945 17.1 33.0 11.8 28.6 9.5 0.060 - 64 11552 20.7 29.5 32.1 9.5 5.3 2.965+ 5159 11.6 65.7 14.3 7.6 0.8 0.0Male Total 4536367 8.0 26.5 21.8 38.8 3.7 1.25-9 30504 7.6 92.4 0.0 0.0 0.0 0.010-14 26424 3.9 35.9 53.1 7.2 0.0 0.015 - 19 609556 4.2 25.4 26.4 43.8 0.2 0.020 - 24 1366653 5.3 24.7 25.3 42.4 2.2 0.125 - 29 1015900 6.9 24.2 19.0 40.4 6.4 3.230 - 34 575008 10.3 27.3 19.5 34.5 6.8 1.635 - 39 447897 12.8 29.1 18.0 35.6 2.6 2.040 - 44 256213 17.1 28.3 18.2 30.8 5.1 0.645 - 49 128411 13.5 31.9 18.1 34.7 1.8 0.150 - 54 41464 18.8 30.9 18.8 23.0 7.7 0.955 - 59 23880 17.5 33.8 9.2 29.5 9.9 0.060 - 64 10710 18.8 27.5 34.6 10.3 5.7 3.165+ 3746 0.0 75.4 19.7 3.9 1.0 0.0Female Total 184389 15.5 25.2 14.9 30.0 10.1 4.35-9 3178 6.5 93.5 0.0 0.0 0.0 0.010-14 4514 0.0 37.7 62.3 0.0 0.0 0.015 - 19 34248 14.5 10.6 29.5 37.5 7.9 0.020 - 24 55938 7.3 34.3 6.3 38.8 8.5 4.825 - 29 30563 11.0 18.2 11.9 27.7 24.4 6.830 - 34 30838 25.0 26.9 18.7 15.6 7.2 6.535 - 39 12837 42.8 16.0 2.0 24.2 6.2 8.840 - 44 4167 19.9 38.7 0.0 26.1 14.6 0.745 - 49 3236 17.0 4.2 2.1 75.6 1.2 0.050 - 54 1553 20.7 8.7 39.1 31.5 0.0 0.055 - 59 1065 8.0 14.3 70.4 7.3 0.0 0.060 - 64 842 44.4 55.6 0.0 0.0 0.0 0.0

National Series: Socio-economic and Demographic Report Page 333
Table Mig07: Educational Qualification of Immigrant by Age and Sex, 2011
Age
Highest Class Passed
Total Number of Immigrants
No Schooling Primary Junior
Secondary Secondary/
Higher Secondary
Graduate Masters
and Higher
1 2 3 4 5 6 7 8 65+ 1412 42.4 40.2 0.0 17.4 0.0 0.0Barisal Division Total 176272 0.9 25.9 19.2 47.7 5.5 0.85-9 1909 0.0 100.0 0.0 0.0 0.0 0.010-14 2199 0.0 7.9 92.1 0.0 0.0 0.015 - 19 22366 0.0 31.3 9.1 59.6 0.0 0.020 - 24 42683 0.5 13.9 21.2 63.4 0.8 0.125 - 29 36660 0.4 19.3 21.8 50.3 8.2 0.030 - 34 35758 1.9 28.5 16.8 43.6 9.1 0.235 - 39 16982 1.3 29.9 26.3 26.1 9.3 7.140 - 44 8996 2.3 41.8 20.6 20.2 14.8 0.345 - 49 6005 0.0 46.7 4.6 48.2 0.5 0.050 - 54 835 10.7 12.7 7.9 43.2 25.5 0.055 - 59 1849 0.0 88.7 3.5 7.8 0.0 0.060 - 64 29 0.0 100.0 0.0 0.0 0.0 0.065+ 0 0.0 0.0 0.0 0.0 0.0 0.0Male Total 169356 0.8 26.1 19.0 48.9 4.4 0.75-9 1532 0.0 100.0 0.0 0.0 0.0 0.010-14 1738 0.0 0.0 100.0 0.0 0.0 0.015 - 19 21789 0.0 31.3 8.2 60.5 0.0 0.020 - 24 41321 0.3 13.5 21.9 63.4 0.8 0.125 - 29 34403 0.5 20.2 23.2 53.2 2.9 0.030 - 34 34359 1.5 29.7 14.3 45.3 9.2 0.135 - 39 16625 1.3 29.3 26.9 26.5 8.8 7.240 - 44 8900 2.3 41.5 20.8 20.5 15.0 0.045 - 49 5975 0.0 46.9 4.2 48.5 0.5 0.050 - 54 835 10.7 12.7 7.9 43.2 25.5 0.055 - 59 1849 0.0 88.7 3.5 7.8 0.0 0.060 - 64 29 0.0 100.0 0.0 0.0 0.0 0.065+ 0 0.0 0.0 0.0 0.0 0.0 0.0Female Total 6915 3.6 21.8 23.7 17.1 32.6 1.35-9 377 0.0 100.0 0.0 0.0 0.0 0.010-14 461 0.0 37.6 62.4 0.0 0.0 0.015 - 19 577 0.0 31.8 43.3 24.9 0.0 0.020 - 24 1362 4.8 26.9 0.0 63.9 2.2 2.225 - 29 2257 0.0 5.8 0.0 4.7 89.5 0.030 - 34 1400 13.1 0.0 76.4 2.1 6.3 2.135 - 39 357 0.0 58.7 0.0 8.3 33.1 0.040 - 44 95 0.0 69.0 0.0 0.0 0.0 31.045 - 49 29 0.0 0.0 100.0 0.0 0.0 0.050 - 54 0 0.0 0.0 0.0 0.0 0.0 0.055 - 59 0 0.0 0.0 0.0 0.0 0.0 0.060 - 64 0 0.0 0.0 0.0 0.0 0.0 0.0

National Series: Socio-economic and Demographic Report Page 334
Table Mig07: Educational Qualification of Immigrant by Age and Sex, 2011
Age
Highest Class Passed
Total Number of Immigrants
No Schooling Primary Junior
Secondary Secondary/
Higher Secondary
Graduate Masters
and Higher
1 2 3 4 5 6 7 8 65+ 0 0.0 0.0 0.0 0.0 0.0 0.0Chittagong Division Total 1844082 9.2 26.6 22.6 37.7 3.4 0.65-9 13177 0.9 99.1 0.0 0.0 0.0 0.010-14 7126 0.0 41.3 58.7 0.0 0.0 0.015 - 19 217131 5.9 26.3 22.6 44.9 0.3 0.020 - 24 595211 7.2 24.5 24.9 40.7 2.4 0.225 - 29 413935 7.8 24.9 23.0 37.0 6.2 1.030 - 34 240196 12.3 26.2 20.5 34.8 5.2 1.035 - 39 151172 12.0 27.5 23.7 33.4 2.3 1.140 - 44 103401 15.3 31.7 15.5 34.8 1.8 0.845 - 49 60050 14.9 27.9 17.1 38.3 1.5 0.350 - 54 21617 14.9 29.3 20.0 23.9 10.3 1.755 - 59 13038 26.9 44.2 9.1 19.7 0.0 0.060 - 64 5967 28.6 25.3 40.4 1.9 0.0 3.865+ 2063 10.9 41.4 35.8 11.9 0.0 0.0Male Total 1808798 9.0 26.8 22.9 37.6 3.2 0.65-9 13177 0.9 99.1 0.0 0.0 0.0 0.010-14 7012 0.0 41.9 58.1 0.0 0.0 0.015 - 19 210985 3.9 26.8 23.2 45.8 0.3 0.020 - 24 577475 7.1 24.9 25.6 39.9 2.3 0.225 - 29 408280 7.8 25.0 23.2 37.4 5.6 1.030 - 34 237519 12.4 26.2 20.5 34.6 5.3 1.035 - 39 150523 12.1 27.2 23.8 33.5 2.3 1.140 - 44 102662 15.4 31.2 15.6 35.1 1.8 0.845 - 49 60050 14.9 27.9 17.1 38.3 1.5 0.350 - 54 20895 14.8 30.3 17.8 24.7 10.6 1.755 - 59 12886 27.3 43.5 9.2 20.0 0.0 0.060 - 64 5743 25.8 26.3 42.0 2.0 0.0 3.965+ 1593 0.0 53.6 46.4 0.0 0.0 0.0Female Total 35284 20.8 17.0 6.7 42.5 12.3 0.65-9 0 0.0 0.0 0.0 0.0 0.0 0.010-14 115 0.0 0.0 100.0 0.0 0.0 0.015 - 19 6146 75.1 10.1 0.0 14.8 0.0 0.020 - 24 17737 9.7 11.6 3.5 65.8 8.1 1.325 - 29 5655 7.7 22.6 7.7 10.4 51.5 0.030 - 34 2676 0.0 23.5 21.4 55.0 0.0 0.035 - 39 649 0.0 82.3 0.0 17.7 0.0 0.040 - 44 739 0.0 100.0 0.0 0.0 0.0 0.045 - 49 0 0.0 0.0 0.0 0.0 0.0 0.050 - 54 722 15.9 0.0 84.1 0.0 0.0 0.055 - 59 152 0.0 100.0 0.0 0.0 0.0 0.060 - 64 224 100.0 0.0 0.0 0.0 0.0 0.0

National Series: Socio-economic and Demographic Report Page 335
Table Mig07: Educational Qualification of Immigrant by Age and Sex, 2011
Age
Highest Class Passed
Total Number of Immigrants
No Schooling Primary Junior
Secondary Secondary/
Higher Secondary
Graduate Masters
and Higher
1 2 3 4 5 6 7 8 65+ 470 47.6 0.0 0.0 52.4 0.0 0.0 Dhaka Division Total 1477011 9.2 29.2 20.9 33.5 5.6 1.45-9 8954 10.7 89.3 0.0 0.0 0.0 0.010-14 8869 4.1 31.3 57.8 6.9 0.0 0.015 - 19 199998 5.8 27.7 27.3 37.7 1.5 0.020 - 24 420218 4.7 27.9 26.7 37.1 3.2 0.425 - 29 340497 7.8 27.8 14.9 37.6 9.4 2.530 - 34 193576 12.0 33.4 19.0 25.1 8.1 2.435 - 39 159460 15.9 33.7 16.8 26.3 3.6 3.740 - 44 89520 21.3 24.9 15.4 28.3 9.6 0.445 - 49 35840 15.7 20.4 18.8 41.3 3.7 0.050 - 54 12885 30.4 31.5 11.8 21.5 4.7 0.055 - 59 4467 2.9 4.6 13.9 26.7 51.9 0.060 - 64 1961 0.0 45.1 5.2 13.2 31.1 5.365+ 766 0.0 100.0 0.0 0.0 0.0 0.0Male Total 1393747 8.6 29.4 21.4 34.1 5.3 1.25-9 7319 13.0 87.0 0.0 0.0 0.0 0.010-14 7350 4.9 37.7 49.1 8.3 0.0 0.015 - 19 189711 6.0 27.9 27.9 38.0 0.3 0.020 - 24 399866 4.4 27.7 27.5 37.7 2.7 0.025 - 29 325278 7.6 28.0 15.0 37.7 9.6 2.130 - 34 171710 9.4 33.8 19.6 26.8 8.0 2.435 - 39 152020 13.3 35.1 17.6 27.4 3.4 3.240 - 44 87510 21.6 24.8 15.8 28.2 9.2 0.445 - 49 33657 16.7 21.4 20.1 37.9 4.0 0.050 - 54 12620 31.1 31.1 12.1 20.9 4.8 0.055 - 59 4467 2.9 4.6 13.9 26.7 51.9 0.060 - 64 1961 0.0 45.1 5.2 13.2 31.1 5.365+ 276 0.0 100.0 0.0 0.0 0.0 0.0Female Total 83264 19.9 26.8 12.6 23.8 10.7 6.35-9 1635 0.0 100.0 0.0 0.0 0.0 0.010-14 1519 0.0 0.0 100.0 0.0 0.0 0.015 - 19 10287 3.2 24.1 15.8 33.2 23.7 0.020 - 24 20352 9.9 31.8 12.1 25.0 12.2 9.025 - 29 15218 12.9 21.8 11.7 36.0 5.5 12.030 - 34 21866 32.3 30.3 14.0 11.7 8.8 2.835 - 39 7440 68.3 5.0 0.0 5.6 8.2 12.940 - 44 2010 6.7 29.9 0.0 33.0 30.4 0.045 - 49 2183 0.0 6.2 0.0 93.8 0.0 0.050 - 54 264 0.0 51.0 0.0 49.0 0.0 0.055 - 59 0 0.0 0.0 0.0 0.0 0.0 0.0

National Series: Socio-economic and Demographic Report Page 336
Table Mig07: Educational Qualification of Immigrant by Age and Sex, 2011
Age
Highest Class Passed
Total Number of Immigrants
No Schooling Primary Junior
Secondary Secondary/
Higher Secondary
Graduate Masters
and Higher
1 2 3 4 5 6 7 8 60 - 64 0 0.0 0.0 0.0 0.0 0.0 0.065+ 490 0.0 100.0 0.0 0.0 0.0 0.0 Khulna Division Total 455429 4.6 16.2 18.8 54.4 1.4 4.65-9 3635 16.8 83.2 0.0 0.0 0.0 0.010-14 4223 3.2 20.1 55.8 20.9 0.0 0.015 - 19 68527 2.0 14.1 17.6 66.1 0.1 0.020 - 24 129673 2.0 21.7 24.3 50.8 0.9 0.225 - 29 105341 4.4 10.8 14.9 50.9 2.5 16.530 - 34 52641 8.2 14.2 17.0 51.9 4.8 4.035 - 39 60073 7.6 8.7 7.2 75.0 0.1 1.340 - 44 17087 7.5 27.2 43.3 20.0 0.4 1.645 - 49 6273 10.0 26.2 27.7 36.1 0.0 0.050 - 54 1831 9.6 28.1 25.9 36.3 0.0 0.055 - 59 3262 19.3 0.0 0.0 80.7 0.0 0.060 - 64 1817 4.7 10.8 54.6 30.0 0.0 0.065+ 1044 0.0 93.5 0.0 6.5 0.0 0.0Male Total 428162 4.4 14.7 19.5 55.5 1.2 4.75-9 3437 17.8 82.2 0.0 0.0 0.0 0.010-14 3678 3.7 15.6 56.7 24.0 0.0 0.015 - 19 60831 2.3 15.9 18.2 63.6 0.0 0.020 - 24 119304 2.0 15.6 26.4 55.0 0.8 0.225 - 29 102376 3.6 10.6 15.3 51.8 1.8 16.930 - 34 51273 7.9 14.4 16.1 53.3 4.8 3.635 - 39 57098 7.3 9.2 7.5 74.9 0.0 1.040 - 44 16952 7.2 27.4 43.7 19.7 0.4 1.645 - 49 5539 5.3 29.7 31.4 33.7 0.0 0.050 - 54 1831 9.6 28.1 25.9 36.3 0.0 0.055 - 59 3177 17.1 0.0 0.0 82.9 0.0 0.060 - 64 1622 5.3 0.0 61.1 33.6 0.0 0.065+ 1044 0.0 93.5 0.0 6.5 0.0 0.0Female Total 27267 8.9 39.5 7.7 37.6 4.6 1.65-9 199 0.0 100.0 0.0 0.0 0.0 0.010-14 545 0.0 50.0 50.0 0.0 0.0 0.015 - 19 7696 0.0 0.0 13.2 86.0 0.9 0.020 - 24 10369 2.6 91.9 0.0 3.2 2.2 0.025 - 29 2965 32.8 17.1 2.3 19.6 28.3 0.030 - 34 1368 19.9 4.9 50.6 0.0 4.6 19.935 - 39 2976 13.7 0.0 2.1 76.1 2.1 5.940 - 44 135 50.0 0.0 0.0 50.0 0.0 0.045 - 49 734 46.0 0.0 0.0 54.0 0.0 0.050 - 54 0 0.0 0.0 0.0 0.0 0.0 0.0
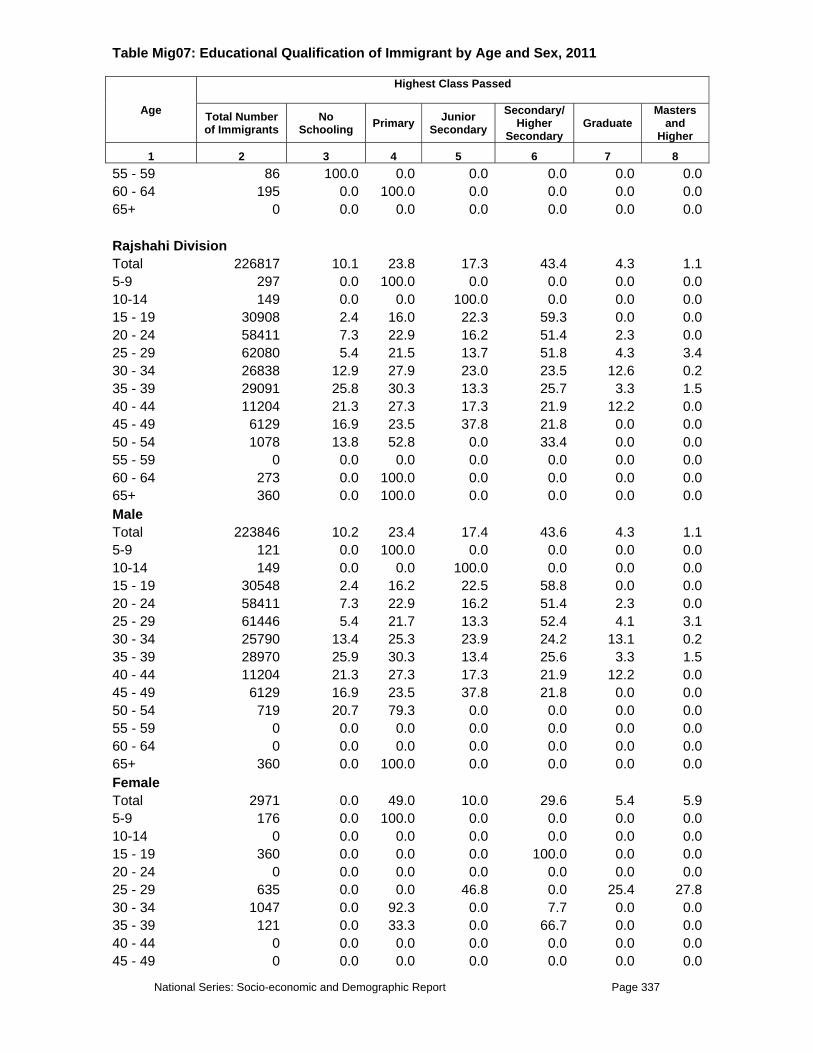
National Series: Socio-economic and Demographic Report Page 337
Table Mig07: Educational Qualification of Immigrant by Age and Sex, 2011
Age
Highest Class Passed
Total Number of Immigrants
No Schooling Primary Junior
Secondary Secondary/
Higher Secondary
Graduate Masters
and Higher
1 2 3 4 5 6 7 8 55 - 59 86 100.0 0.0 0.0 0.0 0.0 0.060 - 64 195 0.0 100.0 0.0 0.0 0.0 0.065+ 0 0.0 0.0 0.0 0.0 0.0 0.0 Rajshahi Division Total 226817 10.1 23.8 17.3 43.4 4.3 1.15-9 297 0.0 100.0 0.0 0.0 0.0 0.010-14 149 0.0 0.0 100.0 0.0 0.0 0.015 - 19 30908 2.4 16.0 22.3 59.3 0.0 0.020 - 24 58411 7.3 22.9 16.2 51.4 2.3 0.025 - 29 62080 5.4 21.5 13.7 51.8 4.3 3.430 - 34 26838 12.9 27.9 23.0 23.5 12.6 0.235 - 39 29091 25.8 30.3 13.3 25.7 3.3 1.540 - 44 11204 21.3 27.3 17.3 21.9 12.2 0.045 - 49 6129 16.9 23.5 37.8 21.8 0.0 0.050 - 54 1078 13.8 52.8 0.0 33.4 0.0 0.055 - 59 0 0.0 0.0 0.0 0.0 0.0 0.060 - 64 273 0.0 100.0 0.0 0.0 0.0 0.065+ 360 0.0 100.0 0.0 0.0 0.0 0.0Male Total 223846 10.2 23.4 17.4 43.6 4.3 1.15-9 121 0.0 100.0 0.0 0.0 0.0 0.010-14 149 0.0 0.0 100.0 0.0 0.0 0.015 - 19 30548 2.4 16.2 22.5 58.8 0.0 0.020 - 24 58411 7.3 22.9 16.2 51.4 2.3 0.025 - 29 61446 5.4 21.7 13.3 52.4 4.1 3.130 - 34 25790 13.4 25.3 23.9 24.2 13.1 0.235 - 39 28970 25.9 30.3 13.4 25.6 3.3 1.540 - 44 11204 21.3 27.3 17.3 21.9 12.2 0.045 - 49 6129 16.9 23.5 37.8 21.8 0.0 0.050 - 54 719 20.7 79.3 0.0 0.0 0.0 0.055 - 59 0 0.0 0.0 0.0 0.0 0.0 0.060 - 64 0 0.0 0.0 0.0 0.0 0.0 0.065+ 360 0.0 100.0 0.0 0.0 0.0 0.0Female Total 2971 0.0 49.0 10.0 29.6 5.4 5.95-9 176 0.0 100.0 0.0 0.0 0.0 0.010-14 0 0.0 0.0 0.0 0.0 0.0 0.015 - 19 360 0.0 0.0 0.0 100.0 0.0 0.020 - 24 0 0.0 0.0 0.0 0.0 0.0 0.025 - 29 635 0.0 0.0 46.8 0.0 25.4 27.830 - 34 1047 0.0 92.3 0.0 7.7 0.0 0.035 - 39 121 0.0 33.3 0.0 66.7 0.0 0.040 - 44 0 0.0 0.0 0.0 0.0 0.0 0.045 - 49 0 0.0 0.0 0.0 0.0 0.0 0.0

National Series: Socio-economic and Demographic Report Page 338
Table Mig07: Educational Qualification of Immigrant by Age and Sex, 2011
Age
Highest Class Passed
Total Number of Immigrants
No Schooling Primary Junior
Secondary Secondary/
Higher Secondary
Graduate Masters
and Higher
1 2 3 4 5 6 7 8 50 - 54 360 0.0 0.0 0.0 100.0 0.0 0.055 - 59 0 0.0 0.0 0.0 0.0 0.0 0.060 - 64 273 0.0 100.0 0.0 0.0 0.0 0.065+ 0 0.0 0.0 0.0 0.0 0.0 0.0Rangpur Division Total 128261 5.3 12.3 16.7 64.3 0.8 0.55-9 0 0.0 0.0 0.0 0.0 0.0 0.010-14 811 64.9 35.1 0.0 0.0 0.0 0.015 - 19 10830 0.0 21.6 19.6 58.9 0.0 0.020 - 24 43935 0.0 3.3 8.1 88.6 0.0 0.025 - 29 16901 7.3 1.0 17.7 70.4 0.0 3.630 - 34 16871 1.3 3.5 36.4 54.3 4.6 0.035 - 39 15204 10.1 33.5 9.8 44.9 1.7 0.040 - 44 13770 19.1 2.2 22.4 56.2 0.0 0.045 - 49 7195 6.5 71.7 7.1 14.8 0.0 0.050 - 54 2022 0.0 20.9 79.1 0.0 0.0 0.055 - 59 509 0.0 0.0 0.0 100.0 0.0 0.060 - 64 0 0.0 0.0 0.0 0.0 0.0 0.065+ 211 100.0 0.0 0.0 0.0 0.0 0.0Male Total 125617 4.9 12.2 16.9 64.7 0.8 0.55-9 0 0.0 0.0 0.0 0.0 0.0 0.010-14 811 64.9 35.1 0.0 0.0 0.0 0.015 - 19 10830 0.0 21.6 19.6 58.9 0.0 0.020 - 24 42180 0.0 2.1 8.4 89.5 0.0 0.025 - 29 16647 7.4 1.1 16.5 71.5 0.0 3.630 - 34 16871 1.3 3.5 36.4 54.3 4.6 0.035 - 39 15204 10.1 33.5 9.8 44.9 1.7 0.040 - 44 13559 17.9 2.3 22.7 57.1 0.0 0.045 - 49 6984 3.6 73.8 7.3 15.2 0.0 0.050 - 54 2022 0.0 20.9 79.1 0.0 0.0 0.055 - 59 509 0.0 0.0 0.0 100.0 0.0 0.060 - 64 0 0.0 0.0 0.0 0.0 0.0 0.065+ 0 0.0 0.0 0.0 0.0 0.0 0.0Female Total 2644 24.0 21.0 9.6 45.4 0.0 0.05-9 0 0.0 0.0 0.0 0.0 0.0 0.010-14 0 0.0 0.0 0.0 0.0 0.0 0.015 - 19 0 0.0 0.0 0.0 0.0 0.0 0.020 - 24 1756 0.0 31.7 0.0 68.3 0.0 0.025 - 29 255 0.0 0.0 100.0 0.0 0.0 0.030 - 34 0 0.0 0.0 0.0 0.0 0.0 0.035 - 39 0 0.0 0.0 0.0 0.0 0.0 0.040 - 44 211 100.0 0.0 0.0 0.0 0.0 0.045 - 49 211 100.0 0.0 0.0 0.0 0.0 0.0

National Series: Socio-economic and Demographic Report Page 339
Table Mig07: Educational Qualification of Immigrant by Age and Sex, 2011
Age
Highest Class Passed
Total Number of Immigrants
No Schooling Primary Junior
Secondary Secondary/
Higher Secondary
Graduate Masters
and Higher
1 2 3 4 5 6 7 8 50 - 54 0 0.0 0.0 0.0 0.0 0.0 0.055 - 59 0 0.0 0.0 0.0 0.0 0.0 0.060 - 64 0 0.0 0.0 0.0 0.0 0.0 0.065+ 211 100.0 0.0 0.0 0.0 0.0 0.0Sylhet Division Total 412885 7.9 33.2 27.3 26.9 3.5 1.15-9 5710 14.6 85.4 0.0 0.0 0.0 0.010-14 7561 0.0 55.0 39.5 5.5 0.0 0.015 - 19 94044 4.4 23.3 46.9 25.2 0.2 0.020 - 24 132460 5.0 33.6 26.9 30.8 3.0 0.725 - 29 71049 6.5 30.0 22.0 30.3 8.5 2.730 - 34 39967 13.7 30.1 12.4 31.7 8.0 4.135 - 39 28752 18.9 44.2 14.3 21.2 1.1 0.340 - 44 16402 18.9 43.9 14.9 19.4 2.9 0.045 - 49 10154 11.8 59.0 13.3 15.5 0.4 0.050 - 54 2749 20.8 33.8 14.2 25.6 5.7 0.055 - 59 1819 0.0 34.4 59.2 4.3 2.1 0.060 - 64 1505 39.8 34.3 13.7 12.2 0.0 0.065+ 714 22.9 60.8 0.0 10.9 5.4 0.0Male Total 386842 8.1 34.5 26.5 26.9 3.3 0.75-9 4919 12.7 87.3 0.0 0.0 0.0 0.010-14 5686 0.0 51.1 41.7 7.3 0.0 0.015 - 19 84863 4.9 25.4 43.5 26.2 0.0 0.020 - 24 128098 5.2 34.6 27.4 29.9 2.7 0.225 - 29 67470 6.9 31.1 22.0 29.4 7.9 2.830 - 34 37485 14.1 32.1 12.2 32.0 8.1 1.535 - 39 27458 19.7 43.0 14.3 21.5 1.2 0.340 - 44 15426 17.4 45.4 15.8 18.4 3.1 0.045 - 49 10076 11.9 59.5 13.1 15.6 0.0 0.050 - 54 2542 14.4 36.5 15.3 27.6 6.1 0.055 - 59 991 0.0 63.2 32.9 0.0 3.9 0.060 - 64 1355 33.2 38.1 15.3 13.5 0.0 0.065+ 473 0.0 75.4 0.0 16.4 8.2 0.0Female Total 26043 5.1 15.1 40.0 26.8 6.3 6.85-9 791 26.1 73.9 0.0 0.0 0.0 0.010-14 1875 0.0 66.9 33.1 0.0 0.0 0.015 - 19 9182 0.0 4.0 78.6 15.4 2.0 0.020 - 24 4362 0.0 4.7 10.4 58.1 13.0 13.725 - 29 3579 0.0 9.1 21.9 47.5 19.3 2.230 - 34 2481 7.4 0.0 14.4 28.0 6.0 44.235 - 39 1294 0.0 69.4 14.6 16.0 0.0 0.040 - 44 977 42.3 21.2 0.0 36.5 0.0 0.045 - 49 78 0.0 0.0 50.0 0.0 50.0 0.0

National Series: Socio-economic and Demographic Report Page 340
Table Mig07: Educational Qualification of Immigrant by Age and Sex, 2011
Age
Highest Class Passed
Total Number of Immigrants
No Schooling Primary Junior
Secondary Secondary/
Higher Secondary
Graduate Masters
and Higher
1 2 3 4 5 6 7 8 50 - 54 207 100.0 0.0 0.0 0.0 0.0 0.055 - 59 827 0.0 0.0 90.6 9.4 0.0 0.060 - 64 150 100.0 0.0 0.0 0.0 0.0 0.065+ 241 67.7 32.3 0.0 0.0 0.0 0.0

National Series: Socio-economic and Demographic Report Page 341
List of BBS Personnel Engaged in Preparing this Report
1. Ashim Kumar Dey Director (Deputy Secretary) and
Project Director, Population and Housing Census 2011.
2. Ghose Subobrata Joint Director 3. Alauddin Al Azad Deputy Director 4. Mohammad Abdul Kadir Miah Deputy Director 5. Dr. Dipankar Roy Deputy Director 6. Md. Abdur Rahim Deputy Director 7. Md. Mahmuduzzaman Deputy Director 8. Md. Golam Mostofa Deputy Director 9. Md. Salimur Rahman Statistical Officer
10. Md. Mostak Ahmed Miah Programmer 11. Md. Khorshed Alam Assistant Statistical Officer 12. Ms. Jarina Pasha Assistant Statistical Officer 13. Enayet Hossain Assistant Statistical Officer 14. Md. Rezaul Karim Assistant Statistical Officer
Appendix -I
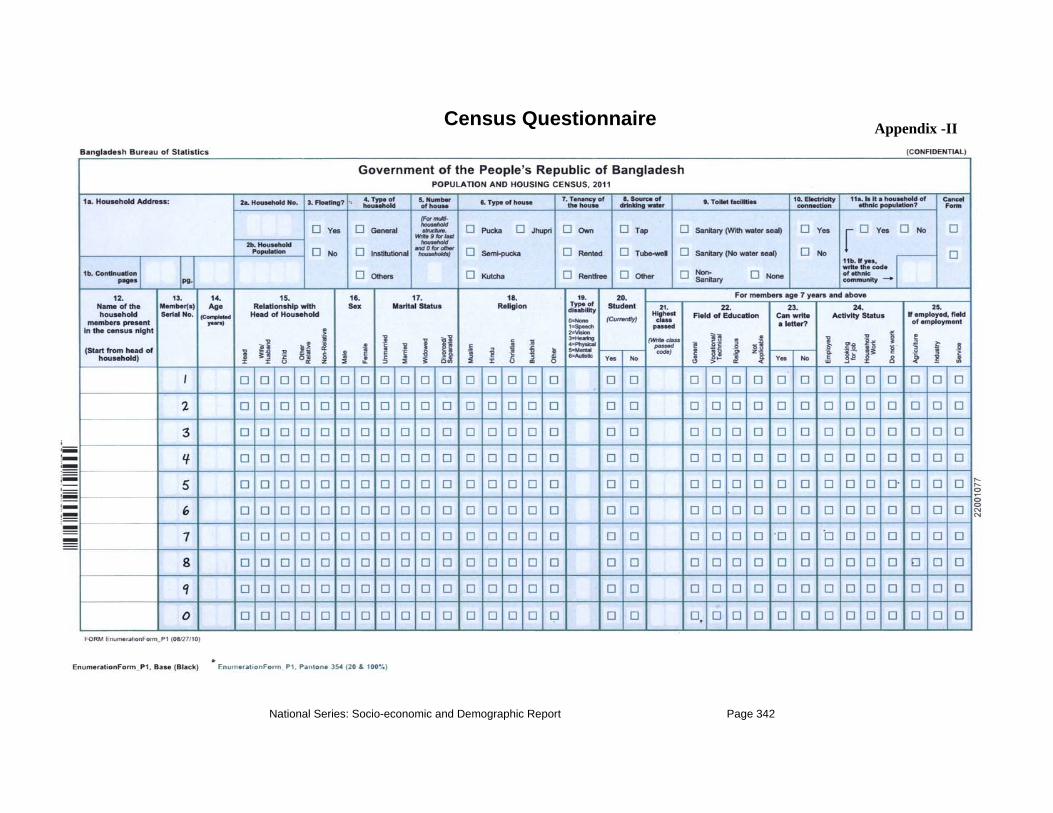
National Series: Socio-economic and Demographic Report Page 342
Census Questionnaire
Appendix -II

National Series: Socio-economic and Demographic Report Page 343
Sample Census Questionnaire Appendix -III
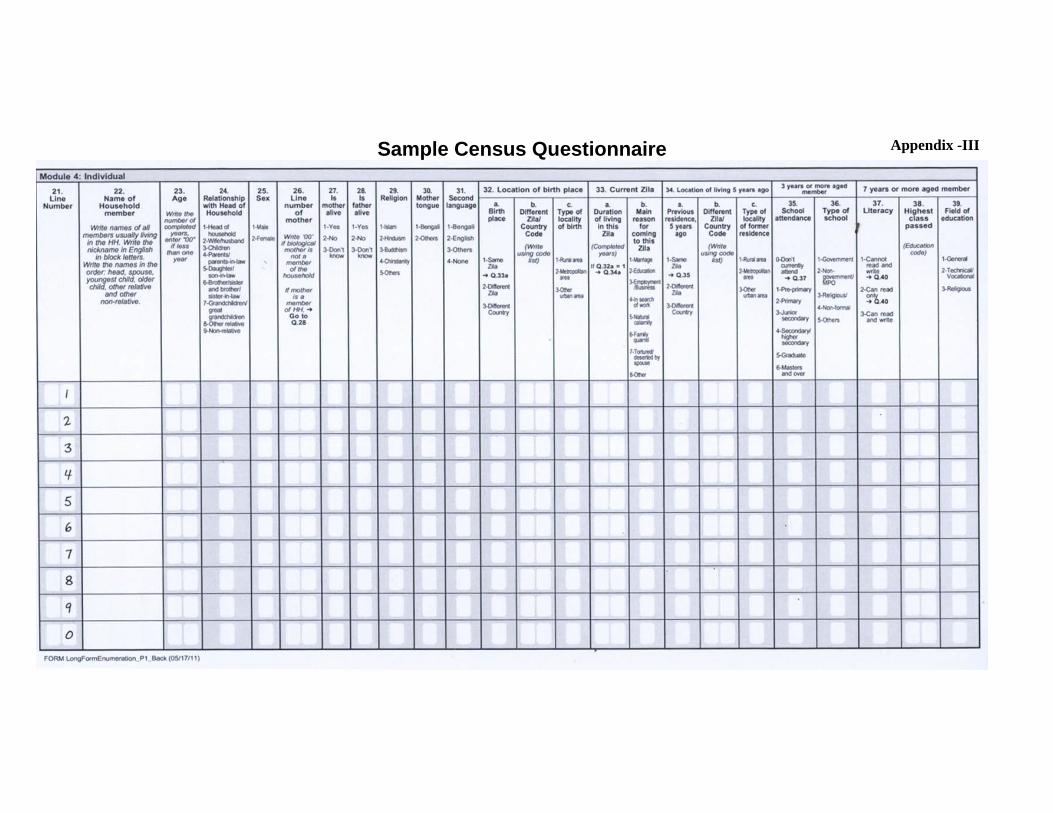
Sample Census Questionnaire Appendix -III

Sample Census Questionnaire Appendix -III

Sample Census Questionnaire Appendix -III

Related Documents