
Welcome message from author
This document is posted to help you gain knowledge. Please leave a comment to let me know what you think about it! Share it to your friends and learn new things together.
Transcript


i
Society of Extension Education, GujaratDirectorate of Extension Education
Anand Agricultural UniversityAnand-388 110, Gujarat, India
Gujarat Journal of
Extension EducationVol. : 27Issue : 1Year : 2016
ii
EDITORIAL BOARD(Gujarat Journal of Extension Education )
Chief Editor : Dr. M. R. Prajapati Prinicpal, C. P. College of Agriculture Sardarkrushinagar Dantiwada Agricultural University SK Nagar-385506 Mo. : 99249 77250 Email: [email protected]
Associate Editors : Dr. N. V. Soni Associate Extension Educationist Publication Dept., DOEE, Anand Agricultural University Anand – 388 110 Mo. : 94278 56045 Email: [email protected]
Dr. J. B. Patel Associate Editor Associate Professor, Dept. of Extension Education B.A., College of Agriculture, Anand Agricultural University Anand – 388 110 Mo. : 94273 85081 Email: [email protected]
Dr. J. K. Patel Senior Scientist & Head, Krushi Vigyan Kendra Anand Agricultural University Arnej-382230 Mo. : 96012 79243 Email: [email protected]
Dr. V. J. Savaliya Assistant Professor, Dept. of Extension Education College of Agriculture, Junagadh Agricultural Univeristy Junagadh-362001 Mo. : 94277 41952 Email: [email protected]
Dr. H. U. Vyas Associate Professor, Dept. of Extension Education College of Agriculture, NAU, Bharuch - 392012 Mo. : 8128994357 Email: [email protected] Dr. J. K. Patel Assistant Professor, Dept. of Extension Education C.P. College of Agriculture Sardarkrushinagar Dantiwada Agricultural University SK Nagar-385506 Mo. : 9429848010 Email: [email protected]
iii
Guidelines to AuthorGujarat Journal of Extension Education
General rules
1 Gujarat Journal of Extension Education is published yearly by “Society of Extension Education”, Anand, which includes the articles contributed by the members of the association and invited articles of eminent researchers.
2 The journal publishes full- length papers, short communication based on new finding/approaches and review articles in English only.
3 The paper submitted for the publication in the journal should not contain material already published in any form or even a part of it offered for publication elsewhere.
4 Authors should submit a certificate duly signed by all authors to the effect that material contained has not been submitted elsewhere for publication.
5 All papers are published after peer review and thereafter approved by the Chief Editor.
6 Submission of paper (through online or offline with CD) does not guarantee its acceptance or publication in Gujarat Journal of Extension Education.
7 It is mandatory for all authors to be member of the Society of Extension Education, Anand (Gujarat).
8 Copy of journal is provided free to all its members. Reprints of papers are not provided.
9 The research paper should contain only three author names. The research paper contains more than three names will not be accepted for publication.
Preparation of manuscript
1 Articles should not exceed 1 .5 double spaced typed pages including references, tables, figures etc.
2 Title of contribution should be short, specific and phrased to identify the content in the article and include the nature of the study. It must written in running letters with first letter capital.
3 The names and initials of the place where research was conducted should be given as the by-line.Any change in the address of correspondence address should be given in a footnote. AUTHORS NAME should be in capital letters.
4 Paper may be outlined under main heading- ABSTRACT, INTRODUCTION, METHOLOGY, RESULTS AND DISCUSSION, CONCLUSION if -any, -ACKNOWLEDGEMENTS, REFERENCES etc should be in capitals.
5 Manuscript should be submitted in duplicate typed in 12 pt Times New Roman in double space throught on A4 size paper with a minimum 3 cm left margin and Soft copy will be required at thetime of submission of revised paper.
6 Abstract should not exceed 200 words. Key words upto six may be given beneath the abstract. 1 Where the methods are well known, citation of standard work would suffice.
8 The result may be supported by tables or graphics, wherever necessary. Self-explanatory tables should be on separate sheets, with appropriate titles. While referring in texts, the first letter in Table and Fig. should be capital with Fig. in short form.

iv
9 References should be cited chronologically in the text. All references in the text must be listed at the end of the paper, with names of the author arranged alphabetically; all entries in the text must correspond to references in the text.
10 The references should include the names of the authors, year, full title of the article, name of the journal, volume number and pages. In case of book and monographs etc. the name of publishers, place, and year with total number of pages should also be given. Journal title should be italic in abbreviated form Example :
Journal Article:
Munikishor, S., Chandargi, D.M. and Hirevenkanagoudar, L. V. (2008).Development of Scale to Measure the Attitude of Beneficiaries towards Sujala Watershed Project.Karnataka J. Agric. Sci., 21(1): 144-145.
Whole book:
Federer, W.T. (1955). Experimental Desingns. The MacMillin Co., New York.
Book chapter:
Cochran, W.G. (1972). Sampling techniques.Wiley Eastern pvt.ltd., New Delhi. 87-107.
Report/Bulletin:
Anonymous (1996).Annual report.Department of Agricultural Statistics, B. A. College of Agriculture, Anand Agricultural University, Anand.
11 Authors are requested to follow the international system of units for exact measurement of physical quantities.
12 All Correspondence should be addressed to : Dr. N.V. Soni Managing Editor Gujarat Journal of Extension Education Office of the Directorate of Extension Education Univeristy Bhavan, Anand Agricultural University, Anand-388110
Check List
1 Manuscript is typed in double space throughout in 12 pt Times New Roman
2 Title is written in running letters only.
3 AUTHORS NAME is capitalized
4 Main heading (ABSTRACT, METHODOLOGY, RESULTS AND DISCUSSION, CONCLUSION, REFERENCES etc are capitalized.
5 Sub-heading are left aligned.
6 Check all reference cited in the text are in the reference and vice-versa.\
7 Give journal name in abbreviated forms in italic in the references.
8 Book title and report name are given in full
9 Tables and Fig are on separate page and numbered in the order in which discussed in the text.
v
Form for enrollment
Society of Extension Education, Anand (Gujarat)Proposal of Membership
• Name in full (Block letter) :
• Address :
Phone/Email :
• Date of Birth :
• Profession and present employment :
• Academic qualification :
• Societies of which already member :
• Amount paid :
Fee: Life Member : ` 2000, Corporate/Institutional Member : ` 3000/- for 10 years and Patrons (Individual or Institutional): ` 5000/-
Declaration by the Nominee
I hereby declare that I shall abide by the Statutes and Regulations of the Society of Extension Education and offer my cooperation in promoting its objectives.
Date:------------------------------- Signature----------------------------------------
I propose that _ _ _ _ _ _ _ _ _ _ _ _ ___ _ _ _ _ _ _ _ _ _ __ _ _ _ _ be admitted as Life member of the Society of Extension Education.
Signature :
Name in full :
Address :
Date :
I second the above proposal for admission of _ _ _ _ _ _ _ _ _ __ _ _ _ _ _ _ __ _ __ to the Society of Extension Educa-
tion.
Signature :
Name in full :
Address :Date :All remittances and correspondence relating to subscription, membership, advertisement etc. should be addressed to Secretary-cum-Treasurer, Society of Extension Education, Office of Director of Extension Education, University Bhavan, Anand Agricultural University, Anand - 388 110, Gujarat. The Demand Draft should be issued in favour of ‘M S OF EXTENSION EDUCATION’ payable at Anand OR through money transfer to Central Bank of India A/c No. 1215785307, IFSC No. : CBIN0281262, (Branch Code : 1262) at Institute of Agri. Campus, Anand Branch, Anand - 388 110
website : www.gjoee.org email : [email protected]
vi
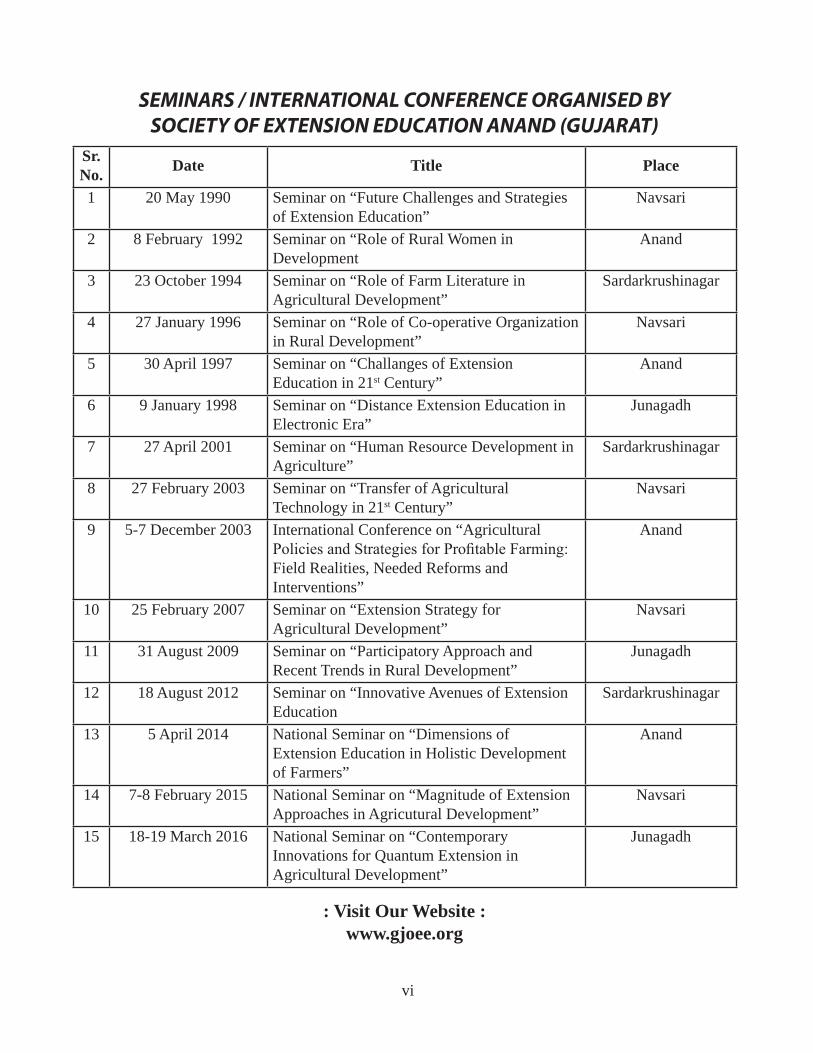
SEMINARS / INTERNATIONAL CONFERENCE ORGANISED BY SOCIETY OF EXTENSION EDUCATION ANAND (GUJARAT)
Sr. No. Date Title Place
1 20 May 1990 Seminar on “Future Challenges and Strategies of Extension Education”
Navsari
2 8 February 1992 Seminar on “Role of Rural Women in Development
Anand
3 23 October 1994 Seminar on “Role of Farm Literature in Agricultural Development”
Sardarkrushinagar
4 27 January 1996 Seminar on “Role of Co-operative Organization in Rural Development”
Navsari
5 30 April 1997 Seminar on “Challanges of Extension Education in 21st Century”
Anand
6 9 January 1998 Seminar on “Distance Extension Education in Electronic Era”
Junagadh
7 27 April 2001 Seminar on “Human Resource Development in Agriculture”
Sardarkrushinagar
8 27 February 2003 Seminar on “Transfer of Agricultural Technology in 21st Century”
Navsari
9 5-7 December 2003 International Conference on “Agricultural Policies and Strategies for Profitable Farming: Field Realities, Needed Reforms and Interventions”
Anand
10 25 February 2007 Seminar on “Extension Strategy for Agricultural Development”
Navsari
11 31 August 2009 Seminar on “Participatory Approach and Recent Trends in Rural Development”
Junagadh
12 18 August 2012 Seminar on “Innovative Avenues of Extension Education
Sardarkrushinagar
13 5 April 2014 National Seminar on “Dimensions of Extension Education in Holistic Development of Farmers”
Anand
14 7-8 February 2015 National Seminar on “Magnitude of Extension Approaches in Agricutural Development”
Navsari
15 18-19 March 2016 National Seminar on “Contemporary Innovations for Quantum Extension in Agricultural Development”
Junagadh
: Visit Our Website :www.gjoee.org

vii
ANNOUNCEMENT
National SeminarJointly Organized by Society of Extension Education, Gujarat &
Sardarkrushinagar Dantiwada Agricultural University, Sardarkrushinagaron
6 – 7 April 2017Extension Plus: Expanding Horizons of Extension for Holistic Agricultural Development
PREAMBLE
Today Agricultural Extension is at its cross age where the paradigm of its application shifts towards pluralistic direction. Agricultural Extension requires continuous renewal of its content and methods. So, we have to think not only in present context but also for the future to make the discipline more competitive and fruitful. We have to consider the expanding demand of information and extension support for the changing situation to deal with the challenges. Keeping this view of futuristic role of extension in rapidly changing scenario of agricultural development, a National Seminar on “Extension Plus: Expanding Horizons of Extension for Holistic Agricultural Development” is planned to provide a right forum to every professionals of the discipline as well as the farmers, policy makers and administrators to share their experiences and expertise, to support the extension professionals as well as the farming community.
THEMATIC AREAS :
1 Pluralistic Extension Systems and Policies• Govt. programmes for agricultural and rural development • Demand driven extension, market led extension and commodity based extension, contract based and
corporate extension• Special group extension, participatory extension, PPP, NGOs, IPR and WTO 2 Role of ICT in Agricultural Development• Use of ICT tools for extension research, information management and technology dissemination• IT based initiatives • Role of mass and print media• Information delivery mechanism• Information and communication management• Need based and resource based information• Adoption of remote sensing and GIS in agriculture3 Gender Mainstreaming • Differential needs of women and their problems• Gender sensitivity and mainstreaming in technology generation and dissemination• Women empowerment programmes and their impact, case studies and success stories
viii
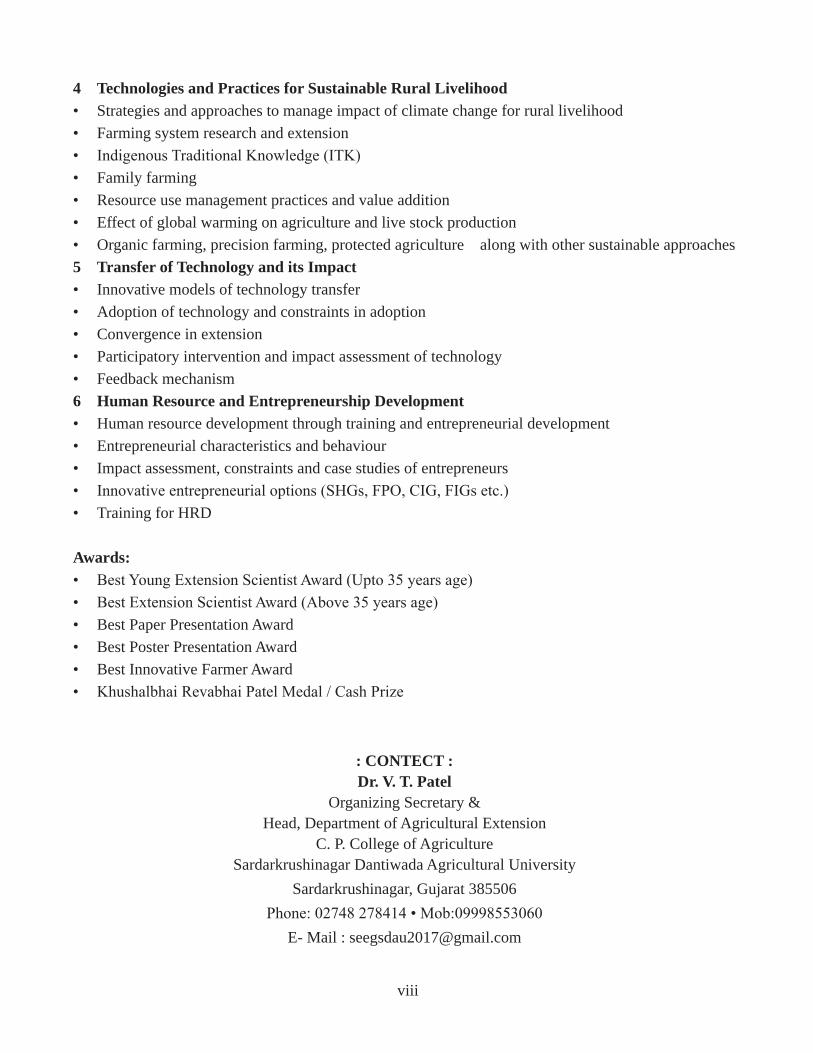
4 Technologies and Practices for Sustainable Rural Livelihood • Strategies and approaches to manage impact of climate change for rural livelihood• Farming system research and extension • Indigenous Traditional Knowledge (ITK)• Family farming • Resource use management practices and value addition• Effect of global warming on agriculture and live stock production• Organic farming, precision farming, protected agriculture along with other sustainable approaches 5 Transfer of Technology and its Impact• Innovative models of technology transfer• Adoption of technology and constraints in adoption• Convergence in extension• Participatory intervention and impact assessment of technology• Feedback mechanism 6 Human Resource and Entrepreneurship Development• Human resource development through training and entrepreneurial development• Entrepreneurial characteristics and behaviour• Impact assessment, constraints and case studies of entrepreneurs • Innovative entrepreneurial options (SHGs, FPO, CIG, FIGs etc.)• Training for HRD
Awards: • Best Young Extension Scientist Award (Upto 35 years age)• Best Extension Scientist Award (Above 35 years age)• Best Paper Presentation Award• Best Poster Presentation Award • Best Innovative Farmer Award• Khushalbhai Revabhai Patel Medal / Cash Prize
: CONTECT :Dr. V. T. Patel
Organizing Secretary & Head, Department of Agricultural Extension
C. P. College of AgricultureSardarkrushinagar Dantiwada Agricultural University
Sardarkrushinagar, Gujarat 385506Phone: 02748 278414 • Mob:09998553060
E- Mail : [email protected]

ix
From Chief Editor’s Desk......
The major function of extension education is to bring positive changes in the society in general and agriculture in particular. This might be achieved through the blend of modern as well as indigenous technologies with the help of new trends of extension like privatization, market led extension, use of ICT, gender sensitization, farmer to farmer extension, and networking of various groups. The Gujarat Society of Extension Education is also engaged in this noble cause by publishing a research journal and organizing special national seminars on current topics every year.
It is a matter of immense pleasure to note that publication of Gujarat Journal of Extension Education is being brought out as a sincere commitment to the farming community and the extension professionals. The contributors’ efforts are to be appreciated for paying their enduring attention, which is painstaking and time consuming, toward contributing quality research papers. Indeed, we are extremely grateful to the contributors for their sincere dedication in contributing to the journal.
We do hope that their keen interest shall be sustained in making the journal progressive. We are sure that the journal shall be significantly useful to all the readers. Simultaneously, we welcome the valuable feedback from our readers for improvement of the journal.
The activities of all the associated professionals are diverse, so I could not have been completed without the cooperation of every one. I feel privileged to thank my editorial team members Dr. N. V. Soni, Dr. J K Patel, Dr. J. B. Patel, Dr. H. U. Vyas and Dr. V J. Savaliya for their untiring efforts for finalizing the articles and bringing this journal into present form.
My sincere thanks are due to Dr. Arun Patel, Director of Extension Education and President of the Gujarat Society of Extension Education and all the members of the society for providing us this opportunity. My sincere thanks are also to the energetic and focused colleagues Dr. N. B. Chauhan, Dr. R. D. Pandya, Dr. P. R. Kanani and Dr. V. T. Patel for availing their wide experience, deep insights and knowledge to make our journal reputed.
I hope this publication will prove its utility for all those who are engaged and interested in noble cause of upliftment and advancement of agriculture through suitable strategic extension approaches.
We always welcome your suggestions and comments and solicit the same.
(Dr. M.R.Prajapati) Chief Editor

x
Our reviewers
• Dr. J. P. Sharma, Pricipal Scientist, IARI, New Delhi
• Dr. Dipak De, Prof. & Head, BHU, Varansi
• Dr. K. L. Dangi, Prof. & Head, MPUAP, Udaipur
• Dr. S. B. Shinde, Prof. & Head, MPKV, Rahuri
• Dr. S. K. Kher, Prof. & Head, Sher-E Kashmir Uni. of Agri. Sci. & Tech., jammu
• Dr. Nalin Khare, Prof. & Head, JNKV, Jabalpur
• Dr. M. L. Sharma, Prof. & Head, IGKVV,Raipur
• Dr. S. S. Shisodiya, Prof., Ext. Edu., MPUAT, Udaipur
• Dr. K. A. Thakkar, DEE, SDAU, S.K. Nagar
• Dr. B. T. Patel, Ex. DEE, GAU, Ahmedabad
• Dr. A. O. Kher, Ex DEE, GAU, Junagadh
• Dr. M.C. Soni, Ex DEE, SDAU, S.K. Nagar
• Dr. R. B. Patel, Ex DEE, NAU, Navsari
• Dr. V. V. Mayani, Ex. Ext. Educationist, AAU, Anand
• Dr. V. D. Joshi, Ex Prof., NAU, Navsari
• Dr. N.B. Chauhan, Prof. & Head, Ext. Edu. Dept., AAU, Anand
• Dr. P.R. Kanani, Prof. & Head, Ext. Edu. Dept., JAU, Junagadh
• Dr. R.D. Pandya, Prof. & Head, Ext. Edu. Dept., NAU, Navsari
• Dr. K. B. Kamaliya, Principal, Polytechnic in Food Sc. & Hom. Eco., AAU, Anand
• Dr. Y. R. Godasara, Librarian, AAU, Anand

xi
CONTENTS
Sr. No.
Title Page No.
1 Tool to Measure Attitude of the Agricultural Scientists Towards Agricultural PublicationsA. R. Makwan and N. B. Chauhan
1
2 Interpersonal Conflict Among Employees of Agricultural Universities of GujaratSunil R. Patel, J. K. Patel and Smt. K. U. Chandravadiya
4
3 Adoption of Package of practices for Dairy animalsA. C. Vaidya, A. R. Macwan and N. H. Joshi
8
4 Performance of System of Rice Intensification (SRI) Technique in Rice (Oryza sativa L.) on Farmer’s Field K.D.Mevada, M.V.Patel and N.P.Chauhan
12
5 Management Efficiency of Poultry OwnersG. N. Thorat, S. G. Vahora and M. M. Trivedi
18
6 Digital-Enabled Services for Agriculture Development R.S. Parmar, D.R. Kathiriya and G.J.Kamani
20
7 Knowledge of Nutritional Practices among the Tribal WomenG.J.Patel, Dipti P. Patel and Dweep B. Ramjiyani
24
8 Yield Gap and Level of Demonstrated Crop Production TechnologyA. K. Rai, Raj Kumar and J. K. Jadav
27
9 Digital Dairy Farm Management SystemR.S. Parmar, H.K Patel and N.M. Vegad
30
10 Relationship Between Reading Behaviour of Krushijivan Farm Magazine Subscriber Livestock Owners and Their ProfileV. V. Solanki, J. B. Patel and Sunny Jani
36
11 Effects of Independent Variables on Overall Extent of Contribution of Tribal Farmwomen in Agricultural ActivitiesMahesh R. Patel, D. D. Patel and Jaydip D. Desai
39
12 Determinants in Knowledge about Recommended Package of Practices of Root & Tuber CropsV. B. Girawale and R. M. Naik
43
13 Impact of Cumin Crop Field Demonstrations on Knowledge of Farmers Patel D. B., Mistry J. J. and Patel V. M.
45
14 Constraints Faced by Biofertilizer Users Chaudhary Diptesh and Dr. N.M. Chauhan
49
15 Knowledge Level of Recommended Green Gram Cultivation Technology of Tribal FLD Farmers J. J. Mistry , D. B. Patel and V. M. Patel
53
16 Risk Preference of Tribal Farm Women and its Relationship with their Contribution in Agriculture and Animal HusbandryMahesh R. Patel, Arun Patel and Pravin Chaudhary
56
17 Communication Behavior of Tribal Dairy Women in Animal Husbandry G. N. Thorat, S. G. Vahora and D. B. Ramjiyani
59
xii
Sr. No.
Title Page No.
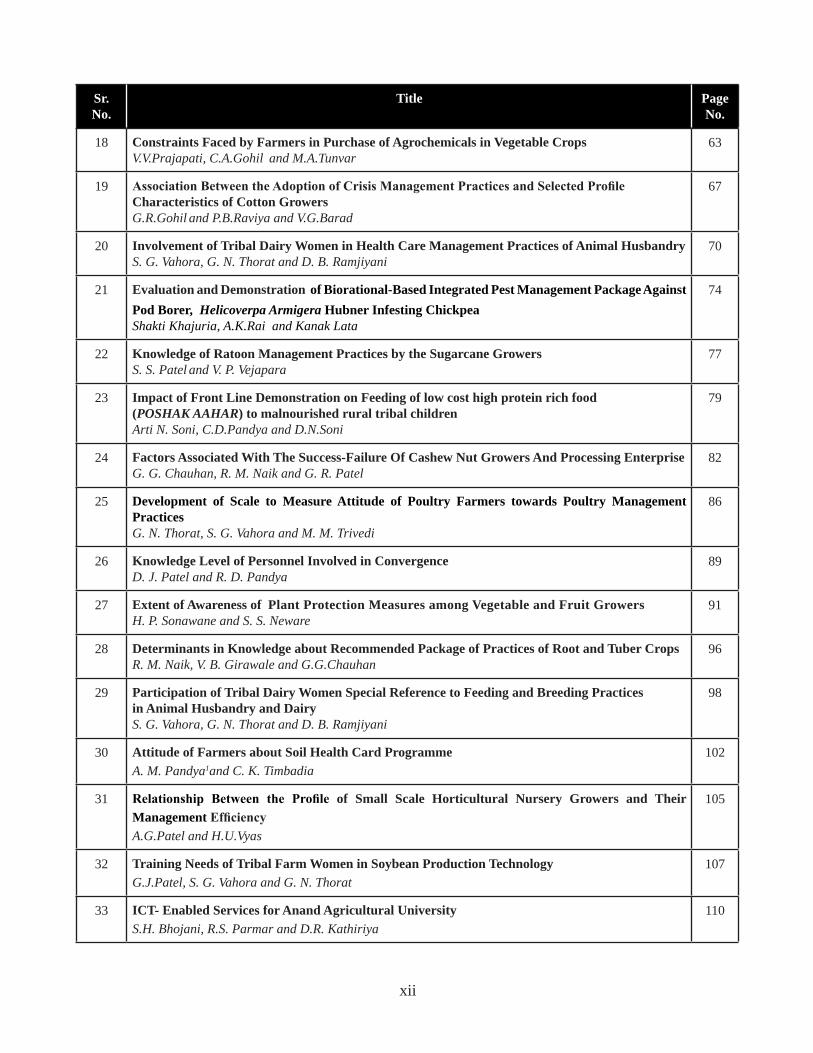
18 Constraints Faced by Farmers in Purchase of Agrochemicals in Vegetable Crops V.V.Prajapati, C.A.Gohil and M.A.Tunvar
63
19 Association Between the Adoption of Crisis Management Practices and Selected Profile Characteristics of Cotton Growers G.R.Gohil and P.B.Raviya and V.G.Barad
67
20 Involvement of Tribal Dairy Women in Health Care Management Practices of Animal Husbandry S. G. Vahora, G. N. Thorat and D. B. Ramjiyani
70
21 Evaluation and Demonstration of Biorational-Based Integrated Pest Management Package Against Pod Borer, Helicoverpa Armigera Hubner Infesting ChickpeaShakti Khajuria, A.K.Rai and Kanak Lata
74
22 Knowledge of Ratoon Management Practices by the Sugarcane GrowersS. S. Patel and V. P. Vejapara
77
23 Impact of Front Line Demonstration on Feeding of low cost high protein rich food (POSHAK AAHAR) to malnourished rural tribal childrenArti N. Soni, C.D.Pandya and D.N.Soni
79
24 Factors Associated With The Success-Failure Of Cashew Nut Growers And Processing EnterpriseG. G. Chauhan, R. M. Naik and G. R. Patel
82
25 Development of Scale to Measure Attitude of Poultry Farmers towards Poultry Management PracticesG. N. Thorat, S. G. Vahora and M. M. Trivedi
86
26 Knowledge Level of Personnel Involved in Convergence D. J. Patel and R. D. Pandya
89
27 Extent of Awareness of Plant Protection Measures among Vegetable and Fruit GrowersH. P. Sonawane and S. S. Neware
91
28 Determinants in Knowledge about Recommended Package of Practices of Root and Tuber CropsR. M. Naik, V. B. Girawale and G.G.Chauhan
96
29 Participation of Tribal Dairy Women Special Reference to Feeding and Breeding Practices in Animal Husbandry and DairyS. G. Vahora, G. N. Thorat and D. B. Ramjiyani
98
30 Attitude of Farmers about Soil Health Card ProgrammeA. M. Pandya1and C. K. Timbadia
102
31 Relationship Between the Profile of Small Scale Horticultural Nursery Growers and Their Management Efficiency A.G.Patel and H.U.Vyas
105
32 Training Needs of Tribal Farm Women in Soybean Production Technology G.J.Patel, S. G. Vahora and G. N. Thorat
107
33 ICT- Enabled Services for Anand Agricultural University S.H. Bhojani, R.S. Parmar and D.R. Kathiriya
110

Guj. J. Ext. Edu. Vol. 27 : Issue 1 : December 2016
1
INTRODUCTION
A breakthrough in any field of agriculture is impossible without an effective communication support to disseminate the research findings. Speedy dissemination of agricultural information and technological knowhow to the farmers is essential for bridging the gap between the agricultural scientists and the farmers. The existing extension services are too small to perform this task so; the mass media like agricultural publications with their tremendous speedy range and force of impact offer the greatest possibility for effective communication of agricultural technology. Moreover, agricultural scientists through their active participation in agricultural publications can play an important role in increasing farmers’ knowledge regarding agriculture technology. By reading the articles, naturally it is expected that farmers may be motivated to adopt the agriculture technology on their farm. Considering significance of agricultural scientists’ role in agricultural publication, it was felt necessary to develop a tool to measure feelings of the agricultural scientists towards Agril-Publications.
OBJECTIVE
To develop a tool to measure attitude of the agricultural scientists towards agricultural publications
METHODOLOGY
In the current study, attitude is defined as positive
or negative feeling of scientists towards agricultural publications. Among the procedures accessible ‘The Scale product method’ which is a combinations of the Thrustone’s technique (1928) of equal appearing interval scale for selection of items and Likert’s technique (1932) of summated rating for ascertaining the response on the scale as proposed by Eysenck and Crown (1949) was used.
Item collection
The items of attitude scale are known as statements. In initial stage, 45 statements reflecting feelings of the scientists towards Agricultural Publications (APs) were collected from relevant literature and discussion with experts of extension discipline. The composed statements were edited according to the criteria suggested by Edward (1957). Thereafter selected 45 statements were selected for the further procedure as they were found to be unmistakable.
Item analysis
With a view to judging the degree of ‘Unfavorableness’ to ‘Favorableness’ of each statement on the five point equal appearing interval continuum, a team of judges was selected. Fifty slips of the selected statements were handed over to the experts connected with agricultural publication and extension educational works. The judges were requested to judge each statement in terms of their most agreement or most disagreement with the statements
TOOL TO MEASURE ATTITUDE OF THE AGRICULTURAL SCIENTISTS TOWARDS AGRICULTURAL PUBLICATIONS
A. R. Makwan1 and N. B. Chauhan2
1 Assistant Professor, Institute of Distance Education, AAU, Anand - 3881102 Professor & Head, Department of Extension Education, BACA, AAU, Anand - 388110
e-mail: [email protected]
ABSTRACT
The study was conducted to develop and standardize a reliable and valid scale to measure attitude of the agricultural scientists towards Agril-Publications (APs). From the available methods to develop attitude scale, ‘Scale product method’ was used. This method combines Thurston and Likert techniques. Total 45 statements were selected for judgment; a team of 50 judges was appealed to give the score for each statement on five point continuum. Based on the Scale (median) and Q values, twenty statements were finally selected to constitute the scale to measure attitude of the agricultural scientists towards agro-publications.
Keywords: agricultural publications, agricultural scientists, attitude

Guj. J. Ext. Edu. Vol. 27 : Issue 1 : December 2016
2
with the five equal appearing interval continuums. Out of these experts, all the experts returned the statements after duly recording their judgments and were considered for the analysis.
Determination of scale and ‘Q’ values: Based on responses of the judges, Frequency distribution in five continuums was prepared. On the bases of judgment, the Median Value of the distribution and ‘Q’, Q3 and Q1 values for each of 45 statements were worked out. The inter-quartile range (Q = Q3 - Q1) for each statement was exercised for determination of vagueness involved in the statement. Only those statements as items were selected, whose median (scale) values were greater than Q values. On the other hand, when a few items had the same scale values, items having lowest Q value were selected. Based on this, 20 statements were finally selected to constitute attitude scale. The selected 20 statements for final
format of the attitude scale were randomly arranged to avoid response bias. The final format of the scale is presented in Table: 1.
Reliability of the scale
The reliability of the scale is an important aspect in the development of dependable tool to measure attitude. In order to know the consistency of the scale, reliability was worked out. The split-half technique was used to measure the reliability of the scale. Selected 20 attitudinal statements were divided into two equal halves with 10 (Ten) odd and 10 (Ten) even numbered statements. Each of the two sets was treated as separate scales having obtained two score, for each of the 20 respondents. Co-efficient of reliability between the two sets of score was calculated by Rulon’s formula (Guilford 1954), which was 0.89.
Table 1: Final selected statements to measure attitude of the agricultural scientists towards Agricultural Publications
No. Statements ‘S’ value ‘Q’ value1 Agril-Publications (APs) provide solutions to tackle current agricultural situations. (+) 4.08 0.752 APs are less effective than other media in getting farmers’ feedback. (-) 3.88 1.353 APs help in harmonizing scientists, extension personnel and farmers. (+) 3.77 1.65
4 APs are incompetent to channelize functioning between researchers and extension agents. (-) 4.19 1.63
5 APs are potential media to connect agricultural research, education and extension management. (+) 4.11 1.15
6 APs are inefficient to address every areas of agriculture. (-) 4.13 1.397 APs are encouraging means to aid current extension systems. (+) 4.24 1.148 APs have insignificant contribution in farming process. (-) 3.97 0.789 APs encourage farmers effectively to purchase farm inputs. (+) 3.76 1.46
10 I consider Agril-publications as useless part in my life. (-) 4.22 0.9711 Existing infrastructure of APs is capable to meet farmers’ needs. (+) 4.25 1.1112 I have never experienced scientists advising me to contribute through APs. (-) 2.19 1.9613 APs contribute productively for farmers. (+) 4.05 0.8614 Agril-publications are not my areas of interest. (-) 3.98 1.5315 APs provide sound opportunity to farmers know information in local language. (+) 4.02 0.8616 It is difficult to address ideas through Agril-publications. (-) 4.57 1.1617 APs facilitate integration of information sources. (+) 3.93 1.4018 I think agricultural publication is possible only by trained specialists. (-) 4.54 1.2919 APs are the strength of progress of agricultural extension. (+) 4.25 1.1120 I visualize significance of Agril-publications for my future work. (+) 4.54 1.29
Validity of the scale
The validity of content is also an important part to develop applicable, suitable and appropriate scale to measure attitude. The validity of scale was checked by deep conversation with experts and specialists of the extension and statistics. Specialists scrutinized and appreciated correctness of the every item or statement to determine the feeling of
scientists towards Agricultural Publications.
Administration of the scale (Scoring technique)
For application of the scale, the researcher can collect information against each 20 statements in five point continuum viz. ’Strongly agree’, ‘Agree’, ‘Undecided’, ’Disagree’ and ‘Strongly disagree’ with weighted score of 5,4,3,2 and 1 for positive and reverse scoring is advised to
Guj. J. Ext. Edu. Vol. 27 : Issue 1 : December 2016
3
quantify negative statements.
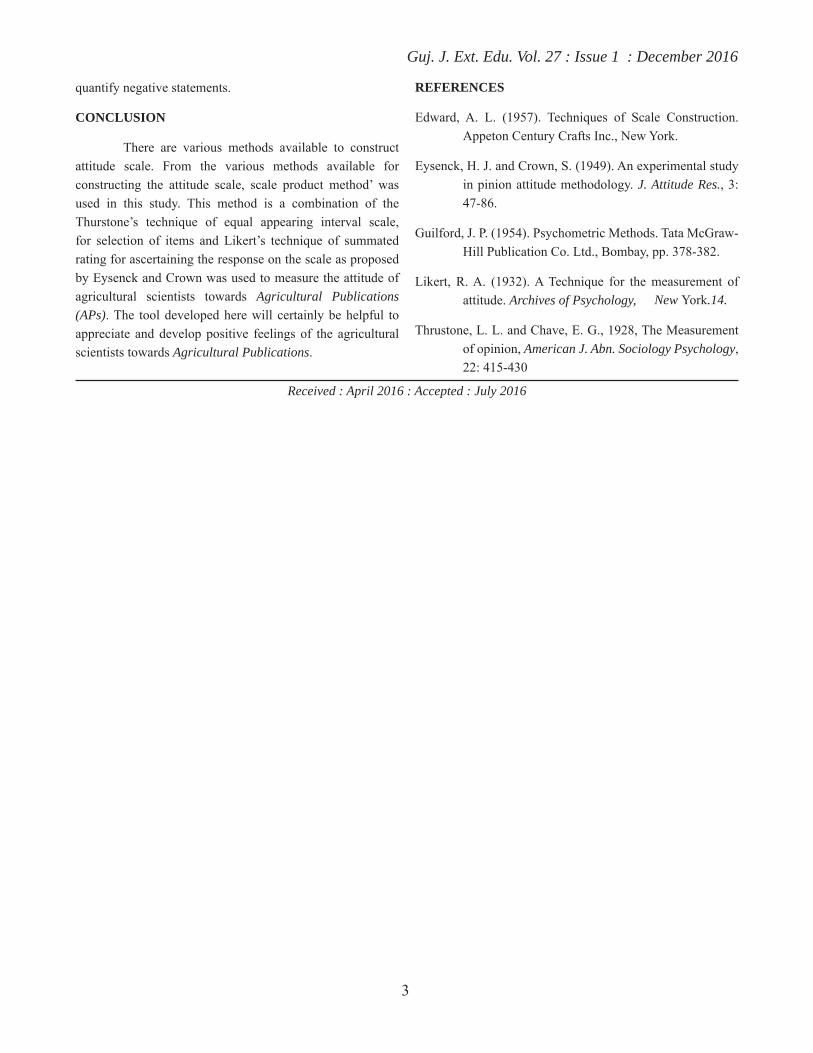
CONCLUSION
There are various methods available to construct attitude scale. From the various methods available for constructing the attitude scale, scale product method’ was used in this study. This method is a combination of the Thurstone’s technique of equal appearing interval scale, for selection of items and Likert’s technique of summated rating for ascertaining the response on the scale as proposed by Eysenck and Crown was used to measure the attitude of agricultural scientists towards Agricultural Publications (APs). The tool developed here will certainly be helpful to appreciate and develop positive feelings of the agricultural scientists towards Agricultural Publications.
REFERENCES
Edward, A. L. (1957). Techniques of Scale Construction. Appeton Century Crafts Inc., New York.
Eysenck, H. J. and Crown, S. (1949). An experimental study in pinion attitude methodology. J. Attitude Res., 3: 47-86.
Guilford, J. P. (1954). Psychometric Methods. Tata McGraw-Hill Publication Co. Ltd., Bombay, pp. 378-382.
Likert, R. A. (1932). A Technique for the measurement of attitude. Archives of Psychology, New York.14.
Thrustone, L. L. and Chave, E. G., 1928, The Measurement of opinion, American J. Abn. Sociology Psychology, 22: 415-430
Received : April 2016 : Accepted : July 2016

Guj. J. Ext. Edu. Vol. 27 : Issue 1 : December 2016
4
INTRODUCTION
Conflict is a part of human existence and is a basic fact of life in groups and organizations. Though people spend about one third of each day at work place, the psychological hand over of the tension and conflict generated at the place of work continues even beyond the hours of work. They also face conflict in social life. This means that major portion of employee’s life is spent with conflicts. These prolonged conflicts and tension adversely affect employee’s mental and physical health. This, in turn, results in decreased efficiency and productivity of an employee and thereby of an organization.
In this situation, for any organization to be more effective and productive incessantly, it is of vital importance for the organization to know the extent of conflict among its employees and how it is affected by various their characteristics.
OBJECTIVES
(1) To find out the extent of interpersonal conflict existing among employees of agricultural universities of Gujarat
(2) To study the relationship between the extent of interpersonal conflict and profile of employees of
agricultural universities of Gujarat
METHODOLOGY
The present investigation was conducted in Anand Agricultural University, Anand and Sardar Krushinagar Dantiwada Agricultutal University, S.K.Nagar of Gujarat State. For the investigation, technical employees were taken into consideration and were broadly divided into three categories: upper cadre, middle cadre and lower cadre. From each cadre, 40 respondents were randomly selected making a total sample size of 120 respondents. As two Agricultural Universities were selected for the study; it was also decided to have equal size of sample from both the universities. Thus from each of the two universities, 20 respondents each from upper, middle and lower cadre were selected by employing random sampling techniques. Thus, in relation to universities, 60 respondents each from AAU and SDAU were randomly selected.
The extent of interpersonal conflict among employees was measured with developed and standardized scale. An interview schedule was developed in accordance with the objectives and the data were collected through personal interview. The statistical measures such as percentage, mean score, standard deviation and coefficient
INTERPERSONAL CONFLICT AMONG EMPLOYEES OF AGRICULTURAL UNIVERSITIES OF GUJARAT
Sunil R. Patel1, J. K. Patel2 and Smt. K. U. Chandravadiya3
1 Officer on Special Duty/principal, College of Agriculture, AAU, Jabugam - 391155
2 Program Coordinator, Krushi vigyan Kendra, AAU, Arnej - 382230 3 Assistant professor, College of Agriculture, AAU, Jabugam - 391155
Email : [email protected]
ABSTRACT
The present investigation was carried out with a view to knowing the extent of interpersonal conflict among employees and its relationship with their various characteristics. Total 120 employees of three categories: upper cadre, middle cadre and lower cadre from Anand Agricultural University, Anand and Sardar Krushinagar Dantiwada Agricultutal University, S.K.Nagar of Gujarat State were selected for the investigation. The results revealed that lower cadre employees had higher extent of overall interpersonal conflict than middle and upper cadre employees. Age, experience, annual income, attitude towards working pattern of SAU, job satisfaction and communication had negatively significant and perception of workload had positively significant correlation with the extent of interpersonal conflict.
Keywords : conflict, satisfaction, employee

Guj. J. Ext. Edu. Vol. 27 : Issue 1 : December 2016
5
of correlation were used to interpret the data. The results revealed that the proportion of the employees having low, medium and high extent of overall interpersonal conflict was almost equal i.e. one-third.
RESULTS AND DISCUSSION
Extent of interpersonal conflict among employees
Interpersonal conflict comprising task conflict as well as relationship conflict existing among the employees is of vital concern for the organization. Hence, it was thought worthwhile to study the extent of interpersonal conflict existing among employees of Agricultural Universities of Gujarat at three levels: interpersonal conflict with their superiors, colleagues and subordinates. The results in this regard have been given in the succeeding pages.
Extent of interpersonal conflict among employees with their superiors
The information pertaining to interpersonal conflict among employees with their superiors is presented in Table: 1.
Table: 1 Distribution of respondents according to their extent of interpersonal conflict with their n=120
Sr. No.
Extent of interpersonal conflict with superiors
Cadre of the employees OverallLower Middle Upper
1 Low(below 21.761)
09(22.50)
13(32.50)
10(25.00)
32(26.67)
2 Medium(in between 21.761 and 27.223)
18(45.00)
13(32.50)
15(37.50)
46(38.33)
3 High(above 27.223)
13(32.50)
14(35.00)
15(37.50)
42(35.00)
Mean: 24.492 S.D.:2.731 Figures in parenthesis indicate percentage
As it is evident from the Table: 1, middle cadre employees were found to be distributed nearly equally in the low (32.50 per cent), medium (32.50 per cent) and high (35.00 per cent) category of interpersonal conflict with superiors. In case of lower cadre, more than three-fourth (77.50 per cent) of the employees were observed to have medium to high extent of conflict with their superiors, whereas 22.50 per cent of them had low extent of interpersonal conflict with their
superiors. With regards to upper cadre, equal number of employees i.e. 37.50 per cent had medium and high extent of interpersonal conflict with their superiors and remaining 25. 00 per cent of them had low extent of interpersonal conflict with their superiors.
In total, it can be stated that slightly less than three-fourth of the employees (73.33 per cent) had medium to high extent of interpersonal conflict with their superiors.
Extent of interpersonal conflict among employees with their colleagues
The data in respect of interpersonal conflict among employees with their colleagues are presented in Table: 2.
Table: 2 Distribution of respondents according to their extent of interpersonal conflict with their colleagues
n=120
Sr. No.
Extent of interpersonal conflict with colleagues
Cadre of the employees OverallLower Middle Upper
1 Low(below 20.713)
06(15.00)
15(37.50)
18(45.00)
39(32.50)
2 Medium(in between 20.713 and 27.121)
19(47.50)
16(40.00)
14(35.00)
49(40.83)
3 High(above 27.121)
15(37.50)
09(22.50)
08(20.00)
32(26.67)
Mean:23.917 S.D.:3.204 Figures in parenthesis indicate percentage
It is obvious from the Table: 2 that slightly less than half (47.50 per cent) of the lower cadre employees were found to have medium extent of interpersonal conflict with their colleagues followed by 37.50 per cent and 15.00 per cent of them with high and low extent of interpersonal conflict with their colleagues, respectively. In case of middle cadre, majority (77.50 per cent) of the employees were observed to have medium to low extent of interpersonal conflict with their colleagues, whereas in upper cadre, four-fifth of the employees (80.00 per cent) had low to medium extent of interpersonal conflict with their colleagues. Overall, it can be said that nearly three-fourth of the employees (73.33 per cent) had medium to low extent of interpersonal conflict with their colleagues.
Guj. J. Ext. Edu. Vol. 27 : Issue 1 : December 2016
6
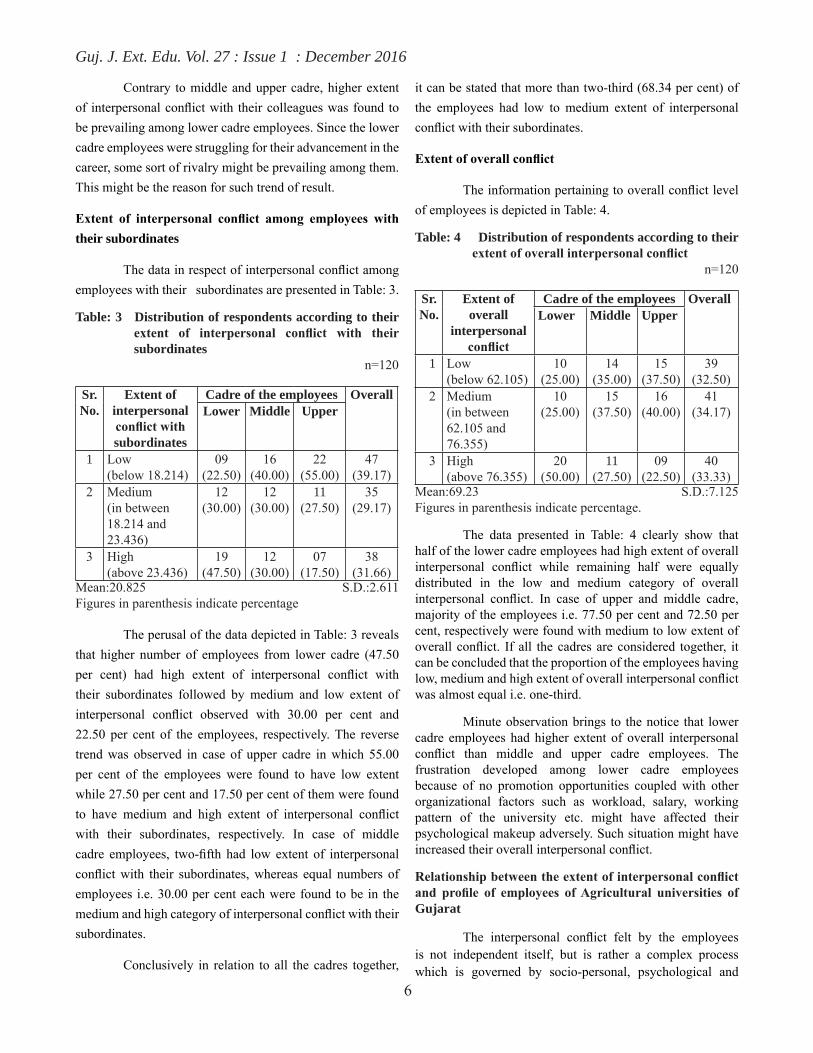
Contrary to middle and upper cadre, higher extent of interpersonal conflict with their colleagues was found to be prevailing among lower cadre employees. Since the lower cadre employees were struggling for their advancement in the career, some sort of rivalry might be prevailing among them. This might be the reason for such trend of result.
Extent of interpersonal conflict among employees with their subordinates
The data in respect of interpersonal conflict among employees with their subordinates are presented in Table: 3.
Table: 3 Distribution of respondents according to their extent of interpersonal conflict with their subordinates n=120
Sr. No.
Extent of interpersonal conflict with subordinates
Cadre of the employees OverallLower Middle Upper
1 Low(below 18.214)
09(22.50)
16(40.00)
22(55.00)
47(39.17)
2 Medium(in between 18.214 and 23.436)
12(30.00)
12(30.00)
11(27.50)
35(29.17)
3 High(above 23.436)
19(47.50)
12(30.00)
07(17.50)
38(31.66)
Mean:20.825 S.D.:2.611 Figures in parenthesis indicate percentage
The perusal of the data depicted in Table: 3 reveals that higher number of employees from lower cadre (47.50 per cent) had high extent of interpersonal conflict with their subordinates followed by medium and low extent of interpersonal conflict observed with 30.00 per cent and 22.50 per cent of the employees, respectively. The reverse trend was observed in case of upper cadre in which 55.00 per cent of the employees were found to have low extent while 27.50 per cent and 17.50 per cent of them were found to have medium and high extent of interpersonal conflict with their subordinates, respectively. In case of middle cadre employees, two-fifth had low extent of interpersonal conflict with their subordinates, whereas equal numbers of employees i.e. 30.00 per cent each were found to be in the medium and high category of interpersonal conflict with their subordinates.
Conclusively in relation to all the cadres together,
it can be stated that more than two-third (68.34 per cent) of the employees had low to medium extent of interpersonal conflict with their subordinates.
Extent of overall conflict
The information pertaining to overall conflict level of employees is depicted in Table: 4.
Table: 4 Distribution of respondents according to their extent of overall interpersonal conflict
n=120
Sr. No.
Extent of overall
interpersonal conflict
Cadre of the employees OverallLower Middle Upper
1 Low(below 62.105)
10(25.00)
14(35.00)
15(37.50)
39(32.50)
2 Medium(in between 62.105 and 76.355)
10(25.00)
15(37.50)
16(40.00)
41(34.17)
3 High(above 76.355)
20(50.00)
11(27.50)
09(22.50)
40(33.33)
Mean:69.23 S.D.:7.125 Figures in parenthesis indicate percentage.
The data presented in Table: 4 clearly show that half of the lower cadre employees had high extent of overall interpersonal conflict while remaining half were equally distributed in the low and medium category of overall interpersonal conflict. In case of upper and middle cadre, majority of the employees i.e. 77.50 per cent and 72.50 per cent, respectively were found with medium to low extent of overall conflict. If all the cadres are considered together, it can be concluded that the proportion of the employees having low, medium and high extent of overall interpersonal conflict was almost equal i.e. one-third.
Minute observation brings to the notice that lower cadre employees had higher extent of overall interpersonal conflict than middle and upper cadre employees. The frustration developed among lower cadre employees because of no promotion opportunities coupled with other organizational factors such as workload, salary, working pattern of the university etc. might have affected their psychological makeup adversely. Such situation might have increased their overall interpersonal conflict.
Relationship between the extent of interpersonal conflict and profile of employees of Agricultural universities of Gujarat
The interpersonal conflict felt by the employees is not independent itself, but is rather a complex process which is governed by socio-personal, psychological and
Guj. J. Ext. Edu. Vol. 27 : Issue 1 : December 2016
7
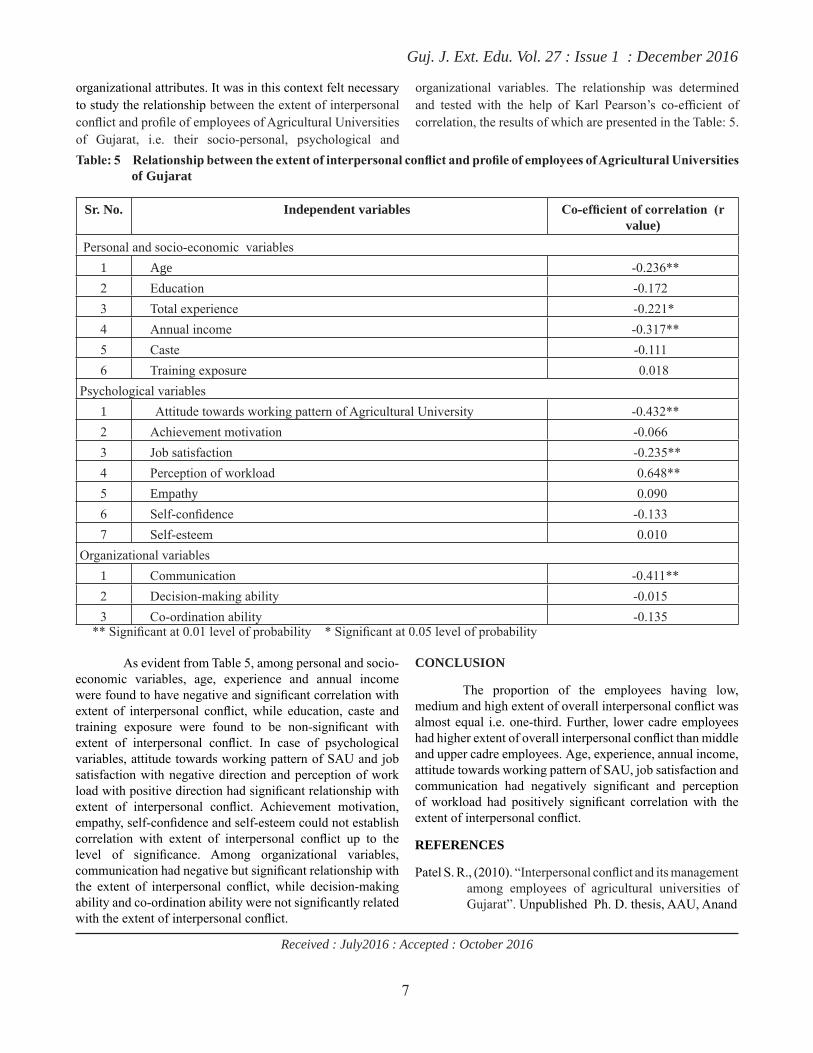
organizational attributes. It was in this context felt necessary to study the relationship between the extent of interpersonal conflict and profile of employees of Agricultural Universities of Gujarat, i.e. their socio-personal, psychological and
organizational variables. The relationship was determined and tested with the help of Karl Pearson’s co-efficient of correlation, the results of which are presented in the Table: 5.
Table: 5 Relationship between the extent of interpersonal conflict and profile of employees of Agricultural Universities of Gujarat
Sr. No. Independent variables Co-efficient of correlation (r value)
Personal and socio-economic variables1 Age -0.236**2 Education -0.1723 Total experience -0.221*4 Annual income -0.317**5 Caste -0.1116 Training exposure 0.018
Psychological variables1 Attitude towards working pattern of Agricultural University -0.432**2 Achievement motivation -0.0663 Job satisfaction -0.235**4 Perception of workload 0.648**5 Empathy 0.0906 Self-confidence -0.1337 Self-esteem 0.010
Organizational variables1 Communication -0.411**2 Decision-making ability -0.0153 Co-ordination ability -0.135
** Significant at 0.01 level of probability * Significant at 0.05 level of probability
As evident from Table 5, among personal and socio-economic variables, age, experience and annual income were found to have negative and significant correlation with extent of interpersonal conflict, while education, caste and training exposure were found to be non-significant with extent of interpersonal conflict. In case of psychological variables, attitude towards working pattern of SAU and job satisfaction with negative direction and perception of work load with positive direction had significant relationship with extent of interpersonal conflict. Achievement motivation, empathy, self-confidence and self-esteem could not establish correlation with extent of interpersonal conflict up to the level of significance. Among organizational variables, communication had negative but significant relationship with the extent of interpersonal conflict, while decision-making ability and co-ordination ability were not significantly related with the extent of interpersonal conflict.
CONCLUSION
The proportion of the employees having low, medium and high extent of overall interpersonal conflict was almost equal i.e. one-third. Further, lower cadre employees had higher extent of overall interpersonal conflict than middle and upper cadre employees. Age, experience, annual income, attitude towards working pattern of SAU, job satisfaction and communication had negatively significant and perception of workload had positively significant correlation with the extent of interpersonal conflict.
REFERENCES
Patel S. R., (2010). “Interpersonal conflict and its management among employees of agricultural universities of Gujarat”. Unpublished Ph. D. thesis, AAU, Anand
Received : July2016 : Accepted : October 2016
Guj. J. Ext. Edu. Vol. 27 : Issue 1 : December 2016
8
INTRODUCTION
Animal Husbandry and Dairying play an important role in the national economy and in the socio-economic development of the country. The livestock sector alone contributes nearly 25.6% of Value of Output at current prices of total value of output in Agriculture, Fishing & Forestry sector and an overall contribution of Livestock Sector in total GDP is nearly 4.11% at current prices during 2012-13. (Livestock Census, 2012).These sectors also play a significant role in supplementing family income and generating gainful employment in the rural sector, particularly, among the landless laborers, small and marginal farmers and women, besides providing cheap nutritional food to millions of people. Milk producers of Ahmadabad district of Gujarat state follow the ancestral system of milk production. Majority of Animal keeper are small, marginal and landless farmers. Considering these facts present study was under taken to know the adoption of no cost and low cost dairy practices by formulating above objectives.
OBJECTIVES
(1) To study the selected characteristics of dairy farmers.
(2) To study the adoption of dairy practices by the dairy farmers
METHODOLOGY
Out of nine talukas of Ahmadabad district, four talukas namely Bavla, Sanand, Ahmadabad city taluka and Dholka were selected randomly. For the selection of villages two villages Rupal and Juda randomly selected from Bavla and Sanandtaluka having dairy cooperative society and two villages Saijpur and Lana randomly selected from Ahmadabad and Dholka taluka having no dairy cooperative society. A list of dairy farmers was obtained from VLWs and Chairman / Secretary of dairy cooperatives. From those four villages twenty five (25) dairy farmers from each village were selected randomly, thus total one hundred (100) dairy farmers were selected as respondents for the study.
Pertaining to the study an interview schedule was developed according to the objectives with the help of Professors of Agricultural and Veterinary colleges of Anand Agricultural University, Anand. The data were collected through the personal interview of selected dairy farmers. The data were tabulated and analyzed to draw the meaningful conclusion.
ADOPTION OF PACKAGE OF PRACTICES FOR DAIRY ANIMALS
A. C. Vaidya1, A. R. Macwan2 and N. H. Joshi3
1 Associate Professor and Head, Department of Veterinary and A. H. Extension, A.A.U., Anand - 3881102 Assistant Professor, IDEA, AAU, Anand - 388001
3 M.V. Sc. Scholar, Department of Veterinary and A. H. Extension, A.A.U., Anand - 388001Email : [email protected]
ABSTRACT
Animal husbandry plays a significant role for uplifting rural community in India. Dairying is considered as a “trea
-
sure” of the Indian rural economy. It provides gainful employment to a vast majority of rural households. Successful animal husbandry depends of adoption of package of practices. The present study were carried out to study the adoption of different package of practices for dairy animals. The study revealed that adoption of package of practices in dairy animals like general livestock management, feed and water management, calf rearing, breeding, clean milk production and health management were low and there are some gaps in adoption of scientific livestock management practices. Deworming, full hand milking, washing of the teats after milking, feeding of silage, urea treated straw and chaffed green and dry fodder, insurance of dairy animals, participation in animal husbandry training camps, treatment camps and agricultural fairs, record keeping are im-portant practices to be adopted by dairy farmers.
Keywords: adoption, package of practices and dairy animals

Guj. J. Ext. Edu. Vol. 27 : Issue 1 : December 2016
9
RESULTS AND DISCUSSION
Table 1 : Distribution of the respondents according to their characteristics n=100
No. Characteristic Category No. Person
1 AgeYoung age (Up to 35 year) 37 37.00Middle age (35 to 50 year) 44 44.00Old age(Above 50 year) 19 19.00
2 Education
Illiterate 30 30.00Up to Primary level 32 32.00Up to Secondary level 27 27.00Up to HSC level 03 03.00Graduate and above 08 08.00
3 Types of Family Nuclear family 49 49.00Joint family 51 51.00
4 Size of FamilyUp to 5 member 40 40.00More than 5 member 60 60.00
5 Occupation
Only Livestock farming 24 24.00Livestock farming with Agriculture 45 45.00Livestock farming and Agriculture along with farm laboring 02 02.00Livestock farming and services 15 15.00Livestock farming with other business 14 14.00
6 Land holding
Landless 37 37.00Up to 1 ha. 30 30.00Above 1 to 2 ha. 16 16.00Above 2 ha. 17 17.00
7Animal possession
Up to 5 animal 28 28.00More than 5 animals 72 72.00Only cow keepers 03 03.00Only buffalo keepers 59 59.00Cow and Buffalo keepers 38 38.00
8 Annual Income
Up to ` 50,000 34 34.00Above ` 50,000 to ` 1,00,000 30 30.00Above ` 1,00,000 to 2,00,000 20 20.00Above ` 2,00,000 16 16.00
9 Social participations
Milk Co-operative society 43 43.00Credit co-operative society 08 08.00Village Panchayat 02 02.00Self-help-group 26 26.00ATMA project (FIG) 00 00.00Irrigation cooperative society 00 00.00
10 Extension Contact
Low (up to 0.37) 65 65.00Medium (0.37 to 3.31) 15 15.00High (Above 3.31) 20 20.00Mean=1.84, SD=2.94)

Guj. J. Ext. Edu. Vol. 27 : Issue 1 : December 2016
10
It is concluded from Table 1 that more than two fifth (44.00 per cent) of the respondents were from middle age group and livestock farming with agriculture as their occupation. Three fifth (60.00 per cent) of the respondents were illiterate to primary level of educationand had more than five member in their family. It is also found that 37.00 per cent landless respondents were engage in livestock raising occupation. Nearly three forth (72.00 per cent) of the respondents had more than five animal and nearly three fifth (59.00 per cent) were keeping only buffaloes. More than two third (64.00 per cent) of the respondents had annual income up to one lack rupees. Less than half (43.00 per cent) of the respondents were the members of milk cooperative society.More than two third (65.00 per cent) of the respondents had low level of extension contacts.
Table: 2 Adoption status of respondents about livestock management n=100
Sr. No.
Improved Practices Ad-opted
Left after adop-tion
Not ad-
opted
1 General livestock management practices1 Provided enough space, proper
ventilation and sufficient sun light to each animal
96 00 04
2 Provided hard, well slopped and non-slippery floor in cattle shed 44 00 56
3 Provided manger in cattle shed 58 00 424 Cleaned cattle shed regularly 96 00 045 Made manure pit away from
cattle shed and human residence 85 00 15
6 Covered the roof of cattle shed with dry fodder in summer 66 00 34
7 Provided tree shed around the cattle shed 75 00 25
8 Sprayed pesticide at regular in-terval in animal shed to control ecto-parasites.
14 00 86
9 Bathed dairy animals every day in summer 46 00 54
10 Groomed dairy animals during bath regularly 06 00 94
11 Consulted veterinary doc-tor while purchasing the dairy animals
06 00 94
12 Kept record of feeding, calving and sale of milk 02 00 98
13 Participated in animal hus-bandry training camps, animal treatment camps and agricul-tural fairs.
05 00 95
14 Preferred loan to purchase the dairy animals from nationalize bank instead of private money lenders
08 00 92
15 Insured precious dairy animals 06 00 942 Feed and water management practices1 Cultivated fodder crop using
high yielding varieties 15 00 85
2 Fed at list 10 kg green fodder to milch animals 56 00 44
3 Fed ad lib dry fodder to milch animals 72 00 28
4 Fed chaffed green and dry fod-der 04 00 96
5 Fed urea treated straw 00 00 1006 Fed the silage 00 00 1007 Supplemented 30 to 40 gm/day
mineral mixture/common salts 20 00 80
8 Provided concentrate according to milk production 40 00 60
9 Provided enough fresh and clean drinking water according to season (80 to 100 litre/day/animal)
69 00 31
3 Calf rearing practices1 Cut and disinfection of navel
cord with sterilized knife and tincture iodine
12 00 88
2 Cleaned nostrils and mouth im-mediately after birth 94 00 06
3 Fed colostrums to calf within 0.5 to 1.5 hrs. of birth 98 00 02
4 Fed concentrate to calf 48 00 525 Follow dehorning 03 00 976 Regular deworming to the calf
according to advice of veterinar-ian
07 00 93
7 Regular vaccination to the calf 08 00 924 Breeding practices1 Followed timely A.I after heat
detection (10 – 12 hrs.) 14 00 86
2 Followed pregnancy diagnosis after 60days of A.I./N.S 03 00 97
3 Breeding after 60 days of calv-ing. 03 00 97
5 Clean milk production practices1 Cleaning and washing the floor
before milking 35 00 65
2 Washing and drying the hand before milking 60 00 40
3 Washed the udder and teats be-fore milking. 94 00 06
4 Washed the teats after milking. 03 00 97

Guj. J. Ext. Edu. Vol. 27 : Issue 1 : December 2016
11
5 Followed full hand milking 06 00 946 Using facemask and triming
the nail 24 00 76
7 Used properly cleaned utensils for milk collection 94 00 06
8 Used dome shaped, narrow mouth stainlesssteel utensils for milking
30 00 70
9 Removal of 1st 2 to 3 strips of milk from each teat to reduce bacterial load in milk.
70 00 30
10 Quick and complete milking in noise free environment. 73 00 27
11 Milking the sick and under treatment animals at last and kept their milk separate
59 00 41
12 Followed regularity of milk-ing operation in terms of time interval, place and person.
86 00 14
13 Filter the milk with clean, dry cloth and tightly covered con-tainer and kept in cool place
86 00 14
14 Sale the milk immediately 94 00 066 Health management practices1 Followed regular vaccination
against contagious disease like FMD, HS4 Brucellosis.
65 04 31
2 Regular deworming of the herd 07 00 933 Informed immediately to near-
est veterinary hospital at the time of outbreak of contagious disease.
04 02 94
4 Identified, isolated and treated the sick animals as early as pos-sible
28 02 70
5 Isolated sick animals from herd. 40 00 606 Dry the milch animals before 60
days of parturition. 87 00 13
7 Removal of carcass carefully and properly 87 00 13
Looking to the adoption of general livestock management practices data presented in Table-2 indicated that more than 96.00 per cent of the respondents were provided enough space, proper ventilation and sufficient sun light to each animal and cleaned cattle shed regularly. More than two fifth (44.00 per cent) of the respondents provided hard, well slopped non slippery floor in cattle shed and bathed dairy animals every day in summer (46.00 per cent). More than half of the respondents were provided manger (58.00 per cent) in cattle shed and covered the roof of cattle shed (66.00 per cent) with dry fodder in summer. Majority of the respondents made manure pit away from cattle shed and human residence
(85.00 per cent) and provided tree shed around the cattle shed (75.00 per cent).
Only 14.00 per cent respondents were sprayed pesticides at regular interval in animal shed to control ecto parasites. Less than 10 .00 per cent of the respondents were groomed dairy animals during bath, consulted veterinary doctor while purchasing the dairy animals, kept record of feeding, calving and sale of milk, participated in animal husbandry training camps, animal treatment camps and agricultural fairs, preferred to obtain loan from nationalize bank to purchase the dairy animals and insured dairy animals
Regarding adoption of feed and water management practices majority (72.00 per cent) of the respondents fed ad lib dry fodder to milch animals and more than 69.00 per cent of the respondents were provided enough fresh and clean drinking water according to season (80 to 100 litre/day/animal). More than half (56.00 per cent) of the respondents were fed at least 10 kg green fodder to milch animals. Two forth of the respondents were provided concentrate according to milk production.20.00 per cent and 15.00 per cent of the respondents were supplemented 30 to 40 gm/day mineral mixture and/or common salts and cultivate fodder crop using high yielding varieties, respectively. Only4.00 per cent respondents were fed chaffed green and dry fodder and none of them were fed urea treated straw and silage to their animals.
As far as calf rearing practices were concern more than 98.00 per cent of the respondents were fed colostrums to calf within half to one and half hour of birth. 94.00 per cent were cleaned nostrils and mouth immediately after birth. Nearly half (48.00 per cent) of the respondents fed concentrate to calf. 12.00 per cent of respondents were cut and disinfected navel cord with sterilized knife and tincture iodine. Less than 10.00 per cent of the respondents were vaccinated and dewormed their calf regularly according to advice of veterinarian and followed the dehorning practices.
Regarding breeding practices, it was observed that more than 86.00 per cent of the respondents not followed timely A.I after heat detection. Few of them (3.00 per cent) followed pregnancy diagnosis after 60 days of A.I./N.S. and breeding after 60 days of calving.
Looking to the adoption ofclean milk productionpractices, 94.00 per cent of respondents washed the udder and teats before milking, use properly cleaned utensils for milking, sale the milk immediately, 86.00 per

Guj. J. Ext. Edu. Vol. 27 : Issue 1 : December 2016
12
cent respondents followed regularity of milking operation in terms of time interval, place and person, filtered milk with clean, dry cloth and tightly covered container and kept in cool place, 70.00 per cent and above of the respondents were followed quick and complete milking in noise free environment and removed 1st 2 to 3 strips of milk from each teat to reduce bacterial load in milk.Nearly three fifth (59.00 per cent) of the respondent s were washed and dried the hand before milking and milked the sick and under treatment animals at last and kept its milk sepárate. More than one third (35.00 per cent) of the respondents were cleaned and washed the floor before milking. 30.00 percent and 24.00 per cent of the respondents were used dome shaped stainlesssteel utensils for milking and used face mask and trimmed their nails, respectively. Only 6.00 per cent and 3.00 per cent of the respondents were followed full hand milking method and washed the teats after milking.
Regarding adoption of health management practices, majority (87.00 per cent) of the respondents removed carcasses carefully and properly and dried their milch animal before 60days of parturition. 65.00 per cent respondents followed regular vaccination against contagious diseases like FMD, HS, and Brucellosis. Two fifth (40.00 per cent) of the respondents were isolated sick animals from herd and 28.00 per cent of them were identified, isolated and treated the sick animals as early as possible. Only few (7.00 per cent) of them were dewormed to their herd regularly.
CONCLUSION
Adoption of package of practices in dairy animals like
General livestock management, feed and water management, calf rearing, breeding, clean milk production and health management were low and there are some gaps in adoption of scientific livestock management practices. Deworming, full hand milking, washing of the teats after milking, feeding of silage, urea treated straw and chaffed green and dry fodder, insurance of dairy animals, participation in animal husbandry training camps, treatment camps and agricultural fairs, record keeping are important practices to be adopted by dairy farmers. Therefor there is a need of extension activity in research area to increase the adoption among the dairy farmers regarding above mentioned practices.
REFERENCES
Livestock Census. (2012).19th Livestock Census. Krishi Bhawan, New Delhi: Government of India, Ministry of Agriculture, Department of Animal Husbandry and Dairying.
Patel, R.N.; Patel, V.T. and Prajapati, M. R. (2014). Attitude, Knowledge and Adoption Level of Dairy Farm Women towards Dairy Farming. Guj. J. Ext. Edu. December, 2014. 25 (2) : 140-142
Shyam Singh, A; Khajan Singh and Imtiwati. (2013). “Adoption of improved dairy husbandry practices by dairy farmers in hill region of manipur, india”. Asian J. Dairy & Food Res. 2013. 32 (4): 283-289
Received : March 2016 : Accepted : July 2016

Guj. J. Ext. Edu. Vol. 27 : Issue 1 : December 2016
13
INTRODUCTION
Rice (Oryza sativa L.) is the staple food for over half of the world’s population. Ninety per cent of the world’s rice is produced and consumed in Asian region only. In Gujarat, it occupies 7.28 lakh hectare with production of 15.63 lakh ton and productivity of 2149 kg/ha. (Anon, 2016). Rice being a hydrophilic crop consumes about 3600 lit of water to produce 1 kg of rice grain. Considering this production, in Gujarat alone 562.68 x 10¹⁰ liter of water is required. The common practice to keep the rice field flooded with water during its life period leads to wastage of the most precious natural resource, water and also results in to occurrence of the problems like deterioration of soil physical, chemical and biological properties, leaching loss of nutrients like nitrogen, and emission of the most harmful gas, methane, responsible for global warming.
The introduction of new aerobic rice technology in rice cultivation has proved to get reasonably good yields with 2-3 irrigations, thus saving 30-40 percent of water. System of rice intensification technology, popularly known as SRI, is another emerging water saving technology for rice (Laulanie,1993). Due to creation of aerobic condition soil physico-chemical as well as biological property has been improved, which resulted in to sustainable crop production.
In India, SRI is experimented in all the 22 districts during 2003 kharif with encouraging results in Andhra Pradesh. Over 1,00,000 farmers are experimenting with this system worldwide at present. In Gujarat, though its significance has been established at Main Rice Research Centre, AAU, Nawagam; its practical implementation and popularization amongst the farming community was still awaiting.
OBJECTIVE
To know the performnce of system of rice internsification (SRI) technique in rice (Oryza Satiiva L.) on farmer's field.
METHODOLIGY
Under Farmer’s Participatory Action Research Programme (FPARP) fifty eight field demonstrations on SRI Technique in rice during kharif -2008 and kharif-2009 were demonstrated in Ahmedabad, Anand, Kheda, Vadodara and Dahod districts of middle Gujarat. SRI technology had been executed on farmers’ field and compared with farmers’ practices (FP) of rice cultivation. GR-12 and Gurjari varieties had been evaluated under SRI technology versus farmer’s practice (FP) in different agro-ecological situations.
Under all the demonstrations same methodology
PERFORMANCE OF SYSTEM OF RICE INTENSIFICATION (SRI) TECHNIQUE IN RICE (ORYZA SATIVA L.) ON FARMER’S FIELD
K.D.Mevada1, M.V.Patel2 and N.P.Chauhan3
1 Associate Professor, Department of Agronomy, BACA, AAU, Anand - 3881102 Professor and Head, Department of Agronomy, BACA, AAU, Anand - 388110
3 Professor, Department of Agronomy, BACA, AAU, Anand - 388110Email : [email protected]
ABSTRACT
Rice being a hydrophilic crop consumes high quantity of water for production. System of Rice Intensification (SRI) is a technique which can improve productivity with augmenting factor productivity, particularly water. Fifty eight (58) demonstrations had been organized on the farmer’s field in middle Gujarat comprising the districts of Ahmedabad, Anand, Kheda, Vadodara and Dahod during kharif season of 2008 and 2009. Results showed comprehensive gain in grain yield (15.6 percent) under SRI over farmer’s practice (FP). Moreover, under SRI technology, saving of inputs like seed (80 percent), nursery area (90 percent) and water (33 percent) exhibited input use efficiency over FP, which was reflected in higher WUE (4.12 kg/ha-mm) under SRI as compared to FP (2.67 kg/ha-mm). Higher monetary return (` 85561 ha-1) and BCR (6.63) had been obtained under SRI. Farmers’ adaptation ratio was also increased from 50 % to 88%.
Keywords: rice, system of rice intensification, farmer’s Practice

Guj. J. Ext. Edu. Vol. 27 : Issue 1 : December 2016
14
has been applied, which could be classified under nursery management and field preparation. Under nursery management pre-sprouted seeds @ 5 kg ha-1 were sown on raised nursery bed having area of 1.0 guntha ha-1. Nursery bed was prepared like garden crops, wherein, a layer was prepared with fine manure, on which spouted seeds of rice were spread and then it was covered with another layer of fine manure. The bed was then mulched with paddy straw and watered carefully till transplanting.
Main field was prepared similar to that of regular rice cultivation with proper leveling. A trench to facilitate drainage was prepared at every 3 m distance. Lines were drawn both ways at 25 cm x 25 cm spacing with the help of marker for transplanting.
A 12 days old seedling, having only two small leaves, before development of fourth phyllochron, was uprooted carefully from the nursery with minimizing trauma during transplanting and placed it in the field without
plunging too deep into soil at intersection at 25 cm x 25 cm in a square pattern with only one seedling per hill. Two weeding, first weeding initiated 10 days after transplanting, along with two interculturing with “Paddy hoe” were done before panicle initiation to keep the rice crop weed free as well as to aerate the root zone. The crop was watered regularly just to keep the field moist, not flooded as in case of farmer’s practice, with intermittent drying, alternating aerobic and anaerobic soil condition up to panicle initiation. Then after up to physiological maturity of the crop 5 cm water level was maintained in the field. From physiological maturity to harvesting of the crop, water was drained out. FYM or compost @ 10 t ha-1 was applied in addition to 100-25-00 NPK kg ha-1, out of which 25 percent nitrogen was applied through organic source (FYM) as against 100-25-00 NPK kg ha-1, totally through chemical fertilizers under farmer’s practice. Methodology has been summarized in Table-1.
Table 1 : Input comparison in SRI with FP
Sr. No.
Agronomic Practice System of rice intensification (SRI) Farmer’s Practice (FP)
1 Seed rate (kg ha-1) 5 kg ha-1 25 kg ha-1
2 Seed bed Raised bed Flat bed3 Nursery Area 1.0 Guntha for 1 ha. Transplanting 10.0 Guntha for 1 ha.
Transplanting4 Transplanting days 12-14 DAS 25-30 DAS5 T.P. Spacing 25 x 25 cm Arbitrary @ 15-22 seedlings/ m2
6 Seedling/ hill One Two
7 Water management: Only keep moist field from transplanting to panicle initiation (PI) stage.Keep flooding 5 cm of water from PI to physiological maturity
Field is filled with water throughout the cropping season.
8 Nutrient Management 100 – 25 N-P kg/ha, out of which 25 % N and 100 % P2O5 is applied as basal, while remaining N is applied in two to three equal splits. 25 % N from organic source.
100 – 25 N-P kg/ha, out of which 25 % N and 100 % P2O5 is applied as basal, while remaining N is applied in two to three equal splits.
RESULTS AND DISCUSSION
Fifty eight farmers from Ahmedabad, Anand, Kheda, Vadodara and Dahod districts were selected for demonstrations on “SRI Technique” under FPARP. The results are presented in the given tables.
Grain Yield
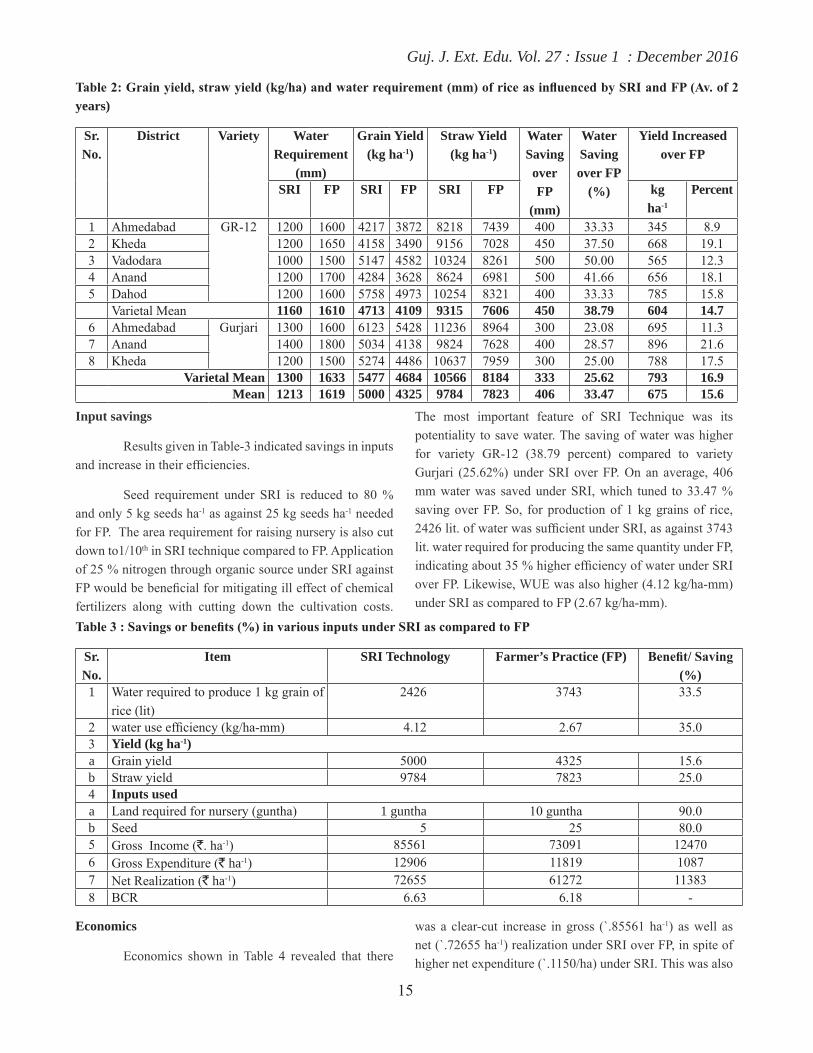
Results presented in Table-2 revealed that for variety GR-12 gave 14.7 % and variety Gurjari gave 16.9 % higher grain yield under SRI over farmer’s practice (FP). Overall, 15.6 % increase was observed for mean grain yield
under SRI technique as compared to FP. This might be due to good root growth because of good aeration of soil under restricted moisture condition which also provided more oxygen in the rhizosphere and increased nitrogen availability due to improved microbial activities in the soil. Good root system also gave 40 to 50 tillers per plant under SRI as compared to 25 to 35 tillers per plant under FP. More over, each additional weeding helped not only reduced weed competition, but also resulted in increased productivity because of better aeration in the rhizosphere. Rice variety Gurjari responded well over variety GR-12 with 16.2 % and 13.9 % higher grain yield under SRI and FP, respectively.
Guj. J. Ext. Edu. Vol. 27 : Issue 1 : December 2016
15
Table 2: Grain yield, straw yield (kg/ha) and water requirement (mm) of rice as influenced by SRI and FP (Av. of 2 years)
Sr.No.
District Variety Water Requirement
(mm)
Grain Yield(kg ha-1)
Straw Yield(kg ha-1)
Water Saving
over FP
(mm)
Water Saving over FP
(%)
Yield Increased over FP
SRI FP SRI FP SRI FP kgha-1
Percent
1 Ahmedabad GR-12 1200 1600 4217 3872 8218 7439 400 33.33 345 8.92 Kheda 1200 1650 4158 3490 9156 7028 450 37.50 668 19.13 Vadodara 1000 1500 5147 4582 10324 8261 500 50.00 565 12.34 Anand 1200 1700 4284 3628 8624 6981 500 41.66 656 18.15 Dahod 1200 1600 5758 4973 10254 8321 400 33.33 785 15.8
Varietal Mean 1160 1610 4713 4109 9315 7606 450 38.79 604 14.76 Ahmedabad Gurjari 1300 1600 6123 5428 11236 8964 300 23.08 695 11.37 Anand 1400 1800 5034 4138 9824 7628 400 28.57 896 21.68 Kheda 1200 1500 5274 4486 10637 7959 300 25.00 788 17.5
Varietal Mean 1300 1633 5477 4684 10566 8184 333 25.62 793 16.9Mean 1213 1619 5000 4325 9784 7823 406 33.47 675 15.6
Input savings
Results given in Table-3 indicated savings in inputs and increase in their efficiencies.
Seed requirement under SRI is reduced to 80 % and only 5 kg seeds ha-1 as against 25 kg seeds ha-1 needed for FP. The area requirement for raising nursery is also cut down to1/10th in SRI technique compared to FP. Application of 25 % nitrogen through organic source under SRI against FP would be beneficial for mitigating ill effect of chemical fertilizers along with cutting down the cultivation costs.
The most important feature of SRI Technique was its potentiality to save water. The saving of water was higher for variety GR-12 (38.79 percent) compared to variety Gurjari (25.62%) under SRI over FP. On an average, 406 mm water was saved under SRI, which tuned to 33.47 % saving over FP. So, for production of 1 kg grains of rice, 2426 lit. of water was sufficient under SRI, as against 3743 lit. water required for producing the same quantity under FP, indicating about 35 % higher efficiency of water under SRI over FP. Likewise, WUE was also higher (4.12 kg/ha-mm) under SRI as compared to FP (2.67 kg/ha-mm).
Table 3 : Savings or benefits (%) in various inputs under SRI as compared to FP
Sr. No.
Item SRI Technology Farmer’s Practice (FP) Benefit/ Saving (%)
1 Water required to produce 1 kg grain of rice (lit)
2426 3743 33.5
2 water use efficiency (kg/ha-mm) 4.12 2.67 35.03 Yield (kg ha-1)a Grain yield 5000 4325 15.6 b Straw yield 9784 7823 25.0 4 Inputs useda Land required for nursery (guntha) 1 guntha 10 guntha 90.0 b Seed 5 25 80.0 5 Gross Income (`. ha-1) 85561 73091 124706 Gross Expenditure (` ha-1) 12906 11819 10877 Net Realization (` ha-1) 72655 61272 113838 BCR 6.63 6.18 -
Economics
Economics shown in Table 4 revealed that there
was a clear-cut increase in gross (`.85561 ha-1) as well as net (`.72655 ha-1) realization under SRI over FP, in spite of higher net expenditure (`.1150/ha) under SRI. This was also
Guj. J. Ext. Edu. Vol. 27 : Issue 1 : December 2016
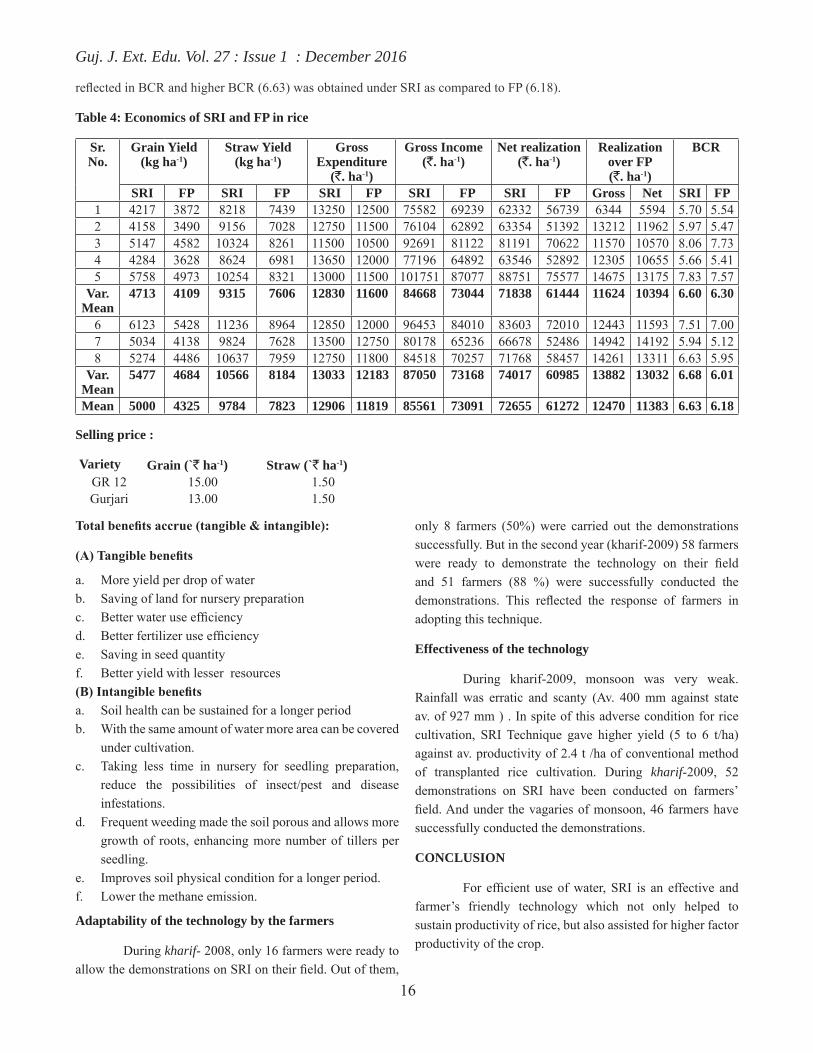
16
reflected in BCR and higher BCR (6.63) was obtained under SRI as compared to FP (6.18).
Table 4: Economics of SRI and FP in rice
Sr.No.
Grain Yield(kg ha-1)
Straw Yield(kg ha-1)
Gross Expenditure
(`. ha-1)
Gross Income(`. ha-1)
Net realization(`. ha-1)
Realization over FP(`. ha-1)
BCR
SRI FP SRI FP SRI FP SRI FP SRI FP Gross Net SRI FP1 4217 3872 8218 7439 13250 12500 75582 69239 62332 56739 6344 5594 5.70 5.542 4158 3490 9156 7028 12750 11500 76104 62892 63354 51392 13212 11962 5.97 5.473 5147 4582 10324 8261 11500 10500 92691 81122 81191 70622 11570 10570 8.06 7.734 4284 3628 8624 6981 13650 12000 77196 64892 63546 52892 12305 10655 5.66 5.415 5758 4973 10254 8321 13000 11500 101751 87077 88751 75577 14675 13175 7.83 7.57
Var. Mean
4713 4109 9315 7606 12830 11600 84668 73044 71838 61444 11624 10394 6.60 6.30
6 6123 5428 11236 8964 12850 12000 96453 84010 83603 72010 12443 11593 7.51 7.007 5034 4138 9824 7628 13500 12750 80178 65236 66678 52486 14942 14192 5.94 5.128 5274 4486 10637 7959 12750 11800 84518 70257 71768 58457 14261 13311 6.63 5.95
Var. Mean
5477 4684 10566 8184 13033 12183 87050 73168 74017 60985 13882 13032 6.68 6.01
Mean 5000 4325 9784 7823 12906 11819 85561 73091 72655 61272 12470 11383 6.63 6.18
Selling price :
Variety Grain (`` ha-1) Straw (`` ha-1)GR 12 15.00 1.50Gurjari 13.00 1.50
Total benefits accrue (tangible & intangible):
(A) Tangible benefits
a. More yield per drop of waterb. Saving of land for nursery preparationc. Better water use efficiencyd. Better fertilizer use efficiencye. Saving in seed quantityf. Better yield with lesser resources(B) Intangible benefitsa. Soil health can be sustained for a longer periodb. With the same amount of water more area can be covered
under cultivation.c. Taking less time in nursery for seedling preparation,
reduce the possibilities of insect/pest and disease infestations.
d. Frequent weeding made the soil porous and allows more growth of roots, enhancing more number of tillers per seedling.
e. Improves soil physical condition for a longer period.f. Lower the methane emission.
Adaptability of the technology by the farmers
During kharif- 2008, only 16 farmers were ready to allow the demonstrations on SRI on their field. Out of them,
only 8 farmers (50%) were carried out the demonstrations successfully. But in the second year (kharif-2009) 58 farmers were ready to demonstrate the technology on their field and 51 farmers (88 %) were successfully conducted the demonstrations. This reflected the response of farmers in adopting this technique.
Effectiveness of the technology
During kharif-2009, monsoon was very weak. Rainfall was erratic and scanty (Av. 400 mm against state av. of 927 mm ) . In spite of this adverse condition for rice cultivation, SRI Technique gave higher yield (5 to 6 t/ha) against av. productivity of 2.4 t /ha of conventional method of transplanted rice cultivation. During kharif-2009, 52 demonstrations on SRI have been conducted on farmers’ field. And under the vagaries of monsoon, 46 farmers have successfully conducted the demonstrations.
CONCLUSION
For efficient use of water, SRI is an effective and farmer’s friendly technology which not only helped to sustain productivity of rice, but also assisted for higher factor productivity of the crop.

Guj. J. Ext. Edu. Vol. 27 : Issue 1 : December 2016
17
FUTURE THRUST
The technology is practically feasible as well as economically viable. Therefore, it can be replicated on large plots in wider range of soils and climate. Particularly, area having limited and scanty rainfall or where irrigation facility is limited and under control, this technique is proved far better than conventional technique of rice transplanting. Not only that, but under vagaries of monsoon the crop can be sustained with considerably good yield.
REFERENCES
Anonymous (2016). Report of Director of Agriculture,
Government of Gujarat, Gandhinagar
Laulanie, H. (1993). Le system de rigiculture intensive malagache. Tropicultura (Brussels). 11: 104-114
Meena, Mamta, Patel,M.V. and Mevada,K.D. (2010). Integrated nutrient management in system of rice intensification technique (SRI) for kharif rice (Oryza sativa L.) under middle Gujarat conditions. Adv. Res. J. Crop.Improv. 1(2) : 194-197
Received : January 2016 : Accepted : April 2016

Guj. J. Ext. Edu. Vol. 27 : Issue 1 : December 2016
18
INTRODUCTION
Today poultry has made a quantum jump to emerge as a dynamic industry, which exist as a backward occupation. During the past decades, our poultry has transformed from a backward activity into a modern, scientific and vibrant industry driven by technology.
At present, India has emerged as the fifth largest egg producer in the world after China, U.S.A, Russia and Japan and the 19th largest broiler producer. There are many factors affecting the development and production of poultry but, the management factor is very important. Management input is not capital, income, and material resources, but it is an individual which helps him to exploit natural resources and accumulate capital. Management is a distinct process consisting of activities of planning, organizing, actuating and controlling, performed to determine and accomplish stated objectives with the use of human beings and other resources (Terry and Franklin, 1984). According to Bora and Ray (1986) management is the process by which the farmer is able to enhance return from the farm on a sustained basis for the attainment of a family goal.
In highly competitive world, the challenges before the poultry owners is how well they can manage the poultry farm to enhance the net returns on a sustained basis. Further, the
resources are very limited in India. Therefore, efficient use of resources depend to a greater extent on how they acquire and adopt innovation in the sector of poultry in effective manner to reach the higher level of performance i.e. management efficiency of the poultry owners for the development of every poultry owner is necessary. By considering all above facts, the present investigation “Management Efficiency of Poultry farmers” was undertaken with the following specific objective:
OBJECTIVE
To know the management efficiency of poultry owners
METHODOLOGY
The present investigation was conducted in milk city of Anand and Charotar bhumi of Kheda district of Gujarat state. Anand districts which is located between north 22.07o to 23.29o Latitudes and east 72.15o to 73.18 o Longitude and an average elevation of 45.1 meters. Kheda district is located between north 22.41o to 23.75o Latitudes and east 72.41o to 72.68 o Longitude respectively and an 21 meters above the mean sea level.
Anand district is composed of eight talukas and Kheda district is composed of ten talukas. Four talukas from
MANAGEMENT EFFICIENCY OF POULTRY OWNERS
G. N. Thorat1, S. G. Vahora2 and M. M. Trivedi3
1 Assistant Professor, Pashu Vigyan Kendra, TRTC, AAU, Devgadh Baria - 389 3802 Associate Professor, Pashu Vigyan Kendra, TRTC, AAU, Devgadh Baria - 389 380
3 Professor, Deparment of Pashu Vigyan B. A. College of Agriculture, AAU, Anand - 388 110E-mail:[email protected]
ABSTRACT
In present era, scientific management has a great potential for increasing the poultry production Therefore, raising management efficiency is of prevailing importance for poultry farmer. Keeping this objective the present study on management efficiency of poultry owners in two districts i.e Anand and Kheda of Gujarat was conducted. Related data were collected with the help of personal interview technique from 150 samples data analyzed by appropriate statistical tools. The study revealed that exactly two third (66.00 per cent) of the respondents had medium level of management efficiency followed by 18.67 per cent and 15.33 per cent of the respondents had high and low level of management efficiency.
Keywords: management efficiency, poultry farmer, poultry management

Guj. J. Ext. Edu. Vol. 27 : Issue 1 : December 2016
19
each district were selected. Thirteen villages from Anand and twelve villages from Kheda districts were purposively selected. In all 150 poultry farmers were selected from 25 villages. for the study. The data were collected through the personal interview. Personal interview schedule has been considered to be the most important tool through which researcher can get most authentic first hand information. The interview schedule was prepared by keeping in view the objectives of the study and was common for all the respondents. Their responses were collected through pre tested, well structured, interview schedule. The respondents were contacted at their home or at their poultry farm.
RESULTS AND DISCUSSION
Management efficiency is a degree to which an individual acquires and adopt effectiveness factors in an enterprise to reach higher level of performance. The data regarding management efficiency of the poultry farmers were categorized into three groups and data of which are presented in Table 1.
Table 1: Distribution of the respondents according to their management efficiency n=150
Sr. No. Management efficiency No Per cent
1 Low level (Below 56.39 score) 23 15.332 Medium level (56.39 to 70.35
score)99 66.00
3 High level (Above 70.35 score)
28 18.67
Mean =63.37 S.D.=6.98
It was evident from the Table 1, that exactly two third (66.00 per cent) of the respondents had medium level of management efficiency followed by 18.67 per cent and 15.33 per cent of respondents had high and low level of management efficiency. bleh level of economic status through better adoption of poultry enterprise. In a nutshell, it can be said that majority (66.00 per cent) of the respondent had medium level of risk orientation. Patel et.al. (2012) reported revealed that, slightly more than two-third (68.50 per cent) of the rose growers had medium level of management efficiency while 16.54 per cent of the rose growers had high and 14.96 per cent of the rose growers had low level of management efficiency.
This finding derives support from the results
reported by Patel and Patel (2000), Patel et al. (2003), Toppo et al. (2004), Patel (2005) and Patel and Vyas (2015).
CONCLUSION
It can be concluded that majority of the respondents had medium to high level of management efficiency in poultry management practices. It was expected that the findings of this study will be useful to the extension agencies in modifying and qualifying their ways of educating the farmers and their management efficiency of poultry farmers. The outcome of the study will help the planners, administrators and research workers to formulate suitable programme and use appropriate methods to increase the managerial level as well as economic level of the tribal farmers. Also efficient managers can be identified and success stories of them can be exercised by the extension workers to motivate, influence and educate other farmers.
REFERENCES
Bora, S. P. and Ray, G. L. (1986). Management attributes of farmers as related to profitability in farming. Decision, 13(2):86-93
Patel A. A. (1993). Study on research management ability of research scientist working as head of department / station / project / scheme in G.A.U., Ph.D. Thesis (Unpublished), G.A.U., Anand
Patel, A. A. and Patel R. K. (2000). Growers managerial ability for plant protection measures in chilli crop. Guj. J. Ext. Edu: 10 & 11 :1-4
Patel, A. G. and Vyas, H.U.(2015). Management Efficiency of Small Scale Horticultural Nursery Growers of South Gujarat. Guj. J. Ext. Edu: 26(1): 63-64
Patel, D. D. ,Joshi, P. J. and Patel, P. P., (2012). Management Efficiency of Rose Growers Towards Improved Rose Cultivation. Guj. J. Ext. Edu: 23:139-140
Patel, H. B. (2005). Management efficiency and economic performance of banana growers in Anand district of Gujarat state. Ph.D. (Agri.) thesis (unpub.), A.A.U., Anand
Terry, G. R. and Franklin, S. G. (1984). Principles of management. Krishnangar, New Delhi : 4
Toppo, A; Trivedi, M. S. and Patel, A (2004). Participation of farm women in dairy occupation. Guj. J. Ext. Edu: Vol.XV:15-21
Received : April 2016 : Accepted : August 2016
Guj. J. Ext. Edu. Vol. 27 : Issue 1 : December 2016
20
INTRODUCTION
Digital technology is likely to continue to be a major driver of agriculture development in India. The capabilities of local entrepreneurs, start-ups and businesses to provide services such as technical assistance and finance are growing significantly due to greater access to mobile and internet technology. As such digital solutions are likely to make a huge contribution to addressing local concerns, connecting people in remote areas and to reaching greater numbers of people than more traditional development initiatives. Such technologies are already transforming the way in which smallholder farmers’ work and interact. The digital Technology in this era of globalization has accentuated new modes of knowledge transformation and communication patterns. Digital has opened up uncommon opportunities for developing countries in terms of providing low cost access to information. This is the fastest growing tool of communication ever with the number of users growing from 150 million in 1998 to more than 700 million in 2001 ( Brown, 2002 ). Today, there are more than 7 billion people on the planet, a figure that’s expected to reach 9.6 billion by 2050. By then, the middle class—who typically have more money available for food, leading to greater demand—could reach 5 billion people by 2030. If these numbers hold, overall food
production will need to double in a relatively short period of time to meet demand to feed the world’s population (https://www.accenture.com/_acnmedia /Accenture/Conversion-Assets/DotCom/Documents/Global/PDF/Digital_3/Accenture-Digital-Agriculture-Point-of-View.pdf). India has 70% of its population, which is dependent on Agriculture for its livelihood. Considering this, use of digital Technology in agricultural development is of strategic importance in a country like India. Digital Technology has tremendous potential in timely collection of data and distributing it to the potential users even in developing countries. Thus, providing low cost access to information. German mathematician, Gottfried Wilhelm Leibniz (http://www.encyclopedia.com/history/dictionaries-thesauruses-pictures-and-press-releases digit al-technology#), defines it as “Digital technology is a base two process. Digitized information is recorded in binary code of combinations of the digits 0 and 1, also called bits, which represent words and images. Digital technology enables immense amounts of information to be compressed on small storage devices that can be easily preserved and transported. Digitization also quickens data transmission speeds. Digital technology has transformed how people communicate, learn, and work“. In some economically developed countries, digital technology (IT) continues to develop rapidly and is
DIGITAL-ENABLED SERVICES FOR AGRICULTURE DEVELOPMENT
R.S. Parmar1, D.R. Kathiriya2 and G.J.Kamani3
1 Associate Professor, College of AIT, AAU, Anand - 3881102 Principal & Dean, College of AIT, AAU, Anand - 3881103 Assitant Professor, College of AIT, AAU, Anand - 388110
Email : [email protected]
ABSTRACT
Digital technology has had an enormous impact on society. The role of digital technology to develop agriculture and quality of life in rural area is well established. Digital technology can help a farmer to get relevant information regarding agro-inputs, crop production technologies, agro processing, market support, agro-finance and management of farm Agri-business. Agriculture sector faces major challenges of enhancing production in a situation of falling natural resources necessary for production. The growing demand for agriculture products, however, also offers opportunities for farmers to sustain and improve their livelihood. A digital technology has a major role in addressing these challenges and uplifting the livelihood of the farming community. This paper attempts to review the significance of digital technology in agriculture, discuss their opportunities in agricultural development in India.
Keywords: digital - enabled serices, agricultural development
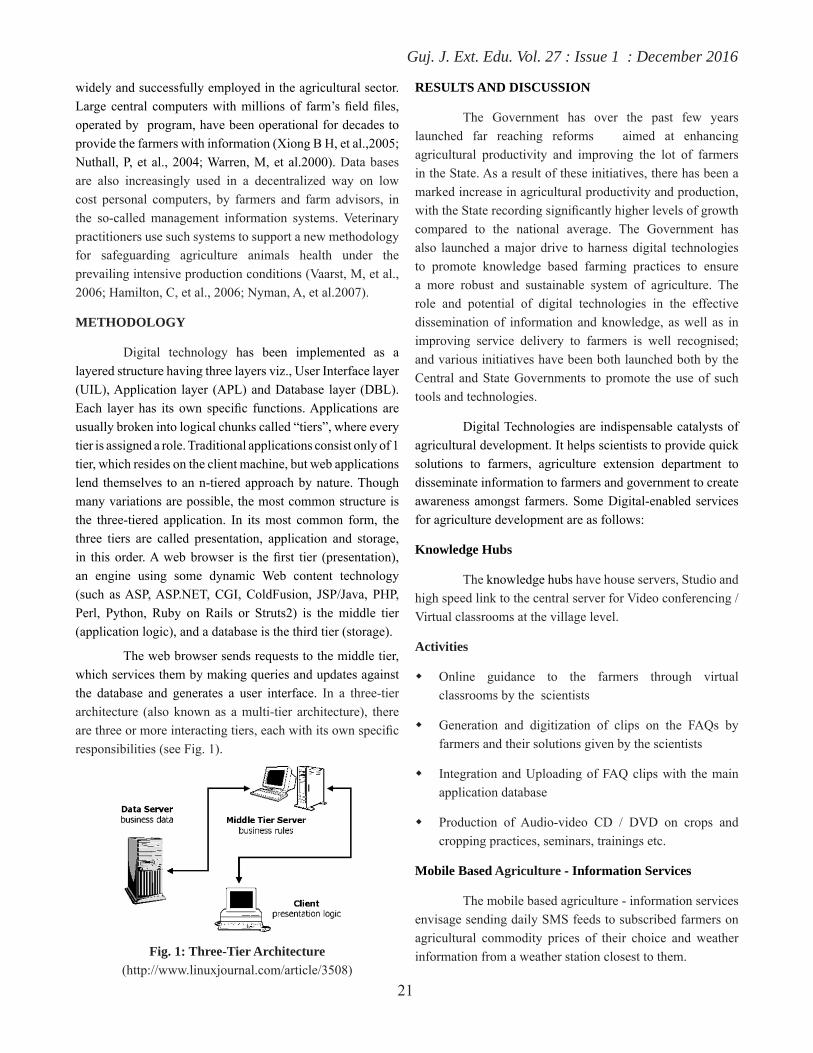
Guj. J. Ext. Edu. Vol. 27 : Issue 1 : December 2016
21
widely and successfully employed in the agricultural sector. Large central computers with millions of farm’s field files, operated by program, have been operational for decades to provide the farmers with information (Xiong B H, et al.,2005; Nuthall, P, et al., 2004; Warren, M, et al.2000). Data bases are also increasingly used in a decentralized way on low cost personal computers, by farmers and farm advisors, in the so-called management information systems. Veterinary practitioners use such systems to support a new methodology for safeguarding agriculture animals health under the prevailing intensive production conditions (Vaarst, M, et al., 2006; Hamilton, C, et al., 2006; Nyman, A, et al.2007).
METHODOLOGY
Digital technology has been implemented as a layered structure having three layers viz., User Interface layer (UIL), Application layer (APL) and Database layer (DBL). Each layer has its own specific functions. Applications are usually broken into logical chunks called “tiers”, where every tier is assigned a role. Traditional applications consist only of 1 tier, which resides on the client machine, but web applications lend themselves to an n-tiered approach by nature. Though many variations are possible, the most common structure is the three-tiered application. In its most common form, the three tiers are called presentation, application and storage, in this order. A web browser is the first tier (presentation), an engine using some dynamic Web content technology (such as ASP, ASP.NET, CGI, ColdFusion, JSP/Java, PHP, Perl, Python, Ruby on Rails or Struts2) is the middle tier (application logic), and a database is the third tier (storage).
The web browser sends requests to the middle tier, which services them by making queries and updates against the database and generates a user interface. In a three-tier architecture (also known as a multi-tier architecture), there are three or more interacting tiers, each with its own specific responsibilities (see Fig. 1).
Fig. 1: Three-Tier Architecture (http://www.linuxjournal.com/article/3508)
RESULTS AND DISCUSSION
The Government has over the past few years launched far reaching reforms aimed at enhancing agricultural productivity and improving the lot of farmers in the State. As a result of these initiatives, there has been a marked increase in agricultural productivity and production, with the State recording significantly higher levels of growth compared to the national average. The Government has also launched a major drive to harness digital technologies to promote knowledge based farming practices to ensure a more robust and sustainable system of agriculture. The role and potential of digital technologies in the effective dissemination of information and knowledge, as well as in improving service delivery to farmers is well recognised; and various initiatives have been both launched both by the Central and State Governments to promote the use of such tools and technologies.
Digital Technologies are indispensable catalysts of agricultural development. It helps scientists to provide quick solutions to farmers, agriculture extension department to disseminate information to farmers and government to create awareness amongst farmers. Some Digital-enabled services for agriculture development are as follows:
Knowledge Hubs
The knowledge hubs have house servers, Studio and high speed link to the central server for Video conferencing / Virtual classrooms at the village level.
Activities
� Online guidance to the farmers through virtual classrooms by the scientists
� Generation and digitization of clips on the FAQs by farmers and their solutions given by the scientists
� Integration and Uploading of FAQ clips with the main application database
� Production of Audio-video CD / DVD on crops and cropping practices, seminars, trainings etc.
Mobile Based Agriculture - Information Services
The mobile based agriculture - information services envisage sending daily SMS feeds to subscribed farmers on agricultural commodity prices of their choice and weather information from a weather station closest to them.
Guj. J. Ext. Edu. Vol. 27 : Issue 1 : December 2016
22
Activities
� Mobile based agro information services to farmers using SMS gateways
� Integration with APMC, Agmarknet, Weather Information portals
� Agricultural Directory Services
� Management of Agrisnet portals with Audio-visual contents
Agriculture Online Content Management
The agriculture online content management envisages creation of an online repository of agricultural contents. The contents shall be indexed with respect to Commodity/Variety and geographical reference if any to ensure relevance of the information served to farmer.
Activities
� Indexed, categorized & sub categorized browsable contents
� Easy search and book-marking
� Agricultural best practices documents videos in local language covering all major Crops
Agriculture Directory Services
The agriculture directory services platform will provide the farmers a facility to search for agricultural inputs suppliers and service providers servicing his village. Such listing would include information such as Name , Address, Tel number, Contact person, Mobile , Email, Products & Services, GeoCodes, Bank info, Category & Sub Category of Services , Rating etc. Wherever relevant, Google facility for location map etc. shall be leveraged for impactful delivery of directory information to farmers.
Knowledge Dissemination through Agriculture Universities
The knowledge dissemination through agriculture universities will cater to the farmers’ requirement to seek expert advice for the problems they face. The advisory shall be enabled both on an HTML based Helpdesk services and video conferencing. It is also envisaged to set up a multicasting/broadcasting facility at the agricultural universities in the State that will enable scheduled transmission of agricultural advisories on common problems. The services anchored
at SAUs will answer to voice calls; web based queries from farmers also. To ensure that the advice provided to the farmers is specific and authentic, the Soil Health card reference also shall be referred to while providing advisories. To facilitate this, while accepting the query from farmer, the SHC reference also shall be captured.
Agriculture E-Trade Platform:
The trade centre services envisages providing a web based interactive platform for the farmers and buyers to exchange information on availability of their agricultural produce for sale and the buyers to view commodities of their interest offered on sale filtered by geography.
The platform shall facilitate contacting the farmer/buyer from the information available in the posting for next steps in the trading activity cycle. The platform shall include facility for posting pictures of agricultural produce being offered.
Agriculture of the future will be digitally integrated at all stages of production, from understanding genetics to transport logistics. We are using our expertise in digital innovation and agriculture to improve decision making for farmers, agribusiness, policy-makers and researchers.
(http://www.csiro.au/en/Research/AF/Areas/Digital-agriculture).
‘Digital agriculture’ includes activities such as the development, testing and deployment of information and communication technologies for agricultural research, development and delivery. By generating detailed insights, farmers can make data-based operational decisions that will optimize yield and boost revenue while minimizing expenses and the chances of crop failure. A mobile application on the field agent’s hand-held device is the hub for connecting the farmer to the agro-input company with a steady stream of information and advice for improving crop yield throughout a season (http://www.gps.gov/applications/agriculture).
CONCLUSION
� Digital technologies now make it possible to collect and leverage huge amounts of critical data at minimal costs—thus making a farm’s field operations more insight driven, and potentially more productive and efficient.
� Digital technology is a technological innovation to promote one farmer at a time concept, each farmer will get personalized attention, and solutions to their
Guj. J. Ext. Edu. Vol. 27 : Issue 1 : December 2016
23
problems.
� Digital technology have a major role to play in the life of farmers as they provide them with latest know-how on agriculture, on line selling and buying, daily weather forecasts, information on cropping patterns, soil conservation, and government schemes.
� India would benefit from approaching the issue by using digital technology in agriculture by focusing on providing broadband connectivity and a centric development approach.
REFERENCES
Brown, M. M. (2002). ‘Can ICTs address the needs of the poor?’ Choices, 10 (2):4
https://www.accenture.com/_acnmedia/Accenture/Conversion-Assets/DotCom/Documents/ Global/PDF/Digital_3/Accenture-Digital-Agriculture-Point-of-View.pdf
http://www.csiro.au/en/Research/AF/Areas/Digital-agriculture
http://www.encyclopedia.com/history/dictionaries-thesauruses-pictures-and-press-releases digit al-technology#
http://www.gps.gov/applications/agriculture
http://www.linuxjournal.com/article/3508
Nuthall, P.(2004). Case studies of the interactions between
farm profitability and the use of a farm computer. J. Comput. Electron. Agric. 42 : 19--30
Nyman, A., Ekman, T., Emanuelson, U., Gustafsson, A.H., Holtenius, K.,Persson Waller, K., Halle′n Sandgren, C. (2007). Risk factors associated with the incidence of veterinary-treated clinical mastitis in Swedish dairy herds with a high milk yield and a low prevalence of subclinical mastitis. J. Prev. Vet. Med. 78 : 142-160
Vaarst, M., Bennedsgaard, T.W., Klaas, I., Nissen, T.B., Thamsborg, M., Ostergaaerd, S. (2006). Development and daily management of an explicit strategy of nonuse of antimicrobial drugs in twelve Danish organic dairy herds. J. Dairy Sci. 89 : 1842-1853
Hamilton, C., Emanuelson, U., Forslund, K., Hansson, I., Ekman, T. (2006). Mastitis and related management factors in certified organic dairy herds in Sweden. J. Acta Vet. Scand.48 : 25-30
Warren, M., Soffe, R., Stone, M. (2000). Farmers, computers and the internet: a study of adoption in contrasting regions of England. J. Farm Manage. 11 : 665-684.
Xiong B H, Qian P, Luo Q Y, Lv J Q. (2005). Design and realization of solution to precision feeding of dairy cattle based on single body status. J. Transaction of the Chinese Society of Agricultural Engineering, 21 : 118-123
Received : August2016 : Accepted : November 2016

Guj. J. Ext. Edu. Vol. 27 : Issue 1 : December 2016
24
INTRODUCTION
Tribal people are the most conservative,orthodox and superstitious which effect their growth and development in all walks of life particularly for women (Rajjihari, 2008). Tribal diets are different from the entire population as they include certain common foods and different manner (Mittal, 2006). Tribal women’s health is varies because of such factors as local disease prevalence, health rerated behavior, women education and exposure tom health information. Nutritional anemia and malnutrition were major problem among the tribal women are found by several studies. Nutritional knowledge has great importance for improving dietary behavior and good health. The present study was thus undertaken for the same purpose.
OBJECTIVE
To know the knowledge of nutritional practices among the tribal women of Dahod district
METHODOLOGY
A survey was carried out in Devgadh Baria and
Limkheda talukas of Dahod district of Gujarat.. The study was confined to the 100 women whose agebelonged 25 to 60 years as well as they were willing to participate were selected from the six villages for the study. The data was collected through personal interview method and set of 15 questions of nutritional practices of food were used .The questions were multiple choice, true or false and fill in the blanks related to food groups, health and disease. The data was analyzed by using the statistical tools i.e. percentage, mean and SD .
RESULTS AND DISCUSSION
The socio-economic characteristics of the tribal women
The data presented in Table1, revealed that the range of age of tribal women was 25 to 60 years with an average age of 37.01 years. About 52 percent of women were of young age and 38 percent of women having middle age that is 36 to 50 years. Only 10 percent of the women were above 50 years of age. From the data on educational status it is seen that 52 percent of the women were illiterate and 2 percent of the women were graduates. The tribal women who got education up to secondary school level were 23 percent. Most
KNOWLEDGE OF NUTRITIONAL PRACTICES AMONG THE TRIBAL WOMEN
G.J.Patel1, Dipti P. Patel2 and Dweep B. Ramjiyani3
1 Professor and Unit Head, Tribal Research Cum Training Centre, AAUDevgadh Baria -389 380
2 & 3 Research Associate, Tribal farm women training centre, AAUDevgadh Baria - 389 380
Email : [email protected]
ABSRACT
Tribal people are the most conservative,orthodox and superstitious,which effect their growth and development in all walks of life.Study objective was to assess the present knowledge of tribal women about selected areas of nutritional practices.A study was carried out in two talukas of Dahod district in which six villages were selected purposively.Data were collected by personal interview method.Hundred tribal women purposively selected for the study.An average age of them was 37.01 years, monthly income was found `1000 to 5000,most of tribal women belonged to joint family;half of the women were illiterate.More than half of tribal women had medium level of knowledge about selected nutritional practices.The women were found the most knowledge about ‘’ Consumption of large amount of tea would lower down the hemoglobin level in the body” while the least knowledge about “consumption of two-three glasses of milk and eight-nine glasses of water daily for maintain good health”.The study implies that the information and importance of certain nutritional practices could be spread to increase the awareness about human nutrition among the tribal women for their development.
Key words: nutritional practices, knowledge, tribal women

Guj. J. Ext. Edu. Vol. 27 : Issue 1 : December 2016
25
of tribal women lived in a joint family that is 58% while 42 percent were from nuclear families. Family incomeranged from Rs.1000 to 5000 per month. About 78% of families had an annual income up to Rs 25,000. Most of the women were engaged in agricultural work along with animal husbandry (79 percent) and only 12 percent of women were engaged in labour work. More than half the of respondents lived in “kachhamakan” (46 percent) while 34 percent of the respondents lived in “pakkamakan.”
Tabel 1 : The Socio economic characteristics of the tribal women n=100
Sr. No Particulars No. Percent
1 Age group ( years )
Young ( up to 35 ) 52 52.00Middle (I n Between36 to 50 ) 38 38. 00Old ( above 50 ) 10 10. 00
2 Education statusIlliterate 52 52. 00Primary 19 19. 00Secondary 23 23. 00Higher Secondary 04 04. 00Graduate 02 02. 00
3 Family typeJoint 58 58. 00Nuclear 42 42. 00
4 Family IncomeUp to ` 25,000 78 78. 00` 25001 to 50,000 17 17. 00` 50,001 to 75,000 05 05. 00Above ` 75000 00 00. 00
5 OccupationAgriculture 07 07. 00Agriculture and animal husbandry
79 79. 00
Agriculture and labour 02 02.00Labour 12 12. 00
6 ResidencePakkaMakan 34 34. 00
Kachha 46 46. 00Mix 20 20. 00
Knowledge level of the Tribal women on selected nutritional practices
To study the knowledge of nutritional practices among the tribal women set of questions were asked to the
individual during the survey. A score of one was given for each correct answer and zero was given for a wrong answer or if no answer was given by the tribal woman. The response given by the tribal women on questions asked to them are presented in decreasing order of knowledge level in table-2
Tabel 2 : Knowledge of the tribal women on selected nutritional practices n=100
Sr. No
Knowledge of Nutritional Practice Percent
1 Consumption of large amount of tea that lower down Hb level in the body
92*
2 Excessive consumption of sugar,salt,oil,ghee can leads to chronic diseases(diabetes,kidney problem, heart problem)
70*
3 We should change the cooking oil regu-larly for maintain good health
62*
4 Combination of cereal and pulses in the food prepration gives complete protien
58*
5 Fermented pulses and green leafy veg-etables should be included in the diet for increasing Hb level of the body
56*
6 Milk and milk products should be con-sumed regularly for healthy bone devel-opment
49#
7 Washing of rice 3-4 times properly before cooking destroy water soluble nutrients
47#
8 Whole cereals pulses and fruits vegetables in the diet can prevent constipation
41#
9 Fruits and vegetables should be consumed daily for good health
38#
10 Consumption of green leafy vegetables regularly is required for proper function of eye,skin and bone
27#
11 Increasing consumption of amla that will help in increasing immunity power of the body
22#
12 Regular using of soyabean in the diet will provide protein
18@
13 Peels of fruits and vegetables help in di-gestion because it contain fibers
13@
14 Two –three glasses of milk should be con-sumed daily for good health
12@
15 Eight –nine glasses of water should be taken daily for good health
10@
Mean = 41.13 SD = 23.44 *=Maximum knowledge(above 50 percent) #= Moderate knowledge (20-50 percent) @=Least knowledge (less than 20 percent)

Guj. J. Ext. Edu. Vol. 27 : Issue 1 : December 2016
26
Table 2 indicates that the tribal women had the maximum knowledge about five selected nutritional practices that is 92% of the respondents knew that “Consumption of large amounts of tea would lower down the Hb level in the body.” Knowledge about facts such as ill effects of consumption of salt ,sugar etc, changing of cooking oil, combination of cereals and pulses for complete protein etc were high. About six of the selected nutritional practices were only moderately known to the women . This included “Consumptionof milk and milk products for healthy bones,leaching of water soluble nutrients due to excessive leaching, prevention of constipation etc. About 9 -20 % knowledge was prevalent for four of the nutritional practices. This lowknowledge was related to consuming two-three glasses of milk and eight-nine glasses of water daily for maintain good health.
The extent of knowledge on nutritional practices was analyzed on the basis of the scores obtained. Accordingly, respondents were classified as having high (eight and above eight), medium ( in between three to eight) ,low (two and lower than two) levels of knowledge as presented in table-3
Table 3 : Knowledge level of tribal women on selected nutritional practices n=100
Sr. No. Knowledge level Number Percent
1 High level (eight and above eight)
30 30.00
2 Medium level(three and above)
68 68.00
3 Low level (two and below two)
02 02.00
The Table shows that majority (68%) of the tribal women had medium level of knowledge while 30% of the tribal women had high levels of knowledge. Only 2% of the tribal women had low levels of knowledge.
CONCLUSION
It can be concluded from the present study that the majority of the tribal women were aged between 25 to 60 years .They belonged to joint families mainly. More than half of the women were illiterate .The family income ranged from Rs 1000 to 5000 per month. Most of the respondents (79 percent) were engaged in agriculture work and animal husbandry. Less than half (46 percent) of the women lived in “ kachhamakan”. Maximum of the tribal women (68 percent) had medium level o knowledge about selected nutritional practices. Tribal women were found to be the most knowledgeable about the consumption of large amount of tea that lower down Hb level in the body. They had the least knowledge about the fact that peels of fruits and vegetables help in digestion because it contain fibers,two –three glasses of milk should be consumed daily for good health and eight-nine glasses of water should be taken for good health.
REFERENCES
Dipal N. Soni and Keshav B. Kamaliya (2013), Evaluation of Knowledge on NutrionalFacts of Tribal Women; Guj, J.Ext.Edu: 24 : 58-61
Mittal P.C and Srivastava S.(2006). “Diet,nutritional status and food related traditions of Oran tribes of New Mal (West Bengal),India”. Jan-Mar;6(1):385. Epub 2006 Apr 10
RijiHari (2008). “Nutritional status of Tribal and Non tribal preschools”. Ind. J.Nut.Diete. Vol.45 : 236
Received : July 2016 : Accepted : October 2016
Guj. J. Ext. Edu. Vol. 27 : Issue 1 : December 2016
27
INTRODUCTION
The objectives of front line demonstration on crops are to be demonstrated the superior productivity potentials of various location/ region specific technologies to practicing farmers and test there implement ability and viability and obtain feedback from the end users and bring about necessary corrections to improve their acceptability and suitability in real farm situations vis-vis prevailing traditional farmers practices. Front line demonstrations are also one of the methodologies to evaluate performance of technology under on farm conditions, technology adoption by the participating farmers and its diffusion to no n participating farmers. Large variation in crop yield exists from place to place depending on the environment, soils type and use of cultivation practices. Training to the farmer’s and participatory front line demonstrations is an efficient measure for reducing knowledge gap of farmers and enhancing productivity, generating production data and collection feedback for large adoption of the technology.
METHODOLOGY
The study was carried out in six villages namely Dudhava, Kharshaliya, Bhadaroli, Sureli, Kanod and Bediya of Panchmahals district of Gujarat. These all six villages demonstrated by KVK during two year (2009-10 and 2010-11) and total 94 demonstrations conducted on selected farmers
fields. Out of this 62 demonstration on each of technologies like, improved variety of maize paddy, sesamum, gram and castor and 22 demonstration on use of micronutrients (zinc sulphate) in pigeonpea (8) and wheat (14) and 10 demonstration on integrated nutrient management in green gram were raised with recommended package of practices under supervision of KVK, scientists.
RESULTS AND DISCUSSION
The data presented in Table 1 that under demonstration plot the crop yield was found to be substantially more than that under local check during two the years. In the improved variety of maize (GM-4), paddy (GR-11), Sesamum (GT-1). gram (GG-1), and castor (GCH-7). Crop yield demonstration plots were noted to be 22.10, 35.00, 5.68, 16.55, and 21.70 q/ha respectively which were 42.50, 31.33, 45.26, 29.30 and 37.80 percent higher over control. In case of use of micro nutrients (zinc sulphete) in pigeonpea (BDN-2) and wheat and integrated nutrient management in green gram demonstration plots gave an average yield of 8.65, 35.36 and 11.75 q/ha which accounted for 32.06, 28.58 and 37.58 percent increase over local check was regards to the average yield of improved variety in maize (GM-4), paddy (GR-11), Sesamum (GT-1). gram (GG-1), and castor (GCH-7) under demonstration and local check was found to be 42.50, 31.33, 45.26, 29.30 and 37.80 percent. Higher yields under demonstration and local check was found to be 45.26,
YIELD GAP AND LEVEL OF DEMONSTRATED CROP PRODUCTION TECHNOLOGY
A. K. Rai1, Raj Kumar2 and J. K. Jadav3
1,2&3 SMS (ICAR-CIAH) Krishi Vigyan Kendra- Panchmahals Vejalpur, Godhra, (Gujarat)
Email :[email protected]
ABSTRACT
The study was conducted in the Panchmahals district of Gujarat with objective of Study on yield gap and level of demonstrated crop production technology in Panchmahals district. Training to the farmer’s and participatory front line dem-onstrations is an efficient measure for reducing knowledge gap of farmers and enhancing productivity, generating production data and collection feedback for large adoption of the technology. Six villages in demonstrated by KVK and total 94 dem-onstrations conducted on selected farmers fields. The study concluded that, higher yields under demonstration over farmers practices was found in case of integrated nutrient management, improve varieties and use of zinc sulphate, followed by other demonstration.
Keywords : yield gap; demonstration; crop production technology

Guj. J. Ext. Edu. Vol. 27 : Issue 1 : December 2016
28
42.50, 37.80 and 37.58 improved variety and integrated nutrient management in green gram respectively. Table also evident that, effect of zinc sulphate on pigeonpea and wheat was 32.06 and 28.58 percent higher yield over to local check.
Similar yield enhancement in mustard crops in front line demonstration has amply been documented by Singh, Navab and Sharma, F.L. (2004).
Table 2 Adoption level technology intervention of front line demonstrations
Sr. No. Problem Technological Intervention
Adoption level Change in adoption %Before After
f % f %1 Lack of knowledge and
unavailability improver variety
Variety Maize: GM-4
21 22.34 56 59.58 37.24
Paddy: GR-11 14 14.90 43 47.75 33.56Sesamum: GT-1 09 9.58 39 41.49 31.91Castor: GCH-7 10 10.64 51 54.26 43.62
2 Lack of knowledge and no use of micro nutrients
Pigeonpea:BDN-2 and Zinc sulphate
07 7.45 46 48.94 41.49
Wheat: GW-496 and Zinc sulphate 05 5.32 38 40.42 35.103. . Lack of knowledge
about PSB& Rhizobium Culture
Gerrn Gram GM-4 and Use of PSB & Rhizobium @ 2.5 kg/ha with FYM
5 5.32 42 44.68 39.36
4. Lack of knowledge and no use Balance fertilizer
Gram- GG-1 and Recommended Dose fertilizer NPK (20:40:00)
11 11.70 37 39.36 27.66
Table 1 : Increase of yield, technology and extension index of components demonstration
Sr.No.
Components of Demonstrated
Demonstrated crop
Demonstration technology
No. of Demonstrated
Mean yield q/ha Increase % over F.P.I.P. F.P.
1 GM-4 Maize Improved variety 11 22.10 15.50 42.502 GR-11 Paddy Improved variety 10 35.00 26.65 31.333 Zinc sulphate and
BDN-2 Pigeonpea Use of micro
nutrients 08 08.65 06.55 32.06
4 Zinc sulphate and GW-496,
Wheat Use of micro nutrients
14 35.36 27.50 28.58
5 GT-1 Sesamum Improved variety 16 05.68 03.91 45.266 Integrated nutrient
management and GM-4
Green Gram Improved variety with INM
10 11.75 08.54 37.58
7 GG-1 Gram Improved variety 10 16.55 12.8 29.308 GCH-7 Castor Improved variety 15 21.70 14.00 37.80
The Table 2 should that the assessment of adoption of technology interventions showed that the improved variety of maize (GM-4), paddy (GR-11), Sesamum (GT-1) and castor (GCH-7) were maximum popularized and adopted by, 37.24, 33.56, 31.91 and 43.62 percent farmers. Other interventions points i.e. Use of zinc sulphate in Pigeonpea (41.49%) and wheat (35.10%), use of PSB & Rhizobium culture (39.36%) and use of balance dose of NPK fertilizer (27.66%) were also adopted by a large number of farmers in view of their impact on crop yield. The knowledge gap about the technology and the availability was reduced by means of training and the impact was visualized by the farmers in the demonstration. Thus, it become quite effective in achieving higher production and economic returns from the investment and monetary returns can be increase substantially by training of farmers
regarding important intervention points like improved variety, use of zinc sulphate in pigeonpea and wheat, use of PSB & Rhizobium culture in green gram, and balance use of NPK in gram through front line demonstrations. The results of the present study are in consonance with the findings of Singh et. al. (2004) and Singh et. al. (2007) .
CONCLUSION
It can be concluded from the discussion that, higher yields under demonstration over to local check was found in case of integrated nutrient management, improve variety GM-4, GT-1, GR-11, GG-1, GCH-7, use of zinc sulphate, followed by pigeonpea and wheat under demonstrations. The assessment of adoption of technological interventions showed

Guj. J. Ext. Edu. Vol. 27 : Issue 1 : December 2016
29
that the improved variety i.e. maize (GM-4), paddy (GR-11), Sesamum (GT-1) and castor (GCH-7) were maximum popularized and adopted by farmers. As well as the other interventions points i.e. Use of zinc sulphate in pigeonpea and wheat, Use of PSB & Rhizobium culture in green gram and use of balance dose of NPK fertilizer in gram were also adopted by a large number of farmers.
REFERENCES
Singh, Navab and Sharma, F.L. (2004). Impact of front line demonstration on gain in knowledge about mustard production technology among farmers. 2nd National
Ext. Edu. Congress, May 22-24, 2004. Society of Extension Education, Agra & MPUAT, Udaipur : 56
Singh, D.P., Prakash, H.G. & Singh Shanker (2004) Gap in adoption of potato production technology in potato export zone of U.P. 2nd National Extension Congress, May 22-24, 2004. Society of Extension Education, Agra & MPUAT, Udaipur : 132
Singh D K, Gautam U S and Singh R K, 2007. Study on Yield Gap and Level of Demonstrated Crop Production Technology in Sagar District Indian Research Journal of Extension Education, 7 (2&3): 94-95
Received : September 2016 : Accepted : November 2016
Guj. J. Ext. Edu. Vol. 27 : Issue 1 : December 2016
30
INTRODUCTION
The digital Technology in this era of globalization has accentuated new modes of knowledge transformation and communication patterns. Digital has opened up uncommon opportunities for developing countries in terms of providing low cost access to information. This is the fastest growing tool of communication ever with the number of users growing from 150 million in 1998 to more than 700 million in 2001 ( Brown, 2002 ). India has 70% of its population, which is dependent on Agriculture for its livelihood. Considering this, use of digital Technology in Dairy Farm Management is of strategic importance in a country like India. Digital Technology have tremendous potential in timely collection of data and distributing it to the potential users even in developing countries. Thus, providing low cost access to information. German mathematician, Gottfried Wilhelm Leibniz (http:// www.encyclopedia.com/history/dictionaries-thesauruses-pictures-and-press-releasesdigital-technology#), defines it as “Digital technology is a base two process. Digitized information is recorded in binary code of combinations of the digits 0 and 1, also called bits, which represent words and images. Digital technology enables immense amounts of information to be compressed on small storage devices that can be easily preserved and transported. Digitization also quickens data transmission speeds. Digital technology has transformed how people communicate, learn,
and work“. The dictionary defines management as “the act or art of managing: the conducing or supervising of something (as a business).” As we can see, this definition is relatively broad and applicable to most management situations. If looking at business management more specifically, we will find definitions that are more about how the management is done. Giles and Stansfield defines it as “Management is a comprehensive activity, involving the combination and co-ordination of human, physical and financial resources in a way which produces a commodity or a service which is both wanted and can be offered at a price which will be paid, while making the working environment for those involved agreeable and acceptable.” All business management, regardless of the size of the firm, involves decision making and supervising. A good manager is usually characterized by making good decisions. All decisions made by a manager might not be satisfactory, but the more decisions that are made in an informed manner, the more likely we are to produce a positive outcome. For management of Dairy Farm one should store the large amount of data and from that He has to take a decision. Decision can be taken by measuring key parameters and comparing these with kept records, the observation of a possible problem will be facilitated. With the help of system analysis and software design techniques, system is can manage the data of dairy animals’ basic information ,milk production, milk selling , vaccination, costing for farm on dairy farm efficiently. System generate the various dynamic
DIGITAL DAIRY FARM MANAGEMENT SYSTEM
R.S. Parmar1, H.K Patel2 and N.M. Vegad3
1 Associate Professor, College of AIT, AAU, Anand - 3881102&3 Assitant Professor, College of AIT, AAU, Anand - 388110
Email : [email protected]
ABSTRACTS
A digital dairy farm management system is presented in this paper, which based on standardization dairy farm management framework. It can manage dairy farm from each stage including dairy animals’ basic information, milk Information, milk selling electronic records, vaccination schedule and milk production cost. Integrate electronic dairy farm management records was set up, which based on dairy farm activities and can implement statistical analytic function of dairy farm and guide dairy farm management. The Unique numbers and integrated dairy animals records information of every dairy animals will lay the foundation for food of animal origin traceability. This system includes four subsystems dairy animals’ basic information management subsystem, milk Information subsystem, milk selling electronic records subsystem, vaccination subsystem and costing subsystem. With the help of system analysis and software design techniques, it is can manage the data of milk production, milk selling, milk production cost easily and effectively.
Keywords: digital management, dairy animal , dairy Farm

Guj. J. Ext. Edu. Vol. 27 : Issue 1 : December 2016
31
reports of milk production per animal, milk selling, profit/loss etc. In some economically developed countries, information technology (IT) continues to develop rapidly and is widely and successfully employed in the dairy cattle sector. Large central computers with millions of cow files, operated by cow diseases control program, have been operational for decades to provide the farmers with information (Xiong B H, et al.,2005; Nuthall, P, et al., 2004; Warren, M, et al.2000). Data bases are also increasingly used in a decentralized way on low cost personal computers, by farmers and farm advisors, in the so-called management information systems. Veterinary practitioners use such systems to support a new methodology for safeguarding cow health under the prevailing intensive production conditions (Vaarst, M, et al., 2006; Hamilton, C, et al., 2006; Nyman, A, et al.2007).
METHODOLOGY
Web-based user-friendly, a digital dairy farm management system has been implemented as a layered structure having three layers viz., User Interface layer (UIL), Application layer (APL) and Database layer (DBL). Each layer having its own specific functions. The User interface layer is implemented using combination of HTML, JavaScript and CSS. Application layer is implemented using PHP (http://php.net). It is an open source general-purpose server-side scripting language originally designed for web development to produce dynamic web pages. Database layer is implemented using MySQL (http://www.mysql.com) database for storing dairy farm data. It is the world’s most used open source relational database management system (RDBMS) as a server providing multi-user access to a number of databases. It can be accessed using the browser of the user’s system. The system is completely menu driven and offers user-friendly screens organized to simplify and reduce effort to understand. The layer structure of a digital dairy farm management system is presented in Fig. 1
The various aspects included in this studied have been organized under the following subsystems:
a. Dairy animals basic information management subsystem
b. Milk Information subsystem
c. Milk selling electronic records subsystem
d. Vaccination and costing subsystem
Fig. 1 : Layer structure of a digital dairy farm management system
RESULTS AND DISCUSSION
The Home page (Fig.2) of the digital dairy farm management system has menu items like “Home”, “Animal Info”, “Vaccination” , “Milk Information”, “Milk Selling Information” and “Cost Benefit”. By clicking on these menu options one can get the desired page.
Fig. 2 : Home Page
To create and manage databases for dairy animals’ basic information, vaccinations schedule of dairy animals’, animal wise milk production information , animal wise milk selling information and animal wise cost benefit information, the end users have to click “Animal Info” , “Vaccination” , “Milk Information” , “Milk Selling Information” and “Cost Benefit” options respectively. This options provides end users with a systematic way to create, retrieve, update and manage dairy animals’ basic information (Fig. 3),

Guj. J. Ext. Edu. Vol. 27 : Issue 1 : December 2016
32
Vaccinations Schedule of dairy animals’ (Fig. 4), Animal wise milk production information (Fig. 5) , Animal wise Milk Selling Information (Fig. 6) and Animal wise Cost Benefit Information (Fig. 7) respectively.
Fig. 3 : Dairy Animals’ Basic Information
Fig. 4 : Vaccinations Schedule of Dairy Animals’
Fig. 5 : Animal wise milk production Information
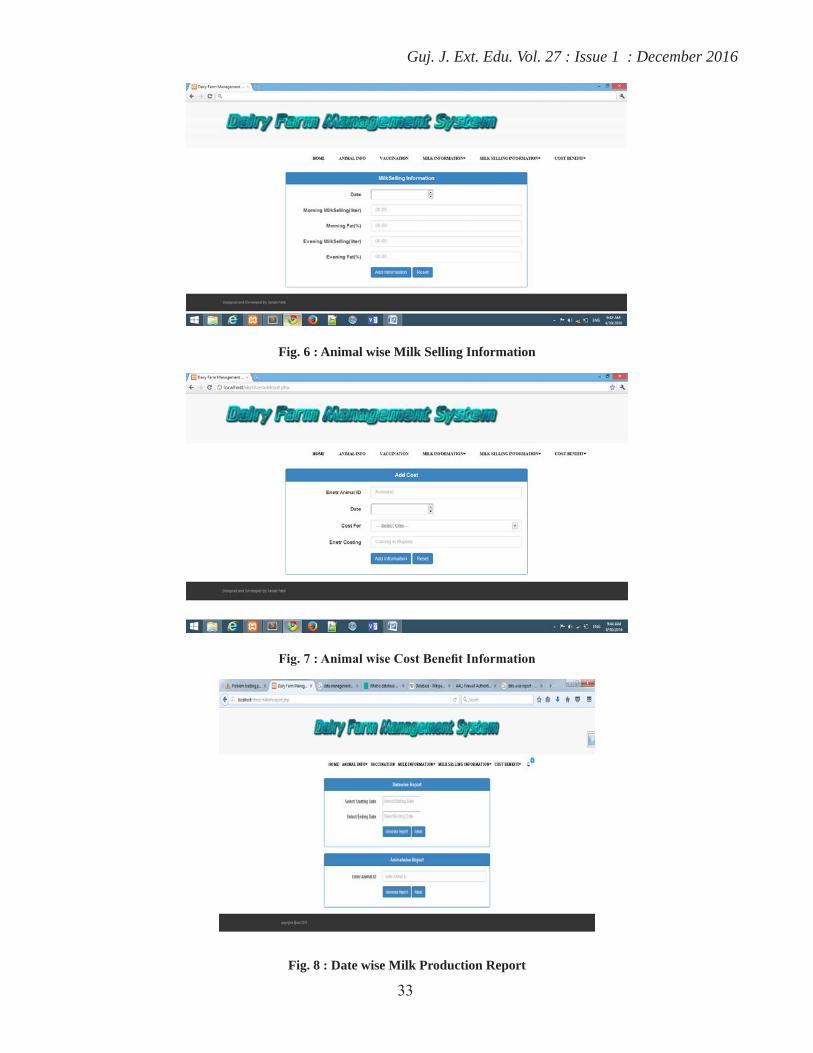
Guj. J. Ext. Edu. Vol. 27 : Issue 1 : December 2016
33
Fig. 6 : Animal wise Milk Selling Information
Fig. 7 : Animal wise Cost Benefit Information
Fig. 8 : Date wise Milk Production Report

Guj. J. Ext. Edu. Vol. 27 : Issue 1 : December 2016
34
Fig. 9 : Date wise Milk Selling Report
Fig. 10 : Cost Benefit Report
By clicking on “Milk Information”, “Milk Selling Information” and “Cost Benefit” menu items on Home page one can get the report option under each menu item for “Date wise Milk Production” (Fig. 8) , “Date wise Milk Selling” (Fig. 9) and “Cost Benefit” (Fig. 10) reports respectively.
The Date wise Milk Production and Date wise Milk Selling reports are presented in Fig.11 and Fig. 12 respectively.
Fig. 11 : Date wise Milk Production Report

Guj. J. Ext. Edu. Vol. 27 : Issue 1 : December 2016
35
Fig. 12 : Date wise Milk Selling ReportCONCLUSION
The digital dairy farm management system that was created implements routine monitoring standardization, applicable and integrity electronic milk selling records, dairy animals’ basic information, milk Information, vaccination schedule and milk production cost. It can manage dairy farm from each stage. Integrate electronic dairy farm management records was set up, which based on dairy farm management records. The Unique numbers and integrated dairy animals records information of every dairy animal will lay the foundation for food of animal origin traceability. With the help of system analysis and software design techniques, it is can manage dairy farm activities effectually. These will bring evident economic returns. . Thus it will be an important application to design and develop digital dairy farm management system in management of dairy farm.
REFERENCES
Brown, M. M. (2002) ‘Can ICTs address the needs of the poor?’ Choices, 10 (2):4
Hamilton, C., Emanuelson, U., Forslund, K., Hansson, I., Ekman, T. (2006). Mastitis and related management factors in certified organic dairy herds in Sweden. J. Acta Vet. Scand.48, 25—30
http:// www.encyclopedia.com/history/dictionaries-thesauruses-pictures-and-press-releases digital
-technology# http://www.mysql.com http://php.net
Nuthall, P.(2004). Case studies of the interactions between farm profitability and the use of a farm computer. J. Comput. Electron. Agric. 42, 19--30 (2004)
Nyman, A., Ekman, T., Emanuelson, U., Gustafsson, A.H., Holtenius, K.,Persson Waller, K., Halle′n Sandgren, C. (2007). Risk factors associated with the incidence of veterinary-treated clinical mastitis in Swedish dairy herds with a high milk yield and a low prevalence of subclinical mastitis. J. Prev. Vet. Med. 78, 142--160
Vaarst, M., Bennedsgaard, T.W., Klaas, I., Nissen, T.B., Thamsborg, M., Ostergaaerd, S. (2006). Development and daily management of an explicit strategy of nonuse of antimicrobial drugs in twelve Danish organic dairy herds. J. Dairy Sci. 89, 1842—1853
Warren, M., Soffe, R., Stone, M. (2000). Farmers, computers and the internet: a study of adoption in contrasting regions of England. J. Farm Manage. 11, 665—684
Xiong B H, Qian P, Luo Q Y, Lv J Q. (2005). Design and realization of solution to precision feeding of dairy cattle based on single body status. J. Transaction of the Chinese Society of Agricultural Engineering, 21,118—123.
Received : May 2016 : Accepted : August 2016

Guj. J. Ext. Edu. Vol. 27 : Issue 1 : December 2016
36
INTRODUCTION
A breakthrough in any field of agriculture is not possible without an effective communication support to disseminate the research findings to its ultimate users. The farm magazines provide technological know-how to the farmers at regular intervals and also increase the knowledge of farmers regarding improved package of practices of different crops and other allied fields. It is assumed that individuals who read farm magazine are likely to gain more knowledge about agricultural technology. Krushijivan Farm Magazine (KFM) is being published regularly since 1969 by Gujarat State Fertilizers and Chemicals Ltd. (GSFC), at Vadodara The aim of the magazine is to disseminate and popularize scientific methods of agriculture. In this farm magazine the information of agricultural technology are published as per the need and time of the farmer.
OBJECTIVE
To find out the relationship between reading
behaviour of KFM Subscriber livestock owners and their profile.
METHODOLOGY
Bhavnagar district is composed of nine talukas, namely Bhavnagar, Shihor, Palitana, Ghogha, Umarala, Vallabhipur, Gariyadhar, Talaja and Mahuva. Out of that top three taluka were selected for the study which have more KFM subscriber. Among these talukas, Talaja, Mahuva and Palitana talukas were selected purposively for the study as they possessed more number of KFM subscribers i.e. 400,225, and 199 respectively. This study compares the KFM subscriber farmers and nonsubscriber farmers. To find out the relationship between reading behaviour of KFM subscriber livestock owners and their profile, reading behaviour variable considered as dependent variable. To know the reading behaviour of the respondents, structured scheduled was prepared. The responses of the respondents were recorded and calculated with the help of frequency and Percentage.
RELATIONSHIP BETWEEN READING BEHAVIOUR OF KRUSHIJIVAN FARM MAGAZINE SUBSCRIBER LIVESTOCK OWNERS AND THEIR PROFILE
V. V. Solanki1, J. B. Patel2, Sunny Jani
1&3 Ex. PG Student, IDEA, AAU, Anand -3880012 Associate Professor, Department of Extension Education,
BACA, AAU, Anand -388110Email : [email protected]
ABSTRACT
The Bhavnagar district of the Gujarat state having more number of life members of Krushijivan Farm Magazine (KFM) was selected purposively for study. Among Bhavnagar district, Talaja, Mahuva and Palitana taluka were selected purposively for the study. Total 75 subscriber respondents and 75 non subscriber respondents were selected proportionately from above three taluka. Thus, total 75 subscriber livestock owners and 75 non subscriber livestock owners were included for the study. Education of the KFM subscriber livestock owners had establish positive and significantly relationship with their reading behaviour where as age had negative and significant correlation. Other variable viz., Social participation, Land holding, Herd size, Milk production, Annual income, Extension participation, Mass media exposure failed to show any significant correlation with their reading behavior
Keywords: relationship, reading behaviour, farm magazine, livestock

Guj. J. Ext. Edu. Vol. 27 : Issue 1 : December 2016
37
RESULTS AND DISCUSSION
Table-1 Relationship between reading behaviour of KFM Subscriber livestock owners and their profile. n=75
Sr. No. Variables Correlation
coefficientX1 Age -0.204*X2 Education 0.775**X3 Social participation -0.075NSX4 Land holding -0.125NSX5 Herd size -0.042NSX6 Milk production -0.030NSX7 Annual income -0.013NSX8 Extension participation 0.091NSX9 Mass media exposure 0.040NS
** Significant at the 0.01 level (2-tailed)* Significant at the 0.05 level (2-tailed)
Age and Reading behaviour of KFM
It can be concluded from Table-1 that the age of the respondents had negative and significant relationship with their reading behaviour of KFM subscriber livestock owners. The age had negative and significant relationship with their reading behaviour of KFM subscriber livestock owners indicates that as age increased, the reading behaviour decreased and the age is the factor which determines the zeal, aptitude and hard work required for determining effectiveness in any activity.
Education and Reading behaviour of KFM
It can be concluded from Table-1 that the education level of the KFM subscriber livestock owners had positive and significant relationship with their reading behaviour. The probable reason might be fact that education is the production of desirable changes in human behaviour. It helps the individual to make progress in right direction. Education might have helped in getting more information by use of mass media like printed literature, namely farm magazines etc. having recent information regarding new innovation.
Social participation and Reading behaviour of KFM
Unrespectable result was found with relationship between social participation and their reading behaviour. Thus, it can be said that the non subscriber livestock owners were also socially participated with the different organizations. Reason might be that now a days people joined with the gram panchayat, cooperative organizations and other social group.
Land holding and Reading behaviour of KFM
The results revealed from Table-1 that size of land holding by the KFM subscriber livestock owners had negative and none significant relationship with their reading behaviour of KFM. It means that most of livestock owners belonging to small category of land holding. This might be the reason to have none significant relationship between the land holding and reading behaviour of KFM.
Herd size and Reading behaviour of KFM
The result found from Table-1 that herd size of the KFM subscriber livestock owners had negative and non significant with their reading behaviour of KFM.
Milk production and Reading behaviour of KFMT
There was negative and non significant relationship between reading behaviour of KFM subscriber livestock owners and milk production. Reason might be that the KFM could not impact on the subscriber livestock owners to high milk production. In other words it can also be said that the information in KFM related to animal husbandry put in sufficient quality and quantity to the subscriber livestock owners to produce high milk.
Annual income and Reading behaviour of KFM
There was negative and non significant relationship between reading behaviour of KFM subscriber livestock owners and their annual income. It means that the no significant impact of KFM subscriber livestock owners to get high annual income. Reason might be that the subscriber livestock owners and non subscriber livestock owners both had small size land holding, medium size herd size and medium milk production. Other reason might be that the KFM could not impact on KFM subscriber livestock owners to get high annual income.
Extension participation and Reading behaviour of KFM
Extension participation and Reading behaviour of KFM The calculated correlation coefficient “r” values were found to be positive and non significant. It means that extension participation had not played much more role in improving reading behaviour of the KFM subscriber livestock owners.
Mass media exposure and Reading behaviour of KFM
The data presented in the Table-1 shows that there
Guj. J. Ext. Edu. Vol. 27 : Issue 1 : December 2016
38
was positive but non significant relationship between mass media exposure of the KFM subscriber livestock owners and their reading behaviour of KFM. In fact, this tendency was not up the level of significant. It means that mass media exposure had played a little role in improving reading behaviour of KFM but it was not up to the level of significant. It is therefore, the null hypothesis (Ho) was accepted and it can be concluded that mass media exposure have not shown any effect in improving the reading behaviour of KFM.
CONCLUSION
Only one variable viz., Education of the KFM subscriber livestock owners had establish positive and significantly relationship with their reading behaviour where as age had negative and significant correlation. Other variable viz., Social participation, Land holding, Herd size, Milk production, Annual income, Extension participation, Mass media exposure failed to show any significant correlation with their reading behavior.
REFERENCES
Hanumanaikar, R. H., Manjunarh, L., & Natikar, K. V. (2011). Reading behaviour of farmers- farm magazines. Karnataka J. Agril. Sci., 24(4), : 471-473
Patel, M.C. (2005). Study on evaluation and assessment of rural television programme and its impact on farmers in Anand district of Gujarat. M. Sc. (Agril. communication) Thesis, (Unpublished), YCMOU, Nasik (MH)
Soni, N.V. (2005) Impact of Krushigovidhya Farm Magazine on Subscriber Farmers.(Unpubished) Ph.D.(Agri) thesis, GAU, Anand
Sunny, Jani. (2014). A study impact in terms of gain in knowledge of jaljivan farm magazine subscriber farmers in porbandar district of Gujarat. M. Sc. (Agri.), Thesis, (Unpublished), AAU, Anand
Received : July 2016 : Accepted : October 2016

Guj. J. Ext. Edu. Vol. 27 : Issue 1 : December 2016
39
INTRODUCTION
Agriculture is the largest industry in India contributing to the source of livelihood for over 70 per cent of population. Agricultural production plays a significant role in the Indian economy. In India, women and agriculture seem synonymous terms. One can not think of agriculture without women. There is hardly any activity in agriculture except ploughing, where women are not involved. In some of the activities, she is relatively more efficient than man. Dahod is one of the Integrated Tribal Development Project (ITDP) areas of Gujarat State, where various administrative measures have been adopted through large number of tribal development and welfare programmes under Tribal Area Sub Plan (TASP). Since, independence huge fund have been diverted by the Central and State Government through different agencies with a view to uplift their living standard and bringing them into the main stream of nation. Even after lapses of more than 50 years of independence the progress of tribal farmwoman is not yet up to the level of expectation in the field of agriculture and animal husbandry as she is continued to be in a state of neglect. A victim of man made
system, she is hardly considered equal to man in wage and social status. Keeping in view the above said facts and information about the tribal farmwoman’s situation and her multiple roles in agriculture and animal husbandry a study on “Effects of Independent variables on overall extent of contribution of tribal farmwomen in Agricultural activities” was undertaken.
OBJECTIVE
To know the effects of independent variables on overiall extent of contribution of tribal farmwomen in agricultural activities
METHODOLOGY
The present study was undertaken in Integrated Tribal Development Project areas of Dahod district of Gujarat. Out of seven talukas of the district, five talukas namely (1) Dahod (2) Zalod (3) Limkheda (4) Garbada and (5) Dhanpur were selected purposively for this study. Out of total villages of each selected taluka, two villages were randomly selected comprising total ten villages from five selected talukas
EFFECTS OF INDEPENDENT VARIABLES ON OVERALL EXTENT OF CONTRIBUTION OF TRIBAL FARMWOMEN IN AGRICULTURAL ACTIVITIES
Mahesh R. Patel1, D. D. Patel2 and Jaydip D. Desai3
1 Associate Extension Educationist, EEI, AAU, Anand - 3881102 Assistant Professor, DoEE, AAU, Anand - 388110
3 Senior Research Assistant, DoEE, AAU, Anand - 388110Email : [email protected]
ABSTRACT
Agricultural production plays a significant role in the Indian economy. In India, women and agriculture seem synonymous terms. One can not think of agriculture without women. There is hardly any activity in agriculture except ploughing, where women are not involved. The tribal farmwoman shares with her husband the arduous burden of farm work in addition to her major responsibility as home maker, by helping in all other agricultural and animal husbandry activities. Keeping this fact in mind, the present study was carried out to find out Effects of independent variables on overall extent of contribution of tribal farmwomen in agricultural activities. The result of the study revealed that Overall extent of contribution of tribal farmwomen in agricultural operations was found to be predicted by four independent variables namely, age, education, herd size and risk preference of tribal farmwomen from highest to lowest order based on standard partial regression coefficient with combine effect of 57.65 per cent of the total variation in it. The co-efficient of determination (R2) indicated that the variable education of tribal farmwomen alone contributed significantly to 53.74 per cent of total variation in their overall extent of contribution in agricultural operations.
Keywords: contribution, tribal farmwomen
Guj. J. Ext. Edu. Vol. 27 : Issue 1 : December 2016
40
kof ITDP Dahod. From each village, 20 respondents were selected randomly, thus, total sample of 200 respondents were selected for the present study. The interview schedule was prepared keeping in view the objectives of the study for data collection. Total 21 variables was selected as under :
(A) Independent variables
I Personal-social
1 Age 2 Education 3 Marital status 4 Type of family 5 Size of family 6 Social participation 7 Socio-economic status II Economical 1 Occupation 2 Bullocks possessed 3 Material possession 4 Size of land holding 5 Herd size 6 Number of other working family member 7 Migration habit 8 Annual family income III Psychological 1 Innovativeness 2 Risk preference 3 Scientific orientation 4 Attitude towards different development programmes 5 Awareness regarding different development programmes IV Communication 1 Source of information (B) Dependent variables Contribution of tribal farmwomen in agricultural operations
The data were analysed with Standard partial regression coefficient.
RESULTS AND DISCUSSION
Extent of variation caused by independent variables on dependent variables
In the previous sub-section, the relationships
between independent and dependent variables were ascertained by computing correlation coefficients (r). The correlation coefficient value only gives the strength and direction of association but does not reflect on predictive ability of independent variables to the dependent variable. Hence, in order to access the amount of contribution (influence or predictive abilities) of each independent variable to the dependent variables, the stepwise regression analysis was carried out with the help of computer. Efroymson’s (1962) stated that the stepwise regression is one such method which had widely adopted in multiple regression analysis. It has got the added advantage that at each stage of analysis, every variable is subjected to an examination for its predictive value. The multiple regression co-efficient (R) represents the correlation between the dependent variables’ actual score and the predicted score obtained from the fitted multiple regression equation. The co-efficient of multiple regression determination (R2) gives the average amount of change in dependent variables, when all independent variables were taken together and was tested with ‘ F ‘ test for its significance.
The partial regression co-efficient (bYi.j) represents
the change in dependent variable (Yi) with a quite change
in independent variable (xi) keeping other variables constant
and it was tested with student’s ‘ t’ test for its significance.
The various independent variables had their own unit of
measurement, which did not permit a comparison of the
partial (bYij) values. To facilitate comparison, the partial
(bYij) values were converted into standard partial (b’Yij)
values, which were free from the units of measurements.
The independent variables were than ranked on the basis of
standard partial (b’Yij) values (ignoring sign) to find out
their relative importance in predicting the dependent variable.
Stepwise regression analysis of independent variables
on overall extent of contribution of tribal farmwomen in
agricultural operations
Stepwise regression analysis with overall extent of
contribution of tribal farmwomen in agricultural operations
as a dependent variable and twenty one independent variables
was carried out. The results are presented in Table 1 and Table
2.
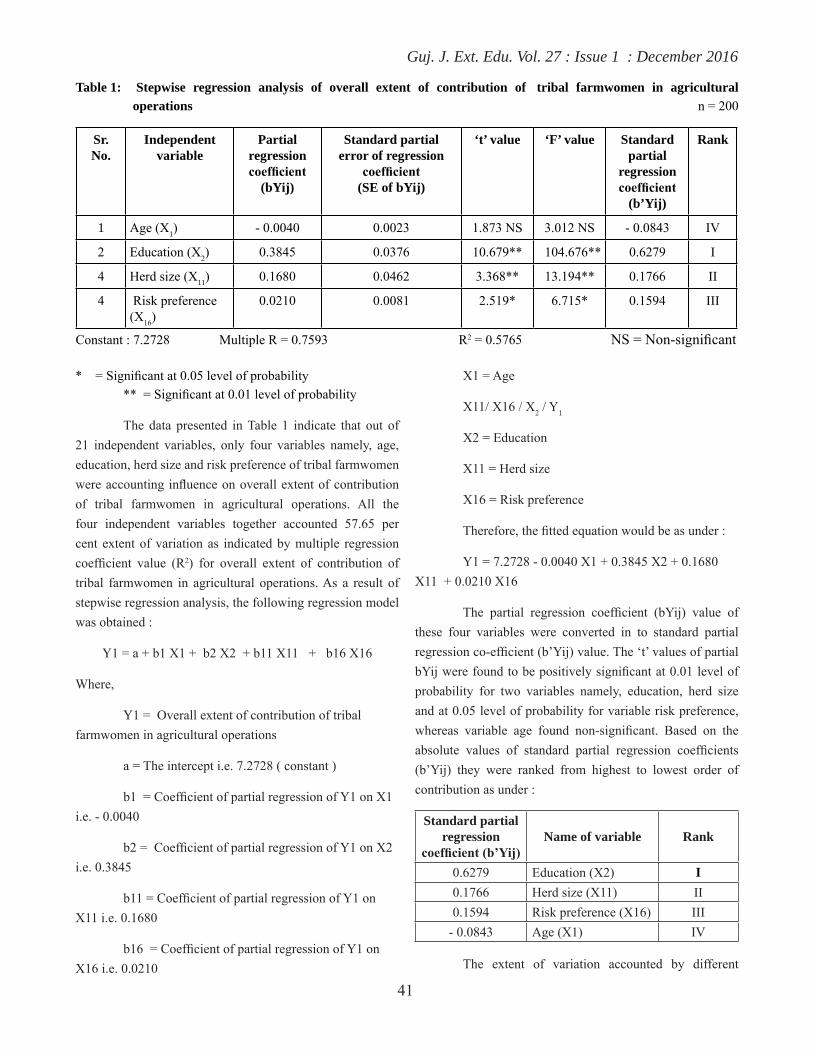
Guj. J. Ext. Edu. Vol. 27 : Issue 1 : December 2016
41
Table 1: Stepwise regression analysis of overall extent of contribution of tribal farmwomen in agricultural operations n = 200
Sr. No.
Independent variable
Partial regression coefficient
(bYij)
Standard partial error of regression
coefficient (SE of bYij)
‘t’ value ‘F’ value Standard partial
regression coefficient
(b’Yij)
Rank
1 Age (X1) - 0.0040 0.0023 1.873 NS 3.012 NS - 0.0843 IV
2 Education (X2) 0.3845 0.0376 10.679** 104.676** 0.6279 I
4 Herd size (X11) 0.1680 0.0462 3.368** 13.194** 0.1766 II
4 Risk preference (X16)
0.0210 0.0081 2.519* 6.715* 0.1594 III
Constant : 7.2728 Multiple R = 0.7593 R2 = 0.5765 NS = Non-significant
* = Significant at 0.05 level of probability ** = Significant at 0.01 level of probability
The data presented in Table 1 indicate that out of 21 independent variables, only four variables namely, age, education, herd size and risk preference of tribal farmwomen were accounting influence on overall extent of contribution of tribal farmwomen in agricultural operations. All the four independent variables together accounted 57.65 per cent extent of variation as indicated by multiple regression coefficient value (R2) for overall extent of contribution of tribal farmwomen in agricultural operations. As a result of stepwise regression analysis, the following regression model was obtained :
Y1 = a + b1 X1 + b2 X2 + b11 X11 + b16 X16
Where,
Y1 = Overall extent of contribution of tribal farmwomen in agricultural operations
a = The intercept i.e. 7.2728 ( constant )
b1 = Coefficient of partial regression of Y1 on X1 i.e. - 0.0040
b2 = Coefficient of partial regression of Y1 on X2 i.e. 0.3845
b11 = Coefficient of partial regression of Y1 on X11 i.e. 0.1680
b16 = Coefficient of partial regression of Y1 on X16 i.e. 0.0210
X1 = Age
X11/ X16 / X2 / Y1
X2 = Education
X11 = Herd size
X16 = Risk preference
Therefore, the fitted equation would be as under :
Y1 = 7.2728 - 0.0040 X1 + 0.3845 X2 + 0.1680 X11 + 0.0210 X16
The partial regression coefficient (bYij) value of these four variables were converted in to standard partial regression co-efficient (b’Yij) value. The ‘t’ values of partial bYij were found to be positively significant at 0.01 level of probability for two variables namely, education, herd size and at 0.05 level of probability for variable risk preference, whereas variable age found non-significant. Based on the absolute values of standard partial regression coefficients (b’Yij) they were ranked from highest to lowest order of contribution as under :
Standard partial regression
coefficient (b’Yij)Name of variable Rank
0.6279 Education (X2) I0.1766 Herd size (X11) II0.1594 Risk preference (X16) III
- 0.0843 Age (X1) IV
The extent of variation accounted by different
Guj. J. Ext. Edu. Vol. 27 : Issue 1 : December 2016
42
independent variables on overall extent of contribution of tribal farmwomen in agricultural operations are presented in Table 2.
Table 2 : Stepwise extent of variation accounted by different independent variables on overall extent of contribution of tribal farmwomen in agricultural operations
n = 200
Step No.
Variables included Multiple correlation coefficient
(R)
Total variation accounted [R2 (%)]
Step-I Education (X2) 0.7331 0.5374
(53.74 %)Step II X2 + Herd size (X11) 0.7457 0.5560
(55.60 %)Step III X2 + X11 + Risk
preference (X16)
0.7549 0.5699
(56.99 %)Step IV X2 + X11 + X16 + Age
(X1)
0.7593 0.5765
(57.65 %)
It is apparent from the Table 2 that the variable, education of tribal farmwomen had independently contributed to 53.74 per cent of total variation in overall extent of contribution of tribal farmwomen in agricultural operations. Whereas, herd size and education of tribal farmwomen jointly contributed to 55.60 per cent and risk preference, herd size and education of tribal farmwomen jointly contributed their role to 56.99 per cent. While, 57.65 per cent joint influences on overall extent of contribution of tribal farmwomen in agricultural operations was observed from all the variable namely age, risk preference, herd size and education of tribal farmwomen.
From the above results it can be concluded that
overall extent of contribution of tribal farmwomen in agricultural operations was found to be predicted by four independent variables namely, age, education, herd size and risk preference of tribal farmwomen having with the combine effect of 57.65 per cent of the total variation in overall extent of contribution of tribal farmwomen in agricultural operations. This findings are suggestive of fact that for increasing overall extent of contribution of tribal farmwomen in agricultural operations in the areas of ITDP Dahod, implementing agencies of different development programmes taken up in integrated tribal development project Dahod have to increase the level of education of tribal farmwomen by organizing different education promoting programmes/activities.
CONCLUSION
It is concluded from the study that Overall extent of contribution of tribal farmwomen in agricultural operations was found to be predicted by four independent variables namely, age, education, herd size and risk preference of tribal farmwomen from highest to lowest order based on standard partial regression coefficient with combine effect of 57.65 per cent of the total variation in it. The co-efficient of determination (R2) indicated that the variable education of tribal farmwomen alone contributed significantly to 53.74 per cent of total variation in their overall extent of contribution in agricultural operations.
REFERENCES
Snedecor. G. W. and Cochran, W. G. (1967). ‘Statistical Methods’ (6th Ed.). Oxford & IBI Publishing Co. Pvt. Ltd., New Delhi
Patel, J. G. (1998). Indigenous resource management by tribal farmwomen in Vadodara district of Gujarat state. Ph. D. thesis (Unpub), GAU, Anand
Received : February 2016 : Accepted : May 2016

Guj. J. Ext. Edu. Vol. 27 : Issue 1 : December 2016
43
INTRODUCTION
Tropical root and tuber crops are considered as the third important group of food crops after cereals and grain legumes. They contribute 6% of the average daily calorific intake of human beings. Mostly tropical tuber crop produced, that are used for human food and animal feed. Elephant foot yam, Greater yam, Aerial yam, Colocasia, Tannia, and Sweet potato play a major role in the socio-economic condition of small and marginal farmers of tribal areas of Gujarat region in context of food and nutrition security. It is believable that to motivate farmers for adopting recommended package of practices of root & tuber crops for food security and nutritional security is very much essential. Final decision of farmers to adopt root & tuber crops cultivation is usually the result of their knowledge about recommended package of practices of tuber crops. Knowledge of the root and tuber crop growers can be affected by their various characteristics. In this context, an attempt has been made to carry out the present investigation.
OBJECTIVE
To know the Determinants in knowledge about recommneded package of practices of root & tuber crops
METHODOLOGY
The study was conducted during April-June 2016 in Navsari district of Gujarat state. Gandevi, Chikhali and Khergam Talukas were randomly selected from Navsari district. From each taluka three villages were selected randomly with maximum number of root and tuber crop growers. In each of the selected villages farmers were selected according to random proportionate sampling to form 70 respondents as a sample size for the study. In order to measure correlation between profile of root and tuber crop growers and knowledge of recommended package of practices, various scale developed by different social scientist were adopted with due modification and correlation of coefficient (r) test was applied.
RESULTS AND DISCUSSION
Relationship between the personal, socio-economic characteristics of root and tuber crop growers and their knowledge
The association between the profile of root and tuber crop growers and their knowledge about recommended package of practices of root and tuber crops were worked out with the help coefficient of correlation. The findings were presented in Table 1.
DETERMINANTS IN KNOWLEDGE ABOUT RECOMMENDED PACKAGE OF PRACTICES OF ROOT & TUBER CROPS
V. B. Girawale1 and R. M. Naik2
1 Postgraduate student (Extension Education)2 Associate professor, Department of Extension Education, NMCA, NAU, Navasri
Email : [email protected]
ABSTRACT
With a view to know the correlation of knowledge about recommended package of practices of root and tuber crops with the root and tuber crop growers characteristics, the present study was undertaken in Navsari district of Gujarat. Majority of root and tuber crop growers had medium level of knowledge about recommended package of practices of root and tuber crops. The independent variables viz., farming experience, social participation, mass media exposure, education, size of land holding, annual income, extension contact and extension participation were positively and significantly correlated with knowledge about recommended package of practices of root & tuber crops.
Keynote : knowledge, root & tumber crops
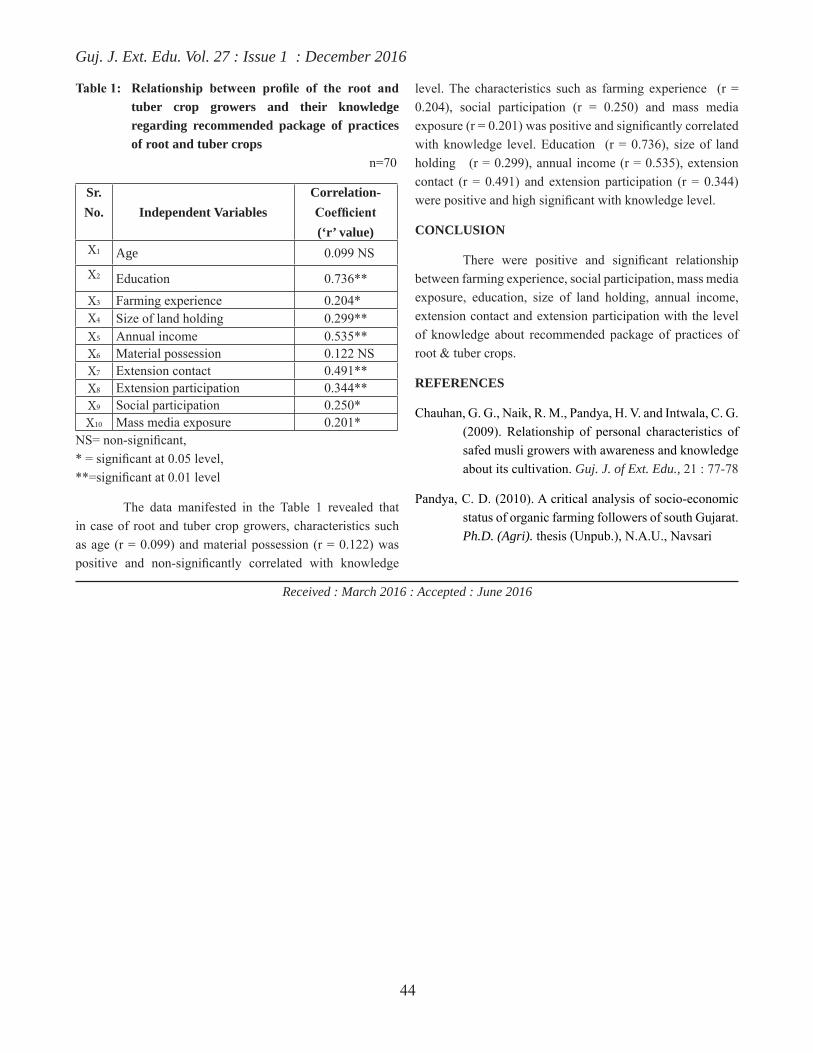
Guj. J. Ext. Edu. Vol. 27 : Issue 1 : December 2016
44
Table 1: Relationship between profile of the root and tuber crop growers and their knowledge regarding recommended package of practices of root and tuber crops n=70
Sr. No. Independent Variables
Correlation-Coefficient(‘r’ value)
X1 Age 0.099 NSX2 Education 0.736**
X3 Farming experience 0.204*X4 Size of land holding 0.299**X5 Annual income 0.535**X6 Material possession 0.122 NSX7 Extension contact 0.491**X8 Extension participation 0.344**X9 Social participation 0.250*X10 Mass media exposure 0.201*
NS= non-significant, * = significant at 0.05 level, **=significant at 0.01 level
The data manifested in the Table 1 revealed that in case of root and tuber crop growers, characteristics such as age (r = 0.099) and material possession (r = 0.122) was positive and non-significantly correlated with knowledge
level. The characteristics such as farming experience (r = 0.204), social participation (r = 0.250) and mass media exposure (r = 0.201) was positive and significantly correlated with knowledge level. Education (r = 0.736), size of land holding (r = 0.299), annual income (r = 0.535), extension contact (r = 0.491) and extension participation (r = 0.344) were positive and high significant with knowledge level.
CONCLUSION
There were positive and significant relationship between farming experience, social participation, mass media exposure, education, size of land holding, annual income, extension contact and extension participation with the level of knowledge about recommended package of practices of root & tuber crops.
REFERENCES
Chauhan, G. G., Naik, R. M., Pandya, H. V. and Intwala, C. G. (2009). Relationship of personal characteristics of safed musli growers with awareness and knowledge about its cultivation. Guj. J. of Ext. Edu., 21 : 77-78
Pandya, C. D. (2010). A critical analysis of socio-economic status of organic farming followers of south Gujarat. Ph.D. (Agri). thesis (Unpub.), N.A.U., Navsari
Received : March 2016 : Accepted : June 2016
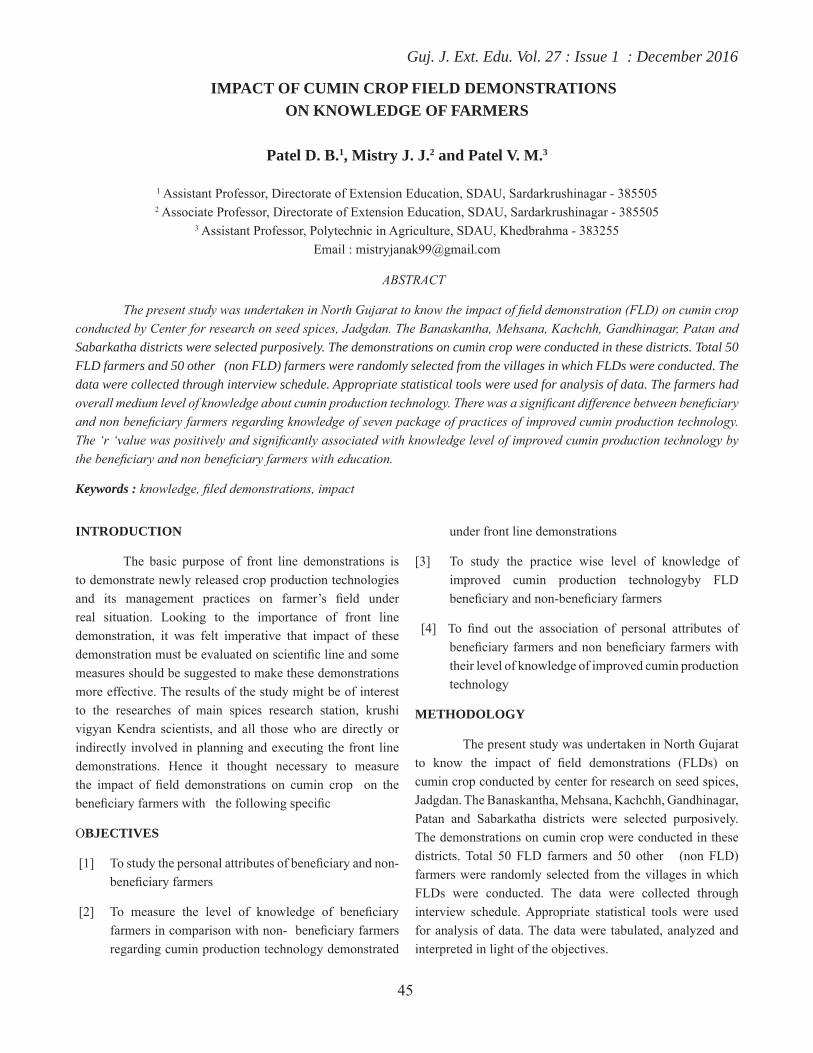
Guj. J. Ext. Edu. Vol. 27 : Issue 1 : December 2016
45
INTRODUCTION
The basic purpose of front line demonstrations is to demonstrate newly released crop production technologies and its management practices on farmer’s field under real situation. Looking to the importance of front line demonstration, it was felt imperative that impact of these demonstration must be evaluated on scientific line and some measures should be suggested to make these demonstrations more effective. The results of the study might be of interest to the researches of main spices research station, krushi vigyan Kendra scientists, and all those who are directly or indirectly involved in planning and executing the front line demonstrations. Hence it thought necessary to measure the impact of field demonstrations on cumin crop on the beneficiary farmers with the following specific
OBJECTIVES
[1] To study the personal attributes of beneficiary and non- beneficiary farmers
[2] To measure the level of knowledge of beneficiary farmers in comparison with non- beneficiary farmers regarding cumin production technology demonstrated
under front line demonstrations
[3] To study the practice wise level of knowledge of improved cumin production technologyby FLD beneficiary and non-beneficiary farmers
[4] To find out the association of personal attributes of beneficiary farmers and non beneficiary farmers with their level of knowledge of improved cumin production technology
METHODOLOGY
The present study was undertaken in North Gujarat to know the impact of field demonstrations (FLDs) on cumin crop conducted by center for research on seed spices, Jadgdan. The Banaskantha, Mehsana, Kachchh, Gandhinagar, Patan and Sabarkatha districts were selected purposively. The demonstrations on cumin crop were conducted in these districts. Total 50 FLD farmers and 50 other (non FLD) farmers were randomly selected from the villages in which FLDs were conducted. The data were collected through interview schedule. Appropriate statistical tools were used for analysis of data. The data were tabulated, analyzed and interpreted in light of the objectives.
IMPACT OF CUMIN CROP FIELD DEMONSTRATIONS ON KNOWLEDGE OF FARMERS
Patel D. B.1, Mistry J. J.2 and Patel V. M.3
1 Assistant Professor, Directorate of Extension Education, SDAU, Sardarkrushinagar - 3855052 Associate Professor, Directorate of Extension Education, SDAU, Sardarkrushinagar - 385505
3 Assistant Professor, Polytechnic in Agriculture, SDAU, Khedbrahma - 383255Email : [email protected]
ABSTRACT
The present study was undertaken in North Gujarat to know the impact of field demonstration (FLD) on cumin crop conducted by Center for research on seed spices, Jadgdan. The Banaskantha, Mehsana, Kachchh, Gandhinagar, Patan and Sabarkatha districts were selected purposively. The demonstrations on cumin crop were conducted in these districts. Total 50 FLD farmers and 50 other (non FLD) farmers were randomly selected from the villages in which FLDs were conducted. The data were collected through interview schedule. Appropriate statistical tools were used for analysis of data. The farmers had overall medium level of knowledge about cumin production technology. There was a significant difference between beneficiary and non beneficiary farmers regarding knowledge of seven package of practices of improved cumin production technology. The ‘r ‘value was positively and significantly associated with knowledge level of improved cumin production technology by the beneficiary and non beneficiary farmers with education.
Keywords : knowledge, filed demonstrations, impact

Guj. J. Ext. Edu. Vol. 27 : Issue 1 : December 2016
46
RESULTS AND DISCUSSION
Personal attributes of respondents
Table 1: Distribution of the respondents according to their the personal attributes
n=100
Sr. No. Attributes Classification
Beneficiary farmers (n=50)
Non-beneficiary farmers (n=50)
No. Percent No. Percent1 Age Young age (below to 35 year) 14 28.00 08 16.00
Middle age (35 to 50 year) 21 42.00 26 52.00Old age (Above 50 year) 15 30.00 16 32.00
2 Education Illiterate 03 06.00 07 14.00Primary education (Up to VII std. 27 54.00 20 40.00High School (VIII to X std.) level 11 22.00 05 10.00Higher secondary (XI to XII) level 06 12.00 15 30.00College level 03 06.00 03 6.00
3 Land holding Marginal (Up to 1.0 ha.) 16 32.00 22 44.00Small (1.01 to 2.0 ha.) 24 48.00 10 20.00Medium (2.01 to 4.0 ha.) 08 16.00 07 14.00Large (More than 4.0 ha.) 02 04.00 05 10.00
4 Source of information
Low (Up to 6 source) 13 26.00 10 20.00Medium (7-13 sources ) 24 48.00 35 70.00High (Above 13 sources) 13 26.00 05 10.00
5Extension participation
Low (Up to 10 score) 02 04.00 19 38.00Medium (11 to 28 score ) 36 72.00 23 46.00High (Above 28 score) 12 24.00 08 16.00
6Economic motivation
Low (Up to 17 score) 08 16.00 14 28.00Medium (18 to 24 score ) 35 70.00 30 60.00High (Above 24 score) 07 14.00 06 12.00
7Risk percentage
Low (Up to 15 score) 04 08.00 20 40.00Medium (16 to 23 score ) 35 70.00 25 50.00High (Above 23 score) 11 22.00 05 10.00
8Scientific orientation
Low (Up to 16 score) 06 12.00 14 28.00Medium (17 to 24 score ) 38 76.00 28 56.00High (Above 24 score) 06 12.00 08 16.00
The data depicted in Table 1 show that maximum number of respondents from beneficiary group (42.00 percent) and non-beneficiary group (52.00 percent) were found in middle age group. Nearly one half number of beneficiary farmers(54.00 percent) had primary education, while 40.00 per cent were found in non- beneficiary farmers. Majority (48.00 percent) of the beneficiary farmers were small farmers having 1.01 to 2.00 ha. of cultivable land. Whereas, majority of (44.00 percent) of non-beneficiary farmers were marginal farmers having up to 1.00 ha. of cultivable land. Maximum number of from beneficiary farmers (48.00 percent) and non-beneficiary farmers (70.00 percent) had medium level
utilization of information sources. Maximum numbers of beneficiary farmers (72.00 percent) had medium level of extension participation. Majority of the respondents from beneficiary group (70.00 percent) and non-beneficiary group (60.00 percent) had medium level of economic motivation. Maximum number of respondents from beneficiary group (70.00 percent) and non-beneficiary group (50.00 percent) were having medium level of risk preferences. Maximum number of respondents from beneficiary group (76.00 percent) and non-beneficiary group (56.00 percent) were having medium level of scientific orientation.

Guj. J. Ext. Edu. Vol. 27 : Issue 1 : December 2016
47
Knowledge level of respondents
Table 2: Distribution of the respondents according to their level of knowledge of improved cumin production technology
n-100
Sr. No. Category Beneficiary farmers(n=50)
Non-beneficiary farmers(n=50)
No. Percent No. Percent1 Low (Up to 24 score) 07 14.00 18 36.002 Medium (25 to 35 score) 33 66.00 31 62.003 High (Above 35 score) 20 40.00 02 04.00
It is clear from Table 2 that nearly equal number of the beneficiary farmers (66.00 %) and non-beneficiary farmers (62.00%) had medium level of knowledge about cumin production technology. On the other hand 40.00 per cent beneficiary and 4.00 per cent non-beneficiary farmers
had high level of knowledge about cumin production technology.
Remaining 14.00 per cent beneficiary and 36.00 per cent non-beneficiary farmers had low level of knowledge about cumin production technology
Table 3: Practice-wise knowledge of improved cumin production technology by FLD beneficiary and non-beneficiary farmers
n=100
Sr.
No.
Name of Practice Mean Score Standard deviation of
Mean
Calculated
‘Z’ valueBeneficiary
(n=50)
Non-beneficiary
(n=50)1 Variety 2.60 1.90 0.089 8.868**2 Seed treatment 3.06 2.32 0.151 3.895**3 Sowing time 3.71 3.21 0.098 3.866**4 Fertilizer 5.13 4.96 0.214 4.093**5 Irrigation 2.87 3.59 0.084 8.623**6 Weed Control 2.39 2.98 0.152 4.854**7 Plant protection measures 6.22 4.99 0.204 3.901**8 Harvesting and storage 2.24 2.26 0.124 0.217NS
** significant at 0.01 level NS: Not significant Table 3 reveal that there was significant difference in knowledge level of beneficiary and non-beneficiary farmers regarding the practice viz., variety, seed treatment, sowing time, fertilizer, irrigation, plant protection measures and
weed control and plant protection measures. No significant difference was observed between beneficiary and non-beneficiary farmers in respect of harvesting and storage.
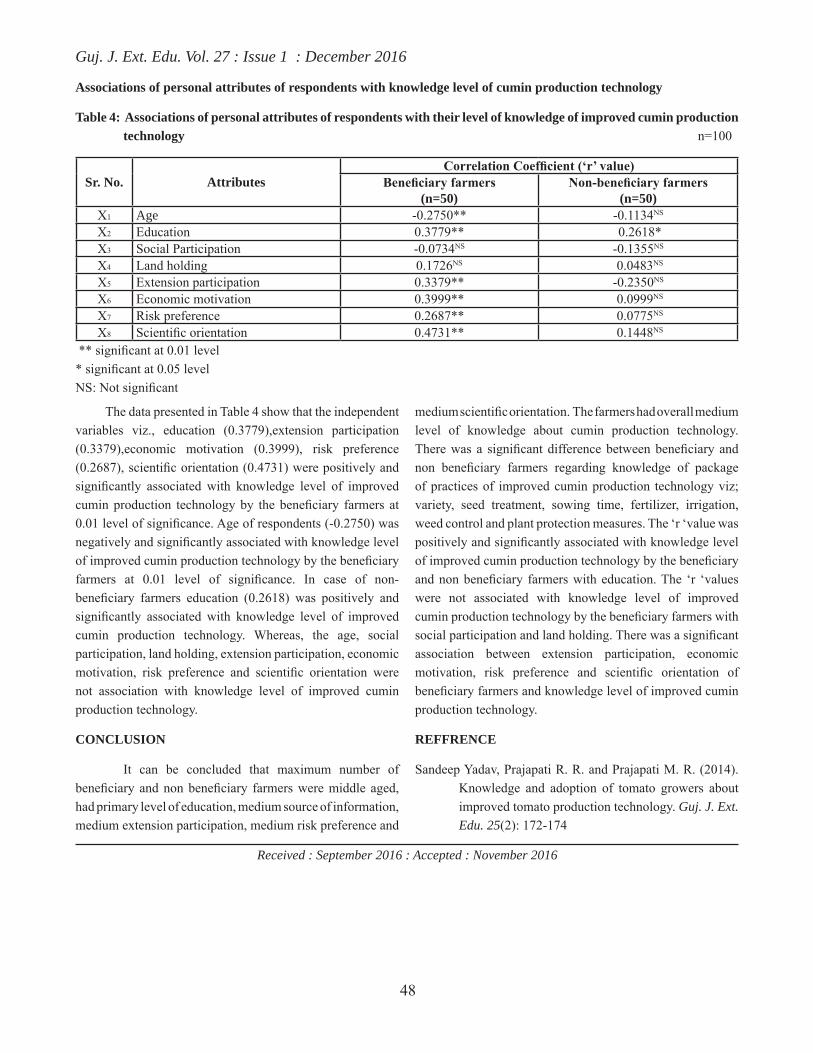
Guj. J. Ext. Edu. Vol. 27 : Issue 1 : December 2016
48
Associations of personal attributes of respondents with knowledge level of cumin production technology
Table 4: Associations of personal attributes of respondents with their level of knowledge of improved cumin production technology n=100
Sr. No. AttributesCorrelation Coefficient (‘r’ value)
Beneficiary farmers(n=50)
Non-beneficiary farmers (n=50)
X1 Age -0.2750** -0.1134NS
X2 Education 0.3779** 0.2618*X3 Social Participation -0.0734NS -0.1355NS
X4 Land holding 0.1726NS 0.0483NS
X5 Extension participation 0.3379** -0.2350NS
X6 Economic motivation 0.3999** 0.0999NS
X7 Risk preference 0.2687** 0.0775NS
X8 Scientific orientation 0.4731** 0.1448NS
** significant at 0.01 level * significant at 0.05 level NS: Not significant
The data presented in Table 4 show that the independent variables viz., education (0.3779),extension participation (0.3379),economic motivation (0.3999), risk preference (0.2687), scientific orientation (0.4731) were positively and significantly associated with knowledge level of improved cumin production technology by the beneficiary farmers at 0.01 level of significance. Age of respondents (-0.2750) was negatively and significantly associated with knowledge level of improved cumin production technology by the beneficiary farmers at 0.01 level of significance. In case of non-beneficiary farmers education (0.2618) was positively and significantly associated with knowledge level of improved cumin production technology. Whereas, the age, social participation, land holding, extension participation, economic motivation, risk preference and scientific orientation were not association with knowledge level of improved cumin production technology.
CONCLUSION
It can be concluded that maximum number of beneficiary and non beneficiary farmers were middle aged, had primary level of education, medium source of information, medium extension participation, medium risk preference and
medium scientific orientation. The farmers had overall medium level of knowledge about cumin production technology. There was a significant difference between beneficiary and non beneficiary farmers regarding knowledge of package of practices of improved cumin production technology viz; variety, seed treatment, sowing time, fertilizer, irrigation, weed control and plant protection measures. The ‘r ‘value was positively and significantly associated with knowledge level of improved cumin production technology by the beneficiary and non beneficiary farmers with education. The ‘r ‘values were not associated with knowledge level of improved cumin production technology by the beneficiary farmers with social participation and land holding. There was a significant association between extension participation, economic motivation, risk preference and scientific orientation of beneficiary farmers and knowledge level of improved cumin production technology.
REFFRENCE
Sandeep Yadav, Prajapati R. R. and Prajapati M. R. (2014). Knowledge and adoption of tomato growers about improved tomato production technology. Guj. J. Ext. Edu. 25(2): 172-174
Received : September 2016 : Accepted : November 2016

Guj. J. Ext. Edu. Vol. 27 : Issue 1 : December 2016
49
INTRODUCTION
In India, Agriculture sector contributes 23 per cent share to the national income but day by day still it is going on decreasing. Even though large hectares of area are under cultivation in this country, the yield per hectare for many crops is lower than expected level. This is because of lack of adoption of new, improved practices, advanced techniques, use of non-productive soils, decreasing soil conditions etc. It is possible to increase yield per unit area by adopting new production technologies viz., use of biofertilizers, vermicompost, organic
farming, bio-control remedies, genetically modified crops etc in golden era of organic farming. In Agricultural production, chemical fertilizers play an important role visa-vis they are available in sufficient quantities. However, they are more costly and their excessive use may cause ill effects on soil, causing increased soil acidity/alkalinity and increased soil pollution with decreased soil productivity. Now maximum farmers in the world are aware about the dangerous effects of chemicals on human being. Hence, there is increasing demand for organic foods. Therefore, there is a need of
CONSTRAINTS FACED BY BIOFERTILIZER USERS
Chaudhary Diptesh1 and Dr. N.M. Chauhan2
1 Postgraduate Student2 Principal, Polytechnic in Agriculture. NAU, Vyara - 394650
Email : [email protected]
ABSTRACT
The constant and sustained efforts of the microbiologists and biotechnologists for isolating and standardizing the activities of microorganisms have helped to increase the production of bio fertilizers. The bio fertilizers are carrier based provision containing effective strains of microorganisms like bacteria, algae, fungi alone or in combination with sufficient number which can provide plant nutrients through microbial activity. Bio fertilizers are environment friendly, less costly and non-bulky. With this background, the study entitled “Extent of knowledge and adoption of biofertilizers use by the biofertilizer users of Navsari district” was undertaken with the following objectives:To study the profile of the biofertilizer users, to ascertain the knowledge level of biofertilizer users towards the use of biofertilizers, to study the adoption pattern of bio fertilizers by biofertilizer users, to measure the relationship between profiles with level of Knowledge and adoption towards the use of biofertilizer and to identify the constraints faced and obtain suggestions by the biofertilizer users in adoption of biofertilizers. Results indicated that majority of the farmers was in the middle age group (36-50 years),most of the farmers had education up to high school level, majority of farmers had 2 to 5 acre of land holding, majority of farmers belonged to more than Rs. 1,00,000 annual incomes, majority of farmers had low level of social participation, majority of farmers had medium extension contact, majority of the farmers had low level of scientific orientation, majority of farmers belonged to medium mass media exposure, majority of farmers belonged to medium level of knowledge about use of biofertilizer, majority of farmers belonged to medium level of adoption of biofertilizer. Majority of the respondents expressed that lack of technical skill to use biofertilizers and occupied rank first, Non availability of biofertilizer locally at times when needed ranked second, Inability to understand the details of biofertilizers ranked third, No guidance by agricultural Supervisor and Gramsevak ranked fourth, Non-availability of extension literature on biofertilizer usage ranked fifth, Lack of finance ranked sixth, Lack of knowledge about practices ranked seventh, Improper soil condition ranked eighth and Low shelf life of biofertilizer ranked ninth. Majority of the respondents expressed that bio fertilizer usage can be increased if they are provided free of cost was the major suggestion offered by the farmers to adopt bio -fertilizer technology. The other suggestions were printed literature in simple local language can be distributed by the Dept. of Agriculture and the University or the NGOs like Krishi Vigyan Kendra, awareness campaign on popularization of biofertilizers like krishi mela , availability of bio fertilizers in villages , subsidy for bio fertilizers.
Keywords: constructions, suggestion, biofertilizer users
Guj. J. Ext. Edu. Vol. 27 : Issue 1 : December 2016
50
certain supplements to the chemical fertilizers with organic manures. In this case, bio-fertilizers can play a significant role in improving soil condition and agricultural production. Now a days Biofertilizers are available in ample with all SAUs in Gujarat. Especially ,NAU is producing huge mass of Biofertilizers.
OBJECTIVES
(1) To know the constraints faced by biofertilizer users
(2) To know the suggestions offerd by biofertilizer users for adoption of biofertilizer
METHODOLOGY
An ex-post-facto research design was used in the present investigation. The study was conducted during April-June 2016 in Navsari district of Gujarat state. The main focus of the investigation is on extent of knowledge and adoption of biofertilizers use by the biofertilizer users of Navsari district. The District comprises of six Talukas, among which Gandevi, Chikhali and Khergam Talukas were randomly selected for the study. Three talukas were selected for the study and from each taluka two village were selected. In each of the selected villages farmers were selected according to random sampling to form 60 respondents as a sample size for the study. Eight variables were measured, in that size of land holding, annual income and social participation, scientific orientation and mass media exposure is measured by scale developed by eminent scientists. In order to measure knowledge and extent of adoption of biofertilizer use a structured schedule was developed by reviewing related literature and seeking expert’s suggestions. The data were collected by personal interview method. Statistical tools viz. frequency, percentage, ranking and correlation, were used to analyze the data.
RESULTS AND DISCUSSION
Personal profile of the respondents
Personal profile of the respondents indicated that majority of the farmers were in the middle age group (36-50 years).Most of the farmers had education up to high school level. Majority of farmers had 2 to 5 acre of land holding. Majority of farmers belonged to more than Rs. 1,00,000 annual income. Majority of farmers had low level of social participation. Majority of farmers had medium extension
contact. Majority of the farmers had low level of scientific orientation. Majority of farmers belonged to medium mass media exposure. The same was also reported by Pandya (2010) and Patel et al (2014).
Knowledge level of the respondents
Knowledge level of farmers about the use of biofertilizers.
Table 1: Distribution of the respondents according to their level of overall knowledge of farmers about biofertilizers n=60
Sr. No.
Category Frequency Percent
1 Low knowledge 06 10.002 Medium knowledge 41 68.333 High knowledge 13 21.67
Mean =8.20 SD=1.60
From the above table No.1 it is evident that majority of farmers (68.33 per cent) belonged to medium level of knowledge, followed by low (21.67 per cent) and high (10.00 per cent).The above findings are in line with the findings of Mokhale et al. (2010) with respect to majority of farmers having medium level of knowledge. Majority of farmers belonged to medium level of knowledge about use of biofertilizer. Reddy et al (2012) also reported the same.
Adoption level of biofertilizer by the farmers
Table 2: Distribution of the respondents according to their level of overall adoption of biofertilizers by farmers n=60
Sr. No.
Category Frequency Percent
1 Low knowledge 15 25.002 Medium knowledge 29 48.333 High knowledge 16 26.67
Mean =5.05 SD=0.79
From the above table No.2 it is evident that majority of farmers (48.33 per cent) belonged to medium level of adoption, followed by high (26.67 per cent) and low (28.00 per cent).The above findings are in line with the findings of Shashidhara. K. K (2012) with respect to majority of farmers belongs to medium level of adoption. Majority of farmers belonged to medium level of adoption of biofertilizer. Reddy et al (2012) and Mokhale, et al (2010) also reported the same.

Guj. J. Ext. Edu. Vol. 27 : Issue 1 : December 2016
51
Constraints encountered in the adoption of biofertilizer practices by the farmers
Table 3 : Constraints encountered in the adoption of biofertilizer practices by the farmers n=60
Sr. No.
Constraints Frequency Percent Rank
1 No guidance by agricultural Supervisor and Gramsevak 39 65.00 IV2 Inability to understand the details of biofertilizers 41 68.33 III
3 lack of technical skill to use biofertilizers 48 80.00 I
3 Lack of finance 36 60.00 VI4 Non availability of biofertilizer locally at times when needed 47 78.33 II5 Lack of knowledge about practices 34 56.67 VII6 Non-availability of extension literature on biofertilizer usage 38 63.33 V7 Improper soil condition 30 50.00 VIII8 Low shelf life of biofertilizer 27 45.00 IX
It is revealed by the respondents in Table-3 that majority of the respondents expressed that lack of technical skill to use biofertilizers (80.00 per cent ) and occupied rank first, Non availability of biofertilizer locally at times when needed (78.33 per cent ) ranked second, Inability to understand the details of biofertilizers (68.33 per cent) ranked third, No guidance by agricultural Supervisor and Gramsevak (65.00 per cent) ranked fourth, Non-availability of extension literature on biofertilizer usage (63.33 per cent) ranked fifth, Lack of finance (60.00 per cent) ranked sixth, Lack of
knowledge about practices (56.67 per cent) ranked seventh, Improper soil condition (50.00 per cent) ranked eighth and Low shelf life of biofertilizer (45.00 per cent) ranked ninth. Jangid (2012) and Srinivas and Bhalekar, (2013) and Slathia et al. (2013) also reported the same. Low shelf life and non-availability of specific strains of biofertilizer, no guidance by agricultural Supervisor and Gramsevak and inability to understand the details were also expressed as constraints by some farmers.
Suggestions by the farmers for adoption of bio fertilizer
Table 4 : Suggestions by the farmers for adoption of bio fertilizer n=60
Sr. No
Suggestions Frequency Percent Rank
1 Bio fertilizers usage can be increased if they are provided free of cost 49 81.67 I
2 Availability of bio fertilizers in villages 34 56.67 IV3 Subsidy on bio fertilizers 32 53.33 V4 Awareness campaign on popularization of biofertilizers like
krishi mela35 58.33 III
5 Printed literature in simple local language can be distributed by the Dept. of Agriculture and the University or the NGOs like Krishi Vigyan Kendra
47 78.33 II
Suggestions offered by the farmers in adoption of bio fertilizer were analyzed and presented in Table-4. Majority of the respondents expressed that bio fertilizer usage can be increased if they are provided free of cost was the major suggestion offered by the farmers to adopt bio fertilizer technology. The other suggestions were printed literature in simple local language can be distributed by the Dept. of Agriculture and the University or the NGOs like
Krishi Vigyan Kendra(78.33 per cent), awareness campaign on popularization of biofertilizers like krishi mela (58.33 per cent), availability of bio fertilizers in villages (56.67per cent), subsidy for bio fertilizers (53.33 per cent). Bodake et al (2012) and Damor, (2013) also reported the same.On above findings this can be conclude like training for the farmers on bio fertilizers usage should be give more and also awareness programmes can be conducted.

Guj. J. Ext. Edu. Vol. 27 : Issue 1 : December 2016
52
CONLUSION
From the above study it can be concluded that majority of biofertilizer users belong to 36 to 50 years, having education primary to graduate, medium land holding, high annual income, low level of membership, medium extension contact, low scientific orientation, medium mass media exposure. Majority of farmers had medium knowledge level. Majority of farmers had medium adoption level. The variable age is negative but significant relationship with the level of knowledge about the use of biofertilizer, education is positive and highly significant and other variables viz., land holding, annual income, social participation, extension contact, scientific orientation and mass media exposure are positive and significant. The variable age is negative but significant relationship with the level of adoption of biofertilizer, education and extension contact are the positive and highly significant and other variables viz. land holding, annual income, social participation and mass media exposure is positive and significant relationship with the level of overall adoption of the biofertilizer. Scientific orientation is negative and non-significant. Majority of the respondents expressed that lack of technical skill to use biofertilizers and occupied rank first, Non availability of biofertilizer locally at times when needed ranked second, Inability to understand the details of biofertilizers ranked third, No guidance by agricultural Supervisor and Gramsevak ranked fourth, Non-availability of extension literature on biofertilizer usage ranked fifth, Lack of finance ranked sixth, Lack of knowledge about practices ranked seventh, Improper soil condition ranked eighth and Low shelf life of biofertilizer ranked ninth. Majority of the respondents expressed that bio fertilizer usage can be increased if they are provided free of cost was the major suggestion offered by the farmers to adopt bio -fertilizer technology. The other suggestions were printed literature in simple local language can be distributed by the Dept. of Agriculture and the University or the NGOs like Krishi Vigyan Kendra, awareness campaign on popularization of biofertilizers like krishi mela , availability of bio fertilizers in villages , subsidy for bio fertilizers.
REFERENCES
Bodake, H. D., Gaikwad, S. P. and Shirke, V. S. (2012). Study of constraints faced by the farmers in adoption of bio-fertilizers. International journal of Agricultural
Sciences, 5(1): 292-294.
Damor, K. C. (2013). Attitude of farmers towards organic farming. M.Sc. (Agri.) Thesis (unpublished), Anand Agricultural University, Anand.
Jangid M. K.,(2012). Constraints Faced by the Organic and Conventional Farmers in Adoption of Organic Farming Practices, Indian Research Journal of Extension Education, II
Mokhale, S. U.,Deshmukh, A. N., Holi, S. S. and Shambarkar, Y. B. (2010). Technological knowledge of farmers about the use of biofertilizer. Agriculture Update. 5(3&4): 277-278
Pandya, C. D. (2010). A critical analysis of soico-economic status of organic farming followers of south Gujarat. Ph.D. (Agri.). Thesis (Unpublished), Navsari Agricultural University, Navsari
Patel, B. D. (2005). A study on adoption of recommended chili technology in Vadodara district of Gujarat state. M.Sc. (Agri.) Thesis (unpublished) submitted to A.A.U., Anand
Patel, J. K.; Patel, V. T.; Prajapati, M. R. and Thakka, K. A. (2014). Awareness regarding organic farming among the farmers of Sabarkantha and Banaskantha district. Guj. J. Extn. Edu. 25: 152-154
Reddy, S. P., Srinath, B., Kishore, S., Naidu, B. V. and Satyanarayana, R. (2012). Knowledge and adoption levels on organic farming in mulberry cultivation with the farmers in Chittoor district of Andhra Pradesh. Crop Res. 43 (1, 2 & 3): 284-288
Shashidhara. K. K. (2012), Adoption of Eco-Friendly Technologies by Cotton Growers. Indian Research Journal of Extension Education, I: 217
Slathia, P. S.; Kumar, P.; Paul, N. and Ali, L. (2013). Problems faced by organic farmers in hilly areas of Udampur district in Jammu Region. Indian Res. J. Extn. Edu. & R.D. 21:55-59
Srinivas, A. and Bhalekar, D. N. (2013). Constraints Faced by Farmers in Adoption of Biofertilizers. International Journal of Scientific Research. 4(2)
Received : April 2016 : Accepted : July 2016

Guj. J. Ext. Edu. Vol. 27 : Issue 1 : December 2016
53
INTRODUCTION
Krishi Vigyan Kendra has been functioning in the Sabarkantha district since February 2005. The main aim of Krishi Vigyan Kendra is transfer of technology through on and off campus training programmes for farmers and extension functionaries, front line demonstrations, on farm trials and other extension activities. Front line demonstration on different crops grown in the district is the mandatory activity of Krishi Vigyan Kendra. Tribal farmers are growing pulse crops since couple of decades. Green gram is important pulse crop grown by tribal farmers. Thus, Krishi Vigyan Kendra had given front line demonstrations on green gram crop to tribal farmers. Thus, study on knowledge and adoption of recommended green gram cultivation technology by tribal FLD beneficiary farmers of Sabarkantha district was felt necessary. The study was conducted with following objectives.
OBJECTIVES
(1) To study selected personal and socio-economic attributes of respondents
(2) To study knowledge level of respondents regarding recommended green gram cultivation technology
(3) To determine the association between selected personal and socio-economic attributes of respondents with
their level of knowledge
METHODOLOGY
The present study was conducted in Sabarkantha district. The all the tribal villages in which green gram FLDs had been given by KVK, Khedbrahma were selected purposively from Khedbrahma, Bhiloda and Vijaynagar talukas. Total 200 FLDs on green gram were given by KVK, Khedbrahma. The sample was selected by proportionate random sampling method. The detail is as under.
Name of Takuka
No. of green gram FLD beneficiaries
No. of selected farmers
Khedbrahma 130 65
Vijaynagar 30 15
Bhiloda 40 20
Thus, total 100 tribal farmers were selected for present study. The data were collected by personal interview. The interview schedule was developed through discussion with experts, scientist and extension officers working in the district. The percentage, arithmetic mean and standard deviation were used for classification of respondents into different categories. The coefficient of correlation test was used to find out association between dependent and independent variables.
KNOWLEDGE LEVEL OF RECOMMENDED GREEN GRAM CULTIVATION TECHNOLOGY OF TRIBAL FLD FARMERS
J. J. Mistry1 , D. B. Patel2 and V. M. Patel3
1 Associate Professor (Ext. Edu.), DEE, SDAU, Sardarkrushinagar - 3855052 Assistant Professor (Ext. Edu.), DEE, SDAU, Sardarkrushinagar - 385505
3 Assistant Professor, Polytechnic in Agriculture, SDAU, Khedbrahma - 383255E-mail : [email protected]
ABSTRACT
The study was conducted in Sabarkantha district. Total 100 tribal FLD green gram farmers were selected by proportionate random sampling method. The majority of the respondents were illiterate, had big family, possessed membership in one organization, medium extension participation, medium annual income, doing farming as well as animal husbandry, medium herd size and had 10 to 20 years of farming experience. The respondents were having over all medium level of knowledge regarding green gram cultivation technology. The positive and significant relationship was exhibited by education, social participation, extension participation, annual income, occupation and heard size with knowledge level of respondents regarding green gram cultivation technology.
Keywords: information, communication, technology, services.
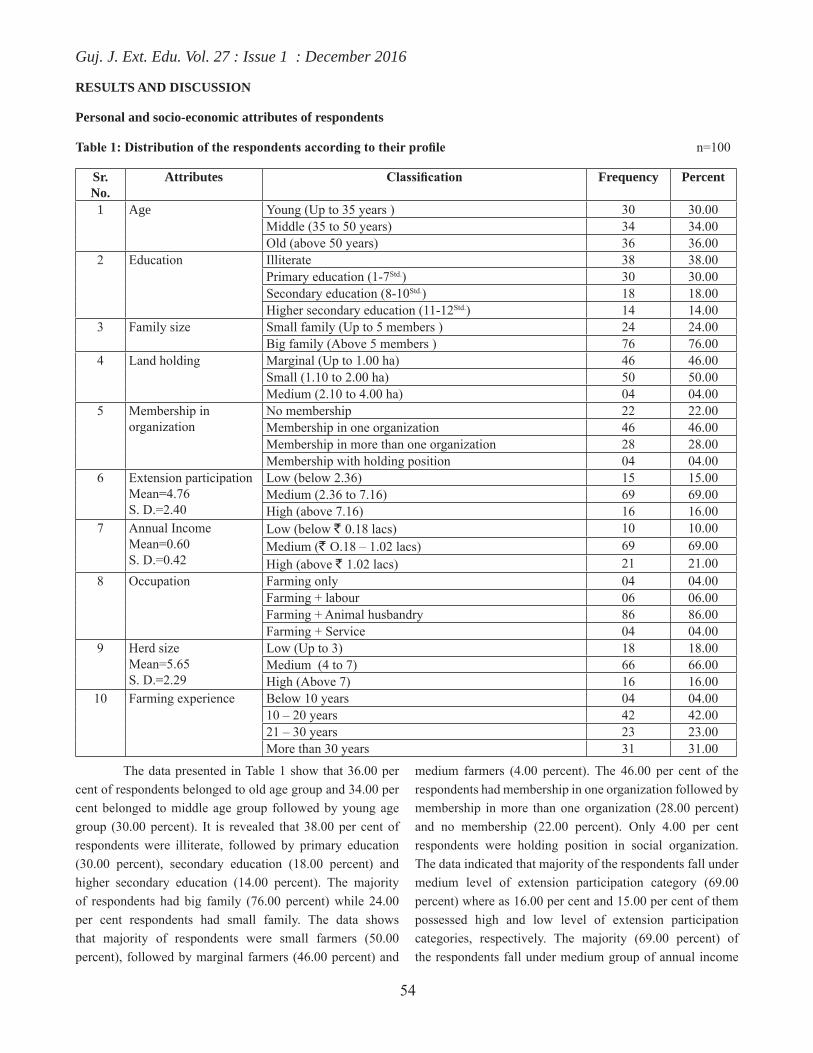
Guj. J. Ext. Edu. Vol. 27 : Issue 1 : December 2016
54
RESULTS AND DISCUSSION
Personal and socio-economic attributes of respondents
Table 1: Distribution of the respondents according to their profile n=100
Sr. No.
Attributes Classification Frequency Percent
1 Age Young (Up to 35 years ) 30 30.00Middle (35 to 50 years) 34 34.00Old (above 50 years) 36 36.00
2 Education Illiterate 38 38.00Primary education (1-7Std.) 30 30.00Secondary education (8-10Std.) 18 18.00Higher secondary education (11-12Std.) 14 14.00
3 Family size Small family (Up to 5 members ) 24 24.00Big family (Above 5 members ) 76 76.00
4 Land holding Marginal (Up to 1.00 ha) 46 46.00Small (1.10 to 2.00 ha) 50 50.00Medium (2.10 to 4.00 ha) 04 04.00
5 Membership in organization
No membership 22 22.00Membership in one organization 46 46.00Membership in more than one organization 28 28.00Membership with holding position 04 04.00
6 Extension participation Mean=4.76 S. D.=2.40
Low (below 2.36) 15 15.00Medium (2.36 to 7.16) 69 69.00High (above 7.16) 16 16.00
7 Annual IncomeMean=0.60S. D.=0.42
Low (below ` 0.18 lacs) 10 10.00Medium (` O.18 – 1.02 lacs) 69 69.00High (above ` 1.02 lacs) 21 21.00
8 Occupation Farming only 04 04.00Farming + labour 06 06.00Farming + Animal husbandry 86 86.00Farming + Service 04 04.00
9 Herd sizeMean=5.65 S. D.=2.29
Low (Up to 3) 18 18.00Medium (4 to 7) 66 66.00High (Above 7) 16 16.00
10 Farming experience Below 10 years 04 04.0010 – 20 years 42 42.0021 – 30 years 23 23.00More than 30 years 31 31.00
The data presented in Table 1 show that 36.00 per cent of respondents belonged to old age group and 34.00 per cent belonged to middle age group followed by young age group (30.00 percent). It is revealed that 38.00 per cent of respondents were illiterate, followed by primary education (30.00 percent), secondary education (18.00 percent) and higher secondary education (14.00 percent). The majority of respondents had big family (76.00 percent) while 24.00 per cent respondents had small family. The data shows that majority of respondents were small farmers (50.00 percent), followed by marginal farmers (46.00 percent) and
medium farmers (4.00 percent). The 46.00 per cent of the respondents had membership in one organization followed by membership in more than one organization (28.00 percent) and no membership (22.00 percent). Only 4.00 per cent respondents were holding position in social organization. The data indicated that majority of the respondents fall under medium level of extension participation category (69.00 percent) where as 16.00 per cent and 15.00 per cent of them possessed high and low level of extension participation categories, respectively. The majority (69.00 percent) of the respondents fall under medium group of annual income

Guj. J. Ext. Edu. Vol. 27 : Issue 1 : December 2016
55
followed by 21.00 percent in high income group and 10.00 per cent in low income group. The data in Table indicated that majority (86.00%) of the respondents had occupation of farming + animal husbandry where as 6.00 percent of respondents had occupation of Farming + labour. An equal number of respondents (4.00%) had occupation of farming and Farming + Service. The majority (66.00%) of the respondents possessed medium herd size followed by small herd size (18.00%) and big herd size (16.00%). The 42.00 per cent of the respondents possessed 10 to 20 years of experience in farming followed by 31.00 percent and 23.00 per cent of them had more than 30 years and 21 to 30 years experience in farming, respectively. Only 4.00 per cent respondents had below 10 years farming experience.
Knowledge level of respondents regarding green gram cultivation technology
Table 2 : Distribution of the respondents according to their level of knowledge regarding green gram cultivation technology n=100
Sr. No.
Knowledge Frequency Percent
1 Low (Up to 8 score ) 07 07.002 Medium (9 – 11 score) 70 70.003 High (above 11 score) 23 23.00
Mean=10.31 S. D.=1.47
The data in Table 2 revealed that majority (70.00 percent) of the respondents possessed medium level of knowledge. Whereas 23.00 per cent and 7.00 per cent of them possessed high and low level of knowledge regarding green gram cultivation technology, respectively.
Association of selected attributes with knowledge level of respondents regarding green gram cultivation technology
The data in Table 3 showed that the correlation coefficient of the knowledge with the different attributes of respondents. It clearly indicate that the variables viz; education, social participation, annual income, occupation and heard size had shown positive and significant association with knowledge of respondents regarding green gram cultivation technology. Family size of the respondents had sown negative and non significant association with knowledge. Land holding of the respondents had no
association with level of knowledge. Extension participation of the respondents had positive and significant association with level of knowledge. Age and farming experience had established negative and significant association with level of knowledge of respondents regarding green gram cultivation technology.
Table 3 : Association of selected attributes of respondents with their level of knowledge regarding green gram cultivation technology n=100
Sr. No.
Attributes Knowledge
1 Age -0.307**2 Education 0.411**3 Family size -0.025NS
4 Land holding 0.175 NS
5 Social participation 0.304**6 Extension participation 0.253*7 Annual income 0.277**8 Occupation 0.268**9 Heard size 0.368**
10 Farming experience -0.213*
CONCLUSION
From the present study it can be concluded that majority of the respondents had big family, possessed membership in one organization, medium extension participation, medium annual income, doing farming as well as animal husbandry, medium herd size and had 10 to 20 years of farming experience. Nearly equal numbers of respondents were observed in young, middle and old aged group. Majority of the respondents were illiterate. The respondents were having over all medium level of knowledge regarding green gram cultivation technology. Education, social participation, extension participation, annual income, occupation and heard size exhibited positive and significant relationship with knowledge level of respondents regarding green gram cultivation technology.
REFERENCE
Yadav S., Prajapati R. R. and Prajapati M. R. (2014). Knowledge and adoption of tomato growers about improved tomato production technology. Guj. J. Ext. Edu. 25(2): 172-174
Received : July 2016 : Accepted : November 2016
Guj. J. Ext. Edu. Vol. 27 : Issue 1 : December 2016
56
INTRODUCTION
Agriculture is the largest industry in India contributing to the source of livelihood for over 70 per cent of population. Agricultural production plays a significant role in the Indian economy. In India, women and agriculture seem synonymous terms. One can not think of agriculture without women. There is hardly any activity in agriculture except ploughing, where women are not involved. In some of the activities, she is relatively more efficient than man. Dahod is one of the Integrated Tribal Development Project (ITDP) areas of Gujarat State, where various administrative measures have been adopted through large number of tribal development and welfare programmes under Tribal Area Sub Plan (TASP). Since, independence huge fund have been diverted by the Central and State Government through different agencies with a view to uplift their living standard and bringing them into the main stream of nation. Even after lapses of more than 50 years of independence the progress of tribal farmwoman is not yet up to the level of expectation in the field of agriculture and animal husbandry as she is continued to be in a state of neglect. A victim of man made system, she is hardly considered equal to man in wage and
social status. Keeping in view the above said facts and information about the tribal farmwoman’s situation and her multiple roles in agriculture and animal husbandry a study on “Risk Preference of tribal farm women and its relationship with their contribution in agriculture and animal husbandry” was undertaken.
OBJECTIVE
To know the risk preference of tribal farm women and its relationship with their constribution in agriculture and animal husbandry
METHODOLOGY
The present study was undertaken in Integrated Tribal Development Project areas of Dahod district of Gujarat. Out of seven talukas of the district, five talukas namely (1) Dahod (2) Zalod (3) Limkheda (4) Garbada and (5) Dhanpur were selected purposively for this study. Out of total villages of each selected taluka, two villages were randomly selected comprising total ten villages from five selected talukas kof ITDP Dahod. From each village, 20 respondents were selected randomly, thus, total sample of 200 respondents were
RISK PREFERENCE OF TRIBAL FARM WOMEN AND ITS RELATIONSHIP WITH THEIR CONTRIBUTION IN AGRICULTURE AND ANIMAL HUSBANDRY
Mahesh R. Patel1, Arun Patel2 and Pravin Chaudhary 1 Associate Extension Educationist, EEI, AAU, Anand - 388110
2 Director of Extension Education AAU, Anand - 3881103 PG Student, BACA, AAU, Anand - 388110
Email : [email protected]
ABSTRACT
Agricultural production plays a significant role in the Indian economy. In India, women and agriculture seem synonymous terms. One can not think of agriculture without women. There is hardly any activity in agriculture except ploughing, where women are not involved. The tribal farmwoman shares with her husband the arduous burden of farm work in addition to her major responsibility as home maker, by helping in all other agricultural and animal husbandry activities. Keeping this fact in mind, the present study was carried out to find out Risk Preference of tribal farm women and its relationship with their contribution in agriculture and animal husbandry. The result of the study revealed that slightly more than three fourth (77.00 per cent) respondents had medium level of risk preference. Whereas 12.00 per cent had high and 10.50 per cent of them had low level of risk preference. It is also observed that there is a positive and highly significant relationship between the risk preference and overall extent of contribution of tribal farmwomen in agricultural operations whereas there is non-significant relationship between the risk preference and overall extent of contribution of tribal farmwomen in animal husbandry activities.
Keywords: risk preference, tribal farmwomen
Guj. J. Ext. Edu. Vol. 27 : Issue 1 : December 2016
57
selected for the present study. The interview schedule was prepared keeping in view the objectives of the study. Risk preference was measured with the help of risk preference scale developed by Supe (1969). The data was analysed with percentage and coefficient of correlation.
RESULTS AND DISCUSSION
Farming in general is characterised by many uncontrollable variables such as rainfall, pest and diseases and price fluctuations, etc. Thus, there is a risk in farming. Therefore, it was felt appropriate to study the risk taking ability of the tribal farmwomen. Data in this regards are presented in Table 1.
Table 1 : Distribution of respondents according to their level of risk preference n = 200
Sr. No.
Risk preference Number Per cent
1 Low (< 15.49 score) 22 11.002 Medium (15.49 to 22.17 score) 154 77.003 High (above > 22.17 score) 24 12.00
Mean = 18.83 S.D. = 3.34
It is evident from the data reported in Table 1 that slightly more than three fourth (77.00 per cent) of the respondents had medium level of risk preference. Whereas 12.00 per cent had high and 11.00 per cent of them had low level of risk preference, respectively. Thus, it appears that majority of the tribal farmwomen had medium to high risk preference ability.
In general, it is observed that agriculture in tribal area is characterised by many uncontrollable variables, for example, uneven rain fall, disease, risk of wild animal and forest conflagration or wild fire, this can be oriented them to adopt any risky ideas for their survival. This might be the probable reason for observing medium to high level of risk preference in majority of the tribal farmwomen. Similar findings have been reported by Gamit (1993), Sarkar and Bandyopadhyay (1996), Patel (1998) and Diwan (2000).
Relationship between risk preference and overall extent of contribution of tribal farmwomen in agricultural operations
The calculated correlation co-efficient value of r = 0.52799 was significant at 0.01 level. It can be concluded that, there is a positive and highly significant relationship between the risk preference and overall extent of contribution of tribal
farmwomen in agricultural operations. It indicates that extent of contribution increases significantly with increase in risk preference of tribal farmwomen. It was obvious that highly risk preferred tribal farmwomen were oriented towards maximization of profits from agriculture. Therefore, they have favourable perception towards progressive change and this might have led them towards more contribution in agricultural operations. This finding is in concurrence with findings reported by Jullana et al. (1991), Padhi (1993), Patel (1998) and Diwan (2000).
Relationship between risk preference and overall extent of contribution of tribal farmwomen in animal husbandry activities
The calculated correlation co-efficient value (r = -0.05005) was non-significant at 0.05 level. It can be concluded that, there is non-significant relationship between the risk preference and overall extent of contribution of tribal farmwomen in animal husbandry activities. This might be due to the fact that there is not much risk in adopting animal husbandry practices. This finding is in concurrence with findings reported by Patel (1983).
CONCLUSION
It is concluded from the study that slightly more than three fourth (77.00 per cent) respondents had medium level of risk preference. Whereas 12.00 per cent had high and 10.50 per cent of them had low level of risk preference. It is also observed that there is a positive and highly significant relationship between the risk preference and overall extent of contribution of tribal farmwomen in agricultural operations whereas there is non-significant relationship between the risk preference and overall extent of contribution of tribal farmwomen in animal husbandry activities.
REFERENCES
Diwan, Y. B. (2000). Study on role performance of tribal farmwomen in adoption of maize production technology in Dahod district of Gujarat State. M.Sc. (Agri.) thesis (Unpub.), GAU, Anand
Gamit, S. S. (1993). A study of extent of adoption of recommended summer groundnut technology by the tribal farmers of Panchmahals district of Gujarat State. M. Sc. (Agri.) thesis (Unpub.), GAU. Sardar Krushinagar
Jullana, C. J.; Annamala, R. and Somsundram, S. (1991).

Guj. J. Ext. Edu. Vol. 27 : Issue 1 : December 2016
58
Adoption of integrated post management practices. Ind. J. Ext. Edu., 27 (3 & 4) : 23-27
Padhi, K. M. (1993). A study on the extent of adoption of recommended weedicide practices in transplanted Kharif rice by the rice growers in Kheda district of Gujarat state. M. Sc. (Agri.) thesis (Unpub.), GAU, Anand
Patel, G. J. (1983). Training needs of trained and untrained women in relation to animal husbandry practices in Mehsana Taluka of Gujarat state. M. Sc. (Agri.) thesis (Unpub.), GAU, Anand
Patel, J. G. (1998). Indigenous resource management by tribal farmwomen in Vadodara district of Gujarat state. Ph. D. thesis (Unpub), GAU, Anand
Sarkar, A. and Bandyopadhyay, A. K. (1996). Adoption of scientific farm innovations in red and laterife zone of West Bengal. Agril. Extn. Review, 8 (4) : 19-21
Supe, S. V. (1969). Factors related to different degrees of rationality in decision making among farmers. Ph. D. thesis (Unpub.) IARI, New Delhi
Received : May 2016 : Accepted : August 2016
Guj. J. Ext. Edu. Vol. 27 : Issue 1 : December 2016
59
INTRODUCTION
Livestock sector is a prominent sector among agriculture and allied activities in India. It provides livelihood support to millions of small, marginal farmers and land less labors. Even after several years of planning, the picture in the area of quality of milk as well as productivity is not very encouraging. The animal owners are not aware about the importance of scientific animal husbandry practices and hence milk productivity is very low. In one hand, there are number of factors affecting the productivity as well as dairy development and another hand, the action of individual farmer is governed by social and economical as well as communicational i.e. extension factor.
Communication plays key role in development process. According Berlo (1960), the sole purpose of communication is to influence. People communicate to influence to effect with intent. He says that all communication behavior has its purpose, its goal, as production of response. Lass well (1948) described communication sequence as who says; what, to whom, when, in what manner, under what circumstances and with what effect. The dissemination of any improved technology depends on how best the information
regarding the particular technology is communicated. Today is the era of information explosion. Innumerable information is generated, synthesized and disseminated in each and every moment. Information technology has revolutionized the transfer of information through new ways, i.e., internet, e-mail etc. Information from any part of the world could be easily made available through information technology there by changing the world into global village. Therefore, farmers should be also equally privileged to get informed of farm related information without delay.
OBJECTIVE
To know the communication behavior of tribal dairy women in animal husbandry
METHODOLOGY
The present study was purposively conducted in Dahod district, which is operational area of Pashu Vigyan Kendra- Limkheda under the jurisdiction of Anand Agricultural University with ex-post facto research design. Five talukas viz. Devgadha Baria, Dahod, Limkheda, Garbada and Zalod were selected, from selected talukas two villages and form each village 10 tribal dairy women were selected
COMMUNICATION BEHAVIOR OF TRIBAL DAIRY WOMEN IN ANIMAL HUSBANDRY
G. N. Thorat1, S. G. Vahora2 and D. B. Ramjiyani3
1 Assistant Professor, Pashu Vigyan Kendra, AAU, Devgadh Baria - 389 3802 Associate Professor, Pashu Vigyan Kendra, AAU, Devgadh Baria - 389 380
3 Research Associate, Devgadh Baria -389 380 Email:[email protected]
ABSTRACT
Dahod has a large tribal population having agriculture and animal husbandry as major source of livelihood. The cows and buffaloes are major milk producing animals in the district. Many research studies have indicated that responsibilities of animal husbandry are almost completely shouldered by women. The present study was conducted on communication behavior of tribal dairy women in animal husbandry in Dahod district of Gujarat state. Study revealed that less than three-fifth (57.00 per cent) of the tribal dairy women made their contact with relatives and 45.00 per cent of them made contact with progressive farmers., Majority of the TDW had medium level of extension contact and extension participation. 37.00 per cent of the tribal dairy women participated in Krushimela while 24.00 per cent of respondents had participated in training programme related the animal husbandry.
Keywords: communication behavior, animal husbandry, tribal dairy women
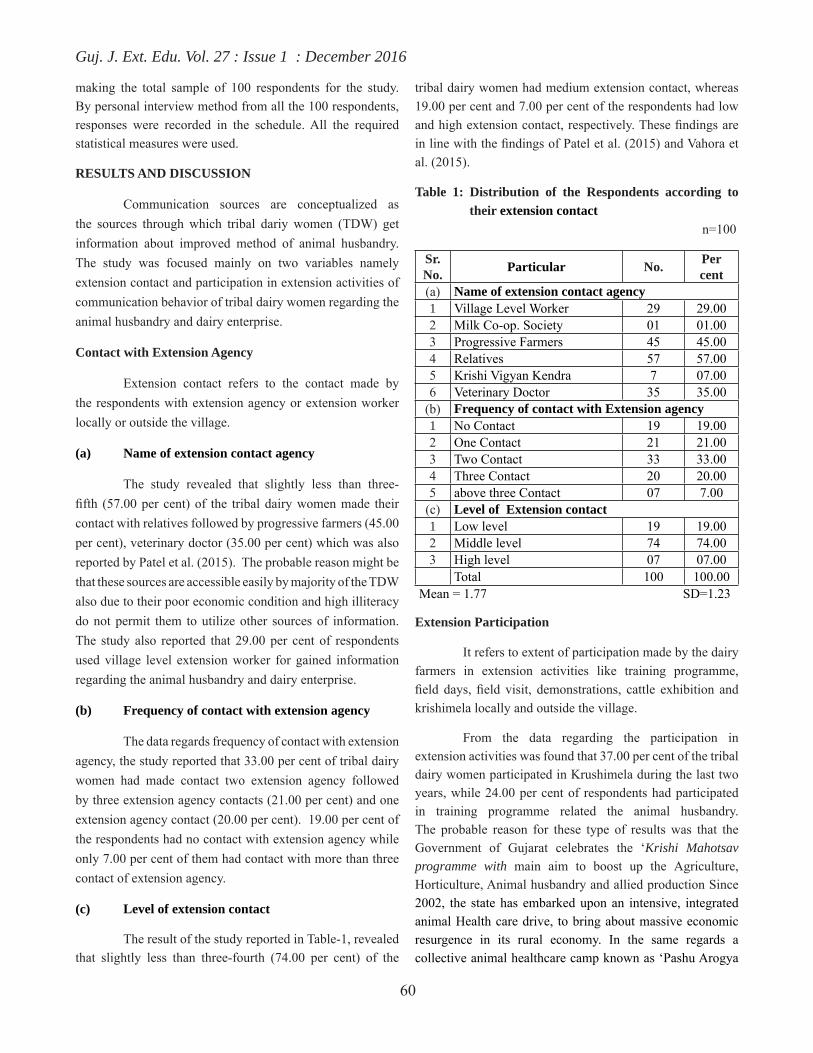
Guj. J. Ext. Edu. Vol. 27 : Issue 1 : December 2016
60
making the total sample of 100 respondents for the study. By personal interview method from all the 100 respondents, responses were recorded in the schedule. All the required statistical measures were used.
RESULTS AND DISCUSSION
Communication sources are conceptualized as the sources through which tribal dariy women (TDW) get information about improved method of animal husbandry. The study was focused mainly on two variables namely extension contact and participation in extension activities of communication behavior of tribal dairy women regarding the animal husbandry and dairy enterprise.
Contact with Extension Agency
Extension contact refers to the contact made by the respondents with extension agency or extension worker locally or outside the village.
(a) Name of extension contact agency
The study revealed that slightly less than three-fifth (57.00 per cent) of the tribal dairy women made their contact with relatives followed by progressive farmers (45.00 per cent), veterinary doctor (35.00 per cent) which was also reported by Patel et al. (2015). The probable reason might be that these sources are accessible easily by majority of the TDW also due to their poor economic condition and high illiteracy do not permit them to utilize other sources of information. The study also reported that 29.00 per cent of respondents used village level extension worker for gained information regarding the animal husbandry and dairy enterprise.
(b) Frequency of contact with extension agency
The data regards frequency of contact with extension agency, the study reported that 33.00 per cent of tribal dairy women had made contact two extension agency followed by three extension agency contacts (21.00 per cent) and one extension agency contact (20.00 per cent). 19.00 per cent of the respondents had no contact with extension agency while only 7.00 per cent of them had contact with more than three contact of extension agency.
(c) Level of extension contact
The result of the study reported in Table-1, revealed that slightly less than three-fourth (74.00 per cent) of the
tribal dairy women had medium extension contact, whereas 19.00 per cent and 7.00 per cent of the respondents had low and high extension contact, respectively. These findings are in line with the findings of Patel et al. (2015) and Vahora et al. (2015).
Table 1: Distribution of the Respondents according to their extension contact n=100
Sr. No. Particular No. Per
cent(a) Name of extension contact agency 1 Village Level Worker 29 29.002 Milk Co-op. Society 01 01.003 Progressive Farmers 45 45.004 Relatives 57 57.005 Krishi Vigyan Kendra 7 07.006 Veterinary Doctor 35 35.00
(b) Frequency of contact with Extension agency1 No Contact 19 19.002 One Contact 21 21.003 Two Contact 33 33.004 Three Contact 20 20.005 above three Contact 07 7.00
(c) Level of Extension contact1 Low level 19 19.002 Middle level 74 74.003 High level 07 07.00
Total 100 100.00Mean = 1.77 SD=1.23
Extension Participation
It refers to extent of participation made by the dairy farmers in extension activities like training programme, field days, field visit, demonstrations, cattle exhibition and krishimela locally and outside the village.
From the data regarding the participation in extension activities was found that 37.00 per cent of the tribal dairy women participated in Krushimela during the last two years, while 24.00 per cent of respondents had participated in training programme related the animal husbandry. The probable reason for these type of results was that the Government of Gujarat celebrates the ‘Krishi Mahotsav programme with main aim to boost up the Agriculture, Horticulture, Animal husbandry and allied production Since 2002, the state has embarked upon an intensive, integrated animal Health care drive, to bring about massive economic resurgence in its rural economy. In the same regards a collective animal healthcare camp known as ‘Pashu Arogya

Guj. J. Ext. Edu. Vol. 27 : Issue 1 : December 2016
61
Mela’ is conducted every year post monsoon. At this camp, specialized animal health care services, breeding facilities and extension activities are offered to rural livestock owners at their doorstep. Soni et al. (2014) reported in his study that the detail information regarding Animal Husbandry practices should be given to farmers during Krishi Mahotsav programme same was reported by Patel and Patel (2014).
Table 2: Distribution of the respondents according to their Participation in Extension activities n=100
Sr. No. Name of the Extension Activity No. Per cent
1 Participated in any Animal Husbandry training 24 24.00
2Demonstration was organized at farmers’ field by any extension agency during last two years
01 1.00
3Tribal Dairy women was visited any exhibitions during last two years.
15 15.00
4 Participated in Krushimela during last two years 37 37.00
5 Read farm information published in local news papers 02 02.00
6 Read any farm magazine 00 00.00
7 View any A.H. programme on Tele Vision 04 4.00
8 Listening A.H. Programme broadcasting on radio 01 1.00
It was also observed that 15.00 per cent tribal dairy women were was visited exhibitions during last two years followed by View any A.H. programme on Tele Vision (04.00 per cent ) and read farm information published in local news papers (0.2.00 per cent). Negligible percentage of Tribal dairy women participated in organizing the demonstration at their field as well as they were not read any farm magazine and not listened A.H. Programme broadcasting on radio. The finding is in conformity with those of Thakor and Waghmare (1992) and Patel (1995).
Level of Extension Participation
The data presented in Table 3, disclosed that more than fifty per cent (54.00 per cent) of the respondents had low level of extension participation while equal percentage (22. 00 per cent) of them had no participation and medium level of extension participation in extension activities. Only 2.00 per cent of the respondents had high level of extension participation. Same results was reported by Kavad et al.
(2015).
Table 3: Distribution of the Respondents according to their level of Extension Participation in n=100
Sr. No.
Category of Extension participation
No. Per cent
1 No participation (0 score) 22 22.002 Low participation (up to 2 score) 54 54.003 Medium participation
(3 to 4 score)22 22.00
4 High participation (above 4 score)
02 02.00
CONCLUSION
It can be concluded from the study that majority of the respondents’ contacted relatives and progressive farmers as well as two extension agency for gained information on animal husbandry. Further a study concluded that majority of the respondents had medium to low level of extension participation and extension contact. 37.00 per cent of the tribal dairy women participated in Krushimela, while 24.00 per cent of respondents had participated in training programme. Extension workers should concentrate to increase the level of knowledge, education and annual income for promotion of dairy technology. Subject matter specialists, veterinary doctors, extension officers should visit the village and guide them to solve the problem of the dairy farm women in accordance with resources availed with dairy.
REFERENCES
Berlo David, K. (1960). Process of communication, Holt Kinehart Winstion, New York
Kavad, S. D., Virdia, H. M. and Patel G. R. (2015).Adoption Status of Nagli Production Technologies in the Tribal District Dang of Gujarat. Guj. J. Ext. Edu. 26(1):10-13
Lasswell, H.D. (1948). The communication of ideas, institute of religious and social studies, New York
Patel, A. J. (1995). Transfer of agricultural technology among tribal farmers of I.T.D.P. Chhotaudepur, Dist. Vadodara. Ph. D. thesis (Unpub.), G.A.U., Anand.
Patel, J. R. and Patel, R.N. (2014). Opinon and Usefulness of Krishi Vigyan Kendra Perceived by Groundnut Growers. Guj. J. Ext. Edu. 25(2):212-214

Guj. J. Ext. Edu. Vol. 27 : Issue 1 : December 2016
62
Patel, M. R., Patel Bhavik and Patel Arun.(2015). Sources of Information Used by Tribal Farm Women and Relationship with Their Contribution in Agriculture and Animal Husbandry. Guj. J. Ext.Edu.26 (2):199-201
Patel, P. C., Patel, J. B. and Parmar, N. R. (2015) Dynamic Profile of the Tribal Livestock Owners and Their Attitude Towards Vaccination in Ruminants. Guj. J. of Ext. Edu., 26(2) : 173-177
Soni , A. N., Soni, D. N. and Patel, H. B. (2014).Opinion
of Farmers About Information of Animal Husbandry Practices Given During Krishi Mahotsav. Guj. J. Ext. Edu. 25(2):184-188
Thakkor, R. F. and Waghmare, S. K. (1992). Adoption of niger production technology by the tribal of Dangs. Guj. J. of Ext. Edu., 2 & 3: 84-86
Vahora, S. G., Thorat, G N. and Ramjiyani, Dweep (2015). Personal and Socio-Economic Characteristics of Livestock Keepers in Dahod District. Guj. J. of Ext. Edu., 26(2): 194-198
Received : July 2016 : Accepted : November 2016
Guj. J. Ext. Edu. Vol. 27 : Issue 1 : December 2016
63
INTRODUCTION
The Indian agrochemicals market is highly fragmented in nature with over 800 formulators. The competition is fierce with large number of organized sector players and significant share of spurious pesticides. The market has been witnessing mergers and acquisitions with large players buying out small manufacturers. Exports currently constitute almost 50.00 per cent of Indian crop protection industry and are expected to grow at a CAGR of 16.00 per cent to reach USD 4.2 billion by FY 2019, resulting in 60.00 per cent share in Indian crop protection industry. Domestic market on the other hand would grow at 8.00 per cent CAGR, as it is predominantly monsoon dependent, to reach USD 3.3 billion by FY 2019. Globally, India is fourth largest producer of crop protection chemicals, after United States, Japan and China. The crop protection companies in India can be categorized into three types –Multi-National, Indian including public sector companies and small sector units. According to the Pesticide Monitoring Unit, there are about 125 technical grade manufacturers, including about 10 multinationals, more than 800 formulators and over 145,000 distributors in India. More than 60 technical grade
pesticides are being manufactured indigenously. The market share of large players depends primarily on product portfolio and introduction of new molecules. Strategic alliances with competitors are common to reduce risks and serve a wider customer base.There are numerous companies which are engaged in production and marketing of agrochemicals in India which include multinational, national and some local companies. All are in effort to increase their market share in India. These companies produce various types of agrochemicals including pesticides such as insecticide, herbicide, rodenticides, fungicides etc. There are many constraints faced by farmers in purchase of agrochemicals. Hence, the present study entitled; “constraints faced by farmers in purchase of agrochemicals in vegetable crops “was planned.
OBJECTIVES
(1) To know the farmers awareness regarding agrochemicals in vegetable crops by farmers
(2) To know the constraints faced by farmers in purchase of agrochemicals
CONSTRAINTS FACED BY FARMERS IN PURCHASE OF AGROCHEMICALS IN VEGETABLE CROPS
V.V.Prajapati1, C.A.Gohil 2 and M.A.Tunvar3
1 Principal, Polytechnic in Agriculture, SDAU, Deesa - 385535 2&3 Assitant Professor, Polytechnic in Agriculture, SDAU, Deesa - 385535
E-mail : [email protected]
ABSTRACT
The Indian agrochemicals market is highly fragmented in nature with over 800 formulators. The competition is fierce with large number of organized sector players and significant share of spurious pesticides. The market has been witnessing mergers and acquisitions with large players buying out small manufacturers. The use of agrochemicals in vegetable crops are very essential part of cultivation of crops. The present study was conducted in Deesa and Dantiwada talukas of Banaskantha district of Gujarat. Total ten villages were selected based on consumption of agrochemicals. Further, 15 farmers from each village were selected on random basis. Thus, total 150 farmers were surveyed in present study. Majority of the farmers awareness about insecticides were medium to high but less awareness about other chemicals. Majority of the farmers spray insecticides at the time of pest attack. Most of the farmers preferred retailer shop to purchase agrochemicals. Knowledge of farmers towards agrochemicals was low to medium. The reasons behind selection of a particular brand by farmers due to its high effectiveness, easily availability in market and price. The main important constraints perceived by the vegetable growers in purchasing of agrochemicals where high price of agrochemicals, lack of technical knowledge ,poor quality of agrochemicals, lack of training and lack of finance.
Keywords: constraints, knowledge, agro chemicals
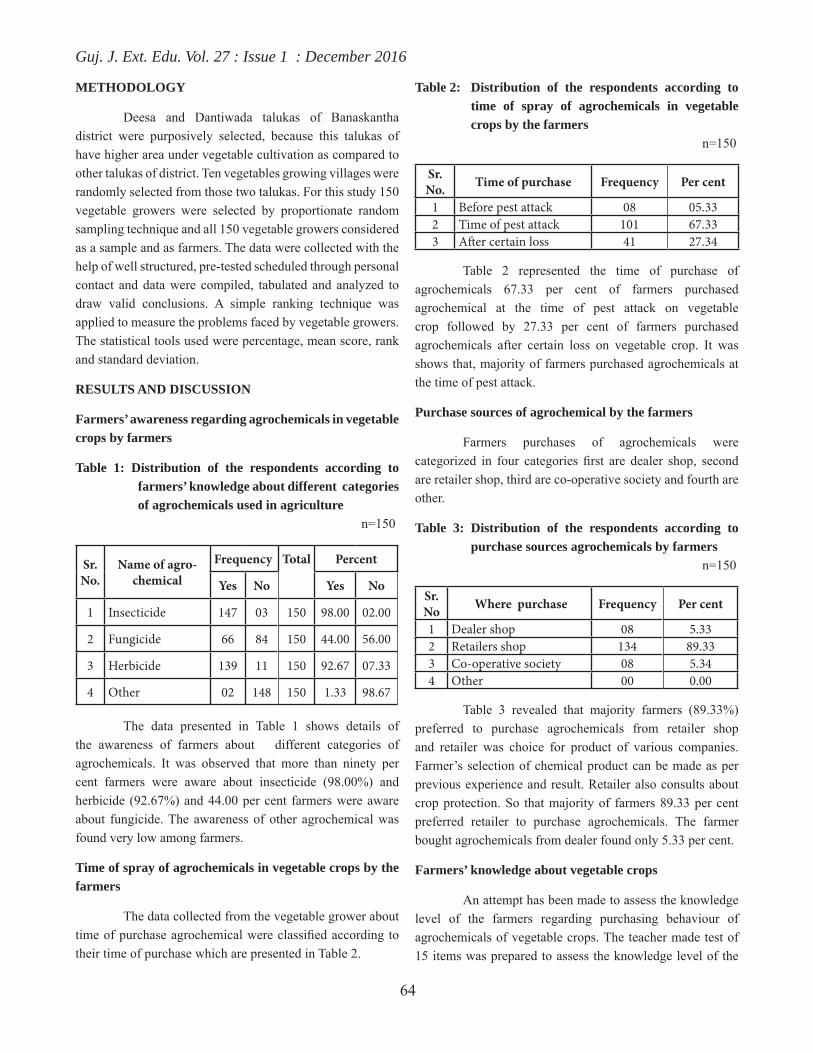
Guj. J. Ext. Edu. Vol. 27 : Issue 1 : December 2016
64
METHODOLOGY
Deesa and Dantiwada talukas of Banaskantha district were purposively selected, because this talukas of have higher area under vegetable cultivation as compared to other talukas of district. Ten vegetables growing villages were randomly selected from those two talukas. For this study 150 vegetable growers were selected by proportionate random sampling technique and all 150 vegetable growers considered as a sample and as farmers. The data were collected with the help of well structured, pre-tested scheduled through personal contact and data were compiled, tabulated and analyzed to draw valid conclusions. A simple ranking technique was applied to measure the problems faced by vegetable growers. The statistical tools used were percentage, mean score, rank and standard deviation.
RESULTS AND DISCUSSION
Farmers’ awareness regarding agrochemicals in vegetable crops by farmers
Table 1: Distribution of the respondents according to farmers’ knowledge about different categories of agrochemicals used in agriculture n=150
Sr. No.
Name of agro-chemical
Frequency Total Percent
Yes No Yes No
1 Insecticide 147 03 150 98.00 02.00
2 Fungicide 66 84 150 44.00 56.00
3 Herbicide 139 11 150 92.67 07.33
4 Other 02 148 150 1.33 98.67
The data presented in Table 1 shows details of the awareness of farmers about different categories of agrochemicals. It was observed that more than ninety per cent farmers were aware about insecticide (98.00%) and herbicide (92.67%) and 44.00 per cent farmers were aware about fungicide. The awareness of other agrochemical was found very low among farmers.
Time of spray of agrochemicals in vegetable crops by the farmers
The data collected from the vegetable grower about time of purchase agrochemical were classified according to their time of purchase which are presented in Table 2.
Table 2: Distribution of the respondents according to time of spray of agrochemicals in vegetable crops by the farmers n=150
Sr. No. Time of purchase Frequency Per cent
1 Before pest attack 08 05.332 Time of pest attack 101 67.333 After certain loss 41 27.34
Table 2 represented the time of purchase of agrochemicals 67.33 per cent of farmers purchased agrochemical at the time of pest attack on vegetable crop followed by 27.33 per cent of farmers purchased agrochemicals after certain loss on vegetable crop. It was shows that, majority of farmers purchased agrochemicals at the time of pest attack.
Purchase sources of agrochemical by the farmers
Farmers purchases of agrochemicals were categorized in four categories first are dealer shop, second are retailer shop, third are co-operative society and fourth are other.
Table 3: Distribution of the respondents according to purchase sources agrochemicals by farmers n=150
Sr. No Where purchase Frequency Per cent
1 Dealer shop 08 5.332 Retailers shop 134 89.333 Co-operative society 08 5.344 Other 00 0.00
Table 3 revealed that majority farmers (89.33%) preferred to purchase agrochemicals from retailer shop and retailer was choice for product of various companies. Farmer’s selection of chemical product can be made as per previous experience and result. Retailer also consults about crop protection. So that majority of farmers 89.33 per cent preferred retailer to purchase agrochemicals. The farmer bought agrochemicals from dealer found only 5.33 per cent.
Farmers’ knowledge about vegetable crops
An attempt has been made to assess the knowledge level of the farmers regarding purchasing behaviour of agrochemicals of vegetable crops. The teacher made test of 15 items was prepared to assess the knowledge level of the

Guj. J. Ext. Edu. Vol. 27 : Issue 1 : December 2016
65
farmers. The score of ‘one’ was assigned to correct answer and ‘zero’ to incorrect answer. Based on knowledge score attained, the index for each farmers was calculated. The farmers on the basis of knowledge index were classified in to three categories. The data in this regard presented in Table:
Table 4: Distribution of the farmers’ according to their knowledge about vegetable crops n=150
Sr. No Categories Frequency Percent
1 Low (up to 61.00 score) 43 28.672 Medium (between 62.00
to 75.00 score)97 64.67
3 High (above 75.00 score) 10 6.66Mean X=68.18 S.D.=7.42
It could be seen from the Table 4 that 64.67 per cent of the farmers had medium knowledge of purchasing behaviour of agrochemicals in vegetable crops. Whereas 28.67 per cent farmers had low level of knowledge. Only 6.66 per cent of the farmers were found having high level of knowledge about purchasing agrochemicals of vegetable crops.
Reasons behind selection of a particular brand by the farmers
Table 5: Distribution of the respondents according to reasons behind selection of a particular brand by the farmers n=150
Sr No Particular Frequency Per cent
Yes No Yes No1 High effectiveness 142 08 94.67 05.332 Easily availability in
market144 06 96.00 04.00
3 Price 139 11 92.67 07.334 Promotion activity 19 131 12.67 87.335 Other 06 144 04.00 96.00
It is found in Table 5 there majority of farmers (96.00%) select brand because easily availability in market followed by 94.67 per cent farmers select brand due to high effectiveness of crops and 92.67 per cent farmers select brand because price factor. Only 12.67 per cent select brand for promotion activity.
Constraints faced by farmers in purchase of agrochemicals
Farmers always faced problems about
agrochemicals, from the study following Constraints were identified.
Table 6: Distribution of the respondents according to constraints faced by farmers n=150
Sr. No
Factor Frequency Per cent Rank
1 Lack of technical knowledge
126 84.00 II
2 High price of agrochemicals
128 85.33 I
3 Lack of timely available 08 05.33 VII4 Residual effect on the
crop/next crop10 6.67 VI
5 Poor quality of agrochemicals
109 73.67 III
6 Lack of finance 65 43.33 V7 Lack of Training 107 71.33 IV8 Others 05 03.33 VIII
Data revealed in Table 6 that the main important constraints perceived by the vegetable growers in purchasing of agrochemicals where high price of agrochemicals (85.33%), lack of technical knowledge (84.00%), poor quality of agrochemicals(73.67%), lack of training(71.33%) and lack of finance(43.33%)The least important constraints faced by farmers were residual effect on (6.67%) and lack of timely available (5.33%).It can be concluded that high price of agrochemicals and lack technical knowledge were major important constraints faced by farmers.
CONCLUSION
Farmers were very conscious about purchasing agrochemicals for vegetables crops in Deesa and Dantiwada talukas. They preferred appropriate agrochemicals for particular crop. Farmers mostly demanded for the agrochemical which gives better results without spoiling the crops soil health as well as environment. Majority of the farmers awareness about insecticides were medium to high but less awareness about other chemicals. Majority of the farmers spray insecticides at the time of pest attack. Most of the farmers preferred retailer shop to purchase agrochemicals. Knowledge of farmers towards agrochemicals was low to medium. The reasons behind selection of a particular brand by farmers due to its high effectiveness, easily availability in market and price. The main important constraints perceived by the vegetable growers in purchasing of agrochemicals where high price of agrochemicals, lack of technical
Guj. J. Ext. Edu. Vol. 27 : Issue 1 : December 2016
66
knowledge ,poor quality of agrochemicals, lack of training and lack of finance.
REFERENCES
Chaudhary, M. L (2012). Pesticide using behaviour of paddy growers of Khambhat Taluka of Anand district of Gujarat state. M. Sc (Agri.) Thesis (unpublished), Anand Agricultural University, Anand
Chaudhary,M.R.and Kadam, A.L. (2000).Constraints in resources management of orange orchard. Agril.Extension Education Review.30-32.
Chauhan N. M. (2016) Constrains in Adoption of Export Oriented Okra Production Technology in Tapi Distract of South Gujarat. Society of Extension Education, Gujarat : 259
Chothe. G. D, and Borkar, M. M. (2000). Constraints faced by farmers in adoption of fertilizers. Maharashtra J. Extension Education. 19; 298-299
Maity, B, and Chatterjee, (2010). Assessing farmer awareness indices of modern inputs in India. European journal of social science, 14(3).
Pankaj Nishad and Hulas Pathak (2015). An analysis of market structure and farmers’ preferences of vegetable seed marketing in Raipur district of Chhattisgarh International Journal of Commerce and Business Management 2015 Vol. 8 No. (2) : 199-202
Raut, V. D, Deshpande, S. K. and Raut, D. D. (2012). Utility perception about skill demonstrated in training programme on IPM practices in cotton. Green farming. 3(2): 230-233
Received : August 2016 : Accepted : November 2016
Guj. J. Ext. Edu. Vol. 27 : Issue 1 : December 2016
67
INTRODUCTION
Cotton is one of the most important commercial fiber crops of India. The seed of cotton is a potential source of edible oil, cake and hull meal. It is also known as “King of Apparel Fiber” and “white gold”. Besides food and housing, clothing is one of the primary needs of human being Cotton is cultivated in about 60 countries of the world. India is having the largest area under cotton; its average productivity is only 520 kg per hectare as against the world average productivity of 650 kg per hectare. In India, cotton contributes about 85.00 per cent of the total fiber consumed in the textile industries. Gujarat is one of the major cotton producing states in the country. Gujarat state has second largest area under cotton after Maharashtra in India. Cotton is widely grown, particularly in all districts of Gujarat state. Gujarat has been the key contributor in cotton research in the country.
Bhavnagar and Amreli are the predominant cotton growing districts of South Saurashtra Agro-Climatic Zone of Gujarat State with 3044 ha. And 2356 ha with the average yield of 821 kg/ha. And 643 Kg/ha, during 2007-
08, respectively. The two districts are more concentrated with respect to area, production and average yield in South Saurashtra Agro-climatic Zone of Gujarat state.
On one hand, cotton crop gives high economic return to the farmers, while on the other hand, there are many risks involved in it. The cultivation of cotton also needs costly inputs in terms of seeds, fertilizers and pesticides if proper care is not taken, it proves as monetary uncertain business. It is also sensitive crop to many disease and pest. It is known as risky crop considering natural hazards, as well as the everyday fluctuating of wholesale price index. Crisis management is the systematic attempt to avoid personal or organization crisis or to manage those crisis events that do occur. The practice of crisis management involves attempts to eliminate technological failure to avoid or to manage crisis situations. Crisis management consists of skills and techniques required to assess, understand and cope with any serious situations, especially from the moment it first occurs to the point that recovery producer start. With respect of association between the adoption of crisis management practices and selected profile characteristics of cotton growers in Saurastra region.
ASSOCIATION BETWEEN THE ADOPTION OF CRISIS MANAGEMENT PRACTICES AND SELECTED PROFILE CHARACTERISTICS OF COTTON GROWERS
G.R.Gohil1and P.B.Raviya2,V.G.Barad3
1 Assistant Extension Educationist, DEE, JAU, Junagadh - 362001 2 P.G. Student, Department of Extension Education, J.A.U. Junagadh -362001
3 Assistant Extension Educationist, Sardar Smruti Kendra, JAU, Junagadh -362001Email : [email protected]
ABSTRACT
Cotton is widely grown in all the districts particularly in South Saurashtra Agro-Climatic Zone of Gujarat State. The study was carried out in Amreli and Bhavnagar District of South Saurashtra Agro-Climatic Zone. A random sample of 200 cotton growers was selected from Amreli and Bhavnagar District and the constraints faced by cotton growers in cotton cultivation were studied. Age and index of farm experience were negatively and significantly associated with the level of adoption of crisis management practices. The characteristics like education, social participation, irrigation index, yield level, management orientation, innovativeness, risk orientation and extension participation had positive and highly significant relationship with adoption level of respondents with respect to crisis management practices. There was a non -significant association of the adoption level of respondents with respect to crisis management practices with their size of land holding, irrigation index and cropping intensity.
Keywords: crisis management, adoption, saurashtra agro-climatic zone
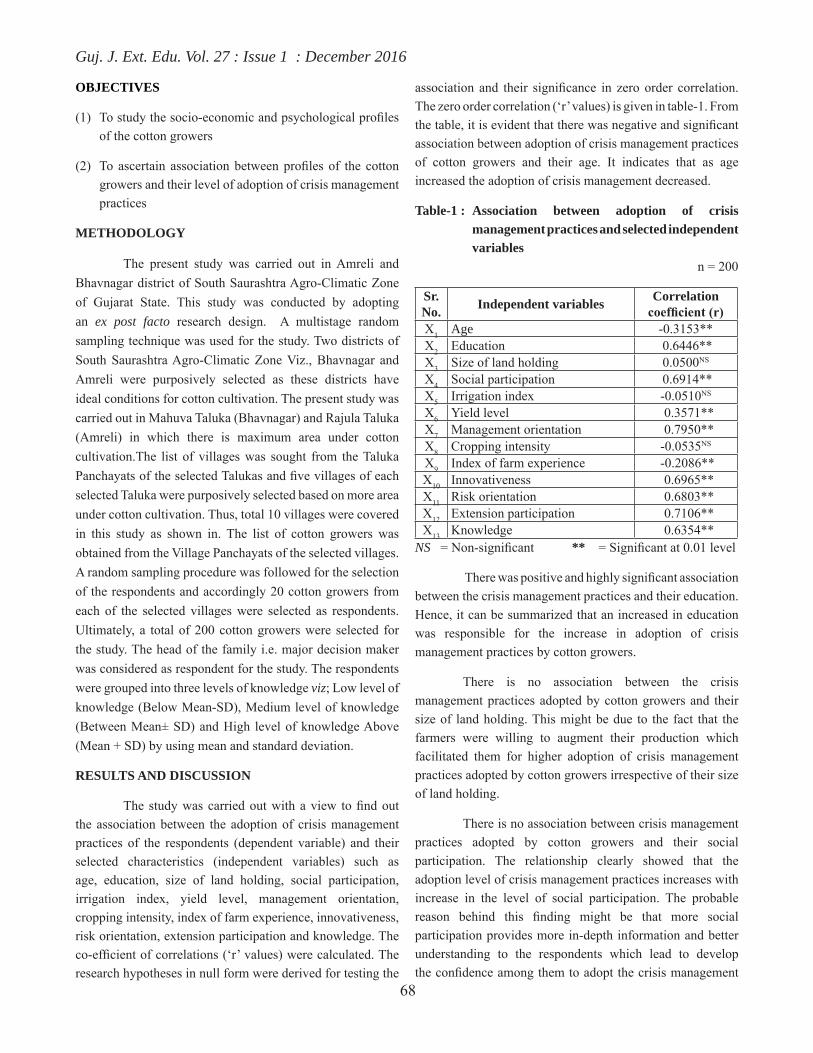
Guj. J. Ext. Edu. Vol. 27 : Issue 1 : December 2016
68
OBJECTIVES
(1) To study the socio-economic and psychological profiles of the cotton growers
(2) To ascertain association between profiles of the cotton growers and their level of adoption of crisis management practices
METHODOLOGY
The present study was carried out in Amreli and Bhavnagar district of South Saurashtra Agro-Climatic Zone of Gujarat State. This study was conducted by adopting an ex post facto research design. A multistage random sampling technique was used for the study. Two districts of South Saurashtra Agro-Climatic Zone Viz., Bhavnagar and Amreli were purposively selected as these districts have ideal conditions for cotton cultivation. The present study was carried out in Mahuva Taluka (Bhavnagar) and Rajula Taluka (Amreli) in which there is maximum area under cotton cultivation.The list of villages was sought from the Taluka Panchayats of the selected Talukas and five villages of each selected Taluka were purposively selected based on more area under cotton cultivation. Thus, total 10 villages were covered in this study as shown in. The list of cotton growers was obtained from the Village Panchayats of the selected villages. A random sampling procedure was followed for the selection of the respondents and accordingly 20 cotton growers from each of the selected villages were selected as respondents. Ultimately, a total of 200 cotton growers were selected for the study. The head of the family i.e. major decision maker was considered as respondent for the study. The respondents were grouped into three levels of knowledge viz; Low level of knowledge (Below Mean-SD), Medium level of knowledge (Between Mean± SD) and High level of knowledge Above (Mean + SD) by using mean and standard deviation.
RESULTS AND DISCUSSION
The study was carried out with a view to find out the association between the adoption of crisis management practices of the respondents (dependent variable) and their selected characteristics (independent variables) such as age, education, size of land holding, social participation, irrigation index, yield level, management orientation, cropping intensity, index of farm experience, innovativeness, risk orientation, extension participation and knowledge. The co-efficient of correlations (‘r’ values) were calculated. The research hypotheses in null form were derived for testing the
association and their significance in zero order correlation. The zero order correlation (‘r’ values) is given in table-1. From the table, it is evident that there was negative and significant association between adoption of crisis management practices of cotton growers and their age. It indicates that as age increased the adoption of crisis management decreased.
Table-1 : Association between adoption of crisis management practices and selected independent variables n = 200
Sr.No. Independent variables Correlation
coefficient (r)X1 Age -0.3153**X2 Education 0.6446**X3 Size of land holding 0.0500NS
X4 Social participation 0.6914**X5 Irrigation index -0.0510NS
X6 Yield level 0.3571**X7 Management orientation 0.7950**X8 Cropping intensity -0.0535NS
X9 Index of farm experience -0.2086**X10 Innovativeness 0.6965**X11 Risk orientation 0.6803**X12 Extension participation 0.7106**X13 Knowledge 0.6354**
NS = Non-significant ** = Significant at 0.01 level
There was positive and highly significant association between the crisis management practices and their education. Hence, it can be summarized that an increased in education was responsible for the increase in adoption of crisis management practices by cotton growers.
There is no association between the crisis management practices adopted by cotton growers and their size of land holding. This might be due to the fact that the farmers were willing to augment their production which facilitated them for higher adoption of crisis management practices adopted by cotton growers irrespective of their size of land holding.
There is no association between crisis management practices adopted by cotton growers and their social participation. The relationship clearly showed that the adoption level of crisis management practices increases with increase in the level of social participation. The probable reason behind this finding might be that more social participation provides more in-depth information and better understanding to the respondents which lead to develop the confidence among them to adopt the crisis management

Guj. J. Ext. Edu. Vol. 27 : Issue 1 : December 2016
69
practices.
There is no association between crisis management practices adopted by cotton growers and their irrigation index. The probable reason for this finding might be that majority of the respondents possessed the medium irrigation facility. Besides this, cropping system is largely depends upon the precipitation through the south-west monsoon.
There is no association between the crisis management practices adopted by cotton growers and their yield level of cotton crop. It indicated that the adoption of crisis management practices by cotton growers was highly associated with their yield level. The relationship clearly indicated that the adoption level of crisis management practices increases with increase of yield level and vice versa.
There is no association between the crisis management practices of the cotton growers and their management orientation. This indicated that the extent of crisis management practices and management orientation were dependent on each other. The direction of association was positive and highly significant which indicated that with increase in management orientation of the respondents, the adoption of crisis management practices was also increased.
There is no association between the crisis management practices adopted by cotton growers and their cropping intensity.
There is no association between the adoption of crisis management practices of the cotton growers and their index of farm experience. This indicated that the extent of crisis management practices and index of farm experience were dependent on each other. The direction of association was negative and significant which indicated that with increase in farm experience of the respondents, the adoption of crisis management practices was decreased.
There is no association between crisis management practices adopted by cotton growers and their innovativeness. The relationship clearly indicated that the adoption level of crisis management practices increases with increase in the level of innovativeness.
There is no association between the risk orientation of the respondents and their adoption of crisis management practices of cotton crop. It indicated that with increases in risk bearing ability there was increases in adoption of crisis management practices. The probable reason for this finding
might be that the area under study is rainfeld. Under such situation the risk is evitable, it had developed risk capacities among respondents which resulted higher adoption of crisis management practices.
There is no association between the crisis management practices adopted by cotton growers and their extension participation. The direction of association was positive indicated that with increase in extension participation the adoption of crisis management practices was increased.
CONCLUSION
The age and index of farm experience were negatively and significantly associated with the adoption level of cotton growers with respect to crisis management practices. The relationship was highly significant. The characteristics like education, social participation, yield level, management orientation, innovativeness, risk orientation, extension participation and knowledge had positive and highly significant relationship with adoption level of cotton growers with respect to crisis management practices. The non-significant association of adoption level of cotton growers was observed in case of size of land holding, irrigation index and cropping intensity.
REFERENCES
Chavda, D. A. (2005). Knowledge of Bt. Cotton growers about distinctive features of Bt. cotton. M.Sc. (Agri.) Thesis (Unpublished), Junagadh Agricultural University, Junagadh
Christian, B. M. (2001). A study on extent of adoption of IPM strategy by cotton growers of Vadodra district of Gujarat State. M.Sc. (Agri.) Thesis (Unpublished), Gujarat Agricultural University, Sardar Krushinagar
Joshi, P. J. (2004). Extent of knowledge and adoption of cotton growers about modern practices of cotton in Bhal area of Gujarat state, Ph.D. Thesis (Unpublished), Gujarat Agricultural University, Sardar Krushinagar
Zala, P.K. (2008). Crisis management practices adopted in con cultivation by the farmers of Kheda district of Gujarat state Ph.D. Thesis (Unpublished), Anand Agricultural University, Anand
Received : July 2016 : Accepted : October 2016
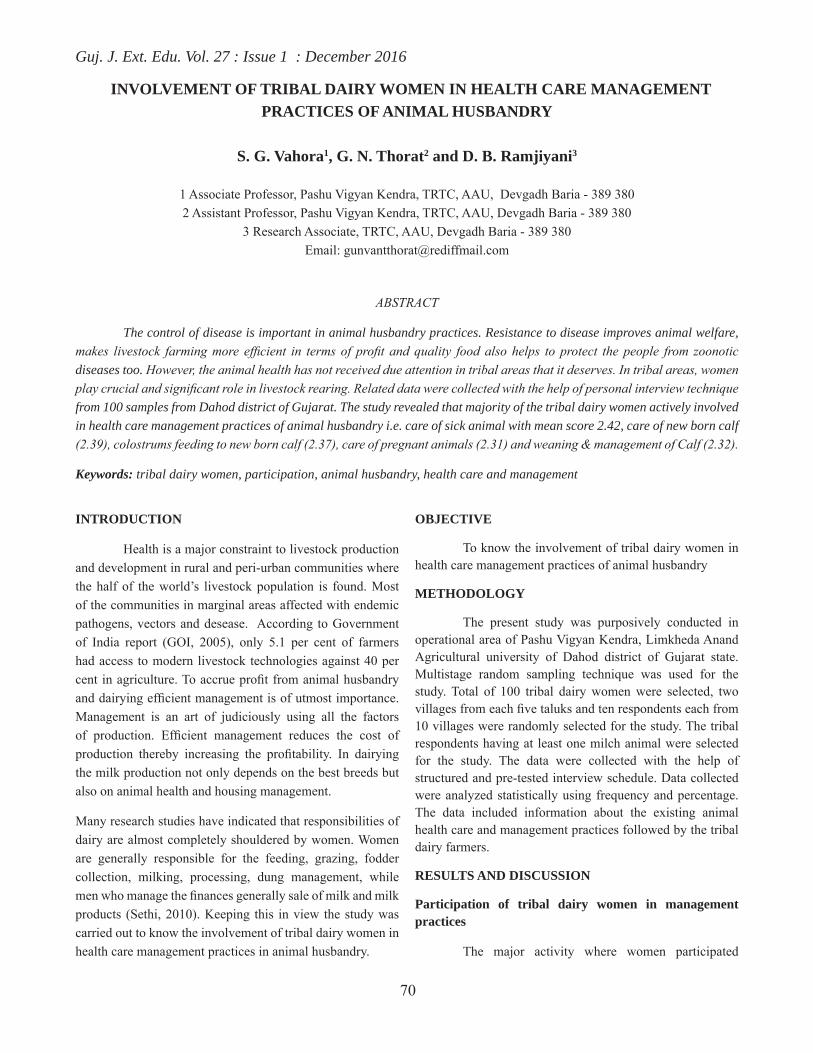
Guj. J. Ext. Edu. Vol. 27 : Issue 1 : December 2016
70
INTRODUCTION
Health is a major constraint to livestock production and development in rural and peri-urban communities where the half of the world’s livestock population is found. Most of the communities in marginal areas affected with endemic pathogens, vectors and desease. According to Government of India report (GOI, 2005), only 5.1 per cent of farmers had access to modern livestock technologies against 40 per cent in agriculture. To accrue profit from animal husbandry and dairying efficient management is of utmost importance. Management is an art of judiciously using all the factors of production. Efficient management reduces the cost of production thereby increasing the profitability. In dairying the milk production not only depends on the best breeds but also on animal health and housing management.
Many research studies have indicated that responsibilities of dairy are almost completely shouldered by women. Women are generally responsible for the feeding, grazing, fodder collection, milking, processing, dung management, while men who manage the finances generally sale of milk and milk products (Sethi, 2010). Keeping this in view the study was carried out to know the involvement of tribal dairy women in health care management practices in animal husbandry.
OBJECTIVE
To know the involvement of tribal dairy women in health care management practices of animal husbandry
METHODOLOGY
The present study was purposively conducted in operational area of Pashu Vigyan Kendra, Limkheda Anand Agricultural university of Dahod district of Gujarat state. Multistage random sampling technique was used for the study. Total of 100 tribal dairy women were selected, two villages from each five taluks and ten respondents each from 10 villages were randomly selected for the study. The tribal respondents having at least one milch animal were selected for the study. The data were collected with the help of structured and pre-tested interview schedule. Data collected were analyzed statistically using frequency and percentage. The data included information about the existing animal health care and management practices followed by the tribal dairy farmers.
RESULTS AND DISCUSSION
Participation of tribal dairy women in management practices
The major activity where women participated
INVOLVEMENT OF TRIBAL DAIRY WOMEN IN HEALTH CARE MANAGEMENT PRACTICES OF ANIMAL HUSBANDRY
S. G. Vahora1, G. N. Thorat2 and D. B. Ramjiyani3
1 Associate Professor, Pashu Vigyan Kendra, TRTC, AAU, Devgadh Baria - 389 3802 Assistant Professor, Pashu Vigyan Kendra, TRTC, AAU, Devgadh Baria - 389 380
3 Research Associate, TRTC, AAU, Devgadh Baria - 389 380Email: [email protected]
ABSTRACT
The control of disease is important in animal husbandry practices. Resistance to disease improves animal welfare, makes livestock farming more efficient in terms of profit and quality food also helps to protect the people from zoonotic diseases too. However, the animal health has not received due attention in tribal areas that it deserves. In tribal areas, women play crucial and significant role in livestock rearing. Related data were collected with the help of personal interview technique from 100 samples from Dahod district of Gujarat. The study revealed that majority of the tribal dairy women actively involved in health care management practices of animal husbandry i.e. care of sick animal with mean score 2.42, care of new born calf (2.39), colostrums feeding to new born calf (2.37), care of pregnant animals (2.31) and weaning & management of Calf (2.32).
Keywords: tribal dairy women, participation, animal husbandry, health care and management

Guj. J. Ext. Edu. Vol. 27 : Issue 1 : December 2016
71
actively was management of livestock. The data in Table-1, pertaining to participation for cleaning of animal shed reveal that equally percentage (41.00 per cent) of dairy women fell under ‘fully participated’ as well as ‘participated’ group and 18.00 per cent of them fell under ‘not participated at all’ group.
Data in Table 1, regarding participation of dairy women for disposal of dung revealed that 35.00 per cent of the them were categorized under ‘fully participated’ group followed by 33.00 per cent and 32 per cent with ‘not participated’ and ‘participated’ group, respectively. Cow dung cake preparations were also one of the dairy farming practices studied. This activity was specially done for the fuel purpose. Here in this activity, only 5.00 per cent of dairy women were participated fully while, more than 50.00 per cent women could not participate and 39.00 per cent women were only participated at ll.
As far as washing and grooming of animals is concerned, nearly half (48.00 per cent) of the dairy women fell under ‘participated’ category followed by “fully participated’ and “not participated”.
Data in Table1, regarding participation of dairy
women in cleaning of utensils revealed that majority (56.00 per cent) of the dairy women were found in the category ‘not participated’ and remaining 36.00 per cent were participated and only 8.00 per cent were fully participated in cleaning of utensils of animals. Similarly Rathod et al. (2011) observed the respondents majorly participated in milking of animals followed by their involvement in cleaning of milking utensils.
With regard to milking activity, it was observed that 47.00 per cent of tribal dairy women had fully participated, whereas 46.00 per cent with ‘participated’ and 7.00 per cent with ‘no participated’ group.
Dairy women are also taking good care of their new born calf. 47.00 per cent and 45 per cent of dairy women were found having ‘fully participation’ and participation in this activity, respectively. Only 8.00 per cent women had no participation in caretaking of new born calf.
It could be seen from the data presented in Table-1 that 48.00 per cent tribal farm women were found fully participated in colostrum feeding to new born calf followed by 41.00 per cent with participation and 11.00 per cent with no participation in colostrum feeding to new born calf.
Table 1: Distribution of the dairy women according to their participation in management practices n=100
Sr. No. Management Practices Fully participated Participated Not at all Total
scoreMean Score Rank
1 Cleaning of animal shed 41(41.00)
41(41.00)
18 (18.00) 223 2.23 V
2 Disposal of dung 35(35.00)
32(32.00)
33(33.00) 202 2.02 VI
3 Preparing cow dung cake 05(5.00)
39(39.00)
56(56.00) 149 1.49 IX
4 Washing & Grooming of animals 40(40.00)
48(48.00)
12(12.00) 228 2.28 IV
5 Cleaning of Utensils 08(8.00)
36(36.00)
56(56.00) 152 1.52 VIII
6 Milking 18(18.00)
28(28.00)
54(54.00) 164 1.64 VII
7 Care of new born calf 47(47.00)
45(45.00)
08(8.00) 239 2.39 I
8 Colostrum feeding to new born calf
48(48.00)
41(41.00)
11(11.00) 237 2.37 II
9 Weaning & management of Calf 47(47.00)
38(38.00)
15(15.00) 232 2.32 III
10 Maintaining of farm & Dairy records
1(1.00)
18(18.00)
81(81.00) 120 1.20 XI
11 Culling of uneconomic animals 12(12.00)
20(20.00)
68(68.00) 144 1.44 X
Note : Figures in parenthesis indicate percentage
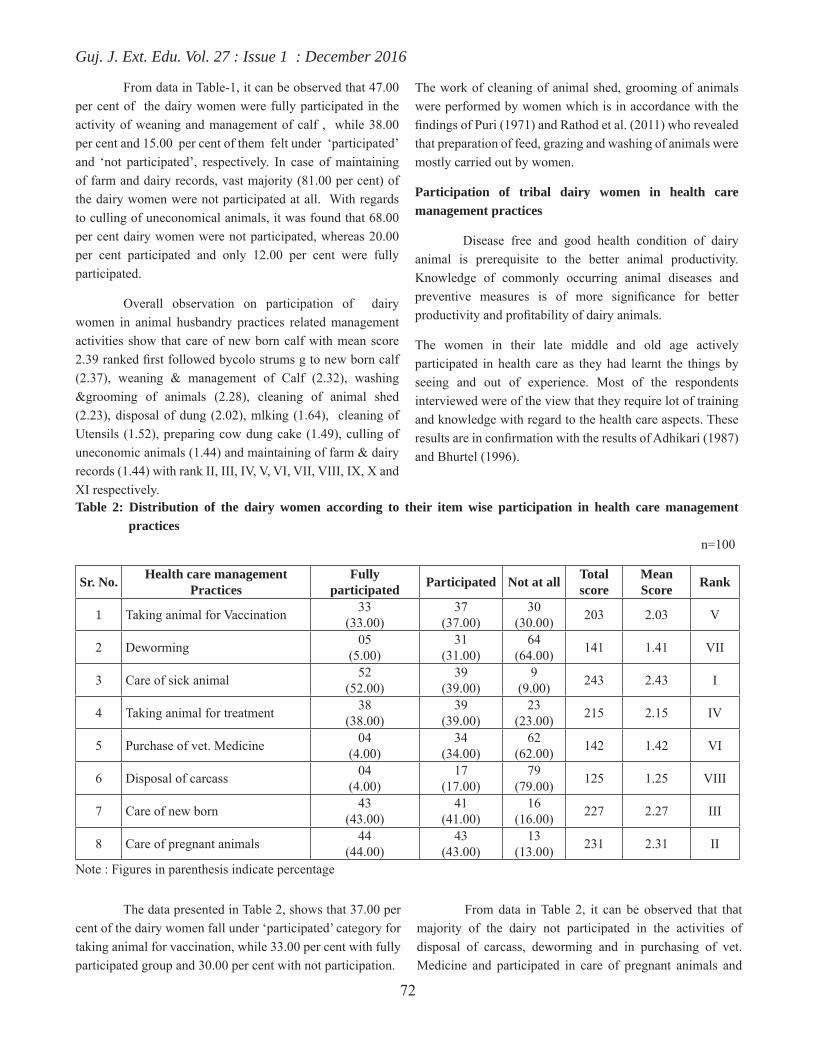
Guj. J. Ext. Edu. Vol. 27 : Issue 1 : December 2016
72
From data in Table-1, it can be observed that 47.00 per cent of the dairy women were fully participated in the activity of weaning and management of calf , while 38.00 per cent and 15.00 per cent of them felt under ‘participated’ and ‘not participated’, respectively. In case of maintaining of farm and dairy records, vast majority (81.00 per cent) of the dairy women were not participated at all. With regards to culling of uneconomical animals, it was found that 68.00 per cent dairy women were not participated, whereas 20.00 per cent participated and only 12.00 per cent were fully participated.
Overall observation on participation of dairy women in animal husbandry practices related management activities show that care of new born calf with mean score 2.39 ranked first followed bycolo strums g to new born calf (2.37), weaning & management of Calf (2.32), washing &grooming of animals (2.28), cleaning of animal shed (2.23), disposal of dung (2.02), mlking (1.64), cleaning of Utensils (1.52), preparing cow dung cake (1.49), culling of uneconomic animals (1.44) and maintaining of farm & dairy records (1.44) with rank II, III, IV, V, VI, VII, VIII, IX, X and XI respectively.
The work of cleaning of animal shed, grooming of animals were performed by women which is in accordance with the findings of Puri (1971) and Rathod et al. (2011) who revealed that preparation of feed, grazing and washing of animals were mostly carried out by women.
Participation of tribal dairy women in health care management practices
Disease free and good health condition of dairy animal is prerequisite to the better animal productivity. Knowledge of commonly occurring animal diseases and preventive measures is of more significance for better productivity and profitability of dairy animals.
The women in their late middle and old age actively participated in health care as they had learnt the things by seeing and out of experience. Most of the respondents interviewed were of the view that they require lot of training and knowledge with regard to the health care aspects. These results are in confirmation with the results of Adhikari (1987) and Bhurtel (1996).
Table 2: Distribution of the dairy women according to their item wise participation in health care management practices n=100
Sr. No. Health care management Practices
Fully participated Participated Not at all Total
scoreMean Score Rank
1 Taking animal for Vaccination 33(33.00)
37(37.00)
30(30.00) 203 2.03 V
2 Deworming 05(5.00)
31(31.00)
64(64.00) 141 1.41 VII
3 Care of sick animal 52(52.00)
39(39.00)
9(9.00) 243 2.43 I
4 Taking animal for treatment 38(38.00)
39(39.00)
23(23.00) 215 2.15 IV
5 Purchase of vet. Medicine 04(4.00)
34(34.00)
62(62.00) 142 1.42 VI
6 Disposal of carcass 04(4.00)
17(17.00)
79(79.00) 125 1.25 VIII
7 Care of new born 43(43.00)
41(41.00)
16(16.00) 227 2.27 III
8 Care of pregnant animals 44(44.00)
43(43.00)
13(13.00) 231 2.31 II
Note : Figures in parenthesis indicate percentage
The data presented in Table 2, shows that 37.00 per cent of the dairy women fall under ‘participated’ category for taking animal for vaccination, while 33.00 per cent with fully participated group and 30.00 per cent with not participation.
From data in Table 2, it can be observed that that majority of the dairy not participated in the activities of disposal of carcass, deworming and in purchasing of vet. Medicine and participated in care of pregnant animals and

Guj. J. Ext. Edu. Vol. 27 : Issue 1 : December 2016
73
new born.
Rathod et al. (2011) reported in his study that 91.66 per cent rural women were engaged in health care of pregnant animals followed by 89.16 per cent respondents looked after new born or young calves and care of sick animals (86.66%).
Item wise participation related to health care hierarchy, Care of sick animal rank first with mean score 2.43 followed by care of pregnant animals (2.31), care of new born (2.27),taking animal for treatment (2.15), taking animal for vaccination (2.03), purchase of vet. medicine (1.42), deworming (1.41) and disposal of carcass (1.25) with rank II, III, IV, V, VI,VII and VIII , respectively.
The findings are in conformity with the findings of Rangnekar et al. (1992) and similar findings were also reported by Tripathi and Bhanja (2000) and Toppo et al. (2004).
CONCLUSION
It can be concluded from the above study that participation of dairy women in related to management activities, it was found that majority of dairy women were participated care of new born calf, weaning & management of Calf, washing & grooming of animals, cleaning of animal shed and disposal of dung were major areas of training. Looking to the various aspects of health care hierarchy, care of sick animal, care of pregnant animals, care of new born , taking animal for treatment and taking animal for vaccination were area where dairy women actively participated.
As dairy women were participated in dairy and animal husbandry enterprise, the extension functionary may organize specialized training programmes especially for tribal dairy women in the area of health care management practices. Various research and extension agencies have to collaborate and create effective region based strategies to involve tribal dairy women in general and health care management technologies. Further, Tribal dairy women should establish a valid veterinarian/client/patient relationship with a licensed veterinarian to assist them in providing proper health care to
their herd.
REFERENCES
Adhikari (1987). Economic analysis of women labour involvement in crop and livestock farming at Nukawet district, Nepal. M.Sc Thesis (unpub.), B.S.U Phillippines
Bhurtel, R. (1996). Women’s participation in rural poultry development. XX World’s Poultry Congress, New Delhi, 2 – 5 Sept 1996 : 413-417
Government of India (2005). Situation assessment survey of farmers: Access to modern technology for farming, NSSO 59th round, January-December 2003. National Sample Survey Organization, Ministry of Statistics and Programme Implementation, GOI
Rangnekar, S. D., P. Bunyavejchewin (ed.), S. Sangdid (ed.) and K. Hangsanet (1992) Women in livestock production in rural India. Animal production and rural development. Proceedings of the Sixth AAAP Animal Sci Congress. 271-285
Rathod, P. K., Nikam, T. R., Landge, S., Vajreshwari, S. and Hatey, A. (2011). Participation of rural women in dairy farming in Karnataka. Ind. Res. J. Ext. Edu. 11(2): 31-36
Sethi, N. (2010).Factors affecting adoption of scientific technologies by dairy women in buffaloes. Proc. of International Buffalo Conference, Vol. II, 1-4 Feb, New Delhi : 166-67
Toppo, A., Trivedi, M. S. and Patel Ashok (2004).Participation of farm women in dairy occupation. Gujarat J. Ext. Edu. Anand., 15 (2) : 15-21
Tripathi, H and Bhanja. (2000).Women’s role in small holder production. Proceeding of the international conferrence on small holder production system in developing countries held in Thissur : 550-556
Received : August 2016 : Accepted : November 2016

Guj. J. Ext. Edu. Vol. 27 : Issue 1 : December 2016
74
INTRODUCTION
Chickpea is of the important and premier pulse crop cultivated and widely consumed in India. It is occupying 8.56 million hectares area and contributing 39 per cent (7.35 million tonnes) to the total production of pulse in the country (Meena et al., 2012 and Singh et al., 2013). The major chickpea producing states are Madhya Pradesh, Uttar Pradesh, Haryana, Gujarat, Rajasthan, Maharastra, Andhra Pradesh, Kamataka, Bihar, Chattishgarh, and West Bangal. In Gujarat, chickpea occupies an area of 2.15 lakh hectares with a production of 2.10 lakh tones with an average productivity of 977 kg/ha, accounts for 2.46% and 2.80% area and production of country, respectively (Singh, 2010). Chickpea is cultivated in the entire Panchmahal district and the area comes under semi arid condition. The low productivity can be attributed to several factors i.e. quality seed, growing methods and adaption of appropriate plant protection measures. By conducting survey, farmer’s interaction and field diagnostics, it was observed that one of the important factors for low productivity of chickpea was attributed to infestation by pod borer, Helicoverpa armiger Hubner which causes both quantitative and qualitative loss. The yield loss in chickpea due to pod borer was 10-60 per cent in normal weather conditions (Bhatt and Patel, 2001). On an average, 30-40 per cent pods
were found to be damaged by this pest and an average of 400 kg/ha grain was lost by the borer. In favourable condition, pod damage goes up to 90-95 per cent (Shengal and Ujagir, 1990). So far, use of chemical pesticides has been the major approach for controlling this pest in different crops in lndia and in most of the developing countries. Chemical control is one of the effective and quicker methods in reducing pest population, where farmer obtains spectacular results within a short period. However, over reliance and indiscriminate use of pesticides for longer periods resulted in a series of problems, mainly risk of environmental contamination, loss of biodiversity which contributed to the development of insecticide resistant H. armigera population, resurgence, out breaks of the secondary pests into primary pest status, destruction of natural enemies, increase in inputs on chemicals and toxicological hazards due to pesticide residue etc., The use of excessive and un-recommended pesticides to manage the menace is in vogue with the farmers. In IPM practices, Installation of pheromone traps with Helicoverpa armigera lures @ 40 traps/ ha and spray of neem oil @ 0.5% have been recommended for management of chickpea pod borer. In view of the above factors, on farm trials were undertaken in a systematic manner on farmers’ field to evaluate and demonstrate performance of integrated pest management (IPM) packages against chickpea pod borer for enhancing
EVALUATION AND DEMONSTRATION OF BIORATIONAL-BASED INTEGRATED PEST MANAGEMENT PACKAGE AGAINST POD BORER,
HELICOVERPA ARMIGERA HUBNER INFESTING CHICKPEA
Shakti Khajuria1, A.K.Rai2 and Kanak Lata3
1&2 SMS, (ICAR-CIAH), KVK-Panchmahal, Vejalpur, Godhra-389340 3 Head, (ICAR-CIAH), KVK-Panchmahal, Vejalpur, Godhra-389340
Email : [email protected]
ABSTRACT
Chickpea, (Cicer arietinum L.) is an important pulse crop world-wide. There are many constraints in the production of the crop, of which pod borer, Helicoverpa armigera Hubner is the notorious one which causes both quantitative and qualitative loss. Therefore, an on farm trial was conducted during rabi 2011-12 to 2013-14 to evaluate different biorational based IPM packages viz., IPM package 1 (P1) = Installation of pheromone traps with Helicoverpa armigera lures @ 40 traps/ ha. ; IPM package 2 (P2) =P1+ spray neem oil @ 0.5 % on the appearance of first instar larvae. Results indicated that the IPM package (P2) revealed the best performance reducing 76.18% pod damage over control and provided significantly the highest yield (1,933 kg/ha). Consequently, the highest benefit cost ratio (BCR) (1.97) was also recorded from this package. Hence, installation of pheromone traps and spraying of neem oil may be recommended for effective management of pod borer attacking chickpea.
Keywords: chickpea pod borer, pheromone traps, neem oil, IPM

Guj. J. Ext. Edu. Vol. 27 : Issue 1 : December 2016
75
production and productivity of chickpea.
METHODOLOGY
The present study was carried out by Krishi Vigyan Kendra-Panchmahal (Gujarat) during rabi season from 2011-2014 (3 years) under on farm testing activity in farmers field of six villages of three talukas of Panchmahal district. In total 36 OFTs in 6 ha area in different locations were conducted. Following IPM packages were compared:
IPM package 1 (P1): Installation of pheromone traps with Helicoverpa armigera lures @ 40 traps/ ha. The traps were installed one month after sowing and at one feet height above the crop canopy covering the whole field uniformly. The lures were changed after every 3 weeks.
IPM package 2 (P2): P1+ spray neem oil @ 0.5 % on the appearance of first instar larvae. Conventional farmf-ers’ practices (P3): No recommended pod borer management practices and untreated control.
These treatments were imposed in farmers’ fields. All recommended agronomical practices were followed to raise healthy crop. Pheromone traps with lures of H. armig-era were installed in the field at 30 days after sowing (DAS) @ 40 traps/ ha maintaining equal distance among the traps. The pheromone traps were placed just above the crop cano-py by means of bamboo support. The traps were kept in the chickpea field throughout the cropping season.
Spray neem oil @ 0.5 % was done twice at an inter-val of 7 days starting from pod formation stage. At maturity, all the pods were collected from 10 randomly selected plants from middle rows of each plot and examined. The damaged (bored) and total numbers of pods were counted and the per cent pod damage was determined using the following formug-la: % Pod damage = Number of damaged pods/ Total number of pods x 100. The grain yield obtained from each field was also recorded. Moreover, benefit cost ratios of different IPM packages were also calculated. Catch of adult H. armigera moths were also recorded fortnightly from each pheromone trap.
Statistical analysis
The data collected were transformed into angular values as per the standard requisites. The experiments were subjected to statistical scrutiny and the means were compared
with Least Significant Difference (L.S.D.) (Gomez and Go -mez,1984).
RESULTS AND DISCUSSION
The infested pods ranged from 8.24 to 34.60 % and differed significantly among the treatments (Table 1). The lowest pod borer damage (8.24%) was attained from IPM package 2 (P2) (pheromone trapping + spray neem oil @ 0.5 %) followed by IPM package 1 (P1) (pheromone trapping). However, the highest pod borer damage was found in un-treated control plots. Fortnightly catch of adult Helicoverpa armigera moths by pheromone trap was 3.68/trap, which contributed in bringing down pod infestation. The pod borer damage reduction over control by different IPM packages ranged from 18.50% to 76.18%. The highest pod damage re1-duction over control was observed in P2 and the lowest in farmer’s practiced field.
Table 1 : Effect of different management packages on pod borer damage in chickpea during Rabi 2011-12 to 2013-14 (Pooled data of three years)
TreatmentsPod damage
(%)Damage reduction over control (%)
P1= Pheromone traps
17.68 (24.79) 48.90
P2 = Pheromone traps + neem oil spray
8.24 (16.65) 76.18
P3=Farmers prac-tice 28.20 (32.04)
18.50
Untreated control 34.60 (36.02) 0S.E± (0.62)
CV (3.94)
LSD(5%) (2.19) * Figures in parenthesis are transformed angular values; * Significant at 5%
This result were in accordance with the findings of Mahmudunnabi et al., (2013) who reported that the lowest pod damage was observed in pheromone traps + bio-pesticide sprayed plots. Pod damage reduction by pheromone traps and bio-pesticides over untreated control ranged from 32.12 to 68.20%. Prabu (2009) and Dong and Zhao (1996) noted that neem oil has repellent, antifeedent, stomach and contact poison properties as well as inhibits growth of many insects and effective against several insect pests which are partly in agreement with the present findings.
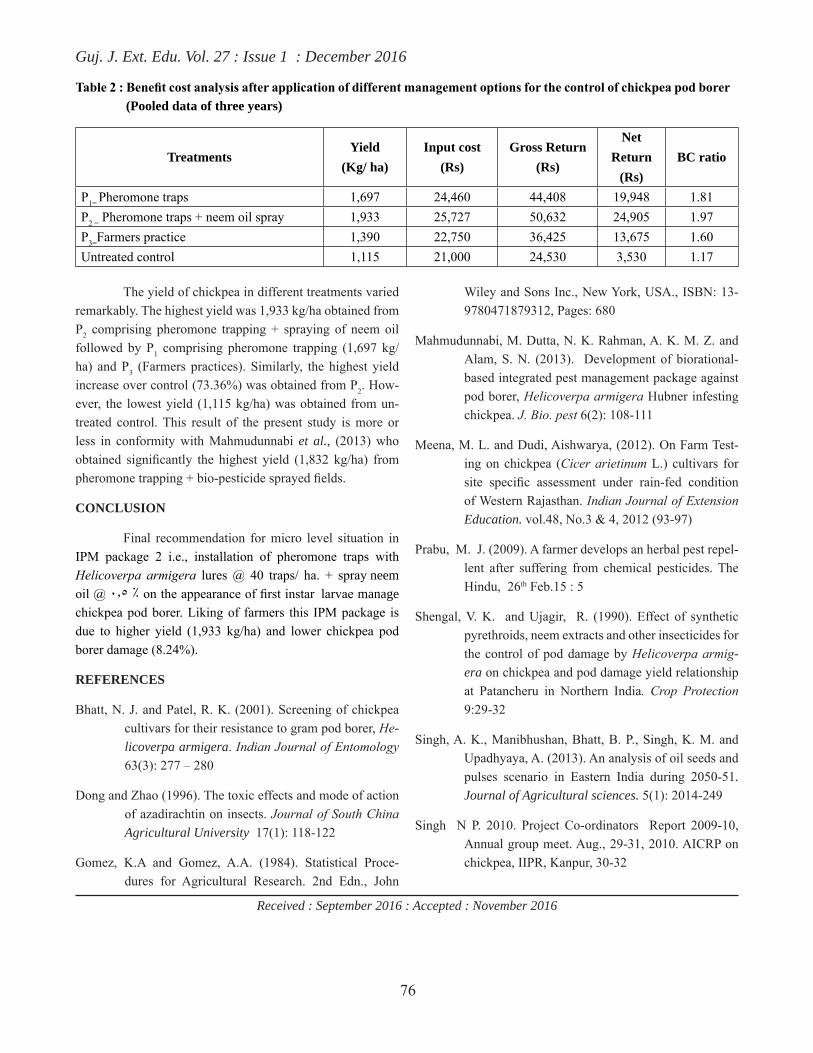
Guj. J. Ext. Edu. Vol. 27 : Issue 1 : December 2016
76
The yield of chickpea in different treatments varied remarkably. The highest yield was 1,933 kg/ha obtained from P2 comprising pheromone trapping + spraying of neem oil followed by P1 comprising pheromone trapping (1,697 kg/ha) and P3 (Farmers practices). Similarly, the highest yield increase over control (73.36%) was obtained from P2. How-ever, the lowest yield (1,115 kg/ha) was obtained from un-treated control. This result of the present study is more or less in conformity with Mahmudunnabi et al., (2013) who obtained significantly the highest yield (1,832 kg/ha) from pheromone trapping + bio-pesticide sprayed fields.
CONCLUSION
Final recommendation for micro level situation in IPM package 2 i.e., installation of pheromone traps with Helicoverpa armigera lures @ 40 traps/ ha. + spray neem oil @ 0.5 % on the appearance of first instar larvae manage chickpea pod borer. Liking of farmers this IPM package is due to higher yield (1,933 kg/ha) and lower chickpea pod borer damage (8.24%).
REFERENCES
Bhatt, N. J. and Patel, R. K. (2001). Screening of chickpea cultivars for their resistance to gram pod borer, He-licoverpa armigera. Indian Journal of Entomology 63(3): 277 – 280
Dong and Zhao (1996). The toxic effects and mode of action of azadirachtin on insects. Journal of South China Agricultural University 17(1): 118-122
Gomez, K.A and Gomez, A.A. (1984). Statistical Proce-dures for Agricultural Research. 2nd Edn., John
Wiley and Sons Inc., New York, USA., ISBN: 13-9780471879312, Pages: 680
Mahmudunnabi, M. Dutta, N. K. Rahman, A. K. M. Z. and Alam, S. N. (2013). Development of biorational-based integrated pest management package against pod borer, Helicoverpa armigera Hubner infesting chickpea. J. Bio. pest 6(2): 108-111
Meena, M. L. and Dudi, Aishwarya, (2012). On Farm Test-ing on chickpea (Cicer arietinum L.) cultivars for site specific assessment under rain-fed condition of Western Rajasthan. Indian Journal of Extension Education. vol.48, No.3 & 4, 2012 (93-97)
Prabu, M. J. (2009). A farmer develops an herbal pest repel-lent after suffering from chemical pesticides. The Hindu, 26th Feb.15 : 5
Shengal, V. K. and Ujagir, R. (1990). Effect of synthetic pyrethroids, neem extracts and other insecticides for the control of pod damage by Helicoverpa armig-era on chickpea and pod damage yield relationship at Patancheru in Northern India. Crop Protection 9:29-32
Singh, A. K., Manibhushan, Bhatt, B. P., Singh, K. M. and Upadhyaya, A. (2013). An analysis of oil seeds and pulses scenario in Eastern India during 2050-51. Journal of Agricultural sciences. 5(1): 2014-249
Singh N P. 2010. Project Co-ordinators Report 2009-10, Annual group meet. Aug., 29-31, 2010. AICRP on chickpea, IIPR, Kanpur, 30-32
Table 2 : Benefit cost analysis after application of different management options for the control of chickpea pod borer (Pooled data of three years)
TreatmentsYield
(Kg/ ha)Input cost
(Rs)Gross Return
(Rs)
Net Return
(Rs)BC ratio
P1= Pheromone traps 1,697 24,460 44,408 19,948 1.81P2 = Pheromone traps + neem oil spray 1,933 25,727 50,632 24,905 1.97P3=Farmers practice 1,390 22,750 36,425 13,675 1.60Untreated control 1,115 21,000 24,530 3,530 1.17
Received : September 2016 : Accepted : November 2016
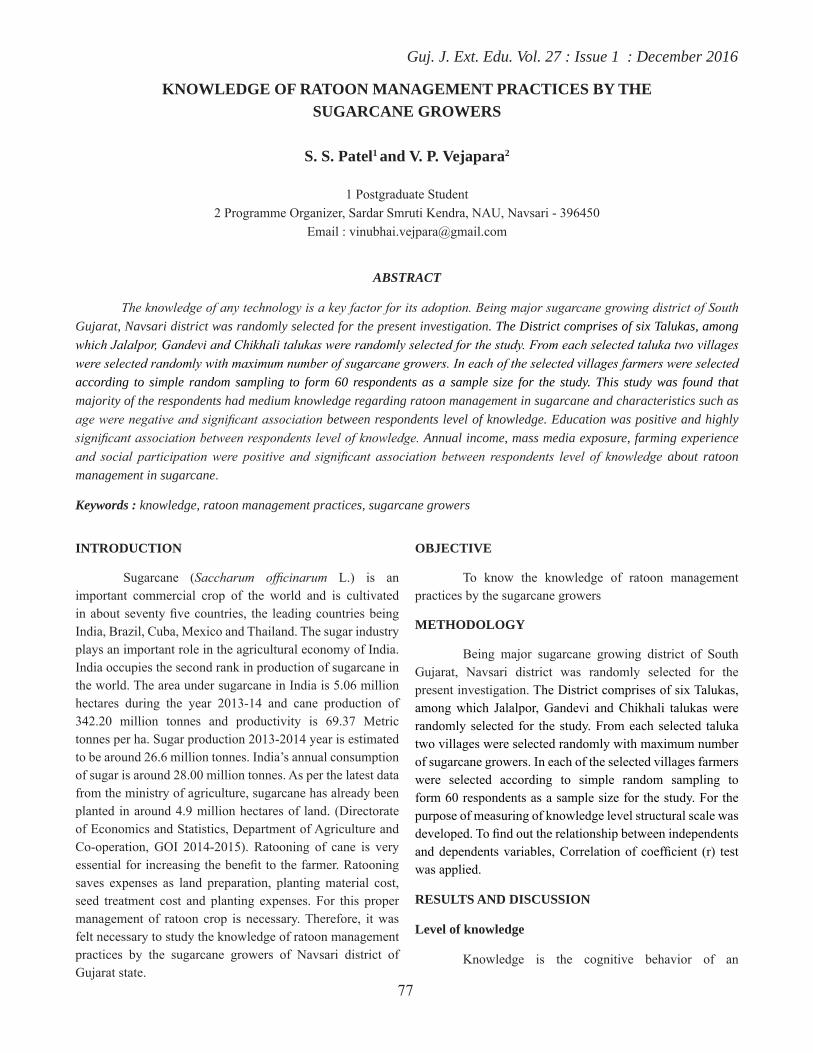
Guj. J. Ext. Edu. Vol. 27 : Issue 1 : December 2016
77
INTRODUCTION
Sugarcane (Saccharum officinarum L.) is an important commercial crop of the world and is cultivated in about seventy five countries, the leading countries being India, Brazil, Cuba, Mexico and Thailand. The sugar industry plays an important role in the agricultural economy of India. India occupies the second rank in production of sugarcane in the world. The area under sugarcane in India is 5.06 million hectares during the year 2013-14 and cane production of 342.20 million tonnes and productivity is 69.37 Metric tonnes per ha. Sugar production 2013-2014 year is estimated to be around 26.6 million tonnes. India’s annual consumption of sugar is around 28.00 million tonnes. As per the latest data from the ministry of agriculture, sugarcane has already been planted in around 4.9 million hectares of land. (Directorate of Economics and Statistics, Department of Agriculture and Co-operation, GOI 2014-2015). Ratooning of cane is very essential for increasing the benefit to the farmer. Ratooning saves expenses as land preparation, planting material cost, seed treatment cost and planting expenses. For this proper management of ratoon crop is necessary. Therefore, it was felt necessary to study the knowledge of ratoon management practices by the sugarcane growers of Navsari district of Gujarat state.
OBJECTIVE
To know the knowledge of ratoon management practices by the sugarcane growers
METHODOLOGY
Being major sugarcane growing district of South Gujarat, Navsari district was randomly selected for the present investigation. The District comprises of six Talukas, among which Jalalpor, Gandevi and Chikhali talukas were randomly selected for the study. From each selected taluka two villages were selected randomly with maximum number of sugarcane growers. In each of the selected villages farmers were selected according to simple random sampling to form 60 respondents as a sample size for the study. For the purpose of measuring of knowledge level structural scale was developed. To find out the relationship between independents and dependents variables, Correlation of coefficient (r) test was applied.
RESULTS AND DISCUSSION
Level of knowledge
Knowledge is the cognitive behavior of an
KNOWLEDGE OF RATOON MANAGEMENT PRACTICES BY THE SUGARCANE GROWERS
S. S. Patel1 and V. P. Vejapara2
1 Postgraduate Student2 Programme Organizer, Sardar Smruti Kendra, NAU, Navsari - 396450
Email : [email protected]
ABSTRACT
The knowledge of any technology is a key factor for its adoption. Being major sugarcane growing district of South Gujarat, Navsari district was randomly selected for the present investigation. The District comprises of six Talukas, among which Jalalpor, Gandevi and Chikhali talukas were randomly selected for the study. From each selected taluka two villages were selected randomly with maximum number of sugarcane growers. In each of the selected villages farmers were selected according to simple random sampling to form 60 respondents as a sample size for the study. This study was found that majority of the respondents had medium knowledge regarding ratoon management in sugarcane and characteristics such as age were negative and significant association between respondents level of knowledge. Education was positive and highly significant association between respondents level of knowledge. Annual income, mass media exposure, farming experience and social participation were positive and significant association between respondents level of knowledge about ratoon management in sugarcane.
Keywords : knowledge, ratoon management practices, sugarcane growers
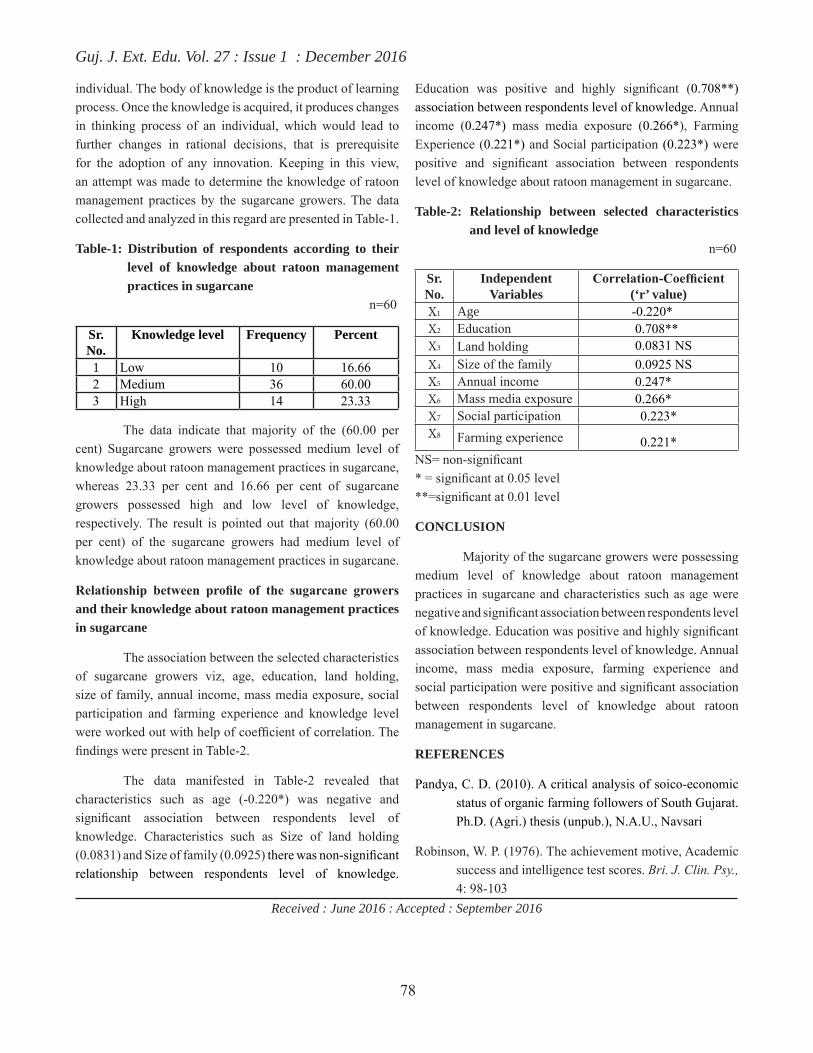
Guj. J. Ext. Edu. Vol. 27 : Issue 1 : December 2016
78
individual. The body of knowledge is the product of learning process. Once the knowledge is acquired, it produces changes in thinking process of an individual, which would lead to further changes in rational decisions, that is prerequisite for the adoption of any innovation. Keeping in this view, an attempt was made to determine the knowledge of ratoon management practices by the sugarcane growers. The data collected and analyzed in this regard are presented in Table-1.
Table-1: Distribution of respondents according to their level of knowledge about ratoon management practices in sugarcane n=60
Sr. No.
Knowledge level Frequency Percent
1 Low 10 16.662 Medium 36 60.003 High 14 23.33
The data indicate that majority of the (60.00 per cent) Sugarcane growers were possessed medium level of knowledge about ratoon management practices in sugarcane, whereas 23.33 per cent and 16.66 per cent of sugarcane growers possessed high and low level of knowledge, respectively. The result is pointed out that majority (60.00 per cent) of the sugarcane growers had medium level of knowledge about ratoon management practices in sugarcane.
Relationship between profile of the sugarcane growers and their knowledge about ratoon management practices in sugarcane
The association between the selected characteristics of sugarcane growers viz, age, education, land holding, size of family, annual income, mass media exposure, social participation and farming experience and knowledge level were worked out with help of coefficient of correlation. The findings were present in Table-2.
The data manifested in Table-2 revealed that characteristics such as age (-0.220*) was negative and significant association between respondents level of knowledge. Characteristics such as Size of land holding (0.0831) and Size of family (0.0925) there was non-significant relationship between respondents level of knowledge.
Education was positive and highly significant (0.708**) association between respondents level of knowledge. Annual income (0.247*) mass media exposure (0.266*), Farming Experience (0.221*) and Social participation (0.223*) were positive and significant association between respondents level of knowledge about ratoon management in sugarcane.
Table-2: Relationship between selected characteristics and level of knowledge n=60
Sr. No.
Independent Variables
Correlation-Coefficient (‘r’ value)
X1 Age -0.220*X2 Education 0.708**X3 Land holding 0.0831 NSX4 Size of the family 0.0925 NSX5 Annual income 0.247*X6 Mass media exposure 0.266*X7 Social participation 0.223*X8 Farming experience 0.221*
NS= non-significant * = significant at 0.05 level **=significant at 0.01 level
CONCLUSION
Majority of the sugarcane growers were possessing medium level of knowledge about ratoon management practices in sugarcane and characteristics such as age were negative and significant association between respondents level of knowledge. Education was positive and highly significant association between respondents level of knowledge. Annual income, mass media exposure, farming experience and social participation were positive and significant association between respondents level of knowledge about ratoon management in sugarcane.
REFERENCES
Pandya, C. D. (2010). A critical analysis of soico-economic status of organic farming followers of South Gujarat. Ph.D. (Agri.) thesis (unpub.), N.A.U., Navsari
Robinson, W. P. (1976). The achievement motive, Academic success and intelligence test scores. Bri. J. Clin. Psy., 4: 98-103
Received : June 2016 : Accepted : September 2016
Guj. J. Ext. Edu. Vol. 27 : Issue 1 : December 2016
79
INTRODUCTION
Tapi is a tribal dominated district with poor economic condition of farmers. Majority of tribal farm women of this area have lack of knowledge about health and nutrition, dietary pattern for pregnant & lactating women and supplementary feeding for children. In addition to that, due to poor economic condition, they are unable to purchase fruits, vegetables and other foodstuff from market for their daily dietary need which is resulted in poor health and imbalance nutritional status of family. Many of children of this area have poor nutritional and health status i.e. malnutrition. In addition to milk, children need other nutrients for their optimum growth and development. Protein is one of the most important nutrient required for better growth and development of children. It forms the important component of muscle, other tissues and vital body fluids like blood. Protein as antibodies helps the body to defend against infection. Therefore, KVK, NAU, Tapi has conducted FLD with specific objective to study the feeding of low cost high protein rich food (POSHAK AAHAR) to malnourished rural tribal children and evaluated its effect on the growth of children.
METHODOLOGY
To know the impact of front line demonstration on feeding of low cost high protein rich food (Poshak aahar) to malnourished rural tribal children
METHODOLOGY
The best quality of protein is the one, which provides essential amino acid pattern very close to the pattern of tissue proteins. e.g. egg protein, human milk protein etc. But plant proteins are of poor quality since essential amino acid composition is not balanced. e.g. cereal proteins are poor in amino acid lysine while pulses & oilseed proteins are rich in lysine but they are poor in sulfur containing amino acid. Thus, deficiency of amino acid in one can be made good by an adequate level in another, if both are consumed together. Therefore, a combination of cereals & pulses in the ratio of 3:1 has been found to give an optimum combination (Recommended by WHO). Hence, keeping all these factors in mind KVK, NAU, Tapi has designed and developed low cost high protein rich food (POSHAK AAHAR) for rural tribal children to prevent malnutrition. Detail of preparation
IMPACT OF FRONT LINE DEMONSTRATION ON FEEDING OF LOW COST HIGH PROTEIN RICH FOOD (POSHAK AAHAR) TO MALNOURISHED RURAL TRIBAL
CHILDREN
Arti N. Soni1, C.D.Pandya2 and D.N.Soni3
1 SMS (Home Science), KVK, NAU, Vyara - 394650 2 Programme Co-ordinator, KVK, NAU, Vyara -394650 3 SMS (Home Science), KVK, NAU, Navsari - 396450
Email : [email protected]
ABSTRACT
In Tapi district, many of children of this area have poor nutritional and health status i.e. malnutrition. Majority of tribal farm women of this area have lack of knowledge about health and nutrition, dietary pattern for pregnant & lactating women and supplementary feeding for children. In addition to milk, children need other nutrients for their optimum growth and development. Protein is one of the most important nutrient required for better growth and development of children. Therefore, KVK, NAU, Tapi has conducted FLD on ‘Feeding of low cost high protein rich food (POSHAK AAHAR) to malnourished rural tribal children of 1 to 3 years of age and evaluated its effect on the growth of children compared to control group. The data indicated that percent weight gain in the demonstration group was 8.54% as compared to control group was 3.65% i.e. less than half of gain in weight of the demonstration group. Thus, it could be concluded that low cost high protein rich food(POSHAK AAHAR) prepared by KVK, Tapi is acceptable and could be useful in growth and development of children and prevent malnutrition problem.
Keywords : malnutrition, supplementary feeding, protein rich food, front line demonstration

Guj. J. Ext. Edu. Vol. 27 : Issue 1 : December 2016
80
of POSHAK AAHAR from locally available food material is presented in Table 1.
Table 1: Preparation of POSHAK AAHAR (mixture of cereals & pulses, ratio 3:1) with nutrient composition n=100
Sr. No.
Ingredients Amount (gm)
NutrientsProtein
(gm)Energy (K.cal)
Calcium (mg)
1 Wheat flour 25.0 3.03 85.25 12.002 Jowar flour
(Sorghum)25.0 2.60 87.25 06.25
3 Rice flour 25.0 1.70 86.25 02.504 Soybean
flour12.5 5.40 54.00 30.00
5 Bengal gram flour
12.5 2.81 46.50 07.00
(Source: Nutritive value of Indian foods by C. Gopalan & et.al, National Institute of Nutrition, ICMR, Hyderabad)
The present study was conducted in adopted villages of Tapi district. The village namely Ghodchit, Vanskui,
Aamalgundi, Degama and Bhadbhunja were selected purposively. To assess the growth promoting effect of low cost high protein rich diet (POSHAK AAHAR), 20 malnourished rural tribal children of 1 to 3 years of age were selected from AANGANVADIES of one village in each year during 2010-11 to 2014-15 (Five years) and divided into two groups. One group were fed POSHAK AAHAR 100 to 150 gm per day per child with existing traditional dietary pattern for four months period and another group as control with traditional dietary pattern. KVK, Tapi has organized FLD training for rural tribal mothers of malnourished children. In FLD training, various low cost nutritious recipes were prepared from POSHAK AAHAR like Paustic mix, Sukhadi, Bhakhari, Thepla, Muthia, Dhokla, Handawa etc. The malnourished rural tribal children were weighed at the beginning of feeding trial and were repeated after every month (30 days) until the end of the experiment i.e. four months period. The data were analyzed with simple statistic tools like Mean and percentage.
RESULTS AND DISCUSSION
The data regarding the study were analyzed and presented in the following Table 2.
Table 2: Average weight gain of malnourished tribal children after feeding of POSHAK AAHAR compared to control group after four months n=100
Year Village and Block GroupNo. of
malnourished tribal children
Average body weight (Kg) Weight
gain (kg)
Percent weight gainBefore
FLDAfter FLD
2010-11 Ghodchit (Songadh) Demonstration 10 7.900 8.880 0.980 12.40Control 10 8.300 8.750 0.450 5.42
2011-12 Vanskui (Vyara) Demonstration 10 8.710 9.500 0.790 9.07Control 10 9.020 9.400 0.380 4.21
2012-13 Aamalgundi (Songadh) Demonstration 10 7.970 8.700 0.730 9.15Control 10 8.290 8.540 0.250 3.01
2013-14 Degama (Valod) Demonstration 10 8.660 9.090 0.430 4.96Control 10 9.730 9.940 0.210 2.15
2014-15 Bhadbhunja (Uchchhal) Demonstration 10 8.910 9.580 0.670 7.51Control 10 8.510 8.820 0.310 3.64
Five years Adopted villages Demonstration 50 8.430 9.150 0.720 8.54Control 50 8.770 9.090 0.320 3.65
Weight gain is the parameter used to assess the effect of low cost high protein rich food on the body of malnourished rural tribal children. Therefore, initial and final weights of malnourished children were recorded and from this data gain in weight and percent gain in weight were calculated. The data portrayed in Table 2 indicated that the demonstration group fed low cost high protein rich food (POSHAK AAHAR)
and control group fed traditional food for four months period showed an average initial body weight was 8.430 kg and 8.770 kg respectively while after conducting FLD, an average final body weight of malnourished children was 9.150 kg and 9.090 kg respectively. Therefore, the demonstration group and control group of tribal malnourished children showed an average weight gain of 0.720 kg and 0.320 kg respectively.

Guj. J. Ext. Edu. Vol. 27 : Issue 1 : December 2016
81
Percent weight gain in the demonstration group was 8.54% as compared to control group was 3.65% i.e. less than half of gain in weight of the demonstration group.
Feedback of Mothers
• POSHAK AAHAR is good in taste therefore children are eating this food one to two times in a day. So that weight of children is increased and ultimately weakness of children is decreased.
• POSHAK AAHAR is cheaper and easily available at home.
• Recipes of POSHAK AAHAR can be prepared as per taste required.
CONCLUSION
From the above results and discussions, it could be concluded that low cost high protein rich food(POSHAK AAHAR) prepared by KVK, NAU, Vyara, Dist.Tapi is acceptable and could be useful in growth and development of children and prevent malnutrition problem. The beneficial effect of POSHAK AAHAR indicates that it can be successfully incorporated in rural community programmes like MAHILA SHIBIR, Health camp, Health awareness programmes, In-service training for AANGANVADI workers and health workers, Method demonstration and other community based extension activities for promoting health and nutritional
status of children as well as rural community.
REFERENCES
Gopalan C., Ramasastri B.V. and Balasubramanian revised by Narasinga B.S., Deosthale Y.G. and Pant K.C. (1999) Nutritive value of Indian foods. National Institute of Nutrition, ICMR, Hyderabad: 2-5, 47-48, 94
Kamaliya K.B. and Mishra R.K. (2015) Evaluation of community Balwadi children growth rate as effected by feeding the protein rich biscuit. Guj. J. Ext. Edu. 26(1): 47-50
Kulkarni S.D. (2005) Soy based food entrepreneurship development. Central Institute of Agricultural Engineering, Bhopal: 1-10
Mistry J.J., Viho K.J. and Patel G.J. (2015) Impact of Front Line Demonstrations on maize. Guj. J. Ext. Edu. 26(1): 18-20
Singh R., Singh G. and Chauhan G.S. (1996) Effect of incorporation of defatted soya flour on the quality of biscuits. J. Food Sci. Tech. 33(4): 355-357
Tiwari R.B., Singh V. and Parihar P. (2003) Role of Front Line Demonstration in transfer of gram production technology. Maha. J. Ext. Edu. 22(1): 19-20
Received : August 2016 : Accepted : October 2016
Guj. J. Ext. Edu. Vol. 27 : Issue 1 : December 2016
82
INTRODUCTION
Entrepreneurship is increasingly recognized as an important driver of economic growth, productivity, innovation and employment, and it is widely accepted as a key aspect of economic dynamism. Institutions and individuals promoting rural development now see entrepreneurship as a strategic development intervention that could accelerate the rural development process. It is abundantly clear that entrepreneurship is important for economic growth, productivity, innovation and employment, and many countries have made entrepreneurship explicit policy priority. Entrepreneurial activities have been recognized as an important element in organizational and economic development, performance and wealth creation. Entrepreneurship in rural areas can benefit a lot from the so called strategic development alliances, i.e., partnership among governments or nonprofit seeking organizations, universities and the private sector. Successful entrepreneurship is hard work carried out in an unpredictable environment. Encouraging and motivating entrepreneurs in rural areas is not an easy proposition.
However, to the real entrepreneur looking on the dark side of the situation is fatal. Optimism is the heart and soul of the entrepreneur. While strategic planning, feasibility and market studies and analysis are necessary parts of new business start-ups, very few real entrepreneurs, the famous and not so famous, waited for a printout to see whether they should launch their new idea. Processing of agricultural commodities helps in value addition, as well as, leads to increase the share of producer in consumer’s rupee. It also helps in providing gainful employment opportunities and increase storage life. Processing helps for tapping distant markets and getting better prices for agricultural commodities. Processing acts as link between the industry and agriculture. There is a wide scope for development of processing industry. Because of the development of agro-based processing industry, the productivity per hectare, total production, total employment and the standard of living of rural people will increase. The sale of processed products gives more returns as compared to the raw agriculture produce.
Due to increased area and production of cashew in the South Gujarat, cashew nut growers as well as processing industry has gained much importance. Looking to the
FACTORS ASSOCIATED WITH THE SUCCESS-FAILURE OF CASHEW NUT GROWERS AND PROCESSING ENTERPRISE
G. G. Chauhan1, R. M. Naik2 and G. R. Patel3
1 Assistant Professor, College of Agriculture, NAU, Waghai - 3947302 Associate Professor, NMCA,NAU,Navsari - 396450
3 Director of Extension Education, NAU,Navsari - 396450Email: [email protected]
ABSTRACT
An entrepreneurial economy, whether on the national, regional or community level, differs significantly from a non-entrepreneurial economy in many respects, not only by its economic structure and its economic vigorousness, but also by the social vitality and quality of life which it offers with a consequent attractiveness to people. Present study was carried out in Valsad and Dang districts of southern part of Gujarat state. The selected talukas from the Valsad district were Dharampur and Kaparada, while from the Dang district, Waghai and Subir talukas were selected. From the each selected taluka, five villages were randomly selected. The 10 cashew nut growers were selected from each village which makes 200 cashew nut growers as respondents. A standard and reliable scale was developed to measure entrepreneurial ability. The majority of the cashew nut growers possessed low to medium level of adaptability, possessed ‘medium’ level of Sustainability, had ‘medium’ level of satisfaction and had ‘medium’ prestige earned in enterprise.
Keywords : entrepreneurship, entrepreneurial ability, entrepreneurial economy, cashew nut growers

Guj. J. Ext. Edu. Vol. 27 : Issue 1 : December 2016
83
employment and income generation potential of the cashew nut growers, many cashew nut processing units have been established in the region. Keeping these issues and questions in mind, the present study was conducted.
OBJECTIVE
To know the factors associated with the success-failur of cashew nut growers and processing enterprise
METHODOLOGY
Present study was carried out in Valsad and Dang districts of southern part of Gujarat state. The selected talukas
from the Valsad district were Dharampur and Kaparada, while from the Dang district, Waghai and Subir talukas were selected. From the each selected taluka, five villages were randomly selected. The 10 cashew nut growers were selected from each village which makes 200 cashew nut growers as respondents. Success is considered as the accomplishment of end aimed and the failure means the condition or fact of not achieving the desired end or ends. The ‘success-failure of the cashew nut processing enterprise’ was considered as second dependent variable for the present study. It was measured by using the scale developed by Chandrasekhar (2010), with slight modifications. This includes the above important components.
Symbol Profitability Parameters Symbol ScoreA Amount of money invested (`) AMI Actual Amount in `B Gross Return of the enterprise in the last three years GR Average of GR 1+GR 2+GR 31 2008-09 GR 1 Actual Amount in Rs.2 2009-10 GR 2 Actual Amount in Rs.3 2010-11 GR 3 Actual Amount in Rs.C Adaptability ADP 101 Adapted very well to the demands of the day ADP 1 102 Adapted well to some situations only ADP 2 073 Could survive barely and now adjusting ADP 3 054 Could not foresee the impending crisis and unable to adjust well ADP 4 035 Could not adjust at all and thinking of quitting or changing ADP 5 00D Sustainability SUS 101 I am enjoying this experience of running the enterprise SUS 1 102 I feel quite comfortable with sustaining the enterprise SUS 2 073 I am able to survive the crisis and now growing slowly SUS 3 054 I may not be able to continue for long in this enterprise SUS 4 03
5 I wish I had started another enterprise; I do not see any future in this enterprise SUS 5 00
E Degree of satisfaction DOS 101 Highly dissatisfied DOS 1 002 Dissatisfied DOS 2 033 So-So (Neutral) DOS 3 054 Satisfied DOS 4 075 Highly satisfied DOS 5 10F Prestige earned PE 101 None at all PE 1 002 Moderate name earned PE 2 023 Earned a good name in sales PE 3 044 Became quite popular in the vicinity PE 4 065 Much sought after by every farmer for opt advice PE 5 08
6 Won awards and enjoyed good press coverage in local and national dailies PE 6 10

Guj. J. Ext. Edu. Vol. 27 : Issue 1 : December 2016
84
RESULTS AND DISCUSSION
Factors associated with success-failure of cashew nut enterprise
The findings pertaining to success-failure of the cashew nut processing enterprise and factors influencing it are presented below.
(1) Adaptability in enterprise
Table 1: Distribution of the cashew nut growers according to their adaptability in enterprise n=200
Sr.No. Adaptability in enterprise No. Percent
1 Adapted very well to the demands of the day 68 34.00
2 Adapted well to some situations only 34 17.00
3 Could survive barely and now adjusting 98 49.00
4Could not foresee the impending crisis and unable to adjust well
00 00
5 Could not adjust at all and thinking of quitting or changing 00 00
Adaptability in enterprise (score)
1 Low (up to 6) 94 47.00
2 Medium ( 7 to 10) 106 53.00
3 High ( 11 and above) 0 0Mean= 1.53 SD= 0.499
The data presented in Table 1 about adaptability revealed that nearer to one half (49.00 per cent) of the cashew nut growers ‘could survive barely and now adjusting’ adaptability. About adaptability level, more than one half (53.00 per cent) of the cashew nut growers had ‘medium’ adaptability, whereas about one half (47.00 percent) of the cashew nut growers had ‘low’ adaptability. It can be discerned from these observations that experience in any enterprise determines the ability of an entrepreneur to overcome the obstacles and make adjustments as per the situation. That is why the cashew nut growers might have exhibited better adaptability level.
(2) Sustainability in enterprise
Table 2: Distribution of the cashew nut growers according to their sustainability in enterprise n=200
Sr.No.
Sustainability in enterprise No. Percent
1I am enjoying the experience of running the enterprise
70 35.00
2I feel quite comfortable with sustaining the enterprise
50 25.00
3I am able to survive the crisis and now growing slowly
80 40.00
4I may not be able to continue for long in this enterprise
0 0
5I wish I had started another en-terprise; I do not see any future in this enterprise
0 0
Sustainability in enterprise (score)1 Low (up to 5) 84 42.002 Medium ( 6 to 10 ) 116 58.003 High ( 11 and above) 0 0
Mean= 1.58 SD= 0.493
The data presented in Table 3 indicated that two fifth (40.00 per cent) of the cashew nut growers said ‘I am able to survive the crisis and now growing slowly’, while 35.00 per cent of the cashew nut growers said, ‘I am enjoying the experience of running the enterprise ’. Nearer to Three fifth (58.00 per cent) of the cashew nut growers had ‘medium’ sustainability. This may be attributed due to the experience, competence and abilities of the cashew nut growers
(3) Degree of satisfaction in enterprise
Table 3: Distribution of the cashew nut growers according to their degree of satisfaction in enterprise (n=200)
Sr.No.
Degree of satisfaction in enterprise No. Percent
1 Highly dissatisfied - -
2 Dissatisfied 20 10
3 So-So (Neutral) 56 28
4 Satisfied 116 58
5 Highly satisfied 8 4
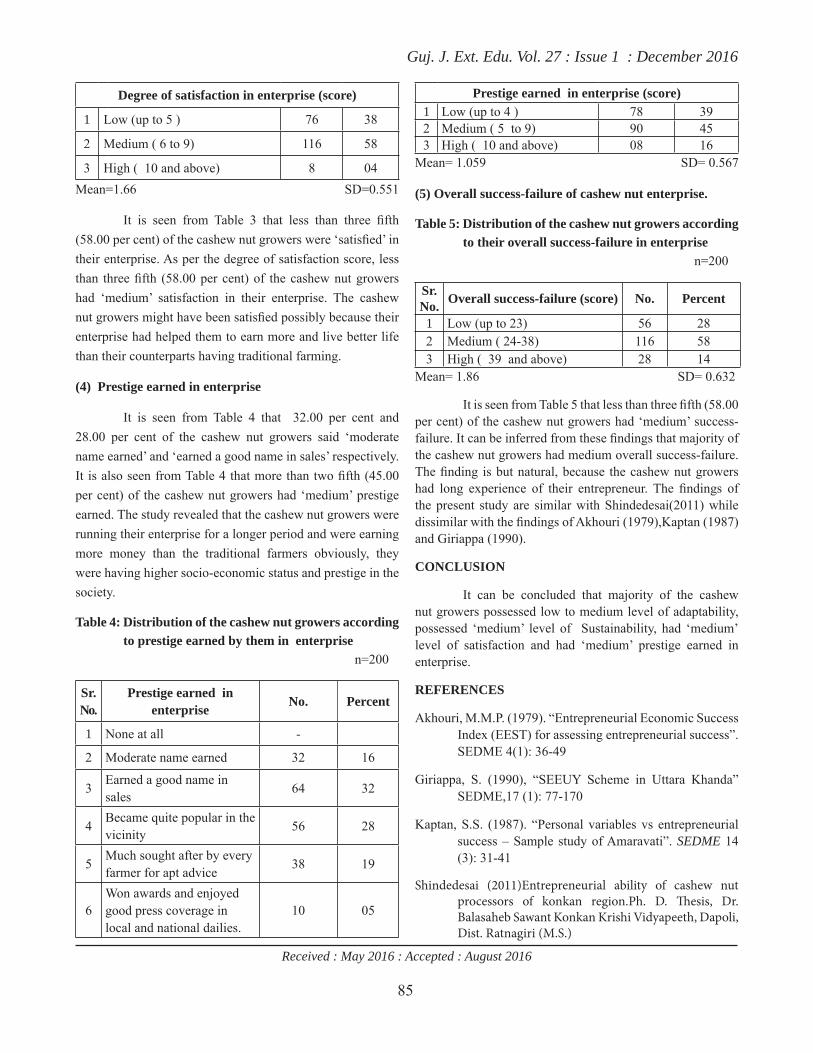
Guj. J. Ext. Edu. Vol. 27 : Issue 1 : December 2016
85
Degree of satisfaction in enterprise (score)
1 Low (up to 5 ) 76 38
2 Medium ( 6 to 9) 116 58
3 High ( 10 and above) 8 04Mean=1.66 SD=0.551
It is seen from Table 3 that less than three fifth (58.00 per cent) of the cashew nut growers were ‘satisfied’ in their enterprise. As per the degree of satisfaction score, less than three fifth (58.00 per cent) of the cashew nut growers had ‘medium’ satisfaction in their enterprise. The cashew nut growers might have been satisfied possibly because their enterprise had helped them to earn more and live better life than their counterparts having traditional farming.
(4) Prestige earned in enterprise
It is seen from Table 4 that 32.00 per cent and 28.00 per cent of the cashew nut growers said ‘moderate name earned’ and ‘earned a good name in sales’ respectively. It is also seen from Table 4 that more than two fifth (45.00 per cent) of the cashew nut growers had ‘medium’ prestige earned. The study revealed that the cashew nut growers were running their enterprise for a longer period and were earning more money than the traditional farmers obviously, they were having higher socio-economic status and prestige in the society.
Table 4: Distribution of the cashew nut growers according to prestige earned by them in enterprise n=200
Sr.No.
Prestige earned in enterprise No. Percent
1 None at all -
2 Moderate name earned 32 16
3 Earned a good name in sales 64 32
4 Became quite popular in the vicinity 56 28
5 Much sought after by every farmer for apt advice 38 19
6Won awards and enjoyed good press coverage in local and national dailies.
10 05
Prestige earned in enterprise (score)1 Low (up to 4 ) 78 392 Medium ( 5 to 9) 90 453 High ( 10 and above) 08 16
Mean= 1.059 SD= 0.567
(5) Overall success-failure of cashew nut enterprise.
Table 5: Distribution of the cashew nut growers according to their overall success-failure in enterprise n=200
Sr. No. Overall success-failure (score) No. Percent
1 Low (up to 23) 56 282 Medium ( 24-38) 116 583 High ( 39 and above) 28 14
Mean= 1.86 SD= 0.632
It is seen from Table 5 that less than three fifth (58.00 per cent) of the cashew nut growers had ‘medium’ success-failure. It can be inferred from these findings that majority of the cashew nut growers had medium overall success-failure. The finding is but natural, because the cashew nut growers had long experience of their entrepreneur. The findings of the present study are similar with Shindedesai(2011) while dissimilar with the findings of Akhouri (1979),Kaptan (1987) and Giriappa (1990).
CONCLUSION
It can be concluded that majority of the cashew nut growers possessed low to medium level of adaptability, possessed ‘medium’ level of Sustainability, had ‘medium’ level of satisfaction and had ‘medium’ prestige earned in enterprise.
REFERENCES
Akhouri, M.M.P. (1979). “Entrepreneurial Economic Success Index (EEST) for assessing entrepreneurial success”. SEDME 4(1): 36-49
Giriappa, S. (1990), “SEEUY Scheme in Uttara Khanda” SEDME,17 (1): 77-170
Kaptan, S.S. (1987). “Personal variables vs entrepreneurial success – Sample study of Amaravati”. SEDME 14 (3): 31-41
Shindedesai (2011)Entrepreneurial ability of cashew nut processors of konkan region.Ph. D. Thesis, Dr. Balasaheb Sawant Konkan Krishi Vidyapeeth, Dapoli, Dist. Ratnagiri (M.S.)
Received : May 2016 : Accepted : August 2016
Guj. J. Ext. Edu. Vol. 27 : Issue 1 : December 2016
86
INTRODUCTION
India’s population has largely crossed one billion and by 2035 India will overtake China as the world’s most populous country. In India poultry plays a crucial role in the rural economy by way of generating self employment and is the easy means of earning livelihood for economically backward rural people, which counts about 70.00 per cent of total population, living below poverty line. The eggs and chicken meat are important and rich sources of animal protein, vitamins and minerals. Poultry business is rich source of organic manure, income and employment to millions of farmers and other persons engaged in allied activities. However, poultry farmers feel unusual to start poultry farming. It is universally accepted fact that an attitude of an individual affects his behavior with respect to a particular object. Realizing this, researchers have developed a scale to measure attitude of the poultry farmers towards poultry management practices.
METHODOLOGY
Attitude refers to the “degree of positive or negative affect associated with some psychological object’’ (Thurstone, 1946). In the present study attitude is conceptualized as positive or negative reaction of beneficiary poultry owner towards improved poultry management practices. Among the techniques available, researcher has used. ‘Scale product
method’ which combines the Thurstone’s technique of equal appearing interval scale (1929) for selection of items and Likert’s technique of summated rating (1932) for ascertaining the response on the scale.
Item collection
The items of attitude scale called as statements. In initial stage of developing the scale large number of statements about improved poultry management practices were collected from relevant literature, discussion with experts of poultry, staff of extension education institute, A.A.U., Anand and Extension workers of the area. The statements, thus selected were edited according to the criteria laid down by Edward (1957). In all 75 statements were selected as they were found to be non-ambiguous and non factual.
Item Analysis
Seventy five slips of the selected statements were handed over to the professors and extension educationists of Anand Agricultural University, Anand, poultry scientists and extension officers of Gujarat State. The judges were requested to judge each statement in terms of their agreement or disagreement with the statements with the five point equal appearing interval continuum. Out of these experts, only 50 experts had returned the statements after dully recording their judgments and were considered for the analysis.
DEVELOPMENT OF SCALE TO MEASURE ATTITUDE OF POULTRY FARMERS TOWARDS POULTRY MANAGEMENT PRACTICES
G. N. Thorat1, S. G. Vahora2 and M. M. Trivedi3
1 Assistant Professor, Pashu Vigyan Kendra, TRTC, AAU, Devgadh Baria - 389 3802 Associate Professor, Pashu Vigyan Kendra, TRTC, AAU Devgadh Baria - 389 380
3 Professor, Deparment of Pashu Vigyan, B. A. College of Agriculture, AAU, Anand - 388 110Email: [email protected]
ABSTRACT
The study was conducted to develop and standardize the reliable and valid scale, to measure attitude of poultry owners towards poultry management practices Appropriate statistical methods ‘Scale product method’ was used, which combines Thurston and Likert techniques. A panel of 50 judges was requested to assign the score for each selected statement for judgment on five point continuum. Based on the scale (median) and Q values, 19 statements were finally selected to constitute attitude of poultry farmers towards poultry management practices.
Keywords: attitude, poultry farmer, poultry and management
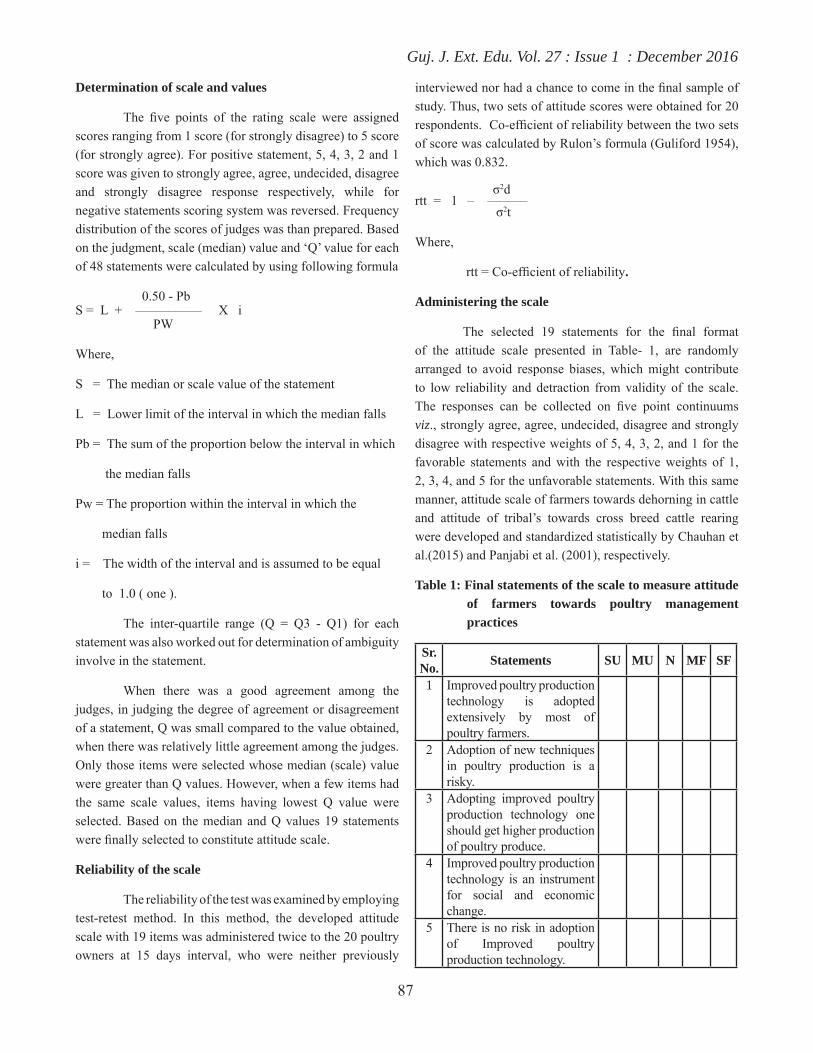
Guj. J. Ext. Edu. Vol. 27 : Issue 1 : December 2016
87
Determination of scale and values
The five points of the rating scale were assigned scores ranging from 1 score (for strongly disagree) to 5 score (for strongly agree). For positive statement, 5, 4, 3, 2 and 1 score was given to strongly agree, agree, undecided, disagree and strongly disagree response respectively, while for negative statements scoring system was reversed. Frequency distribution of the scores of judges was than prepared. Based on the judgment, scale (median) value and ‘Q’ value for each of 48 statements were calculated by using following formula
0.50 - PbS = L + –––––––––– X i PW
Where,
S = The median or scale value of the statement
L = Lower limit of the interval in which the median falls
Pb = The sum of the proportion below the interval in which
the median falls
Pw = The proportion within the interval in which the
median falls
i = The width of the interval and is assumed to be equal
to 1.0 ( one ).
The inter-quartile range (Q = Q3 - Q1) for each statement was also worked out for determination of ambiguity involve in the statement.
When there was a good agreement among the judges, in judging the degree of agreement or disagreement of a statement, Q was small compared to the value obtained, when there was relatively little agreement among the judges. Only those items were selected whose median (scale) value were greater than Q values. However, when a few items had the same scale values, items having lowest Q value were selected. Based on the median and Q values 19 statements were finally selected to constitute attitude scale.
Reliability of the scale
The reliability of the test was examined by employing test-retest method. In this method, the developed attitude scale with 19 items was administered twice to the 20 poultry owners at 15 days interval, who were neither previously
interviewed nor had a chance to come in the final sample of study. Thus, two sets of attitude scores were obtained for 20 respondents. Co-efficient of reliability between the two sets of score was calculated by Rulon’s formula (Guliford 1954), which was 0.832.
σ2drtt = 1 – –––––– σ2t
Where,
rtt = Co-efficient of reliability.
Administering the scale
The selected 19 statements for the final format of the attitude scale presented in Table- 1, are randomly arranged to avoid response biases, which might contribute to low reliability and detraction from validity of the scale. The responses can be collected on five point continuums viz., strongly agree, agree, undecided, disagree and strongly disagree with respective weights of 5, 4, 3, 2, and 1 for the favorable statements and with the respective weights of 1, 2, 3, 4, and 5 for the unfavorable statements. With this same manner, attitude scale of farmers towards dehorning in cattle and attitude of tribal’s towards cross breed cattle rearing were developed and standardized statistically by Chauhan et al.(2015) and Panjabi et al. (2001), respectively.
Table 1: Final statements of the scale to measure attitude of farmers towards poultry management practices
Sr. No. Statements SU MU N MF SF
1 Improved poultry production technology is adopted extensively by most of poultry farmers.
2 Adoption of new techniques in poultry production is a risky.
3 Adopting improved poultry production technology one should get higher production of poultry produce.
4 Improved poultry production technology is an instrument for social and economic change.
5 There is no risk in adoption of Improved poultry production technology.

Guj. J. Ext. Edu. Vol. 27 : Issue 1 : December 2016
88
6 Only progressive and big farmers can adopt Improved poultry production technology.
7 Poultry production is not economically viable because it requires more investment.
8 Adoption of new Improved poultry production technology affects the participation in social activities.
9 Hybrid poultry strain is not given better result than the desi poultry strain.
10 There is no matter a poultry ownershould be used either case system or deep letter system.
11 No matter what poultry farmers may try, poultry production will be improved only when god will it.
12 Expenditure on feeding is compensated by more production.
13 Only educated farmers can cultivate the poultry production efficiently.
14 Improved poultry production is difficult as it requires more technical skill.
15 I would like to advise my son to continue improved poultry production technology.
16 No matter, however new technology of poultry production may be tried, poultry production will not increase.
17 Improved poultry production is not relevant to the need of most of the poultry farmers.
18 I preferred improved poultry production due to low diseases attack.
19 Improved poultry production increases the employment opportunity in rural area.
SU:Strongly unfavourable, MU: Moderately unfavourable, N: Neutral, MF: Moderately favourable SF: Strongly favorable
CONCLUSION
The scale developed to measure attitude of poultry farmers towards poultry management practices is reliable and valid, hence it may be used in future studies with due modifications.
REFERENCES
Chauhan, N. B. Patel J. B. and Patel, P. C. (2015). Development and Standardization of Attitude Scale of Farmers Towards Dehorning in Cattle. Guj. J. of Ext. Edu. 26(1): 40-42
Edward, A. L. (1957). Techniques of attitude scale construction, Appleton Century Crofts, Inc., New York
Guilford, J. P. (1954). Psychometric Methods. Tata McGraw-Hill Publication Co. Ltd., Bombay: 378-382
Likert, R. A. (1932). A Technique for the measurement of attitude. Archives of Psychology, New York.140
Panjabi, N. K. and Paul, N. (2001) Attitude of tribal’s towards cross breed cattle rearing. Maharashtra Journal of Extension Education, XX : 32-35
Thurston, L. L. and Chave , E. G. (1928). The measurement of attitude, Chicago University Press, USA. : 39-40
Received : June 2016 : Accepted : September 2016

Guj. J. Ext. Edu. Vol. 27 : Issue 1 : December 2016
89
INTRODUCTION
Convergence plays important roles to avoid duplication work, collaboration between the departments, conflict management, improve the social relationship. Reducing work load, work finish timely as well as effectively, improve communication ability, improve leadership ability, sharing the strengths and weakness, etc. to members of the different organization. In different members of different department, institutes, organization of agriculture faced different problem like increases work load, conflict between the departments, not proper communication etc this problem is occurred / faced due to low level of knowledge about convergence. Convergence related different aspect about collaboration, communication, leadership the knowledge of convergence has great scope for reducing time, avoid duplication, conflict management, avoid work load in a organization due to this the study has been selected as knowledge about convergence.
OBJECTIVE
To study the level of knowledge about way and mance of convergence
METHODOLOGY
Present investigation was carried out in Navsari Agricultural University. Navsari agricultural have 4 sub-
college viz., surat, bharuch, dediapada, waghai,. Navsari agricultural university divided in five discipline; - agriculture, veterinary, horticulture, forestry, agriculture business management. All the discipline was divided in the different department. 40 respondents selected only those who have power to take the decision purchase money e.g principal, head of department, and research scientist. An Ex-post-factor research design was used in the present investigation. Knowledge of the respondents about convergence to measure with structured schedule was developed. Each question was given a score of one for correct answer and zero for incorrect answer.
RESULTS AND DISCUSSION
Table 1: Distribution of respondents according to their level of knowledge about the convergence n=40
Sr. No
Categories Frequency Percent
1 Low 06 15.002 Medium 30 75.003 High 04 10.00
Table 1 indicated that majority of the respondents (75.00 per cent) had medium level of knowledge about the convergence followed by 15.00 and 10.00 per cent had low and high level of knowledge about the convergence respectively.
KNOWLEDGE LEVEL OF PERSONNEL INVOLVED IN CONVERGENCE
D. J. Patel1* and R. D. Pandya2
1 Postgraduate student (Extension Education)2 Professor & head, Department of Extension Education, NMCA, NAU, Navasri - 396450
Email : [email protected]
ABSTRACTS
With a view to know the correlation of knowledge about convergence the present study was undertaken in Navsari agricul-tural university. Majority of respondents had medium level of knowledge about the convergence. The independent variables viz., Age, education, designation, other responsibility, working distribution, working time, personality characteristic, farming experience, were non-significant relationship with knowledge about convergence
Keywords: knowledge, convengence
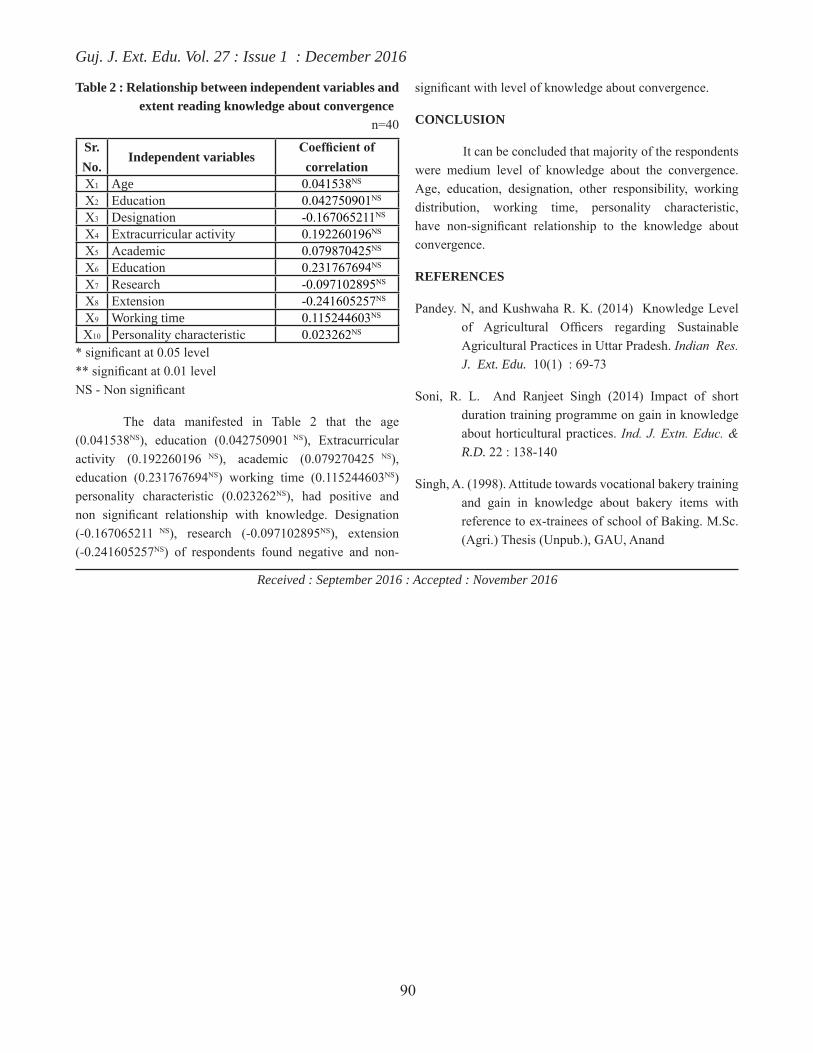
Guj. J. Ext. Edu. Vol. 27 : Issue 1 : December 2016
90
Table 2 : Relationship between independent variables and extent reading knowledge about convergence n=40
Sr. No.
Independent variablesCoefficient of correlation
X1 Age 0.041538NS
X2 Education 0.042750901NS
X3 Designation -0.167065211NS
X4 Extracurricular activity 0.192260196NS
X5 Academic 0.079870425NS
X6 Education 0.231767694NS
X7 Research -0.097102895NS
X8 Extension -0.241605257NS
X9 Working time 0.115244603NS
X10 Personality characteristic 0.023262NS
* significant at 0.05 level ** significant at 0.01 level NS - Non significant
The data manifested in Table 2 that the age (0.041538NS), education (0.042750901 NS), Extracurricular activity (0.192260196 NS), academic (0.079270425 NS), education (0.231767694NS) working time (0.115244603NS) personality characteristic (0.023262NS), had positive and non significant relationship with knowledge. Designation (-0.167065211 NS), research (-0.097102895NS), extension (-0.241605257NS) of respondents found negative and non-
significant with level of knowledge about convergence.
CONCLUSION
It can be concluded that majority of the respondents were medium level of knowledge about the convergence. Age, education, designation, other responsibility, working distribution, working time, personality characteristic, have non-significant relationship to the knowledge about convergence.
REFERENCES
Pandey. N, and Kushwaha R. K. (2014) Knowledge Level of Agricultural Officers regarding Sustainable Agricultural Practices in Uttar Pradesh. Indian Res. J. Ext. Edu. 10(1) : 69-73
Soni, R. L. And Ranjeet Singh (2014) Impact of short duration training programme on gain in knowledge about horticultural practices. Ind. J. Extn. Educ. & R.D. 22 : 138-140
Singh, A. (1998). Attitude towards vocational bakery training and gain in knowledge about bakery items with reference to ex-trainees of school of Baking. M.Sc. (Agri.) Thesis (Unpub.), GAU, Anand
Received : September 2016 : Accepted : November 2016

Guj. J. Ext. Edu. Vol. 27 : Issue 1 : December 2016
91
INTRODUCTION
‘Agriculture pollution’ is defined as the liquid and solid wastes from all types of farming, including the run-off from pesticides, fertilizers and feed lots. Crop protection in India begun in 1947- 48 with introduction of Benzene Hexa Chlorine (BHC) and Dichloro Diphenyl Trichloro Ethane (DDT) for the control of insect pest of agriculture and pub-lic health importance. Later, copper based Bordeaux mixture and Burgundy mixture became prominent as they were more effective and not phytotoxic. From 1950 onwards, mercury compounds were introduced from Germany par-ticularly, as seed dressers. Later, organophosphorous com-pounds, organosulphur fungicide, rodenticides were released for use. Today, India is the largest manufacturer of pesticides in the world.
There are more than 234 registered pesticides in India and the Indian pesticide industry includes more than 125 large and medium scale producers of more than 500 pes-ticide products. Among the various pesticide formulations produced, dust formulations constitute about 85% of the to-tal, followed by water-soluble dispersible powder (12%) and dispersible powder (2%). India is one of the few remaining countries still producing and using some of the chlorinated pesticides such as DDT and lindane (Abhilash and Singh, 2009; Vijgen et al. 2011).
Use of pesticides in India is increasing at the rate of 2.00 to 5.00 per cent per annum and is about 3.00 per cent of total pesticides used in world. About 90,000 metric
EXTENT OF AWARENESS OF PLANT PROTECTION MEASURES AMONG VEGETABLE AND FRUIT GROWERS
H. P. Sonawane1 and S. S. Neware2
1 Assistant Professor, Department of Extension Education, College of Agriculture, Pune (M.S.)2 J.R.A. Department of Extension Education, College of Agriculture, Pune (M.S.)
Email : [email protected]
ABSTRACT
The present study was conducted in Pune district of Maharashtra state. Pune district was purposively selected for the study because it is having large area under vegetable and fruit cultivation. From Pune district Ambegaon, Junnar and Khed tahsils were selected on the basis of area under vegetable and fruit cultivation as the area of present research study. There were 13 villages from 3 tahsil selected. The findings of the study are based on the data collected by interviewing 115 selected vegetable and fruit growers. Out of 110 vegetable and fruit growers who used ‘Fipronil’, vast majority (80.00 per cent) were using it ‘more than recommended dose’, while in case of ‘Dimethoate’, majority (90.00 per cent) of the respondents were us-ing ‘more than recommended dose’ and of those who were using ‘Thiamethoxam’, 52.00 per cent were using it ‘as per recom-mended dose’. Majority (94.78 per cent) of the respondents were aware about adverse effects namely, ‘Headache’(94.78 per cent), ‘Irritation in eyes’ (93.91 percent), ‘Itching on skin’(90.43 per cent), ‘Nausea’ (84.35 per cent), ‘pesticide causes death of valuable pollinators like honey bee’ (72.17per cent), ‘persistent chemicals contaminate soil for longer period’(59.13 per cent) and ‘developed pesticide resistant in pest due to constant use’ (53.91 per cent). ‘Pesticides should be kept away from reach of children and animals’ (98.26 per cent), ‘pesticides should be stored in cool, dry, safe and locked room’ (85.22 per cent), ‘washing of spray pumps near the river and wells should be avoided’ (70.43 per cent), ‘the clogged nozzle and other parts should not be blowed by mouth’ (64.35 per cent) and ‘empty tins of pesticides should not be used’ (53.91 per cent) were the major suggestions given by them. There is a need to convey the message that prevention of adverse health effects and promotion of health are profitable investments for employers and employees as a support to a sustainable develop-ment of economics. To sum up, based on our limited knowledge of direct or inferential information, the domain of pesticides illustrates a certain ambiguity in situations in which people are undergoing life-long exposure. There is thus every reason to develop health education packages based on knowledge, attitude and practices and to disseminate them within the community in order to minimize human exposure to pesticides.
Keywords : plant protection measures, vegetable & fruit growers
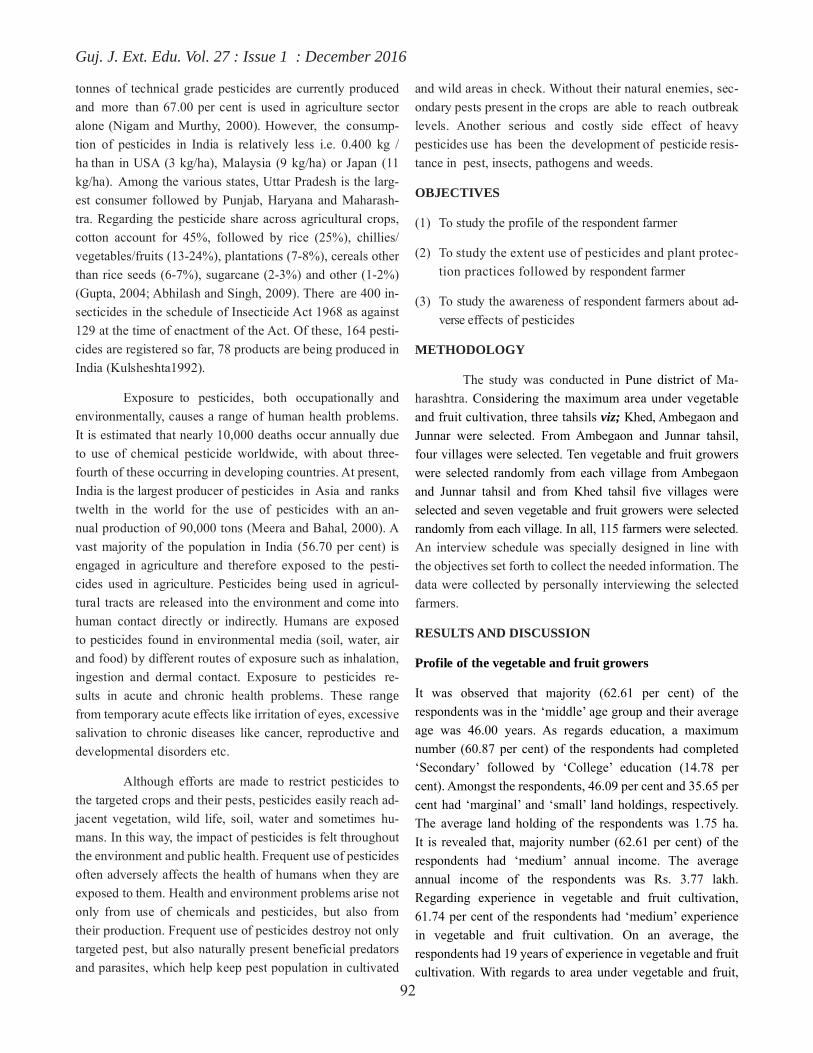
Guj. J. Ext. Edu. Vol. 27 : Issue 1 : December 2016
92
tonnes of technical grade pesticides are currently produced and more than 67.00 per cent is used in agriculture sector alone (Nigam and Murthy, 2000). However, the consump-tion of pesticides in India is relatively less i.e. 0.400 kg /ha than in USA (3 kg/ha), Malaysia (9 kg/ha) or Japan (11 kg/ha). Among the various states, Uttar Pradesh is the larg-est consumer followed by Punjab, Haryana and Maharash-tra. Regarding the pesticide share across agricultural crops, cotton account for 45%, followed by rice (25%), chillies/vegetables/fruits (13-24%), plantations (7-8%), cereals other than rice seeds (6-7%), sugarcane (2-3%) and other (1-2%) (Gupta, 2004; Abhilash and Singh, 2009). There are 400 in-secticides in the schedule of Insecticide Act 1968 as against 129 at the time of enactment of the Act. Of these, 164 pesti-cides are registered so far, 78 products are being produced in India (Kulsheshta1992).
Exposure to pesticides, both occupationally and environmentally, causes a range of human health problems. It is estimated that nearly 10,000 deaths occur annually due to use of chemical pesticide worldwide, with about three-fourth of these occurring in developing countries. At present, India is the largest producer of pesticides in Asia and ranks twelth in the world for the use of pesticides with an an-nual production of 90,000 tons (Meera and Bahal, 2000). A vast majority of the population in India (56.70 per cent) is engaged in agriculture and therefore exposed to the pesti-cides used in agriculture. Pesticides being used in agricul-tural tracts are released into the environment and come into human contact directly or indirectly. Humans are exposed to pesticides found in environmental media (soil, water, air and food) by different routes of exposure such as inhalation, ingestion and dermal contact. Exposure to pesticides re-sults in acute and chronic health problems. These range from temporary acute effects like irritation of eyes, excessive salivation to chronic diseases like cancer, reproductive and developmental disorders etc.
Although efforts are made to restrict pesticides to the targeted crops and their pests, pesticides easily reach ad-jacent vegetation, wild life, soil, water and sometimes hu-mans. In this way, the impact of pesticides is felt throughout the environment and public health. Frequent use of pesticides often adversely affects the health of humans when they are exposed to them. Health and environment problems arise not only from use of chemicals and pesticides, but also from their production. Frequent use of pesticides destroy not only targeted pest, but also naturally present beneficial predators and parasites, which help keep pest population in cultivated
and wild areas in check. Without their natural enemies, sec-ondary pests present in the crops are able to reach outbreak levels. Another serious and costly side effect of heavy pesticides use has been the development of pesticide resis-tance in pest, insects, pathogens and weeds.
OBJECTIVES
(1) To study the profile of the respondent farmer
(2) To study the extent use of pesticides and plant protec-tion practices followed by respondent farmer
(3) To study the awareness of respondent farmers about ad-verse effects of pesticides
METHODOLOGY
The study was conducted in Pune district of Ma-harashtra. Considering the maximum area under vegetable and fruit cultivation, three tahsils viz; Khed, Ambegaon and Junnar were selected. From Ambegaon and Junnar tahsil, four villages were selected. Ten vegetable and fruit growers were selected randomly from each village from Ambegaon and Junnar tahsil and from Khed tahsil five villages were selected and seven vegetable and fruit growers were selected randomly from each village. In all, 115 farmers were selected. An interview schedule was specially designed in line with the objectives set forth to collect the needed information. The data were collected by personally interviewing the selected farmers.
RESULTS AND DISCUSSION
Profile of the vegetable and fruit growers
It was observed that majority (62.61 per cent) of the respondents was in the ‘middle’ age group and their average age was 46.00 years. As regards education, a maximum number (60.87 per cent) of the respondents had completed ‘Secondary’ followed by ‘College’ education (14.78 per cent). Amongst the respondents, 46.09 per cent and 35.65 per cent had ‘marginal’ and ‘small’ land holdings, respectively. The average land holding of the respondents was 1.75 ha. It is revealed that, majority number (62.61 per cent) of the respondents had ‘medium’ annual income. The average annual income of the respondents was Rs. 3.77 lakh. Regarding experience in vegetable and fruit cultivation, 61.74 per cent of the respondents had ‘medium’ experience in vegetable and fruit cultivation. On an average, the respondents had 19 years of experience in vegetable and fruit cultivation. With regards to area under vegetable and fruit,

Guj. J. Ext. Edu. Vol. 27 : Issue 1 : December 2016
93
53.91 per cent of the respondents were having ‘low’ area under vegetable and fruit cultivation with an average area of 1.5 ha. Maximum numbers of the respondents (68.70 per cent) were in the ‘medium’ category of extension contact. Majority of the respondents (59.13 per cent) were in the category of ‘medium’ source of information. Whereas, 74.78 per cent of the respondents had ‘medium’ risk preference and 71.30 per cent of the respondents in the ‘medium’ category
of economic motivation.
Extent of use of pesticides and plant protection prac-tices followed by the vegetable and fruit growers
The results of the present investigation, in respect of nature and extent of use of pesticides by the vegetable and fruit growers is given in Table 1.
Table 1: Distribution of the respondents according to nature and extent of pesticides used by them n=115
Chemical methodSr. No.
Crop (Major pest)
Pesticides& dose(ml/10 lit)
As per recommended
dose
More than recommended
dose
Less than recommended dose
Total
a Vegetables1 Onion
(Thrips)Fipronil(20 gm)
22(20.00)
88(80.00) - 110
(100.00)2 Tomato
(Leaf-miner)Dimethoa-te
(20 ml)07
(10.00)61
(90.00) - 68(100.00)
3 Potato(Aphid)
Thiamet-hoxam(250 gm)
26(52.00)
24(48.00) - 50
(100.00)4 Chilli
(Thrips)Imidachl-orpid
(20 gm)16
(31.00)22
(42.00)14
(27.00)52
(100.00)5 Brinjal.
(Stem borer)Dichlorv-os
(20 ml) - 33(89.00)
4(11.00)
37(100.00)
b Fruits6 Mango
(Mangohopper)Acephate (10 gm) - 24
(100.00)- 24
(100.00)7 Sapota
(Moth)Carbaryl (15 ml)
13(15.00)
76(85.00)
- 89(100.00)
8 Grapes(Mealy bug)
Monocrot-ophos (16 ml)
05(18.00)
23(82.00)
- 28(100.00)
It is observed from table 1 that, out of 110 vegeta-ble and fruit growers who had used ‘Fipronil’ of which vast majority (80.00 per cent) of them were using it ‘more than recommended dose’ and only 20.00 per cent of the respon-dents were using ‘as per recommended dose’. Among tomato growers, in case of ‘Dimethoate’, majority (90.00 per cent) of the respondents were using ‘more than recommended dose’, followed by one-tenth of the respondents (10.00 per cent) ‘as per recommended dose’.
The respondents of potato growers those were us-ing ‘Thiamethoxam’ 52.00 per cent of them using it ‘as per recommended dose’ and 48.00 per cent of them were using ‘more than recommended dose’, whereas, out of 52 respon-dents of chilli growers those who were using ‘Imidachlor-pid’ maximum number (42.00 per cent) of them were using
‘more than recommended dose’, followed by 31.00 per cent ‘as per recommended dose’ and 27.00 per cent ‘less than rec-ommended dose’. Out of 37 ‘Dichlorvos’ using respondents, majority (89.00 per cent) of them were using ‘more than recommended dose’ followed by 11.00 per cent respondents ‘less than recommended dose’.
In case of ‘Acephate’ all mango growers (100.00 per cent) were using these pesticides ‘more than recommended dose’. Whereas out of 89 ‘Carbaryl’ users majority of them (85.00 per cent) were using it ‘more than recommended dose’ while 15.00 per cent of them were using it ‘as per recom-mended dose’. In case of ‘Monocrotophos’ users majority of them were using ‘more than recommended dose’ (82.00 per cent), while only 18.00 per cent of them were using ‘as per recommended dose’.
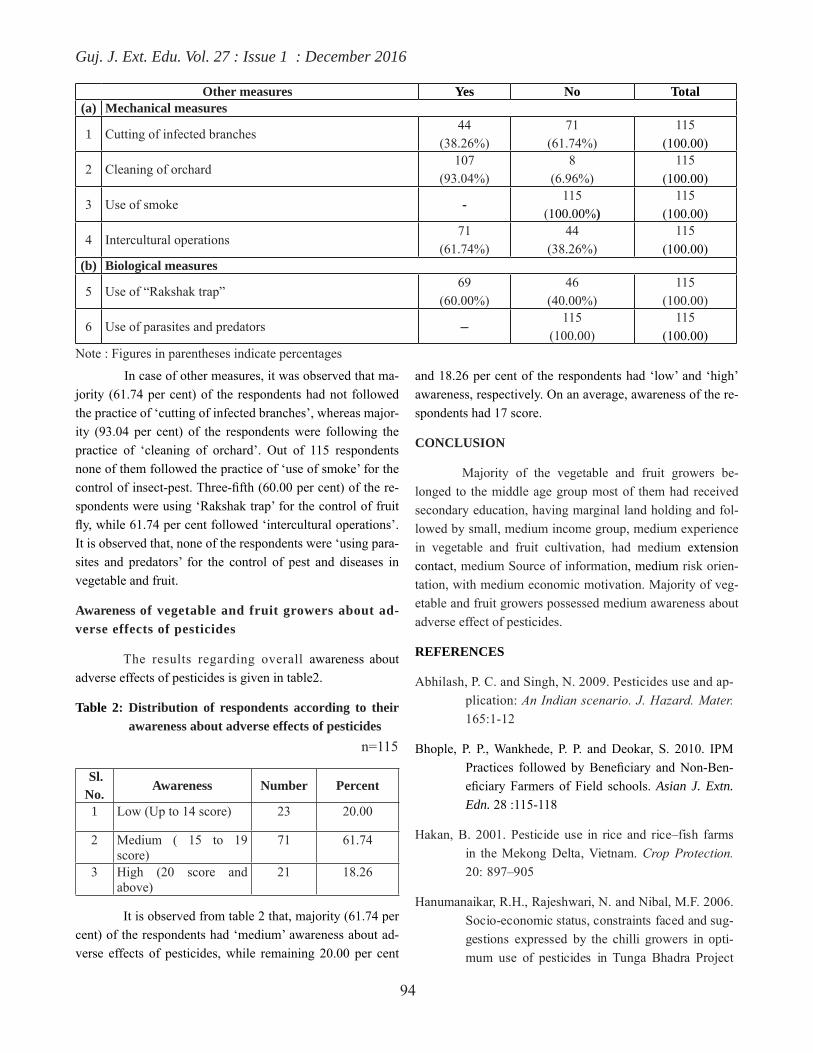
Guj. J. Ext. Edu. Vol. 27 : Issue 1 : December 2016
94
Other measures Yes No Total(a) Mechanical measures
1 Cutting of infected branches44
(38.26%)71
(61.74%)115
(100.00)
2 Cleaning of orchard107
(93.04%)8
(6.96%)115
(100.00)
3 Use of smoke -115
(100.00%)115
(100.00)
4 Intercultural operations71
(61.74%)44
(38.26%)115
(100.00)(b) Biological measures
5 Use of “Rakshak trap”69
(60.00%)46
(40.00%)115
(100.00)
6 Use of parasites and predators —115
(100.00)115
(100.00)Note : Figures in parentheses indicate percentages
In case of other measures, it was observed that ma-jority (61.74 per cent) of the respondents had not followed the practice of ‘cutting of infected branches’, whereas major-ity (93.04 per cent) of the respondents were following the practice of ‘cleaning of orchard’. Out of 115 respondents none of them followed the practice of ‘use of smoke’ for the control of insect-pest. Three-fifth (60.00 per cent) of the re-spondents were using ‘Rakshak trap’ for the control of fruit fly, while 61.74 per cent followed ‘intercultural operations’. It is observed that, none of the respondents were ‘using para-sites and predators’ for the control of pest and diseases in vegetable and fruit.
Awareness of vegetable and fruit growers about ad-verse effects of pesticides
The results regarding overall awareness about adverse effects of pesticides is given in table2.
Table 2: Distribution of respondents according to their awareness about adverse effects of pesticides n=115
Sl. No.
Awareness Number Percent
1 Low (Up to 14 score) 23 20.00
2 Medium ( 15 to 19 score)
71 61.74
3 High (20 score and above)
21 18.26
It is observed from table 2 that, majority (61.74 per cent) of the respondents had ‘medium’ awareness about ad-verse effects of pesticides, while remaining 20.00 per cent
and 18.26 per cent of the respondents had ‘low’ and ‘high’ awareness, respectively. On an average, awareness of the re-spondents had 17 score.
CONCLUSION
Majority of the vegetable and fruit growers be-longed to the middle age group most of them had received secondary education, having marginal land holding and fol-lowed by small, medium income group, medium experience in vegetable and fruit cultivation, had medium extension contact, medium Source of information, medium risk orien-tation, with medium economic motivation. Majority of veg-etable and fruit growers possessed medium awareness about adverse effect of pesticides.
REFERENCES
Abhilash, P. C. and Singh, N. 2009. Pesticides use and ap-plication: An Indian scenario. J. Hazard. Mater. 165:1-12
Bhople, P. P., Wankhede, P. P. and Deokar, S. 2010. IPM Practices followed by Beneficiary and Non-Ben-eficiary Farmers of Field schools. Asian J. Extn. Edn. 28 :115-118
Hakan, B. 2001. Pesticide use in rice and rice–fish farms in the Mekong Delta, Vietnam. Crop Protection. 20: 897–905
Hanumanaikar, R.H., Rajeshwari, N. and Nibal, M.F. 2006. Socio-economic status, constraints faced and sug-gestions expressed by the chilli growers in opti-mum use of pesticides in Tunga Bhadra Project
Guj. J. Ext. Edu. Vol. 27 : Issue 1 : December 2016
95
area of Bellary district. Mysore J. of Agril. Sci.. 40 (2): 261-266
Jeyanthi, H. and Kombairaju, S. 2005. Pesticide use in vegetable crops: frequency, intensity and deter-minant factors, Agric. Econ. Res. Review. 18 : 209-221
Kulsheshta, N. (1992) Pesticides and Environmetal pollu-tion; Legislative control in India. Pesticide Infor-mation 28. (3): 8-13
Meera, Bahal, R. and Shaik, N., 2000. An analysis of utili-zation pattern of pesticides on vegetable crops in Delhi state. Indian J. Ext. Edu. 34 (3&4):116-123
Miah, A.H., Hoque, A., Paul, A. and Rahman, A. 2014. Un-safe use of pesticide and its impact on health of farmers: a case study in Burichong Upazila, Ban-gladesh. J. Environ. Sci. Toxic. Food Tech. 8(1): 57-67
Received : August 2016 : Accepted : November 2016

Guj. J. Ext. Edu. Vol. 27 : Issue 1 : December 2016
96
INTRODUCTION
Tropical root and tuber crops are considered as the third important group of food crops after cereals and grain legumes. They contribute 6 percent of the average daily calorific intake of human beings. Mostly tropical tuber crop produced, that are used for human food and animal feed. Elephant foot yam, Greater yam, Aerial yam, Colocasia, Tannia, and Sweet potato play a major role in the socio-economic condition of small and marginal farmers of tribal areas of Gujarat region in context of food and nutrition security. It is believable that to motivate farmers for adopting recommended package of practices of root & tuber crops for food security and nutritional security is very much essential. Final decision of farmers to adopt root & tuber crops cultivation is usually the result of their knowledge about recommended package of practices of tuber crops. Knowledge of the root and tuber crop growers can be affected by their various characteristics. In this context, an attempt has been made to carry out the present investigation.
OBEJCTIVE
To know the determinats in knowledge about recommended package of practices of root and tuber crops
METHODOLOGY
The study was conducted during April-June 2016 in Navsari district of Gujarat state. Gandevi, Chikhali and Khergam Talukas were randomly selected from Navsari district. From each taluka three villages were selected randomly with maximum number of root and tuber crop growers. In each of the selected villages farmers were selected according to random proportionate sampling to form 70 respondents as a sample size for the study. In order to measure correlation between profile of root and tuber crop growers and knowledge of recommended package of practices, various scale developed by different social scientist were adopted with due modification and correlation of coefficient (r) test was applied.
RESULTS AND DISCUSSION
Relationship between the personal, socio-economic characteristics of root and tuber crop growers and their knowledge
The association between the profile of root and tuber crop growers and their knowledge about recommended package of practices of root and tuber crops were worked out with the help coefficient of correlation. The findings were presented in Table 1.
DETERMINANTS IN KNOWLEDGE ABOUT RECOMMENDED PACKAGE OF PRACTICES OF ROOT AND TUBER CROPS
R. M. Naik1, V. B. Girawale2 and G.G.Chauhan3
1 Associate professor, Department of Extension Education, NMCA, NAU, Navsari - 3964502 Postgraduate Scholar (Extension Education), NAU, Navsari - 396450
3 Assistant Professor,College of Agriculture, NAU,Waghai - 394730Email: [email protected]
ABSTRACT
With a view to know the correlation of knowledge about recommended package of practices of root and tuber crops with the root and tuber crop growers characteristics, the present study was undertaken in Navsari district of Gujarat. Majority of root and tuber crop growers had medium level of knowledge about recommended package of practices of root and tuber crops. The independent variables viz., farming experience, social participation, mass media exposure, education, size of land holding, annual income, extension contact and extension participation were positively and significantly correlated with knowledge about recommended package of practices of root & tuber crops.
Keywords : knowledge, root tuber crops, package of practies

Guj. J. Ext. Edu. Vol. 27 : Issue 1 : December 2016
97
Table 1: Relationship between profile of the root and tuber crop growers and their knowledge regarding recommended package of practices of root and tuber crops n=70
Sr. No.
Independent VariablesCorrelation-Coefficient
(‘r’ value)X1 Age 0.099 NSX2 Education 0.736**X3 Farming experience 0.204*X4 Size of land holding 0.299**X5 Annual income 0.535**X6 Material possession 0.122NSX7 Extension contact 0.491**X8 Extension participation 0.344**X9 Social participation 0.250*X10 Mass media exposure 0.201*
NS= non-significant * = significant at 0.05 level **=significant at 0.01 level
The data manifested in the Table 1 revealed that in case of root and tuber crop growers, characteristics such as age (r = 0.099) and material possession (r = 0.122) was positive and non-significantly correlated with knowledge level. The characteristics such as farming experience (r = 0.204), social
participation (r = 0.250) and mass media exposure (r = 0.201) was positive and significantly correlated with knowledge level. Education (r = 0.736), size of land holding (r = 0.299), annual income (r = 0.535), extension contact (r = 0.491) and extension participation (r = 0.344) were positive and high significant with knowledge level.
CONCLUSION
There were positive and significant relationship between farming experience, social participation, mass media exposure, education, size of land holding, annual income, extension contact and extension participation with the level of knowledge about recommended package of practices of root & tuber crops.
REFERENCES
Chauhan, G. G., Naik, R. M., Pandya, H. V. and Intwala, C. G. (2009). Relationship of personal characteristics of safed musli growers with awareness and knowledge about its cultivation. Guj. J. of Ext. Edu., 21 : 77-78
Pandya, C. D. (2010). A critical analysis of socio-economic status of organic farming followers of south Gujarat. Ph.D. (Agri). thesis (Unpub.), N.A.U., Navsari
Received : July 2016 : Accepted : September 2016
Guj. J. Ext. Edu. Vol. 27 : Issue 1 : December 2016
98
INTRODUCTION
Dairying is one of the important enterprises, which supports the rural households by providing gainful employment and steady income. The importance of milk and milk products for the physical development and well-being of human beings is universally recognized. But profitability of dairying depends upon three main factors viz. breed, management and feeding practices followed. Feeding plays a very crucial/important role in growth, development and productivity of dairy animals. Adequate feeding will ensure that animal attains desired body weight, produce more milk and remains healthy. As feeding alone accounts for around 70% of the expenses incurred for dairying it further augment its importance.
In India, women involvement in livestock management is a longstanding tradition and dairy farming has been an integral part of homestead farming system. Many research studies have indicated that responsibilities of dairy are almost completely shouldered by women. There is considerable evidence that livestock and management
related activities continue to be predominately rural women’s responsibility and domain. Women are generally responsible for the feeding, grazing, fodder collection, milking, processing, dung management, while men who manage the finances generally sale of milk and milk products (Sethi, 2010). Women are actively participating in various dairy farming practices including harvesting and bringing of fodder from field, care of sick animal, feed preparation, feeding the animal, cleaning of animal shed, milking, cow dung collection and cake making, etc. as reported by Narmatha et al., 2009.
OBJECTIVE
To know the participation of tribal dairy women special reference to feeding and breeding practices in animal husbadry and dairy
METHODOLOGY
The present study was conducted in operational area of Pashu Vigyan Kendra, Limkheda. Out of eight talukas of Dahod district five talukas namely Devgadh Baria, Limkheda, Dahod, Garbada and Zalod were selected. From each Taluka
PARTICIPATION OF TRIBAL DAIRY WOMEN SPECIAL REFERENCE TO FEEDING AND BREEDING PRACTICES IN ANIMAL HUSBANDRY AND DAIRY
S. G. Vahora1, G. N. Thorat2 and D. B. Ramjiyani3
1 Associate Professor, Pashu Vigyan Kendra, TRTC, AAU, Devgadh Baria - 389 3802 Assistant Professor, Pashu Vigyan Kendra, TRTC, AAU, Devgadh Baria - 389 380
3 Research Associate, TRTC, AAU, Devgadh Baria - 389 380Email: [email protected]
ABSTRACT
The role of women in tribal communities is substantial and crucial. They constitute about half the total population but in tribal society women are more important than in other social groups, because they work harder and the family economy and management depends on them. The objectives of the present research were to find out the participation of Tribal Dairy Women (TDW) special reference to nutritional and breeding practices in animal husbandry. The studies involved total of 100 TDW respondents from each 10 villages of selected five talukas of Dahod districts of Gujarat. Related data were collected with the help of personal interview technique. Data were analyzed by appropriate statistical tools. Study revealed that majority of TDW involved, feeding the animal, watering the animals, storage of feed & fodder and fodder collection while according participation in breeding practices, it was concluded that majority of dairy women were participation in giving warm water bath after calving, care during pregnancy, detection of heat and involvement during parturition
Keywords: tribal dairy women, participation, animal husbandry, breeding and feeding
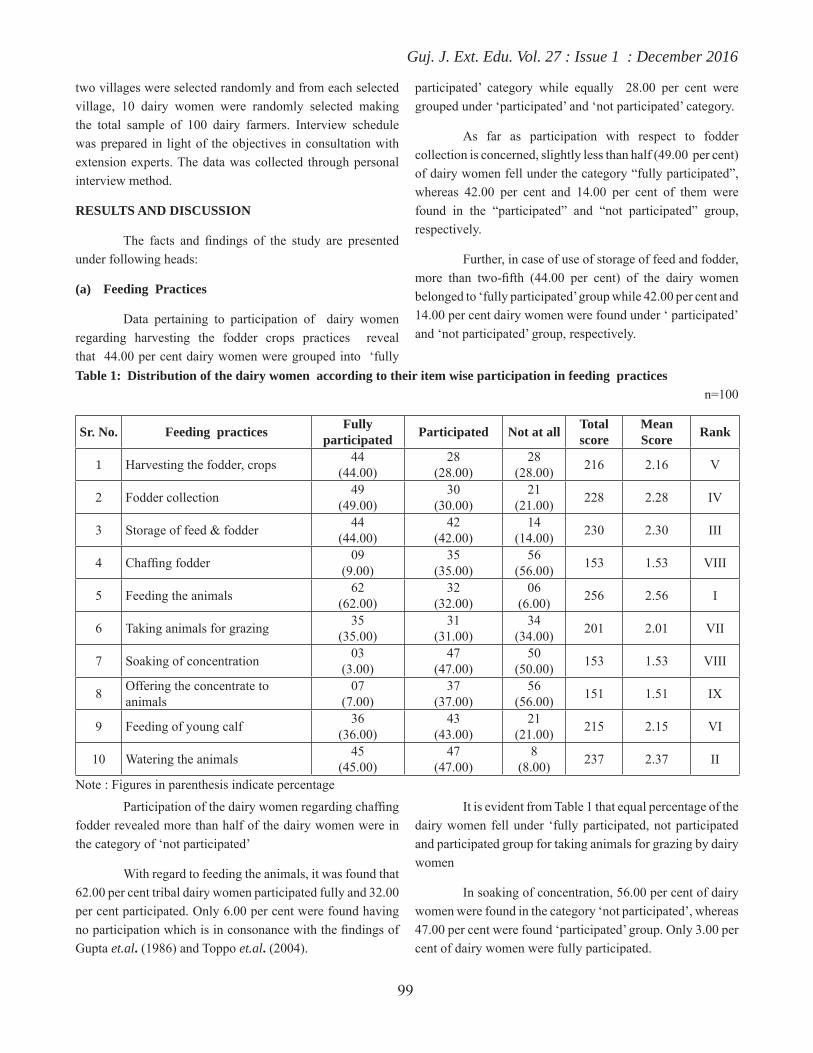
Guj. J. Ext. Edu. Vol. 27 : Issue 1 : December 2016
99
two villages were selected randomly and from each selected village, 10 dairy women were randomly selected making the total sample of 100 dairy farmers. Interview schedule was prepared in light of the objectives in consultation with extension experts. The data was collected through personal interview method.
RESULTS AND DISCUSSION
The facts and findings of the study are presented under following heads:
(a) Feeding Practices
Data pertaining to participation of dairy women regarding harvesting the fodder crops practices reveal that 44.00 per cent dairy women were grouped into ‘fully
participated’ category while equally 28.00 per cent were grouped under ‘participated’ and ‘not participated’ category.
As far as participation with respect to fodder collection is concerned, slightly less than half (49.00 per cent) of dairy women fell under the category “fully participated”, whereas 42.00 per cent and 14.00 per cent of them were found in the “participated” and “not participated” group, respectively.
Further, in case of use of storage of feed and fodder, more than two-fifth (44.00 per cent) of the dairy women belonged to ‘fully participated’ group while 42.00 per cent and 14.00 per cent dairy women were found under ‘ participated’ and ‘not participated’ group, respectively.
Table 1: Distribution of the dairy women according to their item wise participation in feeding practices n=100
Sr. No. Feeding practices Fully participated Participated Not at all Total
scoreMean Score Rank
1 Harvesting the fodder, crops 44(44.00)
28(28.00)
28(28.00) 216 2.16 V
2 Fodder collection 49(49.00)
30(30.00)
21(21.00) 228 2.28 IV
3 Storage of feed & fodder 44(44.00)
42(42.00)
14(14.00) 230 2.30 III
4 Chaffing fodder 09(9.00)
35 (35.00)
56(56.00) 153 1.53 VIII
5 Feeding the animals 62(62.00)
32 (32.00)
06(6.00) 256 2.56 I
6 Taking animals for grazing 35(35.00)
31(31.00)
34(34.00) 201 2.01 VII
7 Soaking of concentration 03(3.00)
47(47.00)
50(50.00) 153 1.53 VIII
8 Offering the concentrate to animals
07(7.00)
37(37.00)
56(56.00) 151 1.51 IX
9 Feeding of young calf 36(36.00)
43(43.00)
21(21.00) 215 2.15 VI
10 Watering the animals 45(45.00)
47(47.00)
8(8.00) 237 2.37 II
Note : Figures in parenthesis indicate percentage
Participation of the dairy women regarding chaffing fodder revealed more than half of the dairy women were in the category of ‘not participated’
With regard to feeding the animals, it was found that 62.00 per cent tribal dairy women participated fully and 32.00 per cent participated. Only 6.00 per cent were found having no participation which is in consonance with the findings of Gupta et.al. (1986) and Toppo et.al. (2004).
It is evident from Table 1 that equal percentage of the dairy women fell under ‘fully participated, not participated and participated group for taking animals for grazing by dairy women
In soaking of concentration, 56.00 per cent of dairy women were found in the category ‘not participated’, whereas 47.00 per cent were found ‘participated’ group. Only 3.00 per cent of dairy women were fully participated.

Guj. J. Ext. Edu. Vol. 27 : Issue 1 : December 2016
100
Same as review in offering the concentration to animal that exactly half (50.00 per cent) of the dairy women were felt under ‘not participated’ whereas 37.00 per cent and 7.00 per cent of respondents were in the group of ‘participated’ and ‘fully participated’, respectively.
In case of feeding of young calf, 43.00 per cent of dairy women were found in the category “participated” followed by 36.00 per cent with “fully participation” and 21.00 per cent with “not participated”.
In the activity of watering animals, it was found that 47.00 per cent tribal dairy women were in the group of participated and 45.00 per cent were fully participated. Only 8.00 per cent women found having no participation.
According to item wise participation related to nutrient practices feeding the animal ranked first with mean score 2.56 followed by watering the animals(2.37), storage of feed & fodder(2.30), fodder collection(2.28), harvesting
the fodder crops(2.16), feeding of young calf(2.15), taking animals for grazing(2.01), chaffing fodder(1.53) and soaking of concentration (1.53) and offering the concentrate to animals(1.51) with ranked II, III, IV, V, VI, VII, VIII, and IX, respectively.
(b) Breeding Practices
Proper and better care of breeding stock helps in developing good dairy herd and getting good returns too. Rural women participation in breeding activities was found to be least among all the selected activities of animal husbandry due to social moves and taboos in society.
The roles of toda women in the context of genetic resources include exotic breeds husbandry (4.52) (for example Toda buffalo, a unique buffalo breed named after toda community), livestock maintenance (4.50) and cultivating domesticated crop varieties (4.03).
Table 2: Distribution of the dairy women according to their item wise participation in breeding practices n=100
Sr. No.
Breeding Practices Fully participated
Participated Not at all Total score
Mean Score
Rank
1 Detection of heat 25(25.00)
54(54.00)
21(21.00)
204 2.04 III
2 To call AI Worker for AI 15(15.00)
45(45.00)
40(40.00)
175 1.75 V
3 Taking animals for A.I./ Natural service
14(14.00)
35(35.00)
51(51.00)
163 1.63 VI
4 Taking animal for pregnancy diagnosis
19(19.00)
48(48.00)
33(33.00)
186 1.86 IV
5 Care during pregnancy 46(46.00)
40(40.00)
14(14.00)
232 2.32 II
6 Involvement during parturition 34(34.00)
36(36.00)
30(30.00)
204 2.04 III
7 Giving warm water bath after calving
48(48.00)
39(36.00)
13(13.00)
235 2.35 I
Note : Figures in parenthesis indicate percentage
With regards detection of heat from data presented in Table-2, it is observed that majority of the dairy women(54.00 per cent) were grouped in ‘participation’ while 25.00 per cent and 21.00 per cent of the dairy women were categorized under ‘fully participation’ and ‘not participation’ group.
The data with respect to call AI Worker for AI, 45.00 per cent of dairy women were participated followed by 40.00 per cent with ‘not participation at all’ and 15.00 per cent with fully participated.
Data presented in Table-2, reveal that more than half
(51.00 per cent) of dairy women were not taking animal for AI/ Natural Services while less than half (48.00 per cent) of dairy women participated in the activity of taking animal for pregnancy diagnosis.
With regards to care during pregnancy, it was found that 46.00 per cent dairy women were having fully participated, whereas 40.00 per cent participated and only 14.00 per cent were fully not participated.
The data presented in Table-2, revealed that 36.00 per cent of dairy women have participated during parturition, while

Guj. J. Ext. Edu. Vol. 27 : Issue 1 : December 2016
101
34.00 per cent and 30.00 per cent with fully participated and not participated during parturition, respectively.
Majority (48.00 per cent) of dairy women fully participated in giving warm water bath after calving, followed by 39.00 per cent with participation and 13.00 per cent with not participation.
According to item wise participation on breeding practices, giving warm water bath after calving ranked first with mean score 2.35 followed by care during pregnancy (2.32), detection of heat and involvement during parturition(2.04), taking animal for pregnancy diagnosis (1.63), to call AI Worker for AI (1.75) and taking animals for A.I./ Natural service (1.63) with rank of II, III, IV, V and VI, respectively. These findings are in conformity with Tripathi and Bhanja (2000), Singh (2003) and Rathod et al. (2011).
CONCLUSION
It is necessary that encourage of tribal farm women for development of his family by appropriate decision and it is a task for government, policy makers and for all to empower the tribal farm women from each and everywhere. Overall observation on participation of tribal farm women in animal husbandry and dairy farming with special reference to feeding practices, majority of tribal dairy women were most important areas ranked first and second, respectively. In breeding related activities, majority of women were more participated in giving warm water bath after calving and care during pregnancy with first and second rank.
REFERENCES
Narmatha, N.; V. Uma.; L. Arun and R. Geetha (2009).Level of participation of women in livestock farming activities. Tamilnadu J. Veterinary and Ani. Sci., 5 (1):4-8
Prajapati R.R., Thakkar K.A. and Prajapati M.R. (2010). Participation of tribal farm women in Dairy and poultry farming. Gujarat J. Ext. Edu. 11 : 91-94
Rathod, P. K., Nikam, T. R., Landge, S., Vajreshwari, S. and Hatey, A. (2011). Participation of rural women in dairy farming in Karnataka. Ind. Res. J. Ext. Edu. 11(2): 31-36
Sethi, N. (2010).Factors affecting adoption of scientific technologies by dairy women in buffaloes. Proc. of International Buffalo Conference, Vol. II, 1-4 Feb, New Delhi. : 166-67
Singh, S. P. (2003). Perfomance of rural women in dairy management practices in Haryana. Indian J. Dairy Sci. 56 (2): 100-106
Toppo, A., Trivedi, M. S. and Patel Ashok (2004). Participation of farm women in dairy occupation. Guj. J. Ext. Edu. 15 (2) : 15-21
Tripathi, H and Bhanja. (2000).Women’s role in small holder production. Proceeding of the international conferrence on small holder production system in developing countries held in Thissur : 550-556
Received : August 2016 : Accepted : October 2016
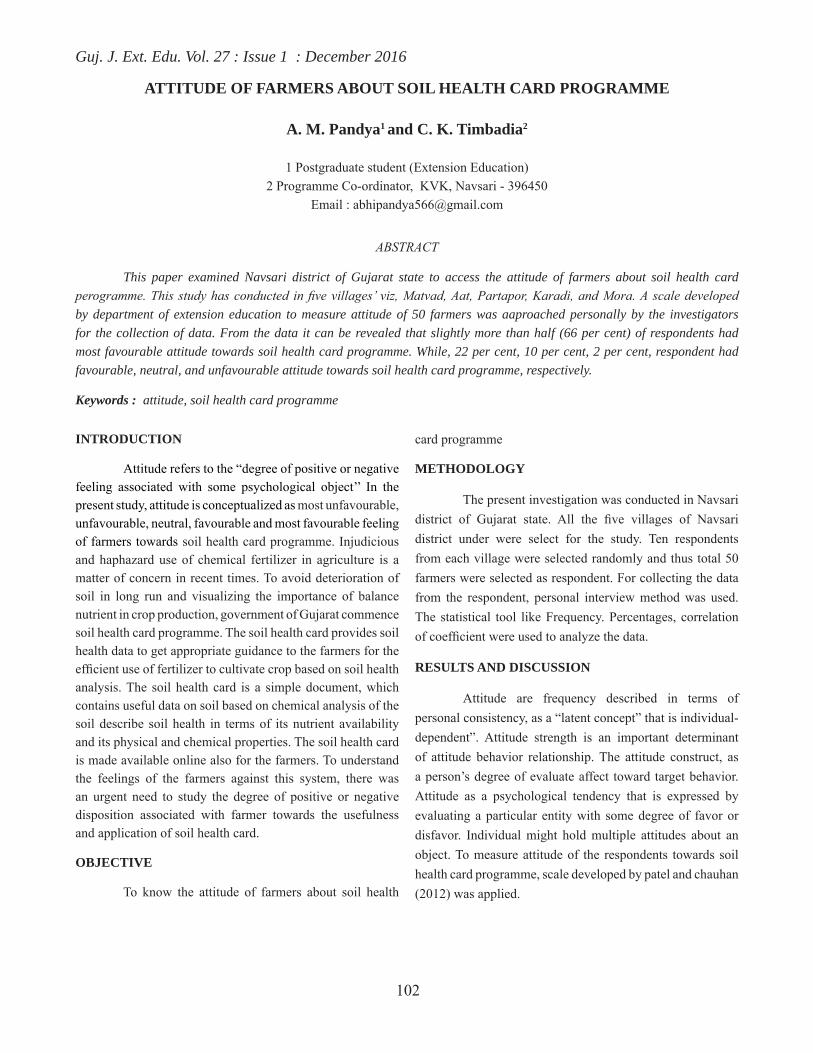
Guj. J. Ext. Edu. Vol. 27 : Issue 1 : December 2016
102
INTRODUCTION
Attitude refers to the “degree of positive or negative feeling associated with some psychological object’’ In the present study, attitude is conceptualized as most unfavourable, unfavourable, neutral, favourable and most favourable feeling of farmers towards soil health card programme. Injudicious and haphazard use of chemical fertilizer in agriculture is a matter of concern in recent times. To avoid deterioration of soil in long run and visualizing the importance of balance nutrient in crop production, government of Gujarat commence soil health card programme. The soil health card provides soil health data to get appropriate guidance to the farmers for the efficient use of fertilizer to cultivate crop based on soil health analysis. The soil health card is a simple document, which contains useful data on soil based on chemical analysis of the soil describe soil health in terms of its nutrient availability and its physical and chemical properties. The soil health card is made available online also for the farmers. To understand the feelings of the farmers against this system, there was an urgent need to study the degree of positive or negative disposition associated with farmer towards the usefulness and application of soil health card.
OBJECTIVE
To know the attitude of farmers about soil health
card programme
METHODOLOGY
The present investigation was conducted in Navsari district of Gujarat state. All the five villages of Navsari district under were select for the study. Ten respondents from each village were selected randomly and thus total 50 farmers were selected as respondent. For collecting the data from the respondent, personal interview method was used. The statistical tool like Frequency. Percentages, correlation of coefficient were used to analyze the data.
RESULTS AND DISCUSSION
Attitude are frequency described in terms of personal consistency, as a “latent concept” that is individual-dependent”. Attitude strength is an important determinant of attitude behavior relationship. The attitude construct, as a person’s degree of evaluate affect toward target behavior. Attitude as a psychological tendency that is expressed by evaluating a particular entity with some degree of favor or disfavor. Individual might hold multiple attitudes about an object. To measure attitude of the respondents towards soil health card programme, scale developed by patel and chauhan (2012) was applied.
ATTITUDE OF FARMERS ABOUT SOIL HEALTH CARD PROGRAMME
A. M. Pandya1 and C. K. Timbadia2
1 Postgraduate student (Extension Education)2 Programme Co-ordinator, KVK, Navsari - 396450
Email : [email protected]
ABSTRACT
This paper examined Navsari district of Gujarat state to access the attitude of farmers about soil health card perogramme. This study has conducted in five villages’ viz, Matvad, Aat, Partapor, Karadi, and Mora. A scale developed by department of extension education to measure attitude of 50 farmers was aaproached personally by the investigators for the collection of data. From the data it can be revealed that slightly more than half (66 per cent) of respondents had most favourable attitude towards soil health card programme. While, 22 per cent, 10 per cent, 2 per cent, respondent had favourable, neutral, and unfavourable attitude towards soil health card programme, respectively.
Keywords : attitude, soil health card programme
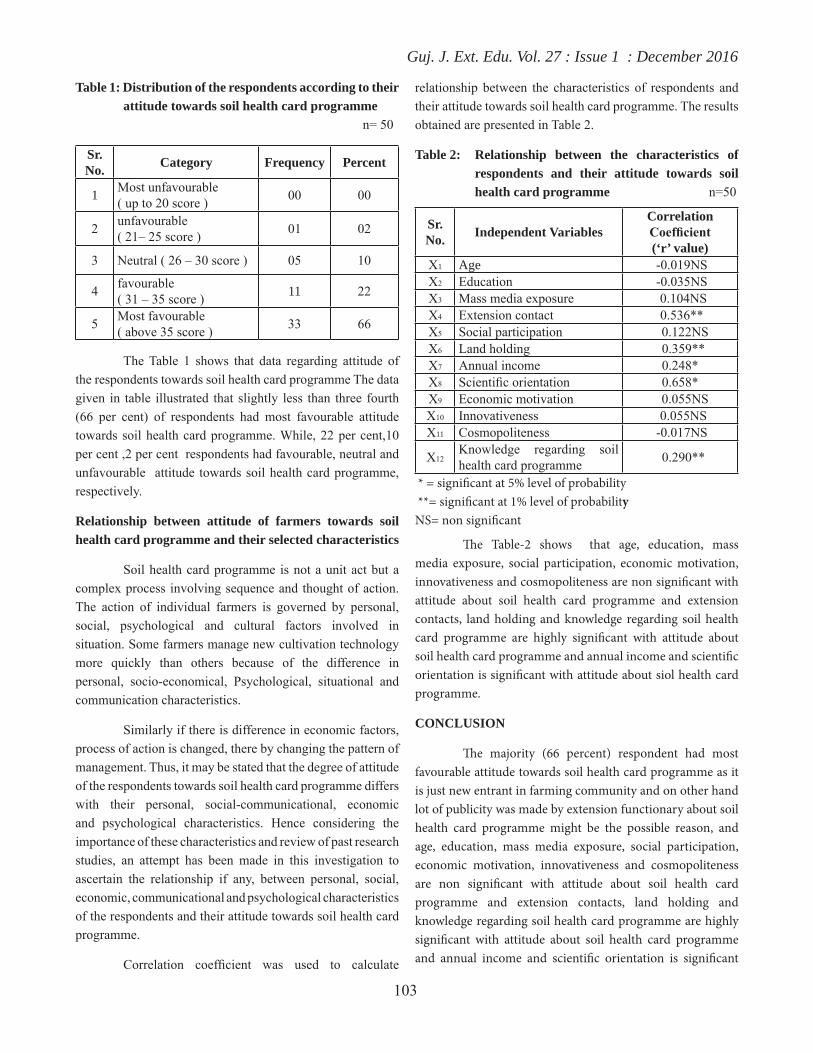
Guj. J. Ext. Edu. Vol. 27 : Issue 1 : December 2016
103
Table 1: Distribution of the respondents according to their attitude towards soil health card programme n= 50
Sr. No. Category Frequency Percent
1 Most unfavourable ( up to 20 score ) 00 00
2 unfavourable ( 21– 25 score ) 01 02
3 Neutral ( 26 – 30 score ) 05 10
4 favourable ( 31 – 35 score ) 11 22
5 Most favourable ( above 35 score ) 33 66
The Table 1 shows that data regarding attitude of the respondents towards soil health card programme The data given in table illustrated that slightly less than three fourth (66 per cent) of respondents had most favourable attitude towards soil health card programme. While, 22 per cent,10 per cent ,2 per cent respondents had favourable, neutral and unfavourable attitude towards soil health card programme, respectively.
Relationship between attitude of farmers towards soil health card programme and their selected characteristics
Soil health card programme is not a unit act but a complex process involving sequence and thought of action. The action of individual farmers is governed by personal, social, psychological and cultural factors involved in situation. Some farmers manage new cultivation technology more quickly than others because of the difference in personal, socio-economical, Psychological, situational and communication characteristics.
Similarly if there is difference in economic factors, process of action is changed, there by changing the pattern of management. Thus, it may be stated that the degree of attitude of the respondents towards soil health card programme differs with their personal, social-communicational, economic and psychological characteristics. Hence considering the importance of these characteristics and review of past research studies, an attempt has been made in this investigation to ascertain the relationship if any, between personal, social, economic, communicational and psychological characteristics of the respondents and their attitude towards soil health card programme.
Correlation coefficient was used to calculate
relationship between the characteristics of respondents and their attitude towards soil health card programme. The results obtained are presented in Table 2.
Table 2: Relationship between the characteristics of respondents and their attitude towards soil health card programme n=50
Sr. No. Independent Variables
Correlation Coefficient(‘r’ value)
X1 Age -0.019NSX2 Education -0.035NSX3 Mass media exposure 0.104NSX4 Extension contact 0.536**X5 Social participation 0.122NSX6 Land holding 0.359**X7 Annual income 0.248*X8 Scientific orientation 0.658*X9 Economic motivation 0.055NSX10 Innovativeness 0.055NSX11 Cosmopoliteness -0.017NS
X12Knowledge regarding soil health card programme 0.290**
* = significant at 5% level of probability **= significant at 1% level of probability NS= non significant
The Table-2 shows that age, education, mass media exposure, social participation, economic motivation, innovativeness and cosmopoliteness are non significant with attitude about soil health card programme and extension contacts, land holding and knowledge regarding soil health card programme are highly significant with attitude about soil health card programme and annual income and scientific orientation is significant with attitude about siol health card programme.
CONCLUSION
The majority (66 percent) respondent had most favourable attitude towards soil health card programme as it is just new entrant in farming community and on other hand lot of publicity was made by extension functionary about soil health card programme might be the possible reason, and age, education, mass media exposure, social participation, economic motivation, innovativeness and cosmopoliteness are non significant with attitude about soil health card programme and extension contacts, land holding and knowledge regarding soil health card programme are highly significant with attitude about soil health card programme and annual income and scientific orientation is significant

Guj. J. Ext. Edu. Vol. 27 : Issue 1 : December 2016
104
with attitude about siol health card programme.
REFERENCES
Dabhi, R. A. (2002). Impact of participatory irrigation management society on techno economic change of farmers of anand district in Gujarat state. Unpublished Ph.D. (Agri.). Thesis, AAU, Anand
Patel, J. K. and Chauhan, N. B. (2012). Attitude of farmers towards soil health card (SHC) programme. An Asian Journal of Soil Science
Patel, N. G. (2013). Attitude of farmers towards soil health card programme. M.Sc. (Agri). Thesis, (Unpub.), Anand
Patel, R. C. (2000). A study on the consequences of adoption of watershed management technology by beneficiary farmer in watershed area of kheda district of Gujarat state. Ph.D. Thesis, (Unpub.). G. A.U, Sardar krushinagar
Received : September 2016 : Accepted : Novmeber 2016

Guj. J. Ext. Edu. Vol. 27 : Issue 1 : December 2016
105
INTRODUCTION
Nursery is a place where plants are cultivated and grown to usable size. The nursery management gained a status of commercial venture where retailer nurseries sell planting materials to the general public, wholesale nurseries which sell only to the other nurseries and to commercial landscape gardeners and private nurseries which supply the needs of the institutions or private estates, since most of the horticultural crops all the related aspects to nursery for production of quality panting materials.
Management is an important factor to utilize these available resources and accumulate capital in effective manner. Gradual but steady development of society required the development of this agency management. Today, we find management is playing an immense role at every place. In future the growth of different sectors including agriculture and society depends upon the efficiency of management. That is why; we find that the pace of management development is faster than the other disciplines.
OBJECTIVE
To ascertain the relationship between selected
characteristics of small scale horticultural nursery growers and their management efficiency
METHODOLOGY
The present study was conducted in South Gujarat region. Out of seven districts of South Gujarat, Navsari and Valsad districts were purposively selected for the study because these two districts are the leading horticulture nursery crops growing districts of South Gujarat. Vansda taluka and Valsad taluka were selected purposively from Navsari and Valsad district, respectively because in these talukas, villages farmers were engaged in small scale horticultural nursery business. Doldha and Kamboya villages from Vansda taluka while Bhomapardi and Ronvel villages from Valsad taluka were purposively selected for the study because in these villages of Vansda and Valsad taluka most of the farmers doing small scale horticultural nursery business. A random sampling technique was followed for selection of respondents from selected village. Thereafter, 25 farmers from each village were selected randomly. Thus, total 100 small scale horticultural nursery growers were selected as respondents from four selected villages.
RELATIONSHIP BETWEEN THE PROFILE OF SMALL SCALE HORTICULTURAL NURSERY GROWERS AND THEIR MANAGEMENT EFFICIENCY
A.G.Patel1 and H.U.Vyas2
1 P.G. Student, NMCA, NAU, Navsari - 396450 2 Associate Professor, DEE, NAU, Navsari - 396450
Email : patelankit07477.gmail.com
ABSTRACT
The present investigation was carried out in the Navsari and Valsad districts of south Gujarat. Vansda taluka and Valsad taluka were selected purposively from Navsari and Valsad district, respectively. Doldha and Kamboya villages from Vansda taluka while Bhomapardi and Ronvel villages from Valsad taluka were purposively selected for the study. A random sampling technique was followed for selection of respondents from selected village. Thereafter, 25 farmers from each village were selected randomly. Thus, total 100 small scale horticultural nursery growers were selected as respondents from four selected villages. A result of a study revealed that only age was negatively and non-significantly correlated with management efficiency of small scale horticultural nursery growers. Social participation, extension contact, mass media exposure and market orientation were positively and significantly correlated at 0.05 level of probability with management efficiency of small scale horticultural nursery growers. Education, experience, land holding, annual income, economic motivation, risk orientation and scientific orientation were positively and highly significantly correlated at 0.01 level of probability with management efficiency of small scale horticultural nursery growers.
Keywords: management efficiency, small scale horticultural nursery growers
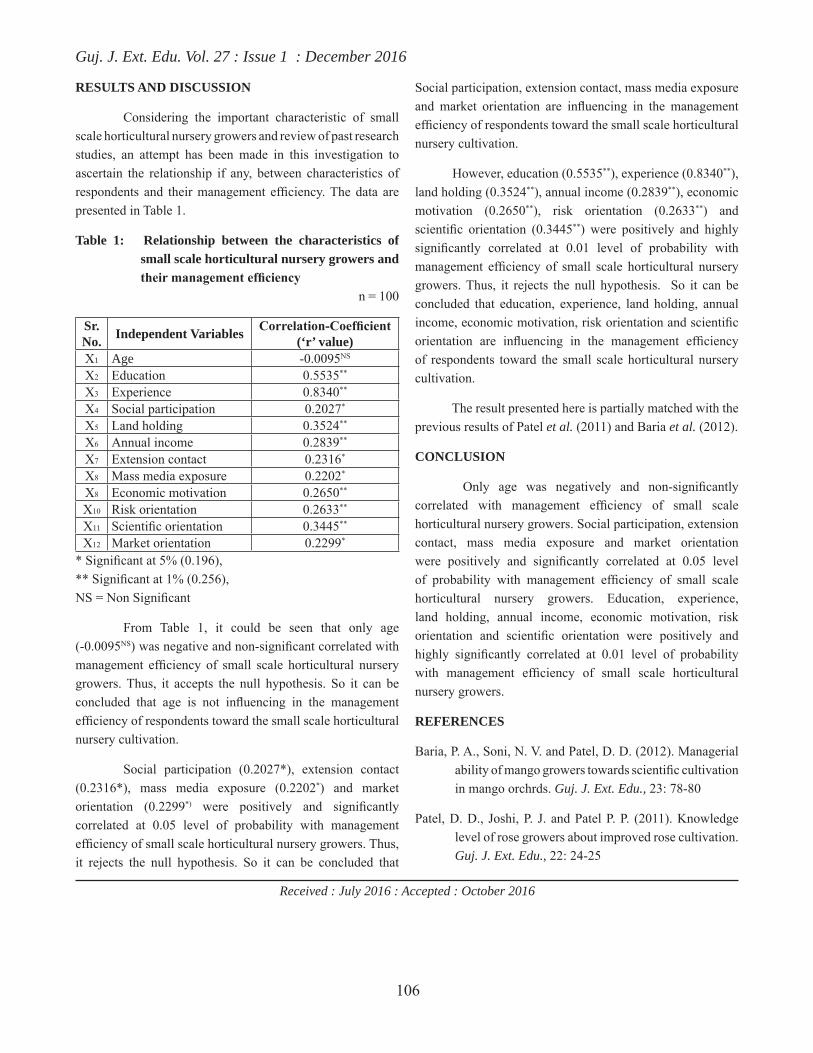
Guj. J. Ext. Edu. Vol. 27 : Issue 1 : December 2016
106
RESULTS AND DISCUSSION
Considering the important characteristic of small scale horticultural nursery growers and review of past research studies, an attempt has been made in this investigation to ascertain the relationship if any, between characteristics of respondents and their management efficiency. The data are presented in Table 1.
Table 1: Relationship between the characteristics of small scale horticultural nursery growers and their management efficiency n = 100
Sr. No. Independent Variables Correlation-Coefficient
(‘r’ value)X1 Age -0.0095NS
X2 Education 0.5535**
X3 Experience 0.8340**
X4 Social participation 0.2027*
X5 Land holding 0.3524**
X6 Annual income 0.2839**
X7 Extension contact 0.2316*
X8 Mass media exposure 0.2202*
X8 Economic motivation 0.2650**
X10 Risk orientation 0.2633**
X11 Scientific orientation 0.3445**
X12 Market orientation 0.2299*
* Significant at 5% (0.196), ** Significant at 1% (0.256), NS = Non Significant
From Table 1, it could be seen that only age (-0.0095NS) was negative and non-significant correlated with management efficiency of small scale horticultural nursery growers. Thus, it accepts the null hypothesis. So it can be concluded that age is not influencing in the management efficiency of respondents toward the small scale horticultural nursery cultivation.
Social participation (0.2027*), extension contact (0.2316*), mass media exposure (0.2202*) and market orientation (0.2299*) were positively and significantly correlated at 0.05 level of probability with management efficiency of small scale horticultural nursery growers. Thus, it rejects the null hypothesis. So it can be concluded that
Social participation, extension contact, mass media exposure and market orientation are influencing in the management efficiency of respondents toward the small scale horticultural nursery cultivation.
However, education (0.5535**), experience (0.8340**), land holding (0.3524**), annual income (0.2839**), economic motivation (0.2650**), risk orientation (0.2633**) and scientific orientation (0.3445**) were positively and highly significantly correlated at 0.01 level of probability with management efficiency of small scale horticultural nursery growers. Thus, it rejects the null hypothesis. So it can be concluded that education, experience, land holding, annual income, economic motivation, risk orientation and scientific orientation are influencing in the management efficiency of respondents toward the small scale horticultural nursery cultivation.
The result presented here is partially matched with the previous results of Patel et al. (2011) and Baria et al. (2012).
CONCLUSION
Only age was negatively and non-significantly correlated with management efficiency of small scale horticultural nursery growers. Social participation, extension contact, mass media exposure and market orientation were positively and significantly correlated at 0.05 level of probability with management efficiency of small scale horticultural nursery growers. Education, experience, land holding, annual income, economic motivation, risk orientation and scientific orientation were positively and highly significantly correlated at 0.01 level of probability with management efficiency of small scale horticultural nursery growers.
REFERENCES
Baria, P. A., Soni, N. V. and Patel, D. D. (2012). Managerial ability of mango growers towards scientific cultivation in mango orchrds. Guj. J. Ext. Edu., 23: 78-80
Patel, D. D., Joshi, P. J. and Patel P. P. (2011). Knowledge level of rose growers about improved rose cultivation. Guj. J. Ext. Edu., 22: 24-25
Received : July 2016 : Accepted : October 2016
Guj. J. Ext. Edu. Vol. 27 : Issue 1 : December 2016
107
INTRODUCTION
Soybean has an important place in world’s oilseed cultivation scenario, due to its high productivity, profitability and vital contribution towards maintaining soil fertility. Presently soybean contributes 43 % to the total oilseeds and 25% to the total oil production in the country. Currently, India ranks fourth in respect to production of soybean in the world. Soybean is a short duration cash crop.
Dahod has a large tribal population having agriculture as major source of livelihood. Soybean is introduced in Dahod district of Gujarat state because of Soybean has largely been responsible in uplifting farmer’s economic status in many pockets of the country. It usually fetches higher income to the farmers owing to the huge export market for soybean de-oiled cake. Moreover the land of this district is most suitable for the crop. The productivity of Soybean in the state at present is 810 kg ha-1 which is less than the national Average (983 kg ha-1). This may be due to reason that Soybean is a new crop, all scientific cultivation
practices may not have reached to the farmers and hence may not have adopted by the farmers. therefore the present study “Training needs of tribal farm women in Soybean production technology in Dahod district” was undertaken.
OBJECTIVE
To know the training needs of tribal farm women in soybean production technology
METHODOLOGY
The present study was conducted in Devgadh Baria and Limkheda talukas of Dahod district of Gujarat. Five villages were selected randomly from each Taluka and 10 tribal farm women were randomly selected from each village, thus making the total sample of 100 tribal farm women. To assess the training need of tribal farm women, a well structured pre tested Gujarati version interview schedule was prepared. Each respondent was asked to mention their response against the training needs on three point continuum viz ‘most needed’, ‘needed’, and ‘not needed’ for which a
TRAINING NEEDS OF TRIBAL FARM WOMEN IN SOYBEAN PRODUCTION TECHNOLOGY
G.J.Patel1, S. G. Vahora2 and G. N. Thorat3
1 Professor and unit head, Tribal Research Cum Training Centre, AAU, Devgadh Baria - 389 380.2 Associate Professor, Pashu Vigyan Kendra, TRTC, AAU, Devgadh Baria - 3893803 Assistant Professor, Pashu Vigyan Kendra, TRTC, AAU, Devgadh Baria - 389380
Email : [email protected]
ABSTRACT
Training is a central component of human resource development which can generate desirable changes in the behavioral component such as knowledge, skill and attitude. In the farming sector, training forms an important tool to sharpen and hone the skills of farmers to aid them in the effective adoption of improved soybean production technologies. Soybean is such a crop for which the farmers of Gujarat are showing interest and area under the crop is increasing gradually. The demand of soybean seed also increased because of remunerative price they getting from the crop. Hence, the study entitled “Training Needs of tribal farm women in Soybean production technology in Dahod district of Gujarat” was undertaken. 100 Tribal farm women randomly selected from two talukas and 10 villages of Dahod district as sample for the study. Majority of tribal farm women were expressed that identification of disease of Soybean crop ranked first with mean score (2.70), followed by selection of variety (2.60) identification of pest with mean score 2.58, fertilizer management with score 2.3 and seed treatment with mean score 2.28, and ranked with II, III, IV and V, respectively.
Keywords: training need, tribal women soybean and production technology

Guj. J. Ext. Edu. Vol. 27 : Issue 1 : December 2016
108
score of 2, 1 and 0 respectively was given. Training need index (TNI) was also computed with help of following formula (Kanaga 1988, Patil and Kokate, 2011). Frequency was worked out and ranking was given to each based on the relative score.
TNI = (Total obtained score/Maximum obtainable score) X 100
The training need index was also used to prioritize the training need of tribal farm women in relation to Soybean production technology.
RESULTS AND DISCUSSIONTable 1: Training need of tribal farm women in soybean production technology
n=100
Sr. No.
Item Most needed
Needed Not needed
Total Score
Mean Score
Rank
1 Selection of variety 03 34 63 260 2.60 II2 Land management 33 41 26 193 1.93 XIV3 Seed Treatment 09 54 37 228 2.28 V4 Sowing 23 35 42 219 2.19 VII5 Weed management 35 26 39 204 2.04 XI6 Fertilizer management 10 49 41 231 2.31 IV7 Irrigation Management 28 43 29 201 2.01 XIII8 Use of Biofertlizer and chemical fertilizer 18 41 41 223 2.23 VI9 Integrated Diseases management
Identification of Disease 04 22 74 270 2.70 1Bio-control 22 53 25 203 2.03 XIIChemical control 14 55 31 217 2.17 VIII
10 Integrated Pest managementIdentification of Disease 06 30 64 258 2.58 IIIBio-control 24 46 30 206 2.06 XChemical control 24 40 36 212 2.12 IX
11 Harvesting, Threshing and storage 54 39 07 153 1.53 XV It is observed from the data presented in Table-1, that more than three-fifth (63.00 per cent) of the tribal farm women opted the training on selection of variety as “not needed”, while 34.00 per cent and 3.00 per cent of the tribal farm women opted it as “needed” and “most needed”, respectively. Data pertaining to training needs of tribal farm women regarding land management reveal that slightly more than two-fifth (41.00 per cent) tribal farm women were grouped into ‘needed’ category while 33.00 per cent and 26.00 per cent were grouped under ‘most needed’ and ‘not needed’ category, respectively.
As far as training need with respect to seed treatment is concerned, more than half of tribal farm women fell under the category “needed”, whereas 37.00 per cent and 9.00 per cent of them were found in the “not needed” and “most needed” training group, respectively.
Further, in case of sowing, more than two-fifth (42.00 per cent) of the tribal farm women belonged to ‘Not needed’ group while 35.00 per cent and 23.00 per cent dairy
farmer were found under “needed” and “most needed” group, respectively.
It is evident from Table-1 that more than 39.00 per cent of the tribal farm women in weed management fell under ‘not needed’ training group followed by 35.00 per cent with “Most needed” and 26.00 per cent with “Needed” group. Data pertaining to training needs of the tribal farm women regarding fertilizer management revealed that nearly half (49.00 per cent) of tribal farm women ‘needed’ category while 41.00 per cent of respondents were grouped under ‘not needed’ category.
Training needs of the tribal farm women regarding irrigation management 43.00 per cent were fell under ‘needed’ training group followed by equal percentage of tribal farm women felt under the “Not needed” and “Most needed” training group. From data in Table: 3, it can be observed that equal percentage (41.00 per cent) of the tribal farm women opined for the training on use of bio-fertilizer and chemical fertilizer as “needed” and “not needed” .

Guj. J. Ext. Edu. Vol. 27 : Issue 1 : December 2016
109
As far as training need with respect to integrated disease management is concerned, vast majority of tribal farm women felt under “not needed” group for identification of disease while more than half of the tribal farm women felt under the “needed” group for decease control.
With regard to training need in integrated pest management, majority of tribal farm women felt under “not needed” group for identification of disease while more than two-fifth of the tribal farm women felt under the “needed” group for pest control.
Training needs of the tribal farm women regarding harvesting, threshing and storage management more than half (54.00 per cent) of tribal farm women were fell under ‘Most needed’ training group followed by 39.00 per cent with “needed” and only 7.00 per cent were felt under the “Not needed” training group.
According to item wise training needs related to Soybean production technology hierarchy, identification of disease of Soybean crop ranked first with mean score (2.70), followed by selection of variety (2.60) identification of pest with mean score 2.58, fertilizer management with score 2.3 and seed treatment with mean score 2.28, and ranked with II, III, IV and V, respectively. Similar results was reported by Prajapati et al. (2015). Majority of respondents prefer to receive training on Oil engine repairing and Micro irrigation systems followed by Seed production and Control measures of pest and disease reported by Patel at al., (2015).
CONCLUSION
From the foregoing discussion, it can be concluded that areas of training needs expressed by tribal farm women
in the field of agriculture were identification of disease, identification of pest, selection of variety and seed treatment. Based on the training need of Tribal farm women in Soybean production technology suitable extension programme should be formulated and implemented in scientific dairy farming. The training strategies can be formulated and course syllabus can be redesigned to impart knowledge and skill to the tribal farm women by various training institutes and state department of Agriculture and state agricultural universities. Emphasis must be given up identification of disease of Soybean crop, selection of variety, identification of pest, fertilizer management and seed treatment.
References:
Kanaga, K. S. (1988). Training needs in agriculture of ‘irulas’ and ‘attapady’ unpublished M. Sc. Agri. Thesis (Unpub.) KAU, College of Agriculture, Vellayani
Patel K.S., Pandya S.P. and Prajapati M.R. (2015). Training Need Assessment of Visitor Farmers of ATIC Regarding Groundnut Production Technology. Guj. J. Ext. Edu. 26(2):165-168
Patil, S. S. and Kokate K. D. (2011). Training need assessment of Subject matter specialists of Krishi Vigyan Kendra. Indian Research J. of Exten. Edu, 11(1) : 18-22.
Prajapati V.V., Prajapati D. M. and Patel B.K.(2015) Training Needs of Tribal Farmers in Agriculture. Guj. J. Ext. Edu. 26(1): 112-115
Received : September 2016 : Accepted : November 2016
Guj. J. Ext. Edu. Vol. 27 : Issue 1 : December 2016
110
INTRODUCTION
Information and Communications Technologies (ICTs), broadly defined, facilitate by electronic means the creation, storage, management and dissemination of information. ICT is both a vehicle for communication and a means of processing information. ICTs are part of the economic infrastructure that supports global production, trade, investment and capital flows. ICTs are means by which individuals, institutions and organizations network, undertake activities, and participate in the development process at local, national and global levels. Specifically the ICT industry is the main driver of the economies of countries like India and China. Technology is fuelling innovation and productivity, and there are signs of fundamental change in markets and user behavior, as countries move towards a knowledge-based economy.
The Information and Communication Technology (ICT) in this era of globalization has accentuated new modes of knowledge transformation and communication patterns. ICT has opened up uncommon opportunities for developing countries in terms of providing low cost access to information. This is the fastest growing tool of communication ever with
the number of users growing from 150 million in 1998 to more than 700 million in 2001 ( Brown, 2002 ). Considering this, use of ICT in agricultural university is of strategic importance in a country like India. ICT have tremendous potential in timely collection of data and distributing it to the potential users even in developing countries, thus, providing low cost access to information.
While the term ‘ICT’ can be interpreted as including a wide variety of media, ICT is used to denote “the use of computers and the communication systems between computers (Anon, 1999). ICT, however have the potential of getting vast amount of information for Agricultural University in a more timely, comprehensive and cost effective manner. The ICT are becoming more accessible and users can obtain information from various sources, one computer could meet the needs of a large community. These modern technologies offer new and multiple perspectives, such as faster and better-focused access to information. Electronic mail is the most commonly used ICT that has brought a cultural revolution in the way individuals and organizations interact, in terms of time, cost and distance. Another most significant use of ICT is the World Wide Web, which enables user to access
ICT- ENABLED SERVICES FOR ANAND AGRICULTURAL UNIVERSITY
S.H. Bhojani1, R.S. Parmar2 and D.R. Kathiriya3
1 Assistant Professor, Office of DIT, AAU, Anand - 3881102 Associate Professor, College of AIT, AAU, Anand - 3881103 Principal & Dean, College of AIT, AAU, Anand - 388110
Email : [email protected]
ABSTRACT
ICT technology has had an enormous impact on Anand Agricultural University. This paper aimed at ascertaining the ICT-enabled services in Anand Agricultural University, Anand, Gujarat, India. The study employed a case study design. The study found that some services such as Web Site, Web Mail Service, Online Tour Program , Mobile Based Application for Farmers, Online Bill Processing System, internet and internet services were ICT -enabled or driven. The critical constraints to ICT -enabled services include poor funding, inadequate ICT infrastructure and inadequate ICT staff. To address these problems, it was suggested that there should be budget provision for ICT projects and series and that private sector investment should be promoted in university. Based on these findings, some recommendations were made. Anand Agricultural University, as platform for innovation and creativity requires proper understanding of the status of services, project implementation and ICT applications including services that are ICT driven. This understanding will not only improve ICT-enabled services but also provide opportunities for innovative services. This paper provides a framework for understanding the status of ICT-enabled services due to developments in ICT in Anand Agricultural University.
Keywords: information, communication, technology, services.

Guj. J. Ext. Edu. Vol. 27 : Issue 1 : December 2016
111
information on millions of computers.
In a broad sense, ICT enabled services can be defined as: “Systems that enable value co-creation through the development and implementation of information and communication technology enabled processes that integrate system value propositions with user value drivers.”
METHODOLOGY
ICT enabled services has been implemented as a layered structure having three layers viz., User Interface layer (UIL), Application layer (APL) and Database layer (DBL). Each layer has its own specific functions. Applications are usually broken into logical chunks called “tiers”, where every tier is assigned a role. Traditional applications consist only of 1 tier, which resides on the client machine, but web applications lend themselves to an n-tiered approach by nature. Though many variations are possible, the most common structure is the three-tiered application. In its most common form, the three tiers are called presentation, application and storage, in this order. A web browser is the first tier (presentation), an engine using some dynamic Web content technology (such as ASP, ASP.NET, CGI, ColdFusion, JSP/Java, PHP, Perl, Python, Ruby on Rails or Struts2) is the middle tier (application logic), and a database is the third tier (storage).
The web browser sends requests to the middle tier, which services them by making queries and updates against the database and generates a user interface. In a three-tier architecture (also known as a multi-tier architecture), there are three or more interacting tiers, each with its own specific responsibilities (see Fig. 1).
RESULTS AND DISCUSSION
Anand Agricultural University (AAU) was
established in 2004 at Anand with the support of the Government of Gujarat, Act No.(Guj 5 of 2004) dated April 29, 2004. Caved out of the erstwhile Gujarat Agricultural University (GAU), the dream institution of Sardar Vallabhbhai Patel and Dr. K. M. Munshi, the AAU was set up to provide support to the farming community in three facets namely education, research and extension activities in Agriculture, Horticulture ,Engineering, Product Processing and Home Science. At present there seven colleges, seventeen Research Centers and six Extension Education Institute working in nine districts of Gujarat namely Ahmedabad, Anand, Dahod, Kheda, Panchmahal, Vadodara, Mahisagar, Botad and Chhotaudepur.
The Directorate of Information Technology at Anand Agricultural University caters the demand for the use of Information Technology for the Anand Agricultural University. Internet, Intranet, ERP, AAU Web-mail, E- Library, CAB Database, J-Gate, Science Direct Personalizing Research, Annual Reviews, Springer Link and Consortium for e-Resources in Agriculture services at Anand Agricultural University have been provided and maintained through Local Area Network (LAN) having broadband connectivity. Some ICT-enabled services for Anand Agricultural University are as follows:
Web Site
Directorate of Information Technology has prepared a Web Site for Anand Agricultural University; the domain name is http://aau.in. This web site includes various aspects and activities of Anand Agricultural University like administration, faculties, colleges, education, and extension, e-library, tender, Right to Information Act etc (see Fig. 2).
Fig. 1: Three-Tier Architecture (http://tutorials.jenkov.com/software-architecture/n-tier-architecture.html)
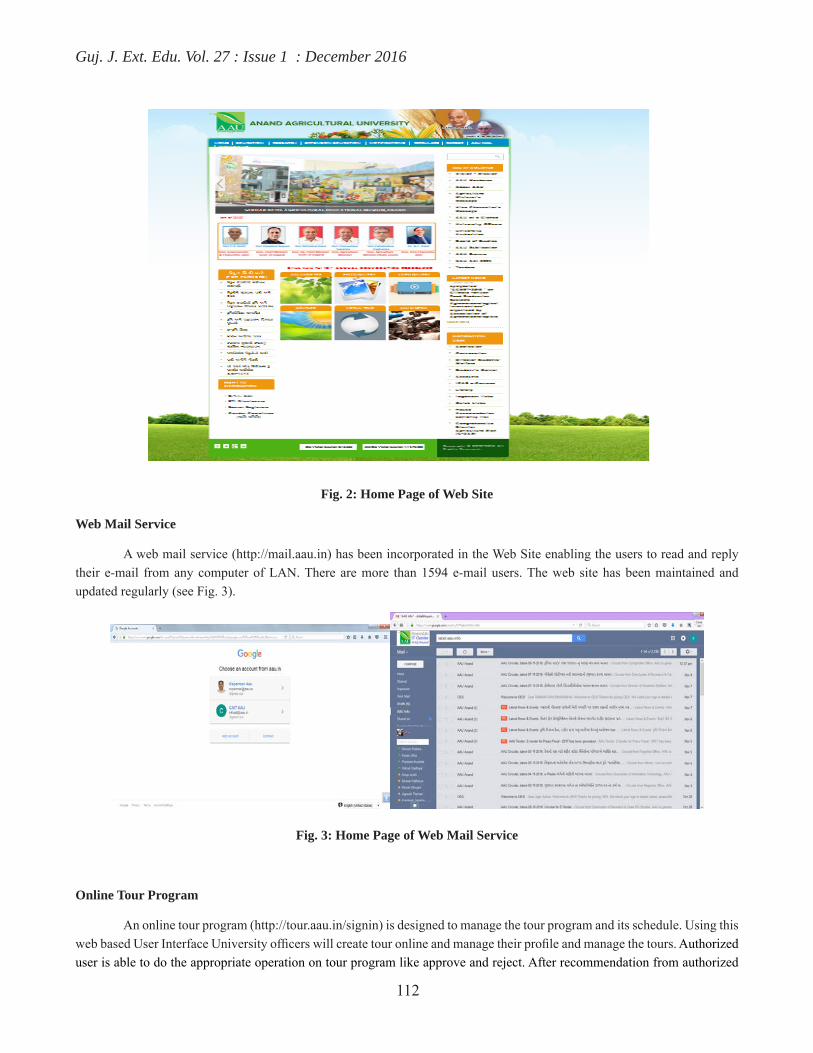
Guj. J. Ext. Edu. Vol. 27 : Issue 1 : December 2016
112
Fig. 2: Home Page of Web Site
Web Mail Service
A web mail service (http://mail.aau.in) has been incorporated in the Web Site enabling the users to read and reply their e-mail from any computer of LAN. There are more than 1594 e-mail users. The web site has been maintained and updated regularly (see Fig. 3).
Fig. 3: Home Page of Web Mail Service
Online Tour Program
An online tour program (http://tour.aau.in/signin) is designed to manage the tour program and its schedule. Using this web based User Interface University officers will create tour online and manage their profile and manage the tours. Authorized user is able to do the appropriate operation on tour program like approve and reject. After recommendation from authorized

Guj. J. Ext. Edu. Vol. 27 : Issue 1 : December 2016
113
user it will displays for Approval or at next level recommending user. After successfully created tour, user will get SMS or E-mail. User can see various reports like tentative report, tour list report, TA-DA report, analysis report etc. User can also search the tour program (see Fig. 4).
Fig. 4: Dashboard of an Online Tour Program
Online Bill Processing System
The Online Bill Processing System gives financial report of University. The system user (accountant) enters all scheme entry and grant allocated unit wise. Unit wise account officer user enters pay allowances and contingency. System user (accountant) can check bill and pass bill and can also see various report. Admin can generate various report as well as they able to print and export to excel (see Fig. 5).
Fig. 5: Account user functionality
Mobile Based Application for Farmers
The mobile based application system (http://ikhedut.aau.in) gives the information of farming and animal husbandry for farmers. Farmers can ask question related of crops and animal husbandry and scientist give their answer. Farmers can download the application from Google Play apps and they can see this application offline when and where required. Admin can create various categories (see Fig. 6).

Guj. J. Ext. Edu. Vol. 27 : Issue 1 : December 2016
114
Fig. 6: Home page of Mobile Based Application
Document Management System
The Document Management system (http://172.16.31.232/DMS_AAU) manages the document version hierarchy within the department/university. The system is based on the departmental authority levels. User can manage different versions of any document. User can search and download any version document. The system can have admin module and user module. Admin can manage all the activities for the system. User can print and download the different kind of reports as per their needs (see Fig. 7).
Fig. 7: Dashboard of Document Management System
CONCLUSION
� Over the past decade, access to ICT in agricultural university has grown rapidly, a development enabled by changes in technologies, policies, and markets.
� Technological innovations and policy reforms over the past decade have opened opportunities for the agricultural university, which has been critical to the expansion of access.
� The increase in ICT access and use has been accompanied by some important issues and constraints.
Anand Agricultural University has to adapt policies and regulations to the rapid changes in technology and market structure.
� ICT now make it possible to collect and leverage huge amounts of critical data at minimal costs—thus making agricultural university operations more insight driven, and potentially more productive and efficient.
� Innovative use of ICT in the agricultural university service will deliver better value for users by creating efficiencies through integration, consolidation and sharing of common infrastructure, systems and resources.
Guj. J. Ext. Edu. Vol. 27 : Issue 1 : December 2016
115
� Adoption and facilitation of ICTs will increase productivity, improve the relationship between scientists, students and farmers and will deliver social and economic benefits for agricultural university.
� Integrated services and increased data sharing will drive significant efficiencies; will facilitate insight driven decision making; will increase openness and transparency between agricultural university and the farmers; and will provide a much higher user experience and quality of service.
REFERENCES
Anonymous (1999). ‘Reducing poverty through agricultural sector: Strategies in eastern and southern Africa.’ Proceedings of a workshop organized by CTA
and the European commission. Wageningen, The Netherlands, 23 – 25 November 1998 : 96
Brown, M. M. (2002). ‘Can ICTs address the needs of the poor?’ Choices, 10 (2):4.
http://aau.in
http://ikhedut.aau.in/
http://mail.aau.in
http://tour.aau.in/signin
http://tutorials.jenkov.com/software-architecture/n-tier-architecture.html
http://172.16.31.232/DMS_AAU/
Received : August 2016 : Accepted : November 2016
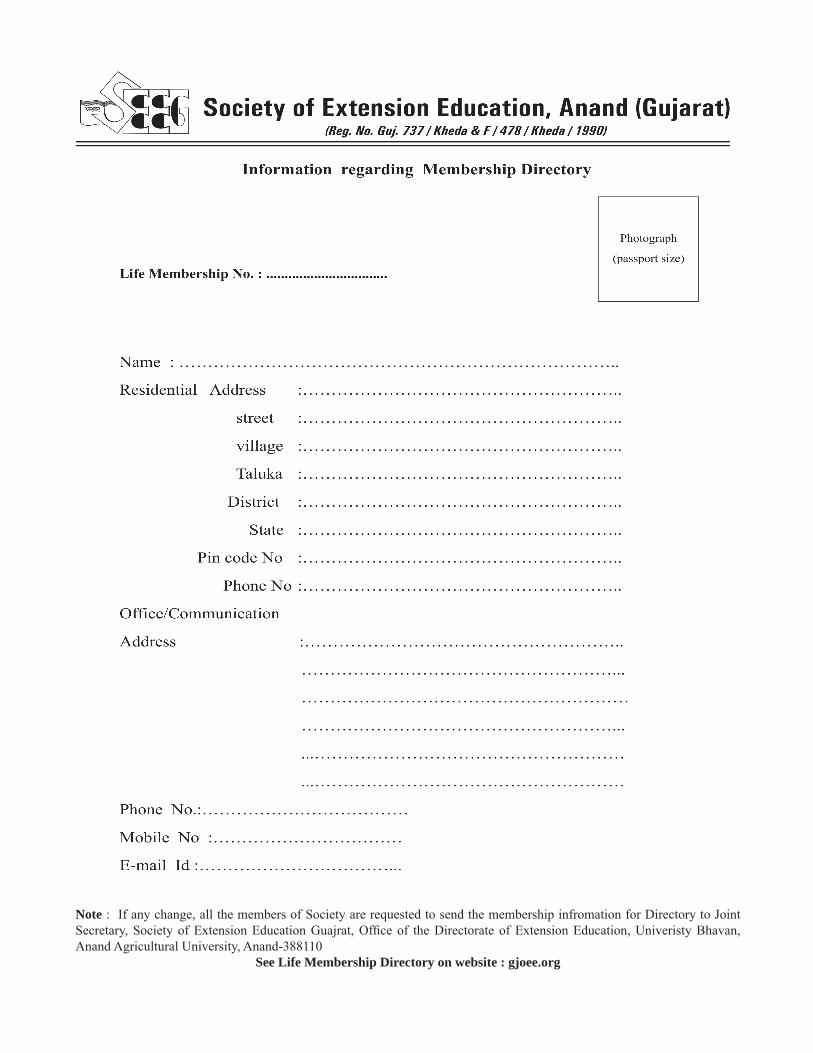
Note : If any change, all the members of Society are requested to send the membership infromation for Directory to Joint Secretary, Society of Extension Education Guajrat, Office of the Directorate of Extension Education, Univeristy Bhavan, Anand Agricultural University, Anand-388110
See Life Membership Directory on website : gjoee.org
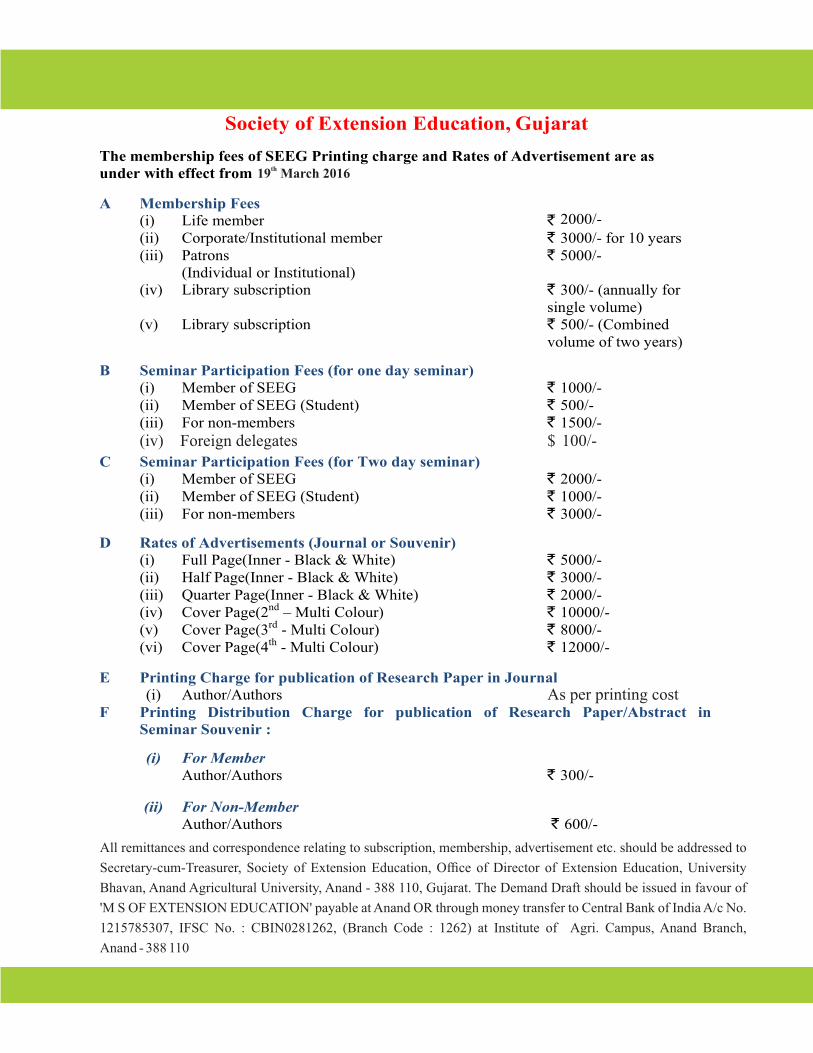
Related Documents


