SSI Annual Statistical Report, 2006 Social Security Administration Office of Policy Office of Research, Evaluation, and Statistics 500 E Street, SW, 8th Floor Washington, DC 20254 SSA Publication No. 13-11827 Released: September 2007

Welcome message from author
This document is posted to help you gain knowledge. Please leave a comment to let me know what you think about it! Share it to your friends and learn new things together.
Transcript

8/14/2019 Social Security: ssi asr06
http://slidepdf.com/reader/full/social-security-ssi-asr06 1/129
SSI AnnualStatistical Report,
2006
Social Security AdministrationOffice of PolicyOffice of Research, Evaluation, and Statistics500 E Street, SW, 8th FloorWashington, DC 20254
SSA Publication No. 13-11827
Released: September 2007
8/14/2019 Social Security: ssi asr06
http://slidepdf.com/reader/full/social-security-ssi-asr06 2/129
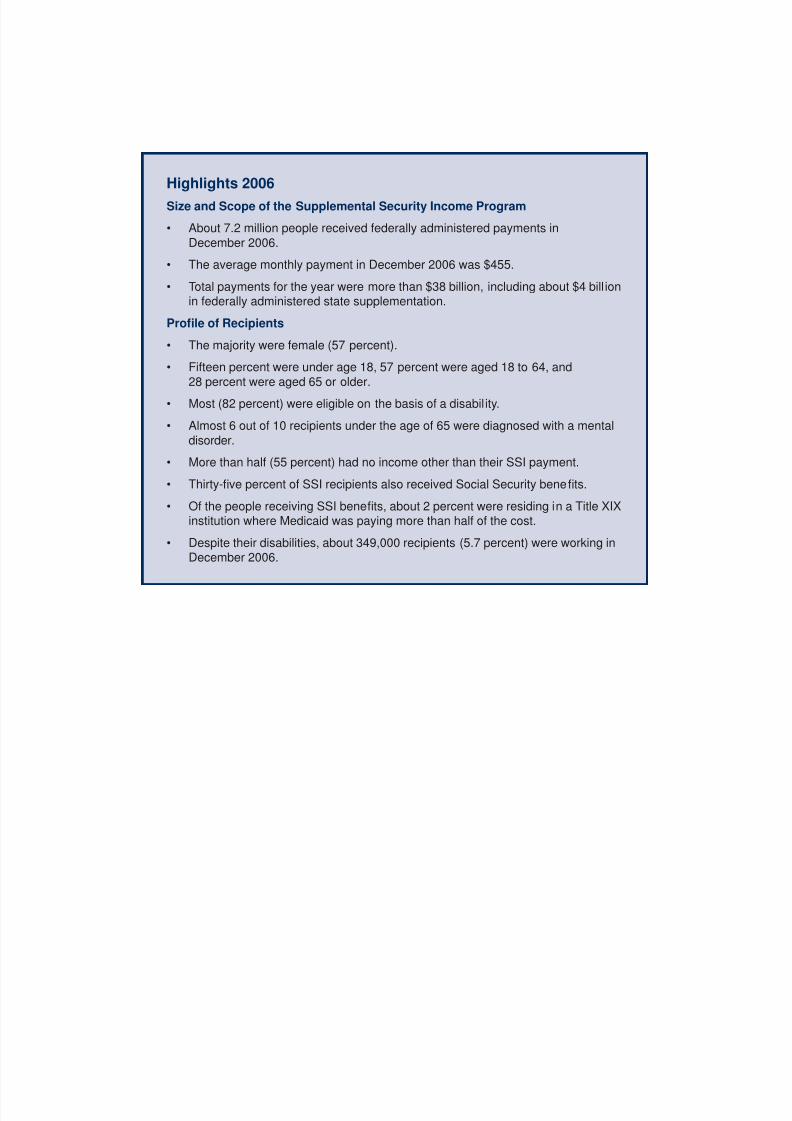
Highlights 2006Size and Scope of the Supplemental Security Income Program
About 7.2 million people received federally administered payments inDecember 2006.
The average monthly payment in December 2006 was $455.
Total payments for the year were more than $38 billion, including about $4 bill ionin federally administered state supplementation.
Profile of Recipients
The majority were female (57 percent).
Fifteen percent were under age 18, 57 percent were aged 18 to 64, and28 percent were aged 65 or older.
Most (82 percent) were eligible on the basis of a disability.
Almost 6 out of 10 recipients under the age of 65 were diagnosed with a mentaldisorder.
More than half (55 percent) had no income other than their SSI payment.
Thirty-five percent of SSI recipients also received Social Security benefits.
Of the people receiving SSI benefits, about 2 percent were residing in a Title XIXinstitution where Medicaid was paying more than half of the cost.
Despite their disabilities, about 349,000 recipients (5.7 percent) were working in
December 2006.
•
•
•
•
•
•
•
•
•
•
•
8/14/2019 Social Security: ssi asr06
http://slidepdf.com/reader/full/social-security-ssi-asr06 3/129
Preface
Since 1974, the Supplemental Security Income (SSI) program has guaranteed a minimumlevel of income for needy aged, blind, or disabled individuals. Each year, we issue a reportthat presents data on the SSI program and the people who receive benefits from it. Thereport covers such topics as federal benefit rates and total annual payments, federallyadministered payments, work incentives, applications, outcomes of applications, awards,denials, and suspension of benefits.
The section on federally administered payments includes a table showing country oforigin of the nearly 1.6 million SSI recipients who were born in a foreign country. Finally, inresponse to numerous inquiries for data at the state level, we have provided state distribu-tions for applications, awards, recipient rates, and receipt of Social Security and SSI onthe basis of disability.
Alfreda M. Brooks compiled the data and prepared the report for publication. Staff ofthe Division of Information Resources edited the report and prepared the print and elec-tronic versions for publication.
General questions about the report should be directed to Alfreda Brooks at
410-965-9849 or [email protected]. For specific questions about the data, contact theperson listed on each table.
This and other reports on the SSI program are available on the Web athttp://www.socialsecurity.gov/policy. For additional copies, please [email protected] or call 202-358-6274.
Susan GradActing Associate Commissionerfor Research, Evaluation, and Statistics
September 2007

8/14/2019 Social Security: ssi asr06
http://slidepdf.com/reader/full/social-security-ssi-asr06 4/129

8/14/2019 Social Security: ssi asr06
http://slidepdf.com/reader/full/social-security-ssi-asr06 5/129
Contents
Background. . . . . . . . . . . . . . . . . . . . . . . . . . . . . . . . . . . . . . . . . . . . . . . . . . . . . . . . . . . .1
History of the SSI Program . . . . . . . . . . . . . . . . . . . . . . . . . . . . . . . . . . . . . . . . . .1
The Basic Plan . . . . . . . . . . . . . . . . . . . . . . . . . . . . . . . . . . . . . . . . . . . . . . . . . . .1
Uniform Standards and Objective Criteria . . . . . . . . . . . . . . . . . . . . . . . . . . . . . . . 1
Assistance of Last Resort . . . . . . . . . . . . . . . . . . . . . . . . . . . . . . . . . . . . . . . . . . . 3
Incentives for Work and Opportunities for Rehabilitation. . . . . . . . . . . . . . . . . . . .6
Administration of the SSI Program . . . . . . . . . . . . . . . . . . . . . . . . . . . . . . . . . . . .8
State Supplementation . . . . . . . . . . . . . . . . . . . . . . . . . . . . . . . . . . . . . . . . . . . .10
Coordination with Other Programs . . . . . . . . . . . . . . . . . . . . . . . . . . . . . . . . . . .10
Tables
Federal Benefit Rates and Total Annual Payments
1. Monthly federal SSI benefit rates, 1974–2007. . . . . . . . . . . . . . . . . . . . . . . . . . .15
2. Total payments, by eligibility category and source of payment,selected years, 1974–2006 . . . . . . . . . . . . . . . . . . . . . . . . . . . . . . . . . . . . . . . . .16
Federally Administered Payments
3. Recipients, by age, December 1974–2006 . . . . . . . . . . . . . . . . . . . . . . . . . . . . .21
4. By type of payment, sex, eligibility category, and age, December 2006 . . . . . . . 22
5. By selected characteristics, eligibility category, and age, December 2006 . . . . .23
6. Recipients, by type of representative payee, eligibility category, and age,December 2006. . . . . . . . . . . . . . . . . . . . . . . . . . . . . . . . . . . . . . . . . . . . . . . . . .24
7. Recipients, by type of income, eligibility category, and age, December 2006 . . .25
8. By receipt of Social Security, type of income, eligibility category, and age,December 2006. . . . . . . . . . . . . . . . . . . . . . . . . . . . . . . . . . . . . . . . . . . . . . . . . .26
9. Recipients, by state or other area, eligibility category, and age,December 2006. . . . . . . . . . . . . . . . . . . . . . . . . . . . . . . . . . . . . . . . . . . . . . . . . .27
10. Average monthly payment, by state or other area, eligibility category,and age, December 2006 . . . . . . . . . . . . . . . . . . . . . . . . . . . . . . . . . . . . . . . . . .29
11. Recipients and their average income, by type of income and marital status,December 2006. . . . . . . . . . . . . . . . . . . . . . . . . . . . . . . . . . . . . . . . . . . . . . . . . .31
12. Recipients as a percentage of resident population, by state,December 2006. . . . . . . . . . . . . . . . . . . . . . . . . . . . . . . . . . . . . . . . . . . . . . . . . .32
13. Foreign-born recipients, by region, country of origin, eligibility category,and age, December 2006 . . . . . . . . . . . . . . . . . . . . . . . . . . . . . . . . . . . . . . . . . .34

8/14/2019 Social Security: ssi asr06
http://slidepdf.com/reader/full/social-security-ssi-asr06 6/129
vi ♦ SSI Annual Statistical Report, 2006
Recipients of Social Security, SSI, or Both
14. Persons aged 18–64 receiving benefits on the basis of disabilityand their total and average monthly payments, by type of beneficiary,December 1996–2006 . . . . . . . . . . . . . . . . . . . . . . . . . . . . . . . . . . . . . . . . . . . . .37
15. Persons aged 18–64 receiving both Social Security and SSI on the basisof disability and their average monthly Social Security benefit andSSI payment, by state or other area and type of beneficiary,
December 2006. . . . . . . . . . . . . . . . . . . . . . . . . . . . . . . . . . . . . . . . . . . . . . . . . .38
Noncitizens
16. By eligibility category, December 1982–2006 . . . . . . . . . . . . . . . . . . . . . . . . . . .43
17. Distribution of recipients, by selected characteristics and citizenship status,December 2006. . . . . . . . . . . . . . . . . . . . . . . . . . . . . . . . . . . . . . . . . . . . . . . . . .44
18. By state or other area, eligibility category, and age, December 2006 . . . . . . . . .45
19. By region and country of origin, eligibility category, and age, December 2006 . .47
20. By number of months between date of U.S. residency and date ofSSI application, eligibility category, and age, December 2006 . . . . . . . . . . . . . .48
Recipients Under Age 65
21. Recipients, by diagnostic group, 1998–2006. . . . . . . . . . . . . . . . . . . . . . . . . . . .51
22. By diagnostic group and age, December 2006 . . . . . . . . . . . . . . . . . . . . . . . . . .52
23. By diagnostic group, age, and sex, December 2006 . . . . . . . . . . . . . . . . . . . . . .54
24. Recipients with a representative payee, by diagnostic groupand age, December 2006 . . . . . . . . . . . . . . . . . . . . . . . . . . . . . . . . . . . . . . . . . .55
25. Percentage distribution, by state or other area and diagnostic group,December 2006. . . . . . . . . . . . . . . . . . . . . . . . . . . . . . . . . . . . . . . . . . . . . . . . . .56
26. Average monthly payment, by state or other area and diagnostic group,
December 2006. . . . . . . . . . . . . . . . . . . . . . . . . . . . . . . . . . . . . . . . . . . . . . . . . .60
Recipients Who Work
27. By selected months, 1976–2006 . . . . . . . . . . . . . . . . . . . . . . . . . . . . . . . . . . . . .67
28. Recipients participating in section 1619(a) or section 1619(b),selected months, 1982–2006. . . . . . . . . . . . . . . . . . . . . . . . . . . . . . . . . . . . . . . .69
29. By state or other area, December 2006 . . . . . . . . . . . . . . . . . . . . . . . . . . . . . . .70
30. Recipients benefiting from specified work incentives, by state or other area,December 2006. . . . . . . . . . . . . . . . . . . . . . . . . . . . . . . . . . . . . . . . . . . . . . . . . .72
Applications
31. All applications, by age of applicant, 1973–2006. . . . . . . . . . . . . . . . . . . . . . . . .77
32. Applications for children under age 18, by selected characteristics,1998–2006. . . . . . . . . . . . . . . . . . . . . . . . . . . . . . . . . . . . . . . . . . . . . . . . . . . . . .78
33. Applications for adults aged 18–64, by selected characteristics,1998–2006. . . . . . . . . . . . . . . . . . . . . . . . . . . . . . . . . . . . . . . . . . . . . . . . . . . . . .79
34. Applications for adults aged 65 or older, by selected characteristics,1998–2006. . . . . . . . . . . . . . . . . . . . . . . . . . . . . . . . . . . . . . . . . . . . . . . . . . . . . .80
8/14/2019 Social Security: ssi asr06
http://slidepdf.com/reader/full/social-security-ssi-asr06 7/129
SSI Annual Statistical Report, 2006 ♦ vii
35. All applications, by state or other area and age of applicant, 2006 . . . . . . . . . . .81
36. All applicants, by year of first application and age, 1973–2006. . . . . . . . . . . . . .83
Awards
37. All awards, by age of awardee, 1974–2006. . . . . . . . . . . . . . . . . . . . . . . . . . . . .87
38. Awards for children under age 18, by selected characteristics, 1998–2006 . . . . 88
39. Awards for adults aged 18–64, by selected characteristics, 1998–2006 . . . . . . .89
40. Awards for adults aged 65 or older, by selected characteristics, 1998–2006 . . . 90
41. All awards, by state or other area and age of awardee, 2006 . . . . . . . . . . . . . . .91
42. All persons awarded SSI, by year of first award and age, 1974–2006 . . . . . . . .93
Outcomes of Applications for Disability Benefits
Notes . . . . . . . . . . . . . . . . . . . . . . . . . . . . . . . . . . . . . . . . . . . . . . . . . . . . . . . . . .96
43. Outcomes at all adjudicative levels, by age and year of application,1992–2005. . . . . . . . . . . . . . . . . . . . . . . . . . . . . . . . . . . . . . . . . . . . . . . . . . . . . .97
44. Medical decisions at the initial adjudicative level, by age, year of application,
and program, 1992–2005 . . . . . . . . . . . . . . . . . . . . . . . . . . . . . . . . . . . . . . . . . .99
45. Medical decisions at the reconsideration level, by age, year of application,and program, 1992–2005 . . . . . . . . . . . . . . . . . . . . . . . . . . . . . . . . . . . . . . . . .101
46. Medical decisions at the hearing level or above, by age, year of application,and program, 1992–2005 . . . . . . . . . . . . . . . . . . . . . . . . . . . . . . . . . . . . . . . . .103
47. Percentage distribution of final medical allowances, by age, year of application,and reason for allowance, 1992–2005. . . . . . . . . . . . . . . . . . . . . . . . . . . . . . . .105
48. Percentage distribution of final medical denials, by age, year of application,and reason for denial, 1992–2005. . . . . . . . . . . . . . . . . . . . . . . . . . . . . . . . . . . 107
Suspensions and TerminationsNotes . . . . . . . . . . . . . . . . . . . . . . . . . . . . . . . . . . . . . . . . . . . . . . . . . . . . . . . . .110
49. Suspensions, by age of recipient and reason for suspension, 1998–2006 . . . .111
50. Recipients suspended, by age and reason for suspension, 1998–2006 . . . . . .112
51. Recipients terminated, by age and reason for termination, 1998–2005 . . . . . .113
Appendix: Sampling Variability. . . . . . . . . . . . . . . . . . . . . . . . . . . . . . . . . . . . . . . . . .117
Glossary . . . . . . . . . . . . . . . . . . . . . . . . . . . . . . . . . . . . . . . . . . . . . . . . . . . . . . . . . . . .119

8/14/2019 Social Security: ssi asr06
http://slidepdf.com/reader/full/social-security-ssi-asr06 8/129

8/14/2019 Social Security: ssi asr06
http://slidepdf.com/reader/full/social-security-ssi-asr06 9/129
Background
The Supplemental Security Income (SSI) program is anationwide federal assistance program administered bythe Social Security Administration (SSA) that guaran-tees a minimum level of income for needy aged, blind,or disabled individuals. In December 2006, 7.2 millionindividuals received federally administered monthly SSIbenefits (including federally administered state supple-mentary payments) averaging $455.
History of the SSI Program
Entitlement programs for the aged, blind, or disabledhave their roots in the original Social Security Act of1935. That act established an old-age social insuranceprogram to be administered by the federal governmentand an old-age means-tested assistance program to beadministered by the states. Similar programs for theblind or disabled were added to the act in later years.
Means-tested assistance was intended to supplementthe incomes of individuals who were ineligible forSocial Security or whose benefits could not provide abasic living.
This means-tested assistance, also known as cate-gorical adult assistance, actually comprised three sep-arate programs—Old-Age Assistance (OAA), Aid to theBlind (AB), and Aid to the Permanently and TotallyDisabled (APTD). Despite substantial federal financing,those programs were essentially state programs; fed-eral law established only broad guidelines and assis-tance. Federal financing was open-ended in the sense
that the federal government would provide matchingfunds to support whatever payment levels the statesestablished. Federal law specified no maximum or min-imum standards. Consequently, each state wasresponsible for setting its own standards for determin-ing who would receive assistance and how much theywould receive. As a result, eligibility requirements andvariations of payment levels differed from state to state.
Beginning in the early 1960s, this state-operated,federally assisted welfare system drew criticism fromwithin and outside of government. Some of the criticism
was directed at the crazy-quilt eligibility requirementsand payment levels. Other criticism centered on spe-cific requirements, such as lien laws and provisionsthat required certain relatives to bear responsibility forthe maintenance of needy family members. The dispar-ity in the degree of federal financial support provided tostates was also an acknowledged problem.
Responding to these concerns, Congress passedand the president approved the SSI program (PublicLaw 92-603, enacted October 30, 1972), which
reversed the historic federal and state roles with regardto adult assistance. Under the new arrangement, SSIwould provide a uniform federal income floor, andoptional state programs would supplement that floor.The new program was historic in that it shifted from thestates to the federal government the responsibility fordetermining who would receive assistance and howmuch assistance they would receive.
The Basic Plan
The main objective of the SSI program is to provide thebasic cash support of needy aged, blind, or disabledindividuals. Congress designed the SSI program on thebasis of the following principles:
• Eligibility requirements and benefit standards thatare nationally uniform and eligibility determinations
that are based on objective criteria• An assistance source of last resort for the aged,
blind, or disabled whose income and resources arebelow specified levels
• Incentives and opportunities for recipients who areable to work or to be rehabilitated that would allowthem to reduce their dependency on public assis-tance
• An efficient and economical method of administer-ing the program to provide assistance
• Inducements to encourage states to provide sup-
plementation of the basic federal benefit and pro-tection for former recipients of state adultassistance programs who were converted to theSSI program
• Appropriate coordination of the SSI program withthe Food Stamp program, medical assistance pro-grams, and other programs
Uniform Standards and Objective Criteria
Before the SSI program, eligibility of aged, blind, or dis-abled individuals for federally funded adult assistance
depended on the state in which they lived. Benefitamounts also varied from state to state. The SSI pro-gram replaced the state-run programs of assistancewith a program having nationally uniform standardsand objective eligibility criteria, which include the fol-lowing:
• A uniform limitation on the dollar amount or valueof income and resources that an individual canhave and still qualify for federal assistance. Thecountable income limits for individuals and couples

8/14/2019 Social Security: ssi asr06
http://slidepdf.com/reader/full/social-security-ssi-asr06 10/129

8/14/2019 Social Security: ssi asr06
http://slidepdf.com/reader/full/social-security-ssi-asr06 11/129
SSI Annual Statistical Report, 2006 ♦ 3
in persons in the United States.4 Such individuals aretreated for SSI purposes as refugees, that is, they areeligible for SSI for 7 years after a determination ismade that they are trafficking victims.5
In addition to having to be a U.S. citizen (ornational) or in one of the potentially eligible noncitizencategories, an individual must reside in the 50 states,
the District of Columbia, or the Northern MarianaIslands—areas referred to here collectively as theUnited States. An individual also must be physicallypresent in the United States for 30 consecutive days ifhe or she had been outside the United States for 30 ormore consecutive days.
There are two exceptions to the residency andphysical presence requirements:
• Blind or disabled children who are citizens of theUnited States may continue to be eligible for pay-ments if they are living outside the United States
with a parent who is on duty as a member of theU.S. armed forces. This exception also applies toblind and disabled children of military personnelwho are born overseas, become blind or disabledoverseas, or applied for SSI benefits while over-seas.
• Students studying abroad for not more than 1 yearmay continue to be eligible for payments if the stud-ies are sponsored by a U.S. educational institutionbut cannot be conducted in the United States.
Assistance of Last Resort
As a means-tested program, SSI takes into account allincome and resources that an individual has or canobtain. The amount of an individual's countable incomeand resources are the measure of his or her need forassistance.
Income
The amount of an individual's income is used to deter-mine both eligibility for, and the amount of, his or herSSI benefit. As countable income increases, an individ-ual's SSI benefit amount decreases. Generally, ineligi-
bility for SSI occurs when countable income equals thefederal benefit rate plus the amount of applicable feder-
ally administered state supplementary payment (statesupplementation is discussed later).
The monthly federal benefit rate is reduced dollarfor dollar by the amount of the individual's "countable"income—that is, income minus all applicable exclu-sions. The result of this computation determines SSIeligibility and the amount of the monthly benefit pay-
able. The benefit rates are adjusted annually (in Janu-ary) to reflect changes in the cost of living.
When an individual lives in the household ofanother and receives support and maintenance in kind(that is, generally, room and board) from the house-holder, the federal SSI benefit rate is reduced by one-third in lieu of counting the actual value of the supportand maintenance as unearned income. The value offood or shelter-related items the individual receives inkind from persons other than the householder (includ-ing in-kind assistance from outside the household inwhich the individual lives) is counted as unearned
income, up to an amount equal to one-third of the appli-cable federal benefit rate plus $20.6
SSI law defines two kinds of income—earned andunearned. Earned income is wages, net earnings fromself-employment, remuneration for work in a shelteredworkshop, royalties on published work, and honorariafor services. All other income is unearned. The distinc-tion between earned and unearned income is signifi-cant because different exclusions apply to each type ofincome.
However, not everything an individual receives isconsidered to be income. Generally, if the item receivedcannot be used as, or to obtain, food, clothing, or shel-ter, it will not be considered as income. For example, ifsomeone pays an individual's medical bills or offersfree medical care, or if the individual receives moneyfrom a social services agency that is a repayment of anamount he or she previously spent, that value is notconsidered income to the individual. In addition, someitems that are considered to be income are excludedwhen determining the amount of an individual's benefit(see Box 1).
Resources
The amount of an individual's resources is used todetermine whether he or she is eligible for SSI in agiven month. SSI law states that eligibility is restrictedto individuals who have countable resources, deter-
4. Trafficking of persons is generally defined as the recruitment,
harboring, transportation, provision, or obtaining of a person for
labor or services through the use of force, fraud, or coercion forthe purpose of subjection to involuntary servitude, peonage,
debt bondage, or slavery.
5. Public Law 106-386, the Victims of Trafficking and Violence Pro-tection Act of 2000, enacted October 28, 2000.
6. SSA simplified the SSI program (70 FR 6340) by generally elim-
inating clothing from the definition of income and from the defini-
tion of in-kind support and maintenance, effective February 7,2005.

8/14/2019 Social Security: ssi asr06
http://slidepdf.com/reader/full/social-security-ssi-asr06 12/129
4 ♦ SSI Annual Statistical Report, 2006
mined monthly, that do not exceed $2,000 ($3,000 for acouple). The law does not define what resources arebut does stipulate what items are not consideredresources.
Regulations state that a resource is cash or otherliquid asset or any real or personal property that indi-viduals (or their spouses) own and could convert to
cash to be used for their support and maintenance.This definition is consistent with the general philosophyof the SSI program that only items that can be used foran individual's food, clothing, or shelter should be usedin determining his or her eligibility and benefit amount.Not all resources an individual owns are counted. Thevalue of an item may be totally excluded or counted
only to the extent that its value exceeds specified limits(see Box 1).
If an individual disposes of resources at less thanfair market value within the 36-month period beforeapplying for SSI or at any time thereafter, the individualmay be penalized. The penalty is a loss of benefits for anumber of months (up to a 36-month maximum)
obtained by dividing the uncompensated value of dis-posed-of resources by the federal benefit rate plus themaximum state supplementary payment, if any, appli-cable to the individual's living arrangement. The pen-alty does not apply if, among other things, theindividual can show that the resources were disposedof exclusively for a purpose other than establishing SSIeligibility.
Box 1.
Income and Resource Exclusions
Income Exclusions
The principal earned income exclusions are
• the first $65 per month plus one-half of theremainder,
• impairment-related work expenses of the dis-abled and work expenses of the blind,
• income set aside or being used to pursue a planfor achieving self-support by a disabled or blindindividual, and
• infrequent or irregularly received income ($30 or
less a quarter).
The principal unearned income exclusions are
• the first $20 per month,a
• income set aside or being used to pursue a planfor achieving self-support by a disabled or blindindividual,
• state- or locally funded assistance based onneed,
• rent subsidies under programs administered bythe Department of Housing and Urban Develop-
ment and the value of food stamps, and
• infrequent or irregularly received income ($60 orless a quarter).
Resource Exclusions
The principal resource exclusions are
• the home and land appertaining to it, regardlessof value;
• life insurance policies whose total face valuedoes not exceed $1,500;
• burial funds not in excess of $1,500 each for anindividual and spouse (plus accrued interest);
• household goods and personal effects;b
• an automobile if used for transportation for thebeneficiary or a member of the beneficiary’shousehold;c
• property essential to self-support;
• resources set aside to fulfill a plan to achieveself-support; and
• amounts deposited into an individual develop-ment account, including matching funds andinterest earned on such amounts, under theTemporary Assistance for Needy Families pro-gram or the Assets for Independence Act.
a. Any portion of the $20 amount not used to exclude unearnedincome may be used to exclude earned income.
b. The $2,000 value limit was removed effective February 7,
2005 (70 FR 6340).
c. SSA also changed the evaluation of automobiles as an
excludable resource, effective February 7, 2005 (70 FR6340). Under the old rules, one automobile could be excluded
(regardless of value) if necessary for employment, medicaltreatment, or essential daily activities. If not excludable underthis criteria, the current market value of one automobile (up to$4,500) could be excluded. The new exclusion, applicable to
any one automobile used for transportation, simplifies theevaluation of this resource.

8/14/2019 Social Security: ssi asr06
http://slidepdf.com/reader/full/social-security-ssi-asr06 13/129
SSI Annual Statistical Report, 2006 ♦ 5
Filing for Other Benefits
As the "program of last resort," SSI benefits are pro-vided to eligible individuals only to the extent that theirneeds are not met by other sources. After evaluating allother income and resources, SSI pays what is neces-sary to bring an individual to the statutorily prescribedincome "floor." In keeping with this principle, SSI law
requires that SSI applicants file for other payments forwhich they may be entitled, such as annuities, pen-sions, retirement or disability benefits, workers’ com-pensation, and unemployment insurance benefits.
SSA must provide an individual with written noticeof potential eligibility for other benefits and of therequirement to take all appropriate steps to pursuethose benefits. The individual has 30 days from receiptof the notice to file for the benefits involved.
Eligibility Issues for Residents of PublicInstitutions or Medical Facilities and Personal
Needs Allowance
State and local governments—rather than the federalgovernment—traditionally have taken the financialresponsibility for residents of their public institutions.The SSI program continues this long-standing publicassistance policy. People who are residents of publicinstitutions for a full calendar month are generally ineli-gible for SSI unless one of the following exceptionsapplies:
• The public institution is a medical treatment facilityand Medicaid pays more than 50 percent of the
cost of care or, in the case of a child under age 18,Medicaid, private health insurance, or both paymore than 50 percent of the cost of care.
• The public institution is a publicly operated commu-nity residence serving no more than 16 residents.
• The public institution is an emergency shelter forthe homeless (payments are limited to no morethan 6 months in any 9-month period).
• The recipient was eligible under section 1619(a) orsection 1619(b) for the month preceding the firstfull month in the public institution and is permitted
by the institution to retain any benefits (payable forup to 2 months).
• A physician certifies that the recipient's stay in amedical facility is likely not to exceed 3 months andthat continued SSI eligibility is needed to maintainand provide for the expenses of the home to whichthe individual will return.
When individuals enter medical treatment facilitiesin which more than half of the bill is paid by the
Medicaid program, their monthly federal payment stan-dard is generally reduced to $30, beginning with thefirst full calendar month they are in the facility. In thecase of an individual under age 18, the $30 paymentstandard is also applicable if more than half of the bill ispaid by private insurance or a combination of Medicaidand private insurance. In these cases, the SSI programprovides up to $30 a month, which is intended to take
care of small comfort items not provided by the institu-tion.
Deeming
In certain situations, the income and resources of oth-ers are counted in determining whether an individual'sincome and resources fall below the levels establishedby law. This process is called deeming and is applied incases in which an eligible individual lives with an ineli-gible spouse, an eligible child lives with an ineligibleparent, or an eligible noncitizen has a sponsor.7 In con-cept, the practice takes into account the responsibility
of the ineligible spouse or parent or the sponsor to pro-vide for the basic needs of the eligible individual.
Spouse-to-Spouse Deeming. When an eligible indi-vidual lives in the same household with a spouse whois not eligible for SSI, the ineligible spouse's incomeand resources are deemed to be available to the eligi-ble individual. In determining the amount of income andresources available to the eligible individual, all applica-ble exclusions are used. In addition, a living allowanceis provided for the ineligible spouse and for any ineligi-ble children under age 18 living in the household. The
allowance reduces the amount of income to bedeemed. Spouse-to-spouse deeming is intended toresult in the same amount of income being available tothe couple as would be available if both members ofthe couple were aged, blind, or disabled and eligible forSSI.
Deeming does not apply when the eligible individ-ual is not living in the same household as the ineligiblespouse. However, if the ineligible spouse's absence istemporary or is due solely to an active-duty assignmentas a member of the U.S. armed forces, deeming contin-ues to apply.
Parent-to-Child Deeming. A child under age 18 issubject to deeming from an ineligible natural or adop-tive parent (and that parent's spouse, if any) living inthe same household. Certain amounts of the parent'sincome are excluded, living allowances are provided for
7. Deeming also applies to an individual who lives with an essen-
tial person (a concept carried over from the former state assis-
tance plans). However, there are fewer than 100 of these casesremaining.

8/14/2019 Social Security: ssi asr06
http://slidepdf.com/reader/full/social-security-ssi-asr06 14/129
6 ♦ SSI Annual Statistical Report, 2006
the parent(s), and an allocation is set aside for eachineligible child under age 18 (under age 21 if a student)who is living in the household. Deeming from an eligi-ble parent to a child continues if the parent is absentfrom the household but the absence is temporary or isdue solely to active-duty assignment as a member ofthe U.S. armed forces. A child living in a household inwhich all members are receiving public assistance ben-
efits is not considered to be receiving any support, anddeeming does not apply.
Sponsor-to-Alien Deeming. The income andresources of noncitizens are deemed to include thoseof their sponsors. The way the income and resourcesare deemed and the length of the deeming perioddepend on whether the sponsor signed a legallyenforceable affidavit of support, as required by PublicLaw 104-208, or the previous version of the affidavit.Generally, individuals who entered the country before1998 did so under the old version of the affidavit.8
Under the old version of the affidavit, deeming ofthe sponsor's income and resources lasts until the non-citizen has been in the United States for 3 years.9 Liv-ing allowances equal to the federal benefit rate areprovided for the sponsor, and allowances equal to one-half of the federal benefit rate are provided for each ofthe sponsor's dependents. Allowances are also pro-vided for the sponsor and his or her family members indetermining deemed resources. These allowancesreduce the amount of the sponsor's income andresources deemed to the noncitizen.
For noncitizens admitted into the United Statesunder a legally enforceable affidavit of support, deem-ing generally applies until the noncitizen becomes aU.S. citizen. Deeming ends before citizenship if thenoncitizen has earned, or can be credited with, 40qualifying quarters of earnings. Children and spousesof workers may be credited with quarters earned by theworker. A quarter otherwise earned after 1996 does notcount as one of the required 40 if the noncitizen orworker received federal means-tested public benefitsduring the relevant period.
Also for this group of noncitizens, deeming does
not apply for specified periods if the noncitizens or theirchildren or parents have been battered or subjected toextreme cruelty while in the United States or if spon-
sors left the noncitizens indigent by not providing themwith sufficient support.
Incentives for Work and Opportunities forRehabilitation
SSI benefits provide a basic level of assistance for indi-viduals who are blind or disabled with limited earningsability because of their impairments. Nonetheless, forrecipients who want to work, the SSI program isdesigned to encourage and support their work attemptsto help them achieve greater degrees of independence.The SSI program includes a number of work incentiveprovisions that enable recipients who are blind or dis-abled to work and retain benefits or to increase theirlevels of work activity without the loss of SSI disabilitystatus or Medicaid. These incentives provide higheramounts of income or resource exclusions as recogni-tion of the expenses associated with working or asinducements to seek rehabilitation services and sup-
port for work efforts.
Earned Income Exclusion
The first $65 ($85 if the individual has no income otherthan earnings) of any monthly earned income plus one-half of remaining earnings are excluded for SSI benefitcomputation purposes. This general earned incomeexclusion is intended to help offset expenses incurredwhen working. It ensures that SSI recipients who areworking will be rewarded for their efforts by havinggreater total income than those who do not work.
Impairment-Related Work Expense Exclusion
The cost of certain impairment-related services anditems that a disabled (but not blind) individual needs towork are excluded from earned income in determiningSSI eligibility and benefit amounts.
In calculating these expenses, amounts equal tothe costs of certain attendant care services, medicaldevices, equipment, prostheses, vehicle modifications,residential modifications to accommodate wheelchairs,and similar items and services are deductible fromearnings. The costs of routine drugs and routine medi-cal services are not deductible, unless they are neces-sary to control the disabling condition.
Work Expenses of the Blind Exclusion
Any expenses relating to work that a blind individualhas are excluded from earned income in determiningSSI eligibility and benefit amounts. Unlike an impair-ment-related work expense, a deductible expense neednot be directly related to the worker's blindness; it need
8. The Immigration and Naturalization Service began using the
new, legally enforceable affidavits on December 19, 1997. How-
ever, if a potential immigrant had a visa issued before that date,the sponsor would sign an old affidavit even if the affidavit was
signed after December 19, 1997.
9. For a temporary period—January through September 1996—the deeming period was 5 years.
8/14/2019 Social Security: ssi asr06
http://slidepdf.com/reader/full/social-security-ssi-asr06 15/129
SSI Annual Statistical Report, 2006 ♦ 7
only be an ordinary and necessary work expense of theworker.
Some frequently excluded work expenses includetransportation to and from work, meals consumed dur-ing work hours, job equipment, licenses, income orFICA taxes, and costs of job training.
Student Earned Income Exclusion
The student earned income exclusion is an additionalexclusion for an individual who is under the age of 22and regularly attending school. It is intended to helpdefray the cost of educational training. Under currentregulations, up to $1,510 of earned income per monthbut no more than $6,100 per year may be excluded.10
Plan for Achieving Self-Support
A plan for achieving self-support (PASS) allows a dis-abled or blind individual to set aside income and
resources to get a specific type of job or to start a busi-ness. The plan may involve setting aside funds for edu-cation or vocational training, to purchase work-relatedequipment, or to pay for transportation related to thework goal. The income and resources that are setaside are excluded under the SSI income andresources tests.
The individual must have a feasible work goal anda specific savings or spending plan. The individual alsomust provide a clearly identifiable accounting for thefunds that are set aside. The PASS is time limited and
must be approved by SSA. The individual must thenfollow the plan and negotiate revisions as needed. SSAmonitors the approved plan by reviewing it periodicallyto ensure the individual's progress toward attaining thework goal.
Special Provisions for Disabled People Who Work
These work incentives are generally referred to by theirsection number in the Social Security Act, section1619. Under section 1619(a), disabled individuals whowould cease to be eligible because they earn morethan the substantial gainful activity level can receive
special cash benefits as long as they• continue to have the disabling condition,
• have income under the amount that would causeineligibility for any payment under SSI incomecounting rules, and
• meet all other nondisability requirements for SSIpayment.
In many states, being a recipient of the specialbenefit permits the individual to be eligible for Medicaidbenefits.
Under section 1619(b), "SSI recipient" status forMedicaid eligibility purposes also is provided to anindividual
• whose earnings preclude any SSI payment but arenot sufficient to provide a reasonable equivalent ofthe SSI, social services, and Medicaid benefits thatthe individual would have in the absence of earn-ings and
• whose ability to continue working would be seri-ously inhibited by the loss of social services andMedicaid benefits.
To qualify for extended Medicaid coverage undersection 1619(b), an individual must
• have a disabling condition,
• need Medicaid to work,
• not be able to afford equivalent medical coverageand publicly funded personal or attendant care thatwould be lost without assistance,
• meet all nondisability requirements for SSI pay-ment other than earnings, and
• have received a regular SSI cash payment in a pre-vious month within the current period of eligibility.(In some states, the individual must have qualifiedfor Medicaid in the month preceding the first monthof eligibility under section 1619.)
In determining whether individuals' earnings arenot sufficient to provide them with the equivalent bene-fits they would be eligible for if they stopped working,their earnings are compared with a threshold amountfor their state of residence. Section 1619(b) status con-tinues if the earnings are below the threshold. If earn-ings exceed the state threshold, an individualizedassessment of the need for Medicaid is made, and1619(b) status may continue.
Vocational Rehabilitation and the Ticket to Work Program
Since the beginning of the SSI program, SSA hasmade provision for blind or disabled individuals who arereceiving SSI benefits to be referred to state VocationalRehabilitation (VR) agencies. If the state VR agencydoes not accept the referral, SSA can refer recipients toan alternate provider to receive vocational rehabilitationservices. SSA reimburses the VR agency or alternateprovider for services that result in the individual's work-ing at the level of substantial gainful activity for a con-
10. Under current regulations, this exclusion will be increased insubsequent years on the basis of changes in the cost of living.

8/14/2019 Social Security: ssi asr06
http://slidepdf.com/reader/full/social-security-ssi-asr06 16/129
8 ♦ SSI Annual Statistical Report, 2006
tinuous period of 9 months, and in certain other limitedsituations.
The Ticket to Work and Work Incentives Improve-ment Act of 1999 established a Ticket to Work programunder which a disabled beneficiary is able to obtainvocational rehabilitation, employment, and other sup-port services from a qualified private or public provider.
Providers of such services in this new setting arereferred to as employment networks (ENs). In addition,the Ticket legislation provided for a new procedure forcompensating the ENs under an outcome or outcome-milestone payment system. By expanding the pool ofproviders and giving the providers incentives forachieving success, this program seeks to expand a dis-abled beneficiary's access to these services for assis-tance in finding, entering, and retaining employmentand reducing his or her dependence on cash benefits.Regulations issued by the commissioner of SocialSecurity became effective January 2002. Beginning in2002, the Ticket to Work program was gradually
phased in, and it has been in operation nationwidesince November 2003.
Individuals receiving SSI benefits who improvemedically and are therefore no longer considered dis-abled or blind can continue to receive SSI benefits ifthey are actively participating in the Ticket to Work pro-gram or another approved VR program and if continu-ing or completing the program would increase thelikelihood that they would be permanently removedfrom the SSI rolls. SSI benefits and Medicaid generallycontinue until the rehabilitation services are completed
or until the individual ceases to participate in theprogram.
Expedited Reinstatement
A disabled or blind individual whose eligibility for SSIpayments was ended because of earnings can requestexpedited reinstatement of his or her SSI benefits with-out filing a new application. To qualify for expeditedreinstatement, the individual must make the requestwithin 60 months after the eligibility ended and musthave a disabling medical condition that (1) is the sameas or related to the disabling medical condition that led
to the previous period of eligibility and (2) prevents himor her from performing substantial gainful activity. Indetermining whether the individual is disabled or blind,the medical review standard is applied. Normal non-medical requirements for SSI eligibility still apply.
An individual requesting expedited reinstatementmay receive up to 6 months of provisional benefitswhile the request is pending. These benefits generallyare not considered an overpayment if the request isdenied. Provisional benefits may include Medicaid but
do not include any state supplementary payments. Pro-visional benefits may be received as well by the individ-ual's spouse at a couple's rate if the spouse waspreviously eligible for SSI as a spouse.
Administration of the SSI Program
The framers of Supplemental Security Income chosethe Social Security Administration to administer theprogram because the basic system for paying monthlybenefits to a large number of individuals was already inplace in the form of the Social Security program.
Application Process
Individuals can make appointments to apply for SSIbenefits at any one of the approximately 1,300 SSAfield offices around the country or through SSA teleser-vice centers. The claims process includes the applica-tion interview, the obtaining of necessary evidence and
documentation, and the adjudication of the claim. Manyindividuals file for benefits under the SSI and the Old-Age, Survivors, and Disability Insurance programs atthe same time. Potential claimants initially contact SSAby phone or mail or in person. Field office personnelconduct an interview with the claimant, the claimant’srepresentative, or both.
SSA corroborates information provided by appli-cants for SSI through independent or collateralsources. Generally, the basic responsibility for obtain-ing evidence lies with the claimant, although SSA oftengives advice on ways to obtain the needed information.
Because of the special circumstances of the SSI popu-lation (for example, financial need, old age, or illness),SSA makes special efforts to assist claimants in obtain-ing the necessary proofs.
With regard to disability and blindness claims, SSAmakes determinations of all of the nonmedical eligibilityfactors, and each state's Disability DeterminationServices (DDS) makes determinations of the medicaleligibility factors.
Applicants and recipients are required to reportevents and changes of circumstances that may affect
their SSI eligibility and benefit amounts. Such reportsare required, for example, when an individual has achange in the amount of income or resources, changesliving arrangements, or leaves the United States. Fail-ure or delay in submitting a required report can result ina penalty being assessed against the individual’s SSIbenefit.

8/14/2019 Social Security: ssi asr06
http://slidepdf.com/reader/full/social-security-ssi-asr06 17/129

8/14/2019 Social Security: ssi asr06
http://slidepdf.com/reader/full/social-security-ssi-asr06 18/129
10 ♦ SSI Annual Statistical Report, 2006
sons, the amount paid is an overpayment and isprocessed as such.
Presumptive Disability or Blindness. Up to 6 monthsof payments may be made to an individual applying forbenefits on the basis of disability or blindness when theavailable evidence reflects a high degree of probabilitythat the impairment will meet the definition of disability
or blindness and the individual is otherwise eligible.These payments are not considered overpayments ifthe individual is later determined not to be disabled orblind.
State Supplementation
In designing the SSI program, Congress recognizedthat states, in many instances, would want to provide ahigher level of income maintenance than was availableunder the federal program. At the same time, stateswere given the option to either provide no supplemen-
tation to the federal assistance payments or supple-ment those payments on the basis of their views of theneeds of their citizens. They were mandated to ensurethat their citizens would not receive lower benefitsunder the federal program than they had under theformer state program.
Types of State Supplementation
State supplementation can be optional or mandatory.
Optional State Supplementary Payment Programs. For individuals who first became eligible for SSI in 1974
or later, each state could supplement federal paymentsto whatever extent it found appropriate with respect tothe needs of its citizens and the resources of the state.In 2006, 46 states had optional state supplementarypayment programs.
Some states provide supplementary payments toall individuals eligible for SSI benefits; others may limitthem to certain SSI recipients, such as the blind or res-idents of domiciliary care facilities, or may extend themto persons ineligible for SSI because of excess income.States' flexibility in setting supplementary payments,however, has been significantly restr icted by manda-
tory passalong provisions (described below).
Mandatory State Supplementary Payment Pro- grams. States are required to maintain the incomelevels from December 1973 of individuals who weretransferred from the former state adult assistance pro-grams to the SSI program in 1974, except for Texas,which until 1999 had a constitutional bar against man-datory state supplementation.12 Because of theincreases in federal benefits, only a few individuals
continue to receive mandatory state supplementarypayments.
Administration of State Supplementary Payments
A state may administer its supplementary program orenter into an agreement under which SSA will make eli-gibility determinations and payments on behalf of the
state. Under state administration, the state pays its ownprogram benefits and absorbs the full administrativecosts. Under federal administration, states are requiredto pay SSA a fee of $9.69 for each supplementary pay-ment issued in fiscal year 2007. Fees are scheduled torise in succeeding fiscal years.
States that administer their own supplementarypayment programs establish their own eligibility criteria.States with federally administered programs mustadhere to SSI eligibility criteria in all aspects exceptadditional income exclusions.
Mandatory Passalong
It was originally the view of Congress that increases inthe federal SSI benefit rate would eventually replacestate supplementary payments. However, public reac-tion to states reducing their supplementary paymentamounts when SSI payments were increased led Con-gress to mandate that states pass along SSI benefitincreases resulting from cost-of-living adjustments.
To meet the passalong requirement, a state mayeither maintain each state payment level from year to
year (the payment levels method), or it may spend thesame amount of money, in the aggregate, that it spentfor supplementary benefits in the 12-month period pre-ceding the increase in the SSI benefit rate (the total
expenditures method).
Coordination with Other Programs
SSI benefits are not the only form of assistance avail-able to needy aged, blind, or disabled individuals. Med-icaid, food stamps, and temporary state assistance arealso important in keeping individuals from sliding fur-ther into poverty. SSA plays a limited but important role
in helping states with regard to administration of theMedicaid and Food Stamp programs, and provisions inthe SSI statute ensure that payments made by statesor under the Social Security program are not duplicatedby SSI benefits.
12. The requirement does not affect West Virginia, since SSI federal
benefit rates in 1973 exceeded the applicable income standardsunder the state’s adult assistance programs.
8/14/2019 Social Security: ssi asr06
http://slidepdf.com/reader/full/social-security-ssi-asr06 19/129
SSI Annual Statistical Report, 2006 ♦ 11
Windfall Offset
If a person receives SSI payments and is later deter-mined to be entitled to retroactive Social Security bene-fits, such retroactive benefits are reduced by theamount of SSI payments the person would not havebeen eligible for had the Social Security benefits beenpaid in the month they were due. This process, called
the windfall offset , was enacted to prevent windfall pay-ments to individuals when Social Security and SSI pay-ments were paid for the same period.
Medicaid Determinations
Generally, SSI recipients are categorically eligible forMedicaid. A state may use SSI eligibility criteria fordetermining Medicaid eligibility, or it may use its owncriteria as long as the criteria are no more restrictivethan the state's January 1972 medical assistance stan-dards. Forty states use SSI criteria, and 11 states useeligibility criteria that are more restrictive than those of
the SSI program.
States also may enter into agreements with SSAfor SSA to make Medicaid eligibility determinations ontheir behalf as long as the eligibility requirements of thestate's Medicaid plans are the same as those for theSSI program. Under these agreements, SSA deter-mines only when an individual is eligible for Medicaid;SSA does not determine Medicaid ineligibility. SSA hasagreements with 33 states to determine eligibility forMedicaid.
Continued Medicaid eligibility is provided for cer-tain Social Security beneficiaries who lose SSI eligibil-ity because of either an entitlement to Social Securitybenefits or an increase in Social Security benefitsresulting from
• cost-of-living adjustments
• actuarial increases in widow(er)s benefits
• changes in the definition of disability for widow(er)sbenefits
• increases in disabled adult child benefits
Food Stamp Applications
SSI recipients in all states, except California, may beeligible for food stamps. Under agreements enteredinto by the secretary of Agriculture and SSA, SocialSecurity offices notify Social Security and SSI appli-cants and recipients of their potential benefits underthe Food Stamp program and make food stamp appli-cations available to them.13
The law also provides for Social Security offices totake food stamp applications from potentially eligible oreligible SSI households that are not already receivingfood stamps and do not have a food stamp applicationpending. Food stamp applications from SSI house-holds may be taken in connection with initial SSI claimsor at the time of a redetermination. Food stamp appli-cants have the option of applying at Social Security
offices or at state food stamp offices if expedited ser-vice is required. Social Security offices forward the foodstamp application and any supporting documents tothe local food stamp offices within 1 day of taking theapplication. Eligibility is determined by the food stampoffice.
Interim Assistance Reimbursement
SSA may enter into agreements under which states orlocal governments are reimbursed for basic needsassistance provided during the period that an eligibleindividual's SSI application for benefits was pending or
the individual's SSI benefits were suspended and sub-sequently reinstated (the interim period). Thirty-ninestates have interim assistance agreements with SSA.
13. California “cashes out” food stamps, and SSI recipients receive
a cash payment in their state supplementary payment in lieu offood stamps.

8/14/2019 Social Security: ssi asr06
http://slidepdf.com/reader/full/social-security-ssi-asr06 20/129
8/14/2019 Social Security: ssi asr06
http://slidepdf.com/reader/full/social-security-ssi-asr06 21/129
Federal Benefit Rates
and Total Annual Payments

8/14/2019 Social Security: ssi asr06
http://slidepdf.com/reader/full/social-security-ssi-asr06 22/129

8/14/2019 Social Security: ssi asr06
http://slidepdf.com/reader/full/social-security-ssi-asr06 23/129
Federal Benefit Rates and Total Annual Payments
SSI Annual Statistical Report, 2006 ♦ 15
Table 1.Monthly federal SSI benefit rates, 1974–2007 (in dollars)
Own
household
Another's
household
Own
household
Another's
household
140.00 93.34 210.00 140.00 25.00 70.00
146.00 97.34 219.00 146.00 25.00 73.00
157.70 105.14 236.60 157.74 25.00 78.90
167.80 111.87 251.80 167.87 25.00 84.00
177.80 118.54 266.70 177.80 25.00 89.00
189.40 126.27 284.10 189.40 25.00 94.80208.20 138.80 312.30 208.20 25.00 104.20
238.00 158.67 357.00 238.00 25.00 119.20
264.70 176.47 397.00 264.67 25.00 132.60
284.30 189.54 426.40 284.27 25.00 142.50304.30 202.87 456.40 304.27 25.00 152.50
314.00 209.34 472.00 314.67 25.00 157.00
325.00 216.67 488.00 325.34 25.00 163.00
336.00 224.00 504.00 336.00 25.00 168.00
340.00 226.67 510.00 340.00 25.00 170.00354.00 236.00 532.00 354.67 25.00 177.00
368.00 245.34 553.00 368.67 30.00 184.00
386.00 257.34 579.00 386.00 30.00 193.00
407.00 271.34 610.00 406.67 30.00 204.00
422.00 281.34 633.00 422.00 30.00 211.00434.00 289.34 652.00 434.67 30.00 217.00
446.00 297.34 669.00 446.00 30.00 223.00
458.00 305.34 687.00 458.00 30.00 229.00
470.00 313.34 705.00 470.00 30.00 235.00
484.00 322.67 726.00 484.00 30.00 242.00
494.00 329.34 741.00 494.00 30.00 247.00
500.00 333.34 751.00 500.67 30.00 250.00
513.00 342.00 769.00 512.67 30.00 257.00531.00 354.00 796.00 530.67 30.00 266.00
545.00 363.34 817.00 544.67 30.00 273.00
552.00 368.00 829.00 552.67 30.00 277.00
564.00 376.00 846.00 564.00 30.00 282.00
579.00 386.00 869.00 579.34 30.00 290.00
603.00 402.00 904.00 603.34 30.00 301.00
623.00 415.34 935.00 622.67 30.00 311.34
a.
Medicaid
facility
Essential
person
incrementStarting date
July 1982
July 1981
July 1980
July 1979July 1978
Individual Couple
July 1977
July 1976
July 1975
July 1974
January 1974
January 1993January 1992
January 1991
January 1990
January 1989
January 1988January 1987
January 1986
January 2006
January 1985
January 1984July 1983
January 1999
January 1998
January 1997
January 1996
January 1995
January 1994
January 2007
January 2000 a
SOURCE: Social Security Administration, Office of the Chief Actuary.
CONTACT: Alfreda Brooks (410) 965-9849 or [email protected].
Data reflect the correction of an error in the consumer price index.
January 2005
January 2003
January 2002
January 2001 a
January 2004
8/14/2019 Social Security: ssi asr06
http://slidepdf.com/reader/full/social-security-ssi-asr06 24/129
Federal Benefit Rates and Total Annual Payments
16 ♦ SSI Annual Statistical Report, 2006
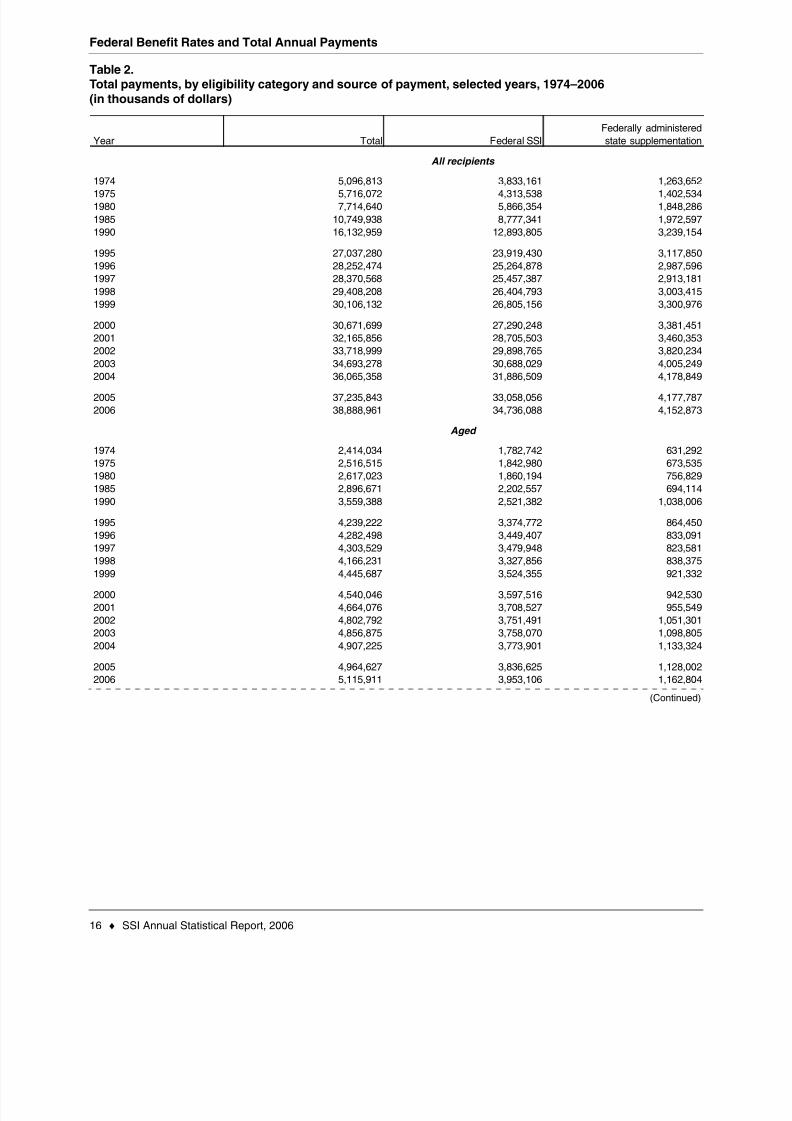
Table 2.Total payments, by eligibility category and source of payment, selected years, 1974–2006
(in thousands of dollars)
(Continued)
Total Federal SSI
Federally administered
state supplementation
5,096,813 3,833,161 1,263,6525,716,072 4,313,538 1,402,534
7,714,640 5,866,354 1,848,286
10,749,938 8,777,341 1,972,597
16,132,959 12,893,805 3,239,154
27,037,280 23,919,430 3,117,850
28,252,474 25,264,878 2,987,596
28,370,568 25,457,387 2,913,181
29,408,208 26,404,793 3,003,415
30,106,132 26,805,156 3,300,976
30,671,699 27,290,248 3,381,451
32,165,856 28,705,503 3,460,353
33,718,999 29,898,765 3,820,234
34,693,278 30,688,029 4,005,249
36,065,358 31,886,509 4,178,849
37,235,843 33,058,056 4,177,787
38,888,961 34,736,088 4,152,873
2,414,034 1,782,742 631,292
2,516,515 1,842,980 673,535
2,617,023 1,860,194 756,829
2,896,671 2,202,557 694,114
3,559,388 2,521,382 1,038,006
4,239,222 3,374,772 864,450
4,282,498 3,449,407 833,091
4,303,529 3,479,948 823,581
4,166,231 3,327,856 838,3754,445,687 3,524,355 921,332
4,540,046 3,597,516 942,530
4,664,076 3,708,527 955,549
4,802,792 3,751,491 1,051,301
4,856,875 3,758,070 1,098,805
4,907,225 3,773,901 1,133,324
4,964,627 3,836,625 1,128,0025,115,911 3,953,106 1,162,804
1999
2005
2004
2003
2001
2002
2005
Aged
1985
2004
1974
2001
2003
Year
2000
1974
1990
1985
1975
All recipients
1995
1998
1997
1996
1980
2006
2006
2000
2002
1980
1975
1990
1998
1997
1995
1996
1999

8/14/2019 Social Security: ssi asr06
http://slidepdf.com/reader/full/social-security-ssi-asr06 25/129
Federal Benefit Rates and Total Annual Payments
SSI Annual Statistical Report, 2006 ♦ 17
Table 2.Total payments, by eligibility category and source of payment, selected years, 1974–2006
(in thousands of dollars)—Continued
Total Federal SSI
Federally administered
state supplementation
125,791 91,308 34,483127,240 92,427 34,813
185,827 131,506 54,321
259,840 195,183 64,657
328,949 238,415 90,534
367,441 298,238 69,203
364,791 298,897 65,894
367,845 302,656 65,189
358,187 291,050 67,137
382,323 309,295 73,028
385,926 312,238 73,688
398,624 323,895 74,729
416,454 335,405 81,049
409,293 325,878 83,415
412,810 327,446 85,364
414,147 330,591 83,556
409,287 326,230 83,057
2,556,988 1,959,112 597,8763,072,317 2,378,131 694,186
4,911,792 3,874,655 1,037,137
7,593,427 6,379,601 1,213,826
12,244,622 10,134,007 2,110,615
22,430,612 20,246,415 2,184,197
23,605,189 21,516,579 2,088,610
23,709,831 21,685,421 2,024,410
24,883,782 22,785,879 2,097,90325,278,121 22,971,506 2,306,615
25,745,710 23,380,477 2,365,233
27,125,707 24,695,630 2,430,077
28,531,939 25,844,055 2,687,884
29,453,803 26,630,775 2,823,028
30,745,406 27,785,246 2,960,160
31,857,069 28,890,840 2,966,229
33,363,762 30,456,751 2,907,011
2006
2006
Blind
Disabled
1995
1990
1974
1985
Year
CONTACT: Stella M. Coleman (410) 965-0157 or [email protected].
NOTE: Totals for "Aged," "Blind," and "Disabled" are derived. The derivation creates s light discrepancies between the sum of the group
totals and the "All recipients" total.
1995
1975
1974
2004
2005
2004
2002
1980
2001
2000
1985
1980
1975
2003
1990
SOURCE: Social Security Administration, Office of Financial Management, Division of Finance.
2003
1997
1996
2002
2001
2000
19991998
2005
1998
1997
1996
1999

8/14/2019 Social Security: ssi asr06
http://slidepdf.com/reader/full/social-security-ssi-asr06 26/129

8/14/2019 Social Security: ssi asr06
http://slidepdf.com/reader/full/social-security-ssi-asr06 27/129
Federally Administered
Payments

8/14/2019 Social Security: ssi asr06
http://slidepdf.com/reader/full/social-security-ssi-asr06 28/129

8/14/2019 Social Security: ssi asr06
http://slidepdf.com/reader/full/social-security-ssi-asr06 29/129
Federally Administered Payments
SSI Annual Statistical Report, 2006 ♦ 21
Table 3.Recipients, by age, December 1974–2006
Number
Percentage
of total Number
Percentage
of total Number
Percentage
of total
1974 3,996,064 70,900 1.8 1,503,155 37.6 2,422,009 60.61975 4,314,275 107,026 2.5 1,699,394 39.4 2,507,855 58.1
1976 4,235,939 125,412 3.0 1,713,594 40.5 2,396,933 56.61977 4,237,692 147,355 3.5 1,736,879 41.0 2,353,458 55.5
1978 4,216,925 165,899 3.9 1,747,126 41.4 2,303,900 54.6
1979 4,149,575 177,306 4.3 1,726,553 41.6 2,245,716 54.1
1980 4,142,017 190,394 4.6 1,730,847 41.8 2,220,776 53.6
1981 4,018,875 194,890 4.8 1,702,895 42.4 2,121,090 52.8
1982 3,857,590 191,570 5.0 1,655,279 42.9 2,010,741 52.1
1983 3,901,497 198,323 5.1 1,699,774 43.6 2,003,400 51.3
1984 4,029,333 211,587 5.3 1,780,459 44.2 2,037,287 50.6
1985 4,138,021 227,384 5.5 1,879,168 45.4 2,031,469 49.1
1986 4,269,184 241,198 5.6 2,010,458 47.1 2,017,528 47.3
1987 4,384,999 250,902 5.7 2,118,710 48.3 2,015,387 46.0
1988 4,463,869 255,135 5.7 2,202,714 49.3 2,006,020 44.9
1989 4,593,059 264,890 5.8 2,301,926 50.1 2,026,243 44.1
1990 4,817,127 308,589 6.4 2,449,897 50.9 2,058,641 42.7
1991 5,118,470 397,162 7.8 2,641,524 51.6 2,079,784 40.6
1992 5,566,189 556,470 10.0 2,910,016 52.3 2,099,703 37.7
1993 5,984,330 722,678 12.1 3,148,413 52.6 2,113,239 35.3
1994 6,295,786 841,474 13.4 3,335,255 53.0 2,119,057 33.7
1995 6,514,134 917,048 14.1 3,482,256 53.5 2,114,830 32.5
1996 6,613,718 955,174 14.4 3,568,393 54.0 2,090,151 31.6
1997 6,494,985 879,828 13.5 3,561,625 54.8 2,053,532 31.6
1998 6,566,069 887,066 13.5 3,646,020 55.5 2,032,983 31.0
1999 6,556,634 847,063 12.9 3,690,970 56.3 2,018,601 30.8
2000 6,601,686 846,784 12.8 3,744,022 56.7 2,010,880 30.5
2001 6,688,489 881,836 13.2 3,811,494 57.0 1,995,159 29.8
2002 6,787,857 914,821 13.5 3,877,752 57.1 1,995,284 29.4
2003 6,902,364 959,379 13.9 3,953,248 57.3 1,989,737 28.8
2004 6,987,845 993,127 14.2 4,017,108 57.5 1,977,610 28.3
2005 7,113,879 1,036,498 14.6 4,082,870 57.4 1,994,511 28.0
2006 7,235,583 1,078,977 14.9 4,152,130 57.4 2,004,476 27.7
Aged 65 or older
CONTACT: Clark Pickett (410) 965-9016 or [email protected].
SOURCE: Social Security Administration, Supplemental Security Record (Characteristic Extract Record format), 100 percent data.
Year Total
Under age 18 Aged 18–64

8/14/2019 Social Security: ssi asr06
http://slidepdf.com/reader/full/social-security-ssi-asr06 30/129
Federally Administered Payments
22 ♦ SSI Annual Statistical Report, 2006
Table 4.By type of payment, sex, eligibility category, and age, December 2006
Aged Blind Disabled Under 18 18–64 65 or older
7,235,583 1,211,656 73,418 5,950,509 1,078,977 4,152,130 2,004,476
Male 3,145,335 385,355 33,331 2,726,649 707,388 1,818,993 618,954Female 4,090,248 826,301 40,087 3,223,860 371,589 2,333,137 1,385,522
6,938,690 1,108,925 68,165 5,761,600 1,076,354 4,004,390 1,857,946
Male 3,011,817 346,643 30,747 2,634,427 705,676 1,742,068 564,073
Female 3,926,873 762,282 37,418 3,127,173 370,678 2,262,322 1,293,873
2,268,579 590,575 30,657 1,647,347 220,060 1,163,085 885,434
Male 977,761 208,166 13,934 755,661 144,907 531,823 301,031
Female 1,290,818 382,409 16,723 891,686 75,153 631,262 584,403
3,499,569 453,529 36,297 3,009,743 610,874 2,134,335 754,360
Male 1,577,757 148,446 16,380 1,412,931 401,187 941,405 235,166
Female 1,921,812 305,083 19,917 1,596,812 209,687 1,192,930 519,194
3,130,803 351,915 29,133 2,749,754 592,877 1,936,436 601,490Male 1,414,866 110,304 13,139 1,291,422 389,424 845,805 179,636
Female 1,715,937 241,611 15,994 1,458,332 203,453 1,090,630 421,854
368,767 101,614 7,164 259,989 17,997 197,900 152,870
Male 162,892 38,142 3,241 121,509 11,762 95,600 55,529
Female 205,875 63,472 3,923 138,480 6,235 102,300 97,341
454.75 373.05 488.42 471.00 541.85 470.64 375.10
Male 467.69 383.93 484.08 479.35 542.66 468.86 378.60
Female 444.84 367.99 492.03 463.95 540.29 472.03 373.54
423.05 316.48 423.15 443.61 527.42 441.60 322.87
Male 436.68 317.24 422.03 452.62 528.29 438.22 317.48
Female 412.63 316.14 424.07 436.04 525.76 444.18 325.21
156.24 170.64 228.97 149.71 77.04 159.79 171.26
Male 159.12 181.83 227.22 151.59 76.39 168.19 182.99
Female 154.06 164.56 230.42 148.12 78.30 152.73 165.23
a.
Type of payment and sex Total
Category Age
Number
All payments
Federal SSI
State supplementation
Total payments (thousands of dollars)
All payments
Federal SSI
State supplementation
SOURCE: Social Security Administration, Supplemental Security Record (Characteristic Extract Record format), 100 percent data.
Averages are not obtained simply by dividing the total dollars by the number of recipients. Averages exclude payments made in the
current month for prior-month eligibility, such as back pay for new awards, so that large retroactive payments do not distort the
averages.
CONTACT: Art Kahn (410) 965-0186 or [email protected].
Average monthly payment a (dollars)
All payments
Federal SSI
State supplementation
8/14/2019 Social Security: ssi asr06
http://slidepdf.com/reader/full/social-security-ssi-asr06 31/129
Federally Administered Payments
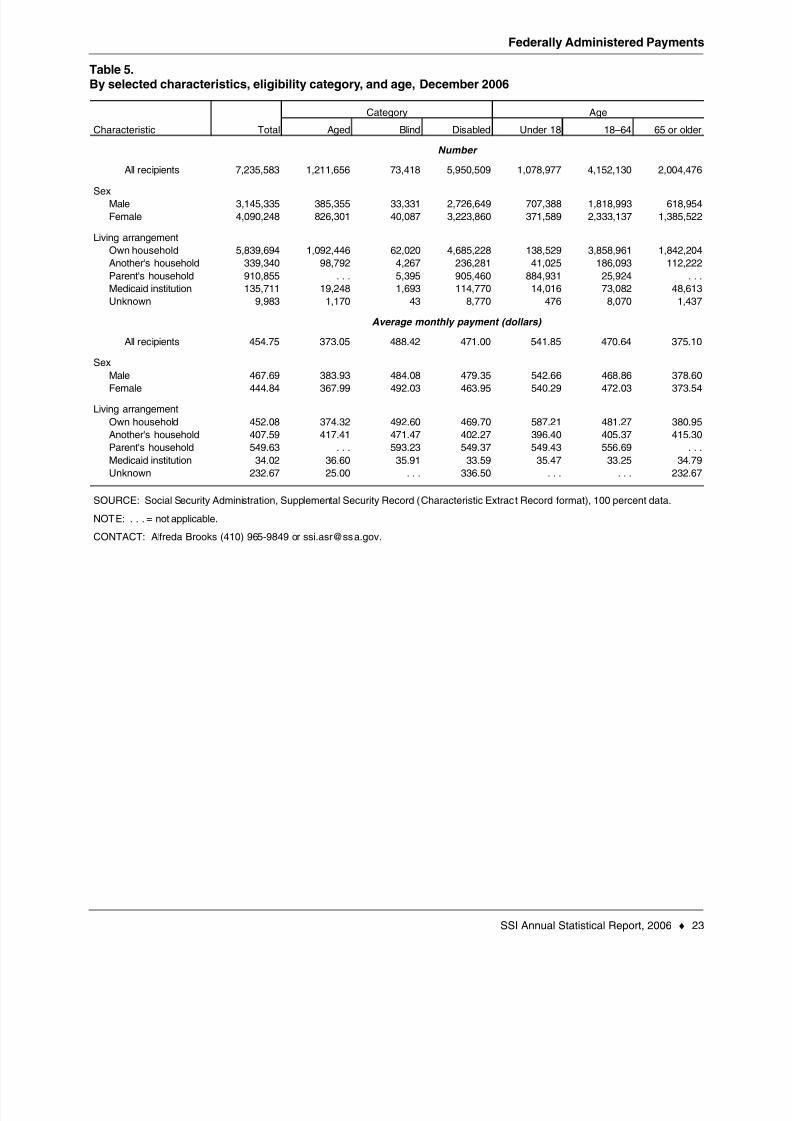
SSI Annual Statistical Report, 2006 ♦ 23
Table 5.By selected characteristics, eligibility category, and age, December 2006
Aged Blind Disabled Under 18 18–64 65 or older
All recipients 7,235,583 1,211,656 73,418 5,950,509 1,078,977 4,152,130 2,004,476
3,145,335 385,355 33,331 2,726,649 707,388 1,818,993 618,954
4,090,248 826,301 40,087 3,223,860 371,589 2,333,137 1,385,522
5,839,694 1,092,446 62,020 4,685,228 138,529 3,858,961 1,842,204
339,340 98,792 4,267 236,281 41,025 186,093 112,222
910,855 . . . 5,395 905,460 884,931 25,924 . . .135,711 19,248 1,693 114,770 14,016 73,082 48,613
9,983 1,170 43 8,770 476 8,070 1,437
All recipients 454.75 373.05 488.42 471.00 541.85 470.64 375.10
467.69 383.93 484.08 479.35 542.66 468.86 378.60444.84 367.99 492.03 463.95 540.29 472.03 373.54
452.08 374.32 492.60 469.70 587.21 481.27 380.95
407.59 417.41 471.47 402.27 396.40 405.37 415.30
549.63 . . . 593.23 549.37 549.43 556.69 . . .
34.02 36.60 35.91 33.59 35.47 33.25 34.79
232.67 25.00 . . . 336.50 . . . . . . 232.67
Male
Another's household
Medicaid institution
Unknown
Characteristic
Number
Average monthly payment (dollars)
Age
Unknown
Own household
Another's household
Parent's household
Sex
Female
Living arrangement
Parent's household
Male
Total
CONTACT: Alfreda Brooks (410) 965-9849 or [email protected].
SOURCE: Social Security Administration, Supplemental Security Record (Characteristic Extract Record format), 100 percent data.
NOTE: . . . = not applicable.
Category
Sex
Living arrangement
Own household
Medicaid institution
Female

8/14/2019 Social Security: ssi asr06
http://slidepdf.com/reader/full/social-security-ssi-asr06 32/129
Federally Administered Payments
24 ♦ SSI Annual Statistical Report, 2006
Table 6.Recipients, by type of representative payee, eligibility category, and age, December 2006
Aged Blind Disabled Under 18 18–64 65 or older
All recipients 7,235,583 1,211,656 73,418 5,950,509 1,078,977 4,152,130 2,004,476
4,583,571 1,167,108 53,821 3,362,642 816 2,735,703 1,847,052
2,652,012 44,548 19,597 2,587,867 1,078,161 1,416,427 157,424
1,526,939 344 11,708 1,514,887 880,777 644,240 1,922
58,551 1,987 222 56,342 50 49,384 9,117
97,909 18,933 657 78,319 397 49,974 47,538
102,678 35 643 102,000 73,278 29,340 60
360,664 10,673 2,422 347,569 76,264 241,758 42,642
129,038 6,382 1,298 121,358 6,292 97,207 25,539
76,674 1,097 730 74,847 2,646 67,538 6,490
3,418 42 15 3,361 169 3,071 178
130,864 2,083 1,063 127,718 20,013 100,748 10,10315,186 489 79 14,618 1,368 11,641 2,177
150,091 2,483 760 146,848 16,907 121,526 11,658
Category Age
Type of payee Total
CONTACT: Alfreda Brooks (410) 965-9849 or [email protected].
Financial organization
Other
Natural, adoptive, or stepchild
Grandparent
Mental institution
Nonmental institution
Public official
Other relative
SOURCE: Social Security Administration, Supplemental Security Record (Characteristic Extract Record format), 100 percent data.
Without payee
Social agency
With payee
Natural or adoptive parents
Spouse

8/14/2019 Social Security: ssi asr06
http://slidepdf.com/reader/full/social-security-ssi-asr06 33/129
Federally Administered Payments
SSI Annual Statistical Report, 2006 ♦ 25
Table 7.Recipients, by type of income, eligibility category, and age, December 2006
Aged Blind Disabled Under 18 18–64 65 or older
All recipients a 7,235,583 1,211,656 73,418 5,950,509 1,078,977 4,152,130 2,004,476
4,011,553 427,225 39,102 3,545,226 801,905 2,471,026 738,622
275,252 18,236 4,319 252,697 3,024 244,228 28,000
2,528,975 692,348 26,913 1,809,714 77,401 1,309,629 1,141,945
60,914 24,910 464 35,540 1,223 21,061 38,63018,556 212 52 18,292 12,200 6,124 232
4,963 398 17 4,548 12 3,989 962
141,036 1 872 140,163 137,274 3,761 1
59,896 39,872 386 19,638 45 12,200 47,651
306,491 88,290 2,568 215,633 49,999 147,659 108,833
191,009 69,062 2,599 119,348 9,733 85,429 95,847
73,980 12,956 725 60,299 3,331 52,286 18,363
a.
b.
c.
SOURCE: Social Security Administration, Supplemental Security Record (Characteristic Extract Record format), 100 percent data.
Total
Earned income
Other c
Social Security benefits
Unearned income
Veterans' benefits
Category Age
Type of income
No other income
CONTACT: Alfreda Brooks (410) 965-9849 or [email protected].
Asset income b
Income based on need
Workers' compensation
Support and maintenance
Pensions
Support from absent parents
The sum of the entries may be greater than the total because some recipients may receive more than one type of unearned income orboth earned and unearned income.
Includes income received as rent, interest, dividends, and royalties.
Does not include income deemed from a spouse or parent.

8/14/2019 Social Security: ssi asr06
http://slidepdf.com/reader/full/social-security-ssi-asr06 34/129
Federally Administered Payments
26 ♦ SSI Annual Statistical Report, 2006
Table 8.By receipt of Social Security, type of income, eligibility category, and age, December 2006
Aged Blind Disabled Under 18 18–64 65 or older
All recipients 7,235,583 1,211,656 73,418 5,950,509 1,078,977 4,152,130 2,004,476
2,156,980 550,464 22,981 1,583,535 67,095 1,138,403 951,482
100,051 10,431 1,453 88,167 291 83,557 16,203
261,504 129,727 2,324 129,453 9,953 79,758 171,793
10,440 1,710 155 8,575 62 7,911 2,467
4,011,553 427,225 39,102 3,545,226 801,905 2,471,026 738,622
148,298 4,876 2,461 140,961 2,004 138,542 7,752
530,294 86,004 4,692 439,598 197,000 218,715 114,579
16,463 1,219 250 14,994 667 14,218 1,578
All recipients 454.75 373.05 488.42 471.00 541.85 470.64 375.10
224.83 219.14 259.75 226.30 403.22 217.51 221.04
228.99 213.06 250.79 230.58 354.47 230.71 218.16
196.30 180.95 232.27 211.53 352.82 209.74 181.43
220.56 197.08 251.99 224.88 297.03 224.60 206.47
595.33 603.88 640.42 593.80 573.50 601.06 599.88
480.95 437.47 495.30 482.20 486.51 482.63 449.56
495.76 531.35 552.29 488.20 471.07 499.93 530.21
426.96 372.63 480.47 430.49 398.73 433.08 383.27
a.
Unearned income only a
Both earned and unearned
income a
Both earned and unearned
incomea
Without Social Security
No other income
Earned income only
Unearned income only a
Earned income only
No other income
Earned income only
With Social Security
Number
Average monthly payment (dollars)
Type of income Total
No other income
Earned income only
Category Age
With Social Security
Includes recipients with in-kind unearned income.
CONTACT: Art Kahn (410) 965-0186 or [email protected].
Unearned income only a
Unearned income only a
SOURCE: Social Security Administration, Supplemental Security Record (Characteristic Extract Record format), 100 percent data.
Without Social Security
Both earned and unearned
income a
No other income
Both earned and unearned
income a

8/14/2019 Social Security: ssi asr06
http://slidepdf.com/reader/full/social-security-ssi-asr06 35/129
Federally Administered Payments
SSI Annual Statistical Report, 2006 ♦ 27
Table 9.Recipients, by state or other area, eligibility category, and age, December 2006
(Continued)
Aged Blind Disabled Under 18 18–64 65 or older
All areas 7,235,583 1,211,656 73,418 5,950,509 1,078,977 4,152,130 2,004,476
164,764 16,659 929 147,176 28,672 102,236 33,856
11,340 2,114 102 9,124 1,155 7,127 3,05899,196 13,415 877 84,904 17,804 57,781 23,61192,960 9,157 775 83,028 19,501 54,978 18,481
1,226,697 360,316 21,273 845,108 99,711 595,736 531,250
56,830 8,648 528 47,654 7,161 35,557 14,112
53,276 6,700 467 46,109 6,898 33,733 12,64514,038 1,300 106 12,632 3,334 8,271 2,433
21,713 1,974 151 19,588 4,441 13,048 4,224
427,902 100,597 2,770 324,535 80,608 203,177 144,117
205,793 26,753 1,974 177,066 35,046 119,885 50,862
22,924 6,452 198 16,274 1,557 12,812 8,55523,053 1,825 206 21,022 4,296 15,469 3,288
261,052 30,448 2,382 228,222 45,096 157,824 58,132
101,058 5,756 934 94,368 21,545 67,180 12,33343,896 3,568 769 39,559 7,124 29,745 7,027
39,501 3,225 356 35,920 7,302 25,773 6,426
181,857 13,374 1,381 167,102 27,797 120,584 33,476
157,299 16,794 1,608 138,897 29,343 94,024 33,932
32,536 2,356 223 29,957 3,504 23,723 5,309
96,248 15,294 647 80,307 15,275 56,186 24,787174,509 44,807 3,729 125,973 19,129 107,365 48,015
225,160 16,680 1,697 206,783 38,719 149,999 36,442
75,793 10,266 724 64,803 11,212 47,595 16,986
123,679 14,157 969 108,553 22,853 71,275 29,551
119,795 9,219 975 109,601 20,269 79,800 19,726
15,208 1,087 131 13,990 2,091 10,673 2,444
22,621 2,046 244 20,331 3,533 15,167 3,92134,468 8,823 670 24,975 6,193 18,883 9,392
14,470 869 157 13,444 1,953 10,680 1,837
154,482 33,722 960 119,800 22,704 80,463 51,315
55,182 8,457 476 46,249 7,762 31,650 15,770
641,870 135,790 2,992 503,088 73,422 337,376 231,072
202,613 24,302 1,771 176,540 38,294 116,889 47,430
8,035 954 74 7,007 989 5,241 1,805
254,012 15,242 1,835 236,935 43,565 173,497 36,950
82,386 7,717 780 73,889 14,592 52,329 15,465
62,280 7,949 647 53,684 8,321 40,642 13,317
325,822 28,797 2,144 294,881 60,991 204,071 60,760
30,720 3,923 193 26,604 4,232 19,224 7,264
105,411 11,760 1,381 92,270 18,731 62,382 24,29812,748 1,630 92 11,026 2,020 7,683 3,045
162,574 16,042 1,524 145,008 23,411 104,432 34,731
524,458 109,073 6,539 408,846 95,709 265,476 163,273
23,532 2,320 259 20,953 4,219 15,268 4,045
Age
State or area Total
New York
Category
Idaho
Illinois
Colorado
California
Arkansas
Rhode Island
Pennsylvania
New Mexico
New Jersey
Oregon
Oklahoma
Ohio
North Dakota
Kansas
IowaIndiana
New Hampshire
NevadaNebraska
MontanaMissouri
Mississippi
Kentucky
ArizonaAlaska
Alabama
Minnesota
Michigan
MassachusettsMaryland
Maine
Louisiana
Hawaii
Georgia
Florida
District of ColumbiaDelaware
Connecticut
North Carolina
South DakotaSouth Carolina
Utah
Texas
Tennessee

8/14/2019 Social Security: ssi asr06
http://slidepdf.com/reader/full/social-security-ssi-asr06 36/129
Federally Administered Payments
28 ♦ SSI Annual Statistical Report, 2006
Table 9.Recipients, by state or other area, eligibility category, and age, December 2006—Continued
Aged Blind Disabled Under 18 18–64 65 or older
13,457 1,122 89 12,246 1,723 9,228 2,506
139,313 20,512 1,254 117,547 22,810 81,496 35,007118,946 15,009 921 103,016 15,217 76,419 27,310
77,987 4,020 576 73,391 8,936 56,945 12,10693,549 8,110 905 84,534 17,111 60,661 15,777
5,786 406 42 5,338 861 4,083 842
784 120 12 652 235 389 160
Outlying area
Wyoming
WisconsinWest Virginia
WashingtonVirginia
CONTACT: Alfreda Brooks (410) 965-9849 or [email protected].
SOURCE: Social Security Administration, Supplemental Security Record (Characteristic Extract Record format), 100 percent data.
Northern Mariana Islands
Vermont
State or area Total
Category Age
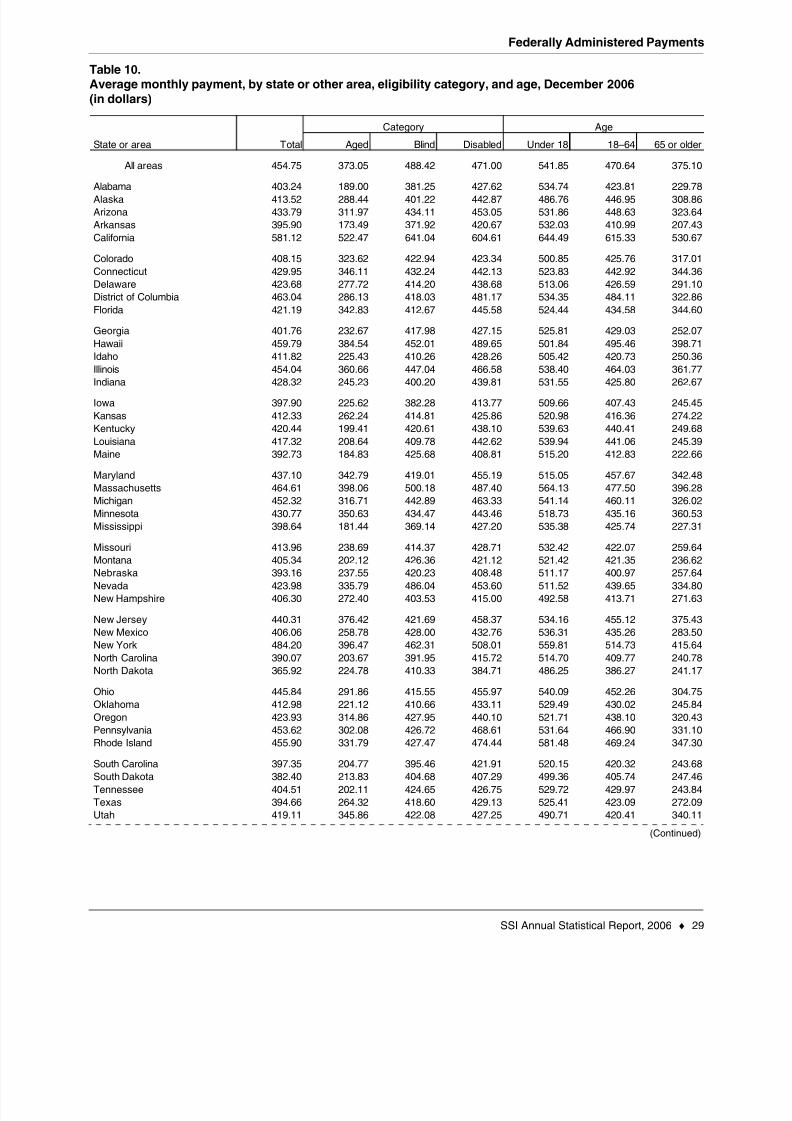
8/14/2019 Social Security: ssi asr06
http://slidepdf.com/reader/full/social-security-ssi-asr06 37/129
Federally Administered Payments
SSI Annual Statistical Report, 2006 ♦ 29
Table 10.Average monthly payment, by state or other area, eligibility category, and age, December 2006
(in dollars)
(Continued)
Aged Blind Disabled Under 18 18–64 65 or older
All areas 454.75 373.05 488.42 471.00 541.85 470.64 375.10
403.24 189.00 381.25 427.62 534.74 423.81 229.78413.52 288.44 401.22 442.87 486.76 446.95 308.86
433.79 311.97 434.11 453.05 531.86 448.63 323.64
395.90 173.49 371.92 420.67 532.03 410.99 207.43
581.12 522.47 641.04 604.61 644.49 615.33 530.67
408.15 323.62 422.94 423.34 500.85 425.76 317.01
429.95 346.11 432.24 442.13 523.83 442.92 344.36
423.68 277.72 414.20 438.68 513.06 426.59 291.10
463.04 286.13 418.03 481.17 534.35 484.11 322.86
421.19 342.83 412.67 445.58 524.44 434.58 344.60
401.76 232.67 417.98 427.15 525.81 429.03 252.07
459.79 384.54 452.01 489.65 501.84 495.46 398.71
411.82 225.43 410.26 428.26 505.42 420.73 250.36
454.04 360.66 447.04 466.58 538.40 464.03 361.77428.32 245.23 400.20 439.81 531.55 425.80 262.67
397.90 225.62 382.28 413.77 509.66 407.43 245.45
412.33 262.24 414.81 425.86 520.98 416.36 274.22
420.44 199.41 420.61 438.10 539.63 440.41 249.68
417.32 208.64 409.78 442.62 539.94 441.06 245.39
392.73 184.83 425.68 408.81 515.20 412.83 222.66
437.10 342.79 419.01 455.19 515.05 457.67 342.48
464.61 398.06 500.18 487.40 564.13 477.50 396.28
452.32 316.71 442.89 463.33 541.14 460.11 326.02
430.77 350.63 434.47 443.46 518.73 435.16 360.53
398.64 181.44 369.14 427.20 535.38 425.74 227.31
413.96 238.69 414.37 428.71 532.42 422.07 259.64
405.34 202.12 426.36 421.12 521.42 421.35 236.62393.16 237.55 420.23 408.48 511.17 400.97 257.64
423.98 335.79 486.04 453.60 511.52 439.65 334.80
406.30 272.40 403.53 415.00 492.58 413.71 271.63
440.31 376.42 421.69 458.37 534.16 455.12 375.43
406.06 258.78 428.00 432.76 536.31 435.26 283.50
484.20 396.47 462.31 508.01 559.81 514.73 415.64
390.07 203.67 391.95 415.72 514.70 409.77 240.78
365.92 224.78 410.33 384.71 486.25 386.27 241.17
445.84 291.86 415.55 455.97 540.09 452.26 304.75
412.98 221.12 410.66 433.11 529.49 430.02 245.84
423.93 314.86 427.95 440.10 521.71 438.10 320.43
453.62 302.08 426.72 468.61 531.64 466.90 331.10
455.90 331.79 427.47 474.44 581.48 469.24 347.30
397.35 204.77 395.46 421.91 520.15 420.32 243.68
382.40 213.83 404.68 407.29 499.36 405.74 247.46
404.51 202.11 424.65 426.75 529.72 429.97 243.84
394.66 264.32 418.60 429.13 525.41 423.09 272.09
419.11 345.86 422.08 427.25 490.71 420.41 340.11
Age
State or area Total
New York
Category
Idaho
Illinois
Colorado
California
Arkansas
Rhode Island
Pennsylvania
New Mexico
New Jersey
Oregon
Oklahoma
Ohio
North Dakota
Iowa
Indiana
New Hampshire
Nevada
NebraskaMontana
Missouri
Mississippi
Kentucky
Kansas
Arizona
AlaskaAlabama
Minnesota
Michigan
Massachusetts
Maryland
Maine
Louisiana
Hawaii
Georgia
Florida
District of Columbia
Delaware
Connecticut
North Carolina
South Dakota
South Carolina
Utah
Texas
Tennessee

8/14/2019 Social Security: ssi asr06
http://slidepdf.com/reader/full/social-security-ssi-asr06 38/129
Federally Administered Payments
30 ♦ SSI Annual Statistical Report, 2006
Table 10.Average monthly payment, by state or other area, eligibility category, and age, December 2006
(in dollars)—Continued
Aged Blind Disabled Under 18 18–64 65 or older
411.23 211.78 406.71 429.49 562.75 426.84 250.27
405.57 293.39 405.89 425.18 510.48 423.56 295.56
449.06 392.36 441.75 457.41 518.16 457.13 388.30
428.57 194.90 421.00 441.44 529.96 448.36 260.97
419.83 260.35 425.39 435.10 526.60 425.45 282.72
392.96 176.37 430.12 409.43 492.58 409.79 213.19
493.58 358.44 457.09 420.56 581.30 491.01 381.02
Outlying area
Wyoming
Wisconsin
West Virginia
Washington
Virginia
CONTACT: Alfreda Brooks (410) 965-9849 or [email protected].
SOURCE: Social Security Administration, Supplemental Security Record (Characteristic Extract Record format), 100 percent data.
Northern Mariana Islands
Vermont
State or area Total
Category Age
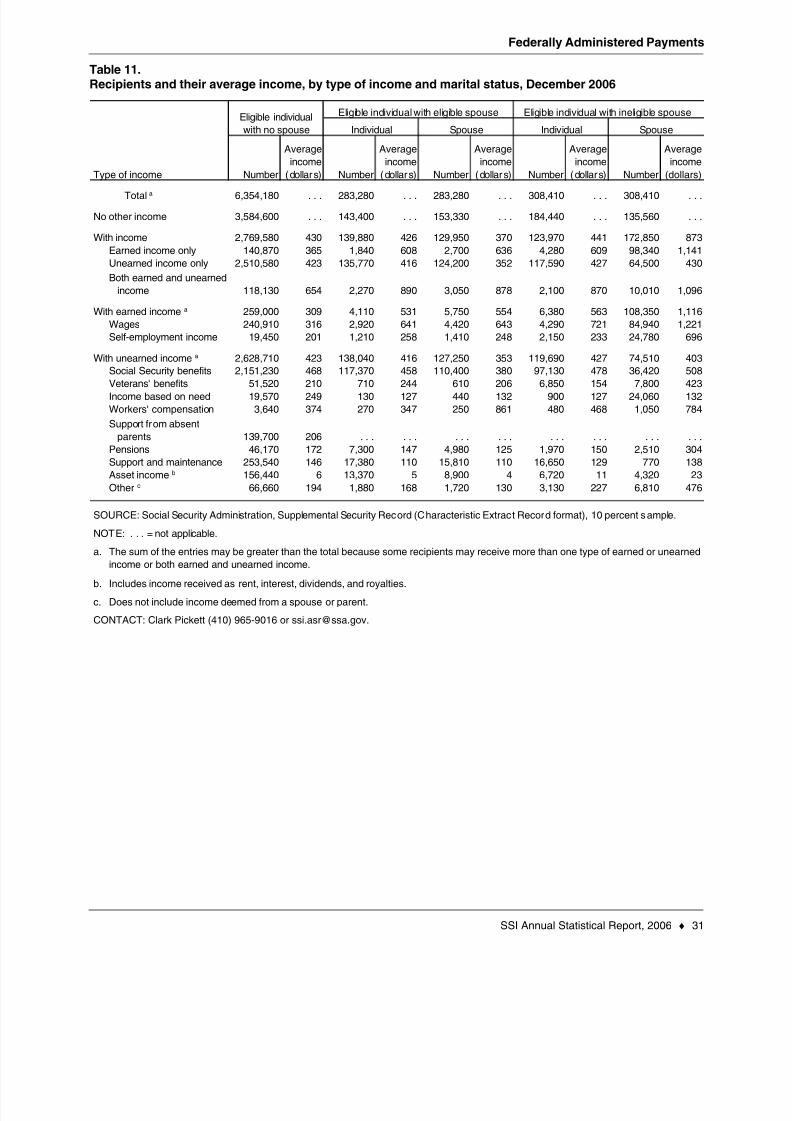
8/14/2019 Social Security: ssi asr06
http://slidepdf.com/reader/full/social-security-ssi-asr06 39/129
Federally Administered Payments
SSI Annual Statistical Report, 2006 ♦ 31
Table 11.Recipients and their average income, by type of income and marital status, December 2006
Number
Average
income
(dollars) Number
Average
income
(dollars) Number
Average
income
(dollars) Number
Average
income
(dollars) Number
Average
income
(dollars)
Total a 6,354,180 . . . 283,280 . . . 283,280 . . . 308,410 . . . 308,410 . . .
3,584,600 . . . 143,400 . . . 153,330 . . . 184,440 . . . 135,560 . . .
2,769,580 430 139,880 426 129,950 370 123,970 441 172,850 873
140,870 365 1,840 608 2,700 636 4,280 609 98,340 1,141
2,510,580 423 135,770 416 124,200 352 117,590 427 64,500 430
118,130 654 2,270 890 3,050 878 2,100 870 10,010 1,096
259,000 309 4,110 531 5,750 554 6,380 563 108,350 1,116
240,910 316 2,920 641 4,420 643 4,290 721 84,940 1,221
19,450 201 1,210 258 1,410 248 2,150 233 24,780 696
2,628,710 423 138,040 416 127,250 353 119,690 427 74,510 403
2,151,230 468 117,370 458 110,400 380 97,130 478 36,420 50851,520 210 710 244 610 206 6,850 154 7,800 423
19,570 249 130 127 440 132 900 127 24,060 132
3,640 374 270 347 250 861 480 468 1,050 784
139,700 206 . . . . . . . . . . . . . . . . . . . . . . . .
46,170 172 7,300 147 4,980 125 1,970 150 2,510 304
253,540 146 17,380 110 15,810 110 16,650 129 770 138
156,440 6 13,370 5 8,900 4 6,720 11 4,320 23
66,660 194 1,880 168 1,720 130 3,130 227 6,810 476
a.
b.
c.
Social Security benefits
SOURCE: Social Security Administration, Supplemental Security Record (Characteristic Extract Record format), 10 percent sample.
NOTE: . . . = not applicable.
The sum of the entries may be greater than the total because some recipients may receive more than one type of earned or unearned
income or both earned and unearned income.
Veterans' benefits
Support from absent
parents
Workers' compensation
Income based on need
Includes income received as rent, interest, dividends, and royalties.
Does not include income deemed from a spouse or parent.
CONTACT: Clark Pickett (410) 965-9016 or [email protected].
Type of income
Wages
With unearned income a
Other c
Asset income b
Support and maintenance
Pensions
Spouse Individual Spouse
Eligible individual
with no spouse
Eligible individual with eligible spouse Eligible individual with ineligible spouse
With earned income a
Self-employment income
No other income
With income
Both earned and unearned
income
Unearned income only
Earned income only
Individual

8/14/2019 Social Security: ssi asr06
http://slidepdf.com/reader/full/social-security-ssi-asr06 40/129
Federally Administered Payments
32 ♦ SSI Annual Statistical Report, 2006
Table 12.Recipients as a percentage of resident population, by state, December 2006
(Continued)
Number
Percentage of
resident population
United States 299,398,484 b 7,235,583 2.4
4,599,030 164,764 3.6670,053 11,340 1.7
6,166,318 99,196 1.6
2,810,872 92,960 3.3
36,457,549 1,226,697 3.4
4,753,377 56,830 1.2
3,504,809 53,276 1.5
853,476 14,038 1.6
581,530 21,713 3.7
18,089,888 427,902 2.4
9,363,941 205,793 2.2
1,285,498 22,924 1.8
1,466,465 23,053 1.6
12,831,970 261,052 2.06,313,520 101,058 1.6
2,982,085 43,896 1.5
2,764,075 39,501 1.4
4,206,074 181,857 4.34,287,768 157,299 3.7
1,321,574 32,536 2.5
5,615,727 96,248 1.7
6,437,193 174,509 2.7
10,095,643 225,160 2.2
5,167,101 75,793 1.5
2,910,540 123,679 4.2
5,842,713 119,795 2.1
944,632 15,208 1.61,768,331 22,621 1.3
2,495,529 34,468 1.4
1,314,895 14,470 1.1
8,724,560 154,482 1.8
1,954,599 55,182 2.819,306,183 641,870 3.3
8,856,505 202,613 2.3
635,867 8,035 1.3
11,478,006 254,012 2.23,579,212 82,386 2.3
3,700,758 62,280 1.7
12,440,621 325,822 2.6
1,067,610 30,720 2.9
4,321,249 105,411 2.4781,919 12,748 1.6
6,038,803 162,574 2.7
23,507,783 524,458 2.2
2,550,063 23,532 0.9
South DakotaSouth Carolina
Tennessee
Utah
Texas
Minnesota
Michigan
Massachusetts
Maryland
NebraskaMontana
Missouri
Mississippi
District of Columbia
Delaware
Connecticut
Hawaii
Florida
Georgia
Colorado
California
Arkansas
Arizona
AlaskaAlabama
Maine
LouisianaKentucky
Kansas
Iowa
IndianaIllinois
Idaho
Rhode Island
Pennsylvania
Oregon
OklahomaOhio
North Dakota
North Carolina
Nevada
New YorkNew Mexico
New Jersey
New Hampshire
Recipients
Resident population aState
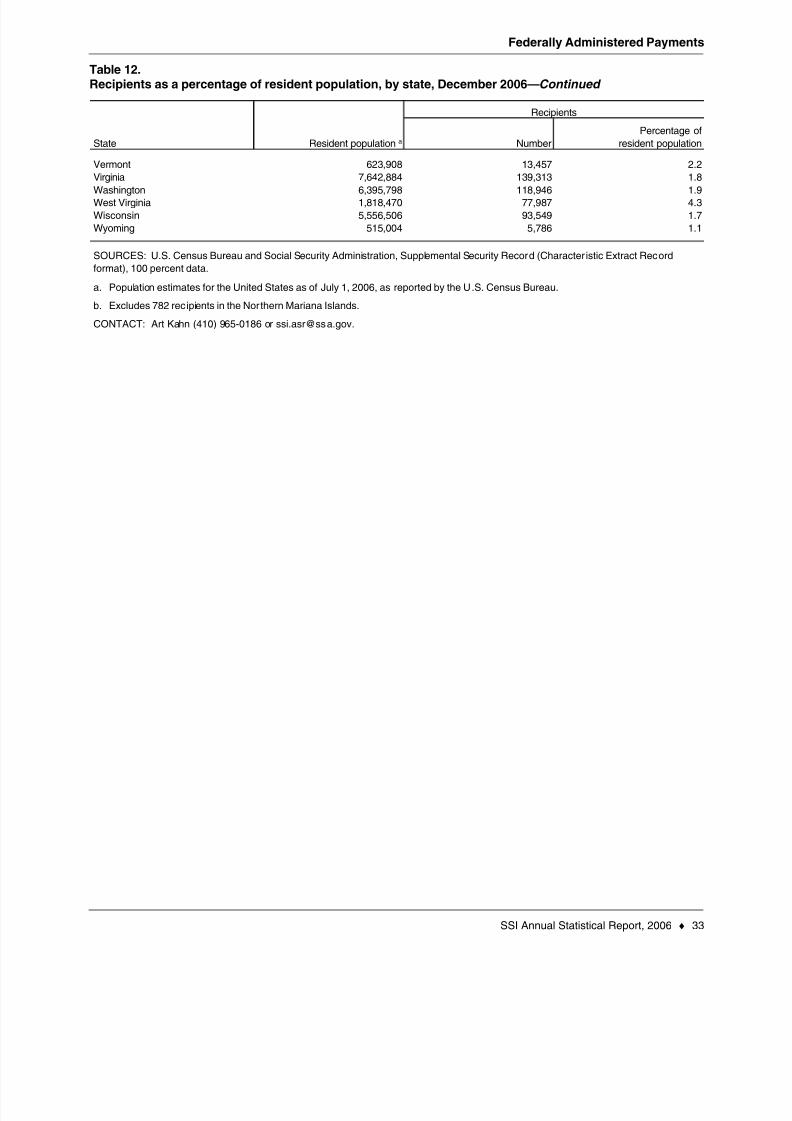
8/14/2019 Social Security: ssi asr06
http://slidepdf.com/reader/full/social-security-ssi-asr06 41/129
Federally Administered Payments
SSI Annual Statistical Report, 2006 ♦ 33
Table 12.Recipients as a percentage of resident population, by state, December 2006—Continued
Number
Percentage of
resident population
623,908 13,457 2.2
7,642,884 139,313 1.8
6,395,798 118,946 1.91,818,470 77,987 4.3
5,556,506 93,549 1.7
515,004 5,786 1.1
a.
b.
Washington
Virginia
State
Population estimates for the United States as of July 1, 2006, as reported by the U.S. Census Bureau.
Resident population a
Recipients
Excludes 782 recipients in the Northern Mariana Islands.
CONTACT: Art Kahn (410) 965-0186 or [email protected].
Vermont
SOURCES: U.S. Census Bureau and Social Security Administration, Supplemental Security Record (Characteristic Extract Record
format), 100 percent data.
Wyoming
Wisconsin
West Virginia

8/14/2019 Social Security: ssi asr06
http://slidepdf.com/reader/full/social-security-ssi-asr06 42/129
Federally Administered Payments
34 ♦ SSI Annual Statistical Report, 2006
Table 13.Foreign-born recipients, by region, country of origin, eligibility category, and age, December 2006
Aged
Blind and
disabled Under 18 18–64 65 or older
All areas 1,568,503 759,018 809,485 17,875 507,823 1,042,805
189,357 27,112 162,245 10,942 116,345 62,070181,062 24,866 156,196 10,701 111,691 58,670
175,869 24,223 151,646 10,066 108,384 57,419
5,193 643 4,550 635 3,307 1,251
8,295 2,246 6,049 241 4,654 3,400
595,258 302,909 292,349 2,585 186,332 406,341
263,435 131,899 131,536 807 83,132 179,496
98,345 54,412 43,933 396 24,415 73,534
68,981 25,013 43,968 568 29,923 38,490164,497 91,585 72,912 814 48,862 114,821
23,841 10,202 13,639 602 10,448 12,791
5,636 2,383 3,253 153 2,497 2,986
1,468 940 528 6 424 1,038
3,156 1,101 2,055 36 1,647 1,47313,581 5,778 7,803 407 5,880 7,294
498,796 298,559 200,237 1,464 120,310 377,022
105,078 46,067 59,011 178 34,105 70,795
79,439 67,963 11,476 87 5,274 74,07834,086 7,070 27,016 86 19,118 14,882
70,552 57,446 13,106 154 8,702 61,696
209,641 120,013 89,628 959 53,111 155,571
38,138 17,472 20,666 351 10,880 26,907
9,309 4,427 4,882 22 2,271 7,0166,895 3,125 3,770 16 1,608 5,271
3,579 2,207 1,372 19 580 2,980
18,355 7,713 10,642 294 6,421 11,640
130,932 66,447 64,485 568 25,131 105,233
84,750 33,399 51,351 1,187 35,381 48,182
7,656 4,290 3,366 13 2,204 5,439
6,559 2,826 3,733 49 2,316 4,194
8,269 2,623 5,646 116 4,294 3,859
8,048 4,739 3,309 22 1,946 6,080
11,315 4,077 7,238 119 4,826 6,370
42,903 14,844 28,059 868 19,795 22,240
7,431 2,918 4,513 176 2,996 4,259
a. Includes American Samoa, Guam, and Virgin Islands.CONTACT: Alfreda Brooks (410) 965-9849 or [email protected].
Region and country of origin
Age
United Kingdom
Italy
Portugal
Middle East
Other
Turkey
SOURCE: Social Security Administration, Supplemental Security Record (Characteristic Extract Record format), 100 percent data.
NOTE: Foreign-born means born in an area not served by the Supplemental Security Income program.
Other or unknown areas
Former Soviet Republics
Europe
Other
Former Yugoslavia
Poland
SyriaLebanon
Asia
Other
Philippines
LaosChina
Vietnam
Africa
OtherEthiopia
Cape Verde Islands
Somalia
OtherDominican Republic
Cuba
Mexico
Puerto Rico
Other a
Other
Latin America
Category
Total
North AmericaU.S. terr itories
8/14/2019 Social Security: ssi asr06
http://slidepdf.com/reader/full/social-security-ssi-asr06 43/129
Recipients of Social
Security, SSI, or Both

8/14/2019 Social Security: ssi asr06
http://slidepdf.com/reader/full/social-security-ssi-asr06 44/129

8/14/2019 Social Security: ssi asr06
http://slidepdf.com/reader/full/social-security-ssi-asr06 45/129
Recipients of Social Security, SSI, or Both
SSI Annual Statistical Report, 2006 ♦ 37
Table 14.Persons aged 18–64 receiving benefits on the basis of disability and their total and average
monthly payments, by type of beneficiary, December 1996–2006
Total Workers Widow(er)s
Adult
children Total Workers Widow(er)s
Adult
children
7,689,664 4,122,152 a a a 2,559,750 1,007,762 a a a
7,811,748 4,250,155 a a a 2,550,105 1,011,488 a a a
8,086,259 4,440,264 a a a 2,618,615 1,027,380 a a a
8,399,309 4,703,774 a a a 2,650,586 1,044,949 a a a
8,599,465 4,850,835 -- -- -- 2,690,446 1,058,184 -- -- --
8,791,338 4,979,844 4,495,477 87,833 396,534 2,732,020 1,079,474 772,562 35,222 271,690
9,106,014 5,228,262 4,738,246 87,900 402,116 2,768,782 1,108,970 801,351 34,671 272,948
9,445,573 5,492,325 4,997,137 87,203 407,985 2,811,647 1,141,601 833,269 34,101 274,231
9,773,201 5,756,093 5,257,314 89,874 408,905 2,850,815 1,166,293 858,850 33,072 274,371
10,081,625 5,998,755 5,491,980 86,422 420,353 2,880,931 1,201,939 893,437 32,302 276,200
10,362,419 6,210,289 5,698,494 85,259 426,536 2,928,034 1,224,096 915,832 31,443 276,821
4,878 3,072 -- -- -- 1,222 584 -- -- --
5,106 3,245 -- -- -- 1,257 604 -- -- --
5,379 3,444 -- -- -- 1,313 622 -- -- --
5,680 3,691 -- -- -- 1,346 643 -- -- --
6,058 3,975 -- -- -- 1,408 675 -- -- --
6,509 4,299 3,976 65 258 1,491 719 530 22 167
6,920 4,629 4,294 67 268 1,544 747 554 22 171
7,416 5,024 4,674 69 281 1,603 790 592 22 176
7,980 5,464 5,096 72 296 1,686 829 626 22 180
8,604 5,974 5,584 75 315 1,724 906 696 22 187
9,172 6,439 6,029 77 334 1,778 955 739 23 193
624.80 744.60 -- -- -- 456.00 546.90 -- -- --
637.80 762.80 -- -- -- 458.10 557.10 -- -- --
649.90 775.00 -- -- -- 467.90 564.30 -- -- --
662.50 784.10 -- -- -- 477.60 576.70 -- -- --
689.30 818.80 -- -- -- 489.00 594.90 -- -- --
722.84 862.60 883.70 744.80 650.00 506.80 615.20 618.40 595.10 608.70
744.40 884.60 905.40 764.40 666.00 522.50 625.20 626.90 608.30 622.20
768.50 914.10 934.80 790.80 687.30 533.50 638.20 639.90 620.90 635.10
796.80 947.80 967.80 804.80 722.50 545.90 655.20 657.10 639.10 651.40
832.80 993.69 1,014.52 863.06 748.08 558.21 675.91 677.65 659.92 672.32
867.90 1,036.50 1,057.60 900.00 781.70 578.30 697.40 699.20 680.70 693.20
a.
-- = not available.
SOURCES: Social Security Administration, Disabled Beneficiaries and Dependents Master Beneficiary Record file and the Supplemental
Security Record (Characteristic Extract Record format), 100 percent data.
NOTES: Social Security counts include disabled workers , disabled widow(er)s, and disabled adult children. SSI counts include recipients
of federal SSI, federally administered state supplementation, or both.
Averages are not obtained simply by dividing the total dollars by the number of recipients. Averages exclude payments made in the
current month for prior-month eligibility, such as back pay for new awards, so that large retroactive payments do not distort the
averages.
2001
2002
SSI only
2001
2004
1997
1998
1999
2005
Total payments (millions of dollars)
CONTACT: Art Kahn (410) 965-0186 or [email protected].
2000
1999
1998
1997
1996
2005
2000
1996
2002
Total
Social Security only
Year
2003
Number
Both Social Security and SSI
2006
2003
2004
1999
2004
2003
2006
2006
Average monthly payment a (dollars)
1996
1997
1998
2005
2000
2001
2002
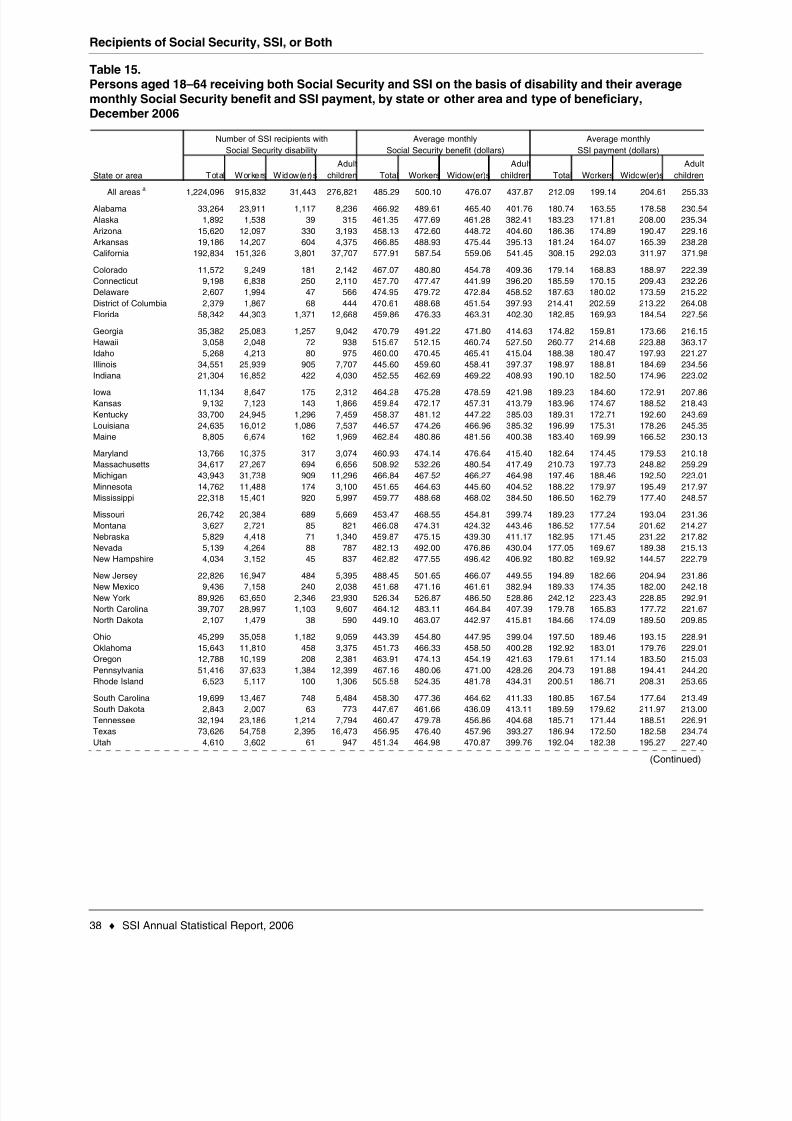
8/14/2019 Social Security: ssi asr06
http://slidepdf.com/reader/full/social-security-ssi-asr06 46/129
Recipients of Social Security, SSI, or Both
38 ♦ SSI Annual Statistical Report, 2006
Table 15.Persons aged 18–64 receiving both Social Security and SSI on the basis of disability and their average
monthly Social Security benefit and SSI payment, by state or other area and type of beneficiary,December 2006
(Continued)
Total Workers Widow(er)s
Adult
children Total Workers Widow(er)s
Adult
children Total Workers Widow(er)s
Adult
children
All areasa
1,224,096 915,832 31,443 276,821 485.29 500.10 476.07 437.87 212.09 199.14 204.61 255.33
33,264 23,911 1,117 8,236 466.92 489.61 465.40 401.76 180.74 163.55 178.58 230.54
1,892 1,538 39 315 461.35 477.69 461.28 382.41 183.23 171.81 208.00 235.34
15,620 12,097 330 3,193 458.13 472.60 448.72 404.60 186.36 174.89 190.47 229.16
19,186 14,207 604 4,375 466.85 488.93 475.44 395.13 181.24 164.07 165.39 238.28
192,834 151,326 3,801 37,707 577.91 587.54 559.06 541.45 308.15 292.03 311.97 371.98
11,572 9,249 181 2,142 467.07 480.80 454.78 409.36 179.14 168.83 188.97 222.39
9,198 6,838 250 2,110 457.70 477.47 441.99 396.20 185.59 170.15 209.43 232.26
2,607 1,994 47 566 474.95 479.72 472.84 458.52 187.63 180.02 173.59 215.22
2,379 1,867 68 444 470.61 488.68 451.54 397.93 214.41 202.59 213.22 264.08
58,342 44,303 1,371 12,668 459.86 476.33 463.31 402.30 182.85 169.93 184.54 227.56
35,382 25,083 1,257 9,042 470.79 491.22 471.80 414.63 174.82 159.81 173.66 216.15
3,058 2,048 72 938 515.67 512.15 460.74 527.50 260.77 214.68 223.88 363.17
5,268 4,213 80 975 460.00 470.45 465.41 415.04 188.38 180.47 197.93 221.27
34,551 25,939 905 7,707 445.60 459.60 458.41 397.37 198.97 188.81 184.69 234.56
21,304 16,852 422 4,030 452.55 462.69 469.22 408.93 190.10 182.50 174.96 223.02
11,134 8,647 175 2,312 464.28 475.28 478.59 421.98 189.23 184.60 172.91 207.86
9,132 7,123 143 1,866 459.84 472.17 457.31 413.79 183.96 174.67 188.52 218.43
33,700 24,945 1,296 7,459 458.37 481.12 447.22 385.03 189.31 172.71 192.60 243.69
24,635 16,012 1,086 7,537 446.57 474.26 466.96 385.32 196.99 175.31 178.26 245.35
8,805 6,674 162 1,969 462.84 480.86 481.56 400.38 183.40 169.99 166.52 230.13
13,766 10,375 317 3,074 460.93 474.14 476.64 415.40 182.64 174.45 179.53 210.18
34,617 27,267 694 6,656 508.92 532.26 480.54 417.49 210.73 197.73 248.82 259.29
43,943 31,738 909 11,296 466.84 467.52 466.27 464.98 197.46 188.46 192.50 223.01
14,762 11,488 174 3,100 451.65 464.63 445.60 404.52 188.22 179.97 195.49 217.97
22,318 15,401 920 5,997 459.77 488.68 468.02 384.50 186.50 162.79 177.40 248.57
26,742 20,384 689 5,669 453.47 468.55 454.81 399.74 189.23 177.24 193.04 231.36
3,627 2,721 85 821 466.08 474.31 424.32 443.46 186.52 177.54 201.62 214.27
5,829 4,418 71 1,340 459.87 475.15 439.30 411.17 182.95 171.45 231.22 217.82
5,139 4,264 88 787 482.13 492.00 476.86 430.04 177.05 169.67 189.38 215.13
4,034 3,152 45 837 462.82 477.55 496.42 406.92 180.82 169.92 144.57 222.79
22,826 16,947 484 5,395 488.45 501.65 466.07 449.55 194.89 182.66 204.94 231.86
9,436 7,158 240 2,038 451.68 471.16 461.61 382.94 189.33 174.35 182.00 242.18
89,926 63,650 2,346 23,930 526.34 526.87 486.50 528.86 242.12 223.43 228.85 292.91
39,707 28,997 1,103 9,607 464.12 483.11 464.84 407.39 179.78 165.83 177.72 221.67
2,107 1,479 38 590 449.10 463.07 442.97 415.81 184.66 174.09 189.50 209.85
45,299 35,058 1,182 9,059 443.39 454.80 447.95 399.04 197.50 189.46 193.15 228.91
15,643 11,810 458 3,375 451.73 466.33 458.50 400.28 192.92 183.01 179.76 229.01
12,788 10,199 208 2,381 463.91 474.13 454.19 421.63 179.61 171.14 183.50 215.03
51,416 37,633 1,384 12,399 467.16 480.06 471.00 428.26 204.73 191.88 194.41 244.20
6,523 5,117 100 1,306 505.58 524.35 481.78 434.31 200.51 186.71 208.31 253.65
19,699 13,467 748 5,484 458.30 477.36 464.62 411.33 180.85 167.54 177.64 213.49
2,843 2,007 63 773 447.67 461.66 436.09 413.11 189.59 179.62 211.97 213.00
32,194 23,186 1,214 7,794 460.47 479.78 456.86 404.68 185.71 171.44 188.51 226.91
73,626 54,758 2,395 16,473 456.95 476.40 457.96 393.27 186.94 172.50 182.58 234.74
4,610 3,602 61 947 451.34 464.98 470.87 399.76 192.04 182.38 195.27 227.40
State or area
Alaska
Alabama
Number of SSI recipients with
Social Security disability
Average monthly
Social Security benefit (dollars)
Average monthly
SSI payment (dollars)
Indiana
Illinois
Idaho
Hawaii
Arkansas
Arizona
Georgia
Florida
District of Columbia
Delaware
Connecticut
Colorado
California
Kentucky
Mississippi
Minnesota
Michigan
Massachusetts
Kansas
Iowa
New Hampshire
Nevada
Nebraska
Montana
Missouri
Maryland
Maine
Louisiana
New Mexico
New Jersey
Oregon
Oklahoma
Ohio
North Dakota
North Carolina
New York
Tennessee
Texas
Pennsylvania
South Dakota
South Carolina
Utah
Rhode Island

8/14/2019 Social Security: ssi asr06
http://slidepdf.com/reader/full/social-security-ssi-asr06 47/129
Recipients of Social Security, SSI, or Both
SSI Annual Statistical Report, 2006 ♦ 39
Table 15.Persons aged 18–64 receiving both Social Security and SSI on the basis of disability and their average
monthly Social Security benefit and SSI payment, by state or other area and type of beneficiary,December 2006—Continued
Total Workers Widow(er)s
Adult
children Total Workers Widow(er)s
Adult
children Total Workers Widow(er)s
Adult
children
3,819 2,825 68 926 502.44 512.13 512.35 472.38 200.72 191.50 165.93 231.22
25,331 18,254 732 6,345 458.74 478.22 468.21 402.52 184.86 171.49 166.70 224.80
20,513 16,504 338 3,671 463.82 474.57 472.34 415.25 182.13 173.61 177.22 220.47
14,451 9,970 542 3,939 452.89 477.32 458.13 390.89 192.89 175.53 183.38 237.74
20,992 15,799 300 4,893 458.23 469.42 450.19 422.83 185.31 177.70 187.34 209.60
1,430 1,157 24 249 458.73 469.79 459.61 408.13 181.31 172.87 206.57 217.54
Northern Mariana
Islands 87 b b b 359.05 b b b 271.04 b b b
a.b.
Number of SSI recipients with
Social Security disability
Average monthly
Social Security benefit (dollars)
Average monthly
SSI payment (dollars)
CONTACT: Art Kahn (410) 965-0186 or [email protected].
Washington
Wyoming
Wisconsin
West Virginia
SOURCES: Social Security Administration, Disabled Beneficiaries and Dependents Master Beneficiary Record file and the Supplemental Security Record
(Characteristic Extract Record format), 100 percent data.
Virginia
Data not shown to avoid disclosure of information for particular individuals.Includes 190 persons not distributed by state or area.
NOTE: SSI counts include recipients of federal SSI, federally administered state supplementation, or both. They do not include beneficiaries whose own Social
Security number is not on the Master Beneficiary Record. Social Security beneficiaries who are entitled to both a primary and a secondary benefit are counted only
once in this table.
Vermont
Outlying area
State or area

8/14/2019 Social Security: ssi asr06
http://slidepdf.com/reader/full/social-security-ssi-asr06 48/129
8/14/2019 Social Security: ssi asr06
http://slidepdf.com/reader/full/social-security-ssi-asr06 49/129
Noncitizens

8/14/2019 Social Security: ssi asr06
http://slidepdf.com/reader/full/social-security-ssi-asr06 50/129

8/14/2019 Social Security: ssi asr06
http://slidepdf.com/reader/full/social-security-ssi-asr06 51/129
Noncitizens
SSI Annual Statistical Report, 2006 ♦ 43
Table 16.By eligibility category, December 1982–2006
Number
Percentage of all
SSI recipients Number
Percentage of all
SSI recipients Number
Percentage of all
SSI recipients
1982 127,900 3.3 91,900 5.9 36,000 1.6
1983 151,200 3.9 106,600 7.0 44,600 1.9
1984 181,100 4.5 127,600 8.3 53,500 2.1
1985 210,800 5.1 146,500 9.7 64,300 2.4
1986 244,300 5.7 165,300 11.2 79,000 2.8
1987 282,500 6.4 188,000 12.9 94,500 3.21988 320,300 7.2 213,900 14.9 106,400 3.5
1989 370,300 8.1 245,700 17.1 124,600 4.0
1990 435,600 9.0 282,400 19.4 153,200 4.6
1991 519,660 10.2 329,690 22.5 189,970 5.2
1992 601,430 10.8 372,930 25.4 228,500 5.61993 683,150 11.4 416,420 28.2 266,730 5.9
1994 738,140 11.7 440,000 30.0 298,140 6.2
1995 785,410 12.1 459,220 31.8 326,190 6.3
1996 724,990 11.0 417,360 29.5 307,630 5.91997 650,830 10.0 367,200 27.0 283,630 5.5
1998 669,630 10.2 364,980 27.4 304,650 5.8
1999 684,930 10.4 368,330 28.2 316,600 6.0
2000 692,590 10.5 364,470 28.3 328,120 6.2
2001 695,650 10.4 364,550 28.9 331,100 6.1
2002 703,515 10.4 364,827 29.1 338,688 6.1
2003 696,772 10.1 356,298 28.9 340,474 6.0
2004 676,979 9.7 342,220 28.3 334,759 5.8
2005 680,397 9.6 344,166 28.3 336,231 5.7
2006 674,250 9.3 339,073 28.0 335,177 5.6
SOURCE: Social Security Administration, Supplemental Security Record (Characteristic Extract Record format), 100 percent data.
CONTACT: Alfreda Brooks (410) 965-9849 or [email protected].
Total Aged Blind and disabled
Year

8/14/2019 Social Security: ssi asr06
http://slidepdf.com/reader/full/social-security-ssi-asr06 52/129
Noncitizens
44 ♦ SSI Annual Statistical Report, 2006
Table 17.Distribution of recipients, by selected characteristics and citizenship status, December 2006
Number Percent Number Percent
Total 6,561,333 100.0 674,250 100.0
1,075,906 16.4 3,071 0.5804,148 12.3 13,897 2.1627,895 9.6 20,359 3.0
994,196 15.2 40,905 6.1
1,074,398 16.4 81,300 12.1
439,430 6.7 55,602 8.2
801,067 12.2 209,109 31.0
744,293 11.3 250,007 37.1
2,892,037 44.1 253,298 37.6
3,669,296 55.9 420,952 62.4
5,254,703 80.1 594,974 88.2
273,883 4.2 65,457 9.7907,774 13.8 3,081 0.5
124,973 1.9 10,738 1.6
2,322,626 35.4 206,349 30.6
1,607,321 24.5 153,572 22.8
715,305 10.9 52,777 7.8
265,789 4.1 9,463 1.4
4,684,235 71.4 282,769 41.9
260,338 4.0 36,555 5.4
1,616,760 24.6 354,926 52.6
Earnings
SSI payment
Both federal SSI and state
supplementation
State supplementation only
Federal SSI only
Income
Social Security
Auxiliary beneficiary
Worker beneficiary
Living arrangement
Medicaid institution
Parent's householdAnother's household
Own household
18–29Under 18
Sex
Female
Male
Characteristic
Age
SOURCE: Social Security Administration, Supplemental Security Record (Characteristic Extract Record format), 100 percent data.
CONTACT: Alfreda Brooks (410) 965-9849 or [email protected].
Citizens Noncitizens
75 or older
65–74
60–64
50–59
40–49
30–39

8/14/2019 Social Security: ssi asr06
http://slidepdf.com/reader/full/social-security-ssi-asr06 53/129
Noncitizens
SSI Annual Statistical Report, 2006 ♦ 45
Table 18.By state or other area, eligibility category, and age, December 2006
(Continued)
Aged
Blind and
disabled Under 18 18–64 65 or older
All areas 674,250 339,073 335,177 3,071 212,063 459,116
766 418 348 5 214 547832 327 505 10 341 481
9,898 4,571 5,327 44 3,442 6,412
684 325 359 a a 431
249,284 123,087 126,197 567 78,226 170,491
4,807 2,463 2,344 28 1,449 3,330
4,087 2,059 2,028 13 1,230 2,844
366 247 119 0 69 297
695 325 370 5 263 427
72,166 40,306 31,860 545 21,010 50,611
6,197 3,701 2,496 46 1,451 4,700
2,981 1,981 1,000 7 627 2,347
886 388 498 15 338 533
17,915 9,382 8,533 67 4,841 13,0071,202 647 555 13 345 844
1,051 407 644 6 392 653
1,367 613 754 a a 901
1,190 594 596 24 417 749
1,962 985 977 a a 1,351
611 157 454 17 306 288
6,276 4,177 2,099 33 1,181 5,062
19,847 11,480 8,367 58 7,742 12,047
8,388 3,487 4,901 103 2,896 5,389
8,628 3,070 5,558 171 3,928 4,529
376 174 202 a a 255
2,245 1,032 1,213 36 771 1,438
127 36 91 a a 67897 370 527 14 348 535
3,955 2,766 1,189 14 1,042 2,899
449 191 258 a a 269
20,064 11,468 8,596 105 5,189 14,770
4,960 2,187 2,773 13 1,719 3,228
96,866 47,498 51,368 396 32,211 64,259
3,586 1,836 1,750 30 1,041 2,515
159 47 112 10 77 72
4,377 2,241 2,136 53 1,229 3,095
1,510 846 664 15 410 1,085
4,502 2,205 2,297 36 1,334 3,132
11,375 4,640 6,735 88 4,182 7,105
3,645 1,316 2,329 22 1,563 2,060
887 463 424 5 260 622
190 64 126 6 84 100
1,658 855 803 25 503 1,130
65,052 34,012 31,040 177 19,574 45,301
1,479 701 778 20 476 983
Florida
District of Columbia
Idaho
Maine
Louisiana
Kentucky
Kansas
Michigan
Iowa
Delaware
Connecticut
Colorado
California
Arkansas
Arizona
AlaskaAlabama
State or area
AgeCategory
Total
IndianaIllinois
Massachusetts
Maryland
New York
Hawaii
Georgia
New Hampshire
Nevada
NebraskaMontana
Missouri
Mississippi
Minnesota
Rhode Island
Pennsylvania
OregonOklahoma
New Jersey
Utah
Texas
Tennessee
South Dakota
South Carolina
Ohio
North Dakota
North Carolina
New Mexico
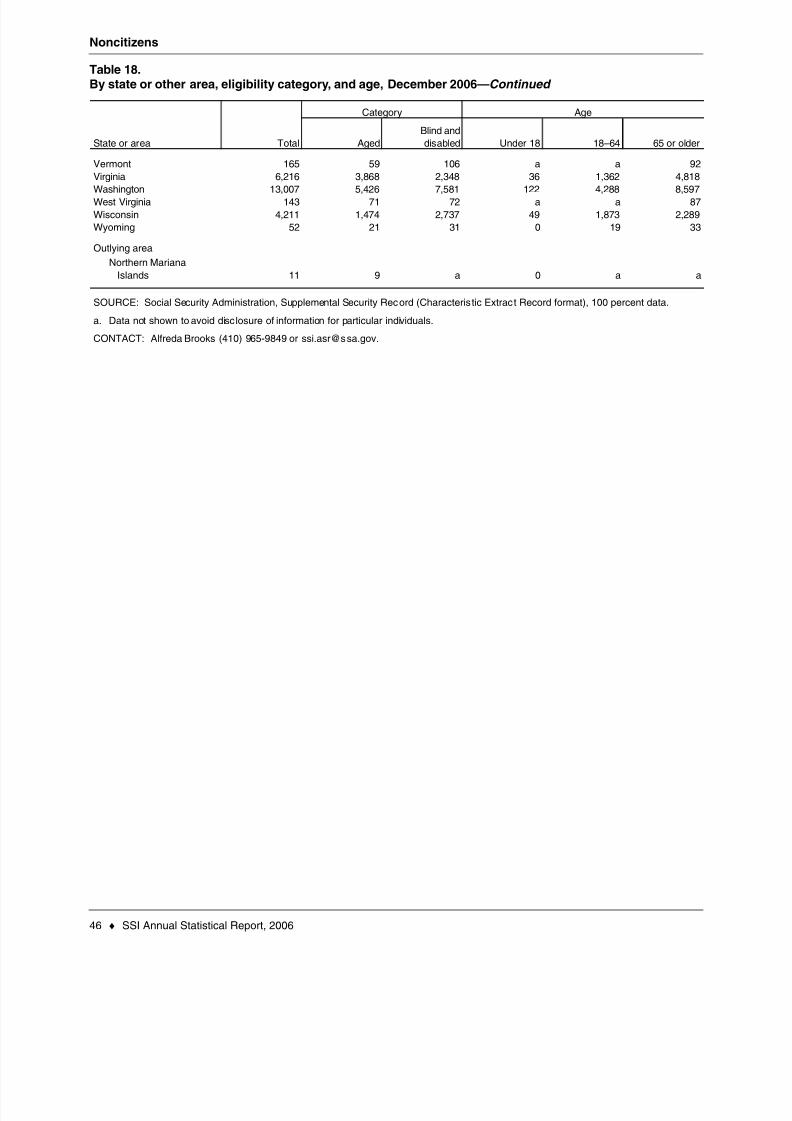
8/14/2019 Social Security: ssi asr06
http://slidepdf.com/reader/full/social-security-ssi-asr06 54/129

8/14/2019 Social Security: ssi asr06
http://slidepdf.com/reader/full/social-security-ssi-asr06 55/129
Noncitizens
SSI Annual Statistical Report, 2006 ♦ 47
Table 19.By region and country of origin, eligibility category, and age, December 2006
Aged
Blind and
disabled Under 18 18–64 65 or older
All areas 674,250 339,073 335,177 3,071 212,063 459,116
354,604 178,025 176,579 1,360 118,854 234,390175,771 89,041 86,730 346 56,703 118,722
53,680 28,271 25,409 366 16,762 36,552
43,149 15,705 27,444 331 19,765 23,053
82,004 45,008 36,996 317 25,624 56,063
13,430 5,758 7,672 423 5,797 7,210
4,128 1,779 2,349 139 1,787 2,202
891 568 323 3 261 627
1,937 698 1,239 24 968 945
6,474 2,713 3,761 257 2,781 3,436
201,149 104,933 96,216 691 57,901 142,557
41,661 16,384 25,277 84 14,860 26,717
28,792 23,998 4,794 16 2,074 26,702
21,796 4,598 17,198 75 12,171 9,55018,012 13,449 4,563 40 3,037 14,935
90,888 46,504 44,384 476 25,759 64,653
11,849 5,612 6,237 82 2,988 8,779
2,808 1,366 1,442 4 606 2,198
2,163 998 1,165 10 497 1,6561,241 812 429 6 159 1,076
5,637 2,436 3,201 62 1,726 3,849
50,691 26,315 24,376 302 11,009 39,380
30,390 13,588 16,802 154 10,902 19,334
3,932 2,250 1,682 4 1,149 2,779
5,898 2,165 3,733 72 2,475 3,351
3,136 1,159 1,977 19 1,419 1,698
3,102 1,716 1,386 6 895 2,20114,322 6,298 8,024 53 4,964 9,305
6,281 2,257 4,024 24 2,855 3,402
5,856 2,585 3,271 35 1,757 4,064
TotalRegion and country of origin
Age
Somalia
Latin America
Other
Dominican Republic
Cuba
Mexico
Category
SOURCE: Social Security Administration, Supplemental Security Record (Characteristic Extract Record format), 100 percent data.
CONTACT: Alfreda Brooks (410) 965-9849 or [email protected].
Asia
Other
PhilippinesLaos
China
Vietnam
Middle East
Other areas
Other
TurkeySyria
Lebanon
Africa
Other
Ethiopia
Cape Verde Islands
Unknown
Former Soviet Republics
Europe
OtherPoland
Great Britain
Former Yugoslavia
Portugal
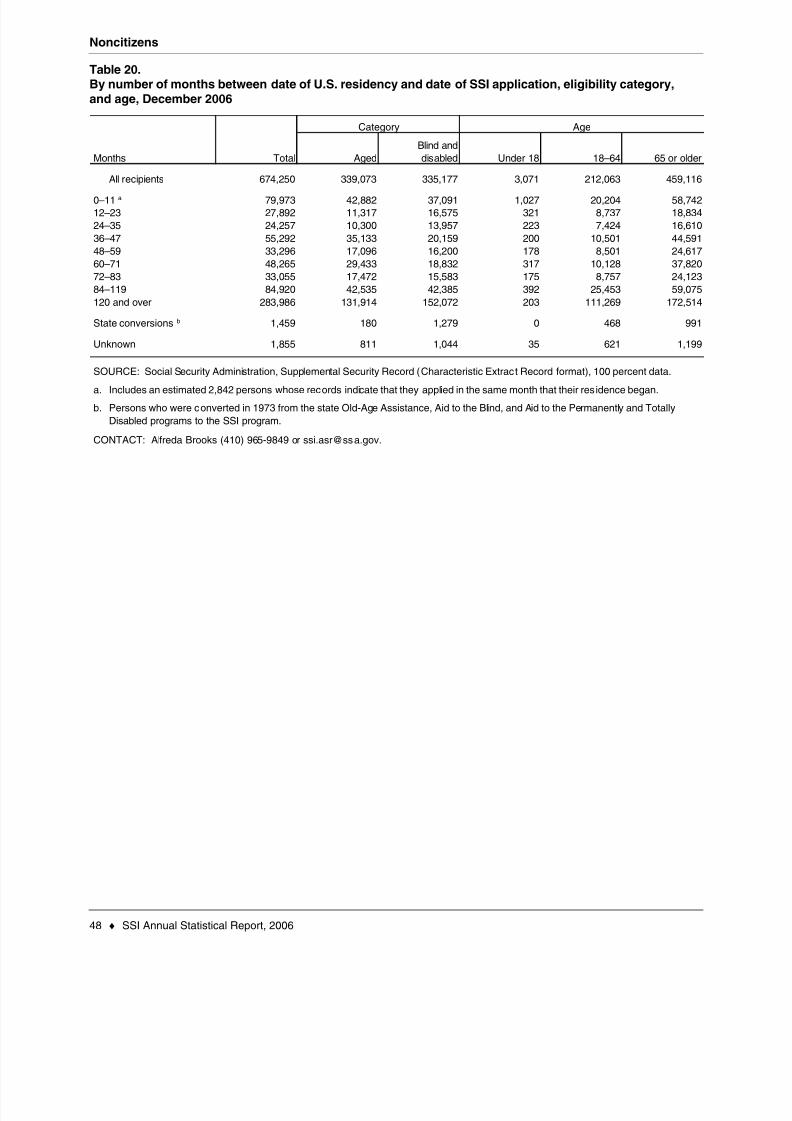
8/14/2019 Social Security: ssi asr06
http://slidepdf.com/reader/full/social-security-ssi-asr06 56/129
Noncitizens
48 ♦ SSI Annual Statistical Report, 2006
Table 20.By number of months between date of U.S. residency and date of SSI application, eligibility category,
and age, December 2006
Aged
Blind and
disabled Under 18 18–64 65 or older
All recipients 674,250 339,073 335,177 3,071 212,063 459,116
79,973 42,882 37,091 1,027 20,204 58,74227,892 11,317 16,575 321 8,737 18,834
24,257 10,300 13,957 223 7,424 16,610
55,292 35,133 20,159 200 10,501 44,591
33,296 17,096 16,200 178 8,501 24,617
48,265 29,433 18,832 317 10,128 37,820
33,055 17,472 15,583 175 8,757 24,123
84,920 42,535 42,385 392 25,453 59,075
283,986 131,914 152,072 203 111,269 172,514
1,459 180 1,279 0 468 991
1,855 811 1,044 35 621 1,199
a.
b. Persons who were converted in 1973 from the state Old-Age Assistance, Aid to the Blind, and Aid to the Permanently and Totally
Disabled programs to the SSI program.
60–71
48–59
CONTACT: Alfreda Brooks (410) 965-9849 or [email protected].
84–119
72–83
Unknown
Includes an estimated 2,842 persons whose records indicate that they applied in the same month that their residence began.
0–11 a
State conversions b
120 and over
Category
Total
SOURCE: Social Security Administration, Supplemental Security Record (Characteristic Extract Record format), 100 percent data.
Months
Age
36–47
24–35
12–23

8/14/2019 Social Security: ssi asr06
http://slidepdf.com/reader/full/social-security-ssi-asr06 57/129
Recipients Under Age 65

8/14/2019 Social Security: ssi asr06
http://slidepdf.com/reader/full/social-security-ssi-asr06 58/129
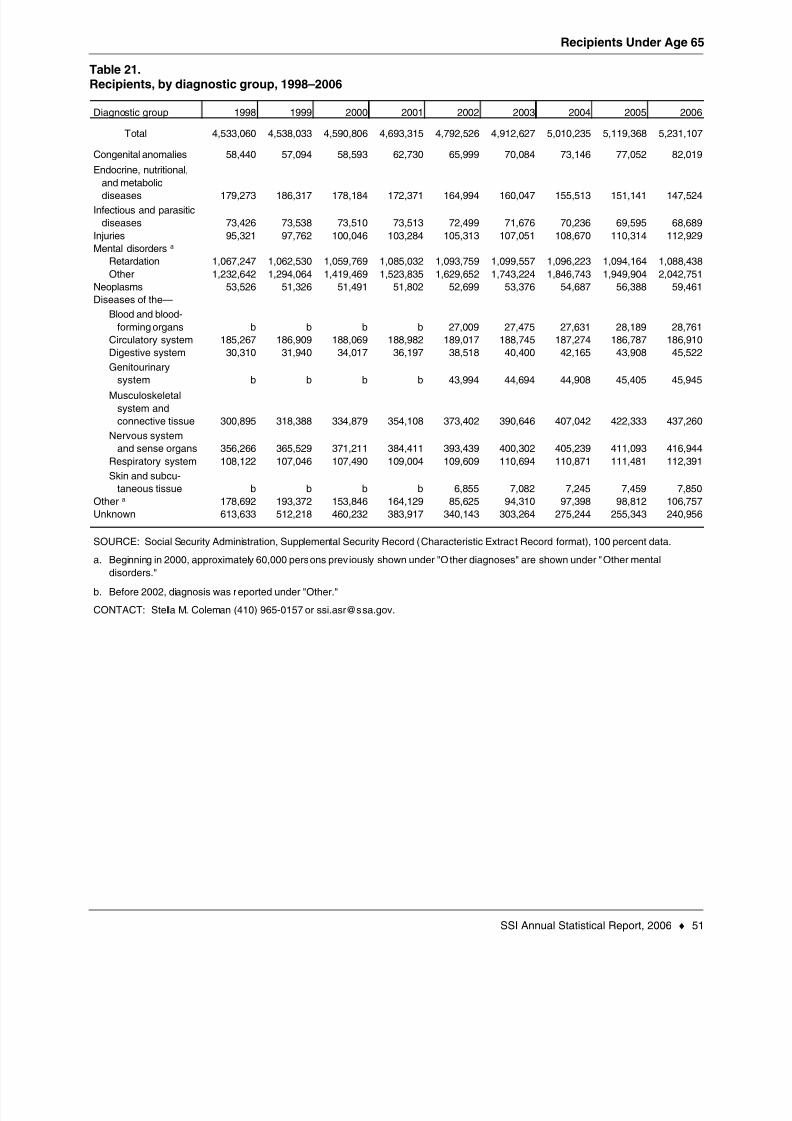
8/14/2019 Social Security: ssi asr06
http://slidepdf.com/reader/full/social-security-ssi-asr06 59/129
Recipients Under Age 65
SSI Annual Statistical Report, 2006 ♦ 51
Table 21.Recipients, by diagnostic group, 1998–2006
1998 1999 2000 2001 2002 2003 2004 2005 2006
Total 4,533,060 4,538,033 4,590,806 4,693,315 4,792,526 4,912,627 5,010,235 5,119,368 5,231,107
58,440 57,094 58,593 62,730 65,999 70,084 73,146 77,052 82,019
179,273 186,317 178,184 172,371 164,994 160,047 155,513 151,141 147,524
73,426 73,538 73,510 73,513 72,499 71,676 70,236 69,595 68,689
95,321 97,762 100,046 103,284 105,313 107,051 108,670 110,314 112,929
1,067,247 1,062,530 1,059,769 1,085,032 1,093,759 1,099,557 1,096,223 1,094,164 1,088,438
1,232,642 1,294,064 1,419,469 1,523,835 1,629,652 1,743,224 1,846,743 1,949,904 2,042,751
53,526 51,326 51,491 51,802 52,699 53,376 54,687 56,388 59,461
b b b b 27,009 27,475 27,631 28,189 28,761
185,267 186,909 188,069 188,982 189,017 188,745 187,274 186,787 186,910
30,310 31,940 34,017 36,197 38,518 40,400 42,165 43,908 45,522
b b b b 43,994 44,694 44,908 45,405 45,945
300,895 318,388 334,879 354,108 373,402 390,646 407,042 422,333 437,260
356,266 365,529 371,211 384,411 393,439 400,302 405,239 411,093 416,944
108,122 107,046 107,490 109,004 109,609 110,694 110,871 111,481 112,391
b b b b 6,855 7,082 7,245 7,459 7,850
178,692 193,372 153,846 164,129 85,625 94,310 97,398 98,812 106,757
613,633 512,218 460,232 383,917 340,143 303,264 275,244 255,343 240,956
a.
b.
Diagnostic group
Endocrine, nutritional,
and metabolicdiseases
Congenital anomalies
Injuries
Infectious and parasitic
diseases
Mental disorders a
Other
Retardation
Diseases of the—
Neoplasms
Skin and subcu-
taneous tissue
Respiratory system
Nervous system
and sense organs
Musculoskeletal
system and
connective tissue
Genitourinarysystem
Digestive system
Circulatory system
Blood and blood-
forming organs
Before 2002, diagnosis was reported under "Other."
CONTACT: Stella M. Coleman (410) 965-0157 or [email protected].
Unknown
Other a
SOURCE: Social Security Administration, Supplemental Security Record (Characteristic Extract Record format), 100 percent data.
Beginning in 2000, approximately 60,000 persons previously shown under "Other diagnoses" are shown under "Other mentaldisorders."
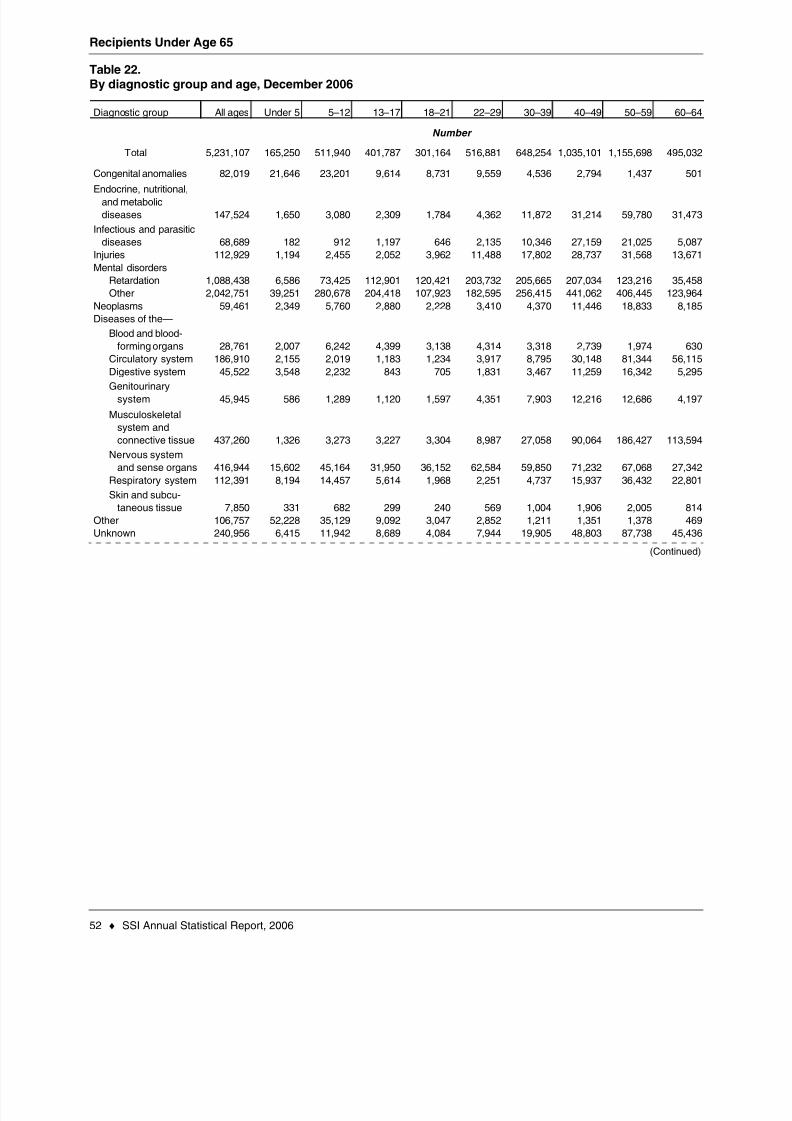
8/14/2019 Social Security: ssi asr06
http://slidepdf.com/reader/full/social-security-ssi-asr06 60/129
Recipients Under Age 65
52 ♦ SSI Annual Statistical Report, 2006
Table 22.By diagnostic group and age, December 2006
(Continued)
All ages Under 5 5–12 13–17 18–21 22–29 30–39 40–49 50–59 60–64
Total 5,231,107 165,250 511,940 401,787 301,164 516,881 648,254 1,035,101 1,155,698 495,032
82,019 21,646 23,201 9,614 8,731 9,559 4,536 2,794 1,437 501
147,524 1,650 3,080 2,309 1,784 4,362 11,872 31,214 59,780 31,473
68,689 182 912 1,197 646 2,135 10,346 27,159 21,025 5,087
112,929 1,194 2,455 2,052 3,962 11,488 17,802 28,737 31,568 13,671
1,088,438 6,586 73,425 112,901 120,421 203,732 205,665 207,034 123,216 35,458
2,042,751 39,251 280,678 204,418 107,923 182,595 256,415 441,062 406,445 123,964
59,461 2,349 5,760 2,880 2,228 3,410 4,370 11,446 18,833 8,185
28,761 2,007 6,242 4,399 3,138 4,314 3,318 2,739 1,974 630
186,910 2,155 2,019 1,183 1,234 3,917 8,795 30,148 81,344 56,115
45,522 3,548 2,232 843 705 1,831 3,467 11,259 16,342 5,295
45,945 586 1,289 1,120 1,597 4,351 7,903 12,216 12,686 4,197
437,260 1,326 3,273 3,227 3,304 8,987 27,058 90,064 186,427 113,594
416,944 15,602 45,164 31,950 36,152 62,584 59,850 71,232 67,068 27,342
112,391 8,194 14,457 5,614 1,968 2,251 4,737 15,937 36,432 22,801
7,850 331 682 299 240 569 1,004 1,906 2,005 814
106,757 52,228 35,129 9,092 3,047 2,852 1,211 1,351 1,378 469
240,956 6,415 11,942 8,689 4,084 7,944 19,905 48,803 87,738 45,436
Skin and subcu-
taneous tissue
Other
Unknown
Diagnostic group
Mental disorders
Injuries
Infectious and parasitic
diseases
Endocrine, nutritional,and metabolic
diseases
Number
Congenital anomalies
Retardation
Diseases of the—
Neoplasms
Digestive system
Musculoskeletal
system and
connective tissue
Respiratory system
Nervous system
and sense organs
Other
Circulatory system
Blood and blood-
forming organs
Genitourinary
system

8/14/2019 Social Security: ssi asr06
http://slidepdf.com/reader/full/social-security-ssi-asr06 61/129
Recipients Under Age 65
SSI Annual Statistical Report, 2006 ♦ 53
Table 22.By diagnostic group and age, December 2006—Continued
All ages Under 5 5–12 13–17 18–21 22–29 30–39 40–49 50–59 60–64
Total 485.35 522.27 549.07 540.66 542.11 500.67 462.59 459.38 471.07 429.05
525.14 538.24 548.98 535.20 536.77 515.51 457.15 384.12 409.23 385.71
454.94 531.71 539.05 521.01 527.04 462.22 450.80 463.67 462.47 411.53
475.45 551.67 535.78 508.79 527.02 481.14 465.11 472.69 488.43 427.14
447.46 530.17 527.22 514.22 500.24 460.51 432.20 431.94 457.35 419.43
483.15 560.01 554.71 544.75 543.40 510.88 460.69 432.59 422.81 396.23
503.21 545.54 548.60 542.35 548.35 494.50 470.07 481.53 496.42 463.83
459.32 522.58 534.26 523.32 504.40 454.34 438.07 447.07 452.70 397.75
510.89 549.00 549.35 537.60 538.67 498.72 467.22 452.85 460.08 409.24
443.58 533.65 539.33 522.11 523.31 462.30 436.94 446.31 459.58 408.52
474.80 527.71 551.59 526.67 523.10 428.73 429.71 467.53 481.63 431.96
455.94 526.96 550.95 525.03 516.48 457.20 438.48 452.90 456.76 413.51
440.29 541.41 544.00 530.30 540.30 467.81 424.09 430.98 457.02 412.34
477.01 537.84 541.98 529.10 531.01 503.84 451.49 430.49 438.59 412.68
481.25 555.19 560.68 543.46 554.80 492.66 467.25 475.06 469.04 408.01
468.41 558.33 553.57 548.00 521.61 459.12 442.80 447.05 457.82 428.87
513.39 484.56 553.71 538.68 547.84 522.85 465.71 440.26 457.15 399.20
498.55 484.65 541.70 529.03 534.04 534.61 536.35 484.60 499.72 470.11
SOURCE: Social Security Administration, Supplemental Security Record (Characteristic Extract Record format), 100 percent data.
CONTACT: Stella M. Coleman (410) 965-0157 or [email protected].
Mental disorders
Retardation
Other
Nervous system
and sense organs
Respiratory system
Skin and subcu-
taneous tissue
Circulatory system
Digestive system
Average monthly payment (dollars)
Infectious and parasitic
diseases
Injuries
Congenital anomalies
Endocrine, nutritional,and metabolic
diseases
Diagnostic group
Other
Unknown
Musculoskeletal
system and
connective tissue
Neoplasms
Diseases of the—
Blood and blood-
forming organs
Genitourinary
system

8/14/2019 Social Security: ssi asr06
http://slidepdf.com/reader/full/social-security-ssi-asr06 62/129
Recipients Under Age 65
54 ♦ SSI Annual Statistical Report, 2006
Table 23.By diagnostic group, age, and sex, December 2006
Total Male Female Total Male Female Total Male Female
Total 5,231,107 100.0 48.3 51.7 1,078,977 100.0 65.6 34.4 4,152,130 100.0 43.8 56.2
82,019 100.0 52.2 47.8 54,461 100.0 53.7 46.3 27,558 100.0 49.1 50.9
147,524 100.0 25.7 74.3 7,039 100.0 51.7 48.3 140,485 100.0 24.4 75.6
68,689 100.0 57.2 42.8 2,291 100.0 50.0 50.0 66,398 100.0 57.5 42.5
112,929 100.0 61.0 39.0 5,701 100.0 59.0 41.0 107,228 100.0 61.1 38.9
1,088,438 100.0 51.7 48.3 192,912 100.0 61.8 38.2 895,526 100.0 49.5 50.5
2,042,751 100.0 50.7 49.3 524,347 100.0 73.4 26.6 1,518,404 100.0 42.8 57.259,461 100.0 43.3 56.7 10,989 100.0 55.3 44.7 48,472 100.0 40.6 59.4
28,761 100.0 48.4 51.6 12,648 100.0 56.7 43.3 16,113 100.0 42.0 58.0
186,910 100.0 47.1 52.9 5,357 100.0 54.6 45.4 181,553 100.0 46.9 53.145,522 100.0 48.0 52.0 6,623 100.0 54.6 45.4 38,899 100.0 46.9 53.1
45,945 100.0 49.4 50.6 2,995 100.0 59.2 40.8 42,950 100.0 48.7 51.3
437,260 100.0 34.6 65.4 7,826 100.0 48.8 51.2 429,434 100.0 34.3 65.7
416,944 100.0 47.8 52.2 92,716 100.0 55.9 44.1 324,228 100.0 45.4 54.6
112,391 100.0 41.1 58.9 28,265 100.0 64.4 35.6 84,126 100.0 33.2 66.8
7,850 100.0 36.7 63.3 1,312 100.0 51.4 48.6 6,538 100.0 33.7 66.3
106,757 100.0 54.9 45.1 96,449 100.0 55.2 44.8 10,308 100.0 51.9 48.1
240,956 100.0 45.4 54.6 27,046 100.0 60.4 39.6 213,910 100.0 43.5 56.5
Mental disorders
Injuries
Infectious and parasitic
diseases
Endocrine, nutritional,
and metabolic
diseases
Congenital anomalies
Diagnostic group Number
All ages
Other
Retardation
Diseases of the—
Neoplasms
SOURCE: Social Security Administration, Supplemental Security Record (Characteristic Extract Record format), 100 percent data.
Genitourinary
system
Digestive system
Unknown
Other
Skin and subcu-
taneous tissue
Respiratory system
Nervous system
and sense organs
Musculoskeletal
system and
connective tissue
Under age 18 Aged 18–64
CONTACT: Stella M. Coleman (410) 965-0157 or [email protected].
Circulatory system
Blood and blood-
forming organs
Number Number
Percent Percent Percent

8/14/2019 Social Security: ssi asr06
http://slidepdf.com/reader/full/social-security-ssi-asr06 63/129
Recipients Under Age 65
SSI Annual Statistical Report, 2006 ♦ 55
Table 24.Recipients with a representative payee, by diagnostic group and age, December 2006
Total
Number
with payee
Percentage
with payee Total
Number
with payee
Percentage
with payee Total
Number
with payee
Percentage
with payee
Total 5,231,107 2,494,592 47.7 1,078,977 1,078,161 99.9 4,152,130 1,416,431 34.1
82,019 71,416 87.1 54,461 54,432 99.9 27,558 16,984 61.6
147,524 12,664 8.6 7,039 7,032 99.9 140,485 5,632 4.0
68,689 8,406 12.2 2,291 2,288 99.9 66,398 6,118 9.2
112,929 22,742 20.1 5,701 5,689 99.8 107,228 17,053 15.9
1,088,438 789,172 72.5 192,912 192,746 99.9 895,526 596,426 66.6
2,042,751 1,076,935 52.7 524,347 523,920 99.9 1,518,404 553,015 36.4
59,461 14,383 24.2 10,989 10,976 99.9 48,472 3,407 7.0
28,761 15,639 54.4 12,648 12,639 99.9 16,113 3,000 18.6
186,910 20,803 11.1 5,357 5,354 99.9 181,553 15,449 8.5
45,522 9,573 21.0 6,623 6,621 100.0 38,899 2,952 7.6
45,945 5,172 11.3 2,995 2,991 99.9 42,950 2,181 5.1
437,260 21,892 5.0 7,826 7,816 99.9 429,434 14,076 3.3
416,944 183,814 44.1 92,716 92,646 99.9 324,228 91,168 28.1
112,391 32,604 29.0 28,265 28,254 100.0 84,126 4,350 5.2
7,850 1,668 21.2 1,312 1,312 100.0 6,538 356 5.4
106,757 101,596 95.2 96,449 96,417 100.0 10,308 5,179 50.2
240,956 106,113 44.0 27,046 27,028 99.9 213,910 79,085 37.0
CONTACT: Stella M. Coleman (410) 965-0157 or [email protected].
Circulatory system
SOURCE: Social Security Administration, Supplemental Security Record (Characteristic Extract Record format), 100 percent data.
Genitourinary system
Digestive system
Unknown
Other
Skin and subcutaneous
tissue
Respiratory system
Nervous system andsense organs
Retardation
Diseases of the—
Neoplasms
Aged 18–64All ages Under age 18
Congenital anomalies
Musculoskeletal system
and connective tissue
Other
Blood and blood-forming
organs
Mental disorders
Injuries
Infectious and parasitic
diseases
Endocrine, nutritional, and
metabolic diseases
Diagnostic group

8/14/2019 Social Security: ssi asr06
http://slidepdf.com/reader/full/social-security-ssi-asr06 64/129
Recipients Under Age 65
56 ♦ SSI Annual Statistical Report, 2006
Table 25.Percentage distribution, by state or other area and diagnostic group, December 2006
(Continued)
Number Percent Total Retardation Other
All areas 5,231,107 100.0 1.6 2.8 1.3 2.2 59.9 20.8 39.1 1.1
130,908 100.0 1.2 3.3 0.8 2.5 55.0 25.6 29.4 1.1
8,282 100.0 1.7 2.4 1.0 3.0 55.7 14.1 41.7 1.4
75,585 100.0 2.3 2.5 0.6 2.3 61.5 18.3 43.1 1.0
74,479 100.0 1.5 3.3 0.6 2.4 59.2 29.5 29.7 1.2
695,447 100.0 1.7 2.5 1.5 2.7 56.3 14.3 42.1 1.3
42,718 100.0 2.4 2.5 1.0 2.9 53.7 18.0 35.8 1.3
40,631 100.0 1.2 2.7 2.4 1.8 61.6 16.5 45.1 1.0
11,605 100.0 1.6 2.7 1.9 1.7 60.9 22.4 38.5 1.1
17,489 100.0 0.6 2.1 3.4 2.0 63.9 21.1 42.8 0.9
283,785 100.0 1.7 2.6 2.2 2.4 60.0 18.1 42.0 1.4
154,931 100.0 1.7 3.3 1.8 2.3 54.6 25.8 28.8 1.314,369 100.0 1.2 2.1 1.0 2.2 64.8 14.7 50.1 1.2
19,765 100.0 2.1 2.5 0.4 2.2 64.2 19.7 44.6 1.0
202,920 100.0 1.4 2.8 1.2 1.7 65.4 23.7 41.6 1.0
88,725 100.0 1.5 3.2 0.6 1.7 64.9 27.8 37.1 1.1
36,869 100.0 1.7 3.0 0.4 1.8 64.7 26.5 38.2 1.0
33,075 100.0 2.0 3.4 0.5 2.2 62.3 23.9 38.4 1.0
148,381 100.0 1.1 2.8 0.4 1.7 64.9 24.4 40.5 0.9
123,367 100.0 1.3 3.2 1.0 2.3 55.5 28.7 26.9 1.1
27,227 100.0 1.2 2.7 0.4 1.9 65.9 19.0 46.9 0.9
71,461 100.0 1.4 2.4 2.8 2.2 58.2 21.3 36.8 1.2
126,494 100.0 1.2 1.9 1.8 1.7 65.8 12.5 53.3 0.9
188,718 100.0 1.3 2.9 0.6 1.8 64.1 23.3 40.8 0.9
58,807 100.0 1.6 1.9 0.7 2.3 68.1 19.6 48.5 0.894,128 100.0 1.1 3.5 0.8 2.1 57.8 24.4 33.4 1.1
100,069 100.0 1.7 3.6 0.7 2.5 59.0 23.5 35.5 1.1
12,764 100.0 2.1 2.5 0.5 3.1 55.4 19.4 36.0 1.4
18,700 100.0 2.6 3.0 0.6 2.6 58.3 24.3 34.0 1.1
25,076 100.0 2.6 2.4 1.4 2.6 54.9 15.6 39.3 1.5
12,633 100.0 1.8 1.9 0.4 1.8 70.1 16.8 53.3 0.8
103,167 100.0 1.5 2.3 2.2 2.1 57.2 17.7 39.5 1.2
39,412 100.0 2.0 3.0 0.6 3.2 56.7 17.3 39.4 1.1
410,798 100.0 1.2 2.4 3.2 1.8 57.4 16.9 40.5 1.2
155,184 100.0 1.7 3.0 1.2 2.1 60.6 28.5 32.2 1.2
6,230 100.0 2.4 2.2 0.4 2.6 61.9 25.6 36.3 1.1
217,062 100.0 1.3 3.0 0.6 1.5 67.4 24.8 42.6 0.9
66,921 100.0 1.7 3.4 0.5 2.3 59.1 28.3 30.8 1.248,963 100.0 1.6 2.8 0.7 2.6 58.3 17.8 40.5 1.2
265,062 100.0 1.2 2.7 1.1 1.8 64.2 21.1 43.1 0.9
23,456 100.0 1.2 2.1 1.2 1.6 68.2 19.8 48.4 0.8
81,113 100.0 1.5 2.7 1.1 2.4 58.1 27.9 30.2 1.1
9,703 100.0 2.4 2.4 0.5 2.5 59.1 21.2 37.9 1.0
127,843 100.0 1.3 2.6 0.7 1.9 60.9 26.6 34.3 1.1
361,185 100.0 2.2 3.8 1.2 2.4 53.3 16.8 36.5 1.5
19,487 100.0 3.5 2.3 0.4 2.1 59.8 22.2 37.6 1.0
Idaho
Hawaii
Endocrine,
nutritional,
and
metabolic
diseases
Infectious
and
parasitic
diseasesState or area
Total Congenital
anomalies
Arizona
Alaska
Alabama
MississippiMinnesota
Michigan
Massachusetts
Maryland
Illinois
Delaware
Connecticut
Colorado
California
Arkansas
Injuries
Mental disorders
Neoplasms
Missouri
Georgia
Florida
District of Columbia
Maine
Louisiana
Kentucky
Kansas
Iowa
Indiana
New York
Nevada
Nebraska
Montana
New Hampshire
New Mexico
New Jersey
Utah
Texas
Tennessee
South Dakota
South Carolina
Ohio
North Dakota
North Carolina
Rhode Island
Pennsylvania
OregonOklahoma
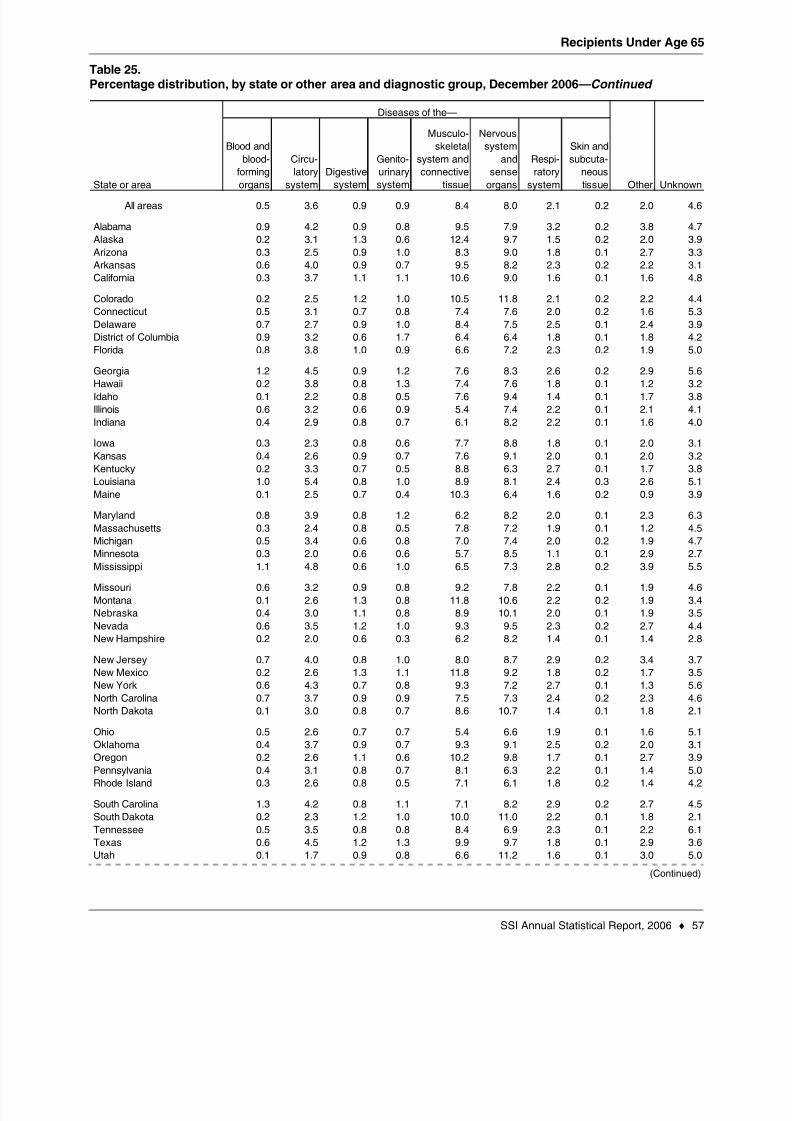
8/14/2019 Social Security: ssi asr06
http://slidepdf.com/reader/full/social-security-ssi-asr06 65/129
Recipients Under Age 65
SSI Annual Statistical Report, 2006 ♦ 57
Table 25.Percentage distribution, by state or other area and diagnostic group, December 2006—Continued
(Continued)
All areas 0.5 3.6 0.9 0.9 8.4 8.0 2.1 0.2 2.0 4.6
0.9 4.2 0.9 0.8 9.5 7.9 3.2 0.2 3.8 4.7
0.2 3.1 1.3 0.6 12.4 9.7 1.5 0.2 2.0 3.9
0.3 2.5 0.9 1.0 8.3 9.0 1.8 0.1 2.7 3.3
0.6 4.0 0.9 0.7 9.5 8.2 2.3 0.2 2.2 3.1
0.3 3.7 1.1 1.1 10.6 9.0 1.6 0.1 1.6 4.8
0.2 2.5 1.2 1.0 10.5 11.8 2.1 0.2 2.2 4.4
0.5 3.1 0.7 0.8 7.4 7.6 2.0 0.2 1.6 5.3
0.7 2.7 0.9 1.0 8.4 7.5 2.5 0.1 2.4 3.9
0.9 3.2 0.6 1.7 6.4 6.4 1.8 0.1 1.8 4.2
0.8 3.8 1.0 0.9 6.6 7.2 2.3 0.2 1.9 5.0
1.2 4.5 0.9 1.2 7.6 8.3 2.6 0.2 2.9 5.60.2 3.8 0.8 1.3 7.4 7.6 1.8 0.1 1.2 3.2
0.1 2.2 0.8 0.5 7.6 9.4 1.4 0.1 1.7 3.8
0.6 3.2 0.6 0.9 5.4 7.4 2.2 0.1 2.1 4.1
0.4 2.9 0.8 0.7 6.1 8.2 2.2 0.1 1.6 4.0
0.3 2.3 0.8 0.6 7.7 8.8 1.8 0.1 2.0 3.1
0.4 2.6 0.9 0.7 7.6 9.1 2.0 0.1 2.0 3.2
0.2 3.3 0.7 0.5 8.8 6.3 2.7 0.1 1.7 3.8
1.0 5.4 0.8 1.0 8.9 8.1 2.4 0.3 2.6 5.1
0.1 2.5 0.7 0.4 10.3 6.4 1.6 0.2 0.9 3.9
0.8 3.9 0.8 1.2 6.2 8.2 2.0 0.1 2.3 6.3
0.3 2.4 0.8 0.5 7.8 7.2 1.9 0.1 1.2 4.5
0.5 3.4 0.6 0.8 7.0 7.4 2.0 0.2 1.9 4.7
0.3 2.0 0.6 0.6 5.7 8.5 1.1 0.1 2.9 2.71.1 4.8 0.6 1.0 6.5 7.3 2.8 0.2 3.9 5.5
0.6 3.2 0.9 0.8 9.2 7.8 2.2 0.1 1.9 4.6
0.1 2.6 1.3 0.8 11.8 10.6 2.2 0.2 1.9 3.4
0.4 3.0 1.1 0.8 8.9 10.1 2.0 0.1 1.9 3.5
0.6 3.5 1.2 1.0 9.3 9.5 2.3 0.2 2.7 4.4
0.2 2.0 0.6 0.3 6.2 8.2 1.4 0.1 1.4 2.8
0.7 4.0 0.8 1.0 8.0 8.7 2.9 0.2 3.4 3.7
0.2 2.6 1.3 1.1 11.8 9.2 1.8 0.2 1.7 3.5
0.6 4.3 0.7 0.8 9.3 7.2 2.7 0.1 1.3 5.6
0.7 3.7 0.9 0.9 7.5 7.3 2.4 0.2 2.3 4.6
0.1 3.0 0.8 0.7 8.6 10.7 1.4 0.1 1.8 2.1
0.5 2.6 0.7 0.7 5.4 6.6 1.9 0.1 1.6 5.1
0.4 3.7 0.9 0.7 9.3 9.1 2.5 0.2 2.0 3.10.2 2.6 1.1 0.6 10.2 9.8 1.7 0.1 2.7 3.9
0.4 3.1 0.8 0.7 8.1 6.3 2.2 0.1 1.4 5.0
0.3 2.6 0.8 0.5 7.1 6.1 1.8 0.2 1.4 4.2
1.3 4.2 0.8 1.1 7.1 8.2 2.9 0.2 2.7 4.5
0.2 2.3 1.2 1.0 10.0 11.0 2.2 0.1 1.8 2.1
0.5 3.5 0.8 0.8 8.4 6.9 2.3 0.1 2.2 6.1
0.6 4.5 1.2 1.3 9.9 9.7 1.8 0.1 2.9 3.6
0.1 1.7 0.9 0.8 6.6 11.2 1.6 0.1 3.0 5.0
Tennessee
Texas
Utah
Alabama
Alaska
Skin and
subcuta-
neous
tissue Other Unknown
Respi-
ratory
system
Diseases of the—
Blood and
blood-
forming
organs
Circu-
latory
system
Arizona
Arkansas
California
Colorado
Connecticut
Delaware
District of Columbia
Florida
GeorgiaHawaii
Idaho
Illinois
Indiana
Iowa
Kansas
Kentucky
Louisiana
Maine
Maryland
Massachusetts
Michigan
MinnesotaMississippi
Missouri
Montana
Nebraska
Nevada
New Hampshire
New Jersey
New Mexico
New York
North Carolina
North Dakota
Ohio
OklahomaOregon
Pennsylvania
Rhode Island
South Carolina
South Dakota
Digestive
system
Genito-
urinary
system
Musculo-
skeletal
system and
connective
tissue
Nervous
system
and
sense
organsState or area
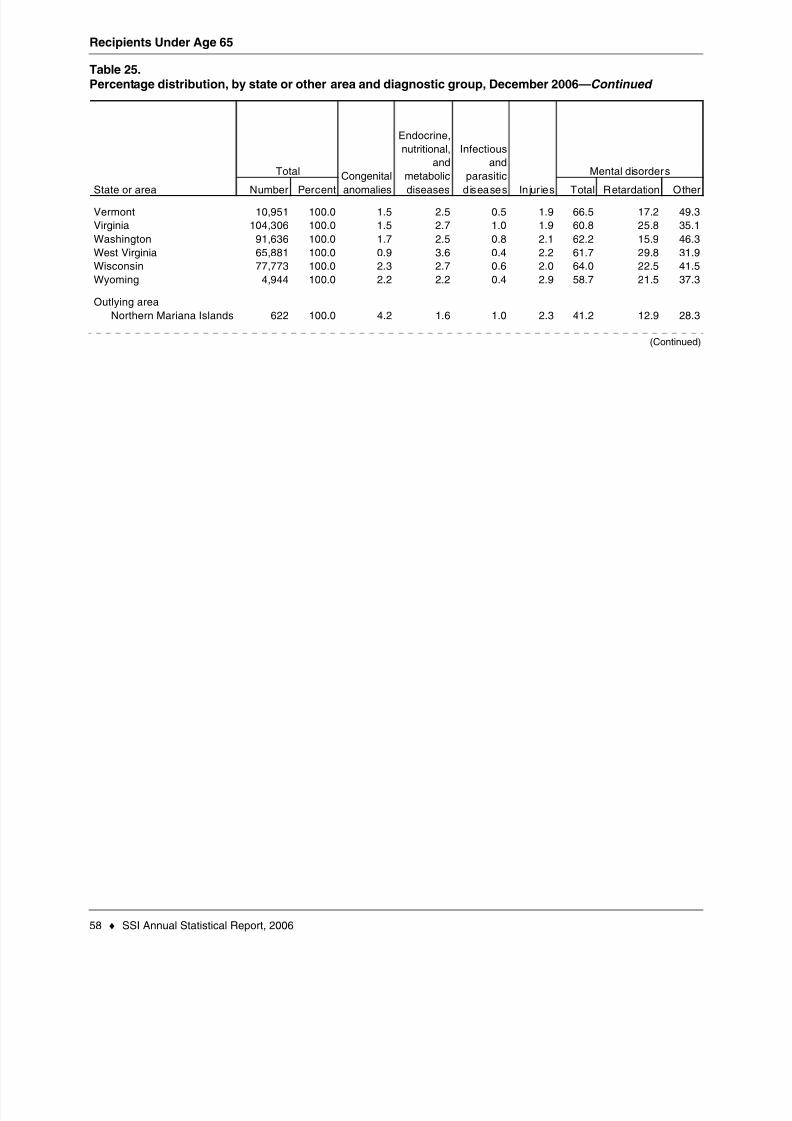
8/14/2019 Social Security: ssi asr06
http://slidepdf.com/reader/full/social-security-ssi-asr06 66/129
Recipients Under Age 65
58 ♦ SSI Annual Statistical Report, 2006
Table 25.Percentage distribution, by state or other area and diagnostic group, December 2006—Continued
(Continued)
Number Percent Total Retardation Other
10,951 100.0 1.5 2.5 0.5 1.9 66.5 17.2 49.3
104,306 100.0 1.5 2.7 1.0 1.9 60.8 25.8 35.1
91,636 100.0 1.7 2.5 0.8 2.1 62.2 15.9 46.3
65,881 100.0 0.9 3.6 0.4 2.2 61.7 29.8 31.9
77,773 100.0 2.3 2.7 0.6 2.0 64.0 22.5 41.5
4,944 100.0 2.2 2.2 0.4 2.9 58.7 21.5 37.3
622 100.0 4.2 1.6 1.0 2.3 41.2 12.9 28.3
Outlying area
Wyoming
Wisconsin
Northern Mariana Islands
West Virginia
Washington
Virginia
Vermont
State or area
Total Congenital
anomalies
Endocrine,
nutritional,
and
metabolic
diseases
Infectious
and
parasitic
diseases Injuries
Mental disorders

8/14/2019 Social Security: ssi asr06
http://slidepdf.com/reader/full/social-security-ssi-asr06 67/129
Recipients Under Age 65
SSI Annual Statistical Report, 2006 ♦ 59
Table 25.Percentage distribution, by state or other area and diagnostic group, December 2006—Continued
0.1 2.0 0.8 0.3 9.2 7.2 1.7 0.1 0.9 4.0
0.6 3.6 0.8 1.0 8.0 7.5 2.2 0.1 2.0 5.0
0.2 2.4 1.1 0.6 9.0 8.3 1.6 0.2 1.9 4.2
0.1 3.5 0.8 0.5 9.0 6.4 2.7 0.2 1.1 6.0
0.5 2.3 0.8 0.7 6.4 8.9 1.6 0.1 2.2 4.0
0.1 2.6 1.1 0.5 9.5 10.9 2.8 0.2 2.2 2.6
0.8 5.3 0.3 4.0 7.1 18.8 1.9 1.6 7.1 1.8
Vermont
Wyoming
Outlying area
Virginia
Washington
West Virginia
Wisconsin
Northern Mariana Islands
SOURCE: Social Security Administration, Supplemental Security Record (Characteristic Extract Record format), 100 percent data.
CONTACT: Stella M. Coleman (410) 965-0157 or [email protected].
Other Unknown
Blood and
blood-
forming
organs
Circu-
latory
system
Digestive
system
Genito-
urinary
system
Musculo-
skeletal
system and
connective
tissue
Nervous
system
and
sense
organs
Respi-
ratory
system
Skin and
subcuta-
neous
tissueState or area
Diseases of the—

8/14/2019 Social Security: ssi asr06
http://slidepdf.com/reader/full/social-security-ssi-asr06 68/129
Recipients Under Age 65
60 ♦ SSI Annual Statistical Report, 2006
Table 26.Average monthly payment, by state or other area and diagnostic group,
December 2006 (in dollars)
(Continued)
Total Retardation Other
All areas 485.35 525.14 454.94 475.45 447.46 496.23 483.15 503.21 459.32
448.12 505.12 408.14 410.26 401.96 465.70 473.40 458.98 422.39
452.47 493.59 462.89 469.37 421.68 453.49 435.05 459.71 458.79
468.28 522.78 442.30 419.60 429.44 475.54 478.81 474.15 453.35442.80 499.80 402.18 390.68 395.18 465.39 464.92 465.85 420.05
619.69 642.23 576.92 565.73 574.22 638.64 640.99 637.84 557.77
438.36 495.50 427.74 391.88 399.18 445.74 444.49 446.36 424.82
456.70 489.04 461.26 478.66 418.43 456.22 440.77 461.89 434.06
451.39 487.20 418.07 413.30 401.56 463.09 456.59 466.88 442.13496.92 490.31 451.44 489.23 463.75 506.18 467.01 525.44 461.57
460.15 494.70 421.14 435.51 406.61 475.49 470.08 477.82 429.04
450.97 503.31 420.02 425.44 406.19 464.85 468.09 461.94 430.19
496.15 492.95 467.69 439.83 465.40 505.71 502.42 506.67 443.45
439.02 503.95 400.22 416.67 407.42 445.12 439.09 447.78 452.61
480.55 512.19 473.30 465.65 449.77 488.03 484.24 490.20 462.48
451.47 494.82 427.84 405.50 407.12 460.67 461.53 460.04 434.62
427.11 478.66 427.74 375.10 391.04 434.22 420.30 443.87 421.22
439.39 495.91 418.38 385.96 383.71 446.60 437.57 452.24 428.86459.02 501.20 436.03 389.30 406.19 474.61 477.40 472.93 417.38
464.64 508.06 446.26 428.78 426.89 481.82 476.21 487.81 440.25
426.00 472.31 419.29 402.25 381.94 431.58 420.00 436.26 425.96
469.95 490.52 452.41 456.71 427.30 478.65 473.96 481.37 459.50
490.65 523.87 488.50 511.73 457.17 491.90 463.97 498.44 488.41
476.73 517.62 460.47 435.12 447.61 486.40 487.91 485.54 452.93451.12 488.14 447.01 441.60 431.31 452.53 436.24 459.11 446.86
452.38 503.15 414.92 394.60 403.11 466.81 459.31 472.28 433.04
444.46 496.69 419.48 390.16 410.55 454.51 451.70 456.37 446.15
437.79 504.78 409.69 366.98 428.79 441.27 437.81 443.13 416.29
421.67 495.63 421.80 393.25 367.28 425.98 430.52 422.73 427.05
457.40 502.40 417.10 425.51 410.05 469.96 472.17 469.08 438.79
425.97 477.86 399.32 402.13 396.54 427.07 408.47 432.95 456.16
472.54 501.43 461.00 462.12 428.81 479.51 467.66 484.81 444.08
455.19 516.66 438.71 423.33 412.92 467.38 461.25 470.07 461.18
522.80 539.68 503.67 534.57 480.35 534.37 508.56 545.14 482.50
435.73 488.90 404.65 399.99 393.79 447.57 441.91 452.59 422.18
402.24 452.24 429.62 415.14 405.81 398.29 373.00 416.12 404.09
469.90 496.65 457.79 424.44 413.48 478.56 476.03 480.03 451.93451.74 512.44 415.35 416.41 413.25 464.90 470.12 460.10 429.91
452.27 495.92 427.68 398.34 425.50 457.17 454.92 458.15 463.04
481.77 498.35 456.93 469.36 447.26 492.53 475.64 500.80 441.69
489.57 535.97 480.90 481.65 430.20 495.84 493.68 496.72 457.60
443.40 496.43 417.75 410.76 410.13 454.54 454.62 454.46 425.75
425.25 469.82 440.20 379.55 410.84 425.63 400.90 439.48 407.63
448.28 501.16 414.97 410.18 399.76 461.74 468.32 456.65 434.20
450.27 511.07 412.24 431.02 409.31 467.36 446.55 476.95 431.04
435.65 494.44 415.14 434.27 400.47 436.55 433.89 438.13 425.03
South Carolina
Ohio
North Dakota
North Carolina
Rhode Island
Pennsylvania
Oregon
Oklahoma
Utah
Texas
Tennessee
South Dakota
New York
Nevada
Nebraska
Montana
New Hampshire
New Mexico
New Jersey
Arizona
Missouri
Georgia
Florida
District of Columbia
Maine
Louisiana
KentuckyKansas
Iowa
Delaware
Connecticut
Colorado
California
Arkansas
Maryland
Illinois
Idaho
Hawaii
Indiana
Mississippi
MinnesotaMichigan
Massachusetts
Infectious
and
parasiticdiseasesState or area
Congenitalanomalies
Alaska
Alabama
Total
Endocrine,
nutritional,
and
metabolicdiseases Injuries
Mental disordersNeoplasms
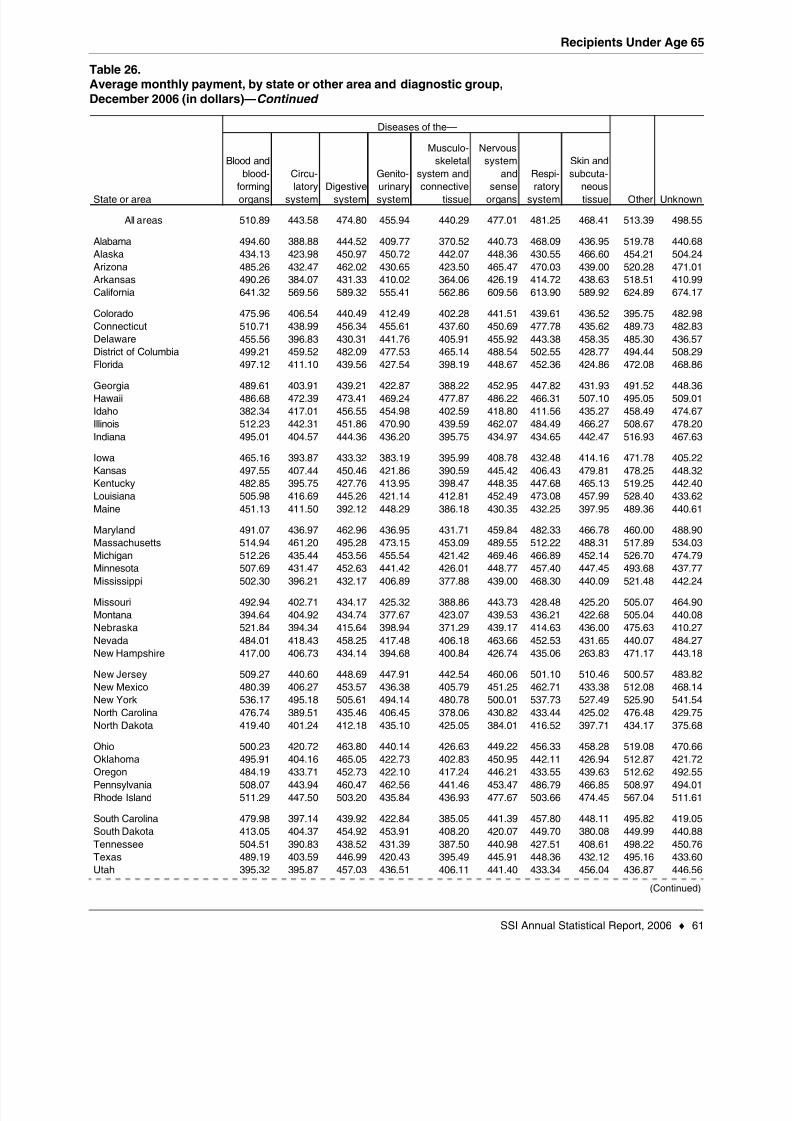
8/14/2019 Social Security: ssi asr06
http://slidepdf.com/reader/full/social-security-ssi-asr06 69/129
Recipients Under Age 65
SSI Annual Statistical Report, 2006 ♦ 61
Table 26.Average monthly payment, by state or other area and diagnostic group,
December 2006 (in dollars)—Continued
(Continued)
All areas 510.89 443.58 474.80 455.94 440.29 477.01 481.25 468.41 513.39 498.55
494.60 388.88 444.52 409.77 370.52 440.73 468.09 436.95 519.78 440.68
434.13 423.98 450.97 450.72 442.07 448.36 430.55 466.60 454.21 504.24
485.26 432.47 462.02 430.65 423.50 465.47 470.03 439.00 520.28 471.01490.26 384.07 431.33 410.02 364.06 426.19 414.72 438.63 518.51 410.99
641.32 569.56 589.32 555.41 562.86 609.56 613.90 589.92 624.89 674.17
475.96 406.54 440.49 412.49 402.28 441.51 439.61 436.52 395.75 482.98
510.71 438.99 456.34 455.61 437.60 450.69 477.78 435.62 489.73 482.83
455.56 396.83 430.31 441.76 405.91 455.92 443.38 458.35 485.30 436.57499.21 459.52 482.09 477.53 465.14 488.54 502.55 428.77 494.44 508.29
497.12 411.10 439.56 427.54 398.19 448.67 452.36 424.86 472.08 468.86
489.61 403.91 439.21 422.87 388.22 452.95 447.82 431.93 491.52 448.36
486.68 472.39 473.41 469.24 477.87 486.22 466.31 507.10 495.05 509.01
382.34 417.01 456.55 454.98 402.59 418.80 411.56 435.27 458.49 474.67
512.23 442.31 451.86 470.90 439.59 462.07 484.49 466.27 508.67 478.20
495.01 404.57 444.36 436.20 395.75 434.97 434.65 442.47 516.93 467.63
465.16 393.87 433.32 383.19 395.99 408.78 432.48 414.16 471.78 405.22
497.55 407.44 450.46 421.86 390.59 445.42 406.43 479.81 478.25 448.32482.85 395.75 427.76 413.95 398.47 448.35 447.68 465.13 519.25 442.40
505.98 416.69 445.26 421.14 412.81 452.49 473.08 457.99 528.40 433.62
451.13 411.50 392.12 448.29 386.18 430.35 432.25 397.95 489.36 440.61
491.07 436.97 462.96 436.95 431.71 459.84 482.33 466.78 460.00 488.90
514.94 461.20 495.28 473.15 453.09 489.55 512.22 488.31 517.89 534.03
512.26 435.44 453.56 455.54 421.42 469.46 466.89 452.14 526.70 474.79507.69 431.47 452.63 441.42 426.01 448.77 457.40 447.45 493.68 437.77
502.30 396.21 432.17 406.89 377.88 439.00 468.30 440.09 521.48 442.24
492.94 402.71 434.17 425.32 388.86 443.73 428.48 425.20 505.07 464.90
394.64 404.92 434.74 377.67 423.07 439.53 436.21 422.68 505.04 440.08
521.84 394.34 415.64 398.94 371.29 439.17 414.63 436.00 475.63 410.27
484.01 418.43 458.25 417.48 406.18 463.66 452.53 431.65 440.07 484.27
417.00 406.73 434.14 394.68 400.84 426.74 435.06 263.83 471.17 443.18
509.27 440.60 448.69 447.91 442.54 460.06 501.10 510.46 500.57 483.82
480.39 406.27 453.57 436.38 405.79 451.25 462.71 433.38 512.08 468.14
536.17 495.18 505.61 494.14 480.78 500.01 537.73 527.49 525.90 541.54
476.74 389.51 435.46 406.45 378.06 430.82 433.44 425.02 476.48 429.75
419.40 401.24 412.18 435.10 425.05 384.01 416.52 397.71 434.17 375.68
500.23 420.72 463.80 440.14 426.63 449.22 456.33 458.28 519.08 470.66495.91 404.16 465.05 422.73 402.83 450.95 442.11 426.94 512.87 421.72
484.19 433.71 452.73 422.10 417.24 446.21 433.55 439.63 512.62 492.55
508.07 443.94 460.47 462.56 441.46 453.47 486.79 466.85 508.97 494.01
511.29 447.50 503.20 435.84 436.93 477.67 503.66 474.45 567.04 511.61
479.98 397.14 439.92 422.84 385.05 441.39 457.80 448.11 495.82 419.05
413.05 404.37 454.92 453.91 408.20 420.07 449.70 380.08 449.99 440.88
504.51 390.83 438.52 431.39 387.50 440.98 427.51 408.61 498.22 450.76
489.19 403.59 446.99 420.43 395.49 445.91 448.36 432.12 495.16 433.60
395.32 395.87 457.03 436.51 406.11 441.40 433.34 456.04 436.87 446.56
Digestivesystem
Genito-
urinarysystem
Musculo-
skeletal
system and
connectivetissue
Nervous
system
and
senseorgans Other Unknown
Respi-
ratorysystem
Diseases of the—
Pennsylvania
Rhode Island
South Carolina
South Dakota
North Dakota
OhioOklahoma
Oregon
New Jersey
New Mexico
New York
North Carolina
Montana
Nebraska
Nevada
New Hampshire
MichiganMinnesota
Mississippi
Missouri
Louisiana
Maine
Maryland
Massachusetts
Indiana
Iowa
Kansas
Kentucky
Georgia
Hawaii
Idaho
Illinois
Connecticut
Delaware
District of Columbia
Florida
Arizona
Arkansas
California
Colorado
Alabama
Alaska
Skin and
subcuta-
neoustissue
Blood and
blood-
formingorgans
Circu-
latorysystemState or area
Tennessee
Texas
Utah

8/14/2019 Social Security: ssi asr06
http://slidepdf.com/reader/full/social-security-ssi-asr06 70/129
Recipients Under Age 65
62 ♦ SSI Annual Statistical Report, 2006
Table 26.Average monthly payment, by state or other area and diagnostic group,
December 2006 (in dollars)—Continued
(Continued)
Total Retardation Other
448.10 503.42 454.87 349.02 404.57 458.03 428.26 468.40 452.75
442.61 486.61 413.25 418.33 398.61 454.80 447.84 459.91 426.93
467.25 506.92 446.08 428.46 431.81 471.22 463.83 473.77 451.50
459.45 498.56 432.44 404.84 424.99 473.85 471.82 475.76 411.42
447.71 496.32 434.68 418.41 422.24 454.12 450.40 456.13 432.64
424.13 491.67 441.29 380.57 427.20 423.95 411.43 431.16 487.93
523.48 564.42 538.13 538.17 515.27 527.63 530.29 526.43 552.43
West Virginia
Washington
Virginia
Vermont
Northern Mariana Islands
Outlying area
Wyoming
Wisconsin
State or area Total
Congenital
anomalies
Endocrine,
nutritional,
and
metabolic
diseases
Infectious
and
parasitic
diseases Injuries
Mental disorders
Neoplasms
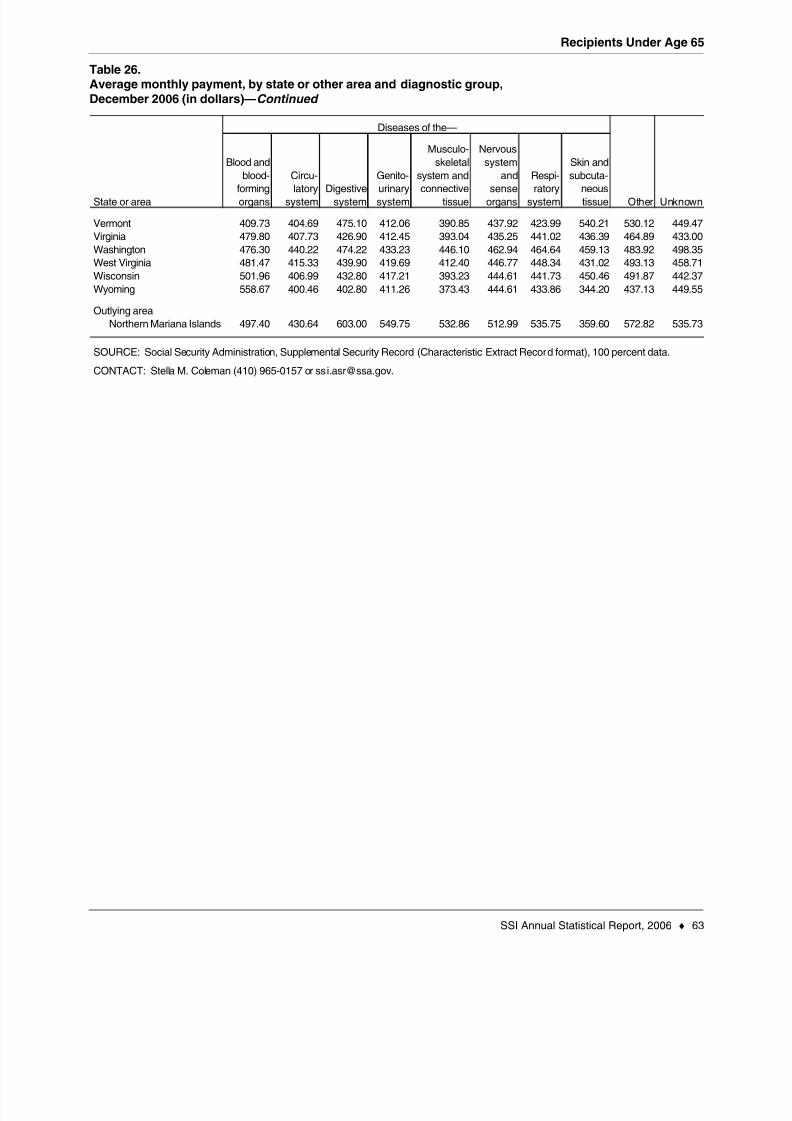
8/14/2019 Social Security: ssi asr06
http://slidepdf.com/reader/full/social-security-ssi-asr06 71/129
Recipients Under Age 65
SSI Annual Statistical Report, 2006 ♦ 63
Table 26.Average monthly payment, by state or other area and diagnostic group,
December 2006 (in dollars)—Continued
409.73 404.69 475.10 412.06 390.85 437.92 423.99 540.21 530.12 449.47
479.80 407.73 426.90 412.45 393.04 435.25 441.02 436.39 464.89 433.00
476.30 440.22 474.22 433.23 446.10 462.94 464.64 459.13 483.92 498.35
481.47 415.33 439.90 419.69 412.40 446.77 448.34 431.02 493.13 458.71
501.96 406.99 432.80 417.21 393.23 444.61 441.73 450.46 491.87 442.37
558.67 400.46 402.80 411.26 373.43 444.61 433.86 344.20 437.13 449.55
497.40 430.64 603.00 549.75 532.86 512.99 535.75 359.60 572.82 535.73
SOURCE: Social Security Administration, Supplemental Security Record (Characteristic Extract Record format), 100 percent data.
CONTACT: Stella M. Coleman (410) 965-0157 or [email protected].
Washington
West Virginia
Wisconsin
Northern Mariana Islands
Vermont
Wyoming
Outlying area
Virginia
Other Unknown
Blood and
blood-
formingorgans
Circu-
latorysystem
Digestivesystem
Genito-
urinarysystem
Musculo-
skeletal
system and
connectivetissue
Nervous
system
and
senseorgans
Respi-
ratorysystem
Skin and
subcuta-
neoustissueState or area
Diseases of the—

8/14/2019 Social Security: ssi asr06
http://slidepdf.com/reader/full/social-security-ssi-asr06 72/129

8/14/2019 Social Security: ssi asr06
http://slidepdf.com/reader/full/social-security-ssi-asr06 73/129
Recipients Who Work

8/14/2019 Social Security: ssi asr06
http://slidepdf.com/reader/full/social-security-ssi-asr06 74/129

8/14/2019 Social Security: ssi asr06
http://slidepdf.com/reader/full/social-security-ssi-asr06 75/129

8/14/2019 Social Security: ssi asr06
http://slidepdf.com/reader/full/social-security-ssi-asr06 76/129
Recipients Who Work
68 ♦ SSI Annual Statistical Report, 2006
Table 27.By selected months, 1976–2006—Continued
Total
Receiving
SSIb
Section 1619(b)
participants
Total as a
percentage
of all blind
and disabled
recipients
March 6,014,109 336,446 257,536 78,910 5.6
June 6,045,960 341,450 258,360 83,090 5.6
September 6,098,112 346,309 259,093 87,216 5.7
December 6,113,277 349,420 260,070 89,350 5.7
a.
b.
SOURCE: Social Security Administration, Supplemental Security Record (Characteristic Extract Record format), 100 percent data.
CONTACT: Clark Pickett (410) 965-9016 or [email protected].
NOTE: . . . = not applicable; -- = not available.
Includes section 1619(b) participants.
Includes section 1619(a) participants.
2006
Month
All blind
and disabled
recipientsa
Blind and disabled recipients who work

8/14/2019 Social Security: ssi asr06
http://slidepdf.com/reader/full/social-security-ssi-asr06 77/129
Recipients Who Work
SSI Annual Statistical Report, 2006 ♦ 69
Table 28.Recipients participating in section 1619(a) or section 1619(b), selected months, 1982–2006
Number
Percentage change
from prior period Number
Percentage change
from prior period
1982 287 . . . 5,515 . . .
1983 392 36.6 5,165 -6.31984 -- -- -- --
1985 -- -- -- --
1986 -- -- -- --
1987 14,559 . . . 15,632 . . .
1988 19,920 36.8 15,625 0
1989 25,655 28.8 18,254 16.8
1990 13,994 -45.5 23,517 28.8
1991 15,531 11.0 27,264 15.9
1992 17,603 13.3 31,649 16.1
1993 20,028 13.8 35,299 11.5
1994 24,315 21.4 40,683 15.3
1995 28,060 15.4 47,002 15.51996 31,085 10.8 51,905 10.4
1997 34,673 11.5 57,089 10.0
1998 37,271 7.5 59,542 4.3
1999 25,528 -31.5 69,265 16.3
2000 27,542 7.9 83,572 20.7
2001 22,100 -19.8 76,455 -8.5
2002 17,271 -21.9 82,177 7.5
2003 17,132 -0.8 71,097 -13.5
2004 17,114 -0.1 73,681 3.6
2005 17,621 3.0 78,205 6.1
2006 17,394 -1.3 89,350 14.3
March 16,879 -1.5 69,532 -2.2June 16,587 -1.7 72,898 4.8
September 16,892 1.8 75,657 3.8
December 17,114 1.3 73,681 -2.6
March 17,082 -0.2 74,247 0.8
June 17,655 3.4 79,368 6.9
September 17,874 1.2 80,134 1.0
December 17,621 -1.4 78,205 -2.4
March 17,597 -0.1 78,910 0.9
June 18,159 3.2 83,090 5.3
September 18,670 2.8 87,216 5.0
December 17,394 -6.8 89,350 2.4
a.
CONTACT: Clark Pickett (410) 965-9016 or [email protected].
. . . = not applicable; -- = not available.
Includes blind participants. Of the 89,350 participants in December 2006, 1,444 were blind.
Month
Section 1619(a) Section 1619(b) a
NOTES: When the substantial gainful activity (SGA) level is periodically raised, SSI recipients with earnings below the increased SGA
level become eligible for regular SSI benefits rather than the special cash payments under section 1619(a). This can lead to decreases in
the number of 1619(a) participants.
December
2004
2005
2006
SOURCE: Social Security Administration, Supplemental Security Record (Characteristic Extract Record format), 100 percent data.
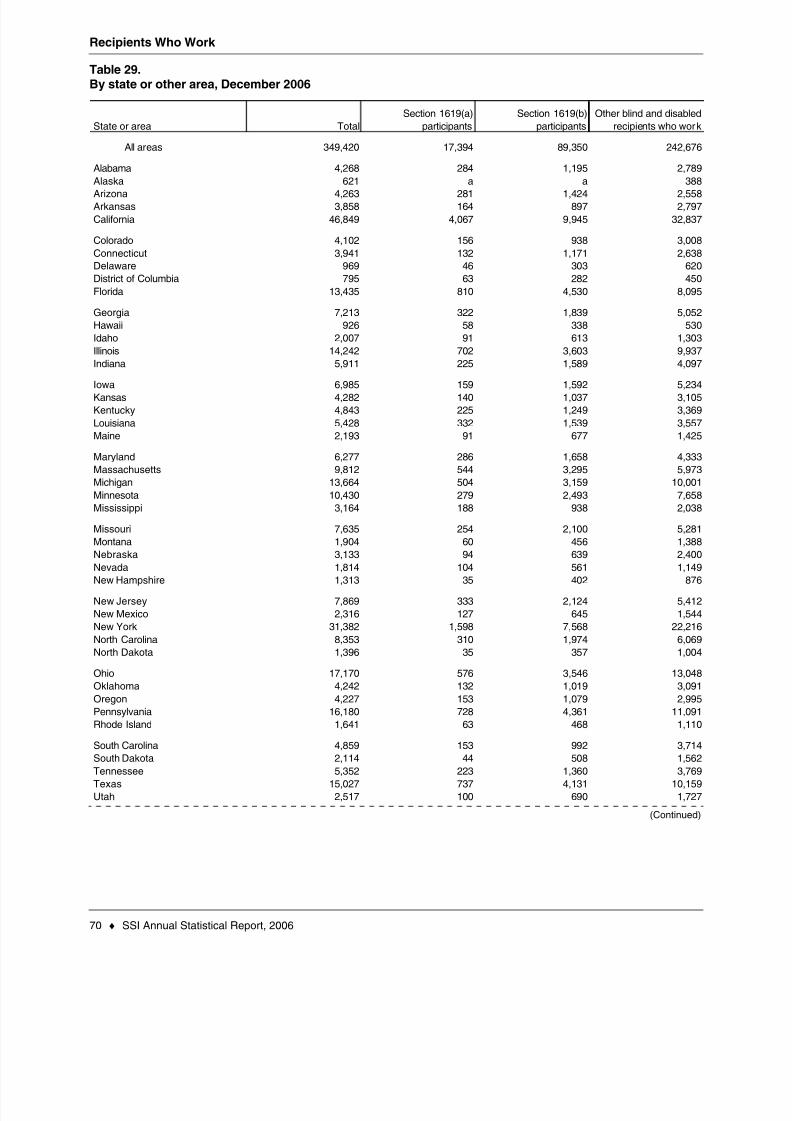
8/14/2019 Social Security: ssi asr06
http://slidepdf.com/reader/full/social-security-ssi-asr06 78/129
Recipients Who Work
70 ♦ SSI Annual Statistical Report, 2006
Table 29.By state or other area, December 2006
(Continued)
Total
Section 1619(a)
participants
Section 1619(b)
participants
Other blind and disabled
recipients who work
All areas 349,420 17,394 89,350 242,676
4,268 284 1,195 2,789
621 a a 3884,263 281 1,424 2,558
3,858 164 897 2,797
46,849 4,067 9,945 32,837
4,102 156 938 3,008
3,941 132 1,171 2,638969 46 303 620
795 63 282 450
13,435 810 4,530 8,095
7,213 322 1,839 5,052
926 58 338 530
2,007 91 613 1,303
14,242 702 3,603 9,937
5,911 225 1,589 4,097
6,985 159 1,592 5,234
4,282 140 1,037 3,105
4,843 225 1,249 3,369
5,428 332 1,539 3,557
2,193 91 677 1,425
6,277 286 1,658 4,333
9,812 544 3,295 5,973
13,664 504 3,159 10,001
10,430 279 2,493 7,658
3,164 188 938 2,038
7,635 254 2,100 5,281
1,904 60 456 1,388
3,133 94 639 2,4001,814 104 561 1,149
1,313 35 402 876
7,869 333 2,124 5,412
2,316 127 645 1,544
31,382 1,598 7,568 22,216
8,353 310 1,974 6,069
1,396 35 357 1,004
17,170 576 3,546 13,048
4,242 132 1,019 3,091
4,227 153 1,079 2,995
16,180 728 4,361 11,091
1,641 63 468 1,110
4,859 153 992 3,7142,114 44 508 1,562
5,352 223 1,360 3,769
15,027 737 4,131 10,159
2,517 100 690 1,727
Tennessee
Oregon
Utah
Texas
South DakotaSouth Carolina
Rhode Island
Pennsylvania
Nebraska
Montana
Oklahoma
Ohio
North Dakota
North Carolina
New York
New Mexico
New Jersey
New Hampshire
Nevada
Kansas
Missouri
Mississippi
Minnesota
Michigan
Massachusetts
Maryland
Maine
Louisiana
Kentucky
Colorado
Iowa
Indiana
Illinois
Idaho
Hawaii
Georgia
Florida
District of Columbia
DelawareConnecticut
State or area
California
Arkansas
ArizonaAlaska
Alabama

8/14/2019 Social Security: ssi asr06
http://slidepdf.com/reader/full/social-security-ssi-asr06 79/129
Recipients Who Work
SSI Annual Statistical Report, 2006 ♦ 71
Table 29.By state or other area, December 2006—Continued
Total
Section 1619(a)
participants
Section 1619(b)
participants
Other blind and disabled
recipients who work
1,255 60 418 777
7,198 331 2,018 4,849
6,415 482 2,197 3,736
2,254 150 654 1,45010,488 308 2,284 7,896
875 33 278 564
13 a a 7
a.
Outlying area
Wyoming
WisconsinWest Virginia
Washington
Virginia
Vermont
Northern Mariana Islands
SOURCE: Social Security Administration, Supplemental Security Record (Characteristic Extract Record format), 100 percent data.
CONTACT: Clark Pickett (410) 965-9016 or [email protected].
State or area
Data are not shown to avoid disclosure of information for particular individuals.

8/14/2019 Social Security: ssi asr06
http://slidepdf.com/reader/full/social-security-ssi-asr06 80/129
Recipients Who Work
72 ♦ SSI Annual Statistical Report, 2006
Table 30.Recipients benefiting from specified work incentives, by state or other area, December 2006
(Continued)
Plans for achieving
self-support (PASS) a
Impairment-related
work expenses (IRWE)
Blind work
expenses (BWE)
All areas 1,583 5,650 2,370
23 143 28
4 b b7 59 27
16 48 20
371 366 391
13 27 24
9 108 32
0 27 9
b 0 3
39 306 82
26 194 48
5 7 8
23 8 4
43 191 57
30 94 38
53 50 47
25 286 30
64 81 34
b 96 34
46 27 10
18 161 34
100 147 211
43 95 78
52 113 44
7 36 22
34 104 29
17 9 9
17 19 8b 19 13
12 19 6
3 201 44
0 56 15
86 477 185
73 293 93
b 7 3
26 106 80
6 65 21
31 36 20
13 242 88
10 10 8
20 60 317 12 6
20 101 36
22 284 156
b 36 13
Connecticut
State or area
California
Arkansas
ArizonaAlaska
Alabama
Colorado
Iowa
Indiana
Illinois
Idaho
Hawaii
Georgia
Florida
District of Columbia
Delaware
Kansas
Missouri
Mississippi
Minnesota
Michigan
Massachusetts
Maryland
Maine
Louisiana
Kentucky
Montana
Oklahoma
Ohio
North Dakota
North Carolina
New York
New Mexico
New Jersey
New Hampshire
Nevada
South Carolina
Rhode Island
Pennsylvania
Nebraska
Oregon
Utah
South Dakota
Tennessee
Texas

8/14/2019 Social Security: ssi asr06
http://slidepdf.com/reader/full/social-security-ssi-asr06 81/129
Recipients Who Work
SSI Annual Statistical Report, 2006 ♦ 73
Table 30.Recipients benefiting from specified work incentives, by state or other area, December 2006—Continued
Plans for achieving
self-support (PASS) a
Impairment-related
work expenses (IRWE)
Blind work
expenses (BWE)
30 9 4
7 465 58
33 89 45
11 25 1378 234 64
b b 3
0 0 b
a.
b.
Outlying area
Wyoming
WisconsinWest Virginia
Washington
Virginia
Vermont
Northern Mariana Islands
SOURCE: Social Security Administration, Supplemental Security Record (Characteristic Extract Record format), 100 percent data.
CONTACT: Clark Pickett (410) 965-9016 or [email protected].
Includes 435 persons with a PASS that excludes only resources.
Data are not shown to avoid disclosure of information for particular individuals.
State or area

8/14/2019 Social Security: ssi asr06
http://slidepdf.com/reader/full/social-security-ssi-asr06 82/129

8/14/2019 Social Security: ssi asr06
http://slidepdf.com/reader/full/social-security-ssi-asr06 83/129
Applications

8/14/2019 Social Security: ssi asr06
http://slidepdf.com/reader/full/social-security-ssi-asr06 84/129
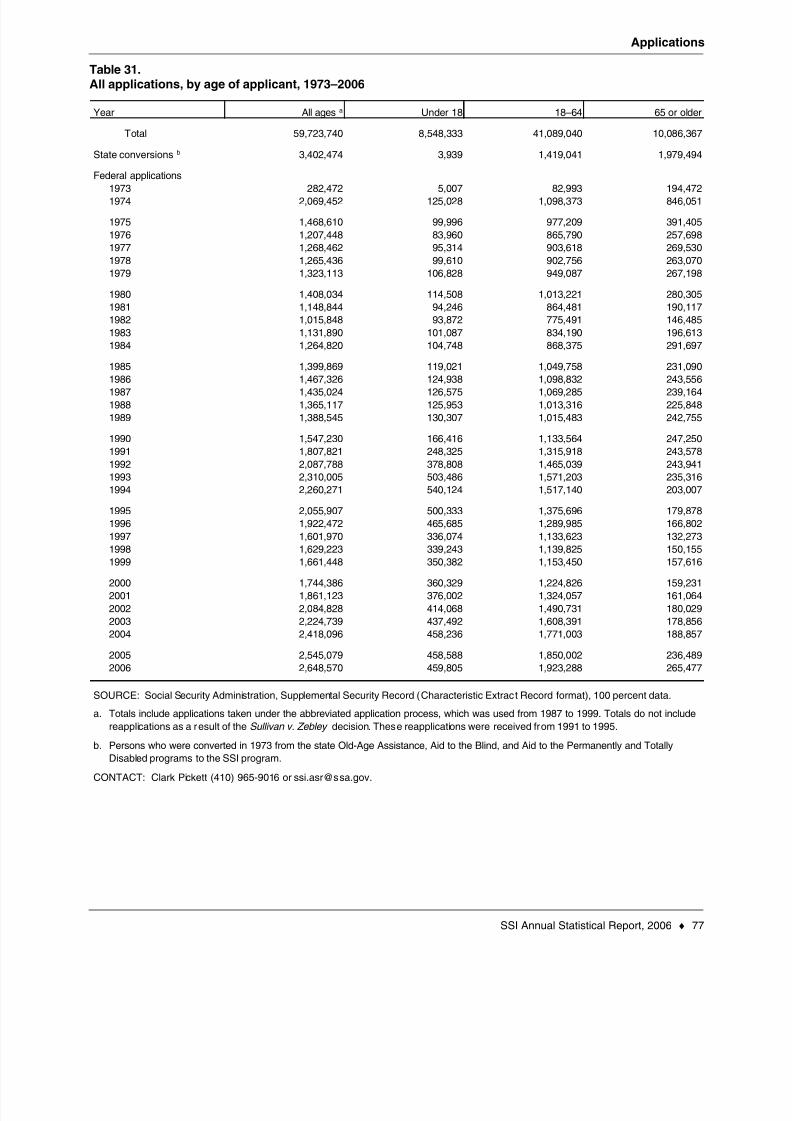
8/14/2019 Social Security: ssi asr06
http://slidepdf.com/reader/full/social-security-ssi-asr06 85/129
Applications
SSI Annual Statistical Report, 2006 ♦ 77
Table 31.All applications, by age of applicant, 1973–2006
All ages a Under 18 18–64 65 or older
Total 59,723,740 8,548,333 41,089,040 10,086,367
3,402,474 3,939 1,419,041 1,979,494
282,472 5,007 82,993 194,4722,069,452 125,028 1,098,373 846,051
1,468,610 99,996 977,209 391,405
1,207,448 83,960 865,790 257,698
1,268,462 95,314 903,618 269,530
1,265,436 99,610 902,756 263,070
1,323,113 106,828 949,087 267,198
1,408,034 114,508 1,013,221 280,305
1,148,844 94,246 864,481 190,117
1,015,848 93,872 775,491 146,485
1,131,890 101,087 834,190 196,613
1,264,820 104,748 868,375 291,697
1,399,869 119,021 1,049,758 231,090
1,467,326 124,938 1,098,832 243,556
1,435,024 126,575 1,069,285 239,164
1,365,117 125,953 1,013,316 225,848
1,388,545 130,307 1,015,483 242,755
1,547,230 166,416 1,133,564 247,250
1,807,821 248,325 1,315,918 243,578
2,087,788 378,808 1,465,039 243,941
2,310,005 503,486 1,571,203 235,316
2,260,271 540,124 1,517,140 203,007
2,055,907 500,333 1,375,696 179,878
1,922,472 465,685 1,289,985 166,802
1,601,970 336,074 1,133,623 132,273
1,629,223 339,243 1,139,825 150,155
1,661,448 350,382 1,153,450 157,616
1,744,386 360,329 1,224,826 159,231
1,861,123 376,002 1,324,057 161,064
2,084,828 414,068 1,490,731 180,029
2,224,739 437,492 1,608,391 178,856
2,418,096 458,236 1,771,003 188,857
2,545,079 458,588 1,850,002 236,489
2,648,570 459,805 1,923,288 265,477
a.
b.
1999
2001
1984
1989
1988
1987
1986
1993
1992
1991
1976
1975
1974
Year
State conversions b
Federal applications
1973
1977
1982
1981
1980
1979
1978
CONTACT: Clark Pickett (410) 965-9016 or [email protected].
2004
2002
2000
Persons who were converted in 1973 from the state Old-Age Assistance, Aid to the Blind, and Aid to the Permanently and TotallyDisabled programs to the SSI program.
Totals include applications taken under the abbreviated application process, which was used from 1987 to 1999. Totals do not include
reapplications as a result of the Sullivan v. Zebley decision. These reapplications were received from 1991 to 1995.
SOURCE: Social Security Administration, Supplemental Security Record (Characteristic Extract Record format), 100 percent data.
2003
2005
2006
1983
1998
1997
1996
1995
1994
1985
1990
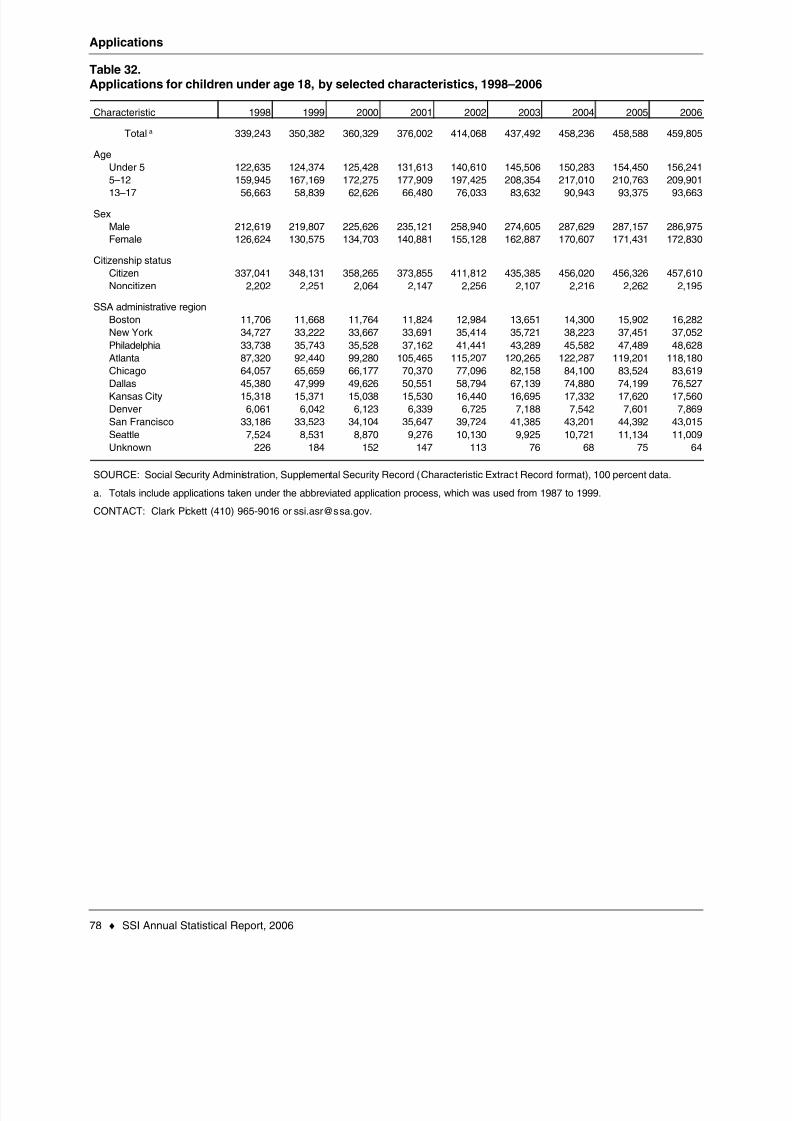
8/14/2019 Social Security: ssi asr06
http://slidepdf.com/reader/full/social-security-ssi-asr06 86/129
Applications
78 ♦ SSI Annual Statistical Report, 2006
Table 32.Applications for children under age 18, by selected characteristics, 1998–2006
1998 1999 2000 2001 2002 2003 2004 2005 2006
Total a 339,243 350,382 360,329 376,002 414,068 437,492 458,236 458,588 459,805
122,635 124,374 125,428 131,613 140,610 145,506 150,283 154,450 156,241
159,945 167,169 172,275 177,909 197,425 208,354 217,010 210,763 209,901
56,663 58,839 62,626 66,480 76,033 83,632 90,943 93,375 93,663
212,619 219,807 225,626 235,121 258,940 274,605 287,629 287,157 286,975126,624 130,575 134,703 140,881 155,128 162,887 170,607 171,431 172,830
337,041 348,131 358,265 373,855 411,812 435,385 456,020 456,326 457,610
2,202 2,251 2,064 2,147 2,256 2,107 2,216 2,262 2,195
11,706 11,668 11,764 11,824 12,984 13,651 14,300 15,902 16,282
34,727 33,222 33,667 33,691 35,414 35,721 38,223 37,451 37,052
33,738 35,743 35,528 37,162 41,441 43,289 45,582 47,489 48,628
87,320 92,440 99,280 105,465 115,207 120,265 122,287 119,201 118,180
64,057 65,659 66,177 70,370 77,096 82,158 84,100 83,524 83,61945,380 47,999 49,626 50,551 58,794 67,139 74,880 74,199 76,527
15,318 15,371 15,038 15,530 16,440 16,695 17,332 17,620 17,560
6,061 6,042 6,123 6,339 6,725 7,188 7,542 7,601 7,869
33,186 33,523 34,104 35,647 39,724 41,385 43,201 44,392 43,015
7,524 8,531 8,870 9,276 10,130 9,925 10,721 11,134 11,009
226 184 152 147 113 76 68 75 64
a.
CONTACT: Clark Pickett (410) 965-9016 or [email protected].
Characteristic
Age
13–17
5–12
Under 5
Sex
FemaleMale
Citizenship status
Noncitizen
Citizen
SSA administrative region
Unknown
Seattle
San Francisco
Denver
Kansas City
DallasChicago
Atlanta
Philadelphia
New York
Boston
Totals include applications taken under the abbreviated application process, which was used from 1987 to 1999.
SOURCE: Social Security Administration, Supplemental Security Record (Characteristic Extract Record format), 100 percent data.

8/14/2019 Social Security: ssi asr06
http://slidepdf.com/reader/full/social-security-ssi-asr06 87/129
Applications
SSI Annual Statistical Report, 2006 ♦ 79
Table 33.Applications for adults aged 18–64, by selected characteristics, 1998–2006
1998 1999 2000 2001 2002 2003 2004 2005 2006
Total a 1,139,825 1,153,450 1,224,826 1,324,057 1,490,731 1,608,391 1,771,003 1,850,002 1,923,288
81,197 85,488 90,994 99,251 110,690 116,569 124,284 123,561 126,991
132,985 131,204 135,688 147,194 169,969 181,987 198,991 202,177 207,438
272,066 266,978 271,472 283,462 306,718 314,586 330,160 323,024 322,096
320,162 328,615 355,328 387,448 438,578 472,602 519,999 533,307 541,692
259,156 265,262 291,945 320,975 367,740 412,175 470,120 519,426 559,756
74,259 75,903 79,399 85,727 97,036 110,472 127,449 148,507 165,315
548,880 554,630 590,330 644,606 732,740 793,711 869,693 911,021 946,356
590,945 598,820 634,496 679,451 757,991 814,680 901,310 938,981 976,932
1,071,153 1,082,600 1,156,008 1,254,051 1,416,935 1,534,995 1,694,842 1,774,054 1,847,683
68,672 70,850 68,818 70,006 73,796 73,396 76,161 75,948 75,605
50,245 48,893 49,006 50,967 55,580 64,098 70,315 84,732 89,743
112,139 109,161 108,853 117,352 120,711 121,097 128,341 128,653 135,340110,332 112,712 117,143 124,290 140,586 154,770 170,232 179,519 188,425
284,814 288,111 316,528 344,111 381,188 396,605 426,469 442,705 456,661
168,713 167,056 186,104 208,019 241,983 269,757 300,502 314,824 336,938
140,562 147,855 159,477 172,406 203,521 227,721 256,360 259,523 263,222
52,576 54,723 58,842 64,749 71,632 75,766 84,259 85,892 88,517
24,865 25,789 27,252 29,760 33,584 35,896 43,112 44,970 45,813
158,123 158,421 156,846 163,422 188,348 206,089 226,244 238,936 245,983
36,592 40,050 44,021 48,201 52,661 55,533 63,950 69,081 71,511
864 679 754 780 937 1,059 1,219 1,167 1,135
a.
New York
Boston
Totals include applications taken under the abbreviated application process, which was used from 1987 to 1999.
SOURCE: Social Security Administration, Supplemental Security Record (Characteristic Extract Record format), 100 percent data.
SSA administrative region
Unknown
Seattle
San Francisco
Denver
Kansas City
Dallas
Chicago
Atlanta
Philadelphia
Noncitizen
Citizen
40–49
30–39
22–29
CONTACT: Clark Pickett (410) 965-9016 or [email protected].
Characteristic
Age
18–21
Sex
Women
Men
Citizenship status
60–64
50–59

8/14/2019 Social Security: ssi asr06
http://slidepdf.com/reader/full/social-security-ssi-asr06 88/129
Applications
80 ♦ SSI Annual Statistical Report, 2006
Table 34.Applications for adults aged 65 or older, by selected characteristics, 1998–2006
1998 1999 2000 2001 2002 2003 2004 2005 2006
Total a 150,155 157,616 159,231 161,064 180,029 178,856 188,857 236,489 265,477
82,165 86,379 87,055 88,070 96,288 96,301 100,905 123,000 143,383
29,607 31,225 32,288 33,179 38,941 38,142 40,849 50,805 54,000
38,383 40,012 39,888 39,815 44,800 44,413 47,103 62,684 68,094
54,668 58,001 59,877 60,772 69,067 69,664 74,377 92,907 107,69595,487 99,615 99,354 100,292 110,962 109,192 114,480 143,582 157,782
101,319 107,201 110,197 110,164 117,383 119,793 126,554 161,489 192,123
48,836 50,415 49,034 50,900 62,646 59,063 62,303 75,000 73,354
6,104 6,226 6,120 5,869 6,053 6,764 7,083 12,694 18,979
20,877 21,620 22,302 23,917 26,697 24,676 26,164 46,708 44,841
11,022 11,830 11,372 10,900 11,102 11,029 11,137 11,876 12,288
30,907 31,633 31,330 31,555 35,529 33,119 34,616 41,269 44,856
11,648 11,877 12,469 12,097 12,414 12,855 13,932 17,491 23,40817,628 19,413 20,067 21,392 22,864 22,919 24,108 26,000 27,266
3,213 3,189 3,420 2,971 2,919 2,854 2,976 3,439 5,077
2,181 2,289 2,744 2,553 2,701 2,831 3,088 3,556 3,961
43,016 45,480 45,402 45,712 55,706 56,935 61,107 67,661 77,219
3,523 4,041 3,991 4,086 4,037 4,867 4,641 5,780 7,569
36 18 14 12 7 7 5 15 13
a. Totals include applications taken under the abbreviated application process, which was used from 1987 to 1999.
SOURCE: Social Security Administration, Supplemental Security Record (Characteristic Extract Record format), 100 percent data.
Kansas City
Dallas
Denver
Unknown
Seattle
San Francisco
Noncitizen
Citizen
65–69
Philadelphia
New York
Boston
Chicago
Atlanta
CONTACT: Clark Pickett (410) 965-9016 or [email protected].
Characteristic
Age
Sex
WomenMen
Citizenship status
75 or older
70–74
SSA administrative region
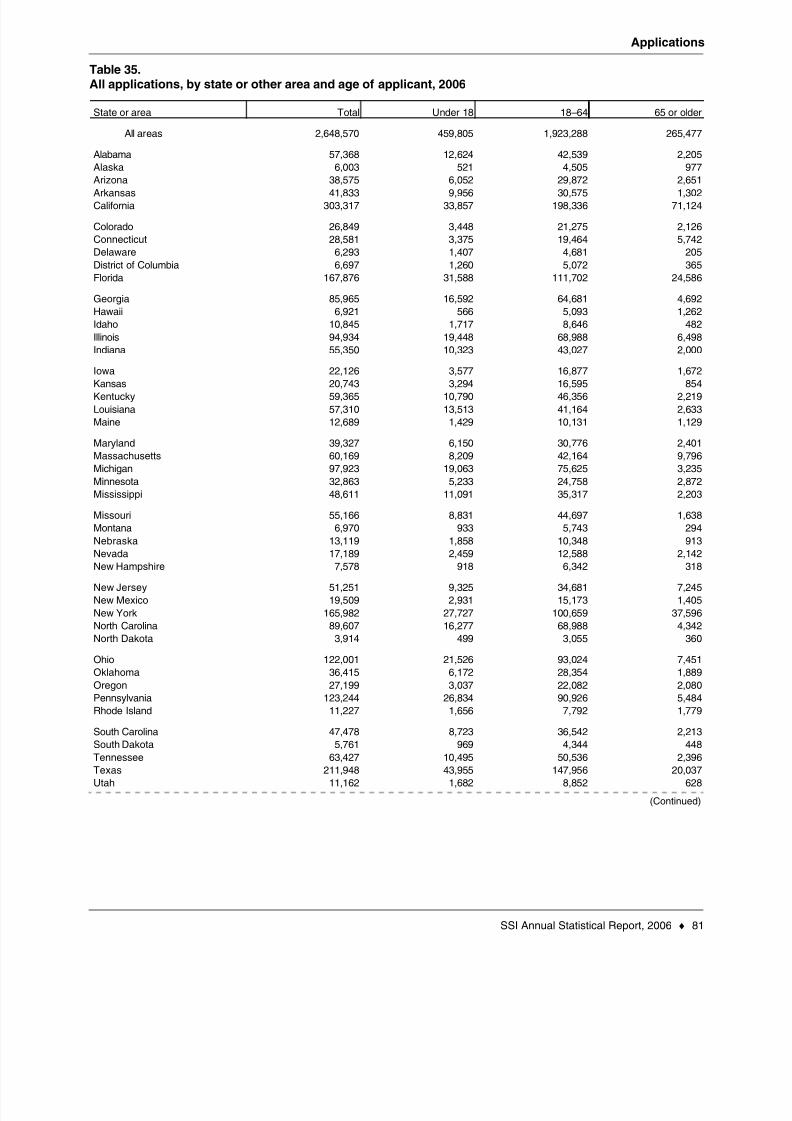
8/14/2019 Social Security: ssi asr06
http://slidepdf.com/reader/full/social-security-ssi-asr06 89/129
Applications
SSI Annual Statistical Report, 2006 ♦ 81
Table 35.All applications, by state or other area and age of applicant, 2006
(Continued)
Total Under 18 18–64 65 or older
All areas 2,648,570 459,805 1,923,288 265,477
57,368 12,624 42,539 2,205
6,003 521 4,505 977
38,575 6,052 29,872 2,651
41,833 9,956 30,575 1,302
303,317 33,857 198,336 71,124
26,849 3,448 21,275 2,126
28,581 3,375 19,464 5,742
6,293 1,407 4,681 205
6,697 1,260 5,072 365
167,876 31,588 111,702 24,586
85,965 16,592 64,681 4,692
6,921 566 5,093 1,262
10,845 1,717 8,646 482
94,934 19,448 68,988 6,498
55,350 10,323 43,027 2,000
22,126 3,577 16,877 1,67220,743 3,294 16,595 854
59,365 10,790 46,356 2,219
57,310 13,513 41,164 2,633
12,689 1,429 10,131 1,129
39,327 6,150 30,776 2,401
60,169 8,209 42,164 9,796
97,923 19,063 75,625 3,235
32,863 5,233 24,758 2,872
48,611 11,091 35,317 2,203
55,166 8,831 44,697 1,638
6,970 933 5,743 294
13,119 1,858 10,348 913
17,189 2,459 12,588 2,1427,578 918 6,342 318
51,251 9,325 34,681 7,245
19,509 2,931 15,173 1,405
165,982 27,727 100,659 37,596
89,607 16,277 68,988 4,342
3,914 499 3,055 360
122,001 21,526 93,024 7,451
36,415 6,172 28,354 1,889
27,199 3,037 22,082 2,080
123,244 26,834 90,926 5,484
11,227 1,656 7,792 1,779
47,478 8,723 36,542 2,213
5,761 969 4,344 44863,427 10,495 50,536 2,396
211,948 43,955 147,956 20,037
11,162 1,682 8,852 628
South Dakota
Texas
Tennessee
Nebraska
Oregon
Utah
Nevada
South Carolina
Rhode Island
Pennsylvania
Kentucky
Montana
Oklahoma
Ohio
North Dakota
North Carolina
New York
New Mexico
New Jersey
New Hampshire
Delaware
Kansas
Missouri
Mississippi
Minnesota
Michigan
Massachusetts
Maryland
Maine
Louisiana
Hawaii
Georgia
Florida
District of Columbia
Iowa
Indiana
Illinois
Idaho
Connecticut
State or area
California
Arkansas
Arizona
Alaska
Alabama
Colorado

8/14/2019 Social Security: ssi asr06
http://slidepdf.com/reader/full/social-security-ssi-asr06 90/129
Applications
82 ♦ SSI Annual Statistical Report, 2006
Table 35.All applications, by state or other area and age of applicant, 2006—Continued
Total Under 18 18–64 65 or older
4,760 695 3,850 215
48,707 9,487 36,063 3,157
46,042 5,734 36,278 4,030
25,073 3,490 20,907 676
40,894 8,026 31,516 1,3522,987 338 2,544 105
215 81 94 40
1,212 64 1,135 13
CONTACT: Clark Pickett (410) 965-9016 or [email protected].
Northern Mariana Islands
Unknown
SOURCE: Social Security Administration, Supplemental Security Record (Characteristic Extract Record format), 100 percent data.
State or area
Outlying area
WyomingWisconsin
West Virginia
Washington
Virginia
Vermont
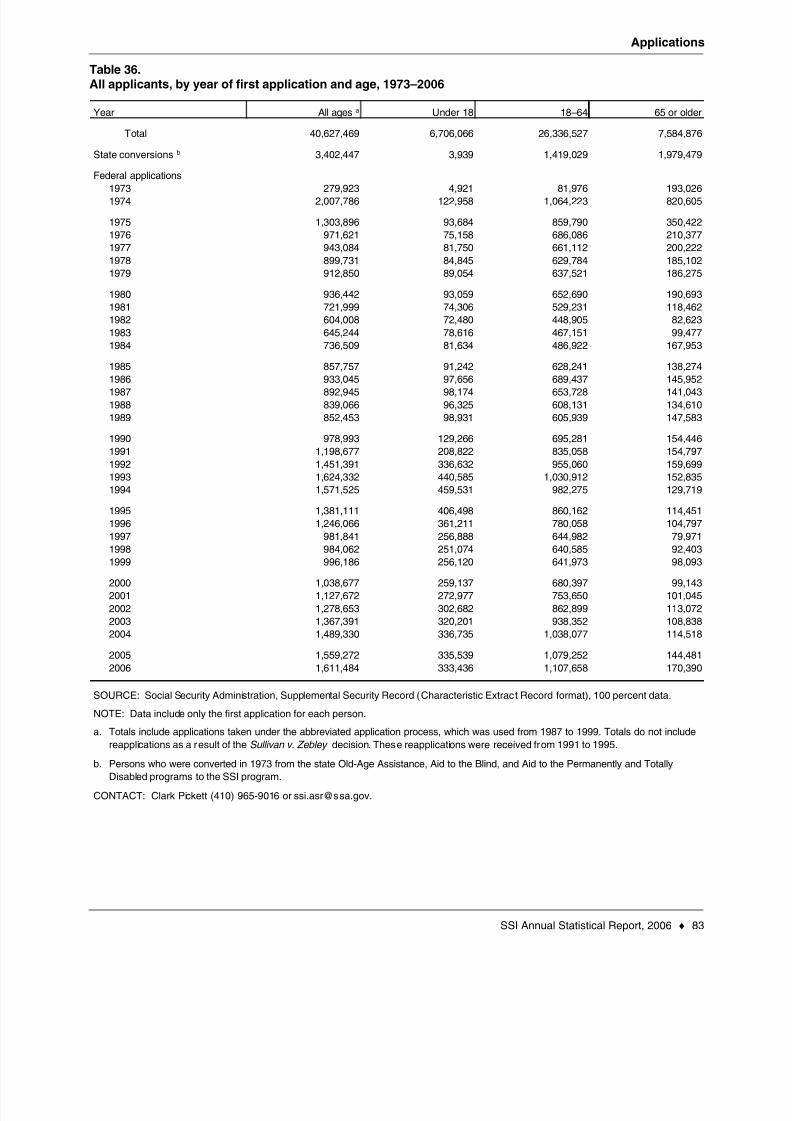
8/14/2019 Social Security: ssi asr06
http://slidepdf.com/reader/full/social-security-ssi-asr06 91/129
Applications
SSI Annual Statistical Report, 2006 ♦ 83
Table 36.All applicants, by year of first application and age, 1973–2006
All ages a Under 18 18–64 65 or older
Total 40,627,469 6,706,066 26,336,527 7,584,876
3,402,447 3,939 1,419,029 1,979,479
279,923 4,921 81,976 193,0262,007,786 122,958 1,064,223 820,605
1,303,896 93,684 859,790 350,422
971,621 75,158 686,086 210,377
943,084 81,750 661,112 200,222
899,731 84,845 629,784 185,102
912,850 89,054 637,521 186,275
936,442 93,059 652,690 190,693
721,999 74,306 529,231 118,462
604,008 72,480 448,905 82,623
645,244 78,616 467,151 99,477
736,509 81,634 486,922 167,953
857,757 91,242 628,241 138,274
933,045 97,656 689,437 145,952
892,945 98,174 653,728 141,043
839,066 96,325 608,131 134,610
852,453 98,931 605,939 147,583
978,993 129,266 695,281 154,446
1,198,677 208,822 835,058 154,797
1,451,391 336,632 955,060 159,699
1,624,332 440,585 1,030,912 152,835
1,571,525 459,531 982,275 129,719
1,381,111 406,498 860,162 114,451
1,246,066 361,211 780,058 104,797
981,841 256,888 644,982 79,971
984,062 251,074 640,585 92,403
996,186 256,120 641,973 98,093
1,038,677 259,137 680,397 99,143
1,127,672 272,977 753,650 101,045
1,278,653 302,682 862,899 113,072
1,367,391 320,201 938,352 108,838
1,489,330 336,735 1,038,077 114,518
1,559,272 335,539 1,079,252 144,481
1,611,484 333,436 1,107,658 170,390
a.
b.
2006
2005
2002
2001
2000
2004
2003
1990
1999
1998
1997
1996
1995
1994
1993
1992
1991
1980
1989
1988
1987
1986
1985
1984
1983
1982
1981
19741973
1979
1978
1977
1976
1975
CONTACT: Clark Pickett (410) 965-9016 or [email protected].
SOURCE: Social Security Administration, Supplemental Security Record (Characteristic Extract Record format), 100 percent data.
Totals include applications taken under the abbreviated application process, which was used from 1987 to 1999. Totals do not include
reapplications as a result of the Sullivan v. Zebley decision. These reapplications were received from 1991 to 1995.
NOTE: Data include only the first application for each person.
Persons who were converted in 1973 from the state Old-Age Assistance, Aid to the Blind, and Aid to the Permanently and Totally
Disabled programs to the SSI program.
Year
Federal applications
State conversions b

8/14/2019 Social Security: ssi asr06
http://slidepdf.com/reader/full/social-security-ssi-asr06 92/129

8/14/2019 Social Security: ssi asr06
http://slidepdf.com/reader/full/social-security-ssi-asr06 93/129
Awards

8/14/2019 Social Security: ssi asr06
http://slidepdf.com/reader/full/social-security-ssi-asr06 94/129

8/14/2019 Social Security: ssi asr06
http://slidepdf.com/reader/full/social-security-ssi-asr06 95/129
Awards
SSI Annual Statistical Report, 2006 ♦ 87
Table 37.All awards, by age of awardee, 1974–2006
All ages Under 18 18–64 65 or older
Total 27,226,940 3,534,700 15,953,361 7,738,879
3,155,995 2,748 1,299,343 1,853,904
1,336,164 66,699 493,511 775,954929,369 63,060 509,271 357,038
667,994 46,114 400,314 221,566
642,712 50,883 377,454 214,375563,117 46,520 321,413 195,184
517,446 44,911 293,910 178,625
523,758 45,781 292,080 185,897
409,992 39,106 248,105 122,781
343,928 35,410 203,335 105,183
453,789 42,154 259,042 152,593
585,832 45,766 322,858 217,208
526,418 46,362 324,933 155,123
603,989 50,632 390,499 162,858
589,053 48,292 372,914 167,847578,748 47,798 362,903 168,047
630,486 50,985 390,703 188,798
718,917 77,923 447,849 193,145
821,396 125,874 506,177 189,345
1,054,441 221,362 641,750 191,329
1,052,415 236,564 629,246 186,605
943,889 203,688 580,253 159,948
888,633 175,784 568,072 144,777
797,137 144,404 525,350 127,383
676,444 117,090 463,444 95,910
743,121 136,383 490,638 116,100
758,076 140,520 494,609 122,947
750,163 144,136 485,798 120,229772,775 156,844 504,366 111,565820,992 170,048 535,507 115,437
827,029 179,566 539,127 108,336
852,052 183,152 561,487 107,413
852,222 177,688 560,960 113,574
838,448 170,453 556,140 111,855
a.
1974
1979
Year
Federal applications
State conversions a
1977
1976
1975
CONTACT: Clark Pickett (410) 965-9016 or [email protected].
SOURCE: Social Security Administration, Supplemental Security Record (Characteristic Extract Record format), 100 percent data.
Persons who were converted in 1973 from the state Old-Age Assistance, Aid to the Blind, and Aid to the Permanently and Totally
Disabled programs to the SSI program.
1983
1986
1985
1984
2000
2004
2003
1982
1981
1978
1993
1992
1991
1980
1989
19881987
1990
1999
1998
1997
1996
1995
1994
2006
2005
2002
2001
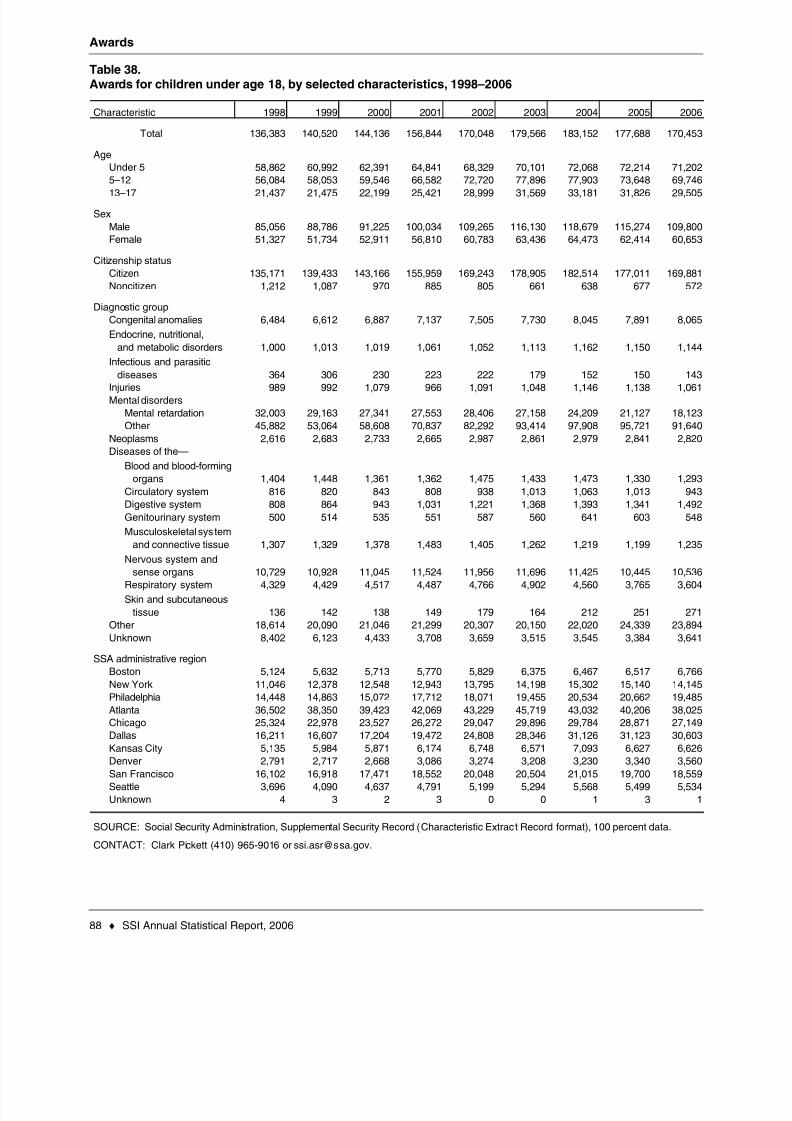
8/14/2019 Social Security: ssi asr06
http://slidepdf.com/reader/full/social-security-ssi-asr06 96/129
Awards
88 ♦ SSI Annual Statistical Report, 2006
Table 38.Awards for children under age 18, by selected characteristics, 1998–2006
1998 1999 2000 2001 2002 2003 2004 2005 2006
Total 136,383 140,520 144,136 156,844 170,048 179,566 183,152 177,688 170,453
58,862 60,992 62,391 64,841 68,329 70,101 72,068 72,214 71,20256,084 58,053 59,546 66,582 72,720 77,896 77,903 73,648 69,746
21,437 21,475 22,199 25,421 28,999 31,569 33,181 31,826 29,505
85,056 88,786 91,225 100,034 109,265 116,130 118,679 115,274 109,80051,327 51,734 52,911 56,810 60,783 63,436 64,473 62,414 60,653
135,171 139,433 143,166 155,959 169,243 178,905 182,514 177,011 169,881
1,212 1,087 970 885 805 661 638 677 572
6,484 6,612 6,887 7,137 7,505 7,730 8,045 7,891 8,065
1,000 1,013 1,019 1,061 1,052 1,113 1,162 1,150 1,144
364 306 230 223 222 179 152 150 143989 992 1,079 966 1,091 1,048 1,146 1,138 1,061
32,003 29,163 27,341 27,553 28,406 27,158 24,209 21,127 18,123
45,882 53,064 58,608 70,837 82,292 93,414 97,908 95,721 91,640
2,616 2,683 2,733 2,665 2,987 2,861 2,979 2,841 2,820
1,404 1,448 1,361 1,362 1,475 1,433 1,473 1,330 1,293
816 820 843 808 938 1,013 1,063 1,013 943
808 864 943 1,031 1,221 1,368 1,393 1,341 1,492
500 514 535 551 587 560 641 603 548
1,307 1,329 1,378 1,483 1,405 1,262 1,219 1,199 1,235
10,729 10,928 11,045 11,524 11,956 11,696 11,425 10,445 10,536
4,329 4,429 4,517 4,487 4,766 4,902 4,560 3,765 3,604
136 142 138 149 179 164 212 251 271
18,614 20,090 21,046 21,299 20,307 20,150 22,020 24,339 23,894
8,402 6,123 4,433 3,708 3,659 3,515 3,545 3,384 3,641
5,124 5,632 5,713 5,770 5,829 6,375 6,467 6,517 6,766
11,046 12,378 12,548 12,943 13,795 14,198 15,302 15,140 14,145
14,448 14,863 15,072 17,712 18,071 19,455 20,534 20,662 19,485
36,502 38,350 39,423 42,069 43,229 45,719 43,032 40,206 38,02525,324 22,978 23,527 26,272 29,047 29,896 29,784 28,871 27,149
16,211 16,607 17,204 19,472 24,808 28,346 31,126 31,123 30,603
5,135 5,984 5,871 6,174 6,748 6,571 7,093 6,627 6,6262,791 2,717 2,668 3,086 3,274 3,208 3,230 3,340 3,560
16,102 16,918 17,471 18,552 20,048 20,504 21,015 19,700 18,559
3,696 4,090 4,637 4,791 5,199 5,294 5,568 5,499 5,534
4 3 2 3 0 0 1 3 1
SOURCE: Social Security Administration, Supplemental Security Record (Characteristic Extract Record format), 100 percent data.
Seattle
San Francisco
CONTACT: Clark Pickett (410) 965-9016 or [email protected].
Unknown
Denver
Male
Citizenship status
Noncitizen
Citizen
Kansas City
Dallas
ChicagoAtlanta
Other
Unknown
SSA administrative region
Philadelphia
New York
Boston
Infectious and parasitic
diseases
Digestive system
Genitourinary system
Musculoskeletal sys tem
and connective tissue
Injuries
Mental disorders
Mental retardation
Other
Female
Diagnostic group
Congenital anomalies
Endocrine, nutritional,
and metabolic disorders
13–17
5–12
Under 5
Sex
Characteristic
Age
Skin and subcutaneous
tissue
Neoplasms
Diseases of the—
Blood and blood-forming
organs
Circulatory system
Nervous system andsense organs
Respiratory system
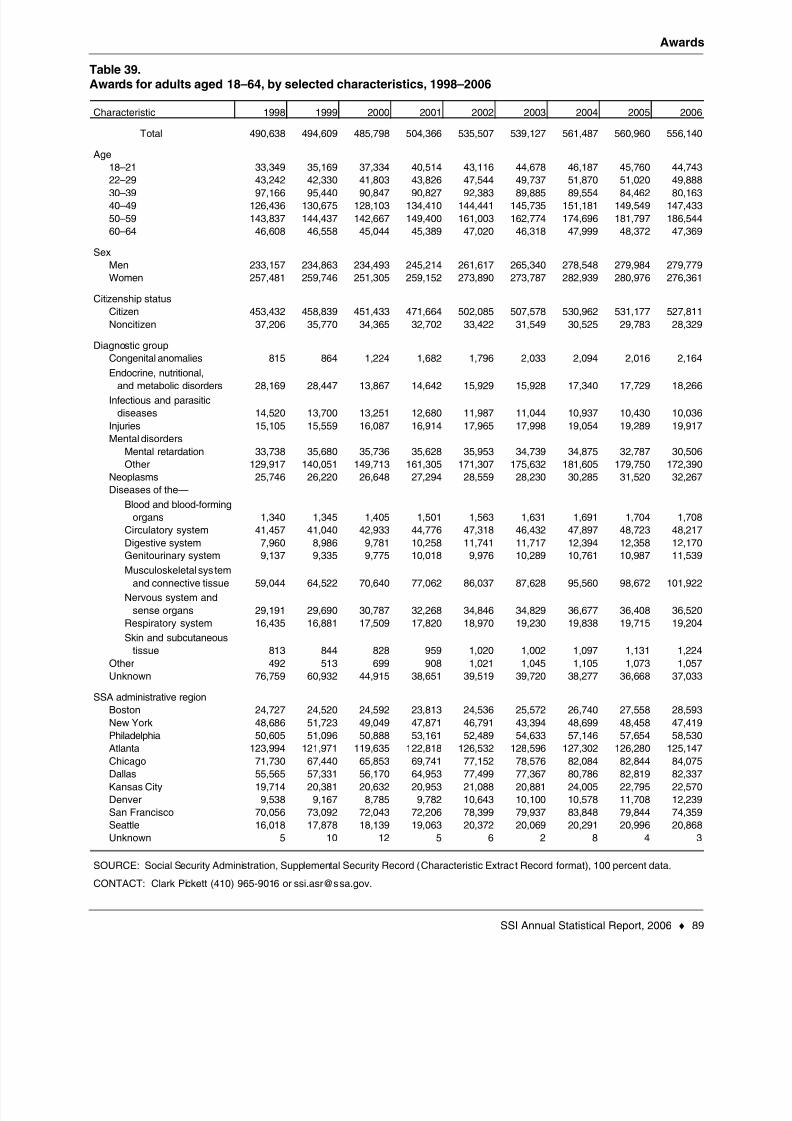
8/14/2019 Social Security: ssi asr06
http://slidepdf.com/reader/full/social-security-ssi-asr06 97/129
Awards
SSI Annual Statistical Report, 2006 ♦ 89
Table 39.Awards for adults aged 18–64, by selected characteristics, 1998–2006
1998 1999 2000 2001 2002 2003 2004 2005 2006
Total 490,638 494,609 485,798 504,366 535,507 539,127 561,487 560,960 556,140
33,349 35,169 37,334 40,514 43,116 44,678 46,187 45,760 44,743
43,242 42,330 41,803 43,826 47,544 49,737 51,870 51,020 49,888
97,166 95,440 90,847 90,827 92,383 89,885 89,554 84,462 80,163
126,436 130,675 128,103 134,410 144,441 145,735 151,181 149,549 147,433
143,837 144,437 142,667 149,400 161,003 162,774 174,696 181,797 186,544
46,608 46,558 45,044 45,389 47,020 46,318 47,999 48,372 47,369
233,157 234,863 234,493 245,214 261,617 265,340 278,548 279,984 279,779
257,481 259,746 251,305 259,152 273,890 273,787 282,939 280,976 276,361
453,432 458,839 451,433 471,664 502,085 507,578 530,962 531,177 527,811
37,206 35,770 34,365 32,702 33,422 31,549 30,525 29,783 28,329
815 864 1,224 1,682 1,796 2,033 2,094 2,016 2,164
28,169 28,447 13,867 14,642 15,929 15,928 17,340 17,729 18,266
14,520 13,700 13,251 12,680 11,987 11,044 10,937 10,430 10,036
15,105 15,559 16,087 16,914 17,965 17,998 19,054 19,289 19,917
33,738 35,680 35,736 35,628 35,953 34,739 34,875 32,787 30,506
129,917 140,051 149,713 161,305 171,307 175,632 181,605 179,750 172,390
25,746 26,220 26,648 27,294 28,559 28,230 30,285 31,520 32,267
1,340 1,345 1,405 1,501 1,563 1,631 1,691 1,704 1,708
41,457 41,040 42,933 44,776 47,318 46,432 47,897 48,723 48,217
7,960 8,986 9,781 10,258 11,741 11,717 12,394 12,358 12,170
9,137 9,335 9,775 10,018 9,976 10,289 10,761 10,987 11,539
59,044 64,522 70,640 77,062 86,037 87,628 95,560 98,672 101,922
29,191 29,690 30,787 32,268 34,846 34,829 36,677 36,408 36,520
16,435 16,881 17,509 17,820 18,970 19,230 19,838 19,715 19,204
813 844 828 959 1,020 1,002 1,097 1,131 1,224
492 513 699 908 1,021 1,045 1,105 1,073 1,057
76,759 60,932 44,915 38,651 39,519 39,720 38,277 36,668 37,033
24,727 24,520 24,592 23,813 24,536 25,572 26,740 27,558 28,593
48,686 51,723 49,049 47,871 46,791 43,394 48,699 48,458 47,419
50,605 51,096 50,888 53,161 52,489 54,633 57,146 57,654 58,530
123,994 121,971 119,635 122,818 126,532 128,596 127,302 126,280 125,14771,730 67,440 65,853 69,741 77,152 78,576 82,084 82,844 84,075
55,565 57,331 56,170 64,953 77,499 77,367 80,786 82,819 82,337
19,714 20,381 20,632 20,953 21,088 20,881 24,005 22,795 22,570
9,538 9,167 8,785 9,782 10,643 10,100 10,578 11,708 12,239
70,056 73,092 72,043 72,206 78,399 79,937 83,848 79,844 74,359
16,018 17,878 18,139 19,063 20,372 20,069 20,291 20,996 20,868
5 10 12 5 6 2 8 4 3
22–29
18–21
Sex
Skin and subcutaneous
tissue
30–39
40–49
60–64
50–59
Neoplasms
Diseases of the—
Characteristic
Age
Women
Diagnostic group
Congenital anomalies
Endocrine, nutritional,and metabolic disorders
Infectious and parasitic
diseases
Digestive system
Genitourinary systemMusculoskeletal sys tem
and connective tissue
Mental disorders
Mental retardation
Other
Blood and blood-forming
organs
Circulatory system
Injuries
Nervous system and
sense organs
Respiratory system
Other
Unknown
CONTACT: Clark Pickett (410) 965-9016 or [email protected].
Denver
Unknown
Men
Citizenship status
Noncitizen
Citizen
Kansas City
Dallas
Chicago
SSA administrative region
Philadelphia
New York
Boston
SOURCE: Social Security Administration, Supplemental Security Record (Characteristic Extract Record format), 100 percent data.
Seattle
San Francisco
Atlanta

8/14/2019 Social Security: ssi asr06
http://slidepdf.com/reader/full/social-security-ssi-asr06 98/129
Awards
90 ♦ SSI Annual Statistical Report, 2006
Table 40.Awards for adults aged 65 or older, by selected characteristics, 1998–2006
1998 1999 2000 2001 2002 2003 2004 2005 2006
Total 116,100 122,947 120,229 111,565 115,437 108,336 107,413 113,574 111,855
34,805 35,284 34,979 32,702 32,787 31,843 31,007 32,142 31,471
29,176 31,981 31,433 29,710 31,284 29,126 28,998 30,659 29,814
21,826 23,860 23,607 21,731 23,148 21,297 21,613 22,993 23,008
14,035 15,241 14,667 13,162 13,630 12,583 12,652 13,703 13,559
16,258 16,581 15,543 14,260 14,588 13,487 13,143 14,077 14,003
40,634 43,532 43,258 40,307 42,254 40,621 40,810 43,220 42,782
75,466 79,415 76,971 71,258 73,183 67,715 66,603 70,354 69,073
81,686 85,686 85,801 80,375 82,032 80,397 81,053 83,704 85,241
34,414 37,261 34,428 31,190 33,405 27,939 26,360 29,870 26,614
4,921 4,980 4,917 4,370 4,126 4,134 4,033 4,225 4,228
16,407 17,367 17,460 16,374 15,638 14,321 14,379 18,060 17,072
8,714 9,513 9,129 8,303 7,898 7,474 7,365 6,941 6,87722,529 22,462 22,191 20,686 22,941 19,664 18,353 21,873 20,354
9,405 9,613 9,291 8,514 8,188 8,050 8,429 8,544 8,868
13,276 14,862 14,428 13,844 14,240 13,238 12,871 12,149 12,064
2,328 2,385 2,497 2,062 1,991 1,868 1,917 1,920 1,961
1,675 1,673 1,914 1,654 1,670 1,726 1,653 1,745 1,761
33,900 36,818 35,175 32,766 35,816 34,429 35,393 35,086 35,676
2,944 3,271 3,223 2,989 2,928 3,430 3,020 3,029 2,993
1 3 4 3 1 2 0 2 1
CONTACT: Clark Pickett (410) 965-9016 or [email protected].
Kansas City
Dallas
Chicago
Seattle
San Francisco
Denver
SOURCE: Social Security Administration, Supplemental Security Record (Characteristic Extract Record format), 100 percent data.
Unknown
Atlanta
Sex
Women
SSA administrative region
Philadelphia
New York
Boston
Men
Citizenship status
Noncitizen
Citizen
70–74
75–79
80 or older
66–69
65
Characteristic
Age

8/14/2019 Social Security: ssi asr06
http://slidepdf.com/reader/full/social-security-ssi-asr06 99/129
Awards
SSI Annual Statistical Report, 2006 ♦ 91
Table 41.All awards, by state or other area and age of awardee, 2006
(Continued)
Total Under 18 18–64 65 or older
All areas 838,448 170,453 556,140 111,855
19,440 3,746 14,590 1,104
1,703 288 1,213 202
12,028 2,705 8,072 1,251
12,703 3,295 8,705 703
107,864 14,456 60,572 32,836
7,632 1,447 5,272 913
6,791 1,121 4,996 674
1,933 533 1,287 113
3,160 690 2,236 234
51,932 10,895 30,236 10,801
23,398 4,693 16,435 2,270
2,943 260 2,021 662
3,606 856 2,496 254
28,051 6,446 18,804 2,801
14,429 3,336 10,439 654
5,517 1,300 3,765 4525,712 1,383 3,970 359
18,595 4,210 13,259 1,126
17,644 4,311 11,975 1,358
3,846 634 3,004 208
12,983 2,626 8,942 1,415
20,843 3,568 14,573 2,702
26,219 5,915 18,524 1,780
10,626 2,185 7,187 1,254
12,420 2,975 8,571 874
16,692 3,299 12,497 896
2,328 446 1,716 166
3,236 644 2,338 254
5,666 1,098 3,661 9072,961 446 2,424 91
18,996 3,657 11,875 3,464
6,940 1,422 4,810 708
59,640 10,488 35,544 13,608
25,795 5,553 18,242 2,000
1,136 220 795 121
29,002 6,322 21,015 1,665
11,783 2,633 8,414 736
7,821 1,487 5,329 1,005
40,275 10,632 26,709 2,934
3,337 649 2,255 433
11,804 2,509 8,438 857
1,663 433 1,029 20120,142 3,444 15,376 1,322
75,934 18,942 48,433 8,559
3,919 862 2,743 314
Oklahoma
New Hampshire
Ohio
Utah
Texas
TennesseeSouth Dakota
South Carolina
Rhode Island
Pennsylvania
Oregon
North Dakota
North Carolina
New York
New Mexico
Nevada
Nebraska
Montana
Illinois
Massachusetts
Missouri
Mississippi
Minnesota
Michigan
Idaho
Hawaii
Maryland
California
Arkansas
Arizona
Florida
District of Columbia
Delaware
Connecticut
Colorado
State or area
Alaska
Alabama
New Jersey
Georgia
Maine
Louisiana
Kentucky
KansasIowa
Indiana
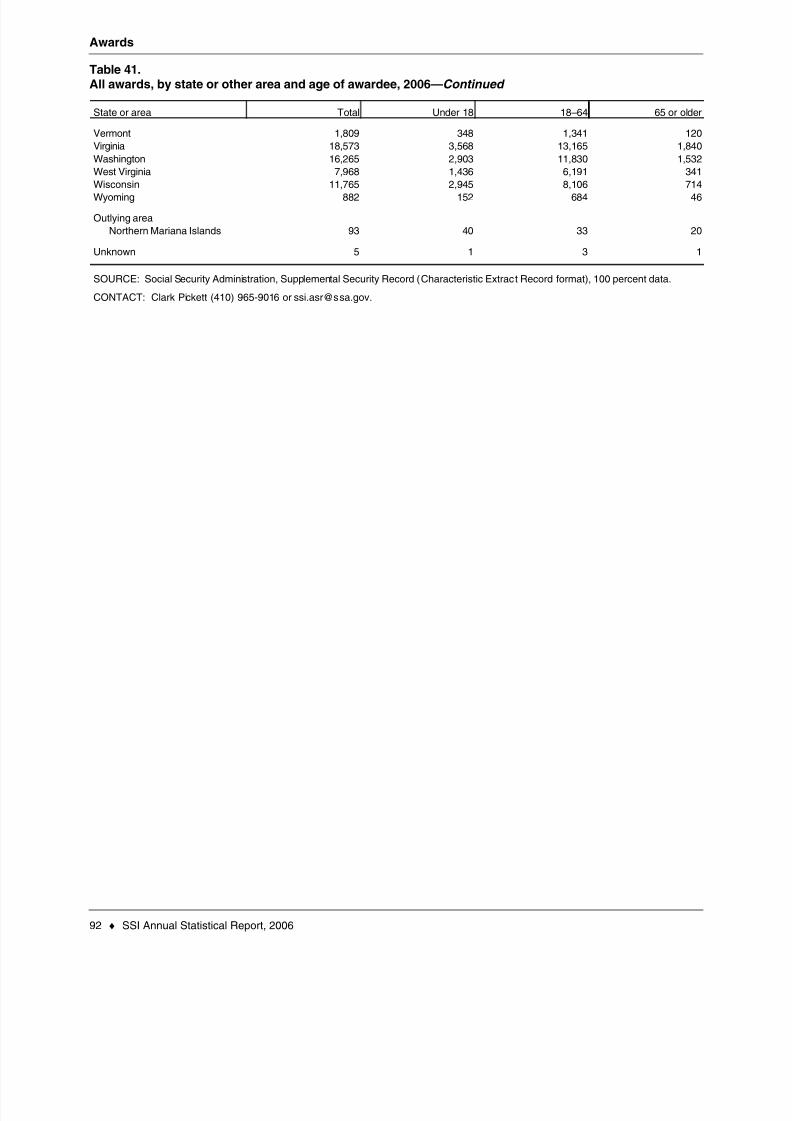
8/14/2019 Social Security: ssi asr06
http://slidepdf.com/reader/full/social-security-ssi-asr06 100/129
Awards
92 ♦ SSI Annual Statistical Report, 2006
Table 41.All awards, by state or other area and age of awardee, 2006—Continued
Total Under 18 18–64 65 or older
1,809 348 1,341 120
18,573 3,568 13,165 1,840
16,265 2,903 11,830 1,532
7,968 1,436 6,191 341
11,765 2,945 8,106 714882 152 684 46
93 40 33 20
5 1 3 1Unknown
Northern Mariana Islands
WyomingWisconsin
Outlying area
West Virginia
Virginia
Vermont
Washington
State or area
CONTACT: Clark Pickett (410) 965-9016 or [email protected].
SOURCE: Social Security Administration, Supplemental Security Record (Characteristic Extract Record format), 100 percent data.

8/14/2019 Social Security: ssi asr06
http://slidepdf.com/reader/full/social-security-ssi-asr06 101/129
Awards
SSI Annual Statistical Report, 2006 ♦ 93
Table 42.All persons awarded SSI, by year of first award and age, 1974–2006
All ages Under 18 18–64 65 or older
Total 24,586,221 3,330,281 14,311,402 6,944,538
3,155,607 2,738 1,299,165 1,853,704
1,324,931 66,062 488,386 770,483916,824 62,545 503,780 350,499
638,206 45,118 385,832 207,256
580,829 47,675 347,409 185,745
494,509 43,348 287,797 163,364
448,824 41,464 259,149 148,211
449,437 42,142 253,629 153,666
348,666 35,365 214,339 98,962
285,142 31,495 172,443 81,204
357,797 37,757 214,397 105,643
481,215 41,506 272,933 166,776
445,951 41,950 279,275 124,726
520,771 45,864 342,655 132,252
508,760 43,918 327,890 136,952501,869 43,596 319,120 139,153
549,240 46,472 344,526 158,242
634,462 72,072 398,648 163,742737,339 118,676 455,676 162,987
966,873 214,273 586,317 166,283
968,268 229,701 576,355 162,212
862,977 197,343 528,799 136,835
810,367 169,897 516,967 123,503723,977 138,753 476,698 108,526
602,946 111,728 411,199 80,019
660,324 129,876 431,784 98,664
667,305 132,280 430,624 104,401
653,066 133,967 417,225 101,874670,146 144,852 430,838 94,456
711,763 157,313 456,779 97,671
713,787 166,188 457,638 89,961
734,909 169,985 476,287 88,637
735,530 165,380 475,538 94,612
723,604 158,982 471,305 93,317
a.
NOTE: Data include only the first award for each person.
2002
20012000
2004
2003
2005
2006
1990
1999
1998
1997
19961995
1994
1993
1992
1991
1980
1989
19881987
1986
1985
1984
1983
1982
1981
1978
1977
1976
1975
CONTACT: Clark Pickett (410) 965-9016 or [email protected].
SOURCE: Social Security Administration, Supplemental Security Record (Characteristic Extract Record format), 100 percent data.
Persons who were converted in 1973 from the state Old-Age Assistance, Aid to the Blind, and Aid to the Permanently and Totally
Disabled programs to the SSI program.
Year
Federal applications
State conversions a
1974
1979

8/14/2019 Social Security: ssi asr06
http://slidepdf.com/reader/full/social-security-ssi-asr06 102/129

8/14/2019 Social Security: ssi asr06
http://slidepdf.com/reader/full/social-security-ssi-asr06 103/129
Outcomes of Applications
for Disability Benefits

8/14/2019 Social Security: ssi asr06
http://slidepdf.com/reader/full/social-security-ssi-asr06 104/129
Notes
The tables in this section provide data on the outcomes of applications for SSI benefits based on blindness or dis-ability. The data on applications are derived from the Social Security Administration's (SSA's) Disability ResearchFile (DRF) maintained by the Office of Disability Programs. Each year the DRF is updated with information aboutapplications for disability benefits that is then used to determine the outcome of those applications. The outcomedata in these tables are reported by year of filing and include decisions made through the administrative appealsprocess.
Table 43 shows the total number of applications filed in a year, the number that are pending a final decision, thenumber denied for nonmedical reasons before a medical decision is made (technical denials), the outcome ofapplications for which a medical allowance or denial was made, and award and allowance rates. Applications forwhich a medical allowance or denial decision was made but which were subsequently denied for nonmedical rea-sons are shown under the medical decision header as subsequent denials. The most common nonmedical reasonfor denying a claim is excess income.
The allowance rate is calculated by dividing the number of medical allowances (including subsequent technicaldenials) by the total number of medical decisions made for a 1-year cohort. The award rate is a broader programmeasure that is calculated as the number of allowances minus subsequent denials divided by total applications(minus pending claims) filed for a given year.
Claims that remain pending after 6 years are probably the result of imperfect data rather than excessive delaysin the decisionmaking process. It is highly probable that decisions have been rendered on most of the older claims.For more recent years, the award and allowance rates will change as decisions are made on pending claims.
Tables 44–46 show the allowance rate for SSI only and the SSI portion of concurrent (a claim for both SocialSecurity and SSI disability benefits) applications, one for each level in the administrative decisionmaking process,that is, initial, reconsideration, and hearing or higher level.
Beginning with fiscal year 2000, the proportion of claims awarded at each level of the process changed as aresult of the Prototype Process being tested in 10 states. Under this test, the reconsideration step of the appealsprocess was eliminated for applications filed October 1, 1999, or later. Elimination of the reconsideration level inthese states results in a decrease in the aggregate proportion of claims awarded at this step.
This section also includes one table that shows the reason for medical allowance and one that shows reasonfor medical denial (Tables 47 and 48). The reasons are derived from the sequential evaluation process used bydecisionmakers. SSA maintains a list of impairments that are considered disabling under its regulations. An appli-cant can be found to be disabled if he or she
• has a listed impairment,
• has a severe impairment that is equal to a listed impairment,
• has a severe impairment when medical and vocational factors are considered, or
• had previously established entitlement to a disability benefit.
An applicant can be denied benefits if he or she
• has an impairment that is not expected to last 12 months;
• has an impairment that is not considered severe;
• is able to perform his or her usual type of work;
• is able to perform another type of work; or
• provides insufficient medical evidence, fails to cooperate, fails to follow prescribed treatment, does not want tocontinue development of the claim, or returns to substantial work before disability can be established.
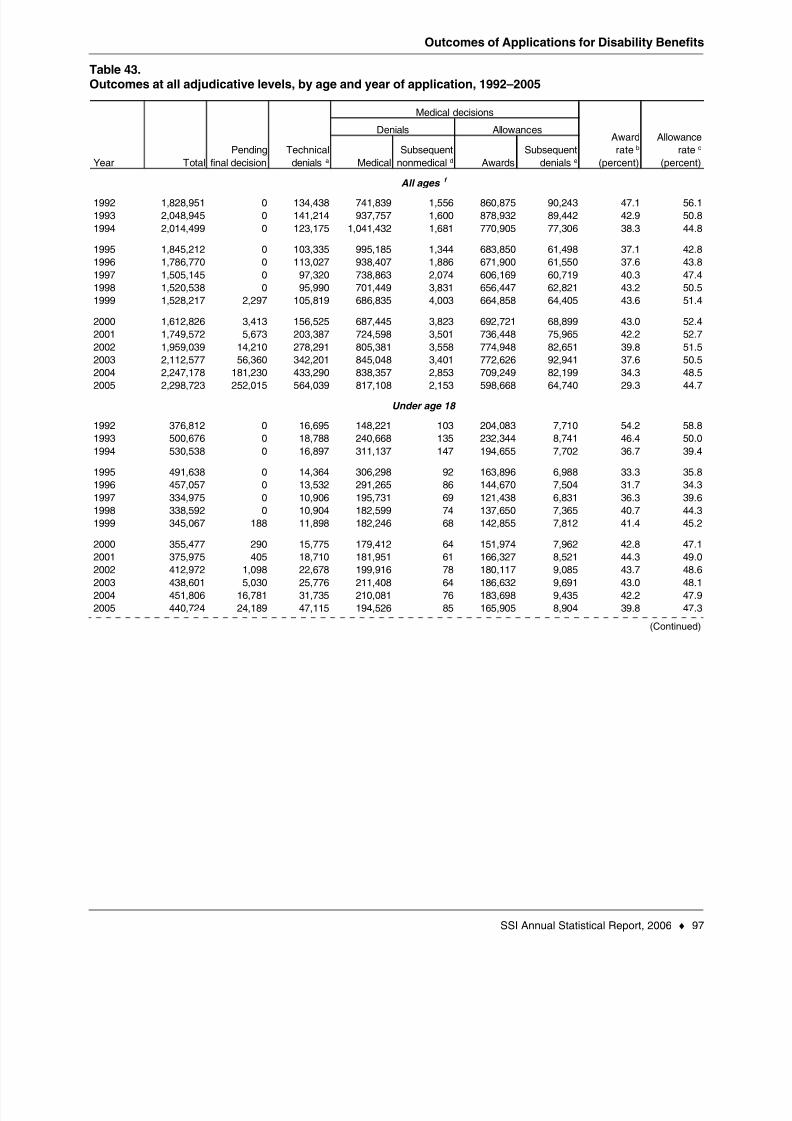
8/14/2019 Social Security: ssi asr06
http://slidepdf.com/reader/full/social-security-ssi-asr06 105/129
Outcomes of Applications for Disability Benefits
SSI Annual Statistical Report, 2006 ♦ 97
Table 43.Outcomes at all adjudicative levels, by age and year of application, 1992–2005
(Continued)
Medical
Subsequent
nonmedical d Awards
Subsequent
denials e
1,828,951 0 134,438 741,839 1,556 860,875 90,243 47.1 56.1
2,048,945 0 141,214 937,757 1,600 878,932 89,442 42.9 50.8
2,014,499 0 123,175 1,041,432 1,681 770,905 77,306 38.3 44.8
1,845,212 0 103,335 995,185 1,344 683,850 61,498 37.1 42.8
1,786,770 0 113,027 938,407 1,886 671,900 61,550 37.6 43.8
1,505,145 0 97,320 738,863 2,074 606,169 60,719 40.3 47.4
1,520,538 0 95,990 701,449 3,831 656,447 62,821 43.2 50.5
1,528,217 2,297 105,819 686,835 4,003 664,858 64,405 43.6 51.4
1,612,826 3,413 156,525 687,445 3,823 692,721 68,899 43.0 52.4
1,749,572 5,673 203,387 724,598 3,501 736,448 75,965 42.2 52.7
1,959,039 14,210 278,291 805,381 3,558 774,948 82,651 39.8 51.5
2,112,577 56,360 342,201 845,048 3,401 772,626 92,941 37.6 50.5
2,247,178 181,230 433,290 838,357 2,853 709,249 82,199 34.3 48.52,298,723 252,015 564,039 817,108 2,153 598,668 64,740 29.3 44.7
376,812 0 16,695 148,221 103 204,083 7,710 54.2 58.8
500,676 0 18,788 240,668 135 232,344 8,741 46.4 50.0
530,538 0 16,897 311,137 147 194,655 7,702 36.7 39.4
491,638 0 14,364 306,298 92 163,896 6,988 33.3 35.8
457,057 0 13,532 291,265 86 144,670 7,504 31.7 34.3
334,975 0 10,906 195,731 69 121,438 6,831 36.3 39.6
338,592 0 10,904 182,599 74 137,650 7,365 40.7 44.3
345,067 188 11,898 182,246 68 142,855 7,812 41.4 45.2
355,477 290 15,775 179,412 64 151,974 7,962 42.8 47.1
375,975 405 18,710 181,951 61 166,327 8,521 44.3 49.0412,972 1,098 22,678 199,916 78 180,117 9,085 43.7 48.6
438,601 5,030 25,776 211,408 64 186,632 9,691 43.0 48.1
451,806 16,781 31,735 210,081 76 183,698 9,435 42.2 47.9
440,724 24,189 47,115 194,526 85 165,905 8,904 39.8 47.3
1995
1994
1998
2005
1993
1992
2005
1996
1996
1995
1994
2000
2003
2001
2002
2002
2004
Year Total
Pending
final decision
Technical
denials a
1999
1998
1997
2004
Under age 18
2003
2001
1997
1999
2000
1993
1992
Award
rate b
(percent)
Denials Allowances
All ages f
Allowance
rate c
(percent)
Medical decisions
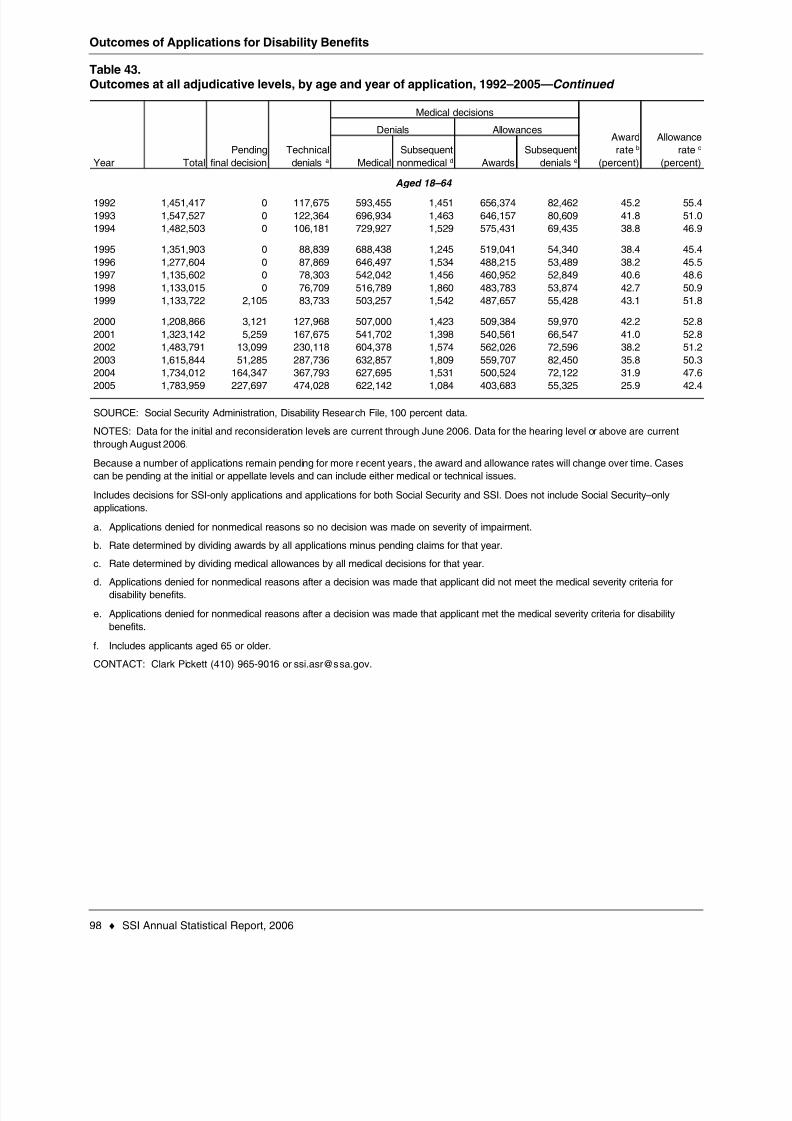
8/14/2019 Social Security: ssi asr06
http://slidepdf.com/reader/full/social-security-ssi-asr06 106/129
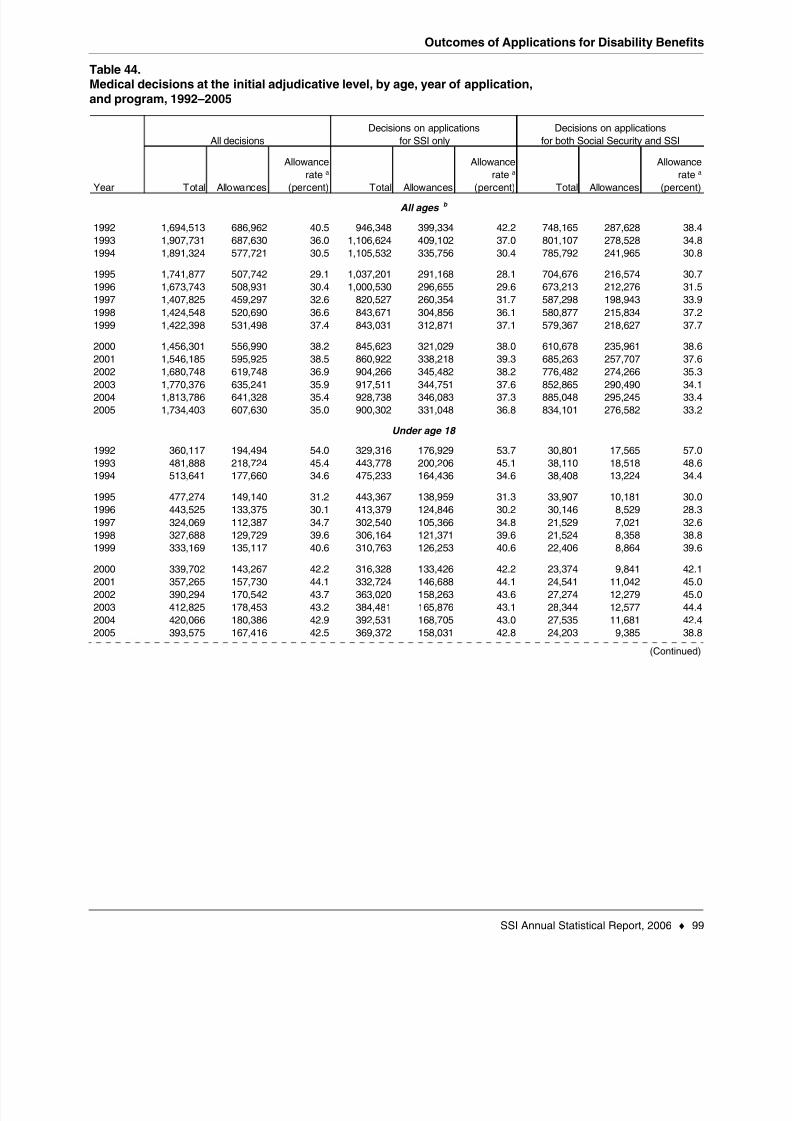
8/14/2019 Social Security: ssi asr06
http://slidepdf.com/reader/full/social-security-ssi-asr06 107/129
Outcomes of Applications for Disability Benefits
SSI Annual Statistical Report, 2006 ♦ 99
Table 44.Medical decisions at the initial adjudicative level, by age, year of application,
and program, 1992–2005
(Continued)
Total Allowances
Allowance
rate a
(percent) Total Allowances
Allowance
rate a
(percent) Total Allowances
Allowance
rate a
(percent)
1,694,513 686,962 40.5 946,348 399,334 42.2 748,165 287,628 38.4
1,907,731 687,630 36.0 1,106,624 409,102 37.0 801,107 278,528 34.8
1,891,324 577,721 30.5 1,105,532 335,756 30.4 785,792 241,965 30.8
1,741,877 507,742 29.1 1,037,201 291,168 28.1 704,676 216,574 30.7
1,673,743 508,931 30.4 1,000,530 296,655 29.6 673,213 212,276 31.5
1,407,825 459,297 32.6 820,527 260,354 31.7 587,298 198,943 33.9
1,424,548 520,690 36.6 843,671 304,856 36.1 580,877 215,834 37.2
1,422,398 531,498 37.4 843,031 312,871 37.1 579,367 218,627 37.7
1,456,301 556,990 38.2 845,623 321,029 38.0 610,678 235,961 38.6
1,546,185 595,925 38.5 860,922 338,218 39.3 685,263 257,707 37.6
1,680,748 619,748 36.9 904,266 345,482 38.2 776,482 274,266 35.31,770,376 635,241 35.9 917,511 344,751 37.6 852,865 290,490 34.11,813,786 641,328 35.4 928,738 346,083 37.3 885,048 295,245 33.4
1,734,403 607,630 35.0 900,302 331,048 36.8 834,101 276,582 33.2
360,117 194,494 54.0 329,316 176,929 53.7 30,801 17,565 57.0
481,888 218,724 45.4 443,778 200,206 45.1 38,110 18,518 48.6513,641 177,660 34.6 475,233 164,436 34.6 38,408 13,224 34.4
477,274 149,140 31.2 443,367 138,959 31.3 33,907 10,181 30.0
443,525 133,375 30.1 413,379 124,846 30.2 30,146 8,529 28.3
324,069 112,387 34.7 302,540 105,366 34.8 21,529 7,021 32.6327,688 129,729 39.6 306,164 121,371 39.6 21,524 8,358 38.8
333,169 135,117 40.6 310,763 126,253 40.6 22,406 8,864 39.6
339,702 143,267 42.2 316,328 133,426 42.2 23,374 9,841 42.1
357,265 157,730 44.1 332,724 146,688 44.1 24,541 11,042 45.0
390,294 170,542 43.7 363,020 158,263 43.6 27,274 12,279 45.0
412,825 178,453 43.2 384,481 165,876 43.1 28,344 12,577 44.4
420,066 180,386 42.9 392,531 168,705 43.0 27,535 11,681 42.4
393,575 167,416 42.5 369,372 158,031 42.8 24,203 9,385 38.8
Under age 18
2002
1993
1992
2002
1996
2003
2001
1997
2000
2000
2005
1999
1998
2004
1997
1996
1995
1994
2005
1999
All decisions
1998
2004
All ages b
Year
2003
2001
1995
1994
Decisions on applications
for both Social Security and SSI
1993
1992
Decisions on applications
for SSI only

8/14/2019 Social Security: ssi asr06
http://slidepdf.com/reader/full/social-security-ssi-asr06 108/129
Outcomes of Applications for Disability Benefits
100 ♦ SSI Annual Statistical Report, 2006
Table 44.Medical decisions at the initial adjudicative level, by age, year of application,
and program, 1992–2005—Continued
Total Allowances
Allowance
rate a
(percent) Total Allowances
Allowance
rate a
(percent) Total Allowances
Allowance
rate a
(percent)
1,333,742 492,046 36.9 616,523 222,077 36.0 717,219 269,969 37.6
1,425,163 468,477 32.9 662,298 208,554 31.5 762,865 259,923 34.1
1,376,322 399,267 29.0 629,051 170,618 27.1 747,271 228,649 30.6
1,263,064 357,732 28.3 592,390 151,417 25.6 670,674 206,315 30.8
1,189,735 338,209 28.4 555,158 142,505 25.7 634,577 195,704 30.8
1,057,299 324,213 30.7 498,637 139,003 27.9 558,662 185,210 33.2
1,056,306 356,592 33.8 506,024 157,861 31.2 550,282 198,731 36.1
1,049,989 362,246 34.5 502,870 162,036 32.2 547,119 200,210 36.6
1,080,898 382,587 35.4 503,636 166,188 33.0 577,262 216,399 37.5
1,155,467 408,901 35.4 505,101 172,232 34.1 650,366 236,669 36.4
1,253,673 416,823 33.2 515,934 165,906 32.2 737,739 250,917 34.01,328,108 430,707 32.4 515,659 164,504 31.9 812,449 266,203 32.8
1,366,122 436,077 31.9 521,576 165,119 31.7 844,546 270,958 32.11,309,684 411,265 31.4 513,828 157,787 30.7 795,856 253,478 31.8
a.
b.
CONTACT: Clark Pickett (410) 965-9016 or [email protected].
1995
2003
2001
2000
1999
1998
Because a number of applications remain pending for more recent years, the award and allowance rates will change over time.
Applications with a medical decision may be pending a final nonmedical decision or subsequently denied for nonmedical reasons.
NOTES: Data are current through June 2006.
2004
2002
1994
1993
Aged 18–64
SOURCE: Social Security Administration, Disability Research File, 100 percent data.
1996
1997
2005
All decisions
Decisions on applications
for SSI only
Decisions on applications
for both Social Security and SSI
1992
Year
Rate determined by dividing medical allowances by all medical decisions for that year.
Includes applicants aged 65 or older.

8/14/2019 Social Security: ssi asr06
http://slidepdf.com/reader/full/social-security-ssi-asr06 109/129

8/14/2019 Social Security: ssi asr06
http://slidepdf.com/reader/full/social-security-ssi-asr06 110/129
Outcomes of Applications for Disability Benefits
102 ♦ SSI Annual Statistical Report, 2006
Table 45.Medical decisions at the reconsideration level, by age, year of application,
and program, 1992–2005—Continued
Total Allowances
Allowance
rate a
(percent) Total Allowances
Allowance
rate a
(percent) Total Allowances
Allowance
rate a
(percent)
429,944 64,891 15.1 189,409 29,744 15.7 240,535 35,147 14.6
481,434 64,074 13.3 210,882 28,268 13.4 270,552 35,806 13.2
479,439 62,150 13.0 206,253 26,260 12.7 273,186 35,890 13.1
435,988 56,205 12.9 195,281 23,695 12.1 240,707 32,510 13.5
403,309 54,194 13.4 178,404 22,457 12.6 224,905 31,737 14.1
355,514 52,588 14.8 159,694 22,951 14.4 195,820 29,637 15.1
337,411 51,759 15.3 154,436 23,051 14.9 182,975 28,708 15.7
330,830 47,244 14.3 150,460 20,862 13.9 180,370 26,382 14.6
332,767 44,865 13.5 146,383 18,874 12.9 186,384 25,991 13.9
356,236 45,039 12.6 143,740 17,759 12.4 212,496 27,280 12.8
400,138 46,817 11.7 150,064 17,452 11.6 250,074 29,365 11.7426,628 47,997 11.3 146,276 16,472 11.3 280,352 31,525 11.2
423,706 44,332 10.5 142,158 14,953 10.5 281,548 29,379 10.4
330,689 28,831 8.7 117,786 10,459 8.9 212,903 18,372 8.6
a.
b.
2005
SOURCE: Social Security Administration, Disability Research File, 100 percent data.
Because a number of applications remain pending for more recent years, the award and allowance rates will change over time.
2002
2004
1998
NOTES: Data are current through June 2006.
Applications with a medical decision may be pending a final nonmedical decision or subsequently denied for nonmedical reasons.
1997
1996
1995
1994
CONTACT: Clark Pickett (410) 965-9016 or [email protected].
A revised process was introduced on October 1, 1999, in 10 states, under which initial denials could be appealed directly to the hearing
level without a reconsideration.
2000
1999
Rate determined by dividing medical allowances by all medical decisions for that year.
Includes applicants aged 65 or older.
2003
2001
1993
1992
Aged 18–64
Year
All decisions
Decisions on applications
for SSI only
Decisions on applications
for both Social Security and SSI
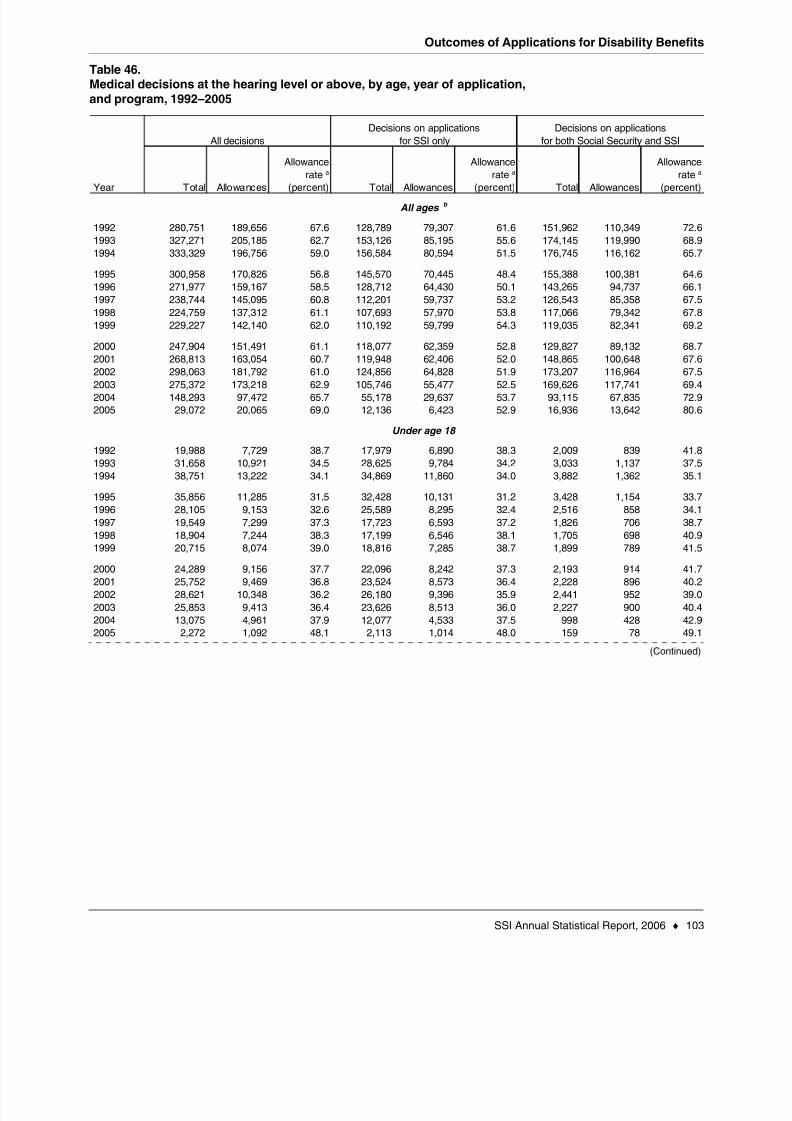
8/14/2019 Social Security: ssi asr06
http://slidepdf.com/reader/full/social-security-ssi-asr06 111/129
Outcomes of Applications for Disability Benefits
SSI Annual Statistical Report, 2006 ♦ 103
Table 46.Medical decisions at the hearing level or above, by age, year of application,
and program, 1992–2005
(Continued)
Total Allowances
Allowance
rate a
(percent) Total Allowances
Allowance
rate a
(percent) Total Allowances
Allowance
rate a
(percent)
280,751 189,656 67.6 128,789 79,307 61.6 151,962 110,349 72.6
327,271 205,185 62.7 153,126 85,195 55.6 174,145 119,990 68.9
333,329 196,756 59.0 156,584 80,594 51.5 176,745 116,162 65.7
300,958 170,826 56.8 145,570 70,445 48.4 155,388 100,381 64.6
271,977 159,167 58.5 128,712 64,430 50.1 143,265 94,737 66.1
238,744 145,095 60.8 112,201 59,737 53.2 126,543 85,358 67.5
224,759 137,312 61.1 107,693 57,970 53.8 117,066 79,342 67.8
229,227 142,140 62.0 110,192 59,799 54.3 119,035 82,341 69.2
247,904 151,491 61.1 118,077 62,359 52.8 129,827 89,132 68.7
268,813 163,054 60.7 119,948 62,406 52.0 148,865 100,648 67.6
298,063 181,792 61.0 124,856 64,828 51.9 173,207 116,964 67.5275,372 173,218 62.9 105,746 55,477 52.5 169,626 117,741 69.4
148,293 97,472 65.7 55,178 29,637 53.7 93,115 67,835 72.929,072 20,065 69.0 12,136 6,423 52.9 16,936 13,642 80.6
19,988 7,729 38.7 17,979 6,890 38.3 2,009 839 41.8
31,658 10,921 34.5 28,625 9,784 34.2 3,033 1,137 37.5
38,751 13,222 34.1 34,869 11,860 34.0 3,882 1,362 35.1
35,856 11,285 31.5 32,428 10,131 31.2 3,428 1,154 33.7
28,105 9,153 32.6 25,589 8,295 32.4 2,516 858 34.1
19,549 7,299 37.3 17,723 6,593 37.2 1,826 706 38.7
18,904 7,244 38.3 17,199 6,546 38.1 1,705 698 40.9
20,715 8,074 39.0 18,816 7,285 38.7 1,899 789 41.5
24,289 9,156 37.7 22,096 8,242 37.3 2,193 914 41.7
25,752 9,469 36.8 23,524 8,573 36.4 2,228 896 40.2
28,621 10,348 36.2 26,180 9,396 35.9 2,441 952 39.0
25,853 9,413 36.4 23,626 8,513 36.0 2,227 900 40.4
13,075 4,961 37.9 12,077 4,533 37.5 998 428 42.92,272 1,092 48.1 2,113 1,014 48.0 159 78 49.1
2000
All ages b
Under age 18
1997
1996
2000
2002
2005
1993
1992
2003
2001
2004
1993
1992
1999
1998
1994
1997
2004
1995
1994
Year
All decisions
Decisions on applications
for SSI only
Decisions on applications
for both Social Security and SSI
1996
1995
19991998
2001
2002
2003
2005

8/14/2019 Social Security: ssi asr06
http://slidepdf.com/reader/full/social-security-ssi-asr06 112/129
Outcomes of Applications for Disability Benefits
104 ♦ SSI Annual Statistical Report, 2006
Table 46.Medical decisions at the hearing level or above, by age, year of application,
and program, 1992–2005—Continued
Total Allowances
Allowance
rate a
(percent) Total Allowances
Allowance
rate a
(percent) Total Allowances
Allowance
rate a
(percent)
260,727 181,899 69.8 110,785 72,398 65.4 149,942 109,501 73.0
295,551 194,215 65.7 124,445 75,368 60.6 171,106 118,847 69.5
294,441 183,449 62.3 121,584 68,654 56.5 172,857 114,795 66.4
264,954 159,444 60.2 113,002 60,224 53.3 151,952 99,220 65.3
243,064 149,301 61.4 102,414 55,516 54.2 140,650 93,785 66.7
218,234 137,000 62.8 93,582 52,402 56.0 124,652 84,598 67.9
204,892 129,306 63.1 89,580 50,706 56.6 115,312 78,600 68.2
207,909 133,595 64.3 90,819 52,083 57.3 117,090 81,512 69.6
223,028 141,902 63.6 95,444 53,725 56.3 127,584 88,177 69.1
242,502 153,168 63.2 95,910 53,448 55.7 146,592 99,720 68.0
268,771 170,982 63.6 98,051 55,003 56.1 170,720 115,979 67.9249,014 163,453 65.6 81,676 46,662 57.1 167,338 116,791 69.8
134,887 92,237 68.4 42,804 24,858 58.1 92,083 67,379 73.2
26,727 18,912 70.8 9,965 5,363 53.8 16,762 13,549 80.8
a.
b.
2005
SOURCE: Social Security Administration, Disability Research File, 100 percent data.
Because a number of applications remain pending for more recent years, the award and allowance rates will change over time.
2002
2004
1998
NOTES: Data are current through August 2006.
Applications with a medical decision may be pending a final nonmedical decision or subsequently denied for nonmedical reasons.
1997
1996
1995
1994
CONTACT: Clark Pickett (410) 965-9016 or [email protected].
A revised process was introduced on October 1, 1999, in 10 states, under which initial denials could be appealed directly to the hearing
level without a reconsideration.
2000
1999
Rate determined by dividing medical allowances by all medical decisions for that year.
Includes applicants aged 65 or older.
2003
2001
1993
1992
Aged 18–64
Year
All decisions
Decisions on applications
for SSI only
Decisions on applications
for both Social Security and SSI
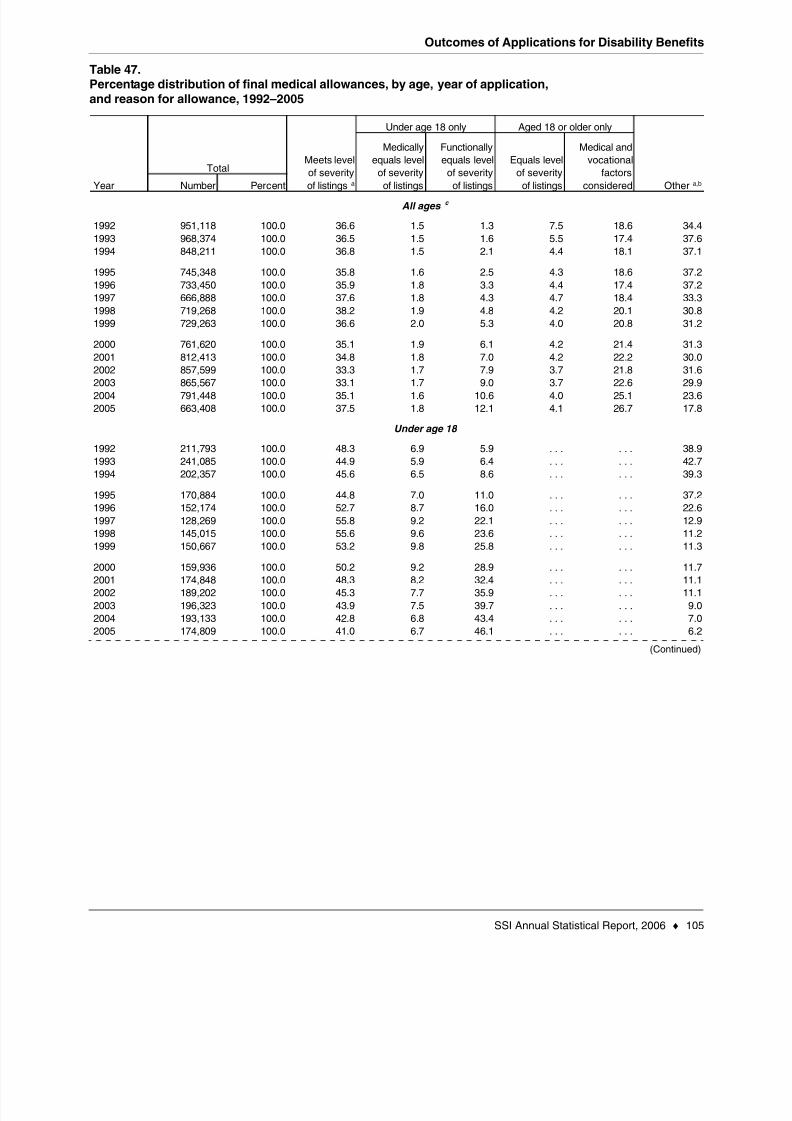
8/14/2019 Social Security: ssi asr06
http://slidepdf.com/reader/full/social-security-ssi-asr06 113/129

8/14/2019 Social Security: ssi asr06
http://slidepdf.com/reader/full/social-security-ssi-asr06 114/129
Outcomes of Applications for Disability Benefits
106 ♦ SSI Annual Statistical Report, 2006
Table 47.Percentage distribution of final medical allowances, by age, year of application,
and reason for allowance, 1992–2005—Continued
Number Percent
738,836 100.0 33.3 . . . . . . 9.7 23.9 33.2
726,766 100.0 33.7 . . . . . . 7.3 23.1 35.9
644,866 100.0 34.0 . . . . . . 5.8 23.8 36.4
573,381 100.0 33.2 . . . . . . 5.6 24.0 37.2
541,704 100.0 33.7 . . . . . . 5.9 23.3 37.1
513,801 100.0 34.5 . . . . . . 6.1 22.6 36.9
537,657 100.0 35.6 . . . . . . 5.5 23.9 35.1
543,085 100.0 34.0 . . . . . . 5.3 25.1 35.6
569,354 100.0 32.6 . . . . . . 5.6 26.4 35.5
607,108 100.0 32.5 . . . . . . 5.6 27.8 34.2
634,622 100.0 31.3 . . . . . . 5.0 27.6 36.1642,157 100.0 31.1 . . . . . . 5.0 29.1 34.8
572,646 100.0 33.9 . . . . . . 5.5 33.6 27.0
459,008 100.0 38.5 . . . . . . 5.9 37.4 18.1
a.
b.
c.
. . . = not applicable.
2004
1997
1996
1995
Includes decisions for SSI-only applications and applications for both Social Security and SSI. Does not include Social Security–only
applications.
CONTACT: Clark Pickett (410) 965-9016 or [email protected].
Includes applications for which the disability was previously established and those for which the basis for the determination is not
available. For final determinations made in or before August 1996 for applicants under age 18, also includes applications allowed
because individual functional assessment showed impairment of comparable severity.
Includes all age groups.
Includes applicants aged 65 or older.
20032002
2001
2000
1999
SOURCE: Social Security Administration, Disability Research File, 100 percent data.
Because a number of applications remain pending for more recent years, the numbers and percentages will change over time.
1998
2005
NOTES: Data for the initial and reconsideration levels are current through June 2006. Data for the hearing level or above are current
through August 2006.
Aged 18–64
TotalMeets level
of severity
of listings a
Under age 18 only
Applications with a medical decision may be pending a final nonmedical decision or subsequently denied for nonmedical reasons.
1994
1993
1992
Year
Aged 18 or older only
Other a,b
Medically
equals level
of severity
of listings
Functionally
equals level
of severity
of listings
Equals level
of severity
of listings
Medical and
vocational
factors
considered
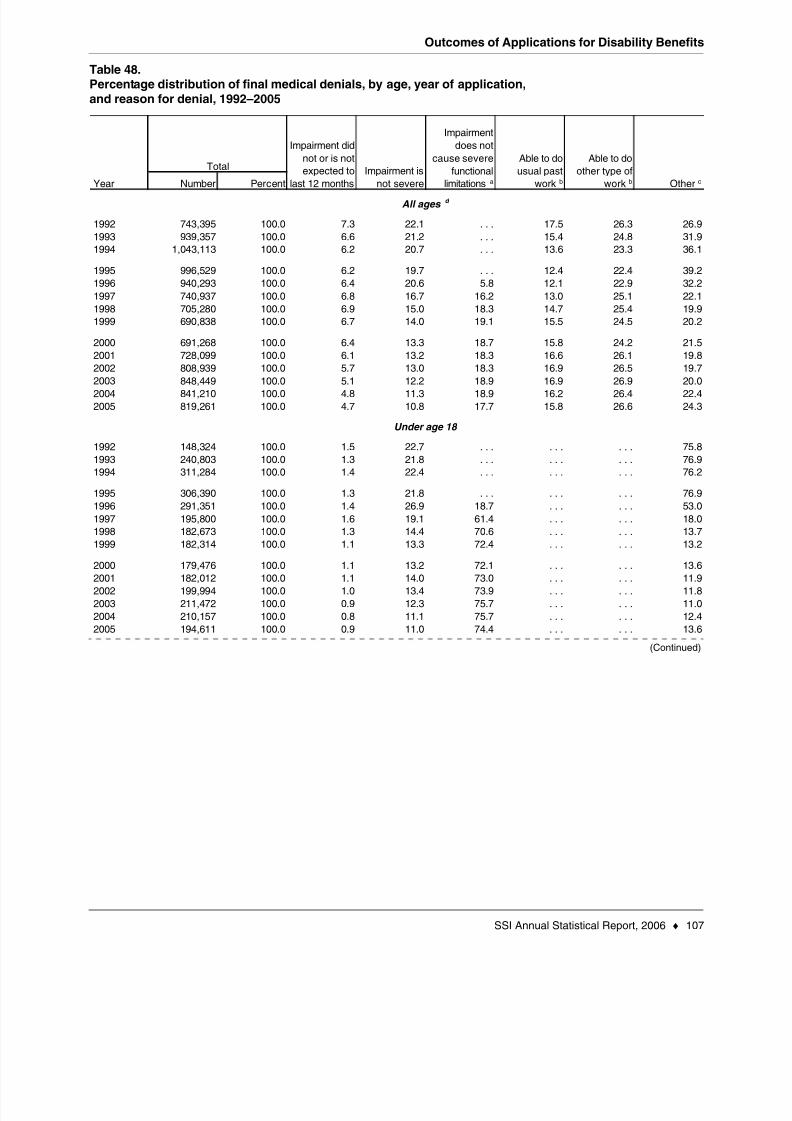
8/14/2019 Social Security: ssi asr06
http://slidepdf.com/reader/full/social-security-ssi-asr06 115/129
Outcomes of Applications for Disability Benefits
SSI Annual Statistical Report, 2006 ♦ 107
Table 48.Percentage distribution of final medical denials, by age, year of application,
and reason for denial, 1992–2005
(Continued)
Number Percent
743,395 100.0 7.3 22.1 . . . 17.5 26.3 26.9
939,357 100.0 6.6 21.2 . . . 15.4 24.8 31.91,043,113 100.0 6.2 20.7 . . . 13.6 23.3 36.1
996,529 100.0 6.2 19.7 . . . 12.4 22.4 39.2
940,293 100.0 6.4 20.6 5.8 12.1 22.9 32.2
740,937 100.0 6.8 16.7 16.2 13.0 25.1 22.1
705,280 100.0 6.9 15.0 18.3 14.7 25.4 19.9690,838 100.0 6.7 14.0 19.1 15.5 24.5 20.2
691,268 100.0 6.4 13.3 18.7 15.8 24.2 21.5
728,099 100.0 6.1 13.2 18.3 16.6 26.1 19.8
808,939 100.0 5.7 13.0 18.3 16.9 26.5 19.7848,449 100.0 5.1 12.2 18.9 16.9 26.9 20.0841,210 100.0 4.8 11.3 18.9 16.2 26.4 22.4
819,261 100.0 4.7 10.8 17.7 15.8 26.6 24.3
148,324 100.0 1.5 22.7 . . . . . . . . . 75.8
240,803 100.0 1.3 21.8 . . . . . . . . . 76.9311,284 100.0 1.4 22.4 . . . . . . . . . 76.2
306,390 100.0 1.3 21.8 . . . . . . . . . 76.9
291,351 100.0 1.4 26.9 18.7 . . . . . . 53.0
195,800 100.0 1.6 19.1 61.4 . . . . . . 18.0182,673 100.0 1.3 14.4 70.6 . . . . . . 13.7
182,314 100.0 1.1 13.3 72.4 . . . . . . 13.2
179,476 100.0 1.1 13.2 72.1 . . . . . . 13.6
182,012 100.0 1.1 14.0 73.0 . . . . . . 11.9
199,994 100.0 1.0 13.4 73.9 . . . . . . 11.8
211,472 100.0 0.9 12.3 75.7 . . . . . . 11.0
210,157 100.0 0.8 11.1 75.7 . . . . . . 12.4
194,611 100.0 0.9 11.0 74.4 . . . . . . 13.62005
2000
2003
1993
2002
2004
19981997
2001
2002
Under age 18
1992
2003
2004
2005
1993
1992
All ages d
Year
Total
2000
Impairment did
not or is notexpected to
last 12 months
Impairment is
not severe
Impairment
does not
cause severe
functional
limitationsa
Able to do
usual past
workb
Able to do
other type of
workb
Otherc
1996
2001
1994
1996
1995
1995
1994
19991998
1997
1999
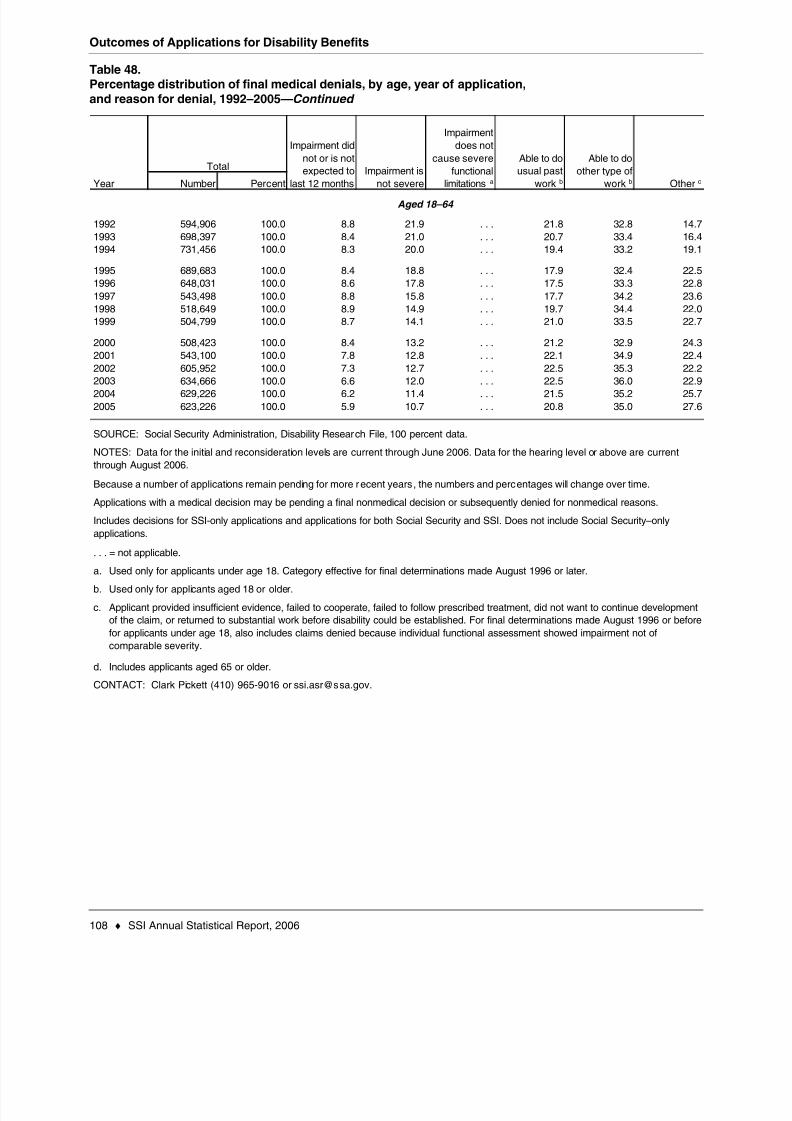
8/14/2019 Social Security: ssi asr06
http://slidepdf.com/reader/full/social-security-ssi-asr06 116/129
Outcomes of Applications for Disability Benefits
108 ♦ SSI Annual Statistical Report, 2006
Table 48.Percentage distribution of final medical denials, by age, year of application,
and reason for denial, 1992–2005—Continued
Number Percent
594,906 100.0 8.8 21.9 . . . 21.8 32.8 14.7
698,397 100.0 8.4 21.0 . . . 20.7 33.4 16.4731,456 100.0 8.3 20.0 . . . 19.4 33.2 19.1
689,683 100.0 8.4 18.8 . . . 17.9 32.4 22.5
648,031 100.0 8.6 17.8 . . . 17.5 33.3 22.8
543,498 100.0 8.8 15.8 . . . 17.7 34.2 23.6
518,649 100.0 8.9 14.9 . . . 19.7 34.4 22.0504,799 100.0 8.7 14.1 . . . 21.0 33.5 22.7
508,423 100.0 8.4 13.2 . . . 21.2 32.9 24.3
543,100 100.0 7.8 12.8 . . . 22.1 34.9 22.4
605,952 100.0 7.3 12.7 . . . 22.5 35.3 22.2634,666 100.0 6.6 12.0 . . . 22.5 36.0 22.9629,226 100.0 6.2 11.4 . . . 21.5 35.2 25.7
623,226 100.0 5.9 10.7 . . . 20.8 35.0 27.6
a.
b.
c.
d.
1999
2005
1998
2002
1997
1996
2000
2004
1995
2003
2001
Aged 18–64
Applicant provided insufficient evidence, failed to cooperate, failed to follow prescribed treatment, did not want to continue developmentof the claim, or returned to substantial work before disability could be established. For final determinations made August 1996 or before
for applicants under age 18, also includes claims denied because individual functional assessment showed impairment not of
comparable severity.
Used only for applicants aged 18 or older.
CONTACT: Clark Pickett (410) 965-9016 or [email protected].
Includes decisions for SSI-only applications and applications for both Social Security and SSI. Does not include Social Security–only
applications.
. . . = not applicable.
SOURCE: Social Security Administration, Disability Research File, 100 percent data.
Includes applicants aged 65 or older.
Used only for applicants under age 18. Category effective for final determinations made August 1996 or later.
Because a number of applications remain pending for more recent years, the numbers and percentages will change over time.
NOTES: Data for the initial and reconsideration levels are current through June 2006. Data for the hearing level or above are current
through August 2006.
Applications with a medical decision may be pending a final nonmedical decision or subsequently denied for nonmedical reasons.
19941993
1992
Year
Able to dousual past
workb
Able to do
other type of
workb
Otherc
Total
Impairment did
not or is notexpected to
last 12 months
Impairment is
not severe
Impairment
does not
cause severe
functional
limitationsa

8/14/2019 Social Security: ssi asr06
http://slidepdf.com/reader/full/social-security-ssi-asr06 117/129
Suspensions and Terminations

8/14/2019 Social Security: ssi asr06
http://slidepdf.com/reader/full/social-security-ssi-asr06 118/129
Notes
The 2006 report includes several changes to this section:
• The name of the section has been changed from “Suspensions” to “Suspensions and Terminations.”
• Deaths are no longer reported as suspensions in Tables 49 and 50.
• The title of Table 51 has been changed from “Recipients suspended for at least 12 months, by age and reason
for suspension” to “Recipients terminated, by age and reason for termination.” Table 51 shows information con-cerning people whose SSI business relationship was terminated automatically because their benefits had beensuspended for 12 consecutive months. The table no longer provides information concerning suspensions thatdo not result in an automatic termination after 12 consecutive months.
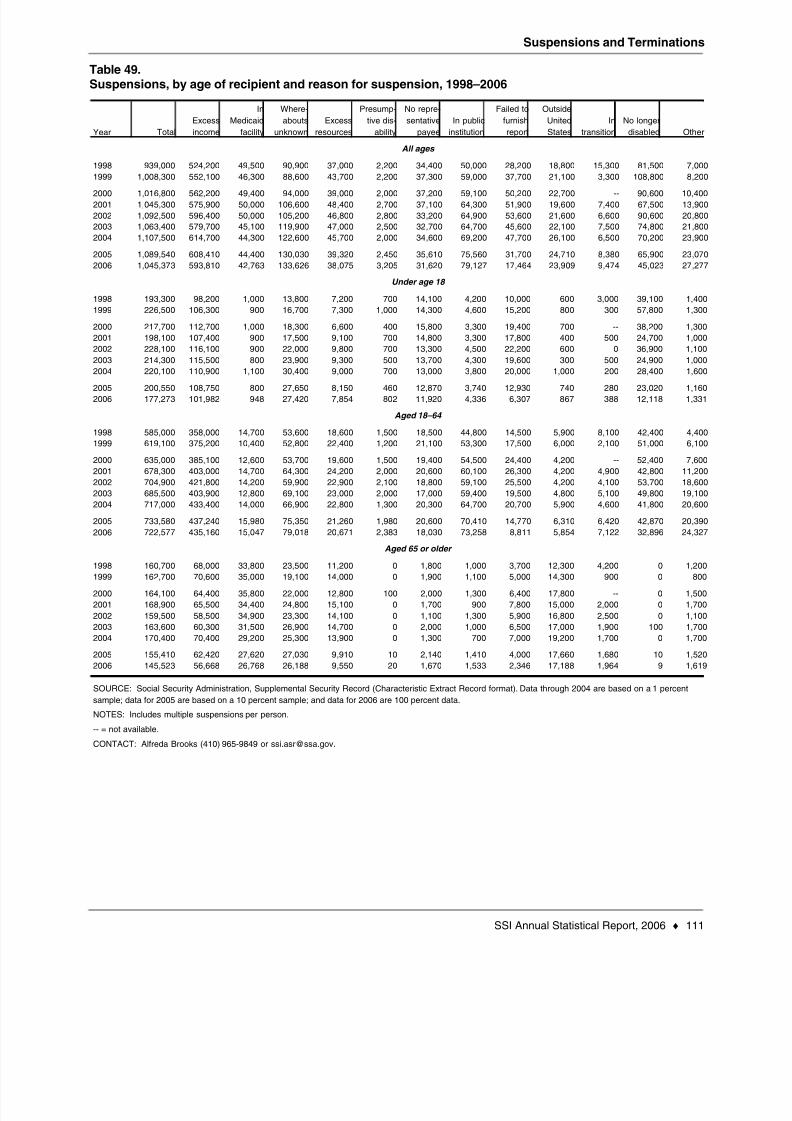
8/14/2019 Social Security: ssi asr06
http://slidepdf.com/reader/full/social-security-ssi-asr06 119/129
Suspensions and Terminations
SSI Annual Statistical Report, 2006 ♦ 111
Table 49.Suspensions, by age of recipient and reason for suspension, 1998–2006
Total
Excess
income
In
Medicaid
facility
Where-
abouts
unknown
Excess
resources
Presump-
tive dis-
ability
No repre-
sentative
payee
In public
institution
Failed to
furnish
report
Outside
United
States
In
transition
No longer
disabled Other
939,000 524,200 49,500 90,900 37,000 2,200 34,400 50,000 28,200 18,800 15,300 81,500 7,000
1,008,300 552,100 46,300 88,600 43,700 2,200 37,300 59,000 37,700 21,100 3,300 108,800 8,200
1,016,800 562,200 49,400 94,000 39,000 2,000 37,200 59,100 50,200 22,700 -- 90,600 10,400
1,045,300 575,900 50,000 106,600 48,400 2,700 37,100 64,300 51,900 19,600 7,400 67,500 13,900
1,092,500 596,400 50,000 105,200 46,800 2,800 33,200 64,900 53,600 21,600 6,600 90,600 20,800
1,063,400 579,700 45,100 119,900 47,000 2,500 32,700 64,700 45,600 22,100 7,500 74,800 21,800
1,107,500 614,700 44,300 122,600 45,700 2,000 34,600 69,200 47,700 26,100 6,500 70,200 23,900
1,089,540 608,410 44,400 130,030 39,320 2,450 35,610 75,560 31,700 24,710 8,380 65,900 23,070
1,045,373 593,810 42,763 133,626 38,075 3,205 31,620 79,127 17,464 23,909 9,474 45,023 27,277
193,300 98,200 1,000 13,800 7,200 700 14,100 4,200 10,000 600 3,000 39,100 1,400
226,500 106,300 900 16,700 7,300 1,000 14,300 4,600 15,200 800 300 57,800 1,300
217,700 112,700 1,000 18,300 6,600 400 15,800 3,300 19,400 700 -- 38,200 1,300
198,100 107,400 900 17,500 9,100 700 14,800 3,300 17,800 400 500 24,700 1,000
228,100 116,100 900 22,000 9,800 700 13,300 4,500 22,200 600 0 36,900 1,100
214,300 115,500 800 23,900 9,300 500 13,700 4,300 19,600 300 500 24,900 1,000
220,100 110,900 1,100 30,400 9,000 700 13,000 3,800 20,000 1,000 200 28,400 1,600
200,550 108,750 800 27,650 8,150 460 12,870 3,740 12,930 740 280 23,020 1,160
177,273 101,982 948 27,420 7,854 802 11,920 4,336 6,307 867 388 12,118 1,331
585,000 358,000 14,700 53,600 18,600 1,500 18,500 44,800 14,500 5,900 8,100 42,400 4,400
619,100 375,200 10,400 52,800 22,400 1,200 21,100 53,300 17,500 6,000 2,100 51,000 6,100
635,000 385,100 12,600 53,700 19,600 1,500 19,400 54,500 24,400 4,200 -- 52,400 7,600
678,300 403,000 14,700 64,300 24,200 2,000 20,600 60,100 26,300 4,200 4,900 42,800 11,200
704,900 421,800 14,200 59,900 22,900 2,100 18,800 59,100 25,500 4,200 4,100 53,700 18,600
685,500 403,900 12,800 69,100 23,000 2,000 17,000 59,400 19,500 4,800 5,100 49,800 19,100
717,000 433,400 14,000 66,900 22,800 1,300 20,300 64,700 20,700 5,900 4,600 41,800 20,600
733,580 437,240 15,980 75,350 21,260 1,980 20,600 70,410 14,770 6,310 6,420 42,870 20,390
722,577 435,160 15,047 79,018 20,671 2,383 18,030 73,258 8,811 5,854 7,122 32,896 24,327
160,700 68,000 33,800 23,500 11,200 0 1,800 1,000 3,700 12,300 4,200 0 1,200
162,700 70,600 35,000 19,100 14,000 0 1,900 1,100 5,000 14,300 900 0 800
164,100 64,400 35,800 22,000 12,800 100 2,000 1,300 6,400 17,800 -- 0 1,500
168,900 65,500 34,400 24,800 15,100 0 1,700 900 7,800 15,000 2,000 0 1,700
159,500 58,500 34,900 23,300 14,100 0 1,100 1,300 5,900 16,800 2,500 0 1,100
163,600 60,300 31,500 26,900 14,700 0 2,000 1,000 6,500 17,000 1,900 100 1,700
170,400 70,400 29,200 25,300 13,900 0 1,300 700 7,000 19,200 1,700 0 1,700
155,410 62,420 27,620 27,030 9,910 10 2,140 1,410 4,000 17,660 1,680 10 1,520
145,523 56,668 26,768 26,188 9,550 20 1,670 1,533 2,346 17,188 1,964 9 1,619
-- = not available.
2000
1999
Aged 18–64
Aged 65 or older
2001
2002
2004
2003
2005
2002
1998
Year
All ages
Under age 18
2005
1998
1999
2000
1999
2005
2001
2002
2004
2003
NOTES: Includes multiple suspensions per person.
CONTACT: Alfreda Brooks (410) 965-9849 or [email protected].
1999
1998
SOURCE: Social Security Administration, Supplemental Security Record (Characteristic Extract Record format). Data through 2004 are based on a 1 percent
sample; data for 2005 are based on a 10 percent sample; and data for 2006 are 100 percent data.
2004
2002
2001
2000
2006
2003
2006
2006
2006
2001
2000
1998
2005
2004
2003

8/14/2019 Social Security: ssi asr06
http://slidepdf.com/reader/full/social-security-ssi-asr06 120/129
Suspensions and Terminations
112 ♦ SSI Annual Statistical Report, 2006
Table 50.Recipients suspended, by age and reason for suspension, 1998–2006
Total
Excess
income
In
Medicaid
facility
Where-
abouts
unknown
Excess
resources
Presump-
tive dis-
ability
No repre-
sentative
payee
In public
institution
Failed to
furnish
report
Outside
United
States
In
transition
No longer
disabled Other
851,600 457,300 47,900 83,900 35,800 1,900 30,900 47,600 26,100 18,100 14,300 80,900 6,900
897,400 461,300 44,600 82,800 42,900 1,900 34,600 55,000 35,600 20,800 3,300 107,200 7,400
906,500 472,900 46,900 87,000 38,000 2,000 35,000 56,100 47,300 22,000 -- 89,500 9,800
929,800 485,500 47,500 97,000 47,500 2,500 33,900 59,600 49,500 19,100 7,300 66,900 13,500
972,800 509,100 48,100 96,000 45,500 2,600 27,700 59,000 47,500 20,800 6,300 90,100 20,100
954,400 499,600 43,500 110,500 45,800 2,300 30,500 59,800 41,200 21,400 7,500 72,200 20,100
997,300 533,200 43,100 113,900 44,600 1,900 30,600 64,200 43,800 25,000 6,500 68,200 22,300
977,680 526,050 42,430 119,630 38,040 2,350 32,650 69,870 29,430 23,930 8,200 63,790 21,310
942,421 517,552 70,996 124,100 37,020 3,040 28,843 73,109 16,411 23,243 9,279 43,563 25,265
164,500 73,300 900 12,800 6,600 600 13,000 4,000 9,400 600 2,900 39,000 1,400
192,200 77,000 900 15,400 7,000 800 13,800 3,900 14,200 600 300 57,100 1,200
177,400 76,500 1,000 16,900 6,300 500 15,100 3,200 18,100 600 -- 38,000 1,200
161,900 75,200 800 15,700 9,000 700 13,800 3,000 17,300 300 400 24,700 1,000
185,700 81,200 800 20,700 9,400 700 10,900 4,200 19,300 600 0 36,900 1,000
173,700 79,900 800 22,300 8,700 400 13,300 4,300 18,000 300 500 24,300 900
178,300 76,100 900 28,500 8,800 700 11,900 3,400 17,700 900 200 27,600 1,600
163,850 77,340 720 25,540 7,840 460 12,020 3,580 11,860 730 260 22,400 1,100
145,724 74,485 881 26,582 7,577 775 11,066 4,116 5,913 844 377 11,845 1,263
537,600 324,100 13,600 49,300 18,400 1,300 16,300 42,600 13,000 5,400 7,400 41,900 4,300
554,600 323,800 9,300 49,200 22,000 1,100 19,000 50,000 16,500 6,000 2,100 50,100 5,500
578,100 340,600 11,100 49,400 19,300 1,500 18,100 51,600 23,500 4,200 -- 51,500 7,300
611,100 353,300 13,000 58,200 23,700 1,800 18,400 55,700 24,800 4,200 4,900 42,200 10,900
637,900 375,100 13,200 54,000 22,500 1,900 15,700 53,700 22,500 4,200 3,900 53,200 18,000
625,600 363,700 11,500 63,100 22,700 1,900 15,200 54,500 17,600 4,800 5,100 47,800 17,700
657,800 392,800 13,200 61,300 22,300 1,200 17,500 60,100 19,300 5,800 4,600 40,600 19,100
668,700 392,840 14,660 68,710 20,600 1,880 18,690 64,950 13,720 6,120 6,320 41,380 18,830
659,401 391,737 13,864 72,612 20,114 2,245 16,204 67,542 8,227 5,672 6,972 31,711 22,501
149,500 59,900 33,400 21,800 10,800 0 1,600 1,000 3,700 12,100 4,000 0 1,200
150,600 60,500 34,400 18,200 13,900 0 1,800 1,100 4,900 14,200 900 0 700
151,000 55,800 34,800 20,700 12,400 0 1,800 1,300 5,700 17,200 -- 0 1,300
156,800 57,000 33,700 23,100 14,800 0 1,700 900 7,400 14,600 2,000 0 1,600
149,200 52,800 34,100 21,300 13,600 0 1,100 1,100 5,700 16,000 2,400 0 1,100
155,100 56,000 31,200 25,100 14,400 0 2,000 100 5,600 16,300 1,900 100 1,500
161,200 64,300 29,000 24,100 13,500 0 1,200 700 6,800 18,300 1,700 0 1,600
145,130 55,870 27,050 25,380 9,600 10 1,940 1,340 3,850 17,080 1,620 10 1,380
137,296 51,330 26,251 24,906 9,329 20 1,529 1,451 2,271 16,727 1,930 7 1,501
NOTE: -- = not available.
CONTACT: Alfreda Brooks (410) 965-9849 or [email protected].
1998
2004
2002
2001
2000
1999
1999
SOURCE: Social Security Administration, Supplemental Security Record (Characteristic Extract Record format). Data through 2004 are based on a 1 percent
sample; data for 2005 are based on a 10 percent sample; and data for 2006 are 100 percent data.
Under age 18
1998
2003
2003
2005
Year
All ages
Aged 18–64
1998
Aged 65 or older
2004
2004
2006
2002
2001
2005
2000
2002
2001
1998
2006
2005
2004
2002
2001
2003
2000
2003
1999
2006
2006
2005
1999
2000

8/14/2019 Social Security: ssi asr06
http://slidepdf.com/reader/full/social-security-ssi-asr06 121/129
Suspensions and Terminations
SSI Annual Statistical Report, 2006 ♦ 113
Table 51.Recipients terminated, by age and reason for termination, 1998–2005
Total
Excess
income Death
In
Medicaid
facility
Where-
abouts
unknown
Excess
resources
In public
institution
Failed to
furnish
report
Outside
United
States
No longer
disabled Other
673,400 285,500 201,100 38,900 22,900 18,600 19,700 9,000 10,100 63,300 4,300
691,500 282,800 195,300 36,100 22,800 24,200 20,600 13,500 11,700 80,000 4,500
686,400 284,900 203,400 35,500 23,800 20,200 20,500 15,100 10,300 66,500 6,200
662,700 284,300 193,500 37,000 21,600 25,700 20,500 15,500 9,700 47,800 7,100
712,600 311,900 202,700 36,600 22,200 24,500 20,700 14,200 10,400 60,300 9,100
674,900 311,200 194,500 32,000 24,200 22,700 19,700 12,600 9,800 39,200 9,000
709,110 333,150 195,600 32,360 25,250 22,340 21,120 12,080 13,060 44,620 9,530
716,458 347,285 192,842 31,531 26,575 21,426 22,935 8,466 12,272 44,412 8,714
79,200 28,700 5,400 500 3,700 2,900 2,100 3,200 500 31,200 1,000
92,600 25,100 5,000 100 3,700 5,000 2,100 5,300 400 45,000 900
76,700 24,100 6,400 200 4,100 3,700 1,600 6,600 200 28,800 1,000
65,900 23,400 5,100 400 4,200 5,900 1,500 5,900 100 18,700 700
80,800 27,900 5,700 400 4,800 5,700 1,400 6,500 200 27,500 700
60,400 25,600 4,000 100 3,900 5,000 1,500 5,200 200 14,100 800
65,270 23,290 5,500 210 4,720 4,980 1,810 4,850 570 18,550 790
62,676 24,551 5,051 304 4,992 4,796 1,651 3,380 496 16,747 708
385,000 220,100 77,200 8,800 10,000 9,200 17,000 4,300 3,500 32,100 2,800
394,400 221,300 78,600 6,100 10,800 11,700 17,700 6,100 3,800 35,000 3,300
410,800 228,200 84,500 5,700 12,600 9,900 18,200 7,100 2,300 37,700 4,600
403,200 229,300 81,900 7,900 9,600 11,800 18,700 7,400 2,200 29,100 5,300
441,100 254,800 88,200 8,200 9,900 11,800 18,900 6,700 2,100 32,800 7,700
426,600 253,100 87,200 7,400 11,900 10,400 17,400 4,600 2,000 25,100 7,200
457,220 278,050 87,100 8,390 11,980 10,430 18,740 5,210 3,310 26,070 7,940
470,025 290,006 85,428 8,560 12,623 10,804 20,660 3,764 3,227 27,663 7,290
209,200 36,700 118,500 29,600 9,200 6,500 600 1,500 6,100 0 500
204,500 36,400 111,700 29,900 8,300 7,500 800 2,100 7,500 0 300
198,900 32,600 112,500 29,600 7,100 6,600 700 1,400 7,800 0 600
193,600 31,600 106,500 28,700 7,800 8,000 300 2,200 7,400 0 1,100190,700 29,200 108,800 28,000 7,500 7,000 400 1,000 8,100 0 700
188,200 32,500 103,300 24,500 8,400 7,300 800 2,800 7,600 0 1,000
186,620 31,810 103,000 23,760 8,550 6,930 570 2,020 9,180 0 800
183,757 32,728 102,363 22,667 8,960 5,826 624 1,322 8,549 2 716
2001
2000
1999
CONTACT: Alfreda Brooks (410) 965-9849 or [email protected].
SOURCE: Social Security Administration, Supplemental Securi ty Record (Characteristic Extract Record format). Data through 2003 are based on a 1 percent
sample; data for 2004 are based on a 10 percent sample; and data for 2005 are 100 percent data.
2000
2003
2001
2000
1999
1998
2004
2003
2001
2002
2003
Year
1999
1998
All ages
2004
2004
2003
2001
2000
1999
2005
2002
2002
2005
Under age 18
Aged 18–64
Aged 65 or older
2004
1998
2005
2005
2002
1998

8/14/2019 Social Security: ssi asr06
http://slidepdf.com/reader/full/social-security-ssi-asr06 122/129

8/14/2019 Social Security: ssi asr06
http://slidepdf.com/reader/full/social-security-ssi-asr06 123/129

8/14/2019 Social Security: ssi asr06
http://slidepdf.com/reader/full/social-security-ssi-asr06 124/129
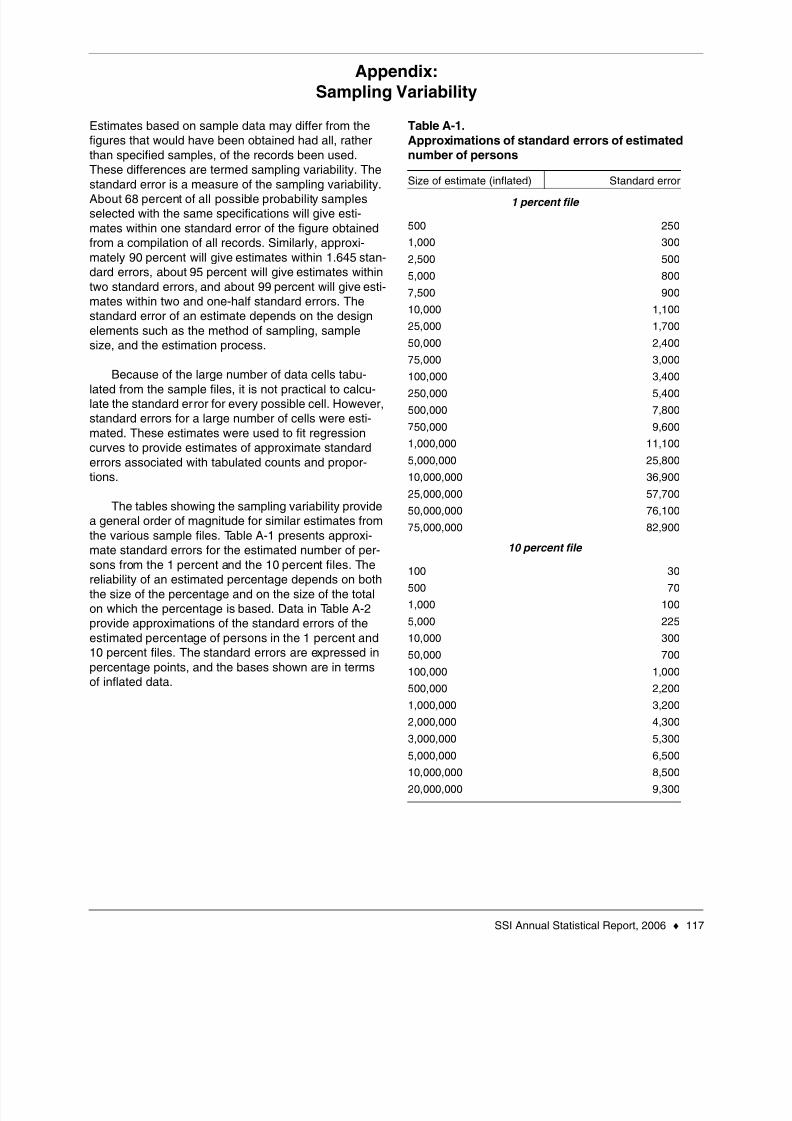
8/14/2019 Social Security: ssi asr06
http://slidepdf.com/reader/full/social-security-ssi-asr06 125/129
SSI Annual Statistical Report, 2006 ♦ 117
Appendix:
Sampling Variability
Estimates based on sample data may differ from thefigures that would have been obtained had all, ratherthan specified samples, of the records been used.These differences are termed sampling variability. The
standard error is a measure of the sampling variability.About 68 percent of all possible probability samplesselected with the same specifications will give esti-mates within one standard error of the figure obtainedfrom a compilation of all records. Similarly, approxi-mately 90 percent will give estimates within 1.645 stan-dard errors, about 95 percent will give estimates withintwo standard errors, and about 99 percent will give esti-mates within two and one-half standard errors. Thestandard error of an estimate depends on the designelements such as the method of sampling, samplesize, and the estimation process.
Because of the large number of data cells tabu-lated from the sample files, it is not practical to calcu-late the standard error for every possible cell. However,standard errors for a large number of cells were esti-mated. These estimates were used to fit regressioncurves to provide estimates of approximate standarderrors associated with tabulated counts and propor-tions.
The tables showing the sampling variability providea general order of magnitude for similar estimates fromthe various sample files. Table A-1 presents approxi-mate standard errors for the estimated number of per-sons from the 1 percent and the 10 percent files. Thereliability of an estimated percentage depends on boththe size of the percentage and on the size of the totalon which the percentage is based. Data in Table A-2provide approximations of the standard errors of theestimated percentage of persons in the 1 percent and10 percent files. The standard errors are expressed inpercentage points, and the bases shown are in termsof inflated data.
Table A-1.
Approximations of standard errors of estimatednumber of persons
Size of estimate (inflated) Standard error1 percent file
500 250
1,000 300
2,500 500
5,000 800
7,500 900
10,000 1,100
25,000 1,700
50,000 2,400
75,000 3,000
100,000 3,400
250,000 5,400
500,000 7,800
750,000 9,600
1,000,000 11,100
5,000,000 25,800
10,000,000 36,900
25,000,000 57,700
50,000,000 76,100
75,000,000 82,900
10 percent file
100 30
500 70
1,000 100
5,000 225
10,000 300
50,000 700
100,000 1,000
500,000 2,200
1,000,000 3,200
2,000,000 4,300
3,000,000 5,300
5,000,000 6,500
10,000,000 8,500
20,000,000 9,300

8/14/2019 Social Security: ssi asr06
http://slidepdf.com/reader/full/social-security-ssi-asr06 126/129
118 ♦ SSI Annual Statistical Report, 2006
Table A-2.Approximations of standard errors of estimated
percentage of persons
Size of base(inflated) 2 or 98 5 or 95
10 or90
25 or75 50
1 percent file
1,000 4.7 7.3 10.1 14.5 16.810,000 1.5 2.3 3.2 4.6 5.3
50,000 0.7 1.0 1.4 2.1 2.4
100,000 0.5 0.7 1.0 1.5 1.7
500,000 0.2 0.3 0.4 0.7 0.8
1,000,000 0.1 0.2 0.3 0.5 0.5
5,000,000 0.1 0.1 0.1 0.2 0.2
10,000,000 a
a. Less than 0.05 percent.
0.1 0.1 0.2 0.2
50,000,000 a a a 0.1 0.1
100,000,000 a a a a a
10 percent file
500 1.9 3.0 4.1 5.9 6.8
1,000 1.3 2.1 2.9 4.1 4.8
2,500 0.8 1.3 1.8 2.6 3.0
10,000 0.4 0.6 0.9 1.3 1.5
50,000 0.2 0.3 0.4 0.6 0.7
100,000 0.1 0.2 0.3 0.4 0.5
500,000 a 0.1 0.1 0.2 0.2
1,000,000 a 0.1 0.1 0.1 0.2
5,000,000 a a a a 0.1
10,000,000 a a a a a
50,000,000 a a a a a

8/14/2019 Social Security: ssi asr06
http://slidepdf.com/reader/full/social-security-ssi-asr06 127/129
SSI Annual Statistical Report, 2006 ♦ 119
Glossary
abbreviated application. An SSI application that is formally denied for nonmedical reasons when the applicantalleges information that clearly results in ineligibility.
adult. A person who is older than age 21, is aged 18–21 but is not a student, is under 21 and married, or is thehead of a household.
aged person. A person aged 65 or older.
allowance. A determination by the Disability Determination Services, an administrative law judge, or the AppealsCouncil that an applicant meets the medical definition of disability under the law.
auxiliary benefit (OASDI). Monthly benefit payable to a spouse or a child of a retired or disabled worker or to asurvivor of a deceased worker.
award. An administrative determination that an individual is entitled to receive monthly benefits.
blind. "Blindness," for Social Security purposes, means either central visual acuity of 20/200 or less in the bettereye with the use of a correcting lens or a limitation in the fields of vision so that the widest diameter of the visualfield subtends an angle of 20 degrees or less (tunnel vision).
blind work expenses (BWE). Permits the exclusion of any earned income of a blind person that is used to meetexpenses reasonably attributable to earning the income.
child. An unmarried blind or disabled person who is not the head of a household and who is either under age 18 oraged 18–21 and a student.
concurrent application. An application for both Title II (Social Security) and Title XVI (Supplemental SecurityIncome) benefits at the same time.
deeming (SSI). Counting part of the income and resources of certain persons who live with an SSI recipient whendetermining the amount of the payment. These persons include the ineligible spouses of adult recipients, theineligible parents of child recipients under age 18, and the immigration sponsor for certain noncitizens.
diagnostic group. Classification of impairments, by body system, that identifies the medical condition(s) on whichdisability-related benefits are based. Before 1985, the coding of the primary and secondary diagnoses forSocial Security and Supplemental Security Income applicants was in accordance with the International Classi- fication of Diseases: 9th revision, Clinical Modification, 4th ed., using 4–digit ICD-9 codes. In 1985, the Social
Security Administration (SSA) implemented a revised method to determine and enter impairment codes inadministrative records. This revised approach provides for a modified impairment coding system, generallyusing 3 digits (followed by zero), loosely based on the ICD-9 codes. For research purposes, the ICD-9 codesand SSA impairment codes are, typically, identical. However, the diagnostic groupings shown in the statisticaltables closely parallel the major ICD-9 disease classifications.
disability. The inability to engage in substantial gainful activity (SGA) by reason of any medically determinablephysical or mental impairment that can be expected to result in death or to last for a continuous period of notless than 12 months. (Special rules apply for workers aged 55 or older whose disability is based on blindness.The 12-month requirement does not apply to SSI beneficiaries who are blind.)
Individuals are considered to be disabled only if their physical or mental impairment(s) is of such severity thatthey are not only unable to do their previous work but cannot—because of their age, education, or work experi-ence—engage in any other kind of substantial gainful activity that exists in the national economy, regardless of
whether such work exists in the immediate area in which they live, or whether a specific job vacancy exists forthem, or whether they would be hired if they applied for work.
The SGA criterion does not apply to children under age 18 in the Supplemental Security Income program. Thestandard for them is a medically determinable physical or mental impairment that results in marked and severefunctional limitations.
Disability Determination Services (DDS). The state agency responsible for developing medical evidence andrendering the initial determination and reconsideration on whether a claimant is disabled or a beneficiary con-tinues to be disabled within the meaning of the law.
8/14/2019 Social Security: ssi asr06
http://slidepdf.com/reader/full/social-security-ssi-asr06 128/129
120 ♦ SSI Annual Statistical Report, 2006
federal benefit rates (FBR). The basic benefit standards used in computing the amount of federal SSI payments.Benefit levels differ for individuals and couples living in households and for persons in Medicaid institutions.Individuals or couples living in their own household receive the full federal benefit. The federal benefit isreduced by one-third if an individual or couple is living in another person’s household and receiving supportand maintenance there. The federal benefit rates are increased annually to reflect increases in the cost of liv-ing.
impairment-related work expenses (IRWE). The costs of items or services that a disabled person needs to work.The expenses, when paid by the beneficiary, are deducted from his or her gross earnings when determining ifthe work is considered substantial gainful activity.
Medicaid institution. Living arrangement for persons in public or private institutions when more than 50 percent ofthe cost of care is met by the Medicaid program. In these situations, the monthly federal SSI payment is limitedto no more than $30.
own household. Used to determine the federal benefit rate. Applies to adults who own their living quarters, are lia-ble for the rent, pay their pro rata shares of household expenses, are living in households composed only ofrecipients of public income–maintenance payments, and are placed by agencies in private households. Alsoapplies to children living in their parent's household. See federal benefit rates.
plans for achieving self-support (PASS). Permits a recipient with an approved PASS to set aside earned orunearned income and resources for a work goal. The income or resources set aside are used to pay for goodsor services needed to reach the goal, such as education, vocational training, star ting a business, or purchasing
work-related equipment. The income and resources that are set aside under a PASS are excluded from SSIincome and resource tests, but they do not influence the determination of ability to engage in substantial gain-ful activity.
presumptive disability or blindness. For certain diagnoses, where there is high probability of a favorable medicaldetermination of disability or blindness, payments may be made for up to 6 months before the formal determi-nation, if the applicant meets the nonmedical eligibility requirements.
representative payee. A person designated by the Social Security Administration to receive monthly benefitchecks on behalf of an adult beneficiary who is unable to manage his or her own funds. A beneficiary underage 18 is generally considered incapable of managing benefit payments, and a representative payee will beselected to receive benefits on the beneficiary’s behalf.
Section 1619(a). Continuing cash benefits for disabled individuals whose gross earned income is at the amount
designated as the substantial gainful activity level. The person must continue to be disabled and meet all othereligibility rules. Also known as special cash payment.
Section 1619(b). For Medicaid purposes, provides special status to working disabled or blind individuals whentheir earnings make them ineligible for cash payments. Also known as special recipient status.
SSA administrative regions
Boston : Connecticut, Maine, Massachusetts, New Hampshire, Rhode Island, and VermontNew York : New Jersey, New York, Puerto Rico, and U.S. Virgin IslandsPhiladelphia : Delaware, District of Columbia, Maryland, Pennsylvania, Virginia, and West VirginiaAtlanta : Alabama, Florida, Georgia, Kentucky, Mississippi, North Carolina, South Carolina, and TennesseeChicago : Illinois, Indiana, Michigan, Minnesota, Ohio, and WisconsinDallas : Arkansas, Louisiana, New Mexico, Oklahoma, and Texas
Kansas City : Iowa, Kansas, Missouri, and NebraskaDenver : Colorado, Montana, North Dakota, South Dakota, Utah, and WyomingSan Francisco : Arizona, California, Hawaii, Nevada, American Samoa, Guam, and Northern Mariana IslandsSeattle : Alaska, Idaho, Oregon, and Washington
NOTE: The SSI program does not cover American Samoa, Guam, Puerto Rico, and U.S. Virgin Islands.
state conversions. Persons who were eligible for payments under the federal and state adult assistance programsin December 1973 were automatically eligible for SSI payments beginning January 1974.

8/14/2019 Social Security: ssi asr06
http://slidepdf.com/reader/full/social-security-ssi-asr06 129/129
state supplementation. Payments to eligible persons made under state provisions. These payments may vary bythe recipient's living situation and by geographic area within the state. The payments may be administered bythe Social Security Administration or the state.
substantial gainful activity (SGA). Describes a level of work activity that is productive and yields or usually yieldsremuneration or profit. The Social Security Administration’s regulations establish a dollar amount to indicatewhether a person’s work is substantial.
Supplemental Security Income (SSI). A federal program for low-income aged, blind, and disabled individuals who
meet income and resource requirements. Beginning in 1974, SSI replaced the former federal and state pro-grams of Old-Age Assistance, Aid to the Blind, and Aid to the Permanently and Totally Disabled. SSI is fundedby general tax revenues, not Social Security taxes.
suspended benefit. A payment that has been temporarily stopped until the condition or conditions causing thesuspension are known to have ended. The suspension does not affect eligibility for Medicaid benefits.
Related Documents