Social Security Bulletin • Vol. 68 • No. 2 • 2008 21 NOTE Social Security Beneficiaries Affected by the Windfall Elimination Provision in 2006 by Barbara A. Lingg The author is with the Office of Research, Evaluation, and Statistics, Office of Retirement and Disability Policy, Social Security Administration. Summary The Windfall Elimination Provision (WEP) is an alternative method of computing ben- efits for some workers who receive a pension based on work not covered by Social Secu- rity. The WEP computation results in a lower benefit than the worker would receive under the regular computation method. This article provides a brief legislative history, describes the WEP computation and applicability, and presents statistical data about beneficiaries affected by the WEP. The statistical data show that, as of the end of December 2006: About 970,000 beneficiaries, mainly • retired workers, were affected by the WEP, and the WEP affected the benefits of almost 3 percent of all retired workers. Almost half of the retired workers • affected by the WEP received a federal pension, and another 36 percent received either a state or local pension. Sixty-five percent of both retired and • disabled workers affected by the WEP were men. History of the Windfall Elimination Provision (WEP) The regular Social Security benefit computa- tion formula is weighted to provide a higher replacement of earnings for workers with low earnings. Most employment and self-employ- ment in the United States is covered by Social Security. Workers and their employers pay taxes up to an annual maximum amount, and the earnings are creditable for Social Security purposes. Before the WEP was enacted, individuals who had worked mainly in employment not covered by Social Security had their benefits computed as if they were long term low-wage earners. The WEP prevents this unintended windfall for workers who receive a pension from a job where they did not pay Social Security taxes, but who benefited from provisions aimed at low lifetime earners. Examples of pensions from noncovered employment are Civil Ser- vice Retirement pensions payable to federal employees hired before 1984, state and local government pensions based on noncovered earnings, and certain pensions from earnings in foreign countries. The Windfall Elimination Provision was one of the many legislative changes included in the Social Security Amendments of 1983 (Public Law 98–21). Major provisions of this legisla- tion included gradually raising the retirement age and making a portion of Social Security benefits received by higher income beneficia- ries subject to income taxes. The amendments

Welcome message from author
This document is posted to help you gain knowledge. Please leave a comment to let me know what you think about it! Share it to your friends and learn new things together.
Transcript

SocialSecurityBulletin•Vol.68•No.2•2008 21
NOTE
Social Security Beneficiaries Affected by the Windfall Elimination Provision in 2006by Barbara A. Lingg
The author is with the Office of Research, Evaluation, and Statistics, Office of Retirement and Disability Policy, Social Security Administration.
SummaryThe Windfall Elimination Provision (WEP) is an alternative method of computing ben-efits for some workers who receive a pension based on work not covered by Social Secu-rity. The WEP computation results in a lower benefit than the worker would receive under the regular computation method. This article provides a brief legislative history, describes the WEP computation and applicability, and presents statistical data about beneficiaries affected by the WEP.
The statistical data show that, as of the end of December 2006:
About 970,000 beneficiaries, mainly • retired workers, were affected by the WEP, and the WEP affected the benefits of almost 3 percent of all retired workers.Almost half of the retired workers • affected by the WEP received a federal pension, and another 36 percent received either a state or local pension. Sixty-five percent of both retired and • disabled workers affected by the WEP were men.
History of the Windfall Elimination Provision (WEP)The regular Social Security benefit computa-tion formula is weighted to provide a higher
replacement of earnings for workers with low earnings. Most employment and self-employ-ment in the United States is covered by Social Security. Workers and their employers pay taxes up to an annual maximum amount, and the earnings are creditable for Social Security purposes. Before the WEP was enacted, individuals who had worked mainly in employment not covered by Social Security had their benefits computed as if they were long term low-wage earners. The WEP prevents this unintended windfall for workers who receive a pension from a job where they did not pay Social Security taxes, but who benefited from provisions aimed at low lifetime earners. Examples of pensions from noncovered employment are Civil Ser-vice Retirement pensions payable to federal employees hired before 1984, state and local government pensions based on noncovered earnings, and certain pensions from earnings in foreign countries.
The Windfall Elimination Provision was one of the many legislative changes included in the Social Security Amendments of 1983 (Public Law 98–21). Major provisions of this legisla-tion included gradually raising the retirement age and making a portion of Social Security benefits received by higher income beneficia-ries subject to income taxes. The amendments

22 SocialSecurityBulletin•Vol.68•No.2•2008
also provided for mandatory Social Security cover-age of newly hired federal employees and current and future employees of nonprofit organizations (Svahn and Ross 1983, 24–27).
Prior to Congressional action, the issue of windfall benefits payable to persons with noncovered employ-ment was considered in two bipartisan national Social Security study commissions. The National Commis-sion on Social Security issued its report on March 12, 1981. One of its recommendations was that “the windfall portion of benefits arising from periods of noncovered government employment in the future (due to the weighted benefit formula) should be eliminated” (National Commission on Social Security 1981, 26).
The WEP was also on the agenda of the later National Commission on Social Security Reform (NCSSR). The commission’s report, released in Janu-ary 1983, recommended “that the method of com-puting benefits should be revised for persons who first become eligible for pensions from non-covered employment, after 1983, so as to eliminate ‘wind-fall’ benefits.” The report included two methods of modifying the windfall. One method would make the percentage related to the second bendpoint of the primary insurance amount (PIA) formula applicable to the first bendpoint (32 percent instead of 90 percent) for workers with noncovered pensions. The reduc-tion in benefits would not be larger than the pension from noncovered employment. The second method would apply the current benefit formula to a record that combines both covered and noncovered earnings to determine a replacement rate, which would then be applied to the average earnings based solely on cov-ered employment (NCSSR 1983, 2-9–2-10).
In February 1983, the Social Security Subcommittee of the House Ways and Means Committee completed markup sessions on a draft bill. The subcommittee agreed with the first NCSSR approach to modify the benefit formula on advice that the second method would pose significant administrative problems, and that generally similar results could be achieved by reducing the percentage in the first bendpoint (Svahn and Ross 1983, 10).
After further action in both the House of Rep-resentatives and Senate, the conference committee agreement substituted 40 percent for 32 percent as the percentage applicable to the first bendpoint, provided for the 5 year phase-in period, and exempted newly
covered employees and those with 30 years of covered work (Committee on Ways and Means 1983, 121). These WEP provisions were included in the legislation signed by President Ronald Reagan on April 21, 1983.
The WEP ComputationSocial Security benefits are based on the PIA, which is the monthly benefit payable to the worker upon retire-ment at full retirement age or upon entitlement to dis-ability benefits. The PIA is derived from the worker’s average indexed monthly earnings (AIME). The AIME is based on annual covered earnings that have been indexed to reflect changes in wage levels since the year the earnings were paid. The indexed earnings are then averaged over most of the worker’s adult years to determine the AIME.
After the AIME has been determined, the PIA is computed by applying a formula to the AIME. The formula applies three percentages to three brackets of the AIME. The formula is weighted to provide a higher PIA to the AIME ratio for workers with relatively low earnings by applying declining percentage rates to the three AIME brackets. The dollar amounts defining the AIME brackets are referred to as bendpoints and are updated each year in proportion to increases in the national average wage level. For workers who first became eligible for benefits—those who reach age 62 or become disabled—in 2006, the PIA is equal to the sum of: 90 percent of the first $656 of AIME, plus 32 percent of the next $3,299 of AIME, plus 15 percent of the AIME over $3,955.
The PIA is the monthly amount payable at full retirement age (FRA)—age 66—for workers who attained age 62 in 2006. Retirement benefits are reduced for each month of benefit receipt before the FRA. Disabled workers may receive 100 percent of the PIA, unless they receive a reduced retirement benefit for months before disability entitlement (SSA 2007a, 14–17).
The WEP computation for the PIA generally applies 40 percent to the first bendpoint instead of the 90 per-cent used to compute the regular PIA. The maximum amount of PIA reduction is half of the amount of the first bendpoint applicable to the year of first eligibil-ity. The following example shows the maximum PIA reduction due to the WEP for a worker who attains age 62 or becomes disabled in 2006:
SocialSecurityBulletin•Vol.68•No.2•2008 23
Regular PIA, based on AIME of $800 $656 x .90 = $590.40 $144 x .32 = $46.08 Regular PIA = $636.40Windfall Elimination Provision PIA, based on
AIME of $800 $656 x .40 = $262.40 $144 x .32 = $46.08 WEP PIA = $308.40After the calculation, the PIA is rounded down to
the nearest $0.10. The maximum PIA reduction due to the WEP is $328, one-half of the first bendpoint of $656.
WEP ApplicabilityThe WEP computation reduces the PIA for some retired and disabled workers and their spouses and children. It is the PIA of record. However, the WEP computation does not apply to survivor benefits. If a worker dies, benefits for widow(er)s and children are based on the regular PIA.
The WEP may apply to workers who attained age 62 or became eligible for disability benefits after 1985 and became eligible after 1985 for a pension based in whole or in part on earnings in employment not cov-ered by Social Security. Workers who have 30 or more years of substantial earnings covered under Social Security are exempt from the WEP. The annual amount of substantial earnings is based on a formula and is updated each year based on the increase in the national average wage level. The formula for substantial earn-ings is 25 percent of the old law’s contribution and benefit base, the amount that would have determined maximum taxable earnings for benefit computation purposes had the 1977 Social Security Amendments (which included ad hoc increases in the maximum taxable earnings) not been enacted. Amounts of sub-stantial covered earnings were $11,625 for 1996 and $17,475 for 2006 (SSA 2007c, 2). These amounts are 25 percent of the old law’s base amounts of $46,500 and $69,900, respectively.
Benefits for workers with 21–29 years of substan-tial covered earnings are not fully impacted by the WEP. The 40 percent applicable to the first bendpoint percentage is increased by 5 percentage points for each year of substantial covered earnings beginning with the 21st year and through the 30th year, at which point the WEP no longer applies. The first bendpoint per-
centage ranges from 45 percent for workers with 21 years of substantial covered earnings to 85 percent for workers with 29 years (SSA 2007a, 16).
There is a guarantee provision for workers with relatively low pensions based on noncovered employ-ment. The reduction in the Social Security benefit due to the WEP cannot exceed one-half of the amount of the pension based on noncovered earnings after 1956 (SSA 2007c, 2).
The WEP was phased in for workers first eligible for retirement or disability insurance in 1986 through 1989. For those first eligible in 1986 and subject to the WEP, the applicable first bendpoint percentage was 80 percent. The percentage decreased by 10 percentage points each year for those first eligible in 1987–1989 and reached 40 percent for those first eligible in 1990 or later (SSA 2007a, Table 2.A11.1).
The WEP does not apply to two groups of employ-ees whose Social Security coverage was mandated in 1984—federal employees who were first hired after December 31, 1983, and certain employees of nonprofit organizations who started employment on December 31, 1983. Other WEP exceptions include pensions based on railroad employment, pensions based solely on noncovered employment before 1957, and certain pensions paid as a result of totalization agreements between the United States and foreign countries (SSA 2007c, 2).
Beneficiaries Affected by the WEPThe following sections present statistical data on ben-eficiaries affected by the WEP who were in current-payment status as of December 2006. The beneficiary statistical data were derived from the Social Security Administration’s Master Beneficiary Record (MBR). The MBR is the principal file used in the administra-tion of the Social Security benefit program. The data show demographic and program characteristics of those affected, information on pensions and years of coverage, and effects of the WEP on the PIA and monthly benefits.
Demographic and Program Characteristics
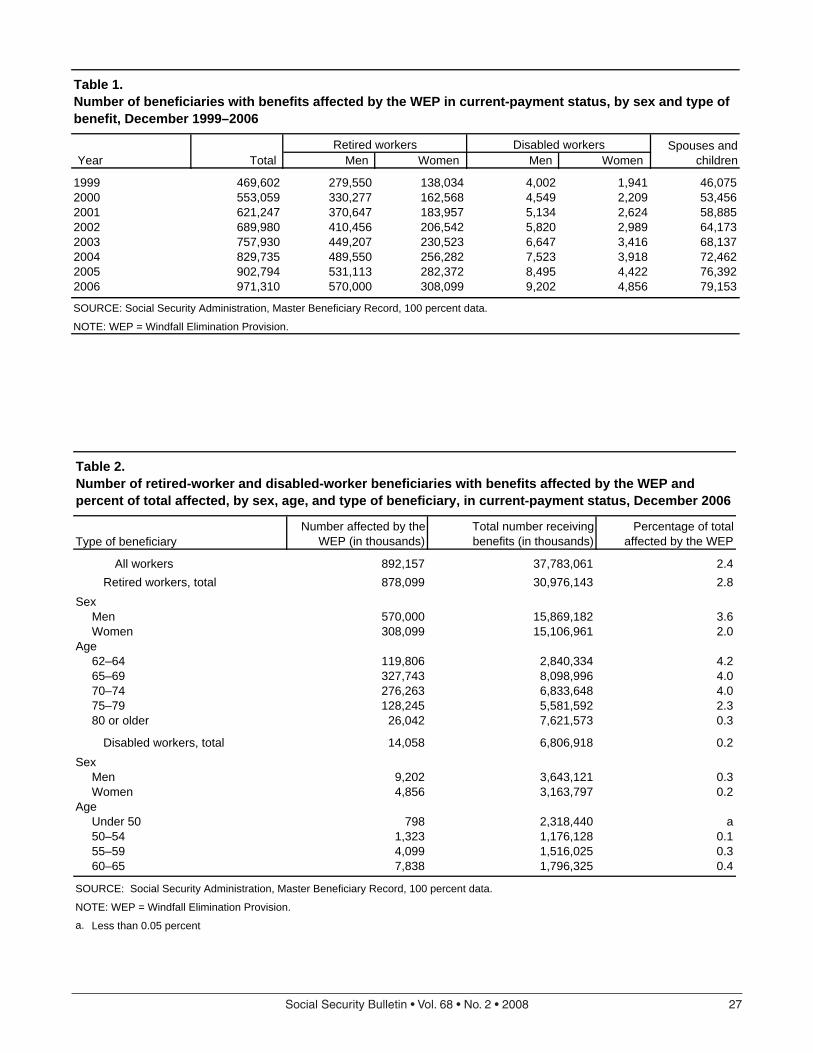
At the end of 2006, 971,310 beneficiaries were affected by the WEP. Ninety percent were retired workers. Another 2 percent were disabled workers, and the remaining 8 percent were spouses and chil-dren of affected workers (Table 1). From 1999 to 2006 the number of affected beneficiaries more than doubled. Although small numbers of disabled workers
24 SocialSecurityBulletin•Vol.68•No.2•2008
are affected by the WEP, the percentage increase was slightly higher for these workers (137 percent) than for retired workers (110 percent) during this period.
About 65 percent of both retired and disabled work-ers affected by the WEP were men. The WEP affected the benefits of 3.6 percent of all men receiving retired-worker benefits, compared with 2.0 percent of all women (Table 2).
The WEP affected the benefits of about 4 percent of retired workers under age 75, but only 2.3 percent of those aged 75–79 and 0.3 percent of those aged 80 or older. The WEP did not apply to persons first eligible for benefits prior to 1986.
Also, those first eligible after 1985 were affected only if they were entitled to a noncovered pension that began after 1985. Thus, fewer older beneficiaries were affected by the WEP.
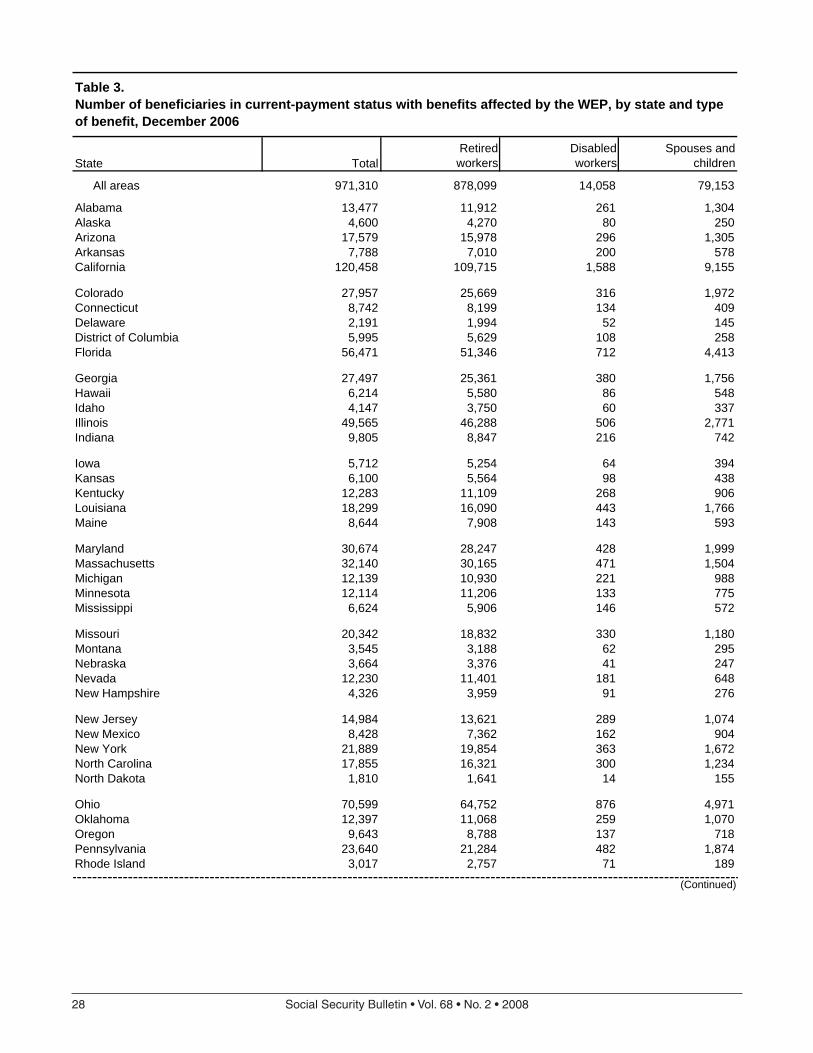
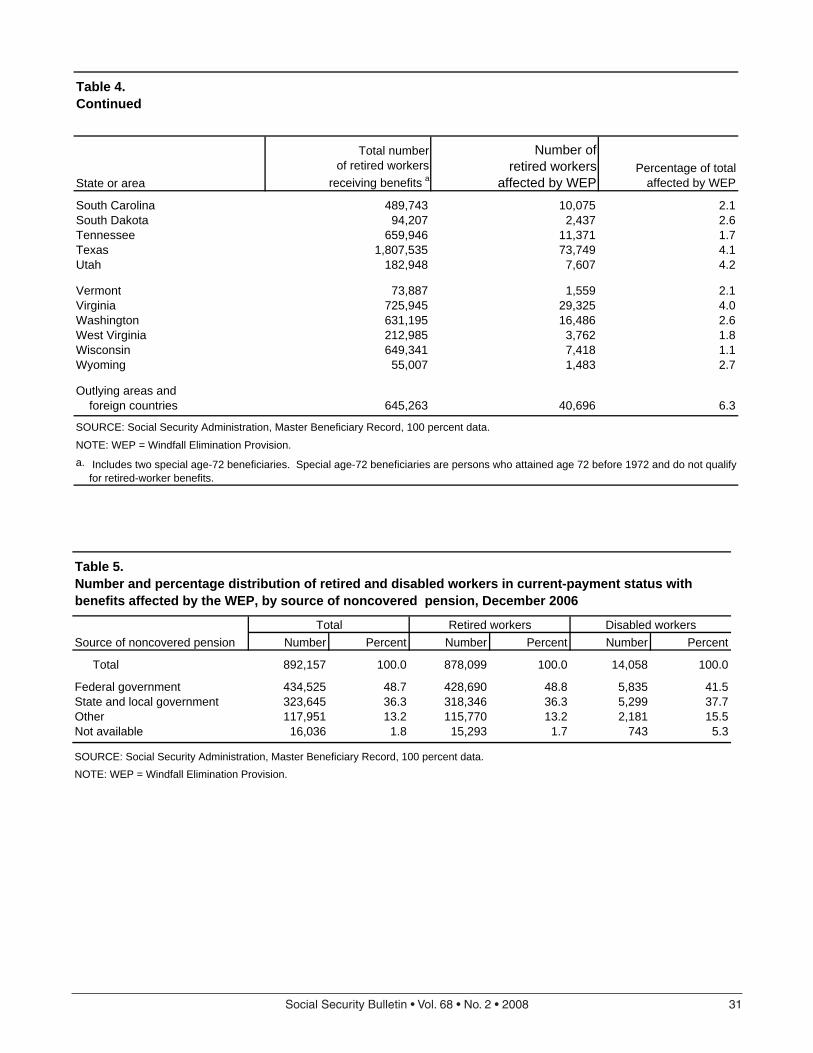
Tables 3 and 4 present state-by-state breakdowns of beneficiaries affected by the WEP. In some states, the percentage of retired workers affected by the WEP was substantially higher than the national figure of 2.8 percent. More than one-tenth of the retired workers in Alaska and the District of Columbia were affected as well as about 5 percent of those in Colorado, Maine, Maryland, Nevada, and Ohio. The percentages are higher in these states because they had either many federal employees or low percentages of state and local employees who were covered by Social Security. In both 1991 and 2001, less than 50 percent of state and local workers in Alaska, California, Colorado, Maine, Louisiana, Massachusetts, Nevada, and Ohio were covered by Social Security. (Committee on Ways and Means 1996, 10–11 and 2004, 1-43–1-44).
Because of the small number of disabled workers affected by the WEP, percentages affected in each state are not presented.
Pensions and Years of Coverage
Table 5 shows the sources of pensions for retired and disabled workers affected by the WEP. Almost half of the retired workers and over two-fifths of the disabled workers received federal pensions. The percentages of retired and disabled workers receiving state and local pensions were similar, 36 percent and 38 percent, respectively.
Almost three-fourths of workers affected by the WEP had fewer than 21 years of substantial covered earnings (Table 6). Thus, almost three-quarters of the workers were subject to the maximum PIA reduc-tion—50 percent of the first bendpoint, unless they
were covered by the WEP guarantee. Another 10 percent had 21–24 years, and about 8 percent had 25–29 years. Retired and disabled workers had similar distributions of years of covered earnings, but women tended to have fewer years than men.
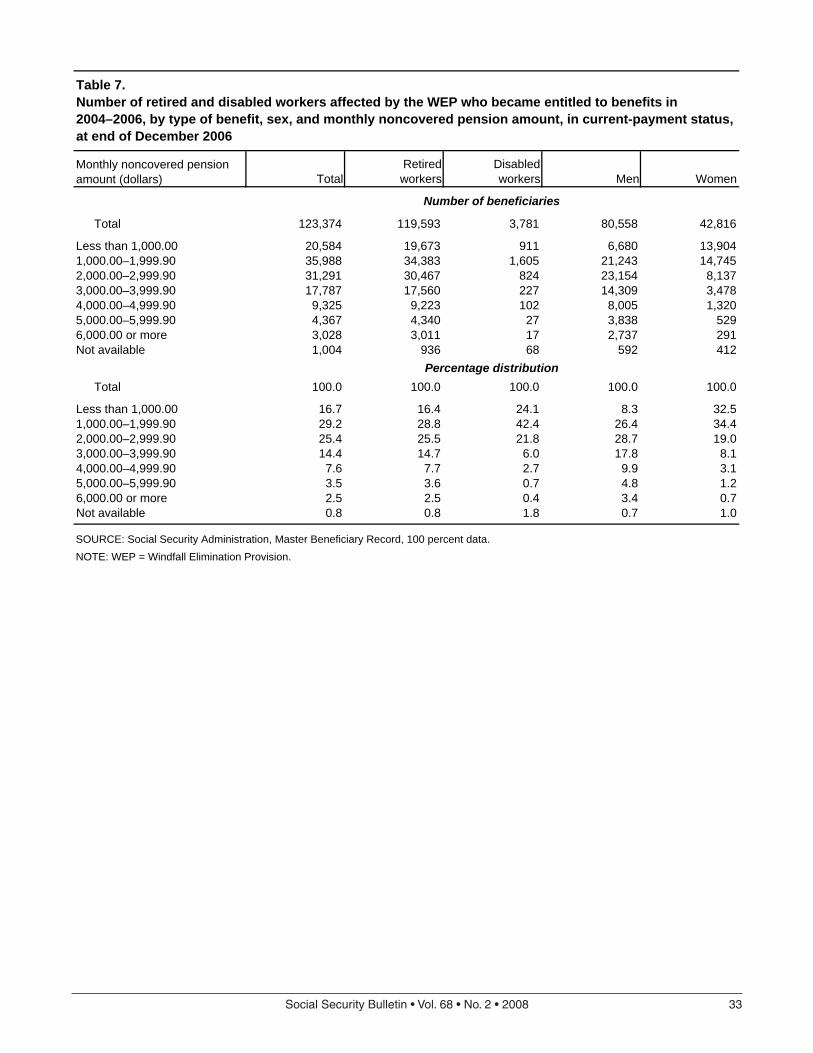
Table 7 shows distributions of the monthly non-covered pension amount for workers affected by the WEP who became entitled to Social Security benefits in 2004–2006. These years were selected to provide fairly current data on pensions. For beneficiaries entitled in these years, higher percentages of disabled workers and women received lower pensions. About two-thirds of disabled workers received monthly noncovered pensions of less than $2,000, compared with 45 percent of retired workers. About two-thirds of women, compared with one-third of men received less than $2,000 per month.
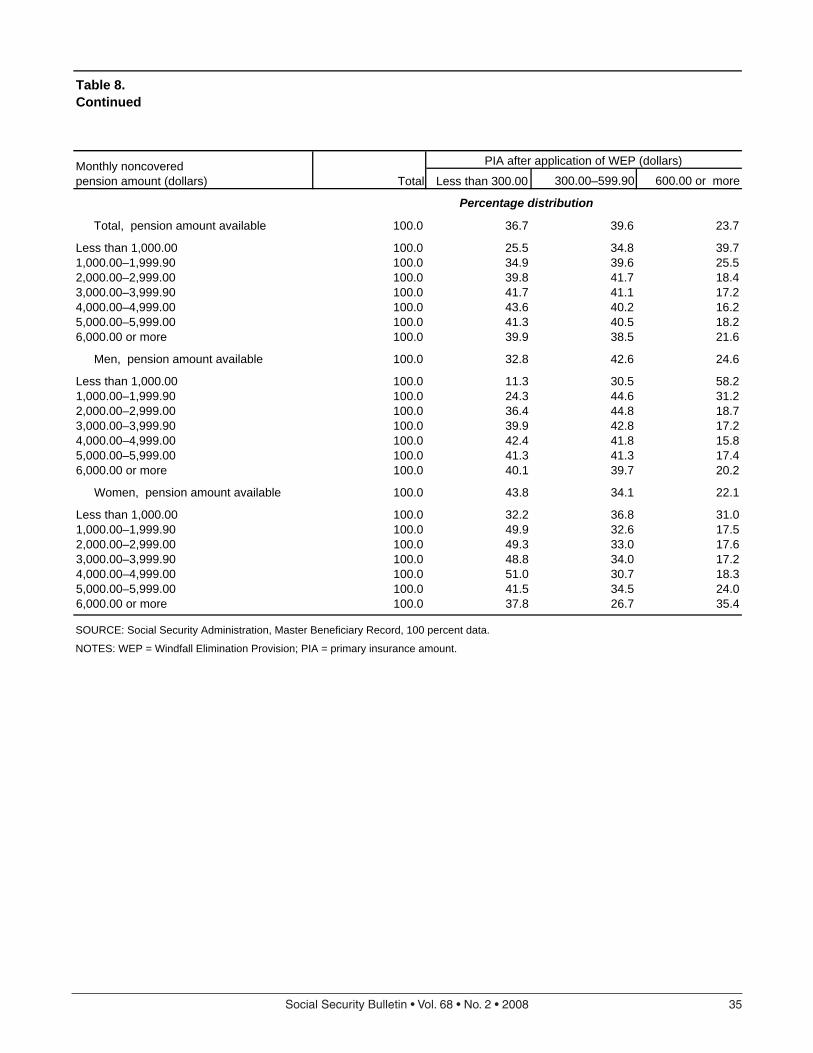
Table 8 relates the amount of the monthly non-covered pension to the primary insurance amount for recently entitled retired workers who were affected by the WEP. Since persons affected by the WEP had many years in noncovered employment, PIAs tended to be low. The years of zero Social Security earnings were included in the computation of the AIME, resulting in a lower PIA, which is further reduced by the WEP.
Overall, about 33 percent of the men and 44 percent of the women in this group had PIAs of less than $300 per month. However, only 11 percent of the men and 32 percent of the women with noncovered pensions of less than $1,000 had PIAs under $300. Some workers with the lowest noncovered pension had fewer years of noncovered employment and more years of covered employment and thus were able to earn higher PIAs.
Effect of the WEP on the PIA
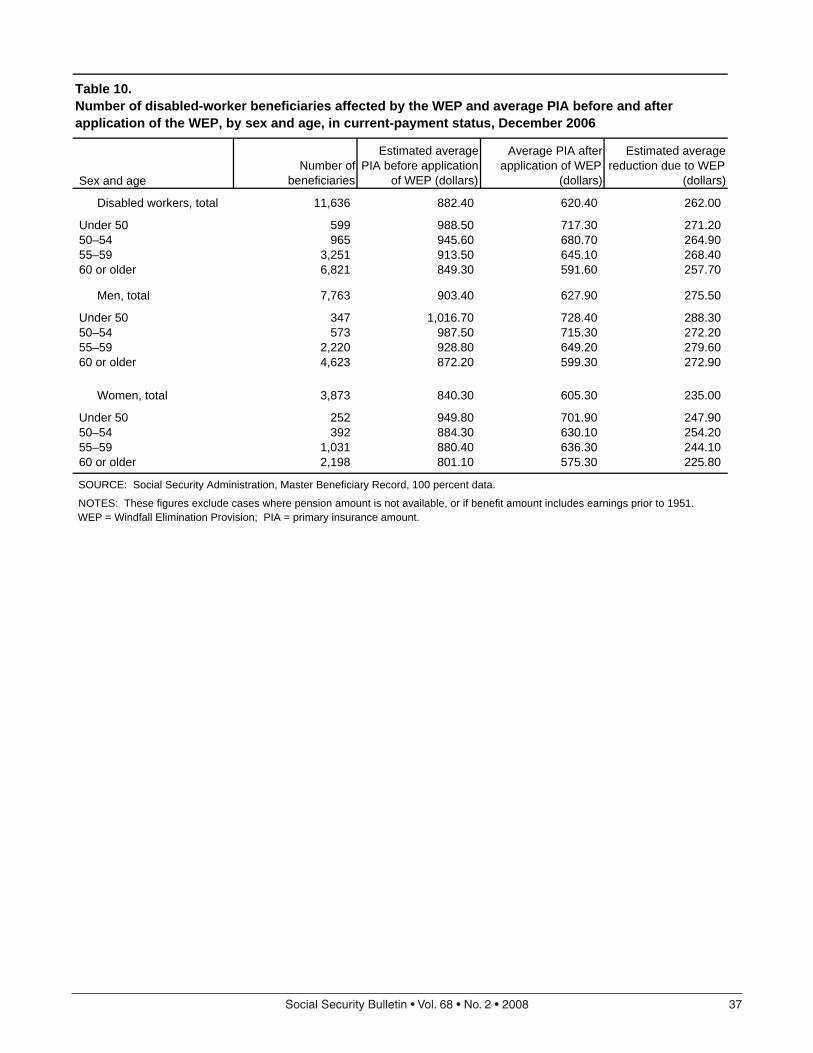
For about 87 percent of the affected workers, there was enough information to estimate the PIA before applica-tion of the WEP. The application of the WEP substan-tially reduced the PIAs of both retired and disabled workers. For retired workers, the reduction in the PIA averaged $246 or 35 percent of the PIA before applica-tion of the WEP (Table 9). Among disabled workers, the PIA reduction averaged $262 or 30 percent of the PIA before the WEP (Table 10).
The maximum reduction in the PIA due to the WEP depends on the year of first eligibility for benefits and was $328 for workers first eligible in 2006. Among retired workers aged 62–64, the estimated reduction in the PIA was $273. As noted in Table 6, almost three-quarters of retired workers affected by the WEP had
SocialSecurityBulletin•Vol.68•No.2•2008 25
fewer than 21 years of substantial covered earnings and could be subject to the maximum PIA reduction. However, the PIA reduction averaged only $119 or 18 percent for retired workers aged 80 or older (Table 9). These individuals were first eligible for benefits prior to 1989 and, thus, were affected by the gradual phase in of the WEP reduction (as discussed above).
Among retired and disabled workers affected by the WEP, average PIAs before the WEP reduction were lower than average PIAs for all workers in these groups. For affected retired workers, the average PIA before application of the WEP was $706, compared with $1,072 for all retired workers receiving benefits at the end of 2006 (Table 9) (SSA 2008, Table 5.B7). Comparable figures for disabled workers were $882 and $979, respectively (Table 10) (SSA 2008, Table 5.E1).
Benefit Amounts for Retired Workers
Retired workers receive the full PIA if they begin receiving benefits at the FRA. Monthly benefits are permanently reduced for each month of entitlement before the FRA. The maximum reduction for workers who attained age 62 before 2000 was 20 percent and is gradually increasing along with the FRA (SSA 2007a, Table 2.A17.1). The maximum reduction for workers who attained age 62 in 2006 is 25 percent, based on a FRA of 66.
The monthly benefit for retired workers is increased if the worker is dually entitled to a higher benefit as a spouse or widow(er). This worker receives the amount of the worker benefit plus the difference between that amount and the benefit he or she would receive as a spouse or widow(er). A beneficiary cannot receive both the full worker benefit and the full spouse or widow(er) benefit.
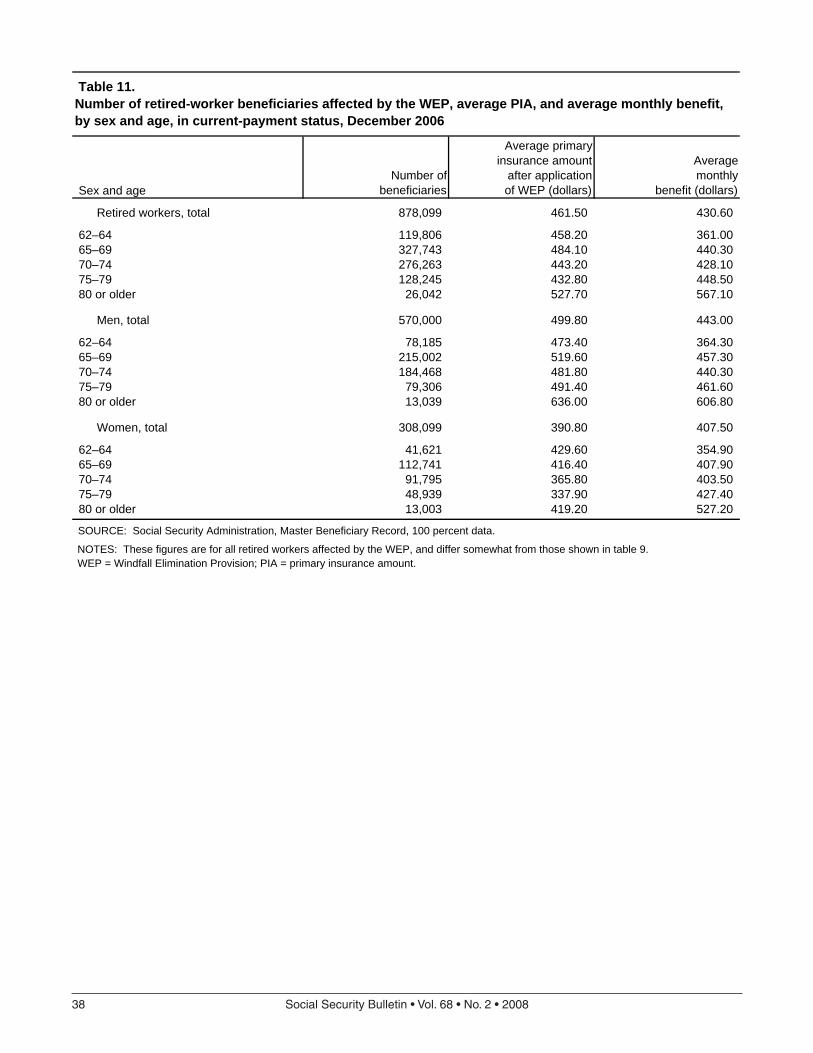
Table 11 shows average PIAs and monthly benefits for all retired workers affected by the WEP. The PIA is the amount after application of the WEP. The average benefit for those affected by the WEP—$431 (Table 11)—was much lower than average benefits for all retired workers receiving benefits—$1,044 (SSA 2008, Table 5A.1.1).
For men affected by the WEP, monthly benefits averaged $443 and PIAs averaged $500. Average ben-efits were lower than average PIAs for all age groups, reflecting a number of early retirements. Since the benefits for all men aged 62–64 were reduced for early retirement, the average benefit of $364 was only 77 percent of the average PIA of $473.
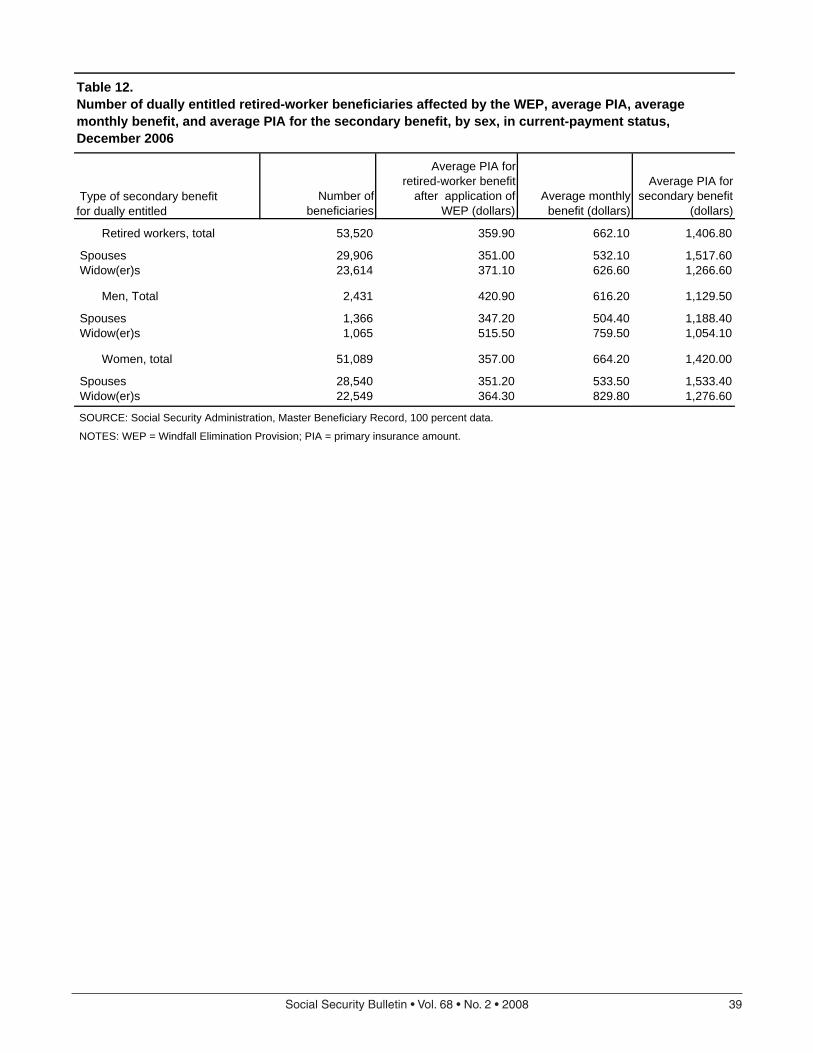
The average benefit for all women affected by the WEP ($408) was higher than the average PIA ($391). For women aged 75 or older, the average benefit was about 26 percent higher than the average PIA. About 51,000 women, one-sixth of those affected by the WEP, were dually entitled to a spouse or widow ben-efit. In contrast, only 2,400 men were dually entitled (Table 12). Benefits averaged $664 for dually entitled women and $616 for dually entitled men affected by the WEP.
For some of the dually entitled beneficiaries affected by the WEP, the amount of the spouse or widow(er) portion of the benefit may have been reduced due to the Government Pension Offset (GPO) provision. The GPO provision also affects the benefits of persons who work in noncovered employment. The WEP affects the worker benefit, and the GPO affects the spouse and widow(er) benefits of persons who receive a pension based on their own work in noncovered government employment. Thus, persons who work in noncovered employment can have their worker benefit reduced due to the WEP and their spou-sal or widow(er) benefit offset by the GPO. Unless cer-tain exceptions apply, the spousal or widow(er) benefit is generally reduced by two-thirds of the noncovered pension (SSA 2007b). The GPO could completely offset the spousal or widow(er) portion of the benefit, and, thus, the retired worker would not be counted as dually entitled in Table 12.
ConclusionThe WEP was enacted to prevent a windfall for work-ers who receive a pension from a job where they did not pay Social Security taxes, but would benefit from provisions aimed at low earners. The impact of the WEP is as intended: it helps to ensure that workers with pensions from noncovered employment do not receive the advantage of the weighted benefit formula that is intended for career-long low earners.
The number of beneficiaries affected by the WEP has been increasing and should continue to increase as the baby-boom generation retires. Certain advocacy groups and individuals affected by the WEP have raised concerns about the WEP, arguing that it unfairly targets public employees who are low earners or have careers split between covered and noncovered employ-ment. In response, during the past several Congres-sional sessions, bills were introduced to eliminate or modify the WEP:

26 SocialSecurityBulletin•Vol.68•No.2•2008
The Social Security Fairness Act of 2007 (H. R. • 82 and S. 206) would repeal the Windfall Elimina-tion Provision and also the Government Pension Offset Provision for monthly benefits payable after December 2007.The Windfall Elimination Provision Relief Act • of 2007 (H. R. 726) would combine amounts of the monthly noncovered pension and the worker’s monthly PIA and apply less stringent WEP provi-sions for smaller combined income amounts.1 The Public Servant Retirement Protection Act of • 2007 (H. R. 2772 and S. 1647) would repeal the current WEP provisions and substitute a new PIA formula based on the proportion of earnings in Social Security covered employment to the total earnings in both covered and noncovered employ-ment. 2
NotesAcknowledgments: The author is grateful to Alexander
Wasarhelyi who performed the computer programming for this project, Claire Miziolek who assisted in the legislative research, and Jacqueline Small who compiled the tables. The author is also grateful to Lynn Fisher, Russell Hudson, and Gayle Reznik for reviewing the manuscript and provid-ing many helpful comments.
1 The WEP would be eliminated for individuals with a combined amount of $2,500, would be phased in gradually for those with monthly amounts between $2,500 and $3,334, and would apply fully for the combined amount of $3,335 or more. The dollar threshold amounts would be indexed to annual increases in the average wage.
2 This new method would apply to those who first per-form noncovered employment one year after enactment or to persons who performed covered employment before that time and would benefit by the provision.
ReferencesCommittee on Ways and Means. 1996. 1996 Green book,
background material and data on programs within the jurisdiction of the Committee on Ways and Means. Wash-ington, DC: Government Printing Office.
———. 2004. 2004 Green book, background material and data on programs within the jurisdiction of the Commit-tee on Ways and Means. Washington, DC: Government Printing Office.
House of Representatives. 1983. Social Security Amend-ments of 1983, conference report. Washington, DC.
National Commission on Social Security. 1981. Social Secu-rity in America’s future. Washington, DC: Government Printing Office.
[NCSSR] National Commission on Social Security Reform. 1983. Report of the National Commission on Social Security Reform. Washington, DC: Government Printing Office.
[SSA] Social Security Administration. 2007a. Annual Sta-tistical Supplement to the Social Security Bulletin, 2006. Washington, DC: SSA.
———. 2007b. Electronic fact sheet: Government pension offset. SSA Publication No. 05-10007. Baltimore, MD: SSA.
———. 2007c. Electronic fact sheet: Windfall elimination provision. SSA Publication No. 05-10045. Baltimore, MD: SSA.
———. 2008. Annual Statistical Supplement to the Social Security Bulletin, 2007. Washington, DC: SSA.
Svahn, John A., and Mary Ross. 1983. Social Security Amendments of 1983: Legislative history and summary of provisions. Social Security Bulletin 46(3): 3–48.
SocialSecurityBulletin•Vol.68•No.2•2008 27
Table 1. Number of beneficiaries with benefits affected by the WEP in current-payment status, by sex and type ofbenefit, December 1999–2006
Year TotalRetired workers Disabled workers Spouses and
childrenMen Women Men Women
1999 469,602 279,550 138,034 4,002 1,941 46,0752000 553,059 330,277 162,568 4,549 2,209 53,4562001 621,247 370,647 183,957 5,134 2,624 58,8852002 689,980 410,456 206,542 5,820 2,989 64,1732003 757,930 449,207 230,523 6,647 3,416 68,1372004 829,735 489,550 256,282 7,523 3,918 72,4622005 902,794 531,113 282,372 8,495 4,422 76,3922006 971,310 570,000 308,099 9,202 4,856 79,153
SOURCE: Social Security Administration, Master Beneficiary Record, 100 percent data.
NOTE: WEP = Windfall Elimination Provision.
Table 2.Number of retired-worker and disabled-worker beneficiaries with benefits affected by the WEP and percent of total affected, by sex, age, and type of beneficiary, in current-payment status, December 2006
Type of beneficiaryNumber affected by the
WEP (in thousands) Total number receivingbenefits (in thousands)
Percentage of total affected by the WEP
All workers 892,157 37,783,061 2.4Retired workers, total 878,099 30,976,143 2.8
SexMen 570,000 15,869,182 3.6Women 308,099 15,106,961 2.0
Age62–64 119,806 2,840,334 4.265–69 327,743 8,098,996 4.070–74 276,263 6,833,648 4.075–79 128,245 5,581,592 2.380 or older 26,042 7,621,573 0.3
Disabled workers, total 14,058 6,806,918 0.2Sex
Men 9,202 3,643,121 0.3Women 4,856 3,163,797 0.2
AgeUnder 50 798 2,318,440 a50–54 1,323 1,176,128 0.155–59 4,099 1,516,025 0.360–65 7,838 1,796,325 0.4
SOURCE: Social Security Administration, Master Beneficiary Record, 100 percent data.
NOTE: WEP = Windfall Elimination Provision.
a. Less than 0.05 percent
28 SocialSecurityBulletin•Vol.68•No.2•2008
Table 3.Number of beneficiaries in current-payment status with benefits affected by the WEP, by state and type of benefit, December 2006
State TotalRetiredworkers
Disabledworkers
Spouses and children
All areas 971,310 878,099 14,058 79,153
Alabama 13,477 11,912 261 1,304Alaska 4,600 4,270 80 250Arizona 17,579 15,978 296 1,305Arkansas 7,788 7,010 200 578California 120,458 109,715 1,588 9,155
Colorado 27,957 25,669 316 1,972Connecticut 8,742 8,199 134 409Delaware 2,191 1,994 52 145District of Columbia 5,995 5,629 108 258Florida 56,471 51,346 712 4,413
Georgia 27,497 25,361 380 1,756Hawaii 6,214 5,580 86 548Idaho 4,147 3,750 60 337Illinois 49,565 46,288 506 2,771Indiana 9,805 8,847 216 742
Iowa 5,712 5,254 64 394Kansas 6,100 5,564 98 438Kentucky 12,283 11,109 268 906Louisiana 18,299 16,090 443 1,766Maine 8,644 7,908 143 593
Maryland 30,674 28,247 428 1,999Massachusetts 32,140 30,165 471 1,504Michigan 12,139 10,930 221 988Minnesota 12,114 11,206 133 775Mississippi 6,624 5,906 146 572
Missouri 20,342 18,832 330 1,180Montana 3,545 3,188 62 295Nebraska 3,664 3,376 41 247Nevada 12,230 11,401 181 648New Hampshire 4,326 3,959 91 276
New Jersey 14,984 13,621 289 1,074New Mexico 8,428 7,362 162 904New York 21,889 19,854 363 1,672North Carolina 17,855 16,321 300 1,234North Dakota 1,810 1,641 14 155
Ohio 70,599 64,752 876 4,971Oklahoma 12,397 11,068 259 1,070Oregon 9,643 8,788 137 718Pennsylvania 23,640 21,284 482 1,874Rhode Island 3,017 2,757 71 189
(Continued)

SocialSecurityBulletin•Vol.68•No.2•2008 29
Table 3.Continued
State TotalRetiredworker
Disabledworker
Spouses and children
South Carolina 11,114 10,075 169 870South Dakota 2,645 2,437 33 175Tennessee 12,642 11,371 176 1,095Texas 80,990 73,749 1,054 6,187Utah 8,556 7,607 124 825
Vermont 1,715 1,559 22 134Virginia 32,442 29,325 412 2,705Washington 18,575 16,486 289 1,800West Virginia 4,305 3,762 105 438Wisconsin 8,028 7,418 99 511Wyoming 1,620 1,483 23 114
Outlying areas and foreign countries 53,094 40,696 484 11,914
SOURCE: Social Security Administration, Master Beneficiary Record, 100 percent data.
NOTE: WEP = Windfall Elimination Provision.

30 SocialSecurityBulletin•Vol.68•No.2•2008
Table 4.Number of retired workers in current-payment status with benefits affected by the WEP, by state, December 2006
State or area
Total number of retired workers
receiving benefits a
Number ofretired workers
affected by WEPPercentage of total
affected by WEP
All Areas 30,976,145 878,099 2.8
Alabama 502,502 11,912 2.4Alaska 40,237 4,270 10.6Arizona 617,724 15,978 2.6Arkansas 327,697 7,010 2.1California 2,912,853 109,715 3.8
Colorado 392,178 25,669 6.5Connecticut 408,611 8,199 2.0Delaware 100,779 1,994 2.0District of Columbia 45,919 5,629 12.3Florida 2,349,812 51,346 2.2
Georgia 764,680 25,361 3.3Hawaii 146,599 5,580 3.8Idaho 150,186 3,750 2.5Illinois 1,238,100 46,288 3.7Indiana 683,997 8,847 1.3
Iowa 369,639 5,254 1.4Kansas 299,083 5,564 1.9Kentucky 424,678 11,109 2.6Louisiana 371,872 16,090 4.3Maine 167,240 7,908 4.7
Maryland 515,455 28,247 5.5Massachusetts 695,199 30,165 4.3Michigan 1,103,565 10,930 1.0Minnesota 537,792 11,206 2.1Mississippi 296,755 5,906 2.0
Missouri 663,590 18,832 2.8Montana 111,990 3,188 2.8Nebraska 194,403 3,376 1.7Nevada 240,460 11,401 4.7New Hampshire 148,322 3,959 2.7
New Jersey 948,401 13,621 1.4New Mexico 192,565 7,362 3.8New York 2,001,974 19,854 1.0North Carolina 970,774 16,321 1.7North Dakota 73,133 1,641 2.2
Ohio 1,220,222 64,752 5.3Oklahoma 394,760 11,068 2.8Oregon 424,170 8,788 2.1Pennsylvania 1,571,817 21,284 1.4Rhode Island 128,410 2,757 2.1
(Continued)
SocialSecurityBulletin•Vol.68•No.2•2008 31
Table 4.Continued
State or area
Total number of retired workers
receiving benefits a
Number ofretired workers
affected by WEPPercentage of total
affected by WEP
South Carolina 489,743 10,075 2.1South Dakota 94,207 2,437 2.6Tennessee 659,946 11,371 1.7Texas 1,807,535 73,749 4.1Utah 182,948 7,607 4.2
Vermont 73,887 1,559 2.1Virginia 725,945 29,325 4.0Washington 631,195 16,486 2.6West Virginia 212,985 3,762 1.8Wisconsin 649,341 7,418 1.1Wyoming 55,007 1,483 2.7
Outlying areas and foreign countries 645,263 40,696 6.3
SOURCE: Social Security Administration, Master Beneficiary Record, 100 percent data.
NOTE: WEP = Windfall Elimination Provision.a. Includes two special age-72 beneficiaries. Special age-72 beneficiaries are persons who attained age 72 before 1972 and do not qualify
for retired-worker benefits.
Table 5.Number and percentage distribution of retired and disabled workers in current-payment status with benefits affected by the WEP, by source of noncovered pension, December 2006
Source of noncovered pensionTotal Retired workers Disabled workers
Number Percent Number Percent Number Percent
Total 892,157 100.0 878,099 100.0 14,058 100.0
Federal government 434,525 48.7 428,690 48.8 5,835 41.5State and local government 323,645 36.3 318,346 36.3 5,299 37.7Other 117,951 13.2 115,770 13.2 2,181 15.5Not available 16,036 1.8 15,293 1.7 743 5.3
SOURCE: Social Security Administration, Master Beneficiary Record, 100 percent data.NOTE: WEP = Windfall Elimination Provision.

32 SocialSecurityBulletin•Vol.68•No.2•2008
Table 6.Number and percentage distribution of retired and disabled workers affected by the WEP, by sex and years of substantial covered earnings, in current-payment status, at end of December 2006
Years of substantial covered earnings Total
Retiredworkers
Disabledworkers Men Women
Number of beneficiaries
Total 892,157 878,099 14,058 579,202 312,955
Less than 21 654,428 644,553 9,875 413,665 242,42721 or more 164,848 162,331 2,517 130,151 34,697
21 25,586 25,210 376 19,885 5,70122 23,966 23,617 349 19,034 4,93223 21,981 21,637 344 17,433 4,54824 19,822 19,516 306 15,711 4,11125 17,518 17,236 282 13,834 3,68426 16,043 15,787 256 12,624 3,41927 14,269 14,049 220 11,313 2,95628 12,900 12,700 200 10,179 2,72129 12,763 12,579 184 10,138 2,625
Not available 72,881 71,215 1,666 35,386 35,831
Percentage distribution
Total 100.0 100.0 100.0 100.0 100.0
Less than 21 73.4 73.4 70.2 71.4 77.521 or more 18.5 18.5 17.9 22.5 11.1
21 2.9 2.9 2.7 3.4 1.822 2.7 2.7 2.5 3.3 1.623 2.5 2.5 2.4 3.0 1.524 2.2 2.2 2.2 2.7 1.325 2.0 2.0 2.0 2.4 1.226 1.8 1.8 1.8 2.2 1.127 1.6 1.6 1.6 2.0 0.928 1.4 1.4 1.4 1.8 0.929 1.4 1.4 1.3 1.8 0.8
Not available 8.2 8.1 11.9 6.1 11.4
SOURCE: Social Security Administration, Master Beneficiary Record, 100 percent data.
NOTE: WEP = Windfall Elimination Provision.
SocialSecurityBulletin•Vol.68•No.2•2008 33
Table 7.Number of retired and disabled workers affected by the WEP who became entitled to benefits in 2004–2006, by type of benefit, sex, and monthly noncovered pension amount, in current-payment status, at end of December 2006
Monthly noncovered pension amount (dollars) Total
Retiredworkers
Disabledworkers Men Women
Number of beneficiaries
Total 123,374 119,593 3,781 80,558 42,816
Less than 1,000.00 20,584 19,673 911 6,680 13,9041,000.00–1,999.90 35,988 34,383 1,605 21,243 14,7452,000.00–2,999.90 31,291 30,467 824 23,154 8,1373,000.00–3,999.90 17,787 17,560 227 14,309 3,4784,000.00–4,999.90 9,325 9,223 102 8,005 1,3205,000.00–5,999.90 4,367 4,340 27 3,838 5296,000.00 or more 3,028 3,011 17 2,737 291Not available 1,004 936 68 592 412
Percentage distributionTotal 100.0 100.0 100.0 100.0 100.0
Less than 1,000.00 16.7 16.4 24.1 8.3 32.51,000.00–1,999.90 29.2 28.8 42.4 26.4 34.42,000.00–2,999.90 25.4 25.5 21.8 28.7 19.03,000.00–3,999.90 14.4 14.7 6.0 17.8 8.14,000.00–4,999.90 7.6 7.7 2.7 9.9 3.15,000.00–5,999.90 3.5 3.6 0.7 4.8 1.26,000.00 or more 2.5 2.5 0.4 3.4 0.7Not available 0.8 0.8 1.8 0.7 1.0
SOURCE: Social Security Administration, Master Beneficiary Record, 100 percent data.NOTE: WEP = Windfall Elimination Provision.

34 SocialSecurityBulletin•Vol.68•No.2•2008
Table 8.Number and percentage distribution of retired workers affected by the WEP who became entitled to benefits in 2004–2006 with noncovered pension amount available, by sex, monthly noncovered pension amount, and PIA, in current-payment status, at end of December 2006
Monthly noncovered pension amount (dollars) Total
PIA after application of WEP (dollars)
Less than 300.00 300.00–599.90 600.00 or more
Number of beneficiaries
Total, pension amount available 118,657 43,493 47,012 28,152
Less than 1,000.00 19,673 5,022 6,840 7,8111,000.00–1,999.90 34,383 12,008 13,610 8,7652,000.00–2,999.00 30,467 12,130 12,718 5,6193,000.00–3,999.90 17,560 7,319 7,218 3,0234,000.00–4,999.00 9,223 4,020 3,711 1,4925,000.00–5,999.00 4,340 1,792 1,757 7916,000.00 or more 3,011 1,202 1,158 651
Men, pension amount available 77,422 25,430 32,960 19,032
Less than 1,000.00 6,282 712 1,913 3,6571,000.00–1,999.90 20,092 4,873 8,953 6,2662,000.00–2,999.00 22,476 8,187 10,078 4,2113,000.00–3,999.90 14,122 5,640 6,050 2,4324,000.00–4,999.00 7,912 3,351 3,309 1,2525,000.00–5,999.00 3,815 1,574 1,576 6656,000.00 or more 2,723 1,093 1,081 549
Women, pension amount available 41,235 18,063 14,052 9,120
Less than 1,000.00 13,391 4,310 4,927 4,1541,000.00–1,999.90 14,291 7,135 4,657 2,4992,000.00–2,999.00 7,991 3,943 2,640 1,4083,000.00–3,999.90 3,438 1,679 1,168 5914,000.00–4,999.00 1,311 669 402 2405,000.00–5,999.00 525 218 181 1266,000.00 or more 288 109 77 102
(Continued)
SocialSecurityBulletin•Vol.68•No.2•2008 35
Table 8.Continued
Monthly noncovered pension amount (dollars) Total
PIA after application of WEP (dollars)
Less than 300.00 300.00–599.90 600.00 or more
Percentage distribution
Total, pension amount available 100.0 36.7 39.6 23.7
Less than 1,000.00 100.0 25.5 34.8 39.71,000.00–1,999.90 100.0 34.9 39.6 25.52,000.00–2,999.00 100.0 39.8 41.7 18.43,000.00–3,999.90 100.0 41.7 41.1 17.24,000.00–4,999.00 100.0 43.6 40.2 16.25,000.00–5,999.00 100.0 41.3 40.5 18.26,000.00 or more 100.0 39.9 38.5 21.6
Men, pension amount available 100.0 32.8 42.6 24.6
Less than 1,000.00 100.0 11.3 30.5 58.21,000.00–1,999.90 100.0 24.3 44.6 31.22,000.00–2,999.00 100.0 36.4 44.8 18.73,000.00–3,999.90 100.0 39.9 42.8 17.24,000.00–4,999.00 100.0 42.4 41.8 15.85,000.00–5,999.00 100.0 41.3 41.3 17.46,000.00 or more 100.0 40.1 39.7 20.2
Women, pension amount available 100.0 43.8 34.1 22.1
Less than 1,000.00 100.0 32.2 36.8 31.01,000.00–1,999.90 100.0 49.9 32.6 17.52,000.00–2,999.00 100.0 49.3 33.0 17.63,000.00–3,999.90 100.0 48.8 34.0 17.24,000.00–4,999.00 100.0 51.0 30.7 18.35,000.00–5,999.00 100.0 41.5 34.5 24.06,000.00 or more 100.0 37.8 26.7 35.4
SOURCE: Social Security Administration, Master Beneficiary Record, 100 percent data.
NOTES: WEP = Windfall Elimination Provision; PIA = primary insurance amount.

36 SocialSecurityBulletin•Vol.68•No.2•2008
Table 9.Number of retired-worker beneficiaries affected by the WEP and average PIA before and after application of the WEP, by sex and age, in current-payment status, December 2006
Sex and age Number of
beneficiaries
Estimated averagePIA before application
of WEP (dollars)
Average PIA afterapplication of WEP
(dollars)
Estimated Average reduction due to
WEP (dollars)
Retired workers, total 769,144 706.20 460.30 245.90
62–64 101,832 730.90 457.70 273.20 65–69 302,827 742.50 479.60 262.90 70–74 246,845 676.90 442.10 234.80 75–79 100,949 652.90 436.90 216.00 80 or older 16,691 655.30 536.40 118.90
Men, total 513,885 747.70 493.00 254.70
62–64 67,047 760.20 472.60 287.60 65–69 201,866 784.20 511.60 272.60 70–74 169,751 715.20 475.20 240.00 75–79 66,057 706.20 484.40 221.80 80 or older 9,164 750.70 621.70 129.00
Women, total 255,259 622.90 394.50 228.40
62–64 34,785 674.50 428.80 245.70 65–69 100,961 659.00 415.40 243.60 70–74 77,094 592.60 369.30 223.30 75–79 34,892 552.10 346.90 205.20 80 or older 7,527 539.10 432.50 106.60
SOURCE: Social Security Administration, Master Beneficiary Record, 100 percent data.
NOTES: These figures exclude cases where pension amount is not available, or if benefit amount includes earnings prior to 1951 and differ somewhat from figures shown in Table 11.
WEP = Windfall Elimination Provision; PIA = primary insurance amount.
SocialSecurityBulletin•Vol.68•No.2•2008 37
Table 10.Number of disabled-worker beneficiaries affected by the WEP and average PIA before and after application of the WEP, by sex and age, in current-payment status, December 2006
Sex and age Number of
beneficiaries
Estimated average PIA before application
of WEP (dollars)
Average PIA afterapplication of WEP
(dollars)
Estimated average reduction due to WEP
(dollars)
Disabled workers, total 11,636 882.40 620.40 262.00
Under 50 599 988.50 717.30 271.20 50–54 965 945.60 680.70 264.90 55–59 3,251 913.50 645.10 268.40 60 or older 6,821 849.30 591.60 257.70
Men, total 7,763 903.40 627.90 275.50
Under 50 347 1,016.70 728.40 288.30 50–54 573 987.50 715.30 272.20 55–59 2,220 928.80 649.20 279.60 60 or older 4,623 872.20 599.30 272.90
Women, total 3,873 840.30 605.30 235.00
Under 50 252 949.80 701.90 247.90 50–54 392 884.30 630.10 254.20 55–59 1,031 880.40 636.30 244.10 60 or older 2,198 801.10 575.30 225.80
SOURCE: Social Security Administration, Master Beneficiary Record, 100 percent data.
NOTES: These figures exclude cases where pension amount is not available, or if benefit amount includes earnings prior to 1951. WEP = Windfall Elimination Provision; PIA = primary insurance amount.
38 SocialSecurityBulletin•Vol.68•No.2•2008
Table 11.Number of retired-worker beneficiaries affected by the WEP, average PIA, and average monthly benefit, by sex and age, in current-payment status, December 2006
Sex and ageNumber of
beneficiaries
Average primaryinsurance amount
after applicationof WEP (dollars)
Averagemonthly
benefit (dollars)
Retired workers, total 878,099 461.50 430.60
62–64 119,806 458.20 361.00 65–69 327,743 484.10 440.30 70–74 276,263 443.20 428.10 75–79 128,245 432.80 448.50 80 or older 26,042 527.70 567.10
Men, total 570,000 499.80 443.00
62–64 78,185 473.40 364.30 65–69 215,002 519.60 457.30 70–74 184,468 481.80 440.30 75–79 79,306 491.40 461.60 80 or older 13,039 636.00 606.80
Women, total 308,099 390.80 407.50
62–64 41,621 429.60 354.90 65–69 112,741 416.40 407.90 70–74 91,795 365.80 403.50 75–79 48,939 337.90 427.40 80 or older 13,003 419.20 527.20
SOURCE: Social Security Administration, Master Beneficiary Record, 100 percent data.
NOTES: These figures are for all retired workers affected by the WEP, and differ somewhat from those shown in table 9. WEP = Windfall Elimination Provision; PIA = primary insurance amount.
SocialSecurityBulletin•Vol.68•No.2•2008 39
Table 12.Number of dually entitled retired-worker beneficiaries affected by the WEP, average PIA, average monthly benefit, and average PIA for the secondary benefit, by sex, in current-payment status, December 2006
Type of secondary benefit for dually entitled
Number of beneficiaries
Average PIA forretired-worker benefit
after application of WEP (dollars)
Average monthlybenefit (dollars)
Average PIA for secondary benefit
(dollars)
Retired workers, total 53,520 359.90 662.10 1,406.80
Spouses 29,906 351.00 532.10 1,517.60 Widow(er)s 23,614 371.10 626.60 1,266.60
Men, Total 2,431 420.90 616.20 1,129.50
Spouses 1,366 347.20 504.40 1,188.40 Widow(er)s 1,065 515.50 759.50 1,054.10
Women, total 51,089 357.00 664.20 1,420.00
Spouses 28,540 351.20 533.50 1,533.40 Widow(er)s 22,549 364.30 829.80 1,276.60
SOURCE: Social Security Administration, Master Beneficiary Record, 100 percent data.
NOTES: WEP = Windfall Elimination Provision; PIA = primary insurance amount.
Related Documents