Social Sectors Table 10.1 : India’s global position on human and gender development Country Human development HDI Rank Gender development GDI Rank index (HDI) index (GDI) 2000 2003 2000 2003 2000 2003 2000 2003 Norway 0.942 0.963 1 1 0.941 0.960 3 1 Australia 0.939 0.955 5 3 0.956 0.954 1 2 Sri Lanka 0.741 0.751 89 93 0.737 0.747 70 66 China 0.726 0.755 96 85 0.724 0.754 77 64 Indonesia 0.684 0.697 110 110 0.678 0.691 91 87 India 0.577 0.602 124 127 0.560 0.586 105 98 Pakistan 0.499 0.527 138 135 0.468 0.508 120 107 Bangladesh 0.478 0.520 145 139 0.468 0.514 121 105 Nepal 0.490 0.526 142 136 0.470 0.511 119 106 Mozambique 0.322 0.379 170 168 0.307 0.365 144 133 Niger 0.277 0.281 172 177 0.263 0.271 146 140 Source : UNDP Human Development Report (HDR) 2002 & 2005. Development and utilisation of human resources and the improvement in the overall quality of life of the people are central to any development planning. There are, however, two-way linkages between human development and overall economic progress. Sustained high economic growth is a necessary condition and a significant driver of human development. On the other hand, if people are healthy, educated and adequately skilled, they can participate fully and contribute more to economic development process. The Tenth Five Year Plan recognized these linkages while laying down monitorable targets for human development for the Plan. 10.2 Over the years, India has made substantial progress in human development. Sustained and high economic growth in the post-reform period reduced the poverty ratio significantly. There was also noteworthy improvement in the literacy rates over time leading to a decline in the absolute number of illiterates. However, India’s overall performance on human development has been mixed in the last decade. Improvements in health indicators like life expectancy and infant mortality rates have been much slower than expected. There is widespread under- nutrition among women and children, and maternal and child health still remain areas of concern. 10.3 UNDP’s global Human Development Report (HDR) for 2005 ranks India at 127 out of 177 countries of the world in terms of a composite Human Development Index (HDI) for 2003 (Table 10.1). Between 2000 and 2003, while the absolute values of HDI and Gender Development Index (GDI) consistently improved for India, its ranking remained invariant at 127 consecutively for three years in a row. On the other hand, some of India’s neighbours not only improved their HDI and GDI values, but also improved their relative ranks. 10 website: http:/indiabudget.nic.in

Welcome message from author
This document is posted to help you gain knowledge. Please leave a comment to let me know what you think about it! Share it to your friends and learn new things together.
Transcript
Social Sectors
Table 10.1 : India’s global position on human and gender development
Country Human development HDI Rank Gender development GDI Rankindex (HDI) index (GDI)
2000 2003 2000 2003 2000 2003 2000 2003
Norway 0.942 0.963 1 1 0.941 0.960 3 1Australia 0.939 0.955 5 3 0.956 0.954 1 2Sri Lanka 0.741 0.751 89 93 0.737 0.747 70 66China 0.726 0.755 96 85 0.724 0.754 77 64Indonesia 0.684 0.697 110 110 0.678 0.691 91 87India 0.577 0.602 124 127 0.560 0.586 105 98Pakistan 0.499 0.527 138 135 0.468 0.508 120 107Bangladesh 0.478 0.520 145 139 0.468 0.514 121 105Nepal 0.490 0.526 142 136 0.470 0.511 119 106Mozambique 0.322 0.379 170 168 0.307 0.365 144 133Niger 0.277 0.281 172 177 0.263 0.271 146 140
Source : UNDP Human Development Report (HDR) 2002 & 2005.
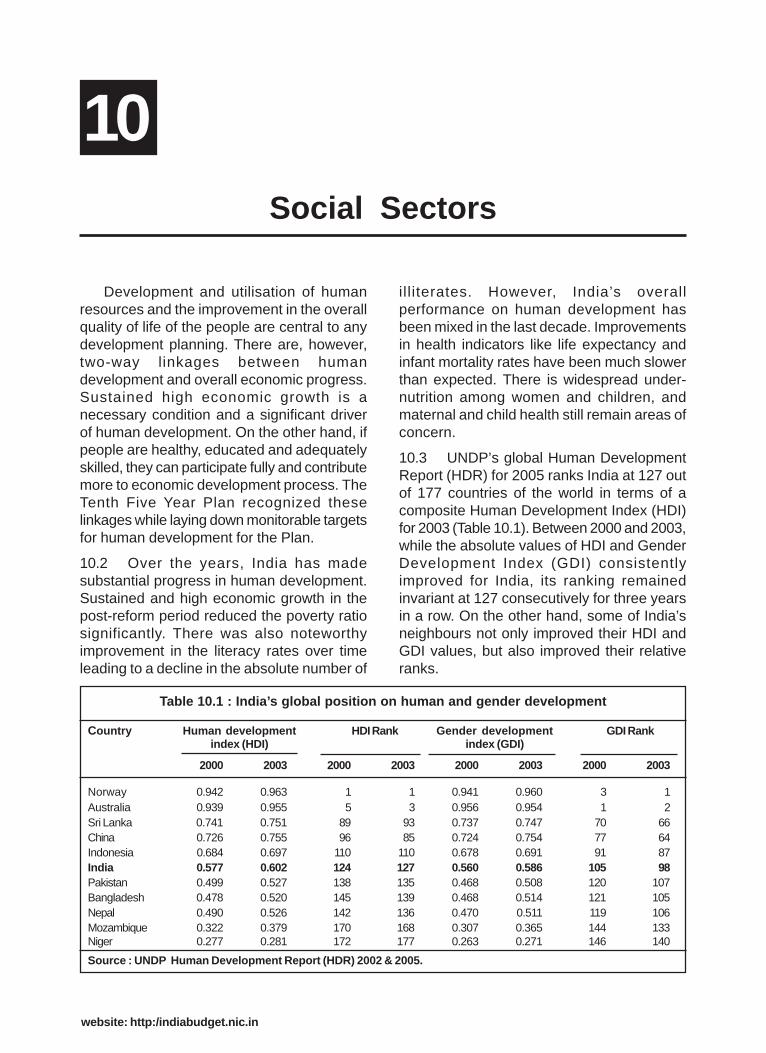
Development and utilisation of humanresources and the improvement in the overallquality of life of the people are central to anydevelopment planning. There are, however,two-way linkages between humandevelopment and overall economic progress.Sustained high economic growth is anecessary condition and a significant driverof human development. On the other hand, ifpeople are healthy, educated and adequatelyskilled, they can participate fully and contributemore to economic development process. TheTenth Five Year Plan recognized theselinkages while laying down monitorable targetsfor human development for the Plan.
10.2 Over the years, India has madesubstantial progress in human development.Sustained and high economic growth in thepost-reform period reduced the poverty ratiosignificantly. There was also noteworthyimprovement in the literacy rates over timeleading to a decline in the absolute number of
illiterates. However, India’s overallperformance on human development hasbeen mixed in the last decade. Improvementsin health indicators like life expectancy andinfant mortality rates have been much slowerthan expected. There is widespread under-nutrition among women and children, andmaternal and child health still remain areas ofconcern.
10.3 UNDP’s global Human DevelopmentReport (HDR) for 2005 ranks India at 127 outof 177 countries of the world in terms of acomposite Human Development Index (HDI)for 2003 (Table 10.1). Between 2000 and 2003,while the absolute values of HDI and GenderDevelopment Index (GDI) consistentlyimproved for India, its ranking remainedinvariant at 127 consecutively for three yearsin a row. On the other hand, some of India’sneighbours not only improved their HDI andGDI values, but also improved their relativeranks.
10
website: http:/indiabudget.nic.in

203Social Sectors
website: http:/indiabudget.nic.in
Box 10.1 : Major initiatives in the Social Sector undertaken in 2005-06
! National Rural Employment Guarantee Scheme launched.
! An ambitious programme for creation of rural infrastructure viz, Bharat Nirman has been launched tobring an additional one crore hectares under assured irrigation; to connect all villages with a populationof 1000 (500 in hilly/tribal areas) with a road; to construct 60 lakh additional houses for the poor; to providedrinking water to the remaining 74,000 habitations; to reach electricity to the remaining 1,25,000 villagesand offer electricity connection to 2.3 crore households; and to provide telephone connectivity to theremaining 66,822 villages.
! Allocation for National Food for Work programme increased from Rs.4,020 crore in 2004-05 to Rs.11,000crore in 2005-06. Programme to be converted into the National Rural Employment Guarantee Scheme.
! National Rural Health Mission (NRHM) has been launched on April 12, 2005 with the objective of providinggreater access of the rural population especially the rural poor to the public health care facilities. Majorcomponents of the programme include training of health volunteers, providing more medicines andstrengthening the primary and community health centres. NRHM has an initial outlay of Rs. 6, 731 crorein 2005-06 (BE).
! Antyodaya Anna Yojana: Coverage increased to 2.5 crore families in 2005-06 from 2 crore in 2004-05.
! Mid Day Meal Scheme: Increase in allocation from Rs . 1,675 crore in 2004-05 to Rs.3,010 crore in 2005-06.
! Sarva Shiksha Abhiyan: Allocation increased to Rs.7,156 crore in 2005-06 from Rs. 5080 crore in2004-05. A non-lapsable fund called “Prarambhik Shiksha Kosh” has been created on November 14,2005 for funding the programme.
! Rural Infrastructure Development Fund: The budget for 2005-06 had announced a corpus of Rs.8,000crore in 2005-06.
! Jawahar Lal Nehru National Urban Renewal Mission (JLNNURM) has been launched on December 3,2005 in selected cities which include an urban infrastructure development scheme for small and mediumtowns to provide reform linked assistance to the state Governments for infrastructure projects includingwater supply and sewerage projects for all towns and cities.
10.4 Progress of social development hasvaried across States. While Kerala stood apartfrom the rest and achieved high levels ofhuman development comparable to the richdeveloped countries, the so called ‘BIMARU’states (viz. Bihar, Madhya Pradesh, Rajasthanand Uttar Pradesh) fared particularly badly.Social sector subjects mostly fall under theState list. However, guided by the objectiveslaid down in the National Common MinimumProgramme (NCMP), the Central Governmenthas launched certain major initiatives for socialsector development (Box 10.1).
10.5 The launching of the National RuralEmployment Guarantee Scheme (NREGS) onFebruary 2, 2006 to provide enhancedlivelihood security for the poor in rural areasby providing at least 100 days of guaranteedwage employment in every financial year toevery household whose adult membersvolunteer to do unskilled manual work
constituted a major milestone in the socialsector in 2005-06 (Box 10.2).
10.6 Central Government also providesassistance to the States for social sectordevelopment in the form of central assistanceto States Plan, centrally sponsored schemes(CSS), special central assistance andadditional central assistance. Expenditure ofthe Central Government on social servicesincluding rural development increased fromRs.18,240 crore in 1995-96 to Rs. 70,910 crorein 2005-06 (BE) (Table 10.2).
10.7 Trends of expenditure on socialservices by the general government (Centreand States combined) in the recent yearsreflect the emphasis on the social sector.(Table 10.3).
(a) Expenditure on social sectors as aproportion of total expenditure afterdecreasing from 22.3 per cent in

Economic Survey 2005-2006204
website: http:/indiabudget.nic.in
Table 10.2 : Central Government expenditure (Plan and Non-Plan)on social services and rural development
(Rs. Crore)
Social service 1995-96 2000-01 2001-02 2002-03 2003-04 2004-05 2005-06 (RE) (BE)
1. Social service
a. Education, Sports, Youth Affairs 3,630 7,696 8,642 9,885 10,917 13,358 18,175
b. Health & Family Welfare 2,542 5,291 5,977 6,521 6,856 7,900 9,697
c. Water Supply, Housing etc. 1,756 4,932 5,989 6,815 7,117 8,272 9,364
d. Information & Broadcasting 596 1,317 1,284 1,395 1,270 1,321 1,472
e. Welfare of SC/ST and OBC 800 968 1,093 1,152 1,144 1,270 1,508
f. Labour & Employment 507 894 847 771 827 1,022 1191
g. Social welfare & Nutrition 1,270 2,409 2,620 2,372 2,173 2,423 3,819
h. North-Eastern areas 4,193 6,378 9,143
i. Other Social Services 530 1,715 2,010 438 727 1,948 818
Total 11,631 25,222 28,462 29,349 35,24 43,892 55,187
2. Rural Development 6,609 4,449 6,241 11,960 11,389 8,598 11,503
3. I) Pradhan Mantri Gramodaya Yojana(PMGY)* 2,350 2,533 2,600 2,400 2,766 —
ii). Pradhan Mantri Gram Sadak Yojana(PMGSY)* 2,500 2,500 2,500 2,325 2,468 4,220
4. Social Service, Rural Dev, PMGY and PMGSY(1+2+3) 18,240 34,521 39,736 45,440 51,497 57,724 70,910
* : Launched in 2000-01 (BE) as a new initiative for basic rural needs. However, PMGY has been discontinuedfrom 2005-06.
Source : Budget documents.
Box 10.2 : National Rural Employment Guarantee Act 2005
The National Rural Employment Guarantee Act was notified on September 7, 2005 and the scheme launchedon February 2, 2006. The on-going programmes of Sampoorna Grameen Rozgar Yojana (SGRY) and NationalFood For Work Programme (NFFWP) will be subsumed within the NREGS in the 200 districts identified in theinitial stage. All the districts in the country will be covered under the scheme within five years.
The objective of the Act is to enhance the livelihood security of the people in rural areas by generating wageemployment through works that develop the infrastructure base of that area. The choice of work suggestedaddresses the causes of chronic poverty like drought, deforestation, and soil erosion. The objective behindsuggesting certain key activities/works is to rejuvenate the natural resources of the area to stimulate the localeconomy enabling those who work for wage employment in creating an asset to take advantage of it to engagein productive ways of self-employment, and augment their income.
Implementation of the Act calls for the formulation of NREGSs by the State Governments. Section 4 of the Actprovides that within six months from the date of commencement of the Act, every State Government shall, bynotification, make a scheme for providing not less than 100 days of guaranteed employment in a financial yearto every household in the rural areas covered under the scheme and whose adult members volunteer to dounskilled manual work subject to the conditions laid down in the Act.
2000-01 to 19.7 per cent in 2003-04,increased to 20.7 per cent in 2004-05and further to 20.9 per cent in 2005-06(BE).
(b) Expenditure on education as aproportion of total expenditure has
increased from 9.7 per cent in 2003-04to 10.1 per cent in 2005-06 (BE).
(c) Similarly in respect of the health sector,the share in total expenditure increasedfrom 4.4 per cent to 4.9 per centbetween 2003-04 and 2005-06 (BE).
205Social Sectors
website: http:/indiabudget.nic.in
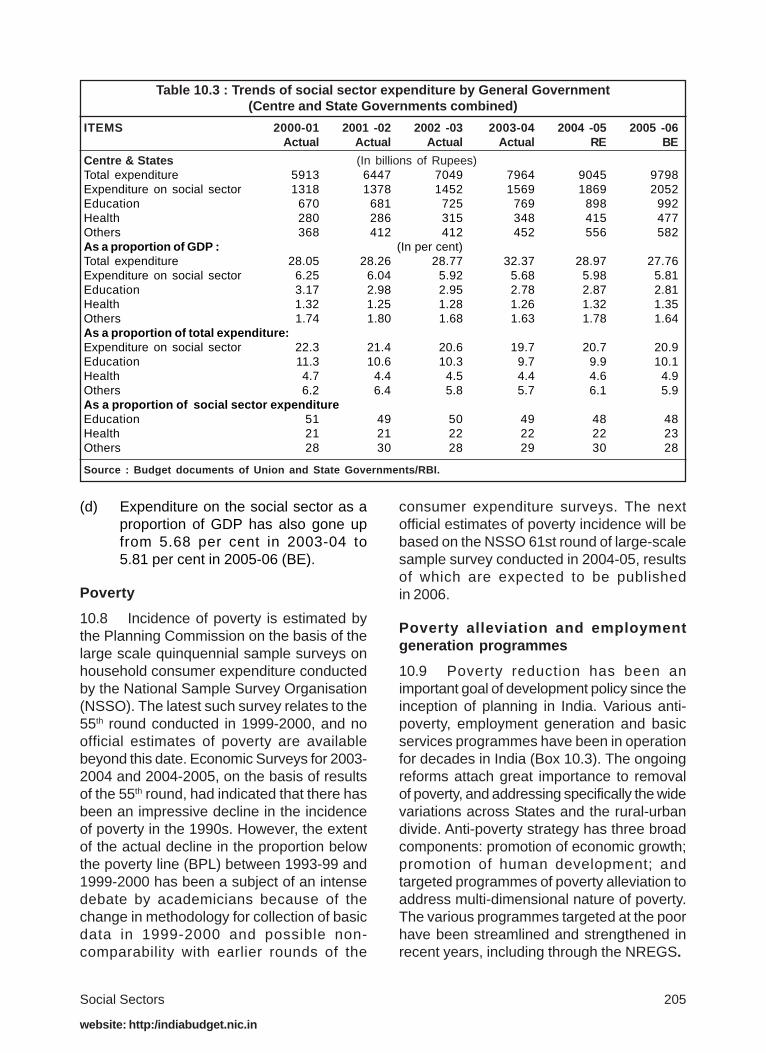
(d) Expenditure on the social sector as aproportion of GDP has also gone upfrom 5.68 per cent in 2003-04 to5.81 per cent in 2005-06 (BE).
Poverty
10.8 Incidence of poverty is estimated bythe Planning Commission on the basis of thelarge scale quinquennial sample surveys onhousehold consumer expenditure conductedby the National Sample Survey Organisation(NSSO). The latest such survey relates to the55th round conducted in 1999-2000, and noofficial estimates of poverty are availablebeyond this date. Economic Surveys for 2003-2004 and 2004-2005, on the basis of resultsof the 55th round, had indicated that there hasbeen an impressive decline in the incidenceof poverty in the 1990s. However, the extentof the actual decline in the proportion belowthe poverty line (BPL) between 1993-99 and1999-2000 has been a subject of an intensedebate by academicians because of thechange in methodology for collection of basicdata in 1999-2000 and possible non-comparability with earlier rounds of the
consumer expenditure surveys. The nextofficial estimates of poverty incidence will bebased on the NSSO 61st round of large-scalesample survey conducted in 2004-05, resultsof which are expected to be publishedin 2006.
Poverty alleviation and employmentgeneration programmes
10.9 Poverty reduction has been animportant goal of development policy since theinception of planning in India. Various anti-poverty, employment generation and basicservices programmes have been in operationfor decades in India (Box 10.3). The ongoingreforms attach great importance to removalof poverty, and addressing specifically the widevariations across States and the rural-urbandivide. Anti-poverty strategy has three broadcomponents: promotion of economic growth;promotion of human development; andtargeted programmes of poverty alleviation toaddress multi-dimensional nature of poverty.The various programmes targeted at the poorhave been streamlined and strengthened inrecent years, including through the NREGS.
Table 10.3 : Trends of social sector expenditure by General Government(Centre and State Governments combined)
ITEMS 2000-01 2001 -02 2002 -03 2003-04 2004 -05 2005 -06 Actual Actual Actual Actual RE BE
Centre & States (In billions of Rupees)Total expenditure 5913 6447 7049 7964 9045 9798Expenditure on social sector 1318 1378 1452 1569 1869 2052Education 670 681 725 769 898 992Health 280 286 315 348 415 477Others 368 412 412 452 556 582As a proportion of GDP : (In per cent)Total expenditure 28.05 28.26 28.77 32.37 28.97 27.76Expenditure on social sector 6.25 6.04 5.92 5.68 5.98 5.81Education 3.17 2.98 2.95 2.78 2.87 2.81Health 1.32 1.25 1.28 1.26 1.32 1.35Others 1.74 1.80 1.68 1.63 1.78 1.64As a proportion of total expenditure:Expenditure on social sector 22.3 21.4 20.6 19.7 20.7 20.9Education 11.3 10.6 10.3 9.7 9.9 10.1Health 4.7 4.4 4.5 4.4 4.6 4.9Others 6.2 6.4 5.8 5.7 6.1 5.9As a proportion of social sector expenditureEducation 51 49 50 49 48 48Health 21 21 22 22 22 23Others 28 30 28 29 30 28
Source : Budget documents of Union and State Governments/RBI.
Economic Survey 2005-2006206
website: http:/indiabudget.nic.in
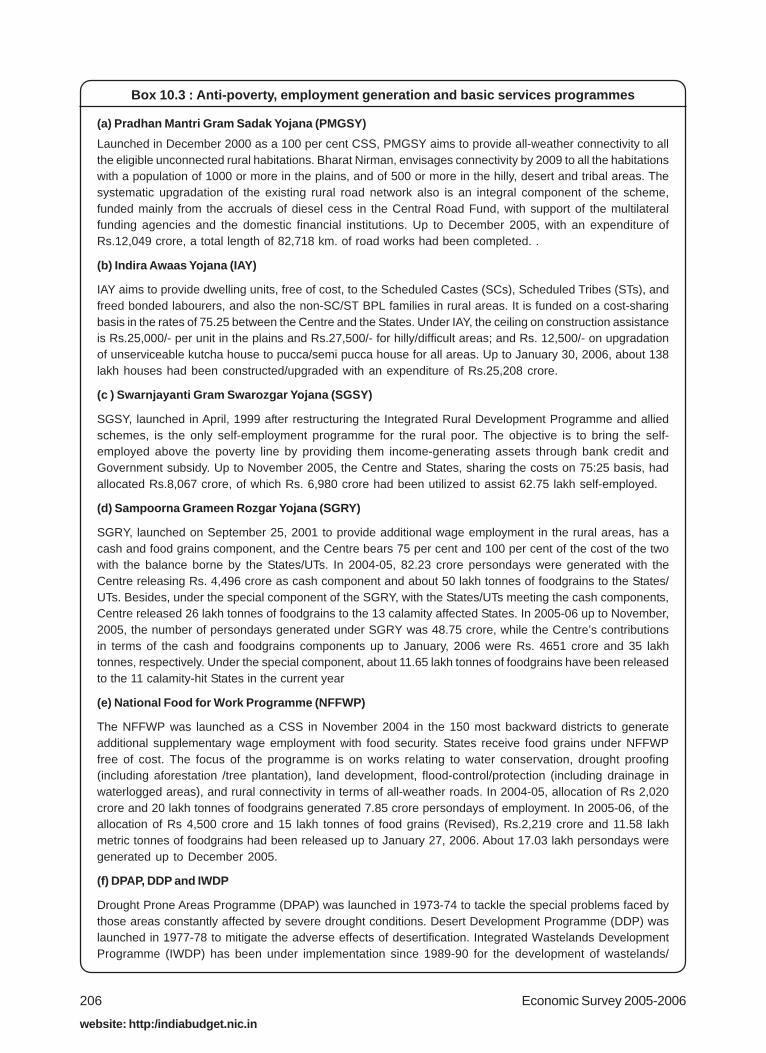
Box 10.3 : Anti-poverty, employment generation and basic services programmes
(a) Pradhan Mantri Gram Sadak Yojana (PMGSY)
Launched in December 2000 as a 100 per cent CSS, PMGSY aims to provide all-weather connectivity to allthe eligible unconnected rural habitations. Bharat Nirman, envisages connectivity by 2009 to all the habitationswith a population of 1000 or more in the plains, and of 500 or more in the hilly, desert and tribal areas. Thesystematic upgradation of the existing rural road network also is an integral component of the scheme,funded mainly from the accruals of diesel cess in the Central Road Fund, with support of the multilateralfunding agencies and the domestic financial institutions. Up to December 2005, with an expenditure ofRs.12,049 crore, a total length of 82,718 km. of road works had been completed. .
(b) Indira Awaas Yojana (IAY)
IAY aims to provide dwelling units, free of cost, to the Scheduled Castes (SCs), Scheduled Tribes (STs), andfreed bonded labourers, and also the non-SC/ST BPL families in rural areas. It is funded on a cost-sharingbasis in the rates of 75.25 between the Centre and the States. Under IAY, the ceiling on construction assistanceis Rs.25,000/- per unit in the plains and Rs.27,500/- for hilly/difficult areas; and Rs. 12,500/- on upgradationof unserviceable kutcha house to pucca/semi pucca house for all areas. Up to January 30, 2006, about 138lakh houses had been constructed/upgraded with an expenditure of Rs.25,208 crore.
(c ) Swarnjayanti Gram Swarozgar Yojana (SGSY)
SGSY, launched in April, 1999 after restructuring the Integrated Rural Development Programme and alliedschemes, is the only self-employment programme for the rural poor. The objective is to bring the self-employed above the poverty line by providing them income-generating assets through bank credit andGovernment subsidy. Up to November 2005, the Centre and States, sharing the costs on 75:25 basis, hadallocated Rs.8,067 crore, of which Rs. 6,980 crore had been utilized to assist 62.75 lakh self-employed.
(d) Sampoorna Grameen Rozgar Yojana (SGRY)
SGRY, launched on September 25, 2001 to provide additional wage employment in the rural areas, has acash and food grains component, and the Centre bears 75 per cent and 100 per cent of the cost of the twowith the balance borne by the States/UTs. In 2004-05, 82.23 crore persondays were generated with theCentre releasing Rs. 4,496 crore as cash component and about 50 lakh tonnes of foodgrains to the States/UTs. Besides, under the special component of the SGRY, with the States/UTs meeting the cash components,Centre released 26 lakh tonnes of foodgrains to the 13 calamity affected States. In 2005-06 up to November,2005, the number of persondays generated under SGRY was 48.75 crore, while the Centre’s contributionsin terms of the cash and foodgrains components up to January, 2006 were Rs. 4651 crore and 35 lakhtonnes, respectively. Under the special component, about 11.65 lakh tonnes of foodgrains have been releasedto the 11 calamity-hit States in the current year
(e) National Food for Work Programme (NFFWP)
The NFFWP was launched as a CSS in November 2004 in the 150 most backward districts to generateadditional supplementary wage employment with food security. States receive food grains under NFFWPfree of cost. The focus of the programme is on works relating to water conservation, drought proofing(including aforestation /tree plantation), land development, flood-control/protection (including drainage inwaterlogged areas), and rural connectivity in terms of all-weather roads. In 2004-05, allocation of Rs 2,020crore and 20 lakh tonnes of foodgrains generated 7.85 crore persondays of employment. In 2005-06, of theallocation of Rs 4,500 crore and 15 lakh tonnes of food grains (Revised), Rs.2,219 crore and 11.58 lakhmetric tonnes of foodgrains had been released up to January 27, 2006. About 17.03 lakh persondays weregenerated up to December 2005.
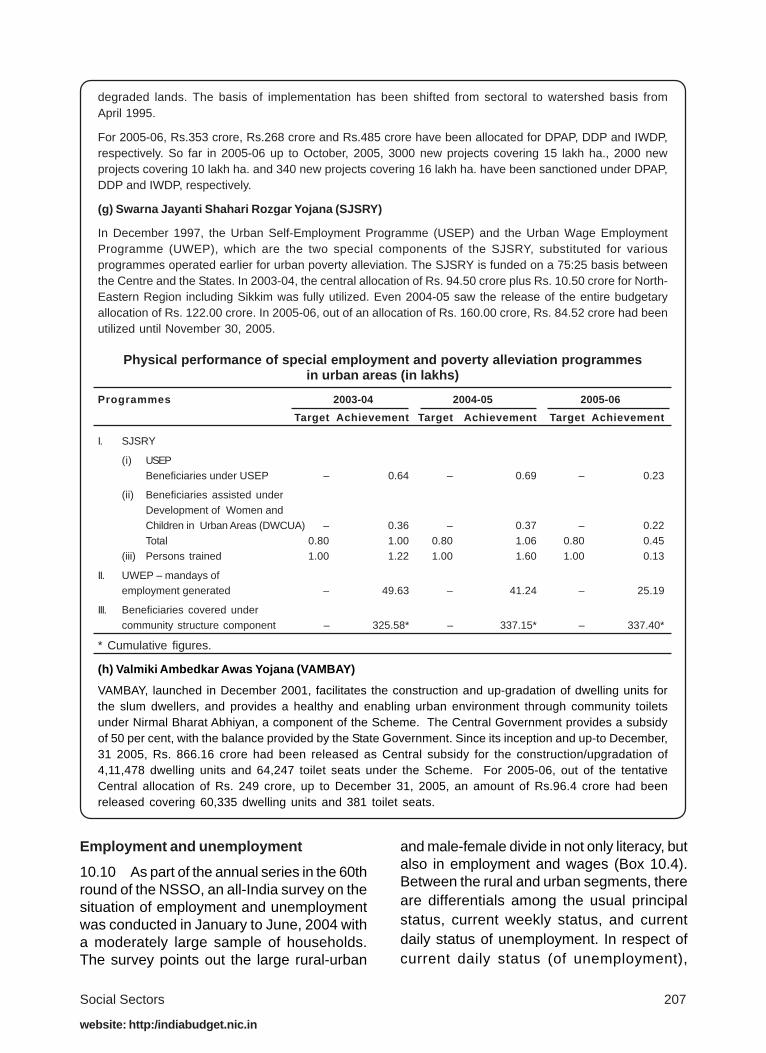
(f) DPAP, DDP and IWDP
Drought Prone Areas Programme (DPAP) was launched in 1973-74 to tackle the special problems faced bythose areas constantly affected by severe drought conditions. Desert Development Programme (DDP) waslaunched in 1977-78 to mitigate the adverse effects of desertification. Integrated Wastelands DevelopmentProgramme (IWDP) has been under implementation since 1989-90 for the development of wastelands/
207Social Sectors
website: http:/indiabudget.nic.in
degraded lands. The basis of implementation has been shifted from sectoral to watershed basis fromApril 1995.
For 2005-06, Rs.353 crore, Rs.268 crore and Rs.485 crore have been allocated for DPAP, DDP and IWDP,respectively. So far in 2005-06 up to October, 2005, 3000 new projects covering 15 lakh ha., 2000 newprojects covering 10 lakh ha. and 340 new projects covering 16 lakh ha. have been sanctioned under DPAP,DDP and IWDP, respectively.
(g) Swarna Jayanti Shahari Rozgar Yojana (SJSRY)
In December 1997, the Urban Self-Employment Programme (USEP) and the Urban Wage EmploymentProgramme (UWEP), which are the two special components of the SJSRY, substituted for variousprogrammes operated earlier for urban poverty alleviation. The SJSRY is funded on a 75:25 basis betweenthe Centre and the States. In 2003-04, the central allocation of Rs. 94.50 crore plus Rs. 10.50 crore for North-Eastern Region including Sikkim was fully utilized. Even 2004-05 saw the release of the entire budgetaryallocation of Rs. 122.00 crore. In 2005-06, out of an allocation of Rs. 160.00 crore, Rs. 84.52 crore had beenutilized until November 30, 2005.
Physical performance of special employment and poverty alleviation programmesin urban areas (in lakhs)
Programmes 2003-04 2004-05 2005-06
Target Achievement Target Achievement Target Achievement
I. SJSRY
(i) USEPBeneficiaries under USEP – 0.64 – 0.69 – 0.23
(ii) Beneficiaries assisted underDevelopment of Women andChildren in Urban Areas (DWCUA) – 0.36 – 0.37 – 0.22Total 0.80 1.00 0.80 1.06 0.80 0.45
(iii) Persons trained 1.00 1.22 1.00 1.60 1.00 0.13
II. UWEP – mandays ofemployment generated – 49.63 – 41.24 – 25.19
III. Beneficiaries covered undercommunity structure component – 325.58* – 337.15* – 337.40*
* Cumulative figures.
(h) Valmiki Ambedkar Awas Yojana (VAMBAY)
VAMBAY, launched in December 2001, facilitates the construction and up-gradation of dwelling units forthe slum dwellers, and provides a healthy and enabling urban environment through community toiletsunder Nirmal Bharat Abhiyan, a component of the Scheme. The Central Government provides a subsidyof 50 per cent, with the balance provided by the State Government. Since its inception and up-to December,31 2005, Rs. 866.16 crore had been released as Central subsidy for the construction/upgradation of4,11,478 dwelling units and 64,247 toilet seats under the Scheme. For 2005-06, out of the tentativeCentral allocation of Rs. 249 crore, up to December 31, 2005, an amount of Rs.96.4 crore had beenreleased covering 60,335 dwelling units and 381 toilet seats.
Employment and unemployment
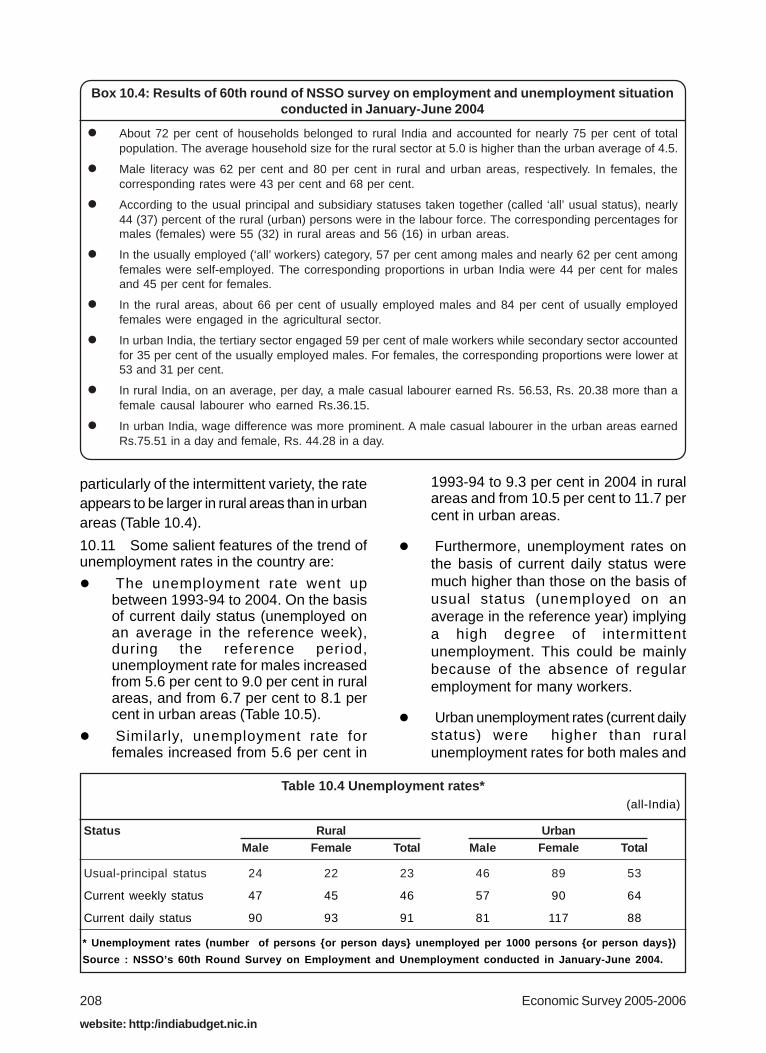
10.10 As part of the annual series in the 60thround of the NSSO, an all-India survey on thesituation of employment and unemploymentwas conducted in January to June, 2004 witha moderately large sample of households.The survey points out the large rural-urban
and male-female divide in not only literacy, butalso in employment and wages (Box 10.4).Between the rural and urban segments, thereare differentials among the usual principalstatus, current weekly status, and currentdaily status of unemployment. In respect ofcurrent daily status (of unemployment),
Economic Survey 2005-2006208
website: http:/indiabudget.nic.in
particularly of the intermittent variety, the rateappears to be larger in rural areas than in urbanareas (Table 10.4).
10.11 Some salient features of the trend ofunemployment rates in the country are:
! The unemployment rate went upbetween 1993-94 to 2004. On the basisof current daily status (unemployed onan average in the reference week),during the reference period,unemployment rate for males increasedfrom 5.6 per cent to 9.0 per cent in ruralareas, and from 6.7 per cent to 8.1 percent in urban areas (Table 10.5).
! Similarly, unemployment rate forfemales increased from 5.6 per cent in
1993-94 to 9.3 per cent in 2004 in ruralareas and from 10.5 per cent to 11.7 percent in urban areas.
! Furthermore, unemployment rates onthe basis of current daily status weremuch higher than those on the basis ofusual status (unemployed on anaverage in the reference year) implyinga high degree of intermittentunemployment. This could be mainlybecause of the absence of regularemployment for many workers.
! Urban unemployment rates (current dailystatus) were higher than ruralunemployment rates for both males and
Box 10.4: Results of 60th round of NSSO survey on employment and unemployment situationconducted in January-June 2004
! About 72 per cent of households belonged to rural India and accounted for nearly 75 per cent of totalpopulation. The average household size for the rural sector at 5.0 is higher than the urban average of 4.5.
! Male literacy was 62 per cent and 80 per cent in rural and urban areas, respectively. In females, thecorresponding rates were 43 per cent and 68 per cent.
! According to the usual principal and subsidiary statuses taken together (called ‘all’ usual status), nearly44 (37) percent of the rural (urban) persons were in the labour force. The corresponding percentages formales (females) were 55 (32) in rural areas and 56 (16) in urban areas.
! In the usually employed (‘all’ workers) category, 57 per cent among males and nearly 62 per cent amongfemales were self-employed. The corresponding proportions in urban India were 44 per cent for malesand 45 per cent for females.
! In the rural areas, about 66 per cent of usually employed males and 84 per cent of usually employedfemales were engaged in the agricultural sector.
! In urban India, the tertiary sector engaged 59 per cent of male workers while secondary sector accountedfor 35 per cent of the usually employed males. For females, the corresponding proportions were lower at53 and 31 per cent.
! In rural India, on an average, per day, a male casual labourer earned Rs. 56.53, Rs. 20.38 more than afemale causal labourer who earned Rs.36.15.
! In urban India, wage difference was more prominent. A male casual labourer in the urban areas earnedRs.75.51 in a day and female, Rs. 44.28 in a day.
Table 10.4 Unemployment rates*(all-India)
Status Rural UrbanMale Female Total Male Female Total
Usual-principal status 24 22 23 46 89 53
Current weekly status 47 45 46 57 90 64
Current daily status 90 93 91 81 117 88
* Unemployment rates (number of persons {or person days} unemployed per 1000 persons {or person days})
Source : NSSO’s 60th Round Survey on Employment and Unemployment conducted in January-June 2004.

209Social Sectors
website: http:/indiabudget.nic.in
females in 1993-94. However, in 2004,rural unemployment rates for males washigher than that of urban males.
! Unemployment rates varied sharplyacross States. States, where wages arehigher than in neighbouring onesbecause of strong bargains or socialsecurity provisions, such as highminimum wage, had high incidence ofunemployment, in general.
Indian labour laws and labour markets
10.12 Indian labour market is characterizedby a sharp dichotomy. A large number ofestablishments in the unorganized sectorremain outside any regulation, while theorganized sector has been regulated fairlystringently. It can be reasonably argued thatthe organised sector has provided too muchof job-security for too long, while theunorganized sector has provided too little totoo many.
10.13 Various studies indicate that Indianlabour laws are highly protective of labour, andlabour markets are relatively inflexible. Theselaws apply only to the organized sector.Consequently, these laws have restrictedlabour mobility, have led to capital-intensivemethods in the organized sector andadversely affected the sector’s long-rundemand for labour. Labour being a subject inthe concurrent list, State-level labour
regulations are also an important determinantof industrial performance. Evidence suggeststhat States, which have enacted more pro-worker regulations, have lost out on industrialproduction in general.
10.14 Perhaps there are lessons to be learntfrom China in the area of labour reforms.China, with a history of extreme employmentsecurity, has drastically reformed its labourrelations and created a new labour market, inwhich workers are highly mobile. Althoughthere have been mass layoffs and openunemployment, high rates of industrial growthespecially in the coastal regions helped theirredeployment. In spite of hardship, workers inChina seem to have benefited from wagegrowth, additional job creation and newopportunities for self employment.
Education
10.15 The National Policy on Education(NPE), 1986, as modified in 1992, emphasisesthree aspects in relation to elementaryeducation:
! universal access and enrolment,
! universal retention of children up to14 years of age, and
! a substantial improvement in thequality of education to enable allchildren to achieve essential levels oflearning.
Table 10.5 : Unemployment rates* for 50th round (1993-94)and 60th round (January-June 2004) of the NSSO (all-India)
Males FemalesRural
Round Usual CWS CDS Usual CWS CDS
60th (2004) 24 47 90 22 45 93
50th (1993-94) 20 30 56 14 30 56
Males Females
Urban
Round Usual CWS CDS Usual CWS CDS
60th (2004) 46 57 81 89 90 117
50th (1993-94) 45 52 67 83 84 105
*Unemployment rates (number of persons {or person days} unemployed per 1000 persons {or persondays})
CWS : Current Weekly Status, CDS: Current Daily StatusSource : NSSO’s 60th Round Survey on Employment and Unemployment conducted in January-June 2004.
Economic Survey 2005-2006210
website: http:/indiabudget.nic.in
NPE emphasises that education must play apositive and interventionist role in correctingsocial and regional imbalance, empoweringwomen, and in securing a rightful place forthe disadvantaged and the minorities.Government is firmly committed to providingeducation for all, the priority areas being freeand compulsory elementary education,covering children with special needs,eradication of illiteracy, education for women’sequality, and special focus on the educationof SCs/STs and Minorities.
10.16 NPE 1986 had set a goal of expenditureon education of 6 per cent of the GDP. Asagainst this target, the combined totalexpenditure on education by Central and StateGovernments was 3.49 per cent of GDP in2004-05(BE). Central Plan Allocation foreducation was increased from Rs.8,225 crorein 2004-05 (BE) to Rs. 15,244 crore in2005-06 (BE), with Rs.12,242 crore forelementary education, Rs. 290 crore for adulteducation and Rs.2,712 crore for secondaryand higher education.
Elementary Education
10.17 Allocation for elementary education inthe Tenth Five Year Plan period (2002-07) atRs.28,750 crore is 75 per cent higher than theallocation in the Ninth Plan. Resources forelementary education have been augmentedthrough imposition of the education cess atthe rate of 2 per cent on direct and indirectCentral taxes imposed through Finance (No.2)Act, 2004. With the imposition of the educationcess, budgeted outlay for elementary and adulteducation more than doubled from Rs. 6,000crore in 2004-05 to Rs.12,532 crore in 2005-06.
10.18 Gross enrolment ratio (GER) indicatesthe proportion of children in the 6-14 years agegroup actually enrolled in elementary schools.It has increased progressively from 32.1 in1950-51 to 84.91 in 2003-04. With the rate ofincrease in GER of girls higher than that ofboys, the gender gap in enrolment is declining.Drop-out rate at the primary level (ClassesI-V) declined from 39.0 per cent in 2001-02 to31.4 per cent in 2003-04. As on October 2005,number of out-of-school children, as reported
by States/UTs, was down to 95 lakh from320 lakh in 2001.
Sarva Shiksha Abhiyan (SSA)
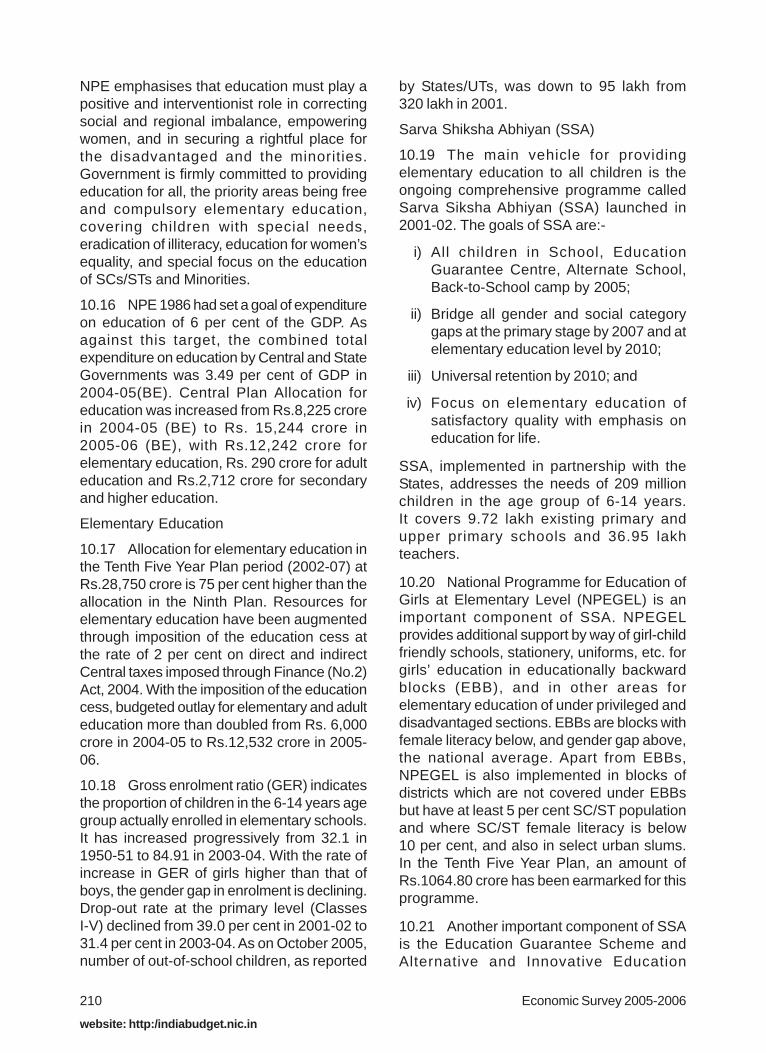
10.19 The main vehicle for providingelementary education to all children is theongoing comprehensive programme calledSarva Siksha Abhiyan (SSA) launched in2001-02. The goals of SSA are:-
i) All children in School, EducationGuarantee Centre, Alternate School,Back-to-School camp by 2005;
ii) Bridge all gender and social categorygaps at the primary stage by 2007 and atelementary education level by 2010;
iii) Universal retention by 2010; and
iv) Focus on elementary education ofsatisfactory quality with emphasis oneducation for life.
SSA, implemented in partnership with theStates, addresses the needs of 209 millionchildren in the age group of 6-14 years.It covers 9.72 lakh existing primary andupper primary schools and 36.95 lakhteachers.
10.20 National Programme for Education ofGirls at Elementary Level (NPEGEL) is animportant component of SSA. NPEGELprovides additional support by way of girl-childfriendly schools, stationery, uniforms, etc. forgirls’ education in educationally backwardblocks (EBB), and in other areas forelementary education of under privileged anddisadvantaged sections. EBBs are blocks withfemale literacy below, and gender gap above,the national average. Apart from EBBs,NPEGEL is also implemented in blocks ofdistricts which are not covered under EBBsbut have at least 5 per cent SC/ST populationand where SC/ST female literacy is below10 per cent, and also in select urban slums.In the Tenth Five Year Plan, an amount ofRs.1064.80 crore has been earmarked for thisprogramme.
10.21 Another important component of SSAis the Education Guarantee Scheme andAlternative and Innovative Education

211Social Sectors
website: http:/indiabudget.nic.in
(EGS&AIE). EGS&AIE is specially designedto provide access to elementary education tochildren in school-less habitations and out-of-school children. It supports flexible strategiesfor out-of-school children through bridgecourses, residential camps, drop-in centres,summer camps, remedial coaching, etc., andhelped to provide elementary education to85.67 lakh children in 2004-05.
Mid-Day Meal Scheme
10.22 The Centrally-sponsored Mid-Day MealScheme was revised and universalized atprimary level with effect from September, 2004to make a provision for providing cooked mealsto children studying in Government,Government-aided, and local body schoolsand EGS&AIE centres. Besides providingfoodgrains free of cost to the States/UTs, andfoodgrains transportation subsidy, the CentralGovernment provides assistance forconverting foodgrains into cooked meal at arate of Re. 1 per child per day.
The programme now covers nearly 12 crorechildren studying in over 9 lakh primaryschools and EGS&AIE Centres. Budgetprovision for this scheme, which is the world’slargest school feeding programme involvingpreparation of a hot meal everyday, for 2005-06 is Rs. 3345.26 crore.
Kasturba Gandhi Balika Vidyalaya (KGBV)
10.23 The KGBV scheme was launched inAugust, 2004 to set up 750 residential schoolsat elementary level for girls belongingpredominantly to the SC, ST, OBC andminorities, in EBBs. All 750 KGBVs have nowbeen sanctioned by the Government of India,with 117 KGBVs (15.6 per cent) allocated toblocks with substantial minority population.Budget provision for the scheme for 2005-06is Rs.250 Crore.
Prarambhik Shiksha Kosh (PSK)
10.24 Department of Elementary Educationand Literacy issued orders on November 14,2005 constituting Prarambhik Shiksha Kosh(PSK) to receive the proceeds of the educationcess imposed through Finance (No.2) Act,2004. PSK is a separate, dedicated, non-
lapsable fund to be maintained by the Ministryof Human Resource Development.
Adult education
10.25 Literacy rates in India have risensharply from 18.3 per cent in 1951 to 64.8 percent in 2001. Nevertheless, India continues tolag behind several other developing countriesin the region such as China (86 per cent) andSri Lanka (92 per cent). The National LiteracyMission (NLM) was launched on May 5, 1988as a Technology Mission to impart functionalliteracy to non-literates in the country in theage group of 15-35 years in a time-boundmanner. This age-group has been the focusof attention because they are in the productiveand reproductive period of life. The NPE,1986,as modified in 1992, recognizes the NLM asone of the three instruments to eradicateilliteracy from the country, the other two beingSSA and non-formal education.
10.26 NLM’s objective is to attain asustainable threshold literacy rate of 75 percent by 2007. The Total Literacy Campaign(TLC) has been the principal strategy ofNational Literacy Mission for eradication ofilliteracy in the target age-group. Thesecampaigns implemented by Zilla SaksharataSamities (District Level Literacy Societies) arearea-specific, time-bound, volunteer-based,cost effective and outcome-oriented.
10.27 At present, 137 districts are im-plementing TLCs, 165 districts Post LiteracyProgrammes and 295 districts ContinuingEducation Programmes. In addition, 157 JanShikshan Sansthan have been set up toprovide vocational training to the neo-literatesand backward sections of the society, and25 State Resource Centres established forproviding academic and technical resourcesupport for the literacy programmes.
10.28 NLM has accorded priority for thepromotion of female literacy. According to2001 Census, 47 districts in the country havefemale literacy rate below 30 percent. Most ofthese districts are concentrated in Bihar,Jharkhand, Uttar Pradesh and Orissa. Specialinnovative projects have been taken up to raisethe level of female literacy in these areas.
Economic Survey 2005-2006212
website: http:/indiabudget.nic.in
Special efforts have been made to targetfemale Panchayati Raj functionaries and makethem literate.
Secondary and higher education
10.29 Secondary education preparesstudents in the age group of 14-18 years forentry into higher education and employment.The number of secondary and seniorsecondary schools increased from 1,07,140in 1997-98 to 1,45,899 in 2003-04 with a totalstudent enrolment of 35.01 million (ClassesIX to XII). There has been an impressivegrowth in the area of higher education with anincrease in annual student enrolment from7.26 million in 1997-98 to 9.95 million in2003-04. Enrolment of women students rosefrom 2.45 million in 1997-98 to 4.03 million in2004-05, constituting 40.22 per cent of the totalenrolment. As per NSSO survey (55th Round1999-00), there were inequalities in enrolmentin higher education across various socialgroups in rural and urban areas, and also interms of gender. Women belonging to SC andST and those living in rural areas are the mostdisadvantaged. A Constitution Amendment Billhas been passed by Parliament in December,2005, which enables the State to make specialprovisions, by law, for admission of studentsbelonging to SC, ST and socially andeducationally backward classes to educationalinstitutions, including aided and unaided privateeducational institutions, except minorityinstitutions referred to in Article 30(1) of theConstitution.
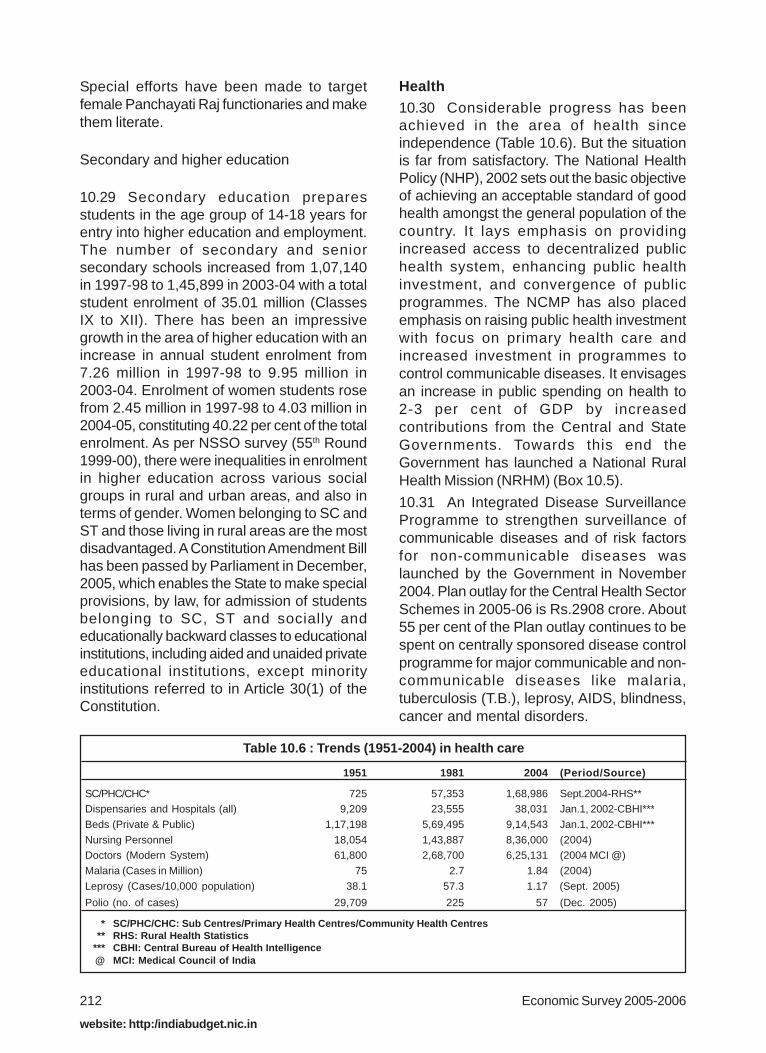
Health10.30 Considerable progress has beenachieved in the area of health sinceindependence (Table 10.6). But the situationis far from satisfactory. The National HealthPolicy (NHP), 2002 sets out the basic objectiveof achieving an acceptable standard of goodhealth amongst the general population of thecountry. It lays emphasis on providingincreased access to decentralized publichealth system, enhancing public healthinvestment, and convergence of publicprogrammes. The NCMP has also placedemphasis on raising public health investmentwith focus on primary health care andincreased investment in programmes tocontrol communicable diseases. It envisagesan increase in public spending on health to2-3 per cent of GDP by increasedcontributions from the Central and StateGovernments. Towards this end theGovernment has launched a National RuralHealth Mission (NRHM) (Box 10.5).
10.31 An Integrated Disease SurveillanceProgramme to strengthen surveillance ofcommunicable diseases and of risk factorsfor non-communicable diseases waslaunched by the Government in November2004. Plan outlay for the Central Health SectorSchemes in 2005-06 is Rs.2908 crore. About55 per cent of the Plan outlay continues to bespent on centrally sponsored disease controlprogramme for major communicable and non-communicable diseases like malaria,tuberculosis (T.B.), leprosy, AIDS, blindness,cancer and mental disorders.
Table 10.6 : Trends (1951-2004) in health care
1951 1981 2004 (Period/Source)
SC/PHC/CHC* 725 57,353 1,68,986 Sept.2004-RHS**Dispensaries and Hospitals (all) 9,209 23,555 38,031 Jan.1, 2002-CBHI***
Beds (Private & Public) 1,17,198 5,69,495 9,14,543 Jan.1, 2002-CBHI***
Nursing Personnel 18,054 1,43,887 8,36,000 (2004)Doctors (Modern System) 61,800 2,68,700 6,25,131 (2004 MCI @)
Malaria (Cases in Million) 75 2.7 1.84 (2004)
Leprosy (Cases/10,000 population) 38.1 57.3 1.17 (Sept. 2005)
Polio (no. of cases) 29,709 225 57 (Dec. 2005)
* SC/PHC/CHC: Sub Centres/Primary Health Centres/Community Health Centres** RHS: Rural Health Statistics
*** CBHI: Central Bureau of Health Intelligence@ MCI: Medical Council of India
213Social Sectors
website: http:/indiabudget.nic.in
National Vector Borne Disease ControlProgramme (NVBDCP)
10.32 The main objective of NVBDCP,initiated in 2003-04 through convergence ofthree programmes on Malaria, Kala-azar andFilaria, and inclusion of Japanese Encephalitisand Dengue, is prevention and efficient controlof vector borne diseases. In tandem with goalsset under the NHP 2002, the mission ofNVBDCP is integrated and accelerated actiontowards reducing mortality on account ofmalaria, dengue, Japanese encephalitis by ahalf and elimination of Kala-azar by 2010, andelimination of Lymphatic Filariasis by 2015.
10.33 The annual overall incidence of malariahas been brought down to less than 2 millioncases over the last decade. Due to concertedimplementation of strategies there has beena decline of 4.8 per cent in the reported casesin the current year as compared to thecorresponding period of the previous year.About 95 per cent of the population of thecountry is in the malaria-endemic areas, and80 per cent of malaria burden is confined inareas comprising 20 per cent of populationthat is mainly in tribal, hilly, difficult andinaccessible areas. 100 hardcore malariadistricts in 8 States have been identified ashigh risk for enhanced support to 1045 tribalPHCs in these districts to intensify malariacontrol. In the effort towards elimination offilaria, the single dose mass drugadministration initiated in 13 districts in 1997was expanded in 2005 to 243 districts coveringover 500 million population.
Tuberculosis
10.34 The Revised National T.B. ControlProgramme (RNTCP), using DirectlyObserved Treatment Shortcourse (DOTS)strategy, is being implemented in the countryin a phased manner since 1997, withassistance from World Bank, DanishInternational Development Agency (DANIDA),Department for International Development(DFID), United States Agency for InternationalDevelopment (USAID), Global Drugs Facility(GDF) and Global Funds for Aids, T.B andMalaria (GFATM). By November 2005, 1065
million (95 per cent) of the country’s populationin 607 districts/reporting units were coveredunder the programme, and the entire countryis expected to be fully covered shortly. Till date,the RNTCP has placed more than 49 lakhpatients on DOTS treatment, thus savingabout 8.8 lakhs additional lives.
Leprosy
10.35 The prevalence rate of leprosy per10,000 has fallen significantly from anestimated 57.3 in 1981 to only 1.17 inSeptember 2005. The goal of elimination ofleprosy (prevalence rate of less than1/10,000) has been achieved by 25 States; andanother six States are very near the goal. TheNational Leprosy Eradication Programme,after the completion of World Bank support inDecember 2004, is continuing withGovernment of India support.
HIV/AIDS
10.36 HIV estimate in India for 2004 indicates5.134 million cases and a prevalence rate of0.9 per cent among the adult population. Indiahas the second largest population ofHIV-infected people, next to South Africa.Although the level of HIV infection appears tohave stabilised in some States, such as AndhraPradesh, Maharashtra and Tamil Nadu, it isstill increasing amongst the high risk populationin several other States. As a result,HIV prevalence continues to rise. UntilNovember, 2005, 1,16,905 AIDS cases hadbeen reported and the cumulative number ofdeaths reported due to AIDS till November,2005 was 8,286. Unsafe sex is responsiblefor 86 per cent of the reported HIV/AIDSinfections in India. These figures are a causeof concern as persons infected with HIV willprogress to AIDS, resulting in a steep increasein number of AIDS patients in the country withconsequent medical, economic and socialimplications.
10.37 In order to pay greater attentiontowards HIV/AIDS, there is a National Councilon AIDS headed by the Prime Minister.National AIDS Control Policy, 2002 aims atprevention of further spread of HIV, reducingimpact of HIV on health of people and socio

Economic Survey 2005-2006214
website: http:/indiabudget.nic.in
economic development and achieve zero rateof growth of new infections by the year 2007.Anti-retroviral treatment (ART) was startedfrom April 1, 2004 from eight governmenthospitals. Currently, 52 government hospitalsare providing free ART services to 23,784patients in 18 states. 48 additional centreshave been identified for starting free ARTservices. Extensive condom promotion isbeing undertaken to control the problem ofunsafe sex.
Control of non-communicable diseases(NCDs)
10.38 Non-communicable diseases (NCDs)cover a wide range of heterogeneousconditions affecting different organs andsystem in different age and socio-economicgroups. Over the last two decades, morbidityand mortality due to cardiovascular diseases,mental disorders, cancers and trauma havebeen rising with increase in the number ofsenior citizens with high prevalence of theseNCDs. Prevalence of NCDs in younger peopleis also on the rise with life-style changes,obesity and stress, and exposure toenvironmental risk factors and use of tobacco.Heart disease has become one of the leadingcauses of death in both urban and ruralpopulation. Similarly, there is a rising trend inprevalence of diabetes. Trauma and accidentsare increasing gradually with rapid urbanisationand change in the lifestyle. It is estimated thatmore than one death is due to trauma everyminute, or more than 1,800 deaths every day.
10.39 The National Mental HealthProgramme in the Tenth Plan is a newinitiative with an outlay of Rs. 130 crore toenhance the coverage of the District MentalHealth Programme from the existing27 districts to 100 districts in the country. Forreducing death due to trauma and for providingmedical assistance within the golden hour,financial assistance is being provided toGovernment hospitals located on the nationalhighways for upgradation and strengtheningof emergency facilities. 27 hospitals in 17States were granted assistance in the first twoyears of the 10th Plan.
Blindness
10.40 Of the total estimated 45 million blindpersons in the world, 7 million are in India. Dueto the large population base and increased lifeexpectancy, the number of cases is expectedto increase in the coming years. Whilecataract continues to be the major cause ofblindness, other emerging causes includediabetic retinopathy and glaucoma. TheNational Programme for Control of Blindnesshas resulted in an increase in cataract surgeryfrom 15 lakh in 1992-93 to 45 lakh in 2004-05.The outcome after cataract surgery hasimproved mainly due to the large number ofimplantations. The target cataract operationsin 2002-07 is 211 lakh.
Cancer
10.41 It is estimated that there are nearly2–2.5 million cancer cases at any given pointof time. There are 7-9 lakh new cases ofcancer and approximately 4 lakh deaths occurannually due to cancer. The National CancerControl Programme has augmented thenumber of Regional Cancer Centres from12 in 1995 to 22 at present. Since 50 per centof cancer is related to tobacco, acomprehensive legislation for discouraging theuse of tobacco was notified in 2003.
Integrated Disease Surveillance Project
10.42 Under Integrated Disease SurveillanceProject, launched as a new scheme inNovember 2004 and to be implementedthrough States and District Surveillance units,activities were initiated in 19 States during2005-06. District and peripheral laboratoriesare being strengthened in 206 districts. ITnetworks connecting all districts and trainingof district surveillance teams, medical officers,laboratory personnel and health workers isbeing carried out. The project has an outlay ofRs.88 crore for 2005-06.
Ayurveda, Yoga & Naturopathy, Unani, Siddhaand Homoeopathy (AYUSH)
10.43 India has a rich heritage of traditionalmedicinal knowledge. If harnessed properly,Indian systems of medicine and Homoeopathy
215Social Sectors
website: http:/indiabudget.nic.in
can play an important role in the preventionand management of non-communicablediseases and life-style related disorders. Thereis a vast infrastructure of Ayurveda, Unani,Siddha and Homoeopathy in the country withapproximately 6.9 lakh qualified practitionersof these systems, 1355 hospitals and 22,671AYUSH dispensaries all over the country.However, this infrastructure is not evenlyspread. Mainstreaming of AYUSH in the HealthCare delivery network in the country isenvisaged in the NRHM with focus onimprovement and upgradation of standards ofeducation, standardization of drugs and qualitycontrol, sustainable collection and cultivationof medicinal plants. The Department ofAYUSH, Ministry of Health and Family Welfare
has taken a number of measures to popularizethe systems through information, educationand communication activities, bothdomestically and internationally. The TenthPlan allocation for the Department of AYUSHis Rs.775 crore.
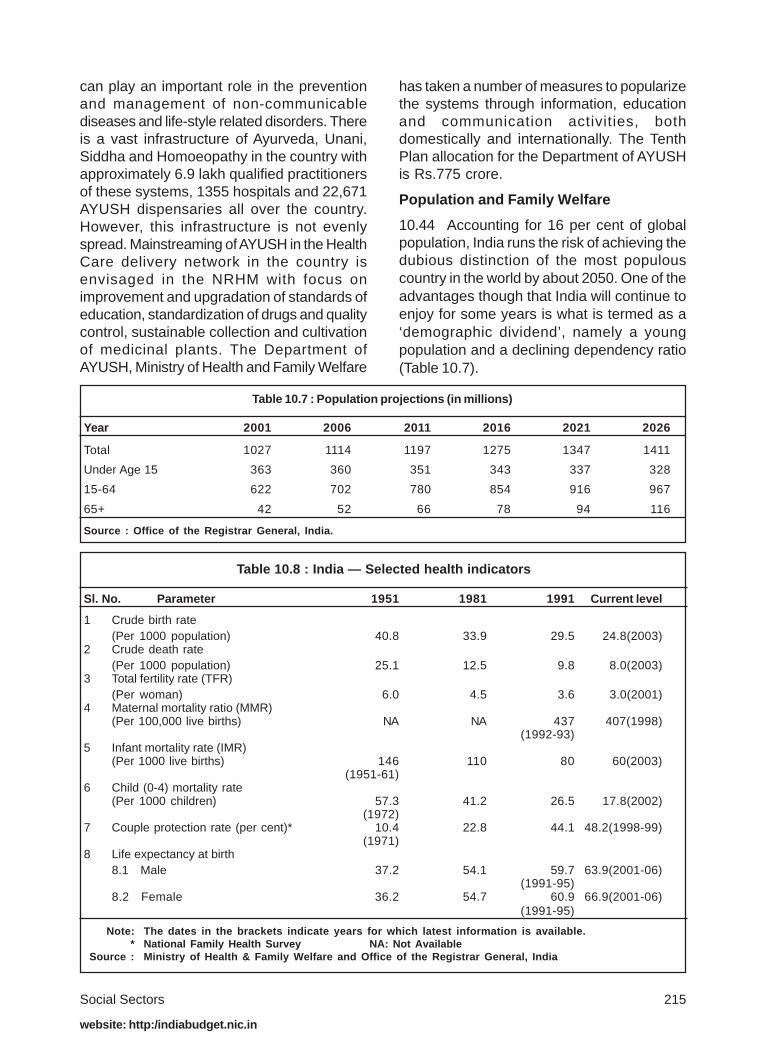
Population and Family Welfare
10.44 Accounting for 16 per cent of globalpopulation, India runs the risk of achieving thedubious distinction of the most populouscountry in the world by about 2050. One of theadvantages though that India will continue toenjoy for some years is what is termed as a‘demographic dividend’, namely a youngpopulation and a declining dependency ratio(Table 10.7).
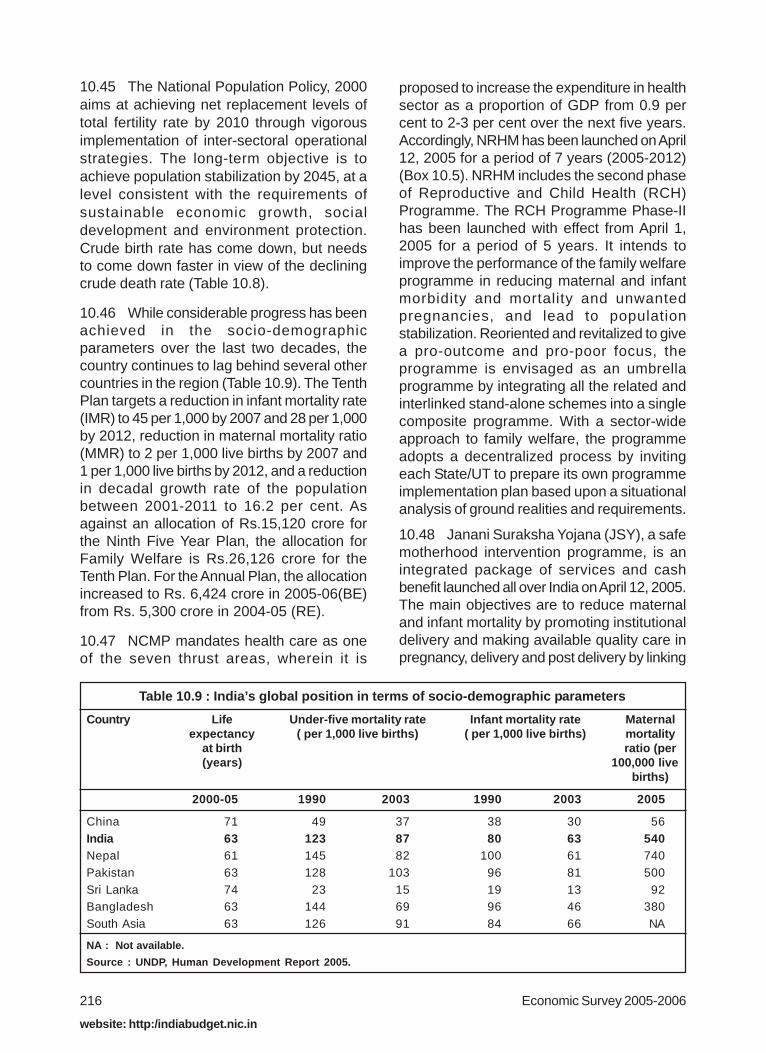
Table 10.7 : Population projections (in millions)
Year 2001 2006 2011 2016 2021 2026
Total 1027 1114 1197 1275 1347 1411
Under Age 15 363 360 351 343 337 328
15-64 622 702 780 854 916 967
65+ 42 52 66 78 94 116
Source : Office of the Registrar General, India.
Table 10.8 : India — Selected health indicators
Sl. No. Parameter 1951 1981 1991 Current level
1 Crude birth rate(Per 1000 population) 40.8 33.9 29.5 24.8(2003)
2 Crude death rate(Per 1000 population) 25.1 12.5 9.8 8.0(2003)
3 Total fertility rate (TFR)(Per woman) 6.0 4.5 3.6 3.0(2001)
4 Maternal mortality ratio (MMR)(Per 100,000 live births) NA NA 437 407(1998)
(1992-93)5 Infant mortality rate (IMR)
(Per 1000 live births) 146 110 80 60(2003)(1951-61)
6 Child (0-4) mortality rate(Per 1000 children) 57.3 41.2 26.5 17.8(2002)
(1972)7 Couple protection rate (per cent)* 10.4 22.8 44.1 48.2(1998-99)
(1971)8 Life expectancy at birth
8.1 Male 37.2 54.1 59.7 63.9(2001-06)(1991-95)
8.2 Female 36.2 54.7 60.9 66.9(2001-06)(1991-95)
Note: The dates in the brackets indicate years for which latest information is available.* National Family Health Survey NA: Not Available
Source : Ministry of Health & Family Welfare and Office of the Registrar General, India
Economic Survey 2005-2006216
website: http:/indiabudget.nic.in
10.45 The National Population Policy, 2000aims at achieving net replacement levels oftotal fertility rate by 2010 through vigorousimplementation of inter-sectoral operationalstrategies. The long-term objective is toachieve population stabilization by 2045, at alevel consistent with the requirements ofsustainable economic growth, socialdevelopment and environment protection.Crude birth rate has come down, but needsto come down faster in view of the decliningcrude death rate (Table 10.8).
10.46 While considerable progress has beenachieved in the socio-demographicparameters over the last two decades, thecountry continues to lag behind several othercountries in the region (Table 10.9). The TenthPlan targets a reduction in infant mortality rate(IMR) to 45 per 1,000 by 2007 and 28 per 1,000by 2012, reduction in maternal mortality ratio(MMR) to 2 per 1,000 live births by 2007 and1 per 1,000 live births by 2012, and a reductionin decadal growth rate of the populationbetween 2001-2011 to 16.2 per cent. Asagainst an allocation of Rs.15,120 crore forthe Ninth Five Year Plan, the allocation forFamily Welfare is Rs.26,126 crore for theTenth Plan. For the Annual Plan, the allocationincreased to Rs. 6,424 crore in 2005-06(BE)from Rs. 5,300 crore in 2004-05 (RE).
10.47 NCMP mandates health care as oneof the seven thrust areas, wherein it is
proposed to increase the expenditure in healthsector as a proportion of GDP from 0.9 percent to 2-3 per cent over the next five years.Accordingly, NRHM has been launched on April12, 2005 for a period of 7 years (2005-2012)(Box 10.5). NRHM includes the second phaseof Reproductive and Child Health (RCH)Programme. The RCH Programme Phase-IIhas been launched with effect from April 1,2005 for a period of 5 years. It intends toimprove the performance of the family welfareprogramme in reducing maternal and infantmorbidity and mortality and unwantedpregnancies, and lead to populationstabilization. Reoriented and revitalized to givea pro-outcome and pro-poor focus, theprogramme is envisaged as an umbrellaprogramme by integrating all the related andinterlinked stand-alone schemes into a singlecomposite programme. With a sector-wideapproach to family welfare, the programmeadopts a decentralized process by invitingeach State/UT to prepare its own programmeimplementation plan based upon a situationalanalysis of ground realities and requirements.
10.48 Janani Suraksha Yojana (JSY), a safemotherhood intervention programme, is anintegrated package of services and cashbenefit launched all over India on April 12, 2005.The main objectives are to reduce maternaland infant mortality by promoting institutionaldelivery and making available quality care inpregnancy, delivery and post delivery by linking
Table 10.9 : India’s global position in terms of socio-demographic parameters
Country Life Under-five mortality rate Infant mortality rate Maternalexpectancy ( per 1,000 live births) ( per 1,000 live births) mortality
at birth ratio (per(years) 100,000 live
births)
2000-05 1990 2003 1990 2003 2005
China 71 49 37 38 30 56India 63 123 87 80 63 540Nepal 61 145 82 100 61 740Pakistan 63 128 103 96 81 500Sri Lanka 74 23 15 19 13 92Bangladesh 63 144 69 96 46 380South Asia 63 126 91 84 66 NA
NA : Not available.
Source : UNDP, Human Development Report 2005.
217Social Sectors
website: http:/indiabudget.nic.in
delivery care to ante-natal check-up and neo-natal care along with appropriate referral andtransport assistance, in the BPL groups.
10.49 The Mother NGO (MNGO) programmeof the Department of Family Welfarecontinued to be implemented in all the States.MNGOs receive grant-in-aid from Governmentof India through the State Standing Committeeon Voluntary Action (SCOVA) and providefunds to ground level NGOs called Field NGOs(FNGOs) in their allocated districts. Theunderlying philosophy of the MNGO schemeis one of nurturing and capacity building, whichincludes assessing the gaps in information onRCH services in the project area; buildingstrong institutional capacity at the State,district, and field levels; advocacy andawareness generation; and facilitate servicedelivery in the underserved and unservedareas. Currently, 215 MNGOs are working in324 districts of the country.
10.50 Under the immunization programme,vaccines are given to infants and pregnantwomen for controlling vaccine-preventablediseases, namely childhood Tuberculosis
(BCG), Diphtheria, Pertussis and NeonatalTetanus (DPT), Measles and Poliomyelitis(OPV). Significant achievement has beenmade under this programme. At the beginningof the programme in 1985-86, vaccinecoverage level ranged between 29 per centfor BCG and 41 per cent for DPT. As per thelatest figures available for 2004-05, theprovisional percentage coverage for DPT,BCG, Measles, TT vaccine (pregnant women)and OPV are 93.6, 99.9, 90.3, 78.6 and 94.2,respectively.
10.51 India has made remarkable progressin controlling the spread of wild polio virus inthe country with only 65 polio cases reportedin the country in 2005. In order to achieve zerotransmission in 2006, efforts for 100 per centvaccination of children up to 5 years of age inSupplementary Immunization Rounds need tocontinue.
Empowerment of women
10.52 The Mid-Term Review of the TenthPlan has identified areas of concern such asadverse child sex ratio, high infant andmaternal mortality, wide gender gaps in literacy
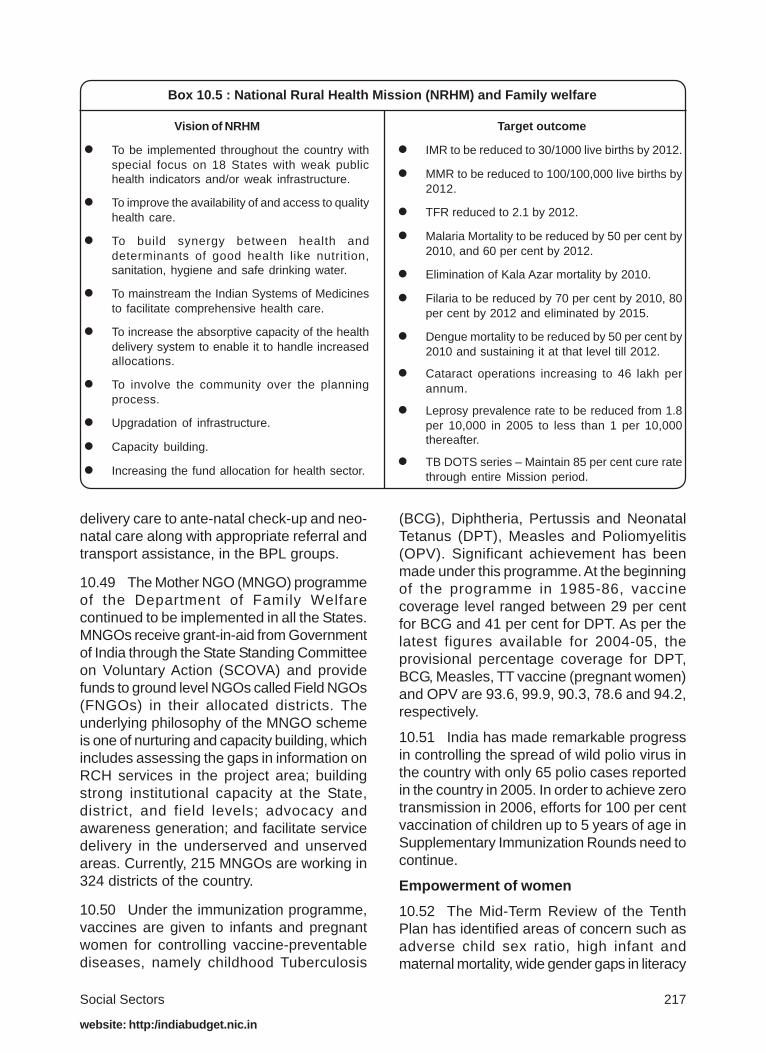
Box 10.5 : National Rural Health Mission (NRHM) and Family welfare
Vision of NRHM Target outcome
! To be implemented throughout the country withspecial focus on 18 States with weak publichealth indicators and/or weak infrastructure.
! To improve the availability of and access to qualityhealth care.
! To build synergy between health anddeterminants of good health like nutrition,sanitation, hygiene and safe drinking water.
! To mainstream the Indian Systems of Medicinesto facilitate comprehensive health care.
! To increase the absorptive capacity of the healthdelivery system to enable it to handle increasedallocations.
! To involve the community over the planningprocess.
! Upgradation of infrastructure.
! Capacity building.
! Increasing the fund allocation for health sector.
! IMR to be reduced to 30/1000 live births by 2012.
! MMR to be reduced to 100/100,000 live births by2012.
! TFR reduced to 2.1 by 2012.
! Malaria Mortality to be reduced by 50 per cent by2010, and 60 per cent by 2012.
! Elimination of Kala Azar mortality by 2010.
! Filaria to be reduced by 70 per cent by 2010, 80per cent by 2012 and eliminated by 2015.
! Dengue mortality to be reduced by 50 per cent by2010 and sustaining it at that level till 2012.
! Cataract operations increasing to 46 lakh perannum.
! Leprosy prevalence rate to be reduced from 1.8per 10,000 in 2005 to less than 1 per 10,000thereafter.
! TB DOTS series – Maintain 85 per cent cure ratethrough entire Mission period.
Economic Survey 2005-2006218
website: http:/indiabudget.nic.in
and wage rates, escalating violence againstwomen, and child trafficking. It hasrecommended universalizing programmeslike Integrated Child Development Services(ICDS), expanding crèches, evaluation ofexisting programmes, strengthening thedelivery mechanism, and assessing thegender impact of all programmes. Planning,policies, programmes and schemes of theDepartment of Women and ChildDevelopment (DWCD) are being speciallyformulated to ensure that these objectives interms of social and economic empowermentof women and gender justice reach thetargeted groups.
Health and nutrition of women
10.53 Measures to uplift health and nutritionstandards of women, under the ICDS, includehealth check up for pregnant women and newmothers, immunization, pre and post-natalcare, and supplementary nutrition. Under the‘Nutrition Programme for Adolescent Girls’(NPAG), special attention is being given tonutrition requirements of the potential mothersof the future. DWCD has been operating NPAGas a pilot project in 51 districts with the ultimateobjective of universalizing the scheme.
Training and Employment of women
10.54 Empowerment of women cannothappen unless they are provided with adequateincome generating activities, through wageand self- employment. A number of schemessuch as Swyamsiddha, Swablamban andSupport to Training-cum-EmploymentProgramme (STEP) are in progress wherewomen mobilized as viable SHGs are utilizingmicro credit with the help of agencies like theRashtriya Mahila Kosh for income generatingactivities or getting trained in various traditionaltrades and crafts (such as poultry, bee keepingand weaving) as well as newly emergingvocations (such as the IT sector), or skill up-gradation and capacity building. To facilitatethe employment of women away from theirhomes/towns, schemes such as WorkingWomen Hostels with day-care centres andcreches/day centres are also beingimplemented. Care and protection of womenin distress is a focused area for attention.
Legal Safeguards
10.55 The National Commission for Women(NCW) safeguards the interests of womenwith a mandate covering almost all aspectsof women’s rights. There are about 42 CentralActs concerning women, of which 32 Actshave been reviewed by the NCW for theirefficiency and removing gender discriminatoryprovisions. In addition, the DWCD is also inthe process of initiating new legislationamending existing ones so that they becomemore potent in protecting women. Theseinclude Protection of Women from DomesticViolence Act, 2005, which came into force onSeptember 14, 2005. The Act seeks to provideimmediate and emergent relief to women whoface situations of violence in their homes.Protection Against Sexual Harassment ofWomen Bill, seeking to confer on women theright to be protected from sexual harassment,is being drafted at the moment.
Gender Budgeting
10.56 The Tenth Plan reinforced thecommitment to gender budgeting to establishits gender-differential impact and to translategender commitments into budgetarycommitments. It is perceived as a powerfultool not only for tracking allocation of resourcesfor women but also covers implementationissues and outcomes. The Union ExpenditureBudget 2005-06 has institutionalized GenderBudgeting in the budget document throughstatement 19, Expenditure Budget, Vol. 1wherein it has been indicated that the budgetprovision in the BE 2005-06, substantiallymeant for welfare of women and children, isRs. 14,378.68 crore. At present Gender Budgetcells have been set up in 35 Departments ofthe Government of India.
Welfare and development of children
10.57 A ‘rights based’ approach has beenadopted in the Tenth Plan with the strategy ofpromoting survival, protection anddevelopment of children, and the adoption ofthe ‘National Charter for Children’ in February2004 and the ‘National Plan of Action forChildren’ in August 2005. Proposal to set up a‘National Commission for Child Rights’ is underconsideration of the Parliament.
219Social Sectors
website: http:/indiabudget.nic.in
10.58 One of the largest child interventionprogrammes in the world is the ICDS Schemeinitiated in 1975 with a package of six basicservices for children up to six years of age,and for pregnant and nursing mothers. Theseservices are: health-checkup, immunization,referral services, supplementary feeding,pre-school education, and health andnutrition education through a single windowdelivery system. Staring with a modest33 blocks/projects, it has gradually expandedto 5,652 projects of which 5,624 projects with7,43,156 Anganwadi Centres were operationalon July 31, 2005. ICDS covers 484.42 lakhbeneficiaries consisting of 403 lakh childrenbelow 6 years of age and 81 lakh pregnantand lactating mothers.
10.59 To fulfill the NCMP commitment ofproviding a functional Anganwadi in everysettlement and ensuring full coverage of allchildren, and also to comply with the SupremeCourt’s directives, Government has approvedexpansion of the ICDS Scheme to 467additional ICDS projects and 1,88,168Anganwadi Centres, out of which only 11 ICDSProjects remain to be sanctioned. A numberof new initiatives have been taken to improvethe impact of the programme, which includessharing of a half of the cost of supplementarynutrition with the States under ICDS.
10.60 Special schemes such as the BallikaSamriddhi Yojana (BSY) and Kishori ShaktiYojana (KSY) are being implemented forimproving the life cycle approach of the girlchild. The BSY initiated in 1997-98 providesfor cash deposit in an interest bearing accountto pay for the girl child’s education andsubsequently to revert to her on her attainingthe age of 18 years. The scheme is in theprocess of being transferred to the States. KSYis a special intervention for adolescent girls(11-18 years), which uses the ICDSinfrastructure to provide them all rounddevelopment including nutrition, literacy andvocational skills. KSY, which was implementedin only 2000 blocks up to 2004-05, is beingexpanded to the remaining blocks of thecountry in 2005-06.
10.61 The scheme of Creches and Day-CareCentres for Children of Working and Ailing
Mothers is being implemented by the CentralSocial Welfare Board and two other nationallevel voluntary organizations, namely, IndianCouncil for Child Welfare and the BhartiyaAdimjati Sevak Sangh.
Rural water supply and Sanitation
10.62 Water is a State subject, and theschemes for providing drinking water facilitiesare implemented by the States. The CentralGovernment supplements the efforts of theStates by providing financial and technicalsupport. The Tenth Plan envisages provisionof safe drinking water to all rural habitations.A major programme - “Accelerated RuralWater Supply Programme (ARWSP)” is beingimplemented since 1972-73 to achieve thisobjective. With an investment of overRs. 50,000 crore (up to March 31, 2005),considerable success has been achieved inmeeting the drinking water needs of the ruralpopulation. More than 3.7 million hand pumpsand 1.73 lakh piped water schemes have beeninstalled in the rural areas. As on April 1, 2005,96.1 per cent of rural habitations were fullycovered, and 3.6 per cent were partiallycovered, leaving 0.3 per cent not covered withdrinking water facilities. The diversity in theState-wise coverage of habitations underRural Water Supply (Table 10.10) needs to beaddressed through accelerated improvementin the lagging States.
10.63 ARWSP, currently being implementedthrough the Rajiv Gandhi National DrinkingWater Mission, aims at coverage of all ruralhabitations with population of 100 and above,specially the un-reached ones, ensuresustainability of the systems and sources,tackle the problem of water quality, andinstitutionalize water quality monitoring andsurveillance through a catchment areaapproach. Adequate operation andmaintenance (O&M) is critical for sustainingwater supply systems already created. Theannual estimated cost of O&M at Rs. 6,000crore is heavy for the Government alone tobear. Peoples’ involvement is envisaged notonly to enhance the economic viability of O&Mbut also for better upkeep and enhanced lifespan of the system created. The Centralallocation of funds for ARWSP has been

Economic Survey 2005-2006220
website: http:/indiabudget.nic.in
stepped up from Rs. 2,900 crore in 2004-05to Rs.4,050 crore in 2005-06.
10.64 The results of a fresh habitation surveyconducted in 2003 are under validation.However, the preliminary results of the surveyindicate large incidences of slippage from ‘fullycovered’ to ‘partially/not covered’ categoriesdue to a number of factors such as: sourcesgoing dry, lowering of ground water table,systems outliving their lives, and increase inpopulation resulting in lower per capitaavailability. Drinking Water Supply is one of thesix components of Bharat Nirman, which hasbeen conceived as a plan to be implementedin four years from 2005-06 to 2008-09 forbuilding rural infrastructure. Under BharatNirman, it has been envisaged to cover 55,067uncovered habitations of ComprehensiveAction Plan, '99 and also to address theproblem of slippage and water quality.
10.65 The Central Rural SanitationProgramme (CRSP) launched in 1986 wasrestructured in 1999 to introduce the TotalSanitation Campaign (TSC). TSC envisagessynergized interaction between Government,people and active NGOs. It also incorporatesintensive Information, Education andCommunication (IEC) campaigns, provisionsof an alternative delivery system and moreflexible, demand-oriented construction norms.The revised centrally sponsored schemeenvisages a shift from allocation–basedprogramme to a demand-based project modewith greater household involvement, intensiveIEC campaign and emphasis on schoolsanitation. Under TSC, projects in 540 districtscovering 30 States/UTs have so far beensanctioned with an approved outlay ofRs. 5694.44 crore.
Urban water supply
10.66 The Accelerated Urban Water SupplyProgramme (AUWSP) was launched in March1994 for providing water supply to towns havingpopulation of less than 20,000 as per the 1991Census. Up to July 26, 2005, 1244 projectswith an estimated cost of Rs. 1,822 crore hadbeen approved and Rs. 760 crore released.
Table 10.10 : Status of coverage ofhabitations under rural water supply
(as on April 1, 2005)
State/UT Status of habitations
NC PC FC Total
Andhra Pradesh 0 0 697.32 697.32
Arunachal Pradesh 158 510 3,630 4,298
Assam 238 7137 63180 70,555
Bihar 0 0 1,05,340 1,05,340
Chhattisgarh 0 0 50,379 50,379
Goa 0 6 389 395
Gujarat 0 36 30,233 30,269
Haryana 0 0 6,745 6,745
Himachal Pradesh 0 6891 38476 45,367
Jammu & Kashmir 660 2,551 7,973 11,184
Jharkhand 0 0 100096 1,00,096
Karnataka 0 5618 51064 56,682
Kerala 0 7573 2190 9763
Madhya Pradesh 0 0 1,09,489 1,09,489
Maharashtra 327 17411 68,192 85,930
Manipur 0 0 2791 2791
Meghalaya 12 239 8,385 8,636
Mizoram 0 112 695 807
Nagaland 41 690 794 1,525
Orissa 0 0 1,14,099 1,14,099
Punjab 803 1,128 11,518 13,449
Rajasthan 2,300 0 91646 93,946
Sikkim 0 74 1,605 1,679
Tamil Nadu 0 0 66,631 66,631
Tripura 0 0 7,412 7,412
Uttar Pradesh 0 0 2,43,508 2,43,508
Uttaranchal 30 242 30,702 30,974
West Bengal 0 0 79,036 79,036
A&N Islands 0 102 402 504
Dadra Nagar Haveli 19 41 476 536
Daman& Diu 0 0 32 32
Delhi 0 0 219 219
Lakshadweep 0 10 0 10
Pondicherry 0 108 159 267
Chandigarh 0 0 18 18
Total 4588 50479 13,67,236 14,22,303
NC : Not covered, PC: Partially covered.FC : Fully covered.

221Social Sectors
website: http:/indiabudget.nic.in
This scheme is to be merged with the newlylaunched “National Urban Renewal Mission(NURM)”.
Scheduled Castes (SCs)
10.67 Special Central Assistance (SCA) forthe Special Component Plan (SCP) is a majorscheme for the welfare and development ofSCs. Under the scheme, 100 per centassistance is extended to supplement theefforts of the States/UTs for ensuring rapidsocio-economic development of SCs,especially those living below the poverty line.Allocation for 2005-06 is Rs. 407.36 crore.
10.68 Social empowerment of thedisadvantaged groups is being carried outthrough reduction/removal of prevailinginequalities, disparities and other persistingproblems especially in the field of education.The flagship scheme of Post-MatricScholarships (PMS) to SC students continuedto receive high priority. Under the scheme, overand above their committed liability to extendscholarships to all eligible SC students basedon a means test, 100 per cent CentralAssistance is provided for payment of tuitionand compulsory fees, besides maintenanceallowance. By November 2005, Rs.378.00crore benefiting 28.59 lakh SC students hadbeen released under PMS. The Scheme ofPre-Matric Scholarships for children of familiesengaged in unclean occupation is beingimplemented with the objective to promoteeducation and wean these children away fromthe clutches of their traditional occupations.By January 2006, Rs.10.70 crore wasreleased to benefit 5.54 lakh students. Againstan amount of Rs.47.00 crore provided in2005-06 for construction of hostels for SCboys and girls, expenditure up to January 2006was Rs.45.00 crore (96 per cent).
10.69 For economic development of thesedisadvantaged groups through incomegenerating schemes, special financialinstitutions have been set-up namely:Scheduled Castes Finance and DevelopmentCorporation (NSCFDC), National SafaiKaramchari Finance and DevelopmentCorporation (NSKFDC), National Backward
Classes Finance and DevelopmentCorporation (NBCFDC) and National MinoritiesDevelopment and Finance Corporation(NMDFDC). The Protection of Civil Rights(PCR) Act, 1955, and the SC & ST Preventionof Atrocities (POA) Act, 1989 are the twoimportant legal instruments to prevent/curbpersistent problems of social discrimination,prevalence of social evils like untouchabilityand cases of exploitation and atrocities againstthese disadvantaged groups.
Scheduled Tribes (STs)
10.70 According to the 2001 Census, STsaccounted for 84.32 million, equivalent to8.2 per cent of the country’s total population.Compared to the rest of the society, STscontinue to persist in socio-economicbackwardness. The objective of the Tenth Planis to empower the STs through theireducational, economic and socialdevelopment.
10.71 For the welfare and development of theSTs, an outlay of Rs. 1,499 crore has beenprovided in the Annual Plan for 2005-06, up30.79 per cent from the corresponding outlayof Rs. 1,146 crore for 2004-05. The outlay of2005-06 includes Rs.727 crore provided asSpecial Central Assistance (SCA) to Tribal-Sub Plan (TSP) and Rs.380 crore providedas grant-in-aid under Article 275(1) of theConstitution.
10.72 SCA to Tribal Sub-Plan (TSP) is a 100per cent grant extended to States as an additiveto undertake a number of developmentalschemes. The focus is on family-orientedincome-generating schemes, creation ofcritical infrastructure, extending financialassistance to SHGs for community-basedactivities, development of Primitive TribalGroups (PTGs) and forest villages. Grant-in-aid under Article 275(1) is also being providedto the States with an objective to promote thewelfare of the STs and improve administrationin the States to bring them at par with the restof the States, and to take up such specialwelfare and development programmes whichare otherwise not included in the Planprogrammes. Under the flagship scheme ofPost-Matric Scholarships (PMS), all eligible ST

Economic Survey 2005-2006222
website: http:/indiabudget.nic.in
students are provided with stipend to pursuetheir education beyond matric includingprofessional and graduate and post-graduatecourses in recognized institutions. A newscheme of Rajiv Gandhi National Fellowshipfor ST students to pursue higher education isbeing introduced in 2005-06. Economicempowerment of the STs continued throughextension of financial support to FinanceCorporations and Tribal Cooperative MarketingFederation of India Limited (TRIFED). Underthe Scheme of National Scheduled TribesFinance and Development Corporation andGrant-in-Aid to State Scheduled TribesDevelopment and Finance Corporation,financial support is being extended to STbeneficiaries/entrepreneurs in the form ofterm-loans and micro credit at concessionalrate of interests for income generatingactivities. An outlay of Rs.30 crore wasprovided in Annual Plan 2005-06 for theseschemes. Other economic developmentschemes being implemented are grant-in-aidto NGOs, vocational training centres in tribalareas, investment in TRIFED and pricesupport and grant-in-aid to STDCs.
Minorities
10.73 Five communities — Muslims,Christians, Sikhs, Buddhists and Parsis —have been declared as minority communitiesby the Government. With a population of189.5 million, the five notified minoritycommunities constituted 18.42 per cent of thetotal population as per the 2001 Census.
10.74 An allocation of Rs.55 crore was madefor 2005-06 for welfare and developmentactivities of minorities. This includes Rs.30.00crore for the Scheme of Maulana AzadEducation Foundation. A significant proportionof the minority communities are engaged intraditional arts and crafts, like handlooms,handicrafts, glass works and metal works; andpriority has been given for up-gradation of thetechnical know-how of these trades. NationalMinority Development Finance Corporation hasbeen extending financial assistance and othertechnical support to minority entrepreneurs.
National Commission for Minorities strives toprotect the interest of the minoritycommunities and work for their welfare anddevelopment.
Other Backward Classes (OBC)
10.75 Central assistance is provided to StateGovernments/UTs for educationaldevelopment of OBCs. Till January 2006,Rs. 25.06 crore and Rs.19.20 crore had beenreleased to States/UTs under Post-MatricScholarships and Pre-Matric Scholarships forOBCs respectively. For construction of hostelsfor OBC boys and girls, Rs.10.72 crore hadbeen released till January 2006 to StateGovernments/UTs/NGOs. The Ministry alsoimplemented programmes through voluntaryorganisations for various skill development ofOBCs.
10.76 National Backward Classes Financeand Development Corporation extends creditfacilities to persons living below double thepoverty line for undertaking various incomegenerating activities. During April-November2005, the Corporation had disbursed Rs. 42.35crore benefitting 33,241 persons.
Welfare of persons with disabilities
10.77 In 2005-06, out of the allocation ofRs.250.60 crore for welfare of persons withdisabilities, an expenditure of Rs.104.50 crorewas incurred up to January 2006. Action hasbeen initiated to suitably emphasize disabilityconcerns in SSA and ensure that most of thechildren with disabilities are covered throughinclusive education programmes.
10.78 Persons with Disabilities Act, 1995 isunder implementation. Five compositerehabilitation centres at Bhopal, Guwahati,Lucknow, Srinagar and Sundernagar providefacilities for manpower development andensure availability of rehabilitation services toall categories of persons with disabilities. FourRegional Rehabilitation Centres provideservices to persons with spinal injuries atBareilly, Chandigarh, Cuttack and Jabalpur. Ofthe 149 District Disability RehabilitationCentres sanctioned in the country for providingcomprehensive rehabilitation services at thegrass roots level, 122 are functional.
223Social Sectors
website: http:/indiabudget.nic.in
10.79 Under the scheme of assistance to thedisabled for purchase/fitting of Aids andAppliances (ADIP), Rs. 32.40 crore had beenreleased to benefit 1.14 lakh beneficiaries in2005-06 up to January 2006. Artificial Limbsand Manufacturing Corporation manufacturesdifferent types of aids and appliances fordisabled persons at low cost and workstowards development of new prototypes andaids and appliances.
10.80 Deen Dayal Disabled RehabilitationScheme (earlier known as Scheme toPromote Voluntary Action for Persons withDisabilities) provides financial assistance tovoluntary organizations for runningrehabilitation centres for leprosy-curedpersons, for manpower development in thefield of mental retardation and cerebral palsy,and for establishment and development ofSpecial Schools in the major areas oforthopaedic, speech, hearing, visual andmental disability.
10.81 A Scheme of National Scholarship forPersons with Disabilities has been introducedfrom the year 2003-04. 500 new awards aregiven every year to students in differentcategories of disabilities for pursuing higherand technical education.
Social defence sector
10.82 The Social Defence Bureau of theMinistry of Social Justice and Empowermentundertakes programmes for the benefit ofvictims of substance abuse, children in needof care and protection, and welfare of the aged.Rigorous efforts are being made to tackle theproblem of drug demand through an integratedand comprehensive community-basedapproach to the growing problem of alcoholismand drug abuse in the country, especially inthe uncovered rural areas and North East, andamong high-risk groups like street children andcommercial sex workers. 54 counselingcentres and 364 treatment cum rehabilitationcentres are being supported under thescheme of Prevention of Alcoholism andSubstance (Drugs) Abuse. Under the
‘Programme of Juvenile Justice’, the cost ofmaintaining mandatory homes for the childrenin conflict with the law, and for those in needof care and protection is shared between theCentre and the States. The programmepresently supports services for 15,696 juvenileinmates in over 290 mandatory homes.
10.83 “1098” is a toll-free telephone numberservices ‘Childline”, which is a helpline forchildren in distress. A child in need or anyoneon his/her behalf can call this number in56 cities of India and seek emergency or otherassistance by way of rescue from a situationof abuse, medical help, restoration to family,and emotional support. 85 lakh calls werereceived and attended to up to November2005. Under the scheme of an IntegratedProgramme for Street Children, NGOs arebeing supported in running shelters, non-formal education and vocational trainingprogrammes coupled with nutritional supportand medical care in 22 States.
Caring for the other disadvantaged
10.84 To fulfill the commitments of theNational Policy on Older Persons for providinghealth, shelter, vocational training, recreationand protection of life, special emphasis is beinggiven for expanding the old age homes andday care centres, provision of mobilemedicare units and medicare centres underthe Integrated Programme for Older Persons.Under this scheme, up to September, 2005,300 NGOs running Old Age Homes, Day CareCentres and Mobile Medicare Units have beenprovided financial assistance.
10.85 A new scheme called Senior CitizensSaving Scheme has been introduced throughPost Offices doing savings bank work forpersons above 60 years of age. The NationalInstitute of Social Defence focuses on trainingand manpower development of social defencepersonnel, especially in the areas ofcommunity based services for juvenile justice,prison welfare, prison administration, childadoption, children in need for care andprotection, prevention of drug-abuse, welfareof senior citizens and emerging socialproblems.
Economic Survey 2005-2006224
website: http:/indiabudget.nic.in
OutlookThe combined effects of economic growth
and measures for direct interventions forpoverty alleviation have translated intoimpressive decline in the incidence of povertyin the recent past. With a sustained growthmomentum and launching of the majorinitiative for creation of rural employment inthe form of the NREGS, this trend will continuein future. Progressive increase in the coverageof this programme from the current level of200 districts to the whole country in the nextfive years, effective implementation along withtransparency through the Right to InformationAct and accountability through decentralizedPanchayati Raj Institutions (PRIs) areexpected to make a permanent dent on theincidence of unemployment and poverty in thecountry.
There has been a consistent upward trendin the public expenditure on the social sectorsboth by the Centre and the States. This trendwill continue with the launching of certain majorinitiatives undertaken during 2005-06.
Coverage under various programmes in thesocial sector has been considerably enhancedduring the Tenth Plan. This is true of thesectors of elementary education, primaryhealth care, nutrition, water supply, welfare anddevelopment of the backward classes, andprogrammes for development of women andchildren etc. The focus under many of theseprogrammes is likely to shift fromuniversalisation of the coverage or quantity toimprovement in delivery or quality of theprogrammes. A number of new initiativeslaunched during 2005-06 specifically aim atachievement of these objectives. In thecoming years, there will be greater stress onimprovement in the quality of elementaryeducation being imparted, quality of primaryhealth care being delivered, quality of watersupply and creation of productive assetsthrough wage employment programmes. Thiswill ensure tangible human development whichwill enhance capacity building of the peopleand improve the opportunity for theirproductive participation in the growth process.
Related Documents