EuroVis 2017 M. Meyer, S. Takahashi, A. Vilanova (Guest Editors) Volume 36 (2017), Number 3 STAR – State of The Art Report Social Media Visual Analytics Siming Chen 1 , Lijing Lin 1 and Xiaoru Yuan † 1 1 Key Laboratory of Machine Perception (Ministry of Education), and School of EECS, Peking University, China Abstract With the development of social media (e.g. Twitter, Flickr, Foursquare, Sina Weibo, etc.), a large number of people are now using them and post microblogs, messages and multi-media information. The everyday usage of social media results in big open social media data. The data offer fruitful information and reflect social behaviors of people. There is much visualization and visual analytics research on such data. We collect state-of-the-art research and put it into three main categories: social network, spatial temporal information and text analysis. We further summarize the visual analytics pipeline for the social media, combining the above categories and supporting complex tasks. With these techniques, social media analytics can apply to multiple disciplines. We summarize the applications and public tools to further investigate the challenges and trends. 1. Introduction Social media are web-based platforms where users create and share messages via virtual communities and social networks. In recent years, the social media change the way people communicate, share, live, etc. The core parts of social media are users and their behav- iors. Users can post and repost (i.e. resend the messages initially posted by others) messages, which have time stamps, text, media, and possibly geo-tags. These behaviors lead to information diffu- sion in social media. The user-generated content spreads through social communication online. Social media data records all the messages posted and behaviors of users. These data are quite big and with many unseen patterns inside. Moreover, a large amount of open social media data is available. Thus, many researchers pay at- tention to social media analytics. Data mining can effectively iden- tify specifically defined features on social media [TSWY09, PP11], such as influencer identification, user classification. However, not all patterns are well defined and the analysis requires a large in- volvement of humans. Thus, researches in visual analytics propose many advanced methods and tools to seek patterns on social me- dia and solve problems in the analyzing process. Our work aims to summarize the state-of-the-art in visualization and visual analyt- ics, to give a research outline and to discuss possible directions and challenges of future research in social media visual analytics. 1.1. Related Surveys There are several surveys on analyzing and mining the behaviors in information diffusion [GHFZ13, BT14]. However, to the best of our † {siming.chen, lijing.lin, xiaoru.yuan}@pku.edu.cn knowledge, there are only two general reviews for social media vi- sual analytics from Schreck et al. [SK13] and Wu et al. [WCG * 16]. In 2013, Schreck et al. described a small number of representative papers in detail. We believe that a more complete survey of state-of- the-art work is necessary. Wu et al. summarized more papers from two research domains of multimedia and visualization [WCG * 16]. They emphasized gathering information and analyzing user behav- iors in multimedia analysis. However, we have a different perspec- tive for collecting related works and propose a new taxonomy for classifying the visualization and visual analytics process of social media. We also take a broader view of related surveys into consideration. These surveys include multi-variate visualiza- tion [MGMZ14], dynamic network visualization [BBDW16], text visualization [WSJ * 14, KK15, KKRS13], community detection and visualization [VBW15] and personal visualization [HTA * 15] etc. They have only mentioned some works in social media visual ana- lytics and refer to them as examples in the application areas. To fill in the blank and provide an overview of related research, it is nec- essary to provide such a state-of-the-art survey focusing on visual analytics of social media data. 1.2. Data There is a variety of derived data based on users’ activities in social media. We investigate multiple attributes of data and propose our categories of the targeting entities. In one aspect, users follow other users based on the existing re- lationship, similar hobbies, and information feed, etc., which con- structs the users’ following-followee network. We abbreviate it to the follower network. Users’ communication and reposting behav- c 2017 The Author(s) Computer Graphics Forum c 2017 The Eurographics Association and John Wiley & Sons Ltd. Published by John Wiley & Sons Ltd. DOI: 10.1111/cgf.13211

Welcome message from author
This document is posted to help you gain knowledge. Please leave a comment to let me know what you think about it! Share it to your friends and learn new things together.
Transcript
EuroVis 2017M. Meyer, S. Takahashi, A. Vilanova(Guest Editors)
Volume 36 (2017), Number 3
STAR – State of The Art Report
Social Media Visual Analytics
Siming Chen1, Lijing Lin1 and Xiaoru Yuan†1
1Key Laboratory of Machine Perception (Ministry of Education), and School of EECS, Peking University, China
Abstract
With the development of social media (e.g. Twitter, Flickr, Foursquare, Sina Weibo, etc.), a large number of people are now
using them and post microblogs, messages and multi-media information. The everyday usage of social media results in big
open social media data. The data offer fruitful information and reflect social behaviors of people. There is much visualization
and visual analytics research on such data. We collect state-of-the-art research and put it into three main categories: social
network, spatial temporal information and text analysis. We further summarize the visual analytics pipeline for the social
media, combining the above categories and supporting complex tasks. With these techniques, social media analytics can apply
to multiple disciplines. We summarize the applications and public tools to further investigate the challenges and trends.
1. Introduction
Social media are web-based platforms where users create and sharemessages via virtual communities and social networks. In recentyears, the social media change the way people communicate, share,live, etc. The core parts of social media are users and their behav-iors. Users can post and repost (i.e. resend the messages initiallyposted by others) messages, which have time stamps, text, media,and possibly geo-tags. These behaviors lead to information diffu-sion in social media. The user-generated content spreads throughsocial communication online. Social media data records all themessages posted and behaviors of users. These data are quite bigand with many unseen patterns inside. Moreover, a large amount ofopen social media data is available. Thus, many researchers pay at-tention to social media analytics. Data mining can effectively iden-tify specifically defined features on social media [TSWY09,PP11],such as influencer identification, user classification. However, notall patterns are well defined and the analysis requires a large in-volvement of humans. Thus, researches in visual analytics proposemany advanced methods and tools to seek patterns on social me-dia and solve problems in the analyzing process. Our work aimsto summarize the state-of-the-art in visualization and visual analyt-ics, to give a research outline and to discuss possible directions andchallenges of future research in social media visual analytics.
1.1. Related Surveys
There are several surveys on analyzing and mining the behaviors ininformation diffusion [GHFZ13,BT14]. However, to the best of our
† {siming.chen, lijing.lin, xiaoru.yuan}@pku.edu.cn
knowledge, there are only two general reviews for social media vi-sual analytics from Schreck et al. [SK13] and Wu et al. [WCG∗16].In 2013, Schreck et al. described a small number of representativepapers in detail. We believe that a more complete survey of state-of-the-art work is necessary. Wu et al. summarized more papers fromtwo research domains of multimedia and visualization [WCG∗16].They emphasized gathering information and analyzing user behav-iors in multimedia analysis. However, we have a different perspec-tive for collecting related works and propose a new taxonomy forclassifying the visualization and visual analytics process of socialmedia.
We also take a broader view of related surveys intoconsideration. These surveys include multi-variate visualiza-tion [MGMZ14], dynamic network visualization [BBDW16], textvisualization [WSJ∗14,KK15,KKRS13], community detection andvisualization [VBW15] and personal visualization [HTA∗15] etc.They have only mentioned some works in social media visual ana-lytics and refer to them as examples in the application areas. To fillin the blank and provide an overview of related research, it is nec-essary to provide such a state-of-the-art survey focusing on visualanalytics of social media data.
1.2. Data
There is a variety of derived data based on users’ activities in socialmedia. We investigate multiple attributes of data and propose ourcategories of the targeting entities.
In one aspect, users follow other users based on the existing re-lationship, similar hobbies, and information feed, etc., which con-structs the users’ following-followee network. We abbreviate it tothe follower network. Users’ communication and reposting behav-
c© 2017 The Author(s)Computer Graphics Forum c© 2017 The Eurographics Association and JohnWiley & Sons Ltd. Published by John Wiley & Sons Ltd.
DOI: 10.1111/cgf.13211
S. Chen, L. Lin & X. Yuan / Social Media Visual Analytics Survey
Social Media Data
Following and Friends
Preprocessing
Graph-based
Calculation
Network
Visualization
Spatial
Visualization
Text
Visualization
Derived Information
Multi-facet and
Dynamic Relationship
Spatial Temporal Event
and Flow
Text, Keywords, Topic
and Sentiment
Visual Analytics Approach
Visual
Monitoring
Knowledge
Social Relationship
and Behaviors
Spatial Temporal
Pattern
Event and Topic
Dynamics
Event Di!usion
Movement
Reposting
Geographic Attributes
Multi-Media Content
Spatial Temporal
Aggregation
Entity detection
and NLP process
Dynamic Text
Visualization
Event
Detection
Predictive
Analysis
Feature
Extraction
Dynamic Network
Visualization
Visualization
Anomaly
Detection
Situation
Awareness
Other Sources Data
POI Information
Crisis Management
People Pro"le
......
Heterogeneous
Data Merge
Multiple
Attributes Analysis
Interactive
Exploration
Iterative
Feedback
Dynamic Flow
Visualization
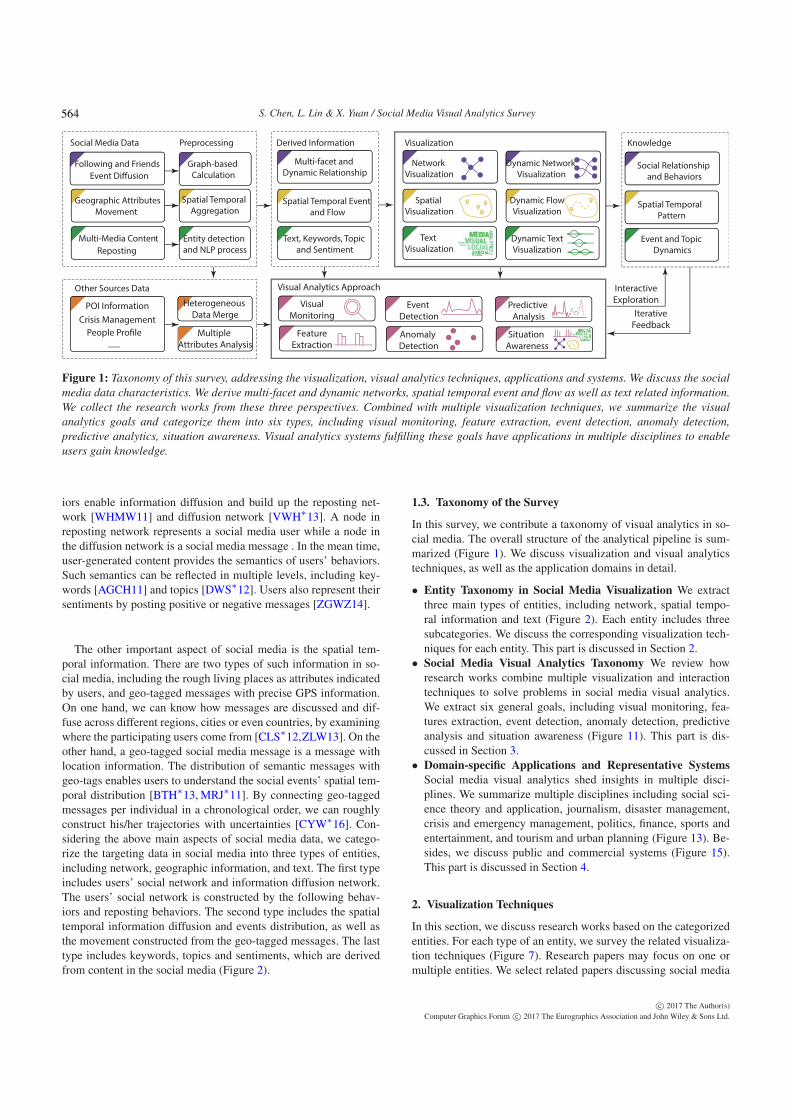
Figure 1: Taxonomy of this survey, addressing the visualization, visual analytics techniques, applications and systems. We discuss the social
media data characteristics. We derive multi-facet and dynamic networks, spatial temporal event and flow as well as text related information.
We collect the research works from these three perspectives. Combined with multiple visualization techniques, we summarize the visual
analytics goals and categorize them into six types, including visual monitoring, feature extraction, event detection, anomaly detection,
predictive analytics, situation awareness. Visual analytics systems fulfilling these goals have applications in multiple disciplines to enable
users gain knowledge.
iors enable information diffusion and build up the reposting net-work [WHMW11] and diffusion network [VWH∗13]. A node inreposting network represents a social media user while a node inthe diffusion network is a social media message . In the mean time,user-generated content provides the semantics of users’ behaviors.Such semantics can be reflected in multiple levels, including key-words [AGCH11] and topics [DWS∗12]. Users also represent theirsentiments by posting positive or negative messages [ZGWZ14].
The other important aspect of social media is the spatial tem-poral information. There are two types of such information in so-cial media, including the rough living places as attributes indicatedby users, and geo-tagged messages with precise GPS information.On one hand, we can know how messages are discussed and dif-fuse across different regions, cities or even countries, by examiningwhere the participating users come from [CLS∗12,ZLW13]. On theother hand, a geo-tagged social media message is a message withlocation information. The distribution of semantic messages withgeo-tags enables users to understand the social events’ spatial tem-poral distribution [BTH∗13, MRJ∗11]. By connecting geo-taggedmessages per individual in a chronological order, we can roughlyconstruct his/her trajectories with uncertainties [CYW∗16]. Con-sidering the above main aspects of social media data, we catego-rize the targeting data in social media into three types of entities,including network, geographic information, and text. The first typeincludes users’ social network and information diffusion network.The users’ social network is constructed by the following behav-iors and reposting behaviors. The second type includes the spatialtemporal information diffusion and events distribution, as well asthe movement constructed from the geo-tagged messages. The lasttype includes keywords, topics and sentiments, which are derivedfrom content in the social media (Figure 2).
1.3. Taxonomy of the Survey
In this survey, we contribute a taxonomy of visual analytics in so-cial media. The overall structure of the analytical pipeline is sum-marized (Figure 1). We discuss visualization and visual analyticstechniques, as well as the application domains in detail.
• Entity Taxonomy in Social Media Visualization We extractthree main types of entities, including network, spatial tempo-ral information and text (Figure 2). Each entity includes threesubcategories. We discuss the corresponding visualization tech-niques for each entity. This part is discussed in Section 2.
• Social Media Visual Analytics Taxonomy We review howresearch works combine multiple visualization and interactiontechniques to solve problems in social media visual analytics.We extract six general goals, including visual monitoring, fea-tures extraction, event detection, anomaly detection, predictiveanalysis and situation awareness (Figure 11). This part is dis-cussed in Section 3.
• Domain-specific Applications and Representative Systems
Social media visual analytics shed insights in multiple disci-plines. We summarize multiple disciplines including social sci-ence theory and application, journalism, disaster management,crisis and emergency management, politics, finance, sports andentertainment, and tourism and urban planning (Figure 13). Be-sides, we discuss public and commercial systems (Figure 15).This part is discussed in Section 4.
2. Visualization Techniques
In this section, we discuss research works based on the categorizedentities. For each type of an entity, we survey the related visualiza-tion techniques (Figure 7). Research papers may focus on one ormultiple entities. We select related papers discussing social media
c© 2017 The Author(s)Computer Graphics Forum c© 2017 The Eurographics Association and John Wiley & Sons Ltd.
564
S. Chen, L. Lin & X. Yuan / Social Media Visual Analytics Survey
Entities in Social Media
Network Geographic Information Text and Content
People’s
Follower Network
Messages’
Di!usion Network
People’s
Reposting Network
Geographic
Information Di!usion
Spatial Temporal
Event Distribution
Movement Trajectory
Keywords
Topic
Sentiment
+ Time
Dynamic
Network
+ Time
Spatial
Temporal
Scenes
+ Time
Dynamic
Sementic
Flow
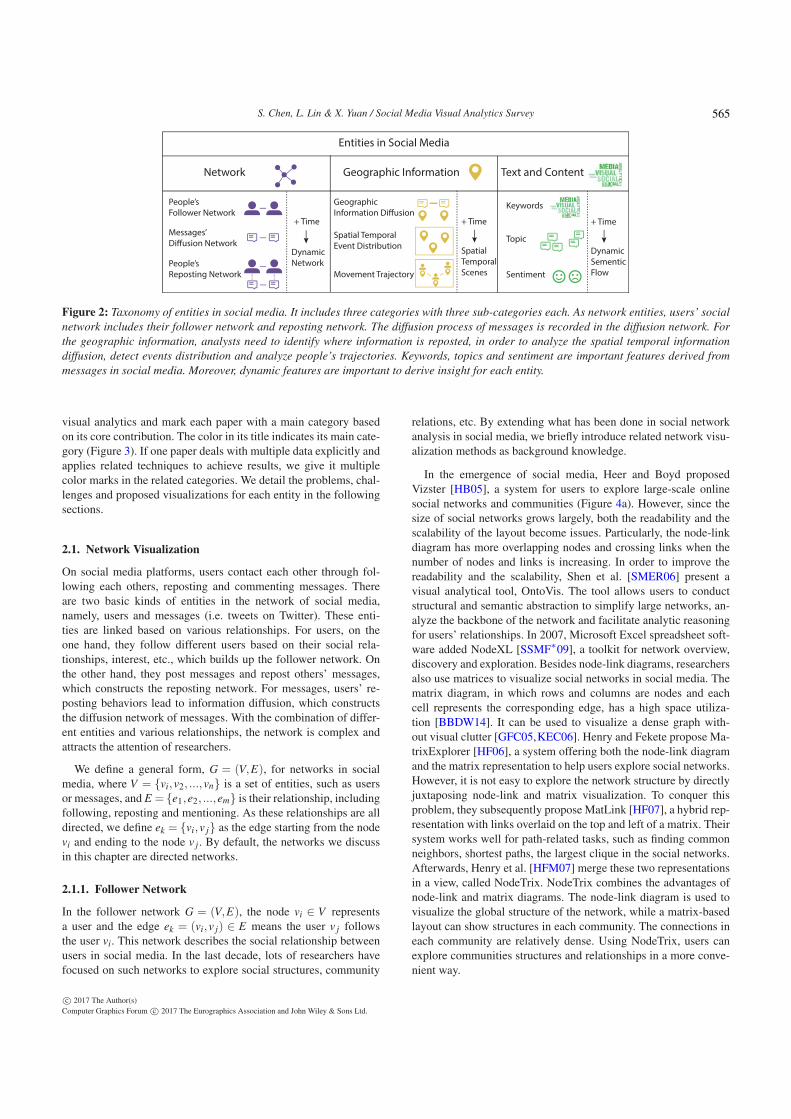
Figure 2: Taxonomy of entities in social media. It includes three categories with three sub-categories each. As network entities, users’ social
network includes their follower network and reposting network. The diffusion process of messages is recorded in the diffusion network. For
the geographic information, analysts need to identify where information is reposted, in order to analyze the spatial temporal information
diffusion, detect events distribution and analyze people’s trajectories. Keywords, topics and sentiment are important features derived from
messages in social media. Moreover, dynamic features are important to derive insight for each entity.
visual analytics and mark each paper with a main category basedon its core contribution. The color in its title indicates its main cate-gory (Figure 3). If one paper deals with multiple data explicitly andapplies related techniques to achieve results, we give it multiplecolor marks in the related categories. We detail the problems, chal-lenges and proposed visualizations for each entity in the followingsections.
2.1. Network Visualization
On social media platforms, users contact each other through fol-lowing each others, reposting and commenting messages. Thereare two basic kinds of entities in the network of social media,namely, users and messages (i.e. tweets on Twitter). These enti-ties are linked based on various relationships. For users, on theone hand, they follow different users based on their social rela-tionships, interest, etc., which builds up the follower network. Onthe other hand, they post messages and repost others’ messages,which constructs the reposting network. For messages, users’ re-posting behaviors lead to information diffusion, which constructsthe diffusion network of messages. With the combination of differ-ent entities and various relationships, the network is complex andattracts the attention of researchers.
We define a general form, G = (V,E), for networks in socialmedia, where V = {vi,v2, ...,vn} is a set of entities, such as usersor messages, and E = {e1,e2, ...,em} is their relationship, includingfollowing, reposting and mentioning. As these relationships are alldirected, we define ek = {vi,v j} as the edge starting from the nodevi and ending to the node v j . By default, the networks we discussin this chapter are directed networks.
2.1.1. Follower Network
In the follower network G = (V,E), the node vi ∈ V representsa user and the edge ek = (vi,v j) ∈ E means the user v j followsthe user vi. This network describes the social relationship betweenusers in social media. In the last decade, lots of researchers havefocused on such networks to explore social structures, community
relations, etc. By extending what has been done in social networkanalysis in social media, we briefly introduce related network visu-alization methods as background knowledge.
In the emergence of social media, Heer and Boyd proposedVizster [HB05], a system for users to explore large-scale onlinesocial networks and communities (Figure 4a). However, since thesize of social networks grows largely, both the readability and thescalability of the layout become issues. Particularly, the node-linkdiagram has more overlapping nodes and crossing links when thenumber of nodes and links is increasing. In order to improve thereadability and the scalability, Shen et al. [SMER06] present avisual analytical tool, OntoVis. The tool allows users to conductstructural and semantic abstraction to simplify large networks, an-alyze the backbone of the network and facilitate analytic reasoningfor users’ relationships. In 2007, Microsoft Excel spreadsheet soft-ware added NodeXL [SSMF∗09], a toolkit for network overview,discovery and exploration. Besides node-link diagrams, researchersalso use matrices to visualize social networks in social media. Thematrix diagram, in which rows and columns are nodes and eachcell represents the corresponding edge, has a high space utiliza-tion [BBDW14]. It can be used to visualize a dense graph with-out visual clutter [GFC05,KEC06]. Henry and Fekete propose Ma-trixExplorer [HF06], a system offering both the node-link diagramand the matrix representation to help users explore social networks.However, it is not easy to explore the network structure by directlyjuxtaposing node-link and matrix visualization. To conquer thisproblem, they subsequently propose MatLink [HF07], a hybrid rep-resentation with links overlaid on the top and left of a matrix. Theirsystem works well for path-related tasks, such as finding commonneighbors, shortest paths, the largest clique in the social networks.Afterwards, Henry et al. [HFM07] merge these two representationsin a view, called NodeTrix. NodeTrix combines the advantages ofnode-link and matrix diagrams. The node-link diagram is used tovisualize the global structure of the network, while a matrix-basedlayout can show structures in each community. The connections ineach community are relatively dense. Using NodeTrix, users canexplore communities structures and relationships in a more conve-nient way.
c© 2017 The Author(s)Computer Graphics Forum c© 2017 The Eurographics Association and John Wiley & Sons Ltd.
565
S. Chen, L. Lin & X. Yuan / Social Media Visual Analytics Survey
Bib
texK
ey/C
ateg
ory
Hen
ry e
t al.
2007
[HF0
7]
Hen
ry e
t al.
2007
a [H
FM07
]
Ch
i et a
l. 20
09 [C
ZH
09]
Beze
rian
os
et a
l. 20
10 [B
CD
10]
Bran
des
et a
l. 20
11 [B
N11
b]
Vié
gas
et a
l. 20
13 [V
WH
13]
Ren
et a
l. 20
14 [R
ZW
14]
Li e
t al.
2013
[LQ
C13
]
Liu
et a
l. 20
15 [L
WYZ
15]
Zh
ao e
t al.
2014
[ZC
W14
]
Cu
i et a
l. 20
14a
[CW
L14
]
Ch
en e
t al.
2016
a [C
CW
16]
Wan
g e
t al.
2016
[WLC
16]
Cao
et a
l. 20
16 [C
SL 1
6]
Yuan
et a
l. 20
14 [Y
WL
14]
Cao
et a
l. 20
12 [C
LS 1
2]
Cro
ito
ru e
t al.
2013
[CC
RS13
]
Zh
ang
et a
l. 20
13 [Z
LW13
]
Mac
Each
ren
et a
l. 20
11 [M
JR 1
1 ]
Mac
Each
ren
et a
l. 20
11a
[MRJ
11 ]
Ch
ae e
t al.
2012
[CTB
12]
Kraf
t et a
l. 20
13 [K
WD
13]
Ch
ae e
t al.
2014
[CTJ
14
]
Tho
m e
t al.
2012
[TBK
12]
Bosc
h e
t al.
2013
[BTH
13
]
Tho
m e
t al.
2015
[TKE
15
]
Prie
to e
t al.
2015
[PH
E 1
5]
McK
enzi
e et
al.
2014
[MJG
14]
Xia
et a
l. 20
14 [X
SX 1
4]
Ch
en e
t al.
2016
[CYW
*16
]
Ch
ua
et a
l. 20
14 [C
MSV
M14
]
Kru
eger
et a
l. 20
16 [K
SB 1
6]
Liu
et a
l. 20
14 [L
SKG
14]
Wu
et a
l. 20
14 [W
ZSL
14]
Ch
ae20
15 [C
CJ
15 ]
An
dri
enko
et a
l. 20
12 [A
AS
12 ]
An
dri
enko
et a
l. 20
13 [A
AF
13]
Dö
rk e
t al.
2010
[DG
WC
10]
Dia
kop
ou
los
et a
l. 20
11 [D
NYK
S11]
Dia
kop
ou
los
et a
l. 20
10 [D
NK1
0]
Fisc
her
et a
l. 20
14 [F
S14]
Arc
ham
bau
lt e
t al.
2011
[AG
CH
11]
Best
et a
l. 20
12 [B
BD 1
2]
Hu
et a
l. 20
17 [H
WS1
7]
Liu
et a
l. 20
16 [L
LZ 1
6]
Wan
ner
2016
[WJS
16]
Do
u e
t al.
2012
[DW
S 1
2]
Do
u e
t al.
2015
a [D
CE
15
]
Gan
sner
et a
l. 20
13a
[GH
N13
]
Liu
et a
l. 20
13 [L
WW
13]
Rib
arsk
y et
al.
2014
[RW
D14
]
Wan
g e
t al.
2012
[WD
M12
]
Do
u e
t al.
2013
[DYW
13]
Cu
i et a
l. 20
14 [C
LWW
14]
Xu
et a
l. 20
13 [X
WW
13]
Wu
et a
l. 20
14 [W
LY14
]
Sun
et a
l. 20
14 [S
WL
14]
Hu
et a
l. 20
13 [H
YZ13
]
Zh
ao e
t al.
2014
a [Z
GW
Z14
]
Stee
d e
t al.
2015
[SD
B15
]
Kuch
er e
t al.
2015
[KSB
K15
]
Lu e
t al.
2014
[LW
M14
]
Lu e
t al.
2014
a [L
KT 1
4]
Bolle
n e
t al.
2011
[BM
Z11
]
Mar
cus
et a
l. 20
11 [M
BB 1
1]
Cao
et a
l.201
4 [C
LL*
14 ]
Roh
rdan
tz20
12 [R
HD
12 ]
Liu
et a
l. 20
16 [L
XG
*16
]
SUM
N1 7
N2 14
N3 11
G1 7
G2 23
G3 8
T1 48
T2 30
T3 20
VM 30
FE 43
ED 22
AD 12
PA 7
SA 5
SUM 2 2 3 2 2 2 6 3 4 5 2 5 5 7 6 7 6 4 5 4 5 6 4 5 6 6 2 5 5 4 3 3 4 4 4 3 4 5 5 5 4 3 5 2 4 2 5 3 3 4 3 7 3 4 5 8 5 4 4 4 3 4 4 3 6 5 5 5
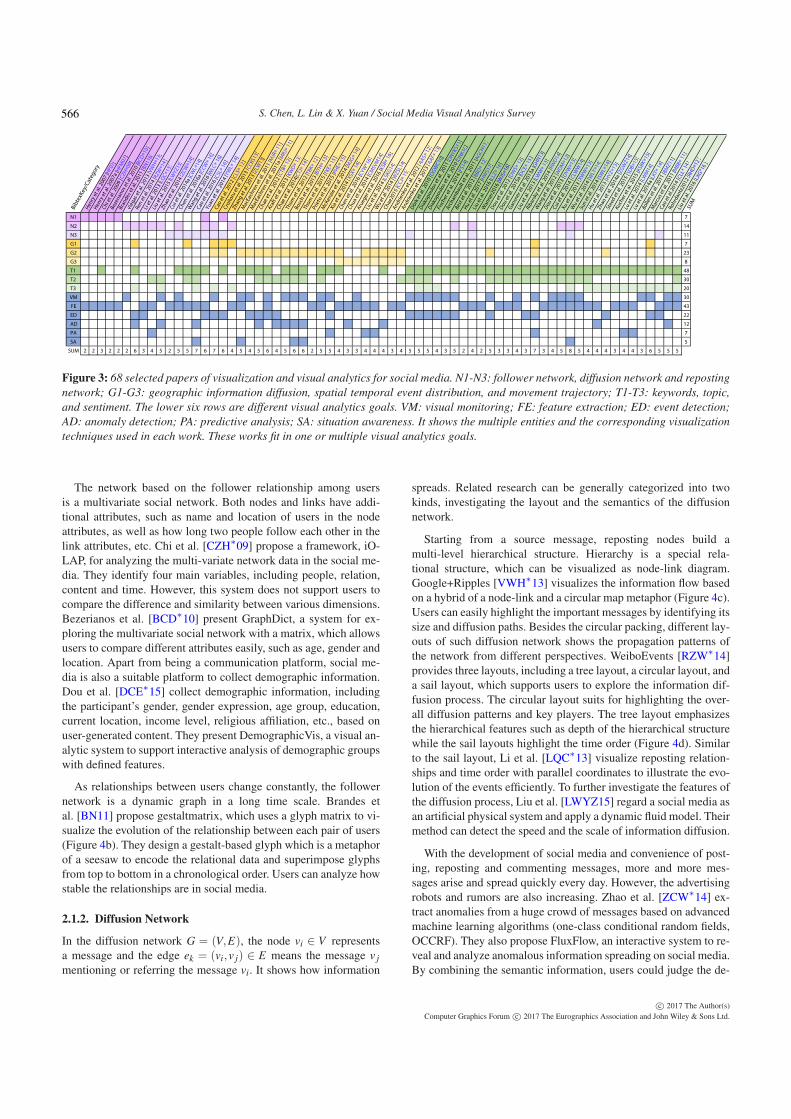
Figure 3: 68 selected papers of visualization and visual analytics for social media. N1-N3: follower network, diffusion network and reposting
network; G1-G3: geographic information diffusion, spatial temporal event distribution, and movement trajectory; T1-T3: keywords, topic,
and sentiment. The lower six rows are different visual analytics goals. VM: visual monitoring; FE: feature extraction; ED: event detection;
AD: anomaly detection; PA: predictive analysis; SA: situation awareness. It shows the multiple entities and the corresponding visualization
techniques used in each work. These works fit in one or multiple visual analytics goals.
The network based on the follower relationship among usersis a multivariate social network. Both nodes and links have addi-tional attributes, such as name and location of users in the nodeattributes, as well as how long two people follow each other in thelink attributes, etc. Chi et al. [CZH∗09] propose a framework, iO-LAP, for analyzing the multi-variate network data in the social me-dia. They identify four main variables, including people, relation,content and time. However, this system does not support users tocompare the difference and similarity between various dimensions.Bezerianos et al. [BCD∗10] present GraphDict, a system for ex-ploring the multivariate social network with a matrix, which allowsusers to compare different attributes easily, such as age, gender andlocation. Apart from being a communication platform, social me-dia is also a suitable platform to collect demographic information.Dou et al. [DCE∗15] collect demographic information, includingthe participant’s gender, gender expression, age group, education,current location, income level, religious affiliation, etc., based onuser-generated content. They present DemographicVis, a visual an-alytic system to support interactive analysis of demographic groupswith defined features.
As relationships between users change constantly, the followernetwork is a dynamic graph in a long time scale. Brandes etal. [BN11] propose gestaltmatrix, which uses a glyph matrix to vi-sualize the evolution of the relationship between each pair of users(Figure 4b). They design a gestalt-based glyph which is a metaphorof a seesaw to encode the relational data and superimpose glyphsfrom top to bottom in a chronological order. Users can analyze howstable the relationships are in social media.
2.1.2. Diffusion Network
In the diffusion network G = (V,E), the node vi ∈ V representsa message and the edge ek = (vi,v j) ∈ E means the message v j
mentioning or referring the message vi. It shows how information
spreads. Related research can be generally categorized into twokinds, investigating the layout and the semantics of the diffusionnetwork.
Starting from a source message, reposting nodes build amulti-level hierarchical structure. Hierarchy is a special rela-tional structure, which can be visualized as node-link diagram.Google+Ripples [VWH∗13] visualizes the information flow basedon a hybrid of a node-link and a circular map metaphor (Figure 4c).Users can easily highlight the important messages by identifying itssize and diffusion paths. Besides the circular packing, different lay-outs of such diffusion network shows the propagation patterns ofthe network from different perspectives. WeiboEvents [RZW∗14]provides three layouts, including a tree layout, a circular layout, anda sail layout, which supports users to explore the information dif-fusion process. The circular layout suits for highlighting the over-all diffusion patterns and key players. The tree layout emphasizesthe hierarchical features such as depth of the hierarchical structurewhile the sail layouts highlight the time order (Figure 4d). Similarto the sail layout, Li et al. [LQC∗13] visualize reposting relation-ships and time order with parallel coordinates to illustrate the evo-lution of the events efficiently. To further investigate the features ofthe diffusion process, Liu et al. [LWYZ15] regard a social media asan artificial physical system and apply a dynamic fluid model. Theirmethod can detect the speed and the scale of information diffusion.
With the development of social media and convenience of post-ing, reposting and commenting messages, more and more mes-sages arise and spread quickly every day. However, the advertisingrobots and rumors are also increasing. Zhao et al. [ZCW∗14] ex-tract anomalies from a huge crowd of messages based on advancedmachine learning algorithms (one-class conditional random fields,OCCRF). They also propose FluxFlow, an interactive system to re-veal and analyze anomalous information spreading on social media.By combining the semantic information, users could judge the de-
c© 2017 The Author(s)Computer Graphics Forum c© 2017 The Eurographics Association and John Wiley & Sons Ltd.
566
S. Chen, L. Lin & X. Yuan / Social Media Visual Analytics Survey
(a)
(d)
(f)(e)
(b) (c)
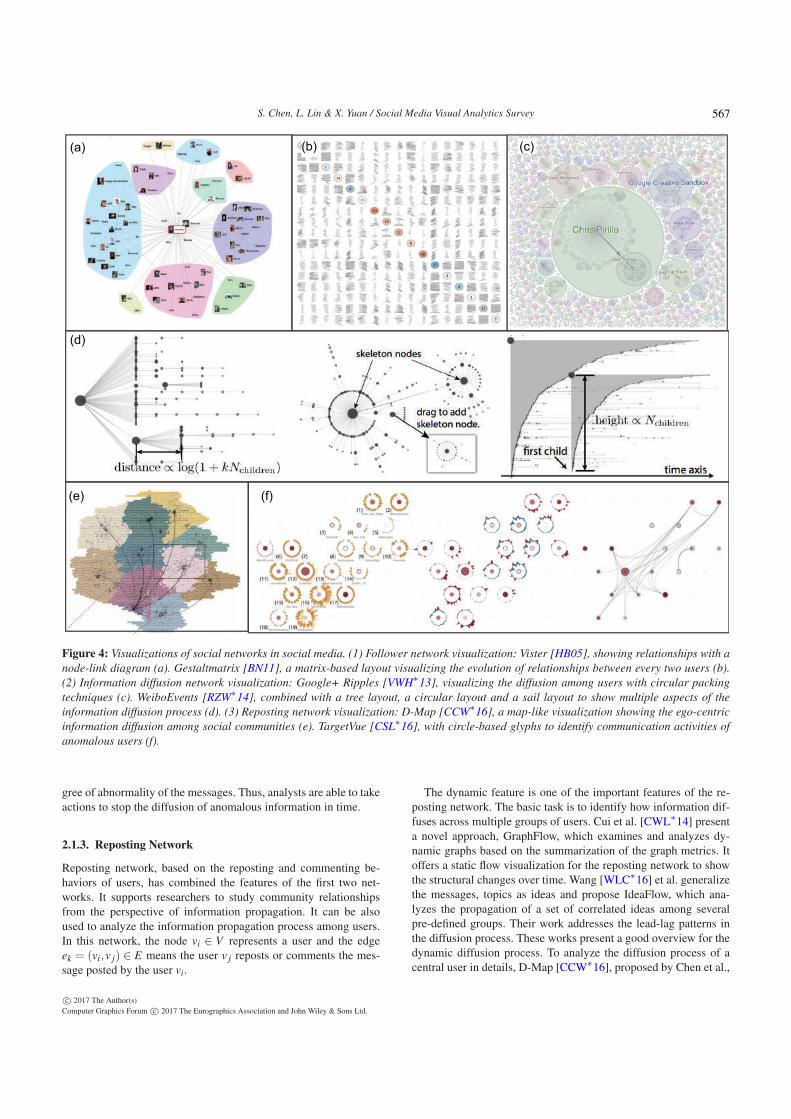
Figure 4: Visualizations of social networks in social media. (1) Follower network visualization: Vister [HB05], showing relationships with a
node-link diagram (a). Gestaltmatrix [BN11], a matrix-based layout visualizing the evolution of relationships between every two users (b).
(2) Information diffusion network visualization: Google+ Ripples [VWH∗13], visualizing the diffusion among users with circular packing
techniques (c). WeiboEvents [RZW∗14], combined with a tree layout, a circular layout and a sail layout to show multiple aspects of the
information diffusion process (d). (3) Reposting network visualization: D-Map [CCW∗16], a map-like visualization showing the ego-centric
information diffusion among social communities (e). TargetVue [CSL∗16], with circle-based glyphs to identify communication activities of
anomalous users (f).
gree of abnormality of the messages. Thus, analysts are able to takeactions to stop the diffusion of anomalous information in time.
2.1.3. Reposting Network
Reposting network, based on the reposting and commenting be-haviors of users, has combined the features of the first two net-works. It supports researchers to study community relationshipsfrom the perspective of information propagation. It can be alsoused to analyze the information propagation process among users.In this network, the node vi ∈ V represents a user and the edgeek = (vi,v j) ∈ E means the user v j reposts or comments the mes-sage posted by the user vi.
The dynamic feature is one of the important features of the re-posting network. The basic task is to identify how information dif-fuses across multiple groups of users. Cui et al. [CWL∗14] presenta novel approach, GraphFlow, which examines and analyzes dy-namic graphs based on the summarization of the graph metrics. Itoffers a static flow visualization for the reposting network to showthe structural changes over time. Wang [WLC∗16] et al. generalizethe messages, topics as ideas and propose IdeaFlow, which ana-lyzes the propagation of a set of correlated ideas among severalpre-defined groups. Their work addresses the lead-lag patterns inthe diffusion process. These works present a good overview for thedynamic diffusion process. To analyze the diffusion process of acentral user in details, D-Map [CCW∗16], proposed by Chen et al.,
c© 2017 The Author(s)Computer Graphics Forum c© 2017 The Eurographics Association and John Wiley & Sons Ltd.
567
S. Chen, L. Lin & X. Yuan / Social Media Visual Analytics Survey
explores information diffusion among social communities based onthe reposting networks in Sina Weibo. Their reposting networks areconstructed by merging the same users in the original diffusion net-work of messages. D-Map shows the propagation of informationbased on a map metaphor (Figure 4e). The technique provides aclear and intuitive visual summary of the dynamic ego-centric dif-fusion process.
Besides, general-purpose entities can be derived from NLP(Natural Language Process) techniques from reposting networks.The entities include brands, person names, products, etc. Yuan etal. [YWL∗14] propose a system to identify key players’ namesand explore their roles in the reposting network. The system usesa multi-faceted filter to enable exploring statistics of the addi-tional entities, including location, time, followers, etc., derivedfrom NLP techniques. To further analyze the entity’s behavior,Cao et al. [CSL∗16] propose TargetVue, which detects anomaloususers via the Time-adaptive Local Outlier Factor (TLOF, a machinelearning model) and visualizes the suspicious users by summariz-ing user’s communication activities, features and social interactionswith others (Figure 4f).
In short, social network analysis intrinsically adopt the visu-alization techniques like node-link graph [HB05, RZW∗14], ma-trix [HFM07], and arc diagram [HF07]. For the diffusion networkand reposting network, special design such as map-like [CCW∗16,CSL∗16] and river-like [ZCW∗14, CWL∗14, WLC∗16] techniquesare used to address the characteristics of the diffusion propertiesand a large number of messages and people.
2.2. Spatial Temporal Visualization
There are two main sources of spatial information on social me-dia. First, people might indicate where they come from, e.g. theirhometown or living places. Second, people can post messages withgeo-tagged information, e.g. geo-tagged tweets. Using Weibos inChina as an example, the ratio of geo-tagged messages is around3% [CYW∗16]. Considering a large number of social media mes-sages generated every day, the amount of such geo-tagged mes-sages is large.
Based on the two categories, we can derive three main researchfocuses for the spatial temporal analysis in the social media. First,we have people’s location information. Messages are reposted bypeople, from which we can infer how information diffuses acrossdifferent regions as well as participants’ distribution. Second, socialmedia messages may have geo-tags. Researchers can analyze thespatial temporal social event distributions based on the geo-taggedinformation. Lastly, the geo-tagged messages can be constructed astrajectories to infer the movement of social media users. In short,the research includes the geographic information diffusion analysis,spatial temporal event analysis and movement analysis (Figure 2).
2.2.1. Geographical Information Diffusion Analysis
Considering the geo-location information in the user profile, we canestimate that most users usually live in the city/region they mark asliving places. V = {vi,v2, ...,vn} is a set of users. For each vi, he/shehas an attribute of hi, which represents his/her living place. Usually,such information would not have a precise latitude and longitude
value, but it indicates a region, a city or even a country. Researchersusing such information can provide a country-level [CLS∗12] andcity-level [CCRS13, ZLW13] information diffusion analysis. Sucha diffusion process integrates both spatial and temporal informa-tion, which requires in visualizing the dynamic scenarios.
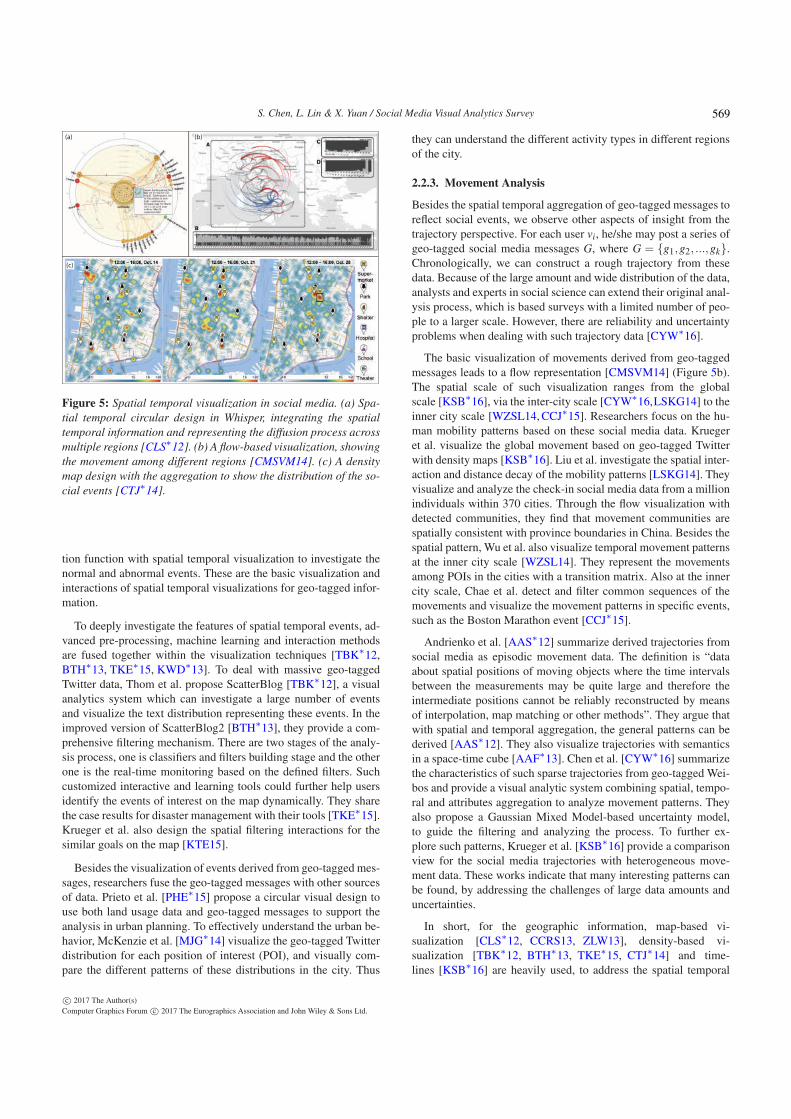
Cao et al. present Whisper [CLS∗12], one of the earliest visualanalytics work to represent and analyze the spatial temporal infor-mation diffusion process over the world (Figure 5a). Whisper in-cludes a sunflower visual metaphor, describing how tweets in onetopic spread from the source center region to the users all overthe world. Users can perceive the temporal trends, i.e., topic evo-lution in the spatial context of such a diffusion process. Croitoruet al. [CCRS13] present the Geosocial Gauge prototype system,which also highlights the retweeting network with the map con-text view. Additionally, Zhang et al. [ZLW13] provide a sentimentanalysis component in analyzing such geographical reposting be-haviors, with case studies on the Sina Weibo Service in China. Intheir work, users can understand how a topic is reposted by peo-ple from different regions and seek for the sentiment distribution indifferent regions for each topic. In the research work focusing oninformation diffusion, WeiboEvents provide the attributes view tohighlight where the retweeting users are from [RZW∗14]. We canobserve the geographical distribution of a special topic and finddifferent local events with the significant spatial distributions ofparticipants in social media.
In short, the geo-location information provides the spatial con-text of users in analyzing the information diffusion process. How-ever, since it is not derived from the social media message itself,it can only provide an overview as well as geographic context forsuch an analysis. More researchers are focusing on the geo-taggedsocial media analysis as introduced in the following sessions.
2.2.2. Spatial Temporal Event Analysis
The geo-tagged social media naturally provides the spatial, tempo-ral, textual and multimedia information in the messages. With thedevelopment of smartphones and GPS technologies, it is easy topost geo-tagged messages. A spatial temporal social event is de-fined as a series of geo-tagged messages that correlate by similartopics in a spatial temporal context. We define the general form ofa social event S = (V,G), where V = {v1,v2, ...,vn} is a set of users,and G = {g1,g2, ...,gm} is a set of geo-tagged social media mes-sages, g j = (t j, pos j, text j,addAttr j), and each message includes atime stamp, position (with latitude and longitude), text information,etc. Each user in V can post one or multiple messages.
In 2011, MacEachren et al. developed a system that integratessuch information to observe the spatial temporal distributions ofsocial events [MJR∗11, MRJ∗11]. They provide basic compo-nents such as a spatial view, a temporal view and a content view.These views are coordinated together to enable the visual explo-ration. For geo-tagged messages, the visualization forms vary froma point-based representation [CCRS13] to a heat map visualiza-tion [MJR∗11] or density map visualization [CTJ∗14] to furtherreduce the clutter and show aggregated information (Figure 5c).Besides 2D representation, histograms on the 3D globe are alsoused [KWD∗13]. From the temporal perspectives of the socialevents, Chae et al. [CTB∗12] combine a seasonal trend decomposi-
c© 2017 The Author(s)Computer Graphics Forum c© 2017 The Eurographics Association and John Wiley & Sons Ltd.
568
S. Chen, L. Lin & X. Yuan / Social Media Visual Analytics Survey
(c)
(a) (b)
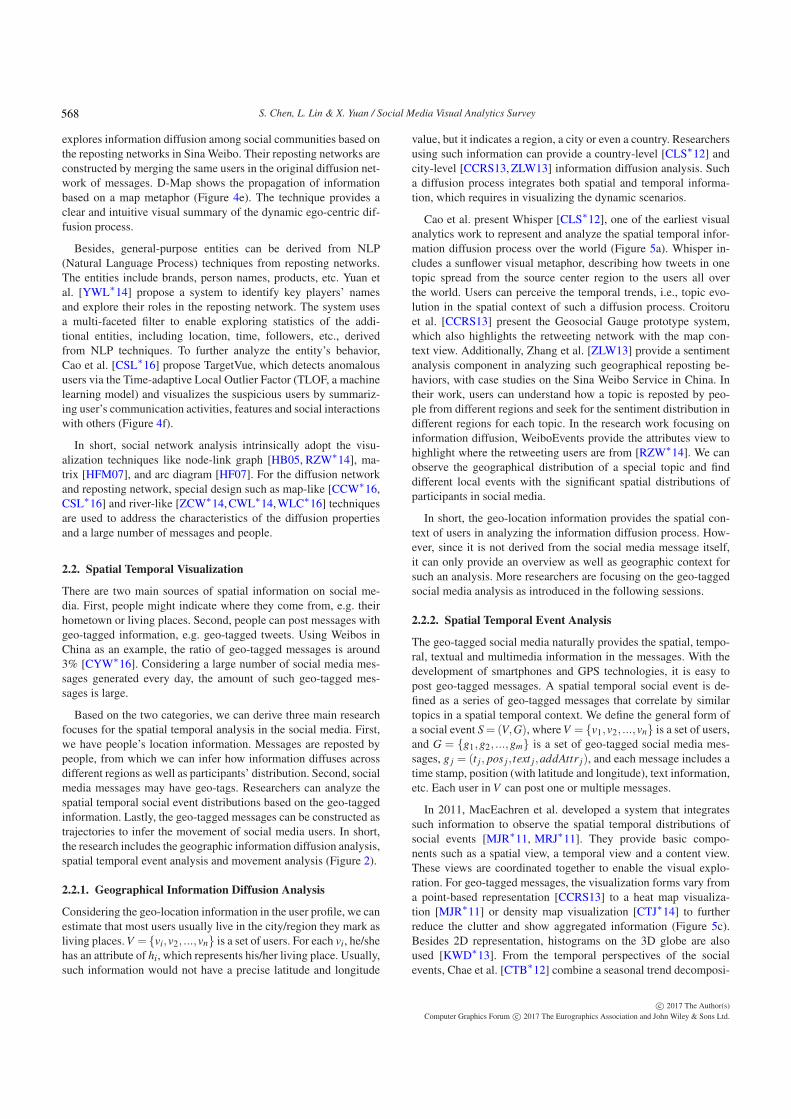
Figure 5: Spatial temporal visualization in social media. (a) Spa-
tial temporal circular design in Whisper, integrating the spatial
temporal information and representing the diffusion process across
multiple regions [CLS∗12]. (b) A flow-based visualization, showing
the movement among different regions [CMSVM14]. (c) A density
map design with the aggregation to show the distribution of the so-
cial events [CTJ∗14].
tion function with spatial temporal visualization to investigate thenormal and abnormal events. These are the basic visualization andinteractions of spatial temporal visualizations for geo-tagged infor-mation.
To deeply investigate the features of spatial temporal events, ad-vanced pre-processing, machine learning and interaction methodsare fused together within the visualization techniques [TBK∗12,BTH∗13, TKE∗15, KWD∗13]. To deal with massive geo-taggedTwitter data, Thom et al. propose ScatterBlog [TBK∗12], a visualanalytics system which can investigate a large number of eventsand visualize the text distribution representing these events. In theimproved version of ScatterBlog2 [BTH∗13], they provide a com-prehensive filtering mechanism. There are two stages of the analy-sis process, one is classifiers and filters building stage and the otherone is the real-time monitoring based on the defined filters. Suchcustomized interactive and learning tools could further help usersidentify the events of interest on the map dynamically. They sharethe case results for disaster management with their tools [TKE∗15].Krueger et al. also design the spatial filtering interactions for thesimilar goals on the map [KTE15].
Besides the visualization of events derived from geo-tagged mes-sages, researchers fuse the geo-tagged messages with other sourcesof data. Prieto et al. [PHE∗15] propose a circular visual design touse both land usage data and geo-tagged messages to support theanalysis in urban planning. To effectively understand the urban be-havior, McKenzie et al. [MJG∗14] visualize the geo-tagged Twitterdistribution for each position of interest (POI), and visually com-pare the different patterns of these distributions in the city. Thus
they can understand the different activity types in different regionsof the city.
2.2.3. Movement Analysis
Besides the spatial temporal aggregation of geo-tagged messages toreflect social events, we observe other aspects of insight from thetrajectory perspective. For each user vi, he/she may post a series ofgeo-tagged social media messages G, where G = {g1,g2, ...,gk}.Chronologically, we can construct a rough trajectory from thesedata. Because of the large amount and wide distribution of the data,analysts and experts in social science can extend their original anal-ysis process, which is based surveys with a limited number of peo-ple to a larger scale. However, there are reliability and uncertaintyproblems when dealing with such trajectory data [CYW∗16].
The basic visualization of movements derived from geo-taggedmessages leads to a flow representation [CMSVM14] (Figure 5b).The spatial scale of such visualization ranges from the globalscale [KSB∗16], via the inter-city scale [CYW∗16,LSKG14] to theinner city scale [WZSL14, CCJ∗15]. Researchers focus on the hu-man mobility patterns based on these social media data. Kruegeret al. visualize the global movement based on geo-tagged Twitterwith density maps [KSB∗16]. Liu et al. investigate the spatial inter-action and distance decay of the mobility patterns [LSKG14]. Theyvisualize and analyze the check-in social media data from a millionindividuals within 370 cities. Through the flow visualization withdetected communities, they find that movement communities arespatially consistent with province boundaries in China. Besides thespatial pattern, Wu et al. also visualize temporal movement patternsat the inner city scale [WZSL14]. They represent the movementsamong POIs in the cities with a transition matrix. Also at the innercity scale, Chae et al. detect and filter common sequences of themovements and visualize the movement patterns in specific events,such as the Boston Marathon event [CCJ∗15].
Andrienko et al. [AAS∗12] summarize derived trajectories fromsocial media as episodic movement data. The definition is “dataabout spatial positions of moving objects where the time intervalsbetween the measurements may be quite large and therefore theintermediate positions cannot be reliably reconstructed by meansof interpolation, map matching or other methods”. They argue thatwith spatial and temporal aggregation, the general patterns can bederived [AAS∗12]. They also visualize trajectories with semanticsin a space-time cube [AAF∗13]. Chen et al. [CYW∗16] summarizethe characteristics of such sparse trajectories from geo-tagged Wei-bos and provide a visual analytic system combining spatial, tempo-ral and attributes aggregation to analyze movement patterns. Theyalso propose a Gaussian Mixed Model-based uncertainty model,to guide the filtering and analyzing the process. To further ex-plore such patterns, Krueger et al. [KSB∗16] provide a comparisonview for the social media trajectories with heterogeneous move-ment data. These works indicate that many interesting patterns canbe found, by addressing the challenges of large data amounts anduncertainties.
In short, for the geographic information, map-based vi-sualization [CLS∗12, CCRS13, ZLW13], density-based vi-sualization [TBK∗12, BTH∗13, TKE∗15, CTJ∗14] and time-lines [KSB∗16] are heavily used, to address the spatial temporal
c© 2017 The Author(s)Computer Graphics Forum c© 2017 The Eurographics Association and John Wiley & Sons Ltd.
569
S. Chen, L. Lin & X. Yuan / Social Media Visual Analytics Survey
characteristics of the data. Besides, wordles are used to rep-resent the text distribution on the map [BTH∗13]. For thetrajectory, aggregated and individual flows are visualized on themap [CYW∗16, CMSVM14].
2.3. Text Visualization
One critical component of social media is the content. Users gen-erate contents, including text, images, multimedia, etc., to share in-formation, give opinions, spread news and connect to other people,etc. Doerk et al. provided a visualization system for social mediacontent - Visual BackChannel [DGWC10] in 2010. The system isamong the earlist to visualize the main parts of social media con-tent. They use a timeline to show the keywords and topics, a circularview to indicate the participating people, and a text list to show theraw data and an image clouds. They also provide a search form andinteractive filters, allowing users to explore the discussing themesand content based on users’ reposting behaviors.
We summarize three types of focus, including keywords, topicsand sentiments visualization and analysis in an incremental man-ner. According to the definitions in [CC16, LYW∗16], words andtopics are two different levels to reveal content. In the context ofsocial media messages, keywords are the words with high mention-ing frequency. Visualizing keywords in the social media extractsword-level semantics. Topics are the summarized subjects from so-cial media content. Visualizing topics in the social media extractstopic-level semantics, which are highly summarized and derive thethemes of contents. Sentiments are summarized from contents withthe attitude of social media users.
2.3.1. Keywords Visualization
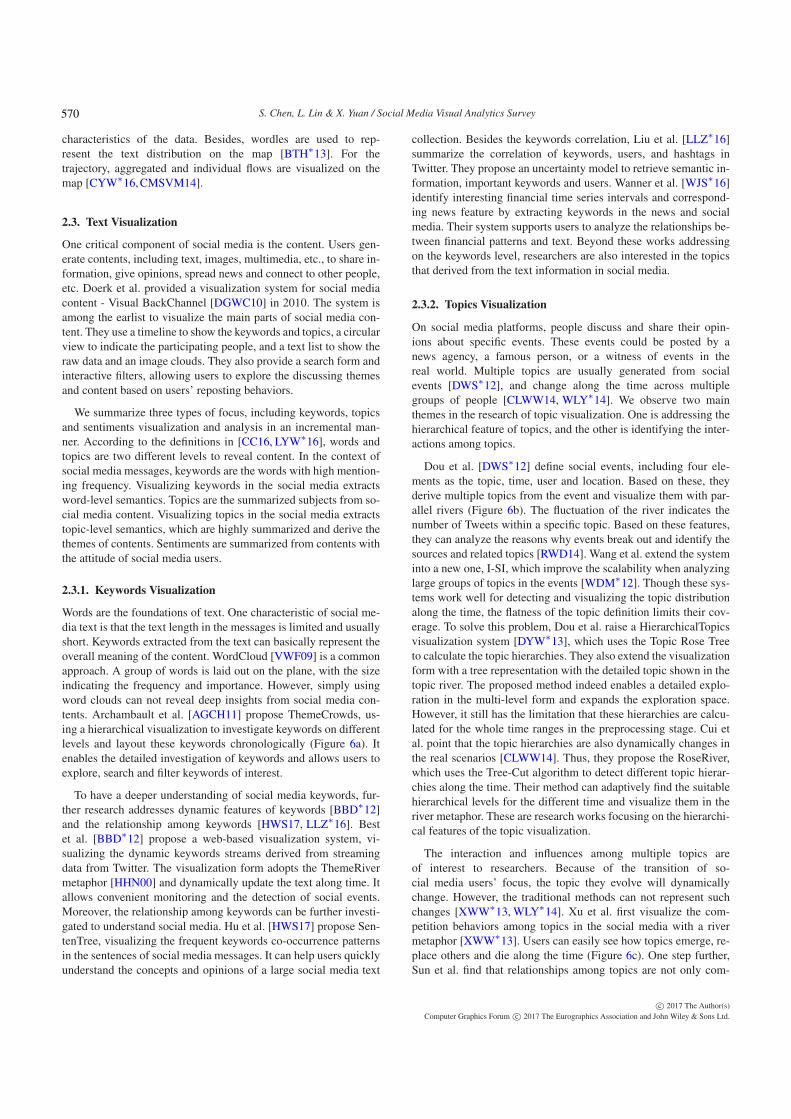
Words are the foundations of text. One characteristic of social me-dia text is that the text length in the messages is limited and usuallyshort. Keywords extracted from the text can basically represent theoverall meaning of the content. WordCloud [VWF09] is a commonapproach. A group of words is laid out on the plane, with the sizeindicating the frequency and importance. However, simply usingword clouds can not reveal deep insights from social media con-tents. Archambault et al. [AGCH11] propose ThemeCrowds, us-ing a hierarchical visualization to investigate keywords on differentlevels and layout these keywords chronologically (Figure 6a). Itenables the detailed investigation of keywords and allows users toexplore, search and filter keywords of interest.
To have a deeper understanding of social media keywords, fur-ther research addresses dynamic features of keywords [BBD∗12]and the relationship among keywords [HWS17, LLZ∗16]. Bestet al. [BBD∗12] propose a web-based visualization system, vi-sualizing the dynamic keywords streams derived from streamingdata from Twitter. The visualization form adopts the ThemeRivermetaphor [HHN00] and dynamically update the text along time. Itallows convenient monitoring and the detection of social events.Moreover, the relationship among keywords can be further investi-gated to understand social media. Hu et al. [HWS17] propose Sen-tenTree, visualizing the frequent keywords co-occurrence patternsin the sentences of social media messages. It can help users quicklyunderstand the concepts and opinions of a large social media text
collection. Besides the keywords correlation, Liu et al. [LLZ∗16]summarize the correlation of keywords, users, and hashtags inTwitter. They propose an uncertainty model to retrieve semantic in-formation, important keywords and users. Wanner et al. [WJS∗16]identify interesting financial time series intervals and correspond-ing news feature by extracting keywords in the news and socialmedia. Their system supports users to analyze the relationships be-tween financial patterns and text. Beyond these works addressingon the keywords level, researchers are also interested in the topicsthat derived from the text information in social media.
2.3.2. Topics Visualization
On social media platforms, people discuss and share their opin-ions about specific events. These events could be posted by anews agency, a famous person, or a witness of events in thereal world. Multiple topics are usually generated from socialevents [DWS∗12], and change along the time across multiplegroups of people [CLWW14, WLY∗14]. We observe two mainthemes in the research of topic visualization. One is addressing thehierarchical feature of topics, and the other is identifying the inter-actions among topics.
Dou et al. [DWS∗12] define social events, including four ele-ments as the topic, time, user and location. Based on these, theyderive multiple topics from the event and visualize them with par-allel rivers (Figure 6b). The fluctuation of the river indicates thenumber of Tweets within a specific topic. Based on these features,they can analyze the reasons why events break out and identify thesources and related topics [RWD14]. Wang et al. extend the systeminto a new one, I-SI, which improve the scalability when analyzinglarge groups of topics in the events [WDM∗12]. Though these sys-tems work well for detecting and visualizing the topic distributionalong the time, the flatness of the topic definition limits their cov-erage. To solve this problem, Dou et al. raise a HierarchicalTopicsvisualization system [DYW∗13], which uses the Topic Rose Treeto calculate the topic hierarchies. They also extend the visualizationform with a tree representation with the detailed topic shown in thetopic river. The proposed method indeed enables a detailed explo-ration in the multi-level form and expands the exploration space.However, it still has the limitation that these hierarchies are calcu-lated for the whole time ranges in the preprocessing stage. Cui etal. point that the topic hierarchies are also dynamically changes inthe real scenarios [CLWW14]. Thus, they propose the RoseRiver,which uses the Tree-Cut algorithm to detect different topic hierar-chies along the time. Their method can adaptively find the suitablehierarchical levels for the different time and visualize them in theriver metaphor. These are research works focusing on the hierarchi-cal features of the topic visualization.
The interaction and influences among multiple topics areof interest to researchers. Because of the transition of so-cial media users’ focus, the topic they evolve will dynamicallychange. However, the traditional methods can not represent suchchanges [XWW∗13, WLY∗14]. Xu et al. first visualize the com-petition behaviors among topics in the social media with a rivermetaphor [XWW∗13]. Users can easily see how topics emerge, re-place others and die along the time (Figure 6c). One step further,Sun et al. find that relationships among topics are not only com-
c© 2017 The Author(s)Computer Graphics Forum c© 2017 The Eurographics Association and John Wiley & Sons Ltd.
570
S. Chen, L. Lin & X. Yuan / Social Media Visual Analytics Survey
(b)
(d)(c)
(a)
Figure 6: Keywords, topic and sentiment visualization with a river-based metaphor. (a) ThemeCrowds, a multi-level dynamic word clouds
visualization [AGCH11]. (b) Leadline, visualizing the dynamic event and topic evolution [DWS∗12]. (c) Topic competition visualization,
representing how different communities’ behaviors lead to the increase and decrease of the topics [XWW∗13]. (d) Sentiment visualization,
showing the eight extracted sentiment along the time [ZGWZ14].
petition but also collaboration [SWL∗14]. Based on this, they pro-pose EvoRiver, in order to visualize the collaboration-competition(“Coopetition”) relationship of topics. They use color to encode thetendency of collaboration or competition. By extending the stackgraph, they visualize the distribution of the topics and key play-ers on the coopetition river. Considering the people behavior to-gether with the evolution of the topics, Wu et al. propose Opinion-Flow [WLY∗14], observing how people diffuse the information indifferent topics. We can observe that the intrinsic dynamic featureleads many researchers to use the river metaphor to visualize topicdistribution and evolution.
2.3.3. Sentiments Visualization
Sentiment is behind most messages people post. By summarizingthe public sentiment towards social events, researchers can estimatethe general public’s attitude for better understanding social events.These types of research are essential in many application domains,such as politics, advertisement, etc.
To visualize sentiment, Hu et al. [HYZ∗13] use a matrix vi-sualization to encode supporting and opposite opinions with yel-low and green color. Further, Zhao et al. [ZGWZ14] visualize adeeper classification of sentiment (Figure 6d). It follows the Dis-crete Categorical Model [Plu01], which includes four pairs of sen-timent: anger - fear, anticipation - surprise, joy - sadness, and trust- disgust. The personal emotion information is visualized alongthe stack graph. Compared with the personal emotion analysis,Steed et al. [SDB∗15] visualize the aggregated emotional dynam-ics of a large group of people with the high-dimensional projection.
Rohrdantz et al. [RHD∗12] propose automatic methods and interac-tive visualizations to extract sentiment from text document streams.The system supports users to analyze sentiment patterns, exploretime-stamped customer feedback and detect critical issues. To sum-marize the users’ requirements in sentiment analysis, Kucher etal. [KSBK∗15] find that users are not only interested in the sen-timent or mood, but also the attitude towards the events. They sum-marize the attitude and sentiment changes with the timeline, to-gether with the text analysis system to support the tasks. Besidesthe general methods, Liu et al. present SocialBrands for brand man-agers to analyze public perceptions of brands in social media. Itfocuses on the special name entities as brands [LXG∗16]. Theypropose a circular design supporting visual comparison of multipleperception matrix.
In short, for text data, wordles [SWL∗14, AGCH11] and river-like visualizations [XWW∗13, WLY∗14, SWL∗14, ZGWZ14] areusually used to understand the text and dynamic behaviors in socialmedia.
2.4. Visualization Techniques Summary
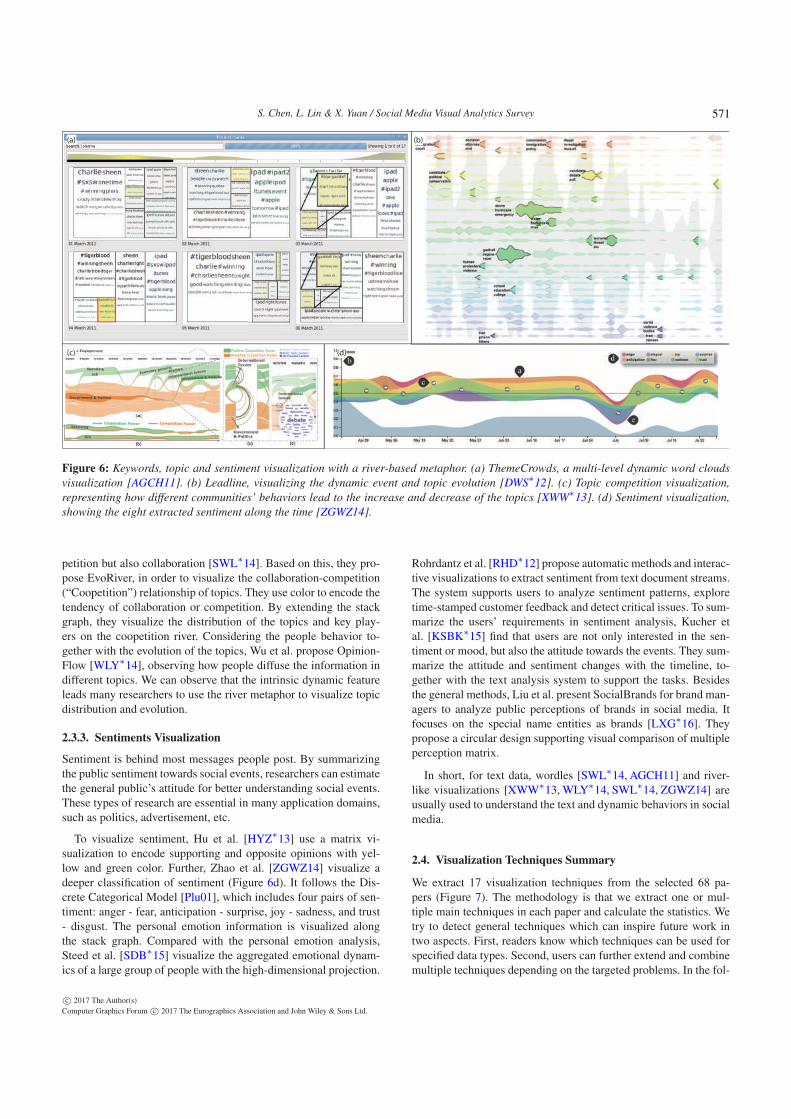
We extract 17 visualization techniques from the selected 68 pa-pers (Figure 7). The methodology is that we extract one or mul-tiple main techniques in each paper and calculate the statistics. Wetry to detect general techniques which can inspire future work intwo aspects. First, readers know which techniques can be used forspecified data types. Second, users can further extend and combinemultiple techniques depending on the targeted problems. In the fol-
c© 2017 The Author(s)Computer Graphics Forum c© 2017 The Eurographics Association and John Wiley & Sons Ltd.
571
S. Chen, L. Lin & X. Yuan / Social Media Visual Analytics Survey
Category Node-link
DiagramMatrix
Arc
DiagramSmall Multiples Glyph
3D
RepresentationTimeline Tree Space-Filling
Parallel
CoordinatesMap-based Visualization Flow on the Map
Map-like
VisualizationRiver-like Visualization
Density-based
VisualizationCircular Design Wordle
N12 [HFM07];
[CZH 09]
2 [HF07];
[HFM07]
2 [HF07];
[BCD 10]2 [BCD 10]; [BN11b] 1 [BN11b]
2 [CZH 09];
[BCD 10]1 [CZH 09] 0 0 0 0 0 0 0 0 0 0
N2 1 [RZW 14] 0 0 0 0 0 1 [RZW 14] 1 [VWH 13]2 [VWH 13];
[ZCW 14]1 [LQC 13] 0 0 1 [LWYZ15] 1 [ZCW 14] 0 0 0
N3 1 [CSL 16] 0 0 0 1 [CSL 16] 0 2 [CWL 14]; [WLC 16] 0 0 1 [YWL 14] 0 02 [CCW 16];
[CSL 16]2 [CWL 14]; [WLC 16] 1 [CWL 14] 0 0
G1 1 [CLS 12] 0 0 02 [CLS 12];
[ZLW13]0 0 0 0 0 3 [CLS 12]; [CCRS13]; [ZLW13] 2 [CLS 12]; [ZLW13] 0 0 0 1 [CLS 12] 1 [CCRS13]
G2 0 0 0 1 [MJG 14]2 [BTH 13];
[TKE 15]1 [KWD 13]
9 [MJR 11]; [MRJ 11]; [CTB 12 ];
[KWD 13];[CTJ 14]; [TBK 12];
[BTH 13]; [TKE 15]; [MJG 14]
0 0 0
11 [MJR 11]; [MRJ 11]; [CTB 12];
[KWD 13]; [CTJ 14]; [TBK 12];
[BTH 13]; [TKE 15]; [PHE 15];
[MJG 14]; [XSX 14]
0 0 0
8 [MJR 11]; [MRJ 11];
[CTB 12]; [CTJ 14];
[TBK 12]; [BTH 13];
[TKE 15]; [MJG 14]
1 [PHE 15]
5 [CTB 12]; [KWD
13]; [TBK 12]; [BTH
13]; [TKE 15]
G3 0 0 03 [CYW*16]; [WZSL14];
[AAF 13]0 1 [AAF 13] 1 [CYW*16] 0 0 1 [CYW*16]
8 [CYW*16]; [CMSVM14]; [CCJ 15];
[KSB 16]; [LSKG14]; [WZSL14];
[AAS 12]; [AAF 13]
7 [CYW*16]; [CMSVM14];
[CCJ 15]; [KSB 16];
[LSKG14]; [AAS 12];
[AAF 13]
0 04 [CYW*16]; [CCJ 15];
[KSB 16]; [LSKG14]1 [CYW*16] 1 [CYW*16]
T1 1 [LLZ 16] 0 0 2 [AGCH11]; [ WJS 16]2 [LLZ 16];
[WJS 16]0
6 [DGWC10]; [AGCH11]; [BBD 12];
[DNYKS11]; [DNK10]; [WJS 16]1 [HWS17] 0 0 0 0 0 2 [DGWC10]; [BBD 12] 0 1 [DGWC10]
5 [AGCH11]; [HWS17];
[DNYKS11]; [DNK10];
[WJS 16]
T2 1 [WLY 14] 0 04 [DWS 12]; [RWD14];
[DYW 13]; [DCE 15]1 [DCE 15] 0
8 [DWS 12]; [RWD14]; [WDM 12];
[DYW 13]; [CLWW14]; [XWW 13];
[WLY 14]; [SWL 14]
1 [DYW 13] 1 [LWW 13] 1 [DCE 15] 0 02 [GHN13];
[LWW 13]
7 [DWS 12]; [RWD14];
[WDM 12]; [CLWW14];
[XWW 13]; [WLY 14];
[SWL 14]
1 [WLY 14] 0
5 [DWS 12];
[CLWW14];
[XWW 13]; [SWL 14];
[DCE 15]
T3 1 [CLL 14]2 [HYZ 13];
[RHD 12]0
3 [LWM14]; [LKT 14];
[LXG*16]
2 [CLL 14];
[LXG*16]0
10 [ZGWZ14]; [SDB 15]; [KSBK 15];
[LWM14]; [LKT 14]; [BMZ11]; [MBB
11]; [CLL 14]; [RHD 12]; [LXG*16]
0 0 1 [LKT 14] 1 [MBB 11] 0 0 1 [ZGWZ14] 1 [SDB 15] 1 [LXG*16]3 [ZGWZ14];
[LWM14]; [LKT 14]
Figure 7: Summarized 17 general visualization techniques used in social media visualization for nine data categories. One or multiple
techniques can be derived from one paper.
lowing sections, we also discuss how we can combine visualizationand analytic methods to solve problems with social media data.
3. Visual Analytics Techniques
Considering the complex characteristics of social media data, morevisual analytics methods combining the above specific visualiza-tion techniques and mining algorithms are proposed. In this section,we first analyze the compounded visualization techniques and cate-gorize the relationships of multiple techniques used in these works.Following this, we summarize the research goals of selected visualanalytics papers in social media and illustrate how these techniqueswork for specific analytical goals.
3.1. Methodology
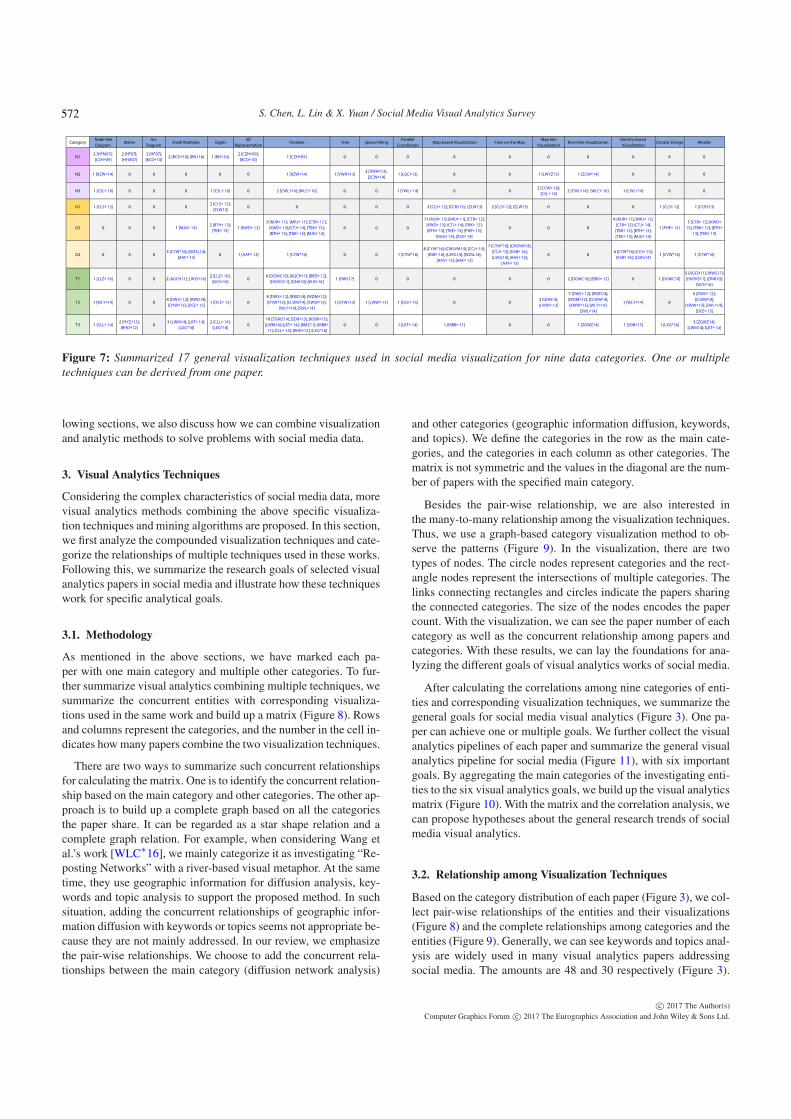
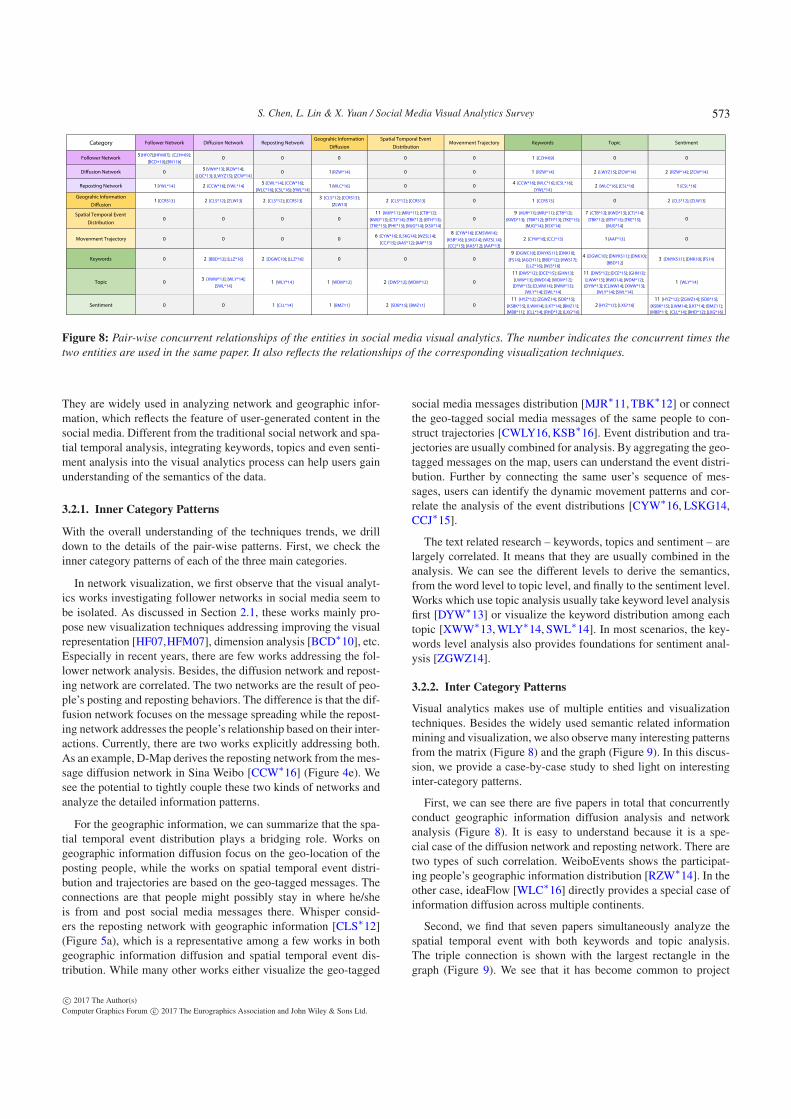
As mentioned in the above sections, we have marked each pa-per with one main category and multiple other categories. To fur-ther summarize visual analytics combining multiple techniques, wesummarize the concurrent entities with corresponding visualiza-tions used in the same work and build up a matrix (Figure 8). Rowsand columns represent the categories, and the number in the cell in-dicates how many papers combine the two visualization techniques.
There are two ways to summarize such concurrent relationshipsfor calculating the matrix. One is to identify the concurrent relation-ship based on the main category and other categories. The other ap-proach is to build up a complete graph based on all the categoriesthe paper share. It can be regarded as a star shape relation and acomplete graph relation. For example, when considering Wang etal.’s work [WLC∗16], we mainly categorize it as investigating “Re-posting Networks” with a river-based visual metaphor. At the sametime, they use geographic information for diffusion analysis, key-words and topic analysis to support the proposed method. In suchsituation, adding the concurrent relationships of geographic infor-mation diffusion with keywords or topics seems not appropriate be-cause they are not mainly addressed. In our review, we emphasizethe pair-wise relationships. We choose to add the concurrent rela-tionships between the main category (diffusion network analysis)
and other categories (geographic information diffusion, keywords,and topics). We define the categories in the row as the main cate-gories, and the categories in each column as other categories. Thematrix is not symmetric and the values in the diagonal are the num-ber of papers with the specified main category.
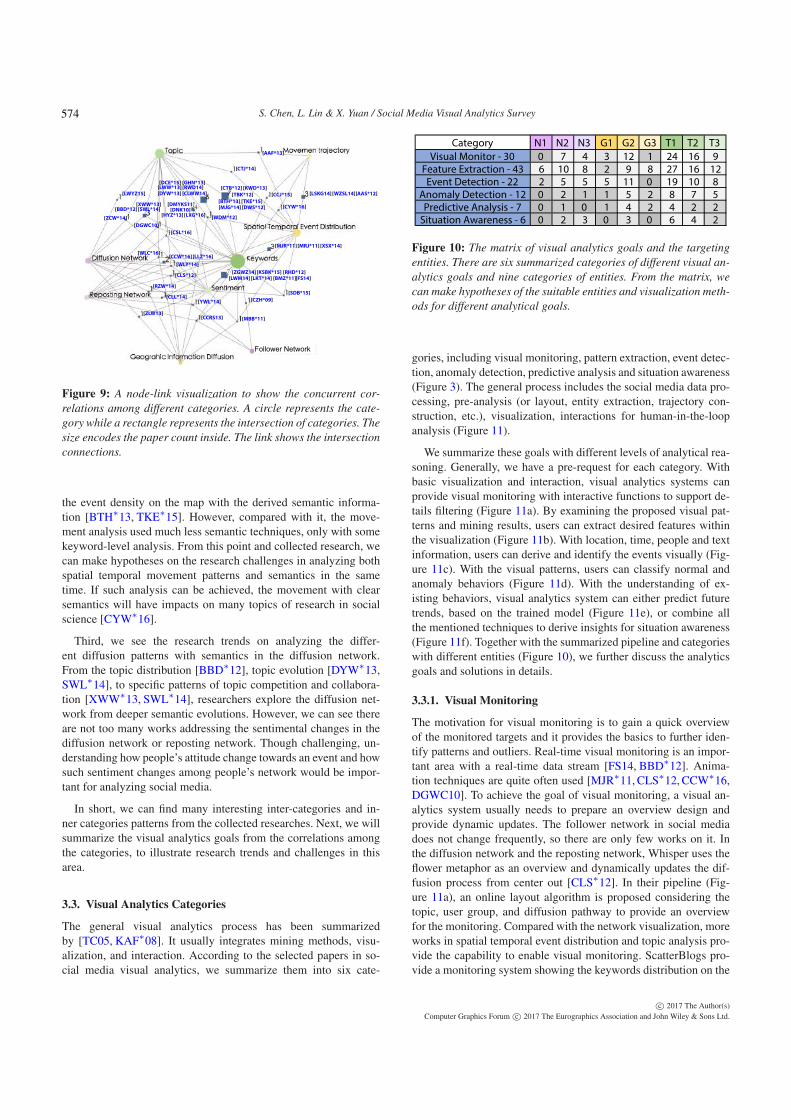
Besides the pair-wise relationship, we are also interested inthe many-to-many relationship among the visualization techniques.Thus, we use a graph-based category visualization method to ob-serve the patterns (Figure 9). In the visualization, there are twotypes of nodes. The circle nodes represent categories and the rect-angle nodes represent the intersections of multiple categories. Thelinks connecting rectangles and circles indicate the papers sharingthe connected categories. The size of the nodes encodes the papercount. With the visualization, we can see the paper number of eachcategory as well as the concurrent relationship among papers andcategories. With these results, we can lay the foundations for ana-lyzing the different goals of visual analytics works of social media.
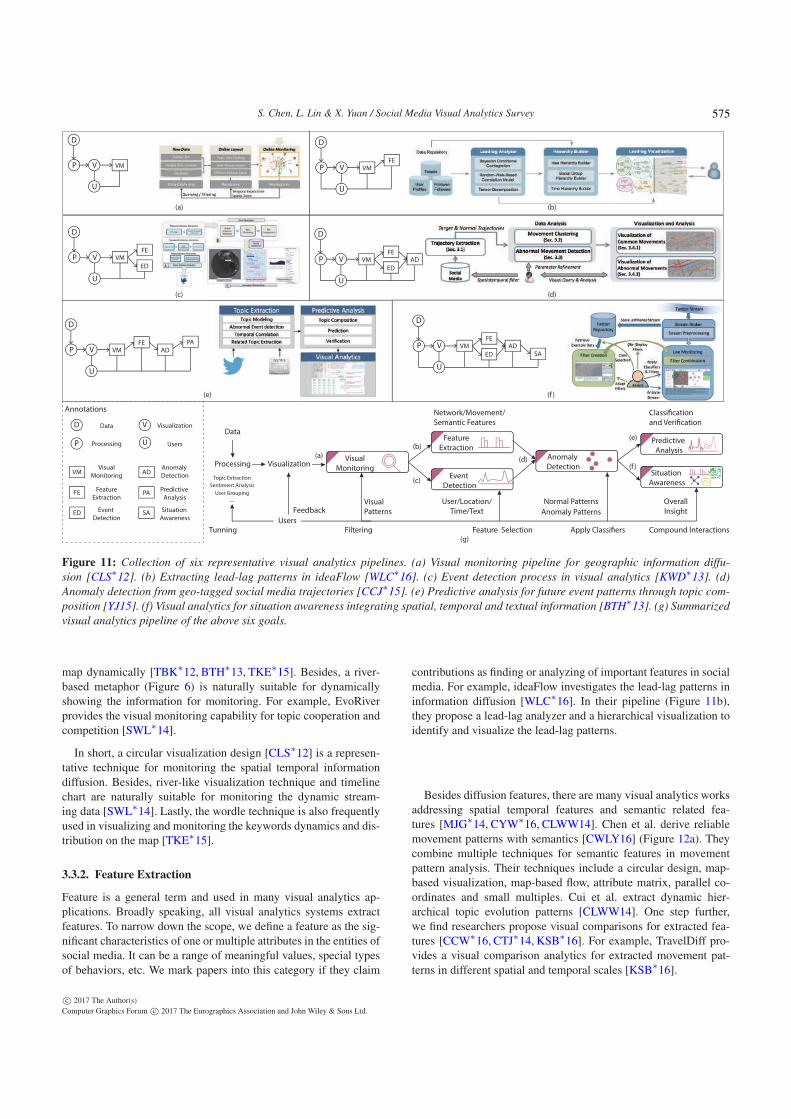
After calculating the correlations among nine categories of enti-ties and corresponding visualization techniques, we summarize thegeneral goals for social media visual analytics (Figure 3). One pa-per can achieve one or multiple goals. We further collect the visualanalytics pipelines of each paper and summarize the general visualanalytics pipeline for social media (Figure 11), with six importantgoals. By aggregating the main categories of the investigating enti-ties to the six visual analytics goals, we build up the visual analyticsmatrix (Figure 10). With the matrix and the correlation analysis, wecan propose hypotheses about the general research trends of socialmedia visual analytics.
3.2. Relationship among Visualization Techniques
Based on the category distribution of each paper (Figure 3), we col-lect pair-wise relationships of the entities and their visualizations(Figure 8) and the complete relationships among categories and theentities (Figure 9). Generally, we can see keywords and topics anal-ysis are widely used in many visual analytics papers addressingsocial media. The amounts are 48 and 30 respectively (Figure 3).
c© 2017 The Author(s)Computer Graphics Forum c© 2017 The Eurographics Association and John Wiley & Sons Ltd.
572
S. Chen, L. Lin & X. Yuan / Social Media Visual Analytics Survey
Category Follower Network Di!usion Network Reposting NetworkGeograhic Information
Di!usion
Spatial Temporal Event
DistributionMovenment Trajectory Keywords Topic Sentiment
Follower Network5 [HF07];[HFM07]; [CZH 09];
[BCD 10];[BN11b]0 0 0 0 0 1 [CZH 09] 0 0
Di!usion Network 05 [VWH*13]; [RZW*14];
[LQC*13]; [LWYZ15]; [ZCW*14]0 1 [RZW*14] 0 0 1 [RZW*14] 2 [LWYZ15]; [ZCW*14] 2 [RZW*14]; [ZCW*14]
Reposting Network 1 [YWL*14] 2 [CCW*16]; [YWL*14]5 [CWL*14]; [CCW*16];
[WLC*16]; [CSL*16]; [YWL*14]1 [WLC*16] 0 0
4 [CCW*16]; [WLC*16]; [CSL*16];
[YWL*14]2 [WLC*16]; [CSL*16] 1 [CSL*16]
Geograhic Information
Di!usion1 [CCRS13] 2 [CLS*12]; [ZLW13] 2 [CLS*12]; [CCRS13]
3 [CLS*12]; [CCRS13];
[ZLW13]2 [CLS*12]; [CCRS13] 0 1 [CCRS13] 0 2 [CLS*12]; [ZLW13]
Spatial Temporal Event
Distribution0 0 0 0
11 [MJR*11]; [MRJ*11]; [CTB*12];
[KWD*13]; [CTJ*14]; [TBK*12]; [BTH*13];
[TKE*15]; [PHE*15]; [MJG*14]; [XSX*14]
09 [MJR*11]; [MRJ*11]; [CTB*12];
[KWD*13]; [TBK*12]; [BTH*13]; [TKE*15];
[MJG*14]; [XSX*14]
7 [CTB*12]; [KWD*13]; [CTJ*14];
[TBK*12]; [BTH*13]; [TKE*15];
[MJG*14]
0
Movenment Trajectory 0 0 0 06 [CYW*16]; [LSKG14]; [WZSL14];
[CCJ*15]; [AAS*12]; [AAF*13]
8 [CYW*16]; [CMSVM14];
[KSB*16]; [LSKG14]; [WZSL14];
[CCJ*15]; [AAS*12]; [AAF*13]
2 [CYW*16]; [CCJ*15] 1 [AAF*13] 0
Keywords 0 2 [BBD*12]; [LLZ*16] 2 [DGWC10]; [LLZ*16] 0 0 09 [DGWC10]; [DNYKS11]; [DNK10];
[FS14]; [AGCH11]; [BBD*12]; [HWS17];
[LLZ*16]; [WJS*16]
4 [DGWC10]; [DNYKS11]; [DNK10];
[BBD*12]3 [DNYKS11]; [DNK10]; [FS14]
Topic 03 [XWW*13]; [WLY*14];
[SWL*14]1 [WLY*14] 1 [WDM*12] 2 [DWS*12]; [WDM*12] 0
11 [DWS*12]; [DCE*15]; [GHN13];
[LWW*13]; [RWD14]; [WDM*12];
[DYW*13]; [CLWW14]; [XWW*13];
[WLY*14]; [SWL*14]
11 [DWS*12]; [DCE*15]; [GHN13];
[LWW*13]; [RWD14]; [WDM*12];
[DYW*13]; [CLWW14]; [XWW*13];
[WLY*14]; [SWL*14]
1 [WLY*14]
Sentiment 0 0 1 [CLL*14] 1 [BMZ11] 2 [SDB*15]; [BMZ11] 011 [HYZ*12]; [ZGWZ14]; [SDB*15];
[KSBK*15]; [LWM14]; [LKT*14]; [BMZ11];
[MBB*11]; [CLL*14]; [RHD*12]; [LXG*16]
2 [HYZ*12]; [LXG*16]
11 [HYZ*12]; [ZGWZ14]; [SDB*15];
[KSBK*15]; [LWM14]; [LKT*14]; [BMZ11];
[MBB*11]; [CLL*14]; [RHD*12]; [LXG*16]
Figure 8: Pair-wise concurrent relationships of the entities in social media visual analytics. The number indicates the concurrent times the
two entities are used in the same paper. It also reflects the relationships of the corresponding visualization techniques.
They are widely used in analyzing network and geographic infor-mation, which reflects the feature of user-generated content in thesocial media. Different from the traditional social network and spa-tial temporal analysis, integrating keywords, topics and even senti-ment analysis into the visual analytics process can help users gainunderstanding of the semantics of the data.
3.2.1. Inner Category Patterns
With the overall understanding of the techniques trends, we drilldown to the details of the pair-wise patterns. First, we check theinner category patterns of each of the three main categories.
In network visualization, we first observe that the visual analyt-ics works investigating follower networks in social media seem tobe isolated. As discussed in Section 2.1, these works mainly pro-pose new visualization techniques addressing improving the visualrepresentation [HF07,HFM07], dimension analysis [BCD∗10], etc.Especially in recent years, there are few works addressing the fol-lower network analysis. Besides, the diffusion network and repost-ing network are correlated. The two networks are the result of peo-ple’s posting and reposting behaviors. The difference is that the dif-fusion network focuses on the message spreading while the repost-ing network addresses the people’s relationship based on their inter-actions. Currently, there are two works explicitly addressing both.As an example, D-Map derives the reposting network from the mes-sage diffusion network in Sina Weibo [CCW∗16] (Figure 4e). Wesee the potential to tightly couple these two kinds of networks andanalyze the detailed information patterns.
For the geographic information, we can summarize that the spa-tial temporal event distribution plays a bridging role. Works ongeographic information diffusion focus on the geo-location of theposting people, while the works on spatial temporal event distri-bution and trajectories are based on the geo-tagged messages. Theconnections are that people might possibly stay in where he/sheis from and post social media messages there. Whisper consid-ers the reposting network with geographic information [CLS∗12](Figure 5a), which is a representative among a few works in bothgeographic information diffusion and spatial temporal event dis-tribution. While many other works either visualize the geo-tagged
social media messages distribution [MJR∗11, TBK∗12] or connectthe geo-tagged social media messages of the same people to con-struct trajectories [CWLY16, KSB∗16]. Event distribution and tra-jectories are usually combined for analysis. By aggregating the geo-tagged messages on the map, users can understand the event distri-bution. Further by connecting the same user’s sequence of mes-sages, users can identify the dynamic movement patterns and cor-relate the analysis of the event distributions [CYW∗16, LSKG14,CCJ∗15].
The text related research – keywords, topics and sentiment – arelargely correlated. It means that they are usually combined in theanalysis. We can see the different levels to derive the semantics,from the word level to topic level, and finally to the sentiment level.Works which use topic analysis usually take keyword level analysisfirst [DYW∗13] or visualize the keyword distribution among eachtopic [XWW∗13, WLY∗14, SWL∗14]. In most scenarios, the key-words level analysis also provides foundations for sentiment anal-ysis [ZGWZ14].
3.2.2. Inter Category Patterns
Visual analytics makes use of multiple entities and visualizationtechniques. Besides the widely used semantic related informationmining and visualization, we also observe many interesting patternsfrom the matrix (Figure 8) and the graph (Figure 9). In this discus-sion, we provide a case-by-case study to shed light on interestinginter-category patterns.
First, we can see there are five papers in total that concurrentlyconduct geographic information diffusion analysis and networkanalysis (Figure 8). It is easy to understand because it is a spe-cial case of the diffusion network and reposting network. There aretwo types of such correlation. WeiboEvents shows the participat-ing people’s geographic information distribution [RZW∗14]. In theother case, ideaFlow [WLC∗16] directly provides a special case ofinformation diffusion across multiple continents.
Second, we find that seven papers simultaneously analyze thespatial temporal event with both keywords and topic analysis.The triple connection is shown with the largest rectangle in thegraph (Figure 9). We see that it has become common to project
c© 2017 The Author(s)Computer Graphics Forum c© 2017 The Eurographics Association and John Wiley & Sons Ltd.
573
S. Chen, L. Lin & X. Yuan / Social Media Visual Analytics Survey
Follower Network
[CZH*09]
[RZW*14]
[LWYZ15]
[ZCW*14]
[CCW*16][WLC*16]
[CSL*16]
[YWL*14]
[CLS*12]
[CCRS13][ZLW13]
[MJR*11] [MRJ*11]
[CTB*12] [KWD*13]
[CTJ*14]
[TBK*12]
[BTH*13] [TKE*15]
[MJG*14]
[XSX*14]
[CYW*16]
[LSKG14] [WZSL14][CCJ*15] [AAS*12]
[AAF*13]
[DGWC10]
[DMYKS11][DNK10]
[FS14]
[BBD*12]
[LLZ*16]
[DWS*12]
[DCE*15] [GHN*13][LWW*13] [RWD14]
[WDM*12]
[DYW*13] [CLWW14]
[XWW*13]
[WLY*14]
[SWL*14]
[HYZ*13]
[ZGWZ14]
[SDB*15]
[KSBK*15]
[LWM14] [LKT*14] [BMZ*11]
[MBB*11]
[CLL*14]
[RHD*12]
[LXG*16]
7
4
Figure 9: A node-link visualization to show the concurrent cor-
relations among different categories. A circle represents the cate-
gory while a rectangle represents the intersection of categories. The
size encodes the paper count inside. The link shows the intersection
connections.
the event density on the map with the derived semantic informa-tion [BTH∗13, TKE∗15]. However, compared with it, the move-ment analysis used much less semantic techniques, only with somekeyword-level analysis. From this point and collected research, wecan make hypotheses on the research challenges in analyzing bothspatial temporal movement patterns and semantics in the sametime. If such analysis can be achieved, the movement with clearsemantics will have impacts on many topics of research in socialscience [CYW∗16].
Third, we see the research trends on analyzing the differ-ent diffusion patterns with semantics in the diffusion network.From the topic distribution [BBD∗12], topic evolution [DYW∗13,SWL∗14], to specific patterns of topic competition and collabora-tion [XWW∗13, SWL∗14], researchers explore the diffusion net-work from deeper semantic evolutions. However, we can see thereare not too many works addressing the sentimental changes in thediffusion network or reposting network. Though challenging, un-derstanding how people’s attitude change towards an event and howsuch sentiment changes among people’s network would be impor-tant for analyzing social media.
In short, we can find many interesting inter-categories and in-ner categories patterns from the collected researches. Next, we willsummarize the visual analytics goals from the correlations amongthe categories, to illustrate research trends and challenges in thisarea.
3.3. Visual Analytics Categories
The general visual analytics process has been summarizedby [TC05, KAF∗08]. It usually integrates mining methods, visu-alization, and interaction. According to the selected papers in so-cial media visual analytics, we summarize them into six cate-
Category N1 N2 N3 G1 G2 G3 T1 T2 T3
Visual Monitor - 30 0 7 4 3 12 1 24 16 9
Feature Extraction - 43 6 10 8 2 9 8 27 16 12
Event Detection - 22 2 5 5 5 11 0 19 10 8
Anomaly Detection - 12 0 2 1 1 5 2 8 7 5
Predictive Analysis - 7 0 1 0 1 4 2 4 2 2
Situation Awareness - 6 0 2 3 0 3 0 6 4 2
Figure 10: The matrix of visual analytics goals and the targeting
entities. There are six summarized categories of different visual an-
alytics goals and nine categories of entities. From the matrix, we
can make hypotheses of the suitable entities and visualization meth-
ods for different analytical goals.
gories, including visual monitoring, pattern extraction, event detec-tion, anomaly detection, predictive analysis and situation awareness(Figure 3). The general process includes the social media data pro-cessing, pre-analysis (or layout, entity extraction, trajectory con-struction, etc.), visualization, interactions for human-in-the-loopanalysis (Figure 11).
We summarize these goals with different levels of analytical rea-soning. Generally, we have a pre-request for each category. Withbasic visualization and interaction, visual analytics systems canprovide visual monitoring with interactive functions to support de-tails filtering (Figure 11a). By examining the proposed visual pat-terns and mining results, users can extract desired features withinthe visualization (Figure 11b). With location, time, people and textinformation, users can derive and identify the events visually (Fig-ure 11c). With the visual patterns, users can classify normal andanomaly behaviors (Figure 11d). With the understanding of ex-isting behaviors, visual analytics system can either predict futuretrends, based on the trained model (Figure 11e), or combine allthe mentioned techniques to derive insights for situation awareness(Figure 11f). Together with the summarized pipeline and categorieswith different entities (Figure 10), we further discuss the analyticsgoals and solutions in details.
3.3.1. Visual Monitoring
The motivation for visual monitoring is to gain a quick overviewof the monitored targets and it provides the basics to further iden-tify patterns and outliers. Real-time visual monitoring is an impor-tant area with a real-time data stream [FS14, BBD∗12]. Anima-tion techniques are quite often used [MJR∗11, CLS∗12, CCW∗16,DGWC10]. To achieve the goal of visual monitoring, a visual an-alytics system usually needs to prepare an overview design andprovide dynamic updates. The follower network in social mediadoes not change frequently, so there are only few works on it. Inthe diffusion network and the reposting network, Whisper uses theflower metaphor as an overview and dynamically updates the dif-fusion process from center out [CLS∗12]. In their pipeline (Fig-ure 11a), an online layout algorithm is proposed considering thetopic, user group, and diffusion pathway to provide an overviewfor the monitoring. Compared with the network visualization, moreworks in spatial temporal event distribution and topic analysis pro-vide the capability to enable visual monitoring. ScatterBlogs pro-vide a monitoring system showing the keywords distribution on the
c© 2017 The Author(s)Computer Graphics Forum c© 2017 The Eurographics Association and John Wiley & Sons Ltd.
574
S. Chen, L. Lin & X. Yuan / Social Media Visual Analytics Survey
(a) (b)
(c) (d)
(e) (f )
D
P V VM
U
D
P V VMFE
U
D
P V VMFE
ED
U
D
P V VMFE
ED
AD
U
D
P V VMFE
ADPA
PA
U
D
P V VMFE
ED
ADSA
U
Visual
MonitoringVisual
Monitoring Event
Detection
Event
Detection
Predictive
Analysis
Predictive
Analysis
Feature
Extraction
Feature
Extraction
Anomaly
DetectionAnomaly
Detection Situation
Awareness
Situation
Awareness
Data
Processing
Processing
Visualization
Visualization
Topic Extraction
Normal Patterns
Anomaly Patterns
Sentiment Analysis
User Grouping
.... User/Location/
Time/Text
Network/Movement/
Semantic Features
Classi!cation
and Veri!cation
Overall
Insight
Filtering Feature Selection
Visual
Patterns
Apply Classi!ers Compound InteractionsUsers
Users
(a)
(b)
(c)
(d)
(e)
(f )
(g)
Tunning
Feedback
DataD
P
V
VM
FE
ED
AD
SA
U
Annotations
Figure 11: Collection of six representative visual analytics pipelines. (a) Visual monitoring pipeline for geographic information diffu-
sion [CLS∗12]. (b) Extracting lead-lag patterns in ideaFlow [WLC∗16]. (c) Event detection process in visual analytics [KWD∗13]. (d)
Anomaly detection from geo-tagged social media trajectories [CCJ∗15]. (e) Predictive analysis for future event patterns through topic com-
position [YJ15]. (f) Visual analytics for situation awareness integrating spatial, temporal and textual information [BTH∗13]. (g) Summarized
visual analytics pipeline of the above six goals.
map dynamically [TBK∗12, BTH∗13, TKE∗15]. Besides, a river-based metaphor (Figure 6) is naturally suitable for dynamicallyshowing the information for monitoring. For example, EvoRiverprovides the visual monitoring capability for topic cooperation andcompetition [SWL∗14].
In short, a circular visualization design [CLS∗12] is a represen-tative technique for monitoring the spatial temporal informationdiffusion. Besides, river-like visualization technique and timelinechart are naturally suitable for monitoring the dynamic stream-ing data [SWL∗14]. Lastly, the wordle technique is also frequentlyused in visualizing and monitoring the keywords dynamics and dis-tribution on the map [TKE∗15].
3.3.2. Feature Extraction
Feature is a general term and used in many visual analytics ap-plications. Broadly speaking, all visual analytics systems extractfeatures. To narrow down the scope, we define a feature as the sig-nificant characteristics of one or multiple attributes in the entities ofsocial media. It can be a range of meaningful values, special typesof behaviors, etc. We mark papers into this category if they claim
contributions as finding or analyzing of important features in socialmedia. For example, ideaFlow investigates the lead-lag patterns ininformation diffusion [WLC∗16]. In their pipeline (Figure 11b),they propose a lead-lag analyzer and a hierarchical visualization toidentify and visualize the lead-lag patterns.
Besides diffusion features, there are many visual analytics worksaddressing spatial temporal features and semantic related fea-tures [MJG∗14, CYW∗16, CLWW14]. Chen et al. derive reliablemovement patterns with semantics [CWLY16] (Figure 12a). Theycombine multiple techniques for semantic features in movementpattern analysis. Their techniques include a circular design, map-based visualization, map-based flow, attribute matrix, parallel co-ordinates and small multiples. Cui et al. extract dynamic hier-archical topic evolution patterns [CLWW14]. One step further,we find researchers propose visual comparisons for extracted fea-tures [CCW∗16, CTJ∗14, KSB∗16]. For example, TravelDiff pro-vides a visual comparison analytics for extracted movement pat-terns in different spatial and temporal scales [KSB∗16].
c© 2017 The Author(s)Computer Graphics Forum c© 2017 The Eurographics Association and John Wiley & Sons Ltd.
575
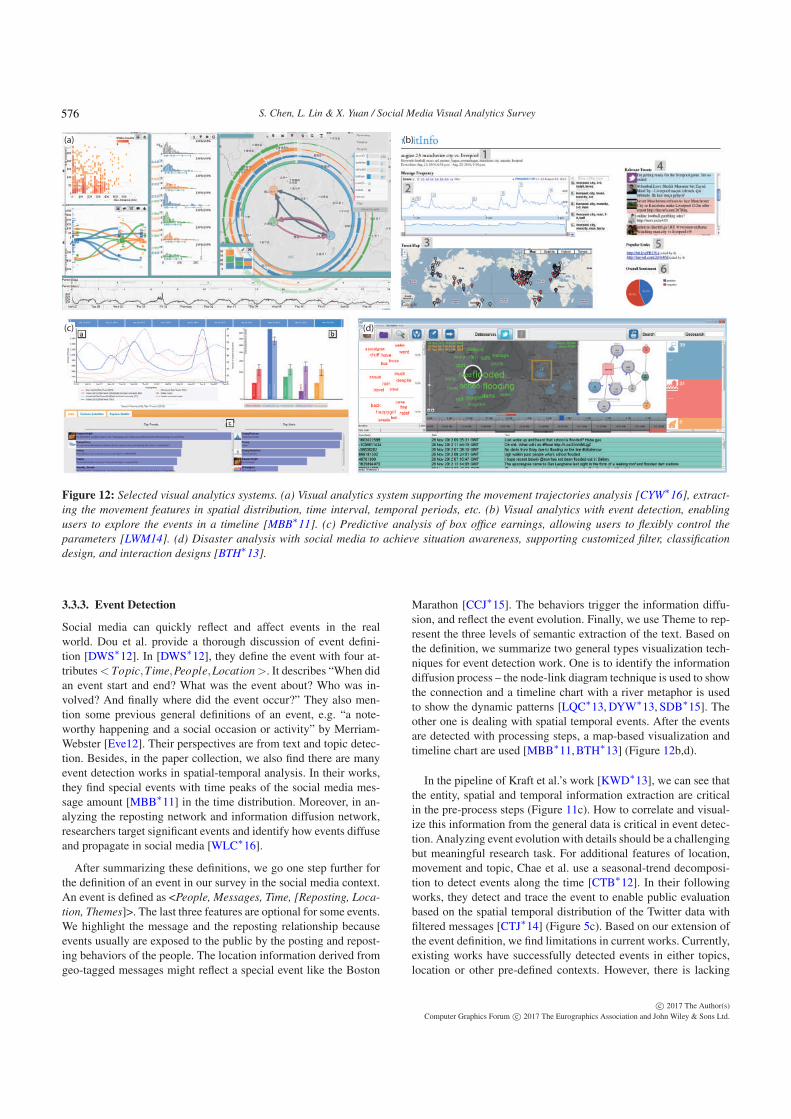
S. Chen, L. Lin & X. Yuan / Social Media Visual Analytics Survey
(a) (b)
(c) (d)
Figure 12: Selected visual analytics systems. (a) Visual analytics system supporting the movement trajectories analysis [CYW∗16], extract-
ing the movement features in spatial distribution, time interval, temporal periods, etc. (b) Visual analytics with event detection, enabling
users to explore the events in a timeline [MBB∗11]. (c) Predictive analysis of box office earnings, allowing users to flexibly control the
parameters [LWM14]. (d) Disaster analysis with social media to achieve situation awareness, supporting customized filter, classification
design, and interaction designs [BTH∗13].
3.3.3. Event Detection
Social media can quickly reflect and affect events in the realworld. Dou et al. provide a thorough discussion of event defini-tion [DWS∗12]. In [DWS∗12], they define the event with four at-tributes < Topic,Time,People,Location>. It describes “When didan event start and end? What was the event about? Who was in-volved? And finally where did the event occur?” They also men-tion some previous general definitions of an event, e.g. “a note-worthy happening and a social occasion or activity” by Merriam-Webster [Eve12]. Their perspectives are from text and topic detec-tion. Besides, in the paper collection, we also find there are manyevent detection works in spatial-temporal analysis. In their works,they find special events with time peaks of the social media mes-sage amount [MBB∗11] in the time distribution. Moreover, in an-alyzing the reposting network and information diffusion network,researchers target significant events and identify how events diffuseand propagate in social media [WLC∗16].
After summarizing these definitions, we go one step further forthe definition of an event in our survey in the social media context.An event is defined as <People, Messages, Time, [Reposting, Loca-
tion, Themes]>. The last three features are optional for some events.We highlight the message and the reposting relationship becauseevents usually are exposed to the public by the posting and repost-ing behaviors of the people. The location information derived fromgeo-tagged messages might reflect a special event like the Boston
Marathon [CCJ∗15]. The behaviors trigger the information diffu-sion, and reflect the event evolution. Finally, we use Theme to rep-resent the three levels of semantic extraction of the text. Based onthe definition, we summarize two general types visualization tech-niques for event detection work. One is to identify the informationdiffusion process – the node-link diagram technique is used to showthe connection and a timeline chart with a river metaphor is usedto show the dynamic patterns [LQC∗13, DYW∗13, SDB∗15]. Theother one is dealing with spatial temporal events. After the eventsare detected with processing steps, a map-based visualization andtimeline chart are used [MBB∗11, BTH∗13] (Figure 12b,d).
In the pipeline of Kraft et al.’s work [KWD∗13], we can see thatthe entity, spatial and temporal information extraction are criticalin the pre-process steps (Figure 11c). How to correlate and visual-ize this information from the general data is critical in event detec-tion. Analyzing event evolution with details should be a challengingbut meaningful research task. For additional features of location,movement and topic, Chae et al. use a seasonal-trend decomposi-tion to detect events along the time [CTB∗12]. In their followingworks, they detect and trace the event to enable public evaluationbased on the spatial temporal distribution of the Twitter data withfiltered messages [CTJ∗14] (Figure 5c). Based on our extension ofthe event definition, we find limitations in current works. Currently,existing works have successfully detected events in either topics,location or other pre-defined contexts. However, there is lacking
c© 2017 The Author(s)Computer Graphics Forum c© 2017 The Eurographics Association and John Wiley & Sons Ltd.
576
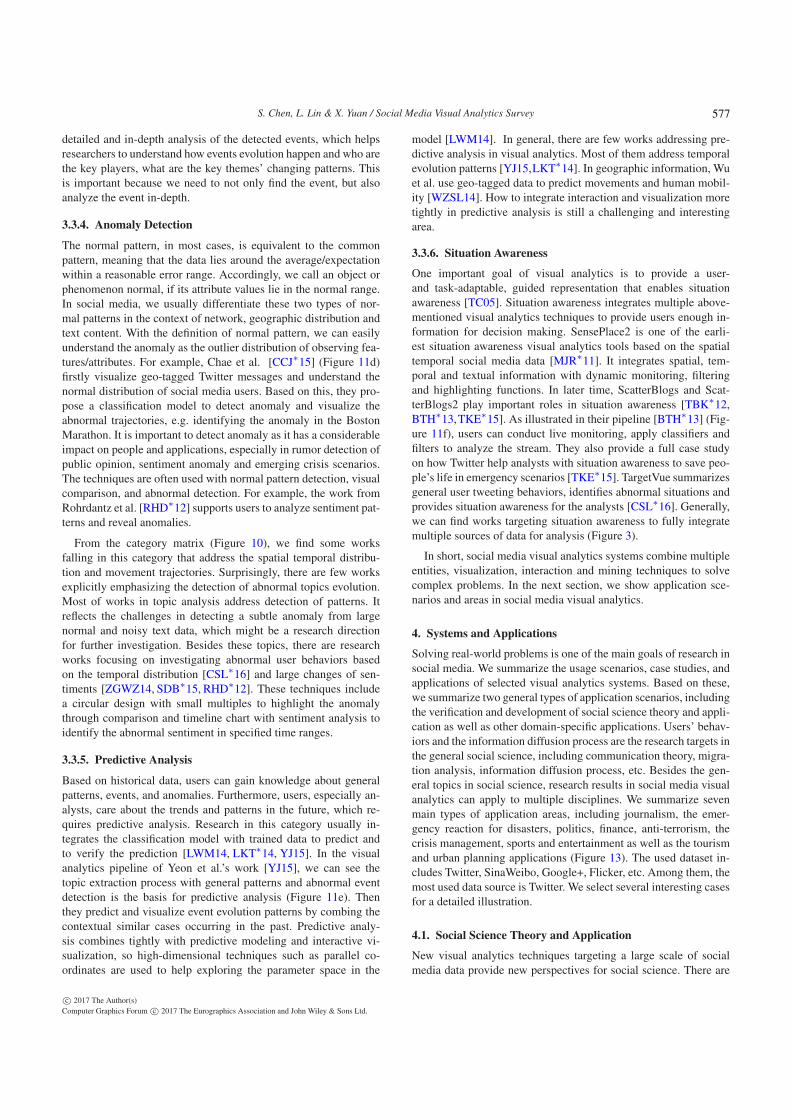
S. Chen, L. Lin & X. Yuan / Social Media Visual Analytics Survey
detailed and in-depth analysis of the detected events, which helpsresearchers to understand how events evolution happen and who arethe key players, what are the key themes’ changing patterns. Thisis important because we need to not only find the event, but alsoanalyze the event in-depth.
3.3.4. Anomaly Detection
The normal pattern, in most cases, is equivalent to the commonpattern, meaning that the data lies around the average/expectationwithin a reasonable error range. Accordingly, we call an object orphenomenon normal, if its attribute values lie in the normal range.In social media, we usually differentiate these two types of nor-mal patterns in the context of network, geographic distribution andtext content. With the definition of normal pattern, we can easilyunderstand the anomaly as the outlier distribution of observing fea-tures/attributes. For example, Chae et al. [CCJ∗15] (Figure 11d)firstly visualize geo-tagged Twitter messages and understand thenormal distribution of social media users. Based on this, they pro-pose a classification model to detect anomaly and visualize theabnormal trajectories, e.g. identifying the anomaly in the BostonMarathon. It is important to detect anomaly as it has a considerableimpact on people and applications, especially in rumor detection ofpublic opinion, sentiment anomaly and emerging crisis scenarios.The techniques are often used with normal pattern detection, visualcomparison, and abnormal detection. For example, the work fromRohrdantz et al. [RHD∗12] supports users to analyze sentiment pat-terns and reveal anomalies.
From the category matrix (Figure 10), we find some worksfalling in this category that address the spatial temporal distribu-tion and movement trajectories. Surprisingly, there are few worksexplicitly emphasizing the detection of abnormal topics evolution.Most of works in topic analysis address detection of patterns. Itreflects the challenges in detecting a subtle anomaly from largenormal and noisy text data, which might be a research directionfor further investigation. Besides these topics, there are researchworks focusing on investigating abnormal user behaviors basedon the temporal distribution [CSL∗16] and large changes of sen-timents [ZGWZ14, SDB∗15, RHD∗12]. These techniques includea circular design with small multiples to highlight the anomalythrough comparison and timeline chart with sentiment analysis toidentify the abnormal sentiment in specified time ranges.
3.3.5. Predictive Analysis
Based on historical data, users can gain knowledge about generalpatterns, events, and anomalies. Furthermore, users, especially an-alysts, care about the trends and patterns in the future, which re-quires predictive analysis. Research in this category usually in-tegrates the classification model with trained data to predict andto verify the prediction [LWM14, LKT∗14, YJ15]. In the visualanalytics pipeline of Yeon et al.’s work [YJ15], we can see thetopic extraction process with general patterns and abnormal eventdetection is the basis for predictive analysis (Figure 11e). Thenthey predict and visualize event evolution patterns by combing thecontextual similar cases occurring in the past. Predictive analy-sis combines tightly with predictive modeling and interactive vi-sualization, so high-dimensional techniques such as parallel co-ordinates are used to help exploring the parameter space in the
model [LWM14]. In general, there are few works addressing pre-dictive analysis in visual analytics. Most of them address temporalevolution patterns [YJ15,LKT∗14]. In geographic information, Wuet al. use geo-tagged data to predict movements and human mobil-ity [WZSL14]. How to integrate interaction and visualization moretightly in predictive analysis is still a challenging and interestingarea.
3.3.6. Situation Awareness
One important goal of visual analytics is to provide a user-and task-adaptable, guided representation that enables situationawareness [TC05]. Situation awareness integrates multiple above-mentioned visual analytics techniques to provide users enough in-formation for decision making. SensePlace2 is one of the earli-est situation awareness visual analytics tools based on the spatialtemporal social media data [MJR∗11]. It integrates spatial, tem-poral and textual information with dynamic monitoring, filteringand highlighting functions. In later time, ScatterBlogs and Scat-terBlogs2 play important roles in situation awareness [TBK∗12,BTH∗13,TKE∗15]. As illustrated in their pipeline [BTH∗13] (Fig-ure 11f), users can conduct live monitoring, apply classifiers andfilters to analyze the stream. They also provide a full case studyon how Twitter help analysts with situation awareness to save peo-ple’s life in emergency scenarios [TKE∗15]. TargetVue summarizesgeneral user tweeting behaviors, identifies abnormal situations andprovides situation awareness for the analysts [CSL∗16]. Generally,we can find works targeting situation awareness to fully integratemultiple sources of data for analysis (Figure 3).
In short, social media visual analytics systems combine multipleentities, visualization, interaction and mining techniques to solvecomplex problems. In the next section, we show application sce-narios and areas in social media visual analytics.
4. Systems and Applications
Solving real-world problems is one of the main goals of research insocial media. We summarize the usage scenarios, case studies, andapplications of selected visual analytics systems. Based on these,we summarize two general types of application scenarios, includingthe verification and development of social science theory and appli-cation as well as other domain-specific applications. Users’ behav-iors and the information diffusion process are the research targets inthe general social science, including communication theory, migra-tion analysis, information diffusion process, etc. Besides the gen-eral topics in social science, research results in social media visualanalytics can apply to multiple disciplines. We summarize sevenmain types of application areas, including journalism, the emer-gency reaction for disasters, politics, finance, anti-terrorism, thecrisis management, sports and entertainment as well as the tourismand urban planning applications (Figure 13). The used dataset in-cludes Twitter, SinaWeibo, Google+, Flicker, etc. Among them, themost used data source is Twitter. We select several interesting casesfor a detailed illustration.
4.1. Social Science Theory and Application
New visual analytics techniques targeting a large scale of socialmedia data provide new perspectives for social science. There are
c© 2017 The Author(s)Computer Graphics Forum c© 2017 The Eurographics Association and John Wiley & Sons Ltd.
577
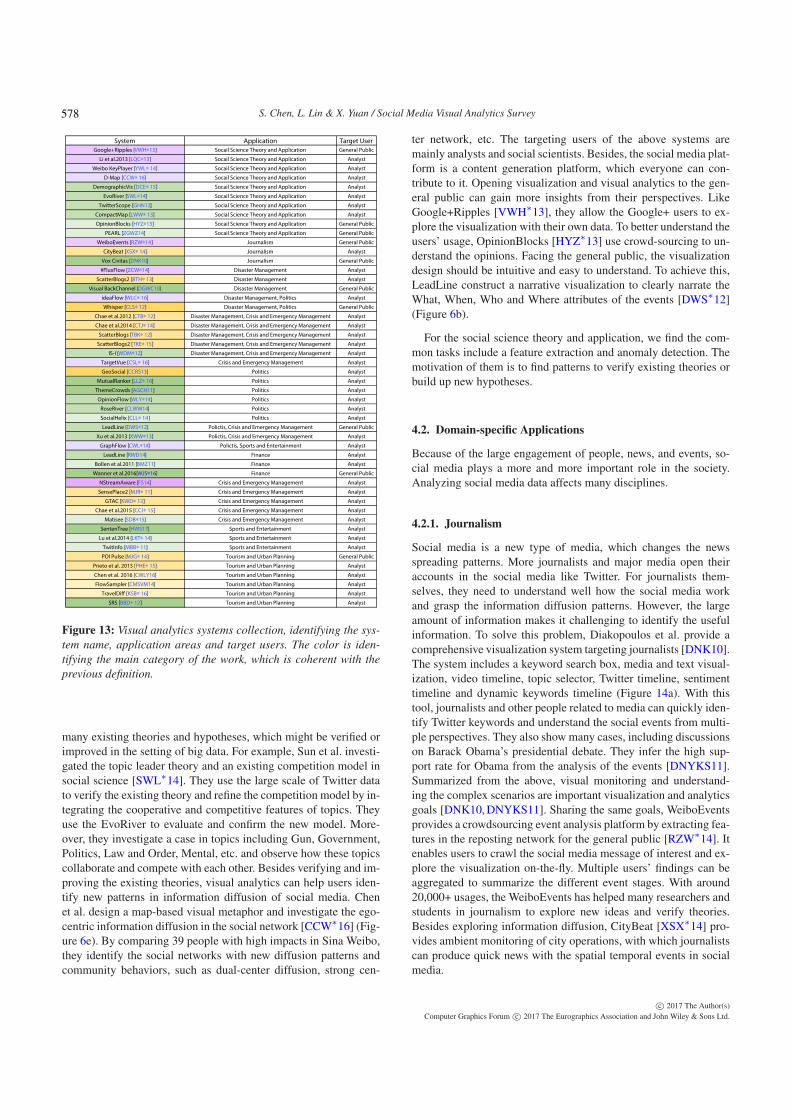
S. Chen, L. Lin & X. Yuan / Social Media Visual Analytics Survey
System Application Target User
Google+Ripples [VWH 13] Socail Science Theory and Application General Public
Li et al.2013 [LQC 13] Socail Science Theory and Application Analyst
Weibo KeyPlayer [YWL 14] Socail Science Theory and Application Analyst
D-Map [CCW 16] Socail Science Theory and Application Analyst
DemographicVis [DCE 15] Socail Science Theory and Application Analyst
EvoRiver [SWL 14] Socail Science Theory and Application Analyst
TwitterScope [GHN13] Social Science Theory and Application Analyst
CompactMap [LWW 13] Social Science Theory and Application Analyst
OpinionBlocks [HYZ 13] Socail Science Theory and Application General Public
PEARL [ZGWZ14] Socail Science Theory and Application General Public
WeiboEvents [RZW 14] Journalism General Public
CityBeat [XSX 14] Journalism Analyst
Vox Civitas [DNK10] Journalism General Public
#FluxFlow [ZCW 14] Disaster Management Analyst
ScatterBlogs2 [BTH 13] Disaster Management Analyst
Visual BackChannel [DGWC10] Disaster Management General Public
ideaFlow [WLC 16] Disaster Management, Politics Analyst
Whisper [CLS 12] Disaster Management, Politics General Public
Chae et al.2012 [CTB 12] Disaster Management, Crisis and Emergency Management Analyst
Chae et al.2014 [CTJ 14] Disaster Management, Crisis and Emergency Management Analyst
ScatterBlogs [TBK 12] Disaster Management, Crisis and Emergency Management Analyst
ScatterBlogs2 [TKE 15] Disaster Management, Crisis and Emergency Management Analyst
IS-I [WDM 12] Disaster Management, Crisis and Emergency Management Analyst
TargetVue [CSL 16] Crisis and Emergency Management Analyst
GeoSocial [CCRS13] Politics Analyst
MutualRanker [LLZ 16] Politics Analyst
ThemeCrowds [AGCH11] Politics Analyst
OpinionFlow [WLY 14] Politics Analyst
RoseRiver [CLWW14] Politics Analyst
SocialHelix [CLL 14] Politics Analyst
LeadLine [DWS 12] Polictis, Crisis and Emergency Management General Public
Xu et al.2013 [XWW 13] Polictis, Crisis and Emergency Management Analyst
GraphFlow [CWL 14] Polictis, Sports and Entertainment Analyst
LeadLine [RWD14] Finance Analyst
Bollen et al.2011 [BMZ11] Finance Analyst
Wanner et al.2016[WJS 16] Finance General Public
NStreamAware [FS14] Crisis and Emergency Management Analyst
SensePlace2 [MJR 11] Crisis and Emergency Management Analyst
GTAC [KWD 13] Crisis and Emergency Management Analyst
Chae et al.2015 [CCJ 15] Crisis and Emergency Management Analyst
Matisee [SDB 15] Crisis and Emergency Management Analyst
SentenTree [HWS17] Sports and Entertainment Analyst
Lu et al.2014 [LKT 14] Sports and Entertainment Analyst
TwitInfo [MBB 11] Sports and Entertainment Analyst
POI Pulse [MJG 14] Tourism and Urban Planning General Public
Prieto et al. 2015 [PHE 15] Tourism and Urban Planning Analyst
Chen et al. 2016 [CWLY16] Tourism and Urban Planning Analyst
FlowSampler [CMSVM14] Tourism and Urban Planning Analyst
TravelDiff [KSB 16] Tourism and Urban Planning Analyst
SRS [BBD 12] Tourism and Urban Planning Analyst
Figure 13: Visual analytics systems collection, identifying the sys-
tem name, application areas and target users. The color is iden-
tifying the main category of the work, which is coherent with the
previous definition.
many existing theories and hypotheses, which might be verified orimproved in the setting of big data. For example, Sun et al. investi-gated the topic leader theory and an existing competition model insocial science [SWL∗14]. They use the large scale of Twitter datato verify the existing theory and refine the competition model by in-tegrating the cooperative and competitive features of topics. Theyuse the EvoRiver to evaluate and confirm the new model. More-over, they investigate a case in topics including Gun, Government,Politics, Law and Order, Mental, etc. and observe how these topicscollaborate and compete with each other. Besides verifying and im-proving the existing theories, visual analytics can help users iden-tify new patterns in information diffusion of social media. Chenet al. design a map-based visual metaphor and investigate the ego-centric information diffusion in the social network [CCW∗16] (Fig-ure 6e). By comparing 39 people with high impacts in Sina Weibo,they identify the social networks with new diffusion patterns andcommunity behaviors, such as dual-center diffusion, strong cen-
ter network, etc. The targeting users of the above systems aremainly analysts and social scientists. Besides, the social media plat-form is a content generation platform, which everyone can con-tribute to it. Opening visualization and visual analytics to the gen-eral public can gain more insights from their perspectives. LikeGoogle+Ripples [VWH∗13], they allow the Google+ users to ex-plore the visualization with their own data. To better understand theusers’ usage, OpinionBlocks [HYZ∗13] use crowd-sourcing to un-derstand the opinions. Facing the general public, the visualizationdesign should be intuitive and easy to understand. To achieve this,LeadLine construct a narrative visualization to clearly narrate theWhat, When, Who and Where attributes of the events [DWS∗12](Figure 6b).
For the social science theory and application, we find the com-mon tasks include a feature extraction and anomaly detection. Themotivation of them is to find patterns to verify existing theories orbuild up new hypotheses.
4.2. Domain-specific Applications
Because of the large engagement of people, news, and events, so-cial media plays a more and more important role in the society.Analyzing social media data affects many disciplines.
4.2.1. Journalism
Social media is a new type of media, which changes the newsspreading patterns. More journalists and major media open theiraccounts in the social media like Twitter. For journalists them-selves, they need to understand well how the social media workand grasp the information diffusion patterns. However, the largeamount of information makes it challenging to identify the usefulinformation. To solve this problem, Diakopoulos et al. provide acomprehensive visualization system targeting journalists [DNK10].The system includes a keyword search box, media and text visual-ization, video timeline, topic selector, Twitter timeline, sentimenttimeline and dynamic keywords timeline (Figure 14a). With thistool, journalists and other people related to media can quickly iden-tify Twitter keywords and understand the social events from multi-ple perspectives. They also show many cases, including discussionson Barack Obama’s presidential debate. They infer the high sup-port rate for Obama from the analysis of the events [DNYKS11].Summarized from the above, visual monitoring and understand-ing the complex scenarios are important visualization and analyticsgoals [DNK10, DNYKS11]. Sharing the same goals, WeiboEventsprovides a crowdsourcing event analysis platform by extracting fea-tures in the reposting network for the general public [RZW∗14]. Itenables users to crawl the social media message of interest and ex-plore the visualization on-the-fly. Multiple users’ findings can beaggregated to summarize the different event stages. With around20,000+ usages, the WeiboEvents has helped many researchers andstudents in journalism to explore new ideas and verify theories.Besides exploring information diffusion, CityBeat [XSX∗14] pro-vides ambient monitoring of city operations, with which journalistscan produce quick news with the spatial temporal events in socialmedia.
c© 2017 The Author(s)Computer Graphics Forum c© 2017 The Eurographics Association and John Wiley & Sons Ltd.
578
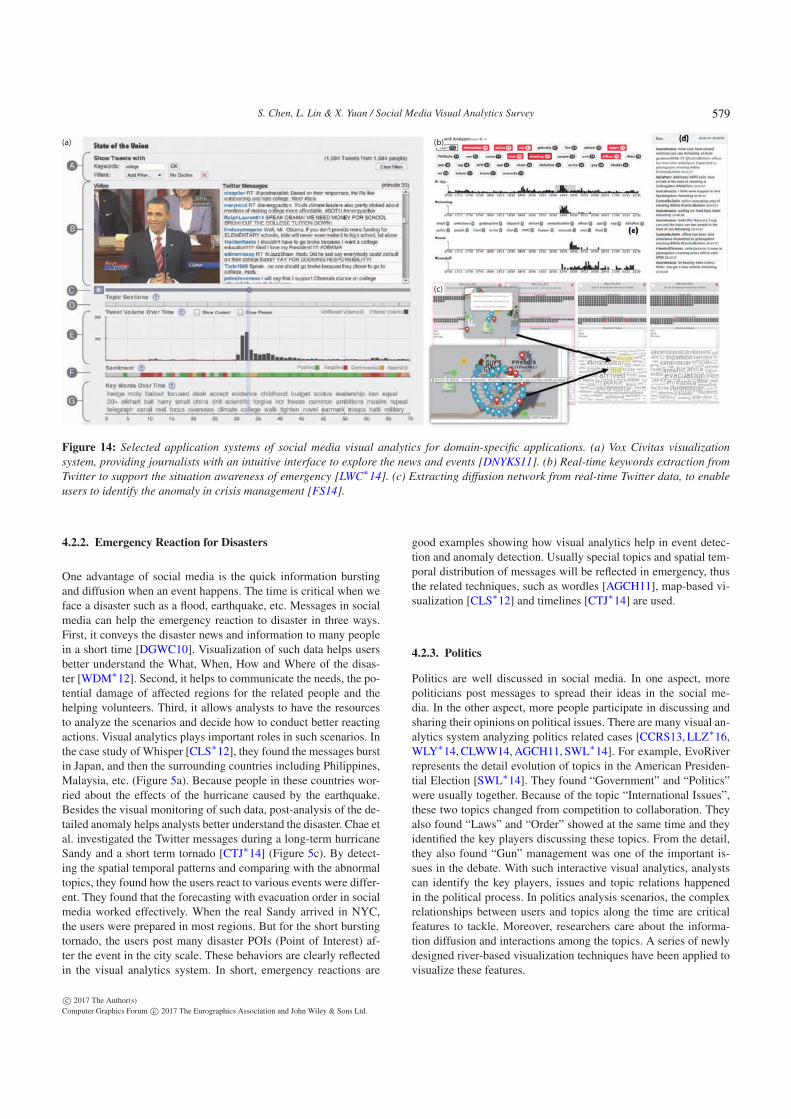
S. Chen, L. Lin & X. Yuan / Social Media Visual Analytics Survey
(a) (b)
(c)
Figure 14: Selected application systems of social media visual analytics for domain-specific applications. (a) Vox Civitas visualization
system, providing journalists with an intuitive interface to explore the news and events [DNYKS11]. (b) Real-time keywords extraction from
Twitter to support the situation awareness of emergency [LWC∗14]. (c) Extracting diffusion network from real-time Twitter data, to enable
users to identify the anomaly in crisis management [FS14].
4.2.2. Emergency Reaction for Disasters
One advantage of social media is the quick information burstingand diffusion when an event happens. The time is critical when weface a disaster such as a flood, earthquake, etc. Messages in socialmedia can help the emergency reaction to disaster in three ways.First, it conveys the disaster news and information to many peoplein a short time [DGWC10]. Visualization of such data helps usersbetter understand the What, When, How and Where of the disas-ter [WDM∗12]. Second, it helps to communicate the needs, the po-tential damage of affected regions for the related people and thehelping volunteers. Third, it allows analysts to have the resourcesto analyze the scenarios and decide how to conduct better reactingactions. Visual analytics plays important roles in such scenarios. Inthe case study of Whisper [CLS∗12], they found the messages burstin Japan, and then the surrounding countries including Philippines,Malaysia, etc. (Figure 5a). Because people in these countries wor-ried about the effects of the hurricane caused by the earthquake.Besides the visual monitoring of such data, post-analysis of the de-tailed anomaly helps analysts better understand the disaster. Chae etal. investigated the Twitter messages during a long-term hurricaneSandy and a short term tornado [CTJ∗14] (Figure 5c). By detect-ing the spatial temporal patterns and comparing with the abnormaltopics, they found how the users react to various events were differ-ent. They found that the forecasting with evacuation order in socialmedia worked effectively. When the real Sandy arrived in NYC,the users were prepared in most regions. But for the short burstingtornado, the users post many disaster POIs (Point of Interest) af-ter the event in the city scale. These behaviors are clearly reflectedin the visual analytics system. In short, emergency reactions are
good examples showing how visual analytics help in event detec-tion and anomaly detection. Usually special topics and spatial tem-poral distribution of messages will be reflected in emergency, thusthe related techniques, such as wordles [AGCH11], map-based vi-sualization [CLS∗12] and timelines [CTJ∗14] are used.
4.2.3. Politics
Politics are well discussed in social media. In one aspect, morepoliticians post messages to spread their ideas in the social me-dia. In the other aspect, more people participate in discussing andsharing their opinions on political issues. There are many visual an-alytics system analyzing politics related cases [CCRS13, LLZ∗16,WLY∗14, CLWW14, AGCH11, SWL∗14]. For example, EvoRiverrepresents the detail evolution of topics in the American Presiden-tial Election [SWL∗14]. They found “Government” and “Politics”were usually together. Because of the topic “International Issues”,these two topics changed from competition to collaboration. Theyalso found “Laws” and “Order” showed at the same time and theyidentified the key players discussing these topics. From the detail,they also found “Gun” management was one of the important is-sues in the debate. With such interactive visual analytics, analystscan identify the key players, issues and topic relations happenedin the political process. In politics analysis scenarios, the complexrelationships between users and topics along the time are criticalfeatures to tackle. Moreover, researchers care about the informa-tion diffusion and interactions among the topics. A series of newlydesigned river-based visualization techniques have been applied tovisualize these features.
c© 2017 The Author(s)Computer Graphics Forum c© 2017 The Eurographics Association and John Wiley & Sons Ltd.
579
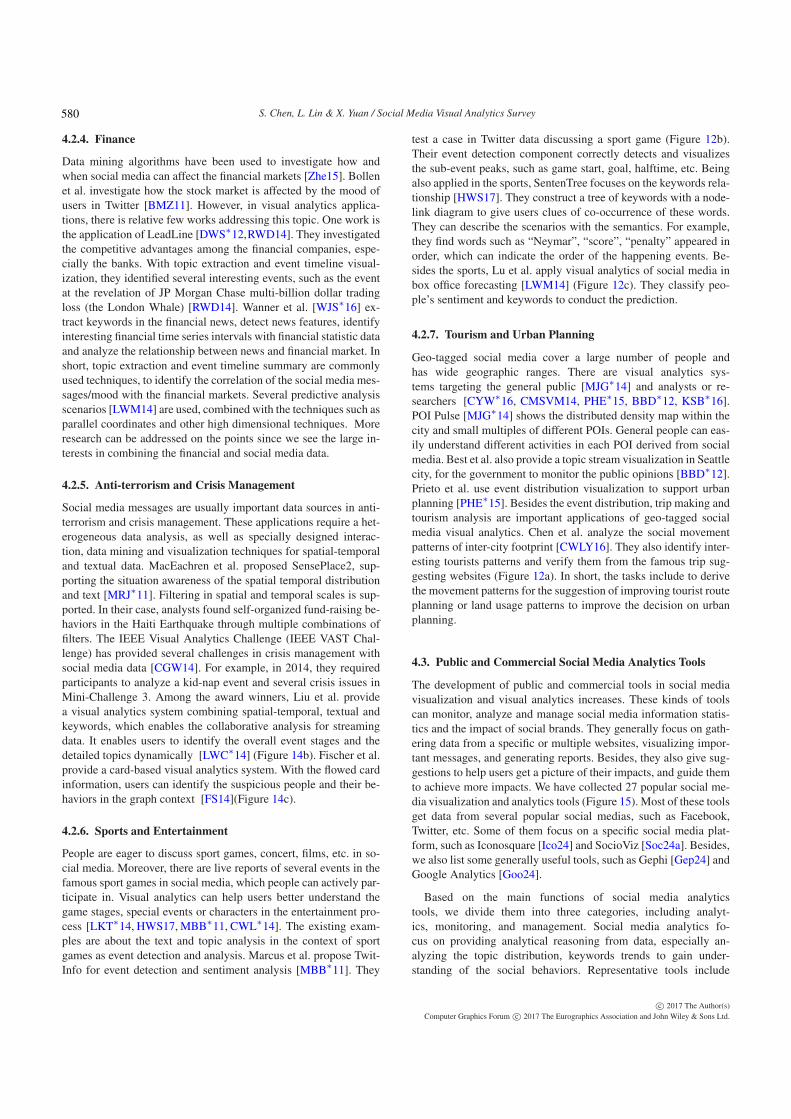
S. Chen, L. Lin & X. Yuan / Social Media Visual Analytics Survey
4.2.4. Finance
Data mining algorithms have been used to investigate how andwhen social media can affect the financial markets [Zhe15]. Bollenet al. investigate how the stock market is affected by the mood ofusers in Twitter [BMZ11]. However, in visual analytics applica-tions, there is relative few works addressing this topic. One work isthe application of LeadLine [DWS∗12,RWD14]. They investigatedthe competitive advantages among the financial companies, espe-cially the banks. With topic extraction and event timeline visual-ization, they identified several interesting events, such as the eventat the revelation of JP Morgan Chase multi-billion dollar tradingloss (the London Whale) [RWD14]. Wanner et al. [WJS∗16] ex-tract keywords in the financial news, detect news features, identifyinteresting financial time series intervals with financial statistic dataand analyze the relationship between news and financial market. Inshort, topic extraction and event timeline summary are commonlyused techniques, to identify the correlation of the social media mes-sages/mood with the financial markets. Several predictive analysisscenarios [LWM14] are used, combined with the techniques such asparallel coordinates and other high dimensional techniques. Moreresearch can be addressed on the points since we see the large in-terests in combining the financial and social media data.
4.2.5. Anti-terrorism and Crisis Management
Social media messages are usually important data sources in anti-terrorism and crisis management. These applications require a het-erogeneous data analysis, as well as specially designed interac-tion, data mining and visualization techniques for spatial-temporaland textual data. MacEachren et al. proposed SensePlace2, sup-porting the situation awareness of the spatial temporal distributionand text [MRJ∗11]. Filtering in spatial and temporal scales is sup-ported. In their case, analysts found self-organized fund-raising be-haviors in the Haiti Earthquake through multiple combinations offilters. The IEEE Visual Analytics Challenge (IEEE VAST Chal-lenge) has provided several challenges in crisis management withsocial media data [CGW14]. For example, in 2014, they requiredparticipants to analyze a kid-nap event and several crisis issues inMini-Challenge 3. Among the award winners, Liu et al. providea visual analytics system combining spatial-temporal, textual andkeywords, which enables the collaborative analysis for streamingdata. It enables users to identify the overall event stages and thedetailed topics dynamically [LWC∗14] (Figure 14b). Fischer et al.provide a card-based visual analytics system. With the flowed cardinformation, users can identify the suspicious people and their be-haviors in the graph context [FS14](Figure 14c).
4.2.6. Sports and Entertainment
People are eager to discuss sport games, concert, films, etc. in so-cial media. Moreover, there are live reports of several events in thefamous sport games in social media, which people can actively par-ticipate in. Visual analytics can help users better understand thegame stages, special events or characters in the entertainment pro-cess [LKT∗14, HWS17, MBB∗11, CWL∗14]. The existing exam-ples are about the text and topic analysis in the context of sportgames as event detection and analysis. Marcus et al. propose Twit-Info for event detection and sentiment analysis [MBB∗11]. They
test a case in Twitter data discussing a sport game (Figure 12b).Their event detection component correctly detects and visualizesthe sub-event peaks, such as game start, goal, halftime, etc. Beingalso applied in the sports, SentenTree focuses on the keywords rela-tionship [HWS17]. They construct a tree of keywords with a node-link diagram to give users clues of co-occurrence of these words.They can describe the scenarios with the semantics. For example,they find words such as “Neymar”, “score”, “penalty” appeared inorder, which can indicate the order of the happening events. Be-sides the sports, Lu et al. apply visual analytics of social media inbox office forecasting [LWM14] (Figure 12c). They classify peo-ple’s sentiment and keywords to conduct the prediction.
4.2.7. Tourism and Urban Planning
Geo-tagged social media cover a large number of people andhas wide geographic ranges. There are visual analytics sys-tems targeting the general public [MJG∗14] and analysts or re-searchers [CYW∗16, CMSVM14, PHE∗15, BBD∗12, KSB∗16].POI Pulse [MJG∗14] shows the distributed density map within thecity and small multiples of different POIs. General people can eas-ily understand different activities in each POI derived from socialmedia. Best et al. also provide a topic stream visualization in Seattlecity, for the government to monitor the public opinions [BBD∗12].Prieto et al. use event distribution visualization to support urbanplanning [PHE∗15]. Besides the event distribution, trip making andtourism analysis are important applications of geo-tagged socialmedia visual analytics. Chen et al. analyze the social movementpatterns of inter-city footprint [CWLY16]. They also identify inter-esting tourists patterns and verify them from the famous trip sug-gesting websites (Figure 12a). In short, the tasks include to derivethe movement patterns for the suggestion of improving tourist routeplanning or land usage patterns to improve the decision on urbanplanning.
4.3. Public and Commercial Social Media Analytics Tools
The development of public and commercial tools in social mediavisualization and visual analytics increases. These kinds of toolscan monitor, analyze and manage social media information statis-tics and the impact of social brands. They generally focus on gath-ering data from a specific or multiple websites, visualizing impor-tant messages, and generating reports. Besides, they also give sug-gestions to help users get a picture of their impacts, and guide themto achieve more impacts. We have collected 27 popular social me-dia visualization and analytics tools (Figure 15). Most of these toolsget data from several popular social medias, such as Facebook,Twitter, etc. Some of them focus on a specific social media plat-form, such as Iconosquare [Ico24] and SocioViz [Soc24a]. Besides,we also list some generally useful tools, such as Gephi [Gep24] andGoogle Analytics [Goo24].
Based on the main functions of social media analyticstools, we divide them into three categories, including analyt-ics, monitoring, and management. Social media analytics fo-cus on providing analytical reasoning from data, especially an-alyzing the topic distribution, keywords trends to gain under-standing of the social behaviors. Representative tools include
c© 2017 The Author(s)Computer Graphics Forum c© 2017 The Eurographics Association and John Wiley & Sons Ltd.
580
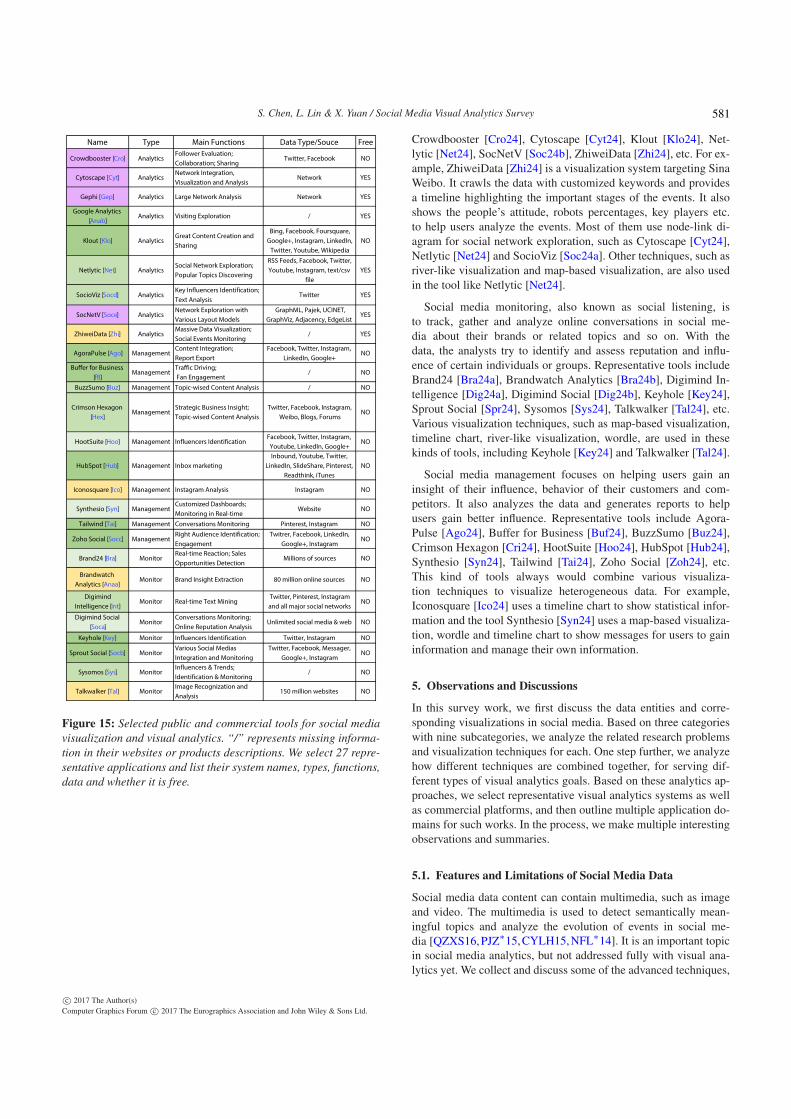
S. Chen, L. Lin & X. Yuan / Social Media Visual Analytics Survey
Name Type Main Functions Data Type/Souce Free
Crowdbooster [Cro] AnalyticsFollower Evaluation;
Collaboration; SharingTwitter, Facebook NO
Cytoscape [Cyt] AnalyticsNetwork Integration,
Visualization and AnalysisNetwork YES
Gephi [Gep] Analytics Large Network Analysis Network YES
Google Analytics
[Anab]Analytics Visiting Exploration / YES
Klout [Klo] AnalyticsGreat Content Creation and
Sharing
Bing, Facebook, Foursquare,
Google+, Instagram, LinkedIn,
Twitter, Youtube, Wikipedia
NO
Netlytic [Net] AnalyticsSocial Network Exploration;
Popular Topics Discovering
RSS Feeds, Facebook, Twitter,
Youtube, Instagram, text/csv
file
YES
SocioViz [Socd] AnalyticsKey Influencers Identification;
Text AnalysisTwitter YES
SocNetV [Soce] AnalyticsNetwork Exploration with
Various Layout Models
GraphML, Pajek, UCINET,
GraphViz, Adjacency, EdgeListYES
ZhiweiData [Zhi] AnalyticsMassive Data Visualization;
Social Events Monitoring/ YES
AgoraPulse [Ago] ManagementContent Integration;
Report Export
Facebook, Twitter, Instagram,
LinkedIn, Google+NO
Buffer for Business
[fB]Management
Traffic Driving;
Fan Engagement/ NO
BuzzSumo [Buz] Management Topic-wised Content Analysis / NO
Crimson Hexagon
[Hex]Management
Strategic Business Insight;
Topic-wised Content Analysis
Twitter, Facebook, Instagram,
Weibo, Blogs, ForumsNO
HootSuite [Hoo] Management Influencers IdentificationFacebook, Twitter, Instagram,
Youtube, LinkedIn, Google+NO
HubSpot [Hub] Management Inbox marketing
Inbound, Youtube, Twitter,
LinkedIn, SlideShare, Pinterest,
Readthink, iTunes
NO
Iconosquare [Ico] Management Instagram Analysis Instagram NO
Synthesio [Syn] ManagementCustomized Dashboards;
Monitoring in Real-timeWebsite NO
Tailwind [Tai] Management Conversations Monitoring Pinterest, Instagram NO
Zoho Social [Socc] ManagementRight Audience Identification;
Engagement
Twitrer, Facebook, LinkedIn,
Google+, InstagramNO
Brand24 [Bra] MonitorReal-time Reaction; Sales
Opportunities DetectionMillions of sources NO
Brandwatch
Analytics [Anaa]Monitor Brand Insight Extraction 80 million online sources NO
Digimind
Intelligence [Int]Monitor Real-time Text Mining
Twitter, Pinterest, Instagram
and all major social networksNO
Digimind Social
[Soca]Monitor
Conversations Monitoring;
Online Reputation AnalysisUnlimited social media & web NO
Keyhole [Key] Monitor Influencers Identification Twitter, Instagram NO
Sprout Social [Socb] MonitorVarious Social Medias
Integration and Monitoring
Twitter, Facebook, Messager,
Google+, InstagramNO
Sysomos [Sys] MonitorInfluencers & Trends;
Identification & Monitoring/ NO
Talkwalker [Tal] MonitorImage Recognization and
Analysis150 million websites NO
Figure 15: Selected public and commercial tools for social media
visualization and visual analytics. “/” represents missing informa-
tion in their websites or products descriptions. We select 27 repre-
sentative applications and list their system names, types, functions,
data and whether it is free.
Crowdbooster [Cro24], Cytoscape [Cyt24], Klout [Klo24], Net-lytic [Net24], SocNetV [Soc24b], ZhiweiData [Zhi24], etc. For ex-ample, ZhiweiData [Zhi24] is a visualization system targeting SinaWeibo. It crawls the data with customized keywords and providesa timeline highlighting the important stages of the events. It alsoshows the people’s attitude, robots percentages, key players etc.to help users analyze the events. Most of them use node-link di-agram for social network exploration, such as Cytoscape [Cyt24],Netlytic [Net24] and SocioViz [Soc24a]. Other techniques, such asriver-like visualization and map-based visualization, are also usedin the tool like Netlytic [Net24].
Social media monitoring, also known as social listening, isto track, gather and analyze online conversations in social me-dia about their brands or related topics and so on. With thedata, the analysts try to identify and assess reputation and influ-ence of certain individuals or groups. Representative tools includeBrand24 [Bra24a], Brandwatch Analytics [Bra24b], Digimind In-telligence [Dig24a], Digimind Social [Dig24b], Keyhole [Key24],Sprout Social [Spr24], Sysomos [Sys24], Talkwalker [Tal24], etc.Various visualization techniques, such as map-based visualization,timeline chart, river-like visualization, wordle, are used in thesekinds of tools, including Keyhole [Key24] and Talkwalker [Tal24].
Social media management focuses on helping users gain aninsight of their influence, behavior of their customers and com-petitors. It also analyzes the data and generates reports to helpusers gain better influence. Representative tools include Agora-Pulse [Ago24], Buffer for Business [Buf24], BuzzSumo [Buz24],Crimson Hexagon [Cri24], HootSuite [Hoo24], HubSpot [Hub24],Synthesio [Syn24], Tailwind [Tai24], Zoho Social [Zoh24], etc.This kind of tools always would combine various visualiza-tion techniques to visualize heterogeneous data. For example,Iconosquare [Ico24] uses a timeline chart to show statistical infor-mation and the tool Synthesio [Syn24] uses a map-based visualiza-tion, wordle and timeline chart to show messages for users to gaininformation and manage their own information.
5. Observations and Discussions
In this survey work, we first discuss the data entities and corre-sponding visualizations in social media. Based on three categorieswith nine subcategories, we analyze the related research problemsand visualization techniques for each. One step further, we analyzehow different techniques are combined together, for serving dif-ferent types of visual analytics goals. Based on these analytics ap-proaches, we select representative visual analytics systems as wellas commercial platforms, and then outline multiple application do-mains for such works. In the process, we make multiple interestingobservations and summaries.
5.1. Features and Limitations of Social Media Data
Social media data content can contain multimedia, such as imageand video. The multimedia is used to detect semantically mean-ingful topics and analyze the evolution of events in social me-dia [QZXS16, PJZ∗15, CYLH15, NFL∗14]. It is an important topicin social media analytics, but not addressed fully with visual ana-lytics yet. We collect and discuss some of the advanced techniques,
c© 2017 The Author(s)Computer Graphics Forum c© 2017 The Eurographics Association and John Wiley & Sons Ltd.
581
S. Chen, L. Lin & X. Yuan / Social Media Visual Analytics Survey
to shed insight on future research. Researchers integrate the mul-timedia with feature extraction and event detection. For example,mmETM [QZXS16] can effectively model multimedia data, suchas long text with related images, to extract topics of significantevents. The model is used in social event tracking and evolutionarytrends analysis. Niu et al. [NFL∗14] develop a multi-source-drivenasynchronous diffusion model (MADM) to study the video-sharingpropagation in social media. More details can be found in Wu etal.’s survey [WCG∗16].
Though social media data provide fruitful sources for analysis ina wide range of domains [KFS∗12,KH10], there are several limita-tions and issues we need to pay attention to when we use social me-dia data. First, there is bias in representing people’s behaviors whenwe use social media data. Young people, and people who have ac-cess to mobile phones and microblog services have more chancesto post social media messages. For geo-tagged analysis, there isaround 3%-5% people posting messages with geo-tagged informa-tion in Sina Weibo [CYW∗16]. Moreover, the data we get are usu-ally samples from one social media platform (e.g. Twitter). Consid-ering this, researchers should pay attention to the data distribution,research scope and the bias issues when conducting research in so-cial media. That is to say, when we generalize from social mediadata to social science, we need further take consideration with riskand uncertainty in mind. Second, the trustiness of the social me-dia message should be considered. Geo-tagged social media datais sometimes not trustable because users might fake their GPS. Thecontent needs further verification to be rumors or not should also beconsidered when we are using social media messages. Some robotsor scripts also intentionally post messages or trigger events. Lastly,the privacy issue is always the problem, which is not covered inthis survey. There are many researches covering the privacy issues[MLC∗13, Geo06, KM06]. In short, these are the both challengesand opportunities to use visual analytics to solve problems with so-cial media data.
5.2. Network Researches Evolution in Social Media
We can find an interesting evolutionary patterns of social mediavisualization, especially in social network visualization. In the be-ginning, researchers focused on social network visualization, ap-plying the existing techniques to analyze the follower networks insocial media [HB05] (Figure 4a). In the next stage, more and moresocial events were discussed on Twitter, etc. Researchers paid at-tention to the information diffusion process visualization and anal-ysis [RZW∗14,CCW∗16] (Figure 4d, e). Research in follower net-work visualization became less and the commercial tools analyzingsuch networks increased. We can see that the research in this areabecomes mature and transfers into commercial products.
We also observe the trend that analyzing the information diffu-sion and reposting behaviors with semantic information [CCW∗16,WLC∗16] is still an active theme recently. Different perspectives,including ego-centric analysis [CCW∗16], community-level anal-ysis [SWL∗14] and topic-evolution analysis [WLY∗14], etc, havebeen investigated. In-depth social event analysis, regarding the dif-fusion network, will obtain further attention. Moreover, the diffu-sion network is correlated with the follower network in social me-dia. People are likely to repost friends’ messages and also tend to
follow the people that share similar opinions. Analyzing how in-formation diffuses among the follower network will enable users tobetter understand the information diffusion process. However, wehaven’t seen too many papers addressing this topic.
Compared with other networks, e.g. citation networks [MGF12,vEW14], social network in social media are different in both datacharacteristics and analytical requirement. A citation network isacyclic and with time information. Both citation networks and so-cial networks in social media are dynamic and face the challengesin dynamic network visual analysis, such as analyzing the evolutionof dynamic graph [BBDW14]. For the networks in social media,the diffusion network has the same acyclic constraints (multi-treestructure). While the follower network and reposting network donot have such constraints. The other difference is that the socialnetwork in social media has strong temporal features, e.g. burstingcharacteristics, fast-dying features, a large amount of users for sig-nificant events, multi-variate entities, etc. The analytical tasks canby either exploring the intrinsic patterns or help other research withsocial media data.
5.3. New perspectives of Semantic Movement Analysis
Visualizing geo-tagged messages on the map is a common ap-proach for users to identify the keywords distribution [CTJ∗14](Figure 5c). One step further, researchers investigate how to un-derstand the event distribution with advanced classification and in-teractions [TBK∗12, BTH∗13, CCJ∗15]. One trend we observe isfrom Krueger [KTE15]. They use the geo-tagged social media datato enrich other movement datasets, such as car trajectories, help-ing users to better understand the semantic of the movement. Be-sides, analyzing sparsely sampled trajectories, defined as episodicmovement [AAS∗12], is also a potential topic. It is fruitful to in-vestigate aggregated movement patterns by promptly dealing withuncertainties. But the uncertainties problems are not fully solvedby the current solutions, e.g., especially the inner-city trajectoriesanalysis [CYW∗16] (Figure 12a). From the application perspective,e.g. in tourism application, there are large demands on analyzingpeople’s movement based on social media, because analysts fromtoursim domain not only want to know the moving paths of thetourists but also want to gain ideas of their thoughts and commentson the journey. Visual analytics is helpful to improve tourists’ vis-iting paths and the settings of the places of interest.
5.4. Text: Diverse Visual Design and Analytical Reasoning
The river-based visual metaphor is a good design choice to vi-sualize dynamic text, topics, and sentiment. A series of interest-ing works have been conducted with river-based visual metaphorin dynamic topic evolution [XWW∗13, WLY∗14, SWL∗14], hier-archical topic analysis [DYW∗13, CLWW14] and semantic anal-ysis [ZGWZ14, SDB∗15], etc. (Figure 6). Though intuitive, theriver-based visual metaphor has its shortcomings. One importantissue is that it restricts other information, e.g. text, relationship,geo-information, etc., into one dimension because the other di-mension is time. Circular visual design [CLS∗12] (Figure 5a) andmap-based projection (Figure 4e, f) might partially solve the prob-lem [GHN13, LWW∗13, CCW∗16, CSL∗16]. Liu et al. project all
c© 2017 The Author(s)Computer Graphics Forum c© 2017 The Eurographics Association and John Wiley & Sons Ltd.
582
S. Chen, L. Lin & X. Yuan / Social Media Visual Analytics Survey
the tweets onto a map based on the topics [LWW∗13]. It makesgood use of space to illustrate the correlations of topics and dy-namically update layout based on time. However, with these ap-proaches, the time dimension is implicit and only animation mightnot be enough to present the temporal variation. From this point,a variety of visual design can be combined to further represent thecomplex dynamic features of textual and relational information inthe future. Moreover, real-time streaming data sources might becommon data source recently [BTH∗13]. Thus, designing a scal-able and progressive visual analytics system targeting this featureis also important. It requires conquering the difficulties in real timecomputing, visual design and dynamic interactions.
We summarize three levels to analyze the text content. How-ever, the gap between keywords/topics and the actual contents ofmessages is still large. Existing works try to analyze the contentin two ways. First, the summarized keywords and topics provideabstracted semantic information derived from the contents. It is de-fined as important information. Second, researchers provide sum-marized keywords and topics as filters and users can select relatedcontents to investigate the raw data. However, there are still gaps tofully understand all the content information, which is restricted bycurrent visual analytics and NLP (Natural Language Process) tech-niques. Currently, we still do not have sufficient control to investi-gate all the message contents. Future visual analytics direction canbe providing explorable methods to navigate the content in mul-tiple perspective, rather than only with keywords/topics with highfrequency. Currently, the insight from social media in three cate-gories has been achieved by case studies in many fields. By sum-marizing these cases, we find the current techniques focus on what,when, where and who. However, the most important “Why”, whichindicates the reasons and behaviors led to the results, is usually notfully covered. For example, in event detection, many systems areproposed to detect the event, but not easily identify the exact be-haviors that push forward the event evolution. From this perspec-tive, the works in the future might further conduct the analyticalreasoning with the social media data.
5.5. Heterogeneous Data Visual Analysis
To summarize the heterogeneous data visual analysis in social me-dia, we can summarize three levels.
• Multiple attributes within the same users It involves the com-bination of multiple entities including network, spatial temporalmovement, and topic or sentiment distribution of the same users.It provides multiple perspectives for analyzing people’s behav-iors in social media.
• Enriching the social media with additional information Tobetter understand the social behaviors of users, we might needadditional information. For example, in trajectory analysis of so-cial media, we might need to derive the POI information to fur-ther identify the semantics of the movement.
• Social Media+: Combining social media in multi-discipline
analysis Social media involves the social activities of users. Ithas connections with many disciplines. More than the exampleswe illustrate in the application survey, we believe it can be usedwith multiple application areas, especially large ranges of socialscience and application. Social media users act as the sensors all
over the world capturing and receiving spatial, temporal and tex-tual information. Knowledge derived from social media can helpbetter decision making, which has been proved in many commer-cial tools. Finally, we envision combining both the cyberspaceand physical space within a uniform analytical environment.
5.6. Evaluation of Social Media Visual Analytics
Currently, almost all of the research papers in social media analysisverify their contributions and claims with case studies. In currentstages, many new problems are proposed and solved in a case-by-case manner. There is still no general evaluation rules and guide-lines for social media visual analytics yet. By summarizing thesepapers, we try to identify several key features that a novel socialmedia visual analytics tools should provide. First, targeting usersof the visual analytics platform should be clearly defined. It is dif-ferent between public users and the analysts. Second, how muchscalable of the proposed method, to which extent of data amount itsupports might be evaluated. Third, users have the desired patterns,features or events found by the proposed methods. A theoreticalanalysis and summaries of such desired patterns are encouraged toprovide. It helps to judge the scope, pros, and cons of the proposedmethods.
6. Conclusion
In this survey, we first identify the features of social media data andsummarize the needs and impact on analyzing such data. Amongall the analysis, visual analytics is an important way to derive in-sight with visualization, interaction and data mining techniques. Wesummarize the general research pipeline of social media visual an-alytics and identify nine categories of entities and the correspond-ing visualization techniques with details. Afterward, we discussthe combination of multiple entities with visual analytics servingfor six types of goals. We also derive insights from applications inmultiple disciplines as well as commercial products. By analyzingthese paper, we frame a taxonomy of social media visual analyticsand derive more guidelines for possible future trends.
Acknowledgement
The authors wish to thank the anonymous reviewers for their valu-able suggestions and comments. This work is funded by NSFCNo. 61672055, NSFC Key Project No. 61232012, and the Na-tional Program on Key Basic Research Project (973 Program)No.2015CB352503. This work is also supported by PKU-QihooJoint Data Visual Analytics Research Center.
References
[AAF∗13] ANDRIENKO G. L., ANDRIENKO N. V., FUCHS G., RAI-MOND A. O., SYMANZIK J., ZIEMLICKI C.: Extracting semantics ofindividual places from movement data by analyzing temporal patternsof visits. In Proceedings of The First ACM SIGSPATIAL International
Workshop on Computational Models of Place (2013), COMP ’13, ACM,pp. 9:9–9:16. 7
[AAS∗12] ANDRIENKO N., ANDRIENKO G., STANGE H., LIEBIG T.,HECKER D.: Visual analytics for understanding spatial situations fromepisodic movement data. KI-Künstliche Intelligenz 26, 3 (2012), 241–251. 7, 20
c© 2017 The Author(s)Computer Graphics Forum c© 2017 The Eurographics Association and John Wiley & Sons Ltd.
583
S. Chen, L. Lin & X. Yuan / Social Media Visual Analytics Survey
[AGCH11] ARCHAMBAULT D., GREENE D., CUNNINGHAM P., HUR-LEY N.: Themecrowds: Multiresolution summaries of twitter usage. InProceedings of the 3rd International Workshop on Search and Mining
User-generated Contents (2011), SMUC ’11, ACM, pp. 77–84. 2, 8, 9,17
[Ago24] Agorapulse, [Online; accessed 2017-01-24]. http://www.
agorapulse.com/. 19
[BBD∗12] BEST D. M., BRUCE J. R., DOWSON S. T., LOVE O. J.,MCGRATH L. R.: Web-based visual analytics for social media. Tech.rep., Pacific Northwest National Laboratory (PNNL), Richland, WA(US), 2012. 8, 12, 18
[BBDW14] BECK F., BURCH M., DIEHL S., WEISKOPF D.: The Stateof the Art in Visualizing Dynamic Graphs. In EuroVis - STARs (2014),Borgo R., Maciejewski R., Viola I., (Eds.), The Eurographics Associa-tion. 3, 20
[BBDW16] BECK F., BURCH M., DIEHL S., WEISKOPF D.: A taxon-omy and survey of dynamic graph visualization. Computer Graphics
Forum (2016). 1
[BCD∗10] BEZERIANOS A., CHEVALIER F., DRAGICEVIC P.,ELMQVIST N., FEKETE J.: Graphdice: A system for exploringmultivariate social networks. Computer Graphics Forum 29, 3 (2010),863–872. 4, 11
[BMZ11] BOLLEN J., MAO H., ZENG X.: Twitter mood predicts thestock market. Journal of computational science 2, 1 (2011), 1–8. 18
[BN11] BRANDES U., NICK B.: Asymmetric relations in longitudinalsocial networks. IEEE Transactions on Visualization and Computer
Graphics 17, 12 (2011), 2283–2290. 4, 5
[Bra24a] Brand24, [Online; accessed 2017-01-24]. http://brand24.
com/. 19
[Bra24b] Brandwatch analytics, [Online; accessed 2017-01-24]. http://www.brandwatch.com/brandwatch-analytics/. 19
[BT14] BATRINCA B., TRELEAVEN P. C.: Social media analytics: a sur-vey of techniques, tools and platforms. AI & SOCIETY 30, 1 (2014),89–116. 1
[BTH∗13] BOSCH H., THOM D., HEIMERL F., PÜTTMANN E., KOCH
S., KRÜGER R., WÖRNER M., ERTL T.: Scatterblogs2: Real-timemonitoring of microblog messages through user-guided filtering. IEEE
Transactions on Visualization and Computer Graphics 19 (2013), 2022–2031. 2, 7, 8, 12, 13, 14, 15, 20, 21
[Buf24] Buffer for business, [Online; accessed 2017-01-24]. http://
buffer.com/business/. 19
[Buz24] Buzzsumo, [Online; accessed 2017-01-24]. http://buzzsumo.com/. 19
[CC16] CAO N., CUI W.: Introduction to text visualization. Atlantis
briefs in artificial intelligence 1 (2016). 8
[CCJ∗15] CHAE J., CUI Y., JANG Y., WANG G., MALIK A., EBERT
D. S.: Trajectory-based visual analytics for anomalous human move-ment analysis using social media. The Eurographics Association (2015).7, 11, 13, 14, 15, 20
[CCRS13] CROITORU A., CROOKS A., RADZIKOWSKI J., STEFANIDIS
A.: Geosocial gauge: A system prototype for knowledge discovery fromsocial media. International Journal of Geographical Information Sci-
ence 27 (2013), 2483–2508. 6, 7, 17
[CCW∗16] CHEN S., CHEN S., WANG Z., LIANG J., YUAN X., CAO
N., WU Y.: D-map: Visual analysis of ego-centric information diffusionpatterns in social media. In Proc. of IEEE Visual Analytics Science and
Technology (2016). 5, 6, 11, 12, 13, 16, 20
[CGW14] COOK K. A., GRINSTEIN G. G., WHITING M. A.: The VASTchallenge: history, scope, and outcomes: An introduction to the specialissue. Information Visualization 13, 4 (2014), 301–312. 18
[CLS∗12] CAO N., LIN Y., SUN X., LAZER D., LIU S., QU H.: Whis-per: Tracing the spatiotemporal process of information diffusion in real
time. IEEE Transactions on Visualization and Computer Graphics 18,12 (2012), 2649–2658. 2, 6, 7, 11, 12, 13, 17, 20
[CLWW14] CUI W., LIU S., WU Z., WEI H.: How hierarchical topicsevolve in large text corpora. IEEE Transactions on Visualization and
Computer Graphics 20, 12 (2014), 2281–2290. 8, 13, 17, 20
[CMSVM14] CHUA A., MARCHEGGIANI E., SERVILLO L. A.,VANDE MOERE A.: Flowsampler: Visual analysis of urban flows ingeolocated social media data. In 6th International Conference on Social
Informatics (workshops) (2014). 7, 8, 18
[Cri24] Crimson hexagon, [Online; accessed 2017-01-24]. http://www.crimsonhexagon.com/. 19
[Cro24] Crowdbooster, [Online; accessed 2017-01-24]. http://
crowdbooster.com/. 19
[CSL∗16] CAO N., SHI C., LIN S., LU J., LIN Y.-R., LIN C.-Y.: Tar-getvue: Visual analysis of anomalous user behaviors in online commu-nication systems. IEEE Transactions on Visualization and Computer
Graphics 22, 1 (2016), 280–289. 5, 6, 15, 20
[CTB∗12] CHAE J., THOM D., BOSCH H., JANG Y., MACIEJEWSKI R.,EBERT D. S., ERTL T.: Spatiotemporal social media analytics for ab-normal event detection and examination using seasonal-trend decompo-sition. In IEEE Conference on Visual Analytics Science and Technology
(VAST) (2012), pp. 143–152. 6, 14
[CTJ∗14] CHAE J., THOM D., JANG Y., KIM S., ERTL T., EBERT D. S.:Public behavior response analysis in disaster events utilizing visual ana-lytics of microblog data. Computers & Graphics 38 (2014), 51 – 60. 6,7, 13, 14, 17, 20
[CWL∗14] CUI W., WANG X., LIU S., RICHE N. H., MADHYASTHA
T. M., MA K.-L., GUO B.: Let it flow: A static method for exploringdynamic graphs. In Visualization Symposium (PacificVis), IEEE Paci-
ficVis (2014), pp. 121–128. 5, 6, 18
[CWLY16] CHEN S., WANG Z., LIANG J., YUAN X.: Weibo footprint:A web-based visualization system to analyzing spatial-temporal move-ment of geo-tagged social media users. In Visualization Symposium
(PacificVis), IEEE PacificVis Poster (2016). 11, 13, 18
[CYLH15] CAI H., YANG Y., LI X., HUANG Z.: What are popular:exploring twitter features for event detection, tracking and visualization.In Proceedings of the 23rd ACM international conference on Multimedia
(2015), ACM, pp. 89–98. 19
[Cyt24] Cytoscape, [Online; accessed 2017-01-24]. http://www.
cytoscape.org/. 19
[CYW∗16] CHEN S., YUAN X., WANG Z., GUO C., LIANG J., WANG
Z., ZHANG X. L., ZHANG J.: Interactive visual discovering of move-ment patterns from sparsely sampled geo-tagged social media data. IEEE
Transactions on Visualization and Computer Graphics 22, 1 (Jan 2016),270–279. 2, 6, 7, 8, 11, 12, 13, 14, 18, 20
[CZH∗09] CHI Y., ZHU S., HINO K., GONG Y., ZHANG Y.: iolap:a framework for analyzing the internet, social networks, and other net-worked data. IEEE Transactions on Multimedia 11, 3 (2009), 372–382.4
[DCE∗15] DOU W., CHO I., ELTAYEBY O., CHOO J., WANG X.,RIBARSKY W.: Demographicvis: Analyzing demographic informationbased on user generated content. In IEEE Conference on Visual Analytics
Science and Technology (VAST) (2015), pp. 57–64. 4
[DGWC10] DÖRK M., GRUEN D. M., WILLIAMSON C., CARPEN-DALE M. S. T.: A visual backchannel for large-scale events. IEEE
Transactions on Visualization and Computer Graphics 16, 6 (2010),1129–1138. 8, 12, 17
[Dig24a] Digimind intelligence, [Online; accessed 2017-01-24].http://www.digimind.com/features-intelligence/. 19
[Dig24b] Digimind social, [Online; accessed 2017-01-24]. http://www.digimind.com/features-social/. 19
[DNK10] DIAKOPOULOS N., NAAMAN M., KIVRAN-SWAINE F.: Dia-monds in the rough: Social media visual analytics for journalistic inquiry.
c© 2017 The Author(s)Computer Graphics Forum c© 2017 The Eurographics Association and John Wiley & Sons Ltd.
584
S. Chen, L. Lin & X. Yuan / Social Media Visual Analytics Survey
In IEEE Conference on Visual Analytics Science and Technology (VAST)
(2010), pp. 115–122. 16
[DNYKS11] DIAKOPOULOS N., NAAMAN M., YAZDANI T., KIVRAN-SWAINE F.: Social media visual analytics for events. In Social Media
Modeling and Computing. Springer, 2011, pp. 189–209. 16, 17
[DWS∗12] DOU W., WANG X., SKAU D., RIBARSKY W., ZHOU
M. X.: Leadline: Interactive visual analysis of text data through eventidentification and exploration. In IEEE Conference on Visual Analytics
Science and Technology (VAST) (2012), pp. 93–102. 2, 8, 9, 14, 16, 18
[DYW∗13] DOU W., YU L., WANG X., MA Z., RIBARSKY W.: Hier-archicaltopics: Visually exploring large text collections using topic hier-archies. IEEE Transactions on Visualization and Computer Graphics 19
(2013), 2002–2011. 8, 11, 12, 14, 20
[Eve12] Event, [Online; accessed 2017-04-12]. http://en.wikipedia.org/wiki/Event. 14
[FS14] FISCHER F., STOFFEL F.: NStreamAware: Real-Time Visual An-alytics for Data Streams (VAST Challenge 2014). In IEEE Confer-
ence on Visual Analytics Science and Technology (VAST Challenge 2014
MC3) (2014). Award for Outstanding Comprehensive Submission. 12,17, 18
[Geo06] GEORGE A.: Living online: The end of privacy. New Scientist
2569 (2006), 1–50. 20
[Gep24] Gephi, [Online; accessed 2017-01-24]. http://gephi.org/.18
[GFC05] GHONIEM M., FEKETE J.-D., CASTAGLIOLA P.: On the read-ability of graphs using node-link and matrix-based representations: acontrolled experiment and statistical analysis. Information Visualization
4, 2 (2005), 114–135. 3
[GHFZ13] GUILLE A., HACID H., FAVRE C., ZIGHED D. A.: Informa-tion diffusion in online social networks: a survey. SIGMOD Record 42,2 (2013), 17–28. 1
[GHN13] GANSNER E. R., HU Y., NORTH S. C.: Interactive visual-ization of streaming text data with dynamic maps. J. Graph Algorithms
Appl. 17, 4 (2013), 515–540. 20
[Goo24] Google analytics, [Online; accessed 2017-01-24]. http://www.google.com/analytics/. 18
[HB05] HEER J., BOYD D.: Vizster: Visualizing online social networks.In Information Visualization, 2005. INFOVIS 2005. IEEE Symposium on
(2005), IEEE, pp. 32–39. 3, 5, 6, 20
[HF06] HENRY N., FEKETE J.-D.: Matrixexplorer: a dual-representationsystem to explore social networks. IEEE Transactions on Visualization
and Computer Graphics 12 (2006), 677 –684. 3
[HF07] HENRY N., FEKETE J.-D.: Matlink: Enhanced matrix visualiza-tion for analyzing social networks. In Proc. International Conference on
Human-Computer Interaction (2007), vol. 4663, pp. 288–302. 3, 6, 11
[HFM07] HENRY N., FEKETE J.-D., MCGUFFIN M. J.: Nodetrix: ahybrid visualization of social networks. IEEE Transactions on Visual-
ization and Computer Graphics 13, 6 (2007), 1302–1309. 3, 6, 11
[HHN00] HAVRE S., HETZLER B., NOWELL L.: Themeriver: visualiz-ing theme changes over time. In IEEE Symposium on Information Visu-
alization 2000. INFOVIS 2000. Proceedings (2000), pp. 115–123. 8
[Hoo24] Hootsuite, [Online; accessed 2017-01-24]. http://
hootsuite.com/. 19
[HTA∗15] HUANG D., TORY M., ASENIERO B. A., BARTRAM L.,BATEMAN S., CARPENDALE S., TANG A., WOODBURY R.: Personalvisualization and personal visual analytics. IEEE Transactions on Visu-
alization and Computer Graphics 21 (2015), 420–433. 1
[Hub24] Hubspot, [Online; accessed 2017-01-24]. http://www.
hubspot.com/. 19
[HWS17] HU M., WONGSUPHASAWAT K., STASKO J.: Visualizing so-cial media content with sententree. IEEE Transactions on Visualization
and Computer Graphics PP, 99 (2017), 1–1. 8, 18
[HYZ∗13] HU M., YANG H., ZHOU M. X., GOU L., LI Y., HABER E.:Human-Computer Interaction – INTERACT 2013: 14th IFIP TC 13 In-
ternational Conference, Cape Town, South Africa, September 2-6, 2013,
Proceedings, Part II. Springer Berlin Heidelberg, 2013, ch. Opinion-Blocks: A Crowd-Powered, Self-improving Interactive Visual AnalyticSystem for Understanding Opinion Text, pp. 116–134. 9, 16
[Ico24] Iconosquare, [Online; accessed 2017-01-24]. http://pro.
iconosquare.com/. 18, 19
[KAF∗08] KEIM D., ANDRIENKO G., FEKETE J.-D., GÖRG C.,KOHLHAMMER J., MELANÇON G.: Information visualization.Springer-Verlag, 2008, ch. Visual Analytics: Definition, Process, andChallenges, pp. 154–175. 12
[KEC06] KELLER R., ECKERT C. M., CLARKSON P. J.: Matrices ornode-link diagrams: which visual representation is better for visualisingconnectivity models? Information Visualization 5, 1 (2006), 62–76. 3
[Key24] Keyhole, [Online; accessed 2017-01-24]. http://keyhole.
co/. 19
[KFS∗12] KAVANAUGH A. L., FOX E. A., SHEETZ S. D., YANG S., LI
L. T., SHOEMAKER D. J., NATSEV A., XIE L.: Social media use bygovernment: From the routine to the critical. Government Information
Quarterly 29, 4 (2012), 480–491. 20
[KH10] KAPLAN A. M., HAENLEIN M.: Users of the world, unite! thechallenges and opportunities of social media. Business horizons 53, 1(2010), 59–68. 20
[KK15] KUCHER K., KERREN A.: Text visualization techniques: Taxon-omy, visual survey, and community insights. In Visualization Symposium
(PacificVis), IEEE PacificVis (2015), pp. 117–121. 1
[KKRS13] KEIM D., KRSTAJIC M., ROHRDANTZ C., SCHRECK T.:Real-time visual analytics for text streams. Computer 46, 7 (July 2013),47–55. 1
[Klo24] Klout, [Online; accessed 2017-01-24]. http://klout.com/. 19
[KM06] KORNBLUM J., MARKLEIN M. B.: What you say online couldhaunt you. USA Today 9 (2006), 1A. 20
[KSB∗16] KRUEGER R., SUN G., BECK F., LIANG R., ERTL T.: Trav-eldiff: Visual comparison analytics for massive movement patterns de-rived from twitter. In Visualization Symposium (PacificVis), IEEE Paci-
ficVis (April 2016), pp. 176–183. 7, 11, 13, 18
[KSBK∗15] KUCHER K., SCHAMP-BJEREDE T., KERREN A., PAR-ADIS C., SAHLGREN M.: Visual analysis of online social media toopen up the investigation of stance phenomena. Information Visualiza-
tion (2015). 9
[KTE15] KRUEGER R., THOM D., ERTL T.: Semantic enrichment ofmovement behavior with foursquare: A visual analytics approach. IEEE
Transactions on Visualization and Computer Graphics (2015), 903–915.7, 20
[KWD∗13] KRAFT T., WANG D. X., DELAWDER J., DOU W., YU
L., RIBARSKY W.: Less after-the-fact: Investigative visual analysis ofevents from streaming twitter. In Large-Scale Data Analysis and Visual-
ization (LDAV), 2013 IEEE Symposium on (2013), pp. 95–103. 6, 7, 13,14
[LKT∗14] LU Y., KRÜGER R., THOM D., WANG F., KOCH S., ERTL
T., MACIEJEWSKI R.: Integrating predictive analytics and social media.In IEEE Conference on Visual Analytics Science and Technology (VAST)
(2014), pp. 193–202. 15, 18
[LLZ∗16] LIU M., LIU S., ZHU X., LIAO Q., WEI F., PAN S.: Anuncertainty-aware approach for exploratory microblog retrieval. IEEE
Transactions on Visualization and Computer Graphics 22 (2016), 250–259. 8, 17
[LQC∗13] LI Q., QU H., CHEN L., WANG R., YONG J., SI D.: Visualanalysis of retweeting propagation network in a microblogging platform.In Proceedings of the 6th International Symposium on Visual Informa-
tion Communication and Interaction (2013), VINCI ’13, ACM, pp. 44–53. 4, 14
c© 2017 The Author(s)Computer Graphics Forum c© 2017 The Eurographics Association and John Wiley & Sons Ltd.
585
S. Chen, L. Lin & X. Yuan / Social Media Visual Analytics Survey
[LSKG14] LIU Y., SUI Z., KANG C., GAO Y.: Uncovering patterns ofinter-urban trip and spatial interaction from social media check-in data.PLoS ONE 9, 1 (2014), e86026. 7, 11
[LWC∗14] LIU Z., WANG Z., CHEN S., WANG Z., MIAO Z., YUAN
X.: A platform for collaborative visual analysis on streaming messages.In IEEE Conference on Visual Analytics Science and Technology (VAST)
(2014), pp. 375–376. 17, 18
[LWM14] LU Y., WANG F., MACIEJEWSKI R.: Business intelligencefrom social media: A study from the vast box office challenge. IEEE
Computer Graphics and Applications 34 (2014), 58–69. 14, 15, 18
[LWW∗13] LIU S., WU Y., WEI E., LIU M., LIU Y.: Storyflow: Track-ing the evolution of stories. IEEE Transactions on Visualization and
Computer Graphics (Proceedings of IEEE InfoVis 2013 19, 12 (2013),2436–2445. 20, 21
[LWYZ15] LIU Y., WANG C., YE P., ZHANG K.: Analysis of micro-blog diffusion using a dynamic fluid model. Journal of Visualization 18,2 (2015), 201–219. 4
[LXG∗16] LIU X., XU A., GOU L., LIU H., AKKIRAJU R., SHEN H.-W.: Socialbrands: Visual analysis of public perceptions of brands onsocial media. In Visual Analytics Science and Technology (VAST), 2016
IEEE Conference on (2016), IEEE, pp. 71–80. 9
[LYW∗16] LIU S., YIN J., WANG X., CUI W., CAO K., PEI J.: Onlinevisual analytics of text streams. IEEE transactions on visualization and
computer graphics 22, 11 (2016), 2451–2466. 8
[MBB∗11] MARCUS A., BERNSTEIN M. S., BADAR O., KARGER
D. R., MADDEN S., MILLER R. C.: Twitinfo: Aggregating and visu-alizing microblogs for event exploration. In Proceedings of the SIGCHI
Conference on Human Factors in Computing Systems (2011), CHI ’11,ACM, pp. 227–236. 14, 18
[MGF12] MATEJKA J., GROSSMAN T., FITZMAURICE G.: Citeology:visualizing paper genealogy. In CHI’12 Extended Abstracts on Human
Factors in Computing Systems (2012), ACM, pp. 181–190. 20
[MGMZ14] MUELDER C., GOU L., MA K.-L., ZHOU M. X.: Multi-variate social network visual analytics. In Multivariate Network Visual-
ization. Springer, 2014, pp. 37–59. 1
[MJG∗14] MCKENZIE G., JANOWICZ K., GAO S., YANG J.-A., HU Y.:Poi pulse: A multi-granular, semantic signatures-based approach for theinteractive visualization of big geosocial data. Cartographica (2014). 7,13, 18
[MJR∗11] MACEACHREN A. M., JAISWAL A., ROBINSON A. C.,PEZANOWSKI S., SAVELYEV A., MITRA P., ZHANG X., BLANFORD
J.: Senseplace2: Geotwitter analytics support for situational awareness.In IEEE Conference on Visual Analytics Science and Technology (VAST)
(2011), pp. 181–190. 6, 11, 12, 15
[MLC∗13] MADDEN M., LENHART A., CORTESI S., GASSER U.,DUGGAN M., SMITH A., BEATON M.: Teens, social media, and pri-vacy. Pew Research Center 21 (2013), 2–86. 20
[MRJ∗11] MACEACHREN A. M., ROBINSON A. C., JAISWAL A.,PEZANOWSKI S., SAVELYEV A., BLANFORD J., MITRA P.: Geo-twitter analytics: Applications in crisis management. Proceedings, 25th
International Cartographic Conference (2011). 2, 6, 18
[Net24] Netlytic, [Online; accessed 2017-01-24]. http://netlytic.
org/. 19
[NFL∗14] NIU G., FAN X., LI V. O., LONG Y., XU K.: Multi-source-driven asynchronous diffusion model for video-sharing in online socialnetworks. IEEE Transactions on Multimedia 16, 7 (2014), 2025–2037.19, 20
[PHE∗15] PRIETO D. F., HAGEN E., ENGEL D., BAYER D., HERNÁN-DEZ J. T., GARTH C., SCHELER I.: Visual exploration of location-based social networks data in urban planning. In Visualization Sympo-
sium (PacificVis), IEEE PacificVis (2015), pp. 123–127. 7, 18
[PJZ∗15] PANG J., JIA F., ZHANG C., ZHANG W., HUANG Q., YIN
B.: Unsupervised web topic detection using a ranked clustering-like
pattern across similarity cascades. IEEE Transactions on Multimedia
17, 6 (2015), 843–853. 19
[Plu01] PLUTCHIK R.: The nature of emotions human emotions havedeep evolutionary roots, a fact that may explain their complexity andprovide tools for clinical practice. American Scientist 89, 4 (2001), 344–350. 9
[PP11] PENNACCHIOTTI M., POPESCU A.: A machine learning ap-proach to twitter user classification. In Proceedings of the Fifth Interna-
tional Conference on Weblogs and Social Media, Barcelona, Catalonia,
Spain, July 17-21, 2011 (2011). 1
[QZXS16] QIAN S., ZHANG T., XU C., SHAO J.: Multi-modal eventtopic model for social event analysis. IEEE Transactions on Multimedia
18, 2 (2016), 233–246. 19, 20
[RHD∗12] ROHRDANTZ C., HAO M. C., DAYAL U., HAUG L.-E.,KEIM D. A.: Feature-based visual sentiment analysis of text docu-ment streams. ACM Transactions on Intelligent Systems and Technology
(TIST) 3, 2 (2012), 26. 9, 15
[RWD14] RIBARSKY W., WANG D. X., DOU W.: Social media an-alytics for competitive advantage. Computers & Graphics 38 (2014),328–331. 8, 18
[RZW∗14] REN D., ZHANG X., WANG Z., LI J., YUAN X.: Wei-boevents: A crowd sourcing weibo visual analytic system. In Visualiza-
tion Symposium (PacificVis), IEEE PacificVis Notes (2014), pp. 330–334.4, 5, 6, 11, 16, 20
[SDB∗15] STEED C. A., DROUHARD M., BEAVER J., PYLE J., BO-GEN P. L.: Matisse: A visual analytics system for exploring emotiontrends in social media text streams. In Big Data (Big Data), 2015 IEEE
International Conference on (2015), pp. 807–814. 9, 14, 15, 20
[SK13] SCHRECK T., KEIM D. A.: Visual analysis of social media data.IEEE Computer 46, 5 (2013), 68–75. 1
[SMER06] SHEN Z., MA K.-L., ELIASSI-RAD T.: Visual analysis oflarge heterogeneous social networks by semantic and structural abstrac-tion. IEEE Transactions on Visualization and Computer Graphics 12, 6(2006), 1427–1439. 3
[Soc24a] Socioviz, [Online; accessed 2017-01-24]. http://socioviz.
net/. 18, 19
[Soc24b] Socnetv, [Online; accessed 2017-01-24]. http://socnetv.
org/. 19
[Spr24] Sprout social, [Online; accessed 2017-01-24]. http://
sproutsocial.com/. 19
[SSMF∗09] SMITH M. A., SHNEIDERMAN B., MILIC-FRAYLING N.,MENDES RODRIGUES E., BARASH V., DUNNE C., CAPONE T.,PERER A., GLEAVE E.: Analyzing social media networks with nodexl.In Proceedings of the Fourth International Conference on Communities
and Technologies (2009), ACM, pp. 255–264. 3
[SWL∗14] SUN G., WU Y., LIU S., PENG T.-Q., ZHU J., LIANG R.:Evoriver: Visual analysis of topic coopetition on social media. IEEE
Transactions on Visualization and Computer Graphics 20 (2014), 1753–1762. 9, 11, 12, 13, 16, 17, 20
[Syn24] Synthesio, [Online; accessed 2017-01-24]. http://www.
synthesio.com/. 19
[Sys24] Sysomos, [Online; accessed 2017-01-24]. http://sysomos.
com/. 19
[Tai24] Tailwind, [Online; accessed 2017-01-24]. http://www.
tailwindapp.com/. 19
[Tal24] Talkwalker, [Online; accessed 2017-01-24]. http://www.
talkwalker.com/. 19
[TBK∗12] THOM D., BOSCH H., KOCH S., WORNER M., ERTL T.:Spatiotemporal anomaly detection through visual analysis of geolocatedtwitter messages. In Visualization Symposium (PacificVis), IEEE Paci-
ficVis (2012), pp. 41–48. 7, 11, 13, 15, 20
c© 2017 The Author(s)Computer Graphics Forum c© 2017 The Eurographics Association and John Wiley & Sons Ltd.
586
S. Chen, L. Lin & X. Yuan / Social Media Visual Analytics Survey
[TC05] THOMAS J. J., COOK K. A. (Eds.): Illuminating the Path: The
Research and Development Agenda for Visual Analytics. IEEE ComputerSociety, 2005. 12, 15
[TKE∗15] THOM D., KRUGER R., ERTL T., BECHSTEDT U., PLATZ
A., ZISGEN J., VOLLAND B.: Can twitter really save your life a casestudy of visual social media analytics for situation awareness. In Visual-
ization Symposium (PacificVis), IEEE PacificVis (2015), pp. 183–190. 7,12, 13, 15
[TSWY09] TANG J., SUN J., WANG C., YANG Z.: Social influence anal-ysis in large-scale networks. In Proceedings of the 15th ACM SIGKDD
International Conference on Knowledge Discovery and Data Mining
(2009), KDD ’09, ACM, pp. 807–816. 1
[VBW15] VEHLOW C., BECK F., WEISKOPF D.: The stateof the art in visualizing group structures in graphs. pp. 021–040. http://diglib.eg.org/bitstream/handle/10.2312/
eurovisstar.20151110.021-040/021-040.pdf?sequence=1. 1
[vEW14] VAN ECK N. J., WALTMAN L.: Citnetexplorer: A new soft-ware tool for analyzing and visualizing citation networks. Journal of
Informetrics 8, 4 (2014), 802–823. 20
[VWF09] VIEGAS F. B., WATTENBERG M., FEINBERG J.: Participa-tory visualization with wordle. IEEE Transactions on Visualization and
Computer Graphics 15 (2009), 1137–1144. 8
[VWH∗13] VIÉGAS F., WATTENBERG M., HEBERT J., BORGGAARD
G., CICHOWLAS A., FEINBERG J., ORWANT J., WREN C.:Google+ripples: A native visualization of information flow. In Proceed-
ings of the 22Nd International Conference on World Wide Web (2013),WWW ’13, International World Wide Web Conferences Steering Com-mittee, pp. 1389–1398. 2, 4, 5, 16
[WCG∗16] WU Y., CAO N., GOTZ D., TAN Y.-P., KEIM D. A.: Asurvey on visual analytics of social media data. IEEE Transactions on
Multimedia 18 (2016), 2135–2148. 1, 20
[WDM∗12] WANG X., DOU W., MA Z., VILLALOBOS J., CHEN Y.,KRAFT T., RIBARSKY W.: I-si: Scalable architecture for analyzing la-tent topical-level information from social media data. Computer Graph-
ics Forum 31 (2012), 1275–1284. 8, 17
[WHMW11] WU S., HOFMAN J. M., MASON W. A., WATTS D. J.:Who says what to whom on twitter. In Proceedings of the 20th Interna-
tional Conference on World Wide Web, WWW 2011 (2011), pp. 705–714.2
[WJS∗16] WANNER F., JENTNER W., SCHRECK T., STOFFEL A.,SHARALIEVA L., KEIM D. A.: Integrated visual analysis of patternsin time series and text data-workflow and application to financial dataanalysis. Information Visualization 15, 1 (2016), 75–90. 8, 18
[WLC∗16] WANG X., LIU S., CHEN Y., PENG T.-Q., SU J., YANG J.,GUO B.: How ideas flow across multiple social groups. In Proc. of IEEE
Visual Analytics Science and Technology (2016). 5, 6, 10, 11, 13, 14, 20
[WLY∗14] WU Y., LIU S., YAN K., LIU M., WU F.: Opinionflow:Visual analysis of opinion diffusion on social media. IEEE Transactions
on Visualization and Computer Graphics 20, 12 (2014), 1763–1772. 8,9, 11, 17, 20
[WSJ∗14] WANNER F., STOFFEL A., JÄCKLE D., KWON B. C.,WEILER A., KEIM D. A., ISAACS K. E., GIMÉNEZ A., JUSUFI I.,GAMBLIN T., ET AL.: State-of-the-art report of visual analysis for eventdetection in text data streams. In EuroVis - STARs (2014), Borgo R.,Maciejewski R., Viola I., (Eds.), The Eurographics Association. 1
[WZSL14] WU L., ZHI Y., SUI Z., LIU Y.: Intra-urban human mobilityand activity transition: Evidence from social media check-in data. PLoS
ONE 9, 5 (2014), e97010. 7, 15
[XSX∗14] XIA C., SCHWARTZ R., XIE K., KREBS A., LANGDON A.,TING J., NAAMAN M.: Citybeat: Real-time social media visualizationof hyper-local city data. In Proceedings of the companion publication of
the 23rd international conference on World wide web companion (2014),pp. 167–170. 16
[XWW∗13] XU P., WU Y., WEI E., PENG T., LIU S., ZHU J. J. H.,QU H.: Visual analysis of topic competition on social media. IEEE
Transactions on Visualization and Computer Graphics 19, 12 (2013),2012–2021. 8, 9, 11, 12, 20
[YJ15] YEON H., JANG Y.: Predictive visual analytics using topic com-position. In Proceedings of the 8th International Symposium on Visual
Information Communication and Interaction (2015), VINCI ’15, ACM,pp. 1–8. 13, 15
[YWL∗14] YUAN X., WANG Z., LIU Z., GUO C., AI H., REN D.: Visu-alization of social media flows with interactively identified key players.In IEEE Conference on Visual Analytics Science and Technology (VAST)
(2014), IEEE, pp. 291–292. 6
[ZCW∗14] ZHAO J., CAO N., WEN Z., SONG Y., LIN Y., COLLINS C.:Fluxflow: Visual analysis of anomalous information spreading on socialmedia. IEEE Transactions on Visualization and Computer Graphics 20,12 (2014), 1773–1782. 4, 6
[ZGWZ14] ZHAO J., GOU L., WANG F., ZHOU M.: Pearl: An interac-tive visual analytic tool for understanding personal emotion style derivedfrom social media. In IEEE Conference on Visual Analytics Science and
Technology (VAST) (2014), pp. 203–212. 2, 9, 11, 15, 20
[Zhe15] ZHELUDEV I. N.: When can social media lead financial mar-
kets? PhD thesis, UCL (University College London), 2015. 18
[Zhi24] Zhiwei data, [Online; accessed 2017-01-24]. http://www.
zhiweidata.com/. 19
[ZLW13] ZHANG C., LIU Y., WANG C.: Time-space varying visualanalysis of micro-blog sentiment. In Proceedings of the 6th Interna-
tional Symposium on Visual Information Communication and Interaction
(2013), VINCI ’13, ACM, pp. 64–71. 2, 6, 7
[Zoh24] Zoho social, [Online; accessed 2017-01-24]. http://www.
zoho.com/social/. 19
c© 2017 The Author(s)Computer Graphics Forum c© 2017 The Eurographics Association and John Wiley & Sons Ltd.
587
Related Documents