International Journal of Economics, Commerce and Management United Kingdom Vol. II, Issue 8, 2014 Licensed under Creative Common Page 1 http://ijecm.co.uk/ ISSN 2348 0386 SOCIAL FAIRNESS AND SUSTAINABILITY OF ECONOMIC PRODUCTIVITY Mihai, Iris A. West University of Timisoara, Timişoara, Romania [email protected] Abstract Economic productivity is a complex phenomenon that serves to highlight how efficient an economic process is. However, the existing paradigms for measuring productivity are not coherent, presenting us with a heterogeneous concept too scattered to prove significant for the policy makers. In this paper, we focus on the social implications of the economic development in our attempt to design an adequate measuring methodology able to capture the impact of the continuously growing productivity upon the quality of life in the selected countries. The research is based on statistical data provided by EU KLEMS, The World Bank, Eurostat and The New Maddison Project. The countries chosen for the empirical analysis belong to two groups: Baltic countries (Estonia, Latvia and Lithuania) and the Nordic countries (Denmark, Finland and Sweden). The research is based on input-output indexes used to emphasize productivity, together with its social fairness component and its sustainability over time. The fundamental research hypothesis of this paper is whether the current economic productivity, socially adjusted by GINI, is sustainable. The secondary hypothesis is whether high levels of economic productivity represent a strong enough incentive to countervail the limited biocapacity of a country. The empirical analysis will answer both questions, highlighting the importance of the ecological reserves and the importance of addressing productivity also from a social and an environmental perspective, and not only the obsolete economic perspective. Keywords: economic productivity, social fairness, biocapacity, sustainability INTRODUCTION Romania has witnessed more than twenty years of economic growth baring as well the promise of increased standards of living. At the heart of the process stood the productivity as a mark of efficiency, as an identifier of areas of intervention in order to improve the efficiency and also as a determinant for ranking economies based on their performance. The concept of productivity is such a simple one, that is exerts a certain pressure upon researchers to complicate it.

Welcome message from author
This document is posted to help you gain knowledge. Please leave a comment to let me know what you think about it! Share it to your friends and learn new things together.
Transcript

International Journal of Economics, Commerce and Management United Kingdom Vol. II, Issue 8, 2014
Licensed under Creative Common Page 1
http://ijecm.co.uk/ ISSN 2348 0386
SOCIAL FAIRNESS AND SUSTAINABILITY OF ECONOMIC PRODUCTIVITY
Mihai, Iris A.
West University of Timisoara, Timişoara, Romania
Abstract
Economic productivity is a complex phenomenon that serves to highlight how efficient an
economic process is. However, the existing paradigms for measuring productivity are not
coherent, presenting us with a heterogeneous concept too scattered to prove significant for the
policy makers. In this paper, we focus on the social implications of the economic development in
our attempt to design an adequate measuring methodology able to capture the impact of the
continuously growing productivity upon the quality of life in the selected countries. The research
is based on statistical data provided by EU KLEMS, The World Bank, Eurostat and The New
Maddison Project. The countries chosen for the empirical analysis belong to two groups: Baltic
countries (Estonia, Latvia and Lithuania) and the Nordic countries (Denmark, Finland and
Sweden). The research is based on input-output indexes used to emphasize productivity,
together with its social fairness component and its sustainability over time. The fundamental
research hypothesis of this paper is whether the current economic productivity, socially adjusted
by GINI, is sustainable. The secondary hypothesis is whether high levels of economic
productivity represent a strong enough incentive to countervail the limited biocapacity of a
country. The empirical analysis will answer both questions, highlighting the importance of the
ecological reserves and the importance of addressing productivity also from a social and an
environmental perspective, and not only the obsolete economic perspective.
Keywords: economic productivity, social fairness, biocapacity, sustainability
INTRODUCTION
Romania has witnessed more than twenty years of economic growth baring as well the promise
of increased standards of living. At the heart of the process stood the productivity as a mark of
efficiency, as an identifier of areas of intervention in order to improve the efficiency and also as
a determinant for ranking economies based on their performance. The concept of productivity is
such a simple one, that is exerts a certain pressure upon researchers to complicate it.
© Mihai
Licensed under Creative Common Page 2
In this paper we analyze productivity in relation with its capacity to support itself on the long run.
The sustainability of the productivity is explored two fold, first from a social perspective and
secondly from an environmental perspective. For the current research we have chosen to
measure labor productivity as ratio of GNI to the number of people engaged – that is employees
together with self-employed, and the capital productivity as ratio of GNI to the capital
compensation. For the productivity of the analyzed countries we have used the sum of the two,
being aware of the deficit of not considering the other types of inputs: energy, materials, know-
how etc.
The social perspective of the productivity is captured by the use of GINI, which tones
down the productive performance; the higher the GINI, the more important its effect on reducing
the productivity of the country. The environmental perspective is captured by the use of the
biocapacity concept, the ecological footprint of consumption and the relation between them
reflected in the ecological reserve or deficit. The biocapacity of a country reflects its capacity to
produce and store what it produces and the associated wastes. The ecological footprint is
defined as the area used to support a defined population's consumption, including the
absorption of CO2 emissions. The ecological reserve is obtained when a country’s ecological
footprint is smaller than its biocapacity, while the ecological deficit occurs when the ecological
footprint is larger than the biocapacity. Before the era of globalization the ecological deficit was
predominantly an internal issue (except from the noxious emissions that transcended the
country’s borders), but the intensification of international trade and cooperation made possible
the false increase of biocapacity. We say false because this wasn’t really increased, it was just
shifted from one country to another. Even so, this was not enough to cover the expanding needs
of a growing world population, resulting into a huge global ecological deficit. According to the
Global Footprint Network, today humanity uses the equivalent of 1.5 planets to provide the
resources we use and absorb our waste. This means it now takes the Earth one year and six
months to regenerate what we use in a year or, in other words, we have at our disposal
resources to only live 8 moths of a year.
The research hypotheses followed by this paper are: whether the current economic
productivity, socially adjusted by GINI, is sustainable, respectively whether high levels of
economic productivity represent a strong enough incentive to countervail the limited biocapacity
of a country.
LITERATURE REVIEW
In the twentieth century, economists defined productivity as the relationship between the output
produced and the inputs necessary to produce it (Antle & Capalbo, 1988; Manoilescu, 1986).
This definition is attractive in its simplicity because it stands invariable no matter the political
International Journal of Economics, Commerce and Management, United Kingdom
Licensed under Creative Common Page 3
system, social milieu or production apparatus; it captures the efficiency with which the
productive factors are used (Samuelson & Nordhaus, 1995). However, current economic
realities (liberalized and dynamic markets, constantly changing customer preferences, new
structure of production and work, etc.) are leading to a rethinking of the notion of productivity.
Whereas traditionally, productivity is viewed mainly as an efficiency concept, it is now viewed
increasingly as an efficiency and effectiveness concept, effectiveness being how the enterprise
meets the dynamic needs and expectations of customers (Durdyeva et al., 2014). Productivity is
now seen as dependent on the value of the products and services (utility, uniqueness, quality,
convenience, availability etc.) and the efficiency with which they are produced and delivered to
the customers (Tolentini, 2004).
Although productivity does not represent a country's economic prosperity, living
standards and the only measure of competitiveness per se, it has been the most widely
accepted measure for at least the past 20 years (Lall et al., 2002). During the last half of
century, international bodies together with national governments and several activists
mainstreamed the need to approach the environment as the main casualty of the economic
activity. Resource-responsible and environment-friendly, sustainable social development issues
have become hot topics of general interest, that resulted into a bulk of research that has been
concerned about the environmental controls for the impact of conventional total factor
productivity (Jaffe et al., 1995). Traditional methods of measuring productivity take into account
only the desired output, without considering the undesirable outputs, such as CO2 emissions.
Therefore, traditional methods of measuring productivity and productivity growth are telling just
one side of the story (Zhao, 2012).
In economic theory, TFP is measured indirectly. It is the output growth not explicable by
changes in the amount of inputs (often referred to as Solow residual). In economic practice, TFP
is measured by productivity indexes or productivity indicators. Indexes have a multiplicative
form, whereas indicators have additive form (Machek, Hnilica, 2012). Some of the most well-
known methodologies for measuring productivity are the Bennet-Bowley productivity indicator
(Bennet, 1920), Fisher productivity index (Fisher, 1922), Törnqvist productivity index (Törnqvist,
1936). Malmquist productivity index (Caves, Christensen, Diewert, 1982), Hicks-Moorsteen
productivity index (Diewert, 1992) and Luenberger productivity indicator (Chambers, 1996).
In the present day society, built on the three pillars of knowledge, competitiveness and
globalization, productivity is one of the fundamental success factors and that is why it
constitutes a permanent priority intervention for improved results. The improvements of results
can be obtained through various means, but all have limited possibilities: reducing the quantity
of inputs, reducing the wastes, identifying cheaper resources, management techniques,
© Mihai
Licensed under Creative Common Page 4
operations research and many others. However improvement of results needs to address also
the sustainability of the processes that made those results possible.
Correspondingly, such broader conception of productivity calls for a wider set of
indicators to catch and reflect the new elements and parameters involved. Some of these new
parameters are the processes and methods used to improve productivity, sustainable
development and green productivity, better value-chain and supply-chain management, and,
especially, the human factor as key (Durdyeva et al., 2014).
Productivity has been and continues to be one of the most relevant issues from an
economic perspective. The concept has become a priority for the economic growth of
developing countries, because of its contribution to the improvement of the living standards and
the economy as a whole. Furthermore, productivity is not only important for the sector it is
measured, but also because it has the power to influence the productivity of other economic
sectors.
Linking the productivity of countries to their biocapacity and the importance given to
insuring optimal living conditions for their inhabitants through a fair income, captured via the
GINI index, will bring to light a significantly different perspective upon the economic
performances that establish the world hierarchies.
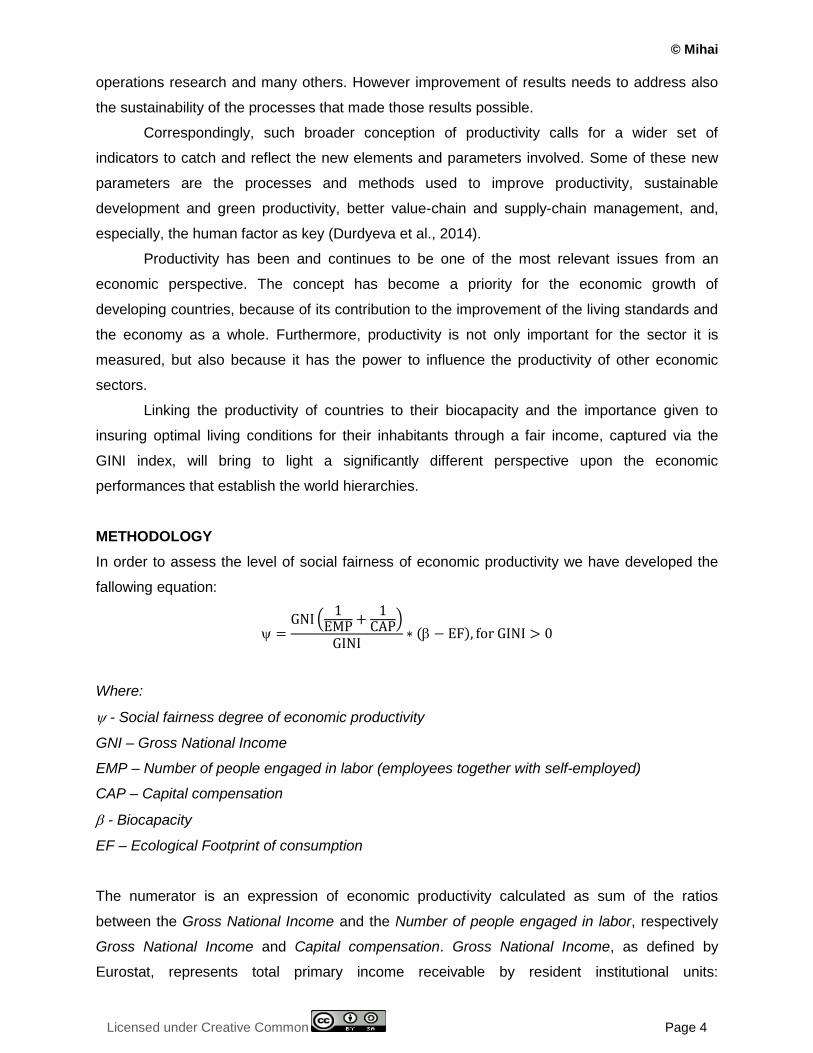
METHODOLOGY
In order to assess the level of social fairness of economic productivity we have developed the
fallowing equation:
=GNI
1EMP
+1
CAP
GINI∗ − EF , for GINI > 0
Where:
- Social fairness degree of economic productivity
GNI – Gross National Income
EMP – Number of people engaged in labor (employees together with self-employed)
CAP – Capital compensation
- Biocapacity
EF – Ecological Footprint of consumption
The numerator is an expression of economic productivity calculated as sum of the ratios
between the Gross National Income and the Number of people engaged in labor, respectively
Gross National Income and Capital compensation. Gross National Income, as defined by
Eurostat, represents total primary income receivable by resident institutional units:
International Journal of Economics, Commerce and Management, United Kingdom
Licensed under Creative Common Page 5
compensation of employees, taxes on production and imports less subsidies, property income
(receivable less payable), gross operating surplus and gross mixed income. It is equal to: GDP
(Gross Domestic Product) + primary incomes receivable from the rest of the world - primary
incomes payable to the rest of the world. Values are seasonally adjusted (SA). The ESA 95
(European System of Accounts) regulation may be referred to for more specific explanations on
methodology. The Number of people engaged in labor the total number of people that have
employment in one country, either as employees or self-employed. Capital compensation is
derived as value added minus labour compensation (VA-LAB).The denominator is an
expression of social fairness captured by GINI.
The sustainability of the economic productivity is captured by the difference between the
country’s Biocapacity and its Ecological Footprint of consumption. Biocapacity or biological
capacity, as defined in the Global Footprint Network Glossary, represents the capacity of
ecosystems to produce useful biological materials and to absorb waste materials generated by
humans, using current management schemes and extraction technologies. “Useful biological
materials” are defined as those demanded by the human economy. Hence what is considered
“useful” can change from year to year (e.g. use of corn (maize) stover for cellulosic ethanol
production would result in corn stover becoming a useful material, and thus increase the
biocapacity of maize cropland). The biocapacity of an area is calculated by multiplying the
actual physical area by the yield factor and the appropriate equivalence factor. Biocapacity is
usually expressed in global hectares. The global hectare (gha) isa productivity weighted area
used to report both the biocapacity of the earth, and the demand on biocapacity (the Ecological
Footprint). The global hectare is normalized to the area-weighted average productivity of
biologically productive land and water in a given year. Because different land types have
different productivity, a global hectare of, for example, cropland, would occupy a smaller
physical area than the much less biologically productive pasture land, as more pasture would be
needed to provide the same biocapacity as one hectare of cropland. Because world
bioproductivity varies slightly from year to year, the value of a gha may change slightly from
year to year. The Ecological Footprint of consumption is defined as the area used to support a
defined population's consumption. The consumption Footprint (in gha) includes the area needed
to produce the materials consumed and the area needed to absorb the carbon dioxide
emissions. The consumption Footprint of a nation is calculated in the National Footprint
Accounts as a nation's primary production Footprint plus the Footprint of imports minus the
Footprint of exports, and is thus, strictly speaking, a Footprint of apparent consumption. The
national average or per capita Consumption Footprint is equal to a country's Consumption
Footprint divided by its population (Global Footprint Network Glossary, 2010).
© Mihai
Licensed under Creative Common Page 6
The difference between the Biocapacity and the Ecological Footprint of consumption can result
either in ecological deficit, when the Ecological Footprint of consumption exceeds the
Biocapacity, either in ecological reserve when the Biocapacity exceeds the Ecological Footprint
of consumption. If there is a regional ecological deficit, it means that the region or the country
imports biocapacity through trade or liquidating regional ecological assets, or emitting wastes
into a global commons such as the atmosphere. In contrast to the national scale, the global
ecological deficit cannot be compensated for through trade, and is therefore equal to overshoot
by definition.
ANALYSIS
For the empirical analysis we have selected two groups of European countries, different in size,
historical background, GNI etc., hoping that we will identify enough overlapping areas to prove
the consistency of the model. The groups are the Baltic countries (Estonia, Latvia and Lithuania)
and the Nordic countries (Denmark, Finland and Sweden). As far as the groups are concerned,
we need to mention that Finland is sometimes considered a Baltic country due to its inclusion in
the Ribbentrop-Molotov Pact during the World War II, but for the purpose of this analysis we felt
it was more appropriate to include it in the Nordic countries group due to the existing similarities
with Denmark and Sweden, much more stronger than those existing between Finland and the
other Baltic countries. We also need to justify the exclusion of Norway, a definitely Northern
country, due to lack of data.
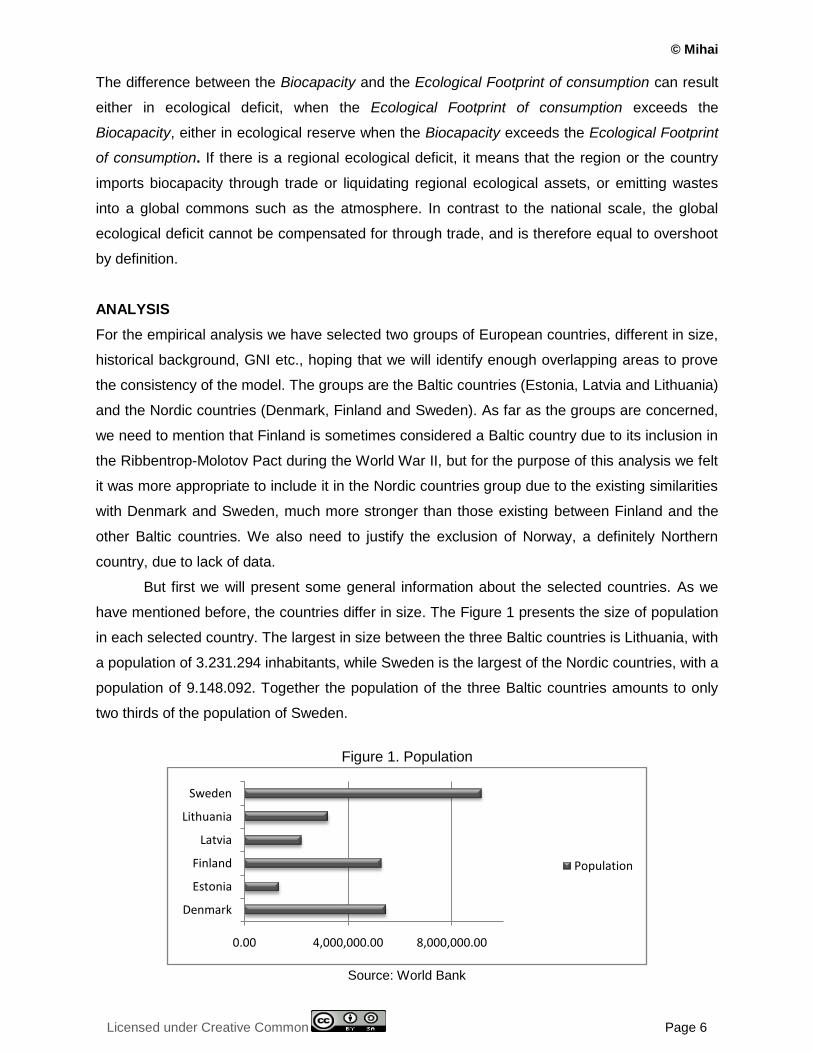
But first we will present some general information about the selected countries. As we
have mentioned before, the countries differ in size. The Figure 1 presents the size of population
in each selected country. The largest in size between the three Baltic countries is Lithuania, with
a population of 3.231.294 inhabitants, while Sweden is the largest of the Nordic countries, with a
population of 9.148.092. Together the population of the three Baltic countries amounts to only
two thirds of the population of Sweden.
Figure 1. Population
Source: World Bank
0.00 4,000,000.00 8,000,000.00
Denmark
Estonia
Finland
Latvia
Lithuania
Sweden
Population
International Journal of Economics, Commerce and Management, United Kingdom
Licensed under Creative Common Page 7
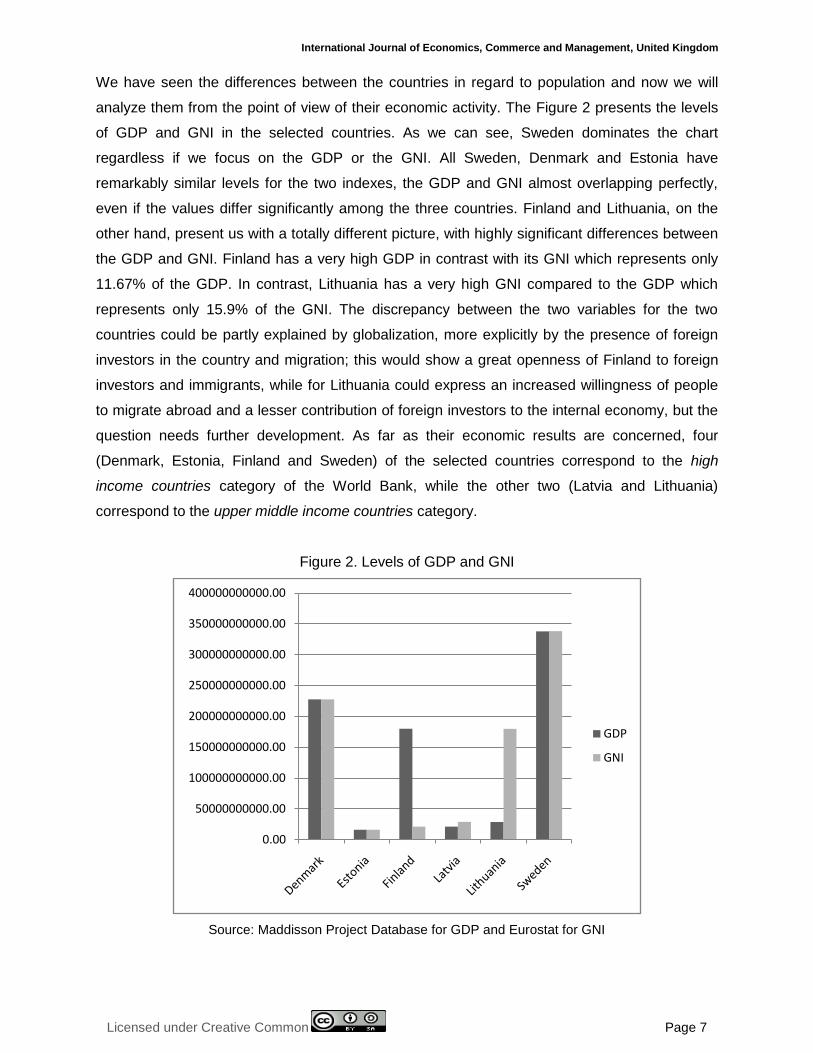
We have seen the differences between the countries in regard to population and now we will
analyze them from the point of view of their economic activity. The Figure 2 presents the levels
of GDP and GNI in the selected countries. As we can see, Sweden dominates the chart
regardless if we focus on the GDP or the GNI. All Sweden, Denmark and Estonia have
remarkably similar levels for the two indexes, the GDP and GNI almost overlapping perfectly,
even if the values differ significantly among the three countries. Finland and Lithuania, on the
other hand, present us with a totally different picture, with highly significant differences between
the GDP and GNI. Finland has a very high GDP in contrast with its GNI which represents only
11.67% of the GDP. In contrast, Lithuania has a very high GNI compared to the GDP which
represents only 15.9% of the GNI. The discrepancy between the two variables for the two
countries could be partly explained by globalization, more explicitly by the presence of foreign
investors in the country and migration; this would show a great openness of Finland to foreign
investors and immigrants, while for Lithuania could express an increased willingness of people
to migrate abroad and a lesser contribution of foreign investors to the internal economy, but the
question needs further development. As far as their economic results are concerned, four
(Denmark, Estonia, Finland and Sweden) of the selected countries correspond to the high
income countries category of the World Bank, while the other two (Latvia and Lithuania)
correspond to the upper middle income countries category.
Figure 2. Levels of GDP and GNI
Source: Maddisson Project Database for GDP and Eurostat for GNI
0.00
50000000000.00
100000000000.00
150000000000.00
200000000000.00
250000000000.00
300000000000.00
350000000000.00
400000000000.00
GDP
GNI
© Mihai
Licensed under Creative Common Page 8
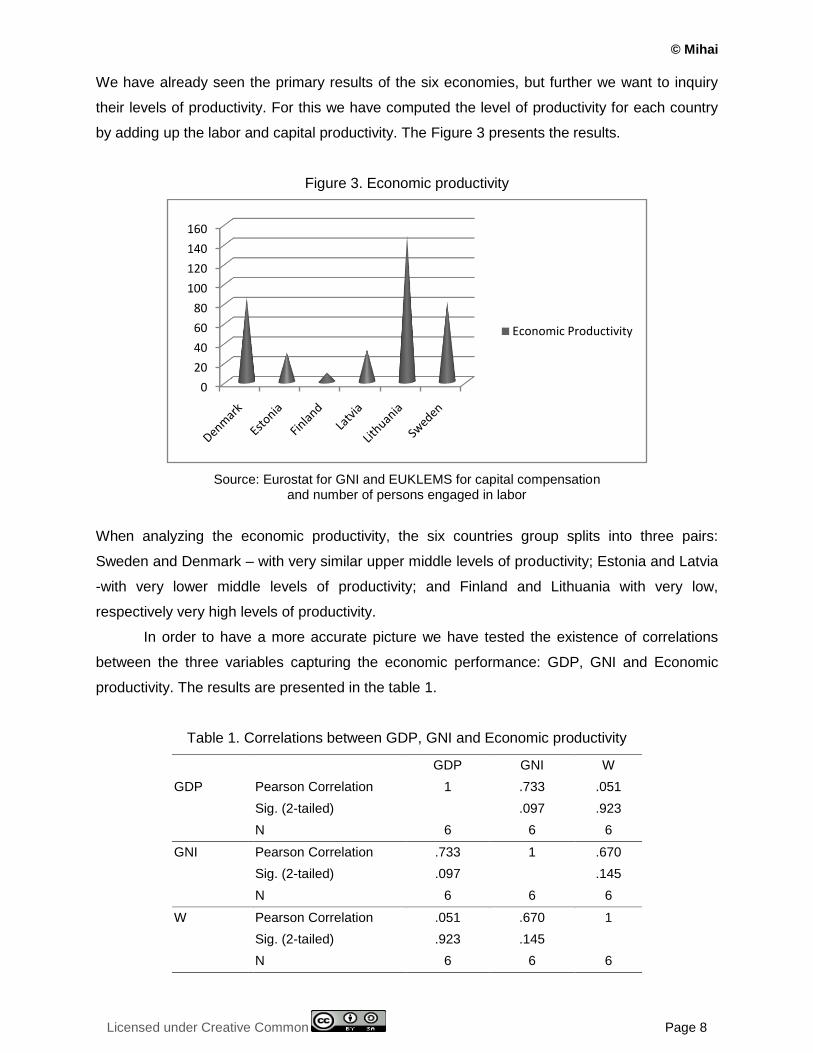
We have already seen the primary results of the six economies, but further we want to inquiry
their levels of productivity. For this we have computed the level of productivity for each country
by adding up the labor and capital productivity. The Figure 3 presents the results.
Figure 3. Economic productivity
Source: Eurostat for GNI and EUKLEMS for capital compensation and number of persons engaged in labor
When analyzing the economic productivity, the six countries group splits into three pairs:
Sweden and Denmark – with very similar upper middle levels of productivity; Estonia and Latvia
-with very lower middle levels of productivity; and Finland and Lithuania with very low,
respectively very high levels of productivity.
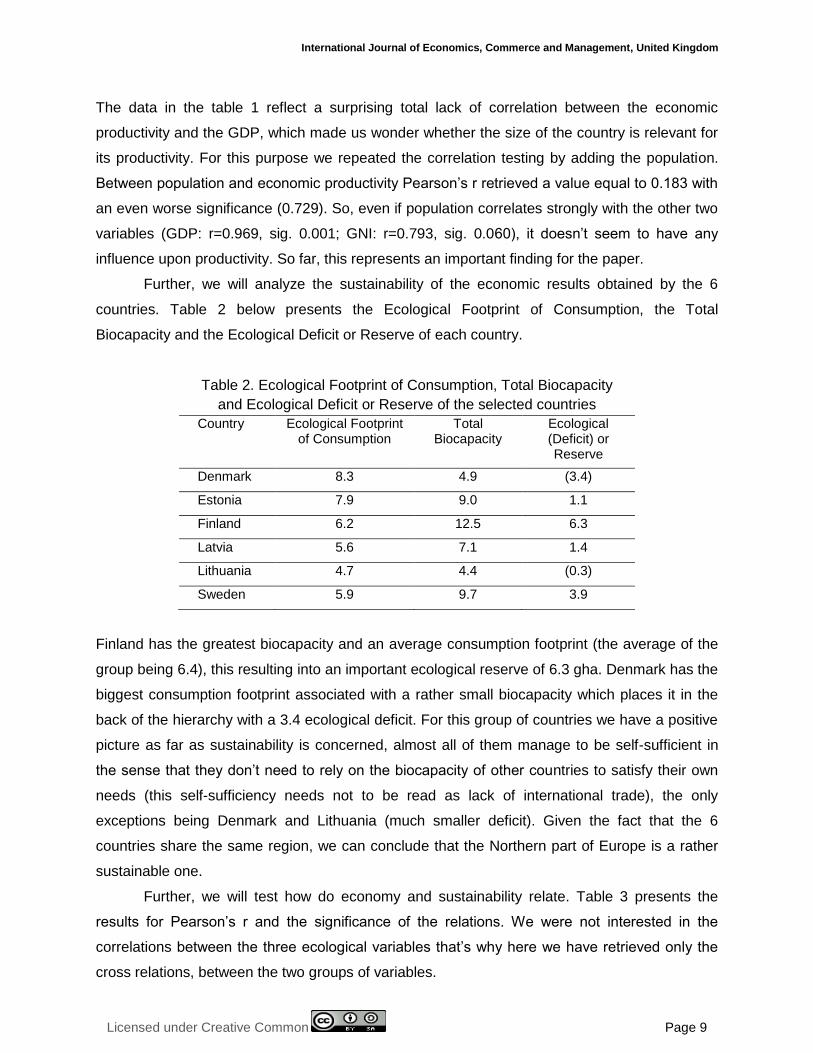
In order to have a more accurate picture we have tested the existence of correlations
between the three variables capturing the economic performance: GDP, GNI and Economic
productivity. The results are presented in the table 1.
Table 1. Correlations between GDP, GNI and Economic productivity
GDP GNI W
GDP Pearson Correlation 1 .733 .051
Sig. (2-tailed) .097 .923
N 6 6 6
GNI Pearson Correlation .733 1 .670
Sig. (2-tailed) .097 .145
N 6 6 6
W Pearson Correlation .051 .670 1
Sig. (2-tailed) .923 .145
N 6 6 6
0
20
40
60
80
100
120
140
160
Economic Productivity
International Journal of Economics, Commerce and Management, United Kingdom
Licensed under Creative Common Page 9
The data in the table 1 reflect a surprising total lack of correlation between the economic
productivity and the GDP, which made us wonder whether the size of the country is relevant for
its productivity. For this purpose we repeated the correlation testing by adding the population.
Between population and economic productivity Pearson’s r retrieved a value equal to 0.183 with
an even worse significance (0.729). So, even if population correlates strongly with the other two
variables (GDP: r=0.969, sig. 0.001; GNI: r=0.793, sig. 0.060), it doesn’t seem to have any
influence upon productivity. So far, this represents an important finding for the paper.
Further, we will analyze the sustainability of the economic results obtained by the 6
countries. Table 2 below presents the Ecological Footprint of Consumption, the Total
Biocapacity and the Ecological Deficit or Reserve of each country.
Table 2. Ecological Footprint of Consumption, Total Biocapacity
and Ecological Deficit or Reserve of the selected countries
Country Ecological Footprint of Consumption
Total Biocapacity
Ecological (Deficit) or Reserve
Denmark 8.3 4.9 (3.4)
Estonia 7.9 9.0 1.1
Finland 6.2 12.5 6.3
Latvia 5.6 7.1 1.4
Lithuania 4.7 4.4 (0.3)
Sweden 5.9 9.7 3.9
Finland has the greatest biocapacity and an average consumption footprint (the average of the
group being 6.4), this resulting into an important ecological reserve of 6.3 gha. Denmark has the
biggest consumption footprint associated with a rather small biocapacity which places it in the
back of the hierarchy with a 3.4 ecological deficit. For this group of countries we have a positive
picture as far as sustainability is concerned, almost all of them manage to be self-sufficient in
the sense that they don’t need to rely on the biocapacity of other countries to satisfy their own
needs (this self-sufficiency needs not to be read as lack of international trade), the only
exceptions being Denmark and Lithuania (much smaller deficit). Given the fact that the 6
countries share the same region, we can conclude that the Northern part of Europe is a rather
sustainable one.
Further, we will test how do economy and sustainability relate. Table 3 presents the
results for Pearson’s r and the significance of the relations. We were not interested in the
correlations between the three ecological variables that’s why here we have retrieved only the
cross relations, between the two groups of variables.
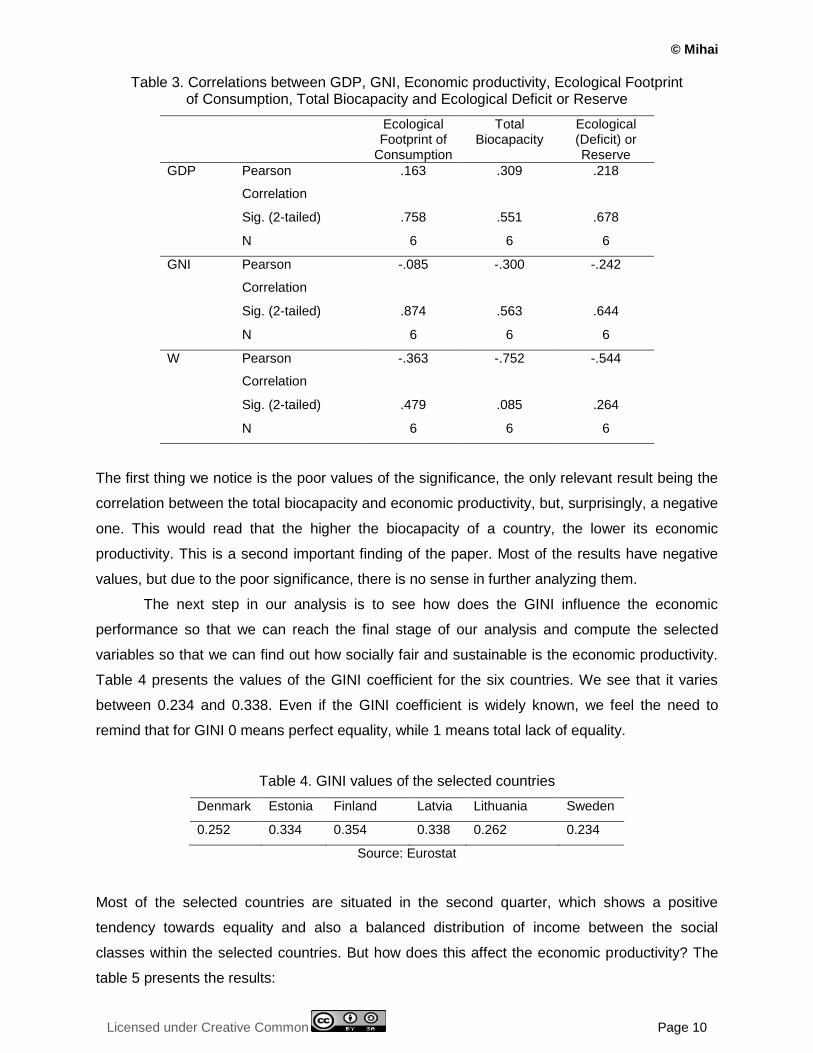
© Mihai
Licensed under Creative Common Page 10
Table 3. Correlations between GDP, GNI, Economic productivity, Ecological Footprint of Consumption, Total Biocapacity and Ecological Deficit or Reserve
Ecological Footprint of
Consumption
Total Biocapacity
Ecological (Deficit) or Reserve
GDP Pearson
Correlation
.163 .309 .218
Sig. (2-tailed) .758 .551 .678
N 6 6 6
GNI Pearson
Correlation
-.085 -.300 -.242
Sig. (2-tailed) .874 .563 .644
N 6 6 6
W Pearson
Correlation
-.363 -.752 -.544
Sig. (2-tailed) .479 .085 .264
N 6 6 6
The first thing we notice is the poor values of the significance, the only relevant result being the
correlation between the total biocapacity and economic productivity, but, surprisingly, a negative
one. This would read that the higher the biocapacity of a country, the lower its economic
productivity. This is a second important finding of the paper. Most of the results have negative
values, but due to the poor significance, there is no sense in further analyzing them.
The next step in our analysis is to see how does the GINI influence the economic
performance so that we can reach the final stage of our analysis and compute the selected
variables so that we can find out how socially fair and sustainable is the economic productivity.
Table 4 presents the values of the GINI coefficient for the six countries. We see that it varies
between 0.234 and 0.338. Even if the GINI coefficient is widely known, we feel the need to
remind that for GINI 0 means perfect equality, while 1 means total lack of equality.
Table 4. GINI values of the selected countries
Denmark Estonia Finland Latvia Lithuania Sweden
0.252 0.334 0.354 0.338 0.262 0.234
Source: Eurostat
Most of the selected countries are situated in the second quarter, which shows a positive
tendency towards equality and also a balanced distribution of income between the social
classes within the selected countries. But how does this affect the economic productivity? The
table 5 presents the results:
International Journal of Economics, Commerce and Management, United Kingdom
Licensed under Creative Common Page 11
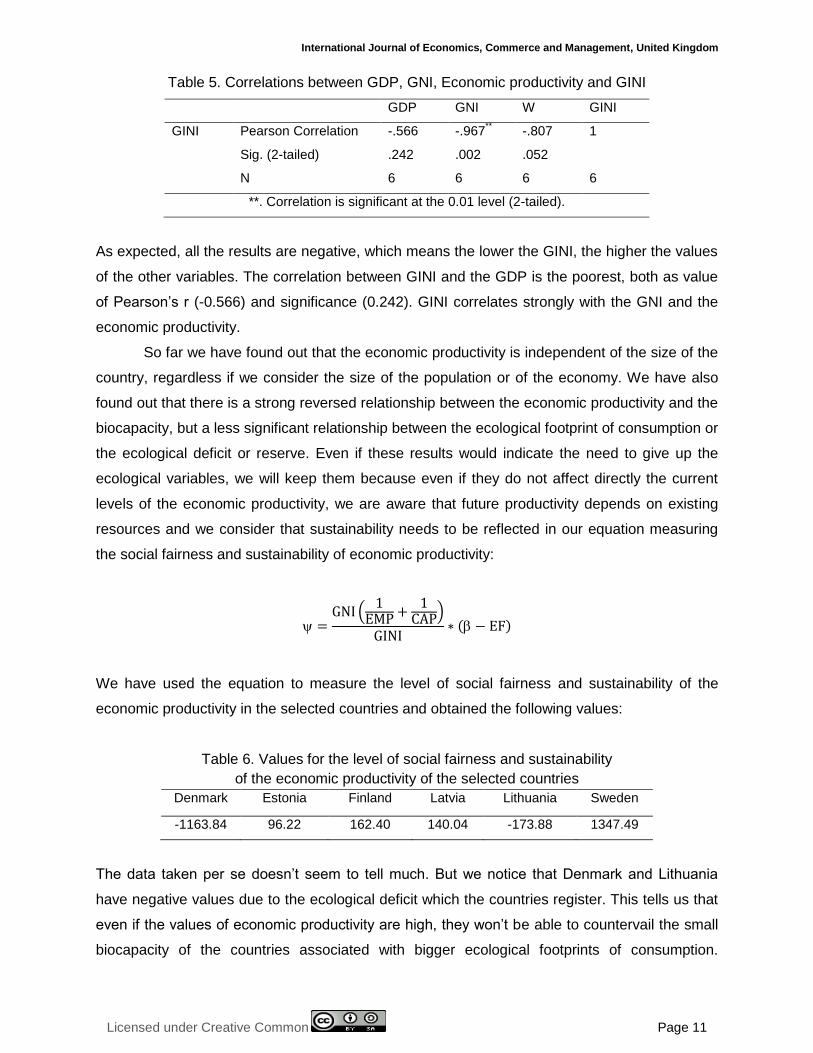
Table 5. Correlations between GDP, GNI, Economic productivity and GINI
GDP GNI W GINI
GINI Pearson Correlation -.566 -.967** -.807 1
Sig. (2-tailed) .242 .002 .052
N 6 6 6 6
**. Correlation is significant at the 0.01 level (2-tailed).
As expected, all the results are negative, which means the lower the GINI, the higher the values
of the other variables. The correlation between GINI and the GDP is the poorest, both as value
of Pearson’s r (-0.566) and significance (0.242). GINI correlates strongly with the GNI and the
economic productivity.
So far we have found out that the economic productivity is independent of the size of the
country, regardless if we consider the size of the population or of the economy. We have also
found out that there is a strong reversed relationship between the economic productivity and the
biocapacity, but a less significant relationship between the ecological footprint of consumption or
the ecological deficit or reserve. Even if these results would indicate the need to give up the
ecological variables, we will keep them because even if they do not affect directly the current
levels of the economic productivity, we are aware that future productivity depends on existing
resources and we consider that sustainability needs to be reflected in our equation measuring
the social fairness and sustainability of economic productivity:
=GNI
1EMP +
1CAP
GINI∗ − EF
We have used the equation to measure the level of social fairness and sustainability of the
economic productivity in the selected countries and obtained the following values:
Table 6. Values for the level of social fairness and sustainability
of the economic productivity of the selected countries
Denmark Estonia Finland Latvia Lithuania Sweden
-1163.84 96.22 162.40 140.04 -173.88 1347.49
The data taken per se doesn’t seem to tell much. But we notice that Denmark and Lithuania
have negative values due to the ecological deficit which the countries register. This tells us that
even if the values of economic productivity are high, they won’t be able to countervail the small
biocapacity of the countries associated with bigger ecological footprints of consumption.
© Mihai
Licensed under Creative Common Page 12
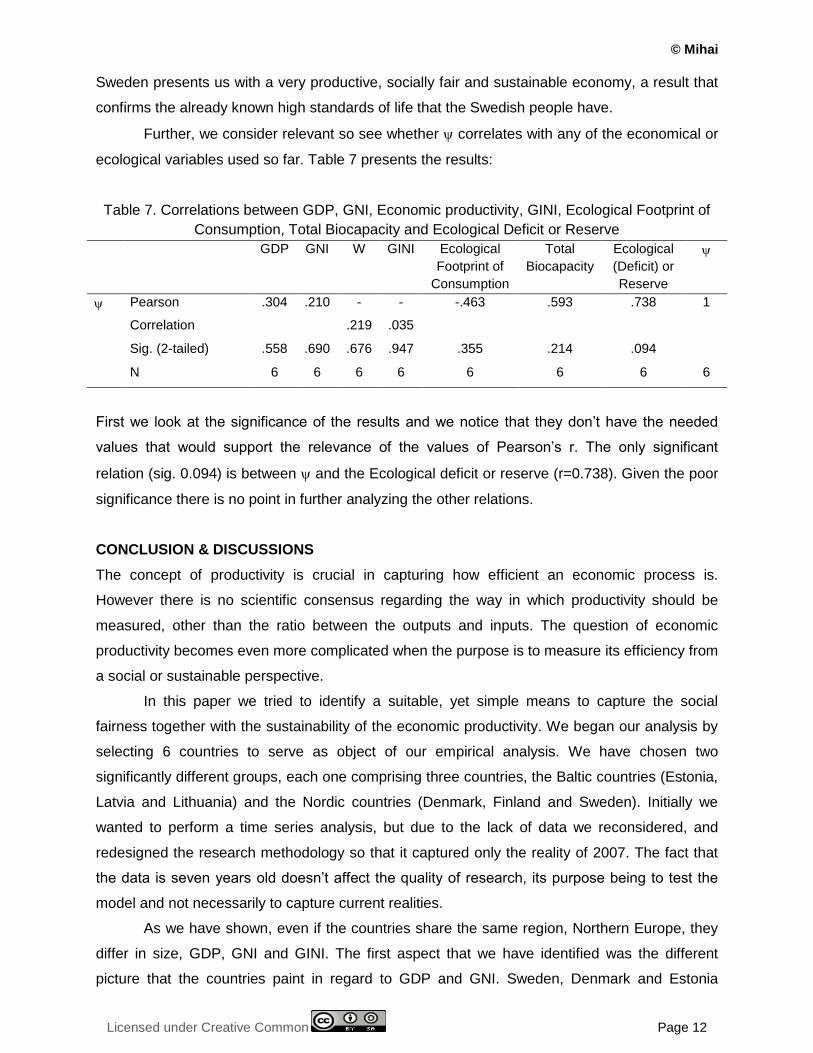
Sweden presents us with a very productive, socially fair and sustainable economy, a result that
confirms the already known high standards of life that the Swedish people have.
Further, we consider relevant so see whether correlates with any of the economical or
ecological variables used so far. Table 7 presents the results:
Table 7. Correlations between GDP, GNI, Economic productivity, GINI, Ecological Footprint of
Consumption, Total Biocapacity and Ecological Deficit or Reserve
GDP GNI W GINI Ecological
Footprint of
Consumption
Total
Biocapacity
Ecological
(Deficit) or
Reserve
Pearson
Correlation
.304 .210 -
.219
-
.035
-.463 .593 .738 1
Sig. (2-tailed) .558 .690 .676 .947 .355 .214 .094
N 6 6 6 6 6 6 6 6
First we look at the significance of the results and we notice that they don’t have the needed
values that would support the relevance of the values of Pearson’s r. The only significant
relation (sig. 0.094) is between and the Ecological deficit or reserve (r=0.738). Given the poor
significance there is no point in further analyzing the other relations.
CONCLUSION & DISCUSSIONS
The concept of productivity is crucial in capturing how efficient an economic process is.
However there is no scientific consensus regarding the way in which productivity should be
measured, other than the ratio between the outputs and inputs. The question of economic
productivity becomes even more complicated when the purpose is to measure its efficiency from
a social or sustainable perspective.
In this paper we tried to identify a suitable, yet simple means to capture the social
fairness together with the sustainability of the economic productivity. We began our analysis by
selecting 6 countries to serve as object of our empirical analysis. We have chosen two
significantly different groups, each one comprising three countries, the Baltic countries (Estonia,
Latvia and Lithuania) and the Nordic countries (Denmark, Finland and Sweden). Initially we
wanted to perform a time series analysis, but due to the lack of data we reconsidered, and
redesigned the research methodology so that it captured only the reality of 2007. The fact that
the data is seven years old doesn’t affect the quality of research, its purpose being to test the
model and not necessarily to capture current realities.
As we have shown, even if the countries share the same region, Northern Europe, they
differ in size, GDP, GNI and GINI. The first aspect that we have identified was the different
picture that the countries paint in regard to GDP and GNI. Sweden, Denmark and Estonia
International Journal of Economics, Commerce and Management, United Kingdom
Licensed under Creative Common Page 13
presented us with remarkably similar levels for the two indexes, the GDP and GNI almost
overlapping perfectly, even if the values differ significantly among the three countries. Finland
and Lithuania, on the other hand, presented us with a totally different picture, with highly
significant differences between the GDP and GNI. Finland has a very high GDP in contrast with
its GNI which represents only 11.67% of the GDP. In contrast, Lithuania has a very high GNI
compared to the GDP which represents only 15.9% of the GNI. The discrepancy between the
two variables for the two countries could be partly explained by globalization, more explicitly by
the presence of foreign investors in the country and migration; this would show a great
openness of Finland to foreign investors and immigrants, while for Lithuania could express an
increased willingness of people to migrate abroad and a lesser contribution of foreign investors
to the internal economy, but the question needs further development.
Next in our analysis we have computed the values for the economic productivity of the
six countries, index that has split the group into three pairs: Sweden and Denmark – with very
similar upper middle levels of productivity; Estonia and Latvia - with very lower middle levels of
productivity; and Finland and Lithuania with very low, respectively very high levels of
productivity. A further step we took was to test the existence of any correlations between the
economic productivity and GDP, respectively GNI. Both correlations proved to be irrelevant, fact
that determined us to test the existence of correlations between population and productivity.
Between population and economic productivity, Pearson’s r retrieved a value equal to 0.183
with a very poor significance (0.729). This has lead us to the first conclusion: size doesn’t
matter, the productivity is independent both of the size of the economy and the size of
population. Further in our analysis we have found out that productivity is independent also of the
biocapacity, in fact the correlation between the economic productivity and biocapacity is a
strong negative one - this would read that the higher the biocapacity of a country, the lower its
economic productivity.
In regard to the social aspect of the analysis, we gathered the values for GINI, which
vary between 0.234 and 0.338. Most of the selected countries are situated in the second
quarter, which shows a positive tendency towards equality and also a balanced distribution of
income between the social classes within the selected countries. As expected, GINI correlated
strongly, but negatively, to the economical variables.
Contrary to our expectations, we have not found significant correlations between the two
classes of variables, economical and ecological, but this can be explained by lags: even if a
country manages to obtain impressive economic performances, these cannot be sustainable in
the long run, unless they are linked to the biocapacity of the country. The hypothesis was
confirmed by the values of . The model retrieved very good results for Sweden which proved
to be the most productive, when productivity was adjusted for social fairness and sustainability.
© Mihai
Licensed under Creative Common Page 14
Denmark, on the other hand, even if it presents high levels of productivity, is not sustainable,
due to the already exceeded biocapacity.
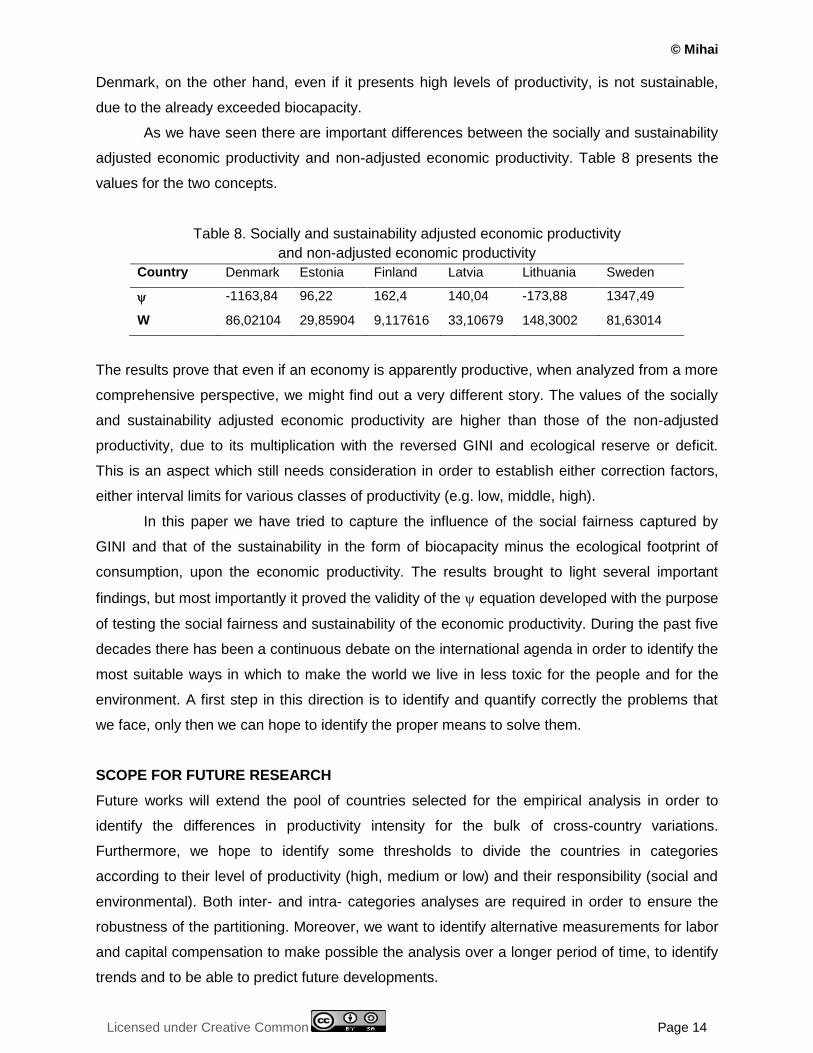
As we have seen there are important differences between the socially and sustainability
adjusted economic productivity and non-adjusted economic productivity. Table 8 presents the
values for the two concepts.
Table 8. Socially and sustainability adjusted economic productivity
and non-adjusted economic productivity
Country Denmark Estonia Finland Latvia Lithuania Sweden
-1163,84 96,22 162,4 140,04 -173,88 1347,49
W 86,02104 29,85904 9,117616 33,10679 148,3002 81,63014
The results prove that even if an economy is apparently productive, when analyzed from a more
comprehensive perspective, we might find out a very different story. The values of the socially
and sustainability adjusted economic productivity are higher than those of the non-adjusted
productivity, due to its multiplication with the reversed GINI and ecological reserve or deficit.
This is an aspect which still needs consideration in order to establish either correction factors,
either interval limits for various classes of productivity (e.g. low, middle, high).
In this paper we have tried to capture the influence of the social fairness captured by
GINI and that of the sustainability in the form of biocapacity minus the ecological footprint of
consumption, upon the economic productivity. The results brought to light several important
findings, but most importantly it proved the validity of the equation developed with the purpose
of testing the social fairness and sustainability of the economic productivity. During the past five
decades there has been a continuous debate on the international agenda in order to identify the
most suitable ways in which to make the world we live in less toxic for the people and for the
environment. A first step in this direction is to identify and quantify correctly the problems that
we face, only then we can hope to identify the proper means to solve them.
SCOPE FOR FUTURE RESEARCH
Future works will extend the pool of countries selected for the empirical analysis in order to
identify the differences in productivity intensity for the bulk of cross-country variations.
Furthermore, we hope to identify some thresholds to divide the countries in categories
according to their level of productivity (high, medium or low) and their responsibility (social and
environmental). Both inter- and intra- categories analyses are required in order to ensure the
robustness of the partitioning. Moreover, we want to identify alternative measurements for labor
and capital compensation to make possible the analysis over a longer period of time, to identify
trends and to be able to predict future developments.
International Journal of Economics, Commerce and Management, United Kingdom
Licensed under Creative Common Page 15
ACKNOWLEDGEMENT
This work was supported by the European Social Fund through Sectorial Operational
Programme Human Resources Development 2007 – 2013, project number
POSDRU/159/1.5/S/142115, project title “Performance and Excellence in Postdoctoral
Research in Romanian Economics Science Domain”.
REFERENCES
Antle, M. J. & Capalbo, S. (1988). An introduction to recent development in production theory and productivity measurement in S. Capalbo & M.J. Antle (Eds.), Agricultural productivity. Measurement and explanation, Washington, DC: Resources for the Future, 17–95.
Bennet, T. L. (1920). The Theory of Measurement of Changes in Cost of Living. Journal of the Royal Statistical Society 1920; 83, 455–462.
Caves D. W, Christensen L. R. & Diewert W. E. (1982). Multilateral Comparisons of Output, Input, and Productivity Using Superlative Index Numbers. Economic Journal 92(365), 73–86.
Chambers, Robert. A New Look at Exact Input, Output, Productivity and Technical Change Measurement, mimeo, Department of Agricultural and Resource Economics, University of Maryland, College Park; 1996 in Machek, O. & Hnilica, J. (2012). Total Factor Productivity Approach in Competitive and Regulated World, Procedia - Social and Behavioral Sciences 57 (2012), 223 – 230.
Diewert, W. E. (1992). Fisher ideal output, input and productivity indexes revisited. Journal of Productivity Analysis 1992; 3, 211–248.
Durdyeva, S., Ihtiyarb, A., Ismailc, S., Ahmadd, F. S. & Bakare, N. A. (2014). Productivity and Service Quality: Factors Affecting in Service Industry, Procedia - Social and Behavioral Sciences 109 (2014), 487 – 491.
Fisher, I. (1922). The Making of Index Numbers;Boston: Houghton-Mifflin.
Global Footprint Network (2010). Glossary, retrieved July 28, 2014, from http://www.footprintnetwork.org/ar/index.php/GFN/page/glossary/
Jaffe, A. B., Peterson, S., Portney, P. & Stavins, R. (1995). Environmental Regulation and the Competitiveness of U.S. Manufacturing:What Does the Evidence Tell Us?, Journal of Economic Literature, 33, 132-163.
Lall, P., Featherstone, A. M. & Norman, D. W. (2002). Productivity growth in the Western Hemisphere (94): the Caribbean in perspective. Journal of Productivity Analysis, 17, 213-231.
Machek, O. & Hnilica, J. (2012). Total Factor Productivity Approach in Competitive and Regulated World, Procedia - Social and Behavioral Sciences 57 (2012), 223 – 230.
Manoilescu, M. (1986). Forţele naţionale productive şi comerţul exterior, Teoria protecţionismului şi a schimbului international; Bucureşti: Editura Ştiinţifică şi Enciclopedică.
Organisation for Economic Co-operation and Devevelopment (OECD) (2001). What services for what society? How should the services provided by financial intermediaries in a modern society be measured?, Paris: STD/NA 13.
Samuelson, P. & Nordhaus, W. (1995). Economics (15th ed.). New York: McGraw-Hill.
Tolentini, A. (2004). New concepts of productivity and its improvement. European productivity network seminar, Budapest.
Törnqvist L. The Bank of Finland's Consumption Price Index. Bank of Finland Monthly Bulletin 1936; 10:1–8 in Machek, O. & Hnilica, J. (2012). Total Factor Productivity Approach in Competitive and Regulated World, Procedia - Social and Behavioral Sciences 57 (2012), 223 – 230.
Zhao, C. (2012). Does Regulation on CO2 Emissions Influence Productivity Growth? The Empirical Test Based on DEA Analysis, Energy Procedia 16 (2012), 667-672
Related Documents