ORIGINAL ARTICLE SOCIAL COSTS OF UNTKEATED OPIOID DEPENDENCE RONALD WALL, PHD, JURGEN REHM, PHD, BENEDIKT FISCHER, PHD, BRUNA BRANDS, PHD, LOUIS GLIKSMAN, PHD, JENNIFER STEWART, PHD, WENDY MEDVED, BA, AND JOAN BLAKE, MSc ABSTRACT Using cost-of-illness methodology applied to a comprehensive survey of 114 daily opiate users not currently in or seeking treatment for their addiction, we estimated the 1996 social costs of untreated opioid dependence in Toronto (Ontario, Canada). The survey collected data on social and demographic characteristics, drug use history, physical and mental health status, the use of health care and substance treatment services, drug use modality and sex-related risks of infectious diseases, sources of income, as well as criminality and involvement with the law enforcement system. The annual social cost generated by this sample, calculated at Canadian $5.086 million, is explained mostly by crime victimization (44.6%) and law enforcement (42.4%), followed by productivity losses (7.0%) and the utilization of health care (6.1%). Applying the $13,100 cost to the estimated 8,000 to 13,000 users and 2.456 million residents living in Toronto yields a range of social cost between $43 and $69 per capita. KEY WORDS Cost of illness, Illicit drugs, Opioid dependence. INTRODUCTION Illicit drug use imposes a substantial burden on Canadian society from the utilization of scarce public sector and personal resources, from the effect of crime From the Social, Prevention, and Health Policy Research Department, Centre for Addic- tion and Mental Health (Drs. Wall, Rehm, Fischer, and Gliksman); Clinical Research Depart- ment, Centre for Addiction and Mental Health (Drs. Wall and Brands, Ms. Blake); Health Systems Research and Consulting Unit, Centre for Addiction and Mental Health (Dr. Wall); Department of Public Health Sciences, University of Applied Science (Hamburg) (Dr. Rehm); Department of Public Health Sciences, University of Toronto (Drs. Rehm and Fischer); Department of Criminology, University of Toronto (Dr. Fischer); Department of Psychiatry, University of Toronto (Dr. Brands); Department of Social Science, The Univer- sity of Western Ontario (Brescia College) (Dr. Gliksman); Department of Economics, Na- tional University of Ireland (Galway) (Dr. Stewart); Family Healthcare Research Centre, Department of Family Medicine, University of Toronto (Ms. Medved); and Ontario Cancer Institute, Princess Margaret Hospital (Ms. Medved). Correspondence: Ronald Wall, Social, Prevention, and Health Policy Research Depart- ment, Centre for Addiction and Mental Health, 100 Collip Circle, Suite 200, London, ON Canada N6G 4X8. (E-maih [email protected]) JOURNAL OF URBAN HEALTH: BULLETIN OF THE NEW YORK ACADEMY OF MEDICINE VOLUME 77, NUMBER 4, DECEMBER 2000 688 ~ 2000 THE NEW YORK ACADEMY OF MEDICINE

Welcome message from author
This document is posted to help you gain knowledge. Please leave a comment to let me know what you think about it! Share it to your friends and learn new things together.
Transcript

O R I G I N A L A R T I C L E
S O C I A L C O S T S OF U N T K E A T E D
O P I O I D D E P E N D E N C E
R O N A L D W A L L , P H D , J U R G E N R E H M , P H D ,
B E N E D I K T F I S C H E R , P H D , B R U N A B R A N D S , P H D ,
L O U I S G L I K S M A N , P H D , J E N N I F E R S T E W A R T , P H D ,
W E N D Y M E D V E D , B A , A N D J O A N B L A K E , M S c
A B S T R A C T Using cost-of-illness methodology applied to a comprehensive survey of 114 daily opiate users not currently in or seeking treatment for their addiction, we estimated the 1996 social costs of untreated opioid dependence in Toronto (Ontario, Canada). The survey collected data on social and demographic characteristics, drug use history, physical and mental health status, the use of health care and substance treatment services, drug use modality and sex-related risks of infectious diseases, sources of income, as well as criminality and involvement with the law enforcement system. The annual social cost generated by this sample, calculated at Canadian $5.086 million, is explained mostly by
crime victimization (44.6%) and law enforcement (42.4%), followed by productivity losses (7.0%) and the utilization of health care (6.1%). Applying the $13,100 cost to the estimated 8,000 to 13,000 users and 2.456 million residents living in Toronto yields a range of social
cost between $43 and $69 per capita.
K E Y W O R D S Cost of illness, Illicit drugs, Opioid dependence.
I N T R O D U C T I O N
Illicit drug use imposes a substantial burden on Canadian society from the
utilization of scarce public sector and personal resources, from the effect of crime
From the Social, Prevention, and Health Policy Research Department, Centre for Addic- tion and Mental Health (Drs. Wall, Rehm, Fischer, and Gliksman); Clinical Research Depart- ment, Centre for Addiction and Mental Health (Drs. Wall and Brands, Ms. Blake); Health Systems Research and Consulting Unit, Centre for Addiction and Mental Health (Dr. Wall); Department of Public Health Sciences, University of Applied Science (Hamburg) (Dr. Rehm); Department of Public Health Sciences, University of Toronto (Drs. Rehm and Fischer); Department of Criminology, University of Toronto (Dr. Fischer); Department of Psychiatry, University of Toronto (Dr. Brands); Department of Social Science, The Univer- sity of Western Ontario (Brescia College) (Dr. Gliksman); Department of Economics, Na- tional University of Ireland (Galway) (Dr. Stewart); Family Healthcare Research Centre, Department of Family Medicine, University of Toronto (Ms. Medved); and Ontario Cancer Institute, Princess Margaret Hospital (Ms. Medved).
Correspondence: Ronald Wall, Social, Prevention, and Health Policy Research Depart- ment, Centre for Addiction and Mental Health, 100 Collip Circle, Suite 200, London, ON Canada N6G 4X8. (E-maih [email protected])
J O U R N A L OF U R B A N H E A L T H : B U L L E T I N OF T H E NEW YORK A C A D E M Y OF M E D I C I N E V O L U M E 77, N U M B E R 4, D E C E M B E R 2 0 0 0 6 8 8 ~ 2 0 0 0 T H E NEW YORK A C A D E M Y OF M E D I C I N E
S O C I A L C O S T S O F U N T R E A T E D O P I O I D D E P E N D E N C E 6 8 9
on its victims (i.e., crime victimization), from productivity losses, and from drug-
related morbidity and premature mortality, which impairs the well-being of users
and affected individuals. 1-3 Cost-of-illness methodology applied to epidemiologic
and administrative data (i.e., top-down analysis 4) estimates the 1992 social cost
of all illicit drug use in Canada at $1.4 billion ($48 per capita or 0.20% of the
gross domestic product [GDP]) 5 and at $489 million in Ontario ($46 per capita
or 0.17% of gross domestic product). 6
While providing valuable insight into the overall economic burden of illicit
drug use, top-down analyses typically
�9 include only costs compiled by clinical and administrative information sys-
tems (e.g., law enforcement expenditures, but not the broader social costs
of crime victimization)
�9 cannot distinguish the harm of specific psychoactive substances (e.g., opi-
oids)
�9 have limited relevance to the subpopulations generating the greatest social
harm (e.g., those dependent on vs. all users of opioids)
�9 include both the hidden population of untreated users and those in treatment
Similarly, bottom-up estimates of the social costs reported by clients entering
treatment (and especially those in therapy) may underestimate the economic
burden generated by the hidden population of untreated opioid users to the
extent that these diverted or self-selected individuals are healthier, avoid risky
drug injection and sex practices, and are better integrated into mainstream society
(i.e., stable housing, greater support, more paid work, less criminal activity).
Although the prevalence of lifetime heroin use in the Province of Ontario
(Canada) remains low (1.1% during 1996), 7 it is associated with disproportionately
high health and social problems. In Vancouver (British Columbia, Canada), over-
dosing on narcotics has become the leading cause of death among young adults,
while the injection of drugs is a leading risk factor of new cases of human
immunodeficiency virus (HIV) and viral hepatitis infections, s In Toronto (Ontario,
Canada), the percentage of drug-related deaths involving heroin has stabilized
at 37%. 9 Heroin-related mortality of 2 per 100,000 residents is comparable to the
rate in Minneapolis/St. Paul, Minnesota, but is less than that in Detroit, Michigan,
and Philadelphia, Pennsylvania. Through its interrelationship with crime, home-
lessness, and concurrent mental disorders, dependence on opioids (i.e., natural
opiates and substances of synthetic origin) generates substantial social harm. s-l~
To inform better the debate on the social harm of untreated opioid dependence,
we estimated the economic burden for Toronto using cost-of-illness methodology

6 9 0 W A L L ET A L .
applied to data derived from a recent survey of a sample of daily users of
natural (opiates) and synthetic origin opioids who were not receiving or seeking
treatment. Although cost-of-illness estimates inform policymaking that is con-
cerned with the allocation of health care resources across competing needs and
they are used in decision-analysis modeling the cost-effectiveness of alternative
interventions, the unique contribution of this bottom-up analysis is the under-
standing gained about the distribution of the economic burden across health care,
law enforcement, and other components of the social harm of opioid dependence.
An assessment of the social harm of untreated opioid dependence needs
to consider four dimensions: harm to physical health, harm to mental health,
intermediate-level harm to personal and social relationships, and broader harm
determined by societal and cultural reaction to drug use. 2~ These dimensions
identify key sources and components of the social cost of illicit substance use.
In considering substance abuse as a chronic health condition, it is important to
distinguish between the harm of single-occasion use versus the progressive dam-
age derived from chronic untreated dependence. An effective intervention re-
duces harm in one or more domains.
Direct physical harm mostly arises from isolated events of opioid overdoses,
with minimal damage occurring from long-term use. Social costs are generated
from the use of health care services, impaired quality of life, and loss of economic
productivity. Over the longer term, however, treatment for opioid dependence
(and concurrent addictions) may be obtained from public or private agencies.
Hazardous behaviors that impair mental functioning place users and others
at risk of harm from accidents in the home, workplace, roadway, and places of
recreation. Such events may require health care and law enforcement interven-
tions, impair quality of life, cause death, and reduce economic productivity.
Substantial personal and social harm occurs from infections (HIV, viral hepati-
tis) from sharing needles and unsafe sex practices. Aside from the high cost of
health care and social services, impaired quality of life, and the loss of economic
activity, substantial out-of-pocket expenses and support from volunteer agencies
may be incurred. Intermediate-level harm from isolated disruption of family
and workplace disruptions and longer term impairment of social and economic
relationships place users and their victims at risk of injury and social isolation.
The user's lifestyle stresses personal relationships. Aside from mental health
effects on users and their families (e.g., depression) from living within the illegal
drug culture, the breakdown of personal relationships from these stresses imposes
financial and other hardships that may require help from relatives and public
agencies. These wider harms may have substantial implications for the use of

S O C I A L C O S T S O F U N T R E A T E D O P I O I D D E P E N D E N C E 6 9 1
health and social services, law enforcement, impaired quality of life, and loss of
economic activity.
Finally, wider social- and cultural-level harm is incurred from criminal and
informal sanctions for drug-related infractions. Depending on the degree that
use is criminalized, the costs to the legal system (police, court, and corrections)
can be high. Moreover, loss of time from productive activities during periods of
incarceration may be high. Also, welfare, public housing, and other social support
resources are employed to compensate for the loss of family income. Substantial
social harm is caused by the social and cultural response to opioid use. For single-
occasion use, criminal controls and sanctions are potentially strong responses to
charges for drug-related crimes. Continuing opioid use increases the risk of arrest
and, for repeat offenders, the severity of punishment. Engaging in criminal careers
diverts users from engaging in productive (legal) economic activities. Convicted
users face stigmatization and discrimination that limits their ability to (re)enter
the formal economy. To the extent that opioid use and possession are prosecuted
strongly and crimes are committed to purchase drugs, the stigma of being labeled
a user and the implications of a criminal record ensure a continuing cycle of
social harm.
Although the effect on others and the wider social and cultural harm bearing
on users are important, we lack the data to measure, to value, and to attribute
these costs to opioid use. Therefore, in this analysis, we focused more narrowly
on the social costs of the health care, criminality, and productivity implications
of untreated dependence.
There are a number of methodological issues that analysts must consider
when estimating the social costs of untreated opioid dependence. These include
identifying, measuring, and valuing health care and other resources consumed
by drug users, assigning monetary value to foregone economic production from
drug-related morbidity and premature mortality, and quantifying the link be-
tween drug use and social costs. In our analysis, the recommendations of the
international guidelines for estimating the social costs of substance abuse u and
the national standards for calculating the cost of health care services 12 were
followed.
Although the identification, measurement, and valuation of the consumption
of social resources are straightforward conceptually, the accuracy and compre-
hensiveness of analysis are limited to the data used. Population-based data
sources are convenient, but important items are omitted, and the findings may
not generalize to certain subgroups (e.g., dependent opioid users). Of particular
importance for illicit substance use is that the cost of criminal activity compiled

6 9 2 W A L L ET A L .
by law enforcement information system is underestimated by the omission of
the costs of crime victimization) 3-Is Secondary analysis of survey data, however
comprehensive, must also consider methodological issues and data limitations.
The controversy over the inclusion of out-of-pocket expenditures made by
the victims of crime and the human capital estimate of productivity losses is
particularly important, but the continuing debate offers little concrete guidance
to analysts. The handling of stolen property in economic analysis is controversial,
with methods and empirical publications taking opposing positions) s-2s For exam-
ple, the recent bottom-up National Treatment Outcome Research Study (NTORS)
excluded productivity losses, but used the net (i.e., uncompensated) out-of-pocket
expense to households and gross losses to retailers to estimate the lower bound
of the victim costs of property crime. 2s Similarly, the recent publication of The
Economic Costs of Alcohol and Drug Abuse in the United States, 1992,16 continues
the debate on the merits of human capital) 5'26-29
As for most cost-of-illness studies, the traditional human capital approach 4
was used to estimate productivity losses from opioid-related morbidity and
premature mortality. As the human capital assumes labor market equilibrium,
full employment, and nonreplacement of individuals lost to the labor force--a
situation typically not describing the circumstances of most opioid users~S--the
more recent friction-cost method provides a more conservative estimate. 3~ How-
ever, to the extent that the labor market conditions and social interventions
enhance the employability (participation, retention, wage) of the disadvantaged,
both of these methods may understate the potential productivity loss.
Finally, calculating the proportion of social costs attributable t O opioid depen-
dence can be problematic. In contrast to top-down cost-of-illness studies, which
use global attributable fractions estimated from epidemiological data, these com-
prehensive survey data support a more precise analysis. The low participation
rate of opioid users in the formal economy, however, raises concerns about the
estimation of the time lost to productive activity. In particular, what proportion
of these respondents (and the target population) likely will enter into and remain
in the formal economy? Similarly, uncertainty exists about the expected reduction
in the days that psychoactive substances are used.
M E T H O D S
A recent survey 31 provides a rare opportunity to estimate the economic burden
to society of untreated opioid dependence. By the very nature of trying to track
individuals engaging in this illegal activity, no formal sampling frame exits for
contacting all untreated illicit opioid users in Toronto. Thus, an advertising
S O C I A L C O S T S O F U N T R E A T E D O P I O I D D E P E N D E N C E 6 9 3
campaign using flyers posted at needle exchanges and social service agencies
was used to recruit subjects. Participants were asked to tell other users about
the survey. Given the context of this population, the flyer/snowball recruitment
method is the best possible approach that, in spite of its limitation, has demon-
strated a high degree of representativeness for hidden populations. 32-34
The sample (n = 114) was interviewed between June 1996 and March 1997.
Eligibility criteria were that subjects had to be daily opiate users currently not
in or seeking treatment. Qualified subjects were invited to participate in a one-
on-one anonymous and confidential interview after providing informed consent.
Subjects were paid for partaking in the interview of closed- and open-ended
questions.
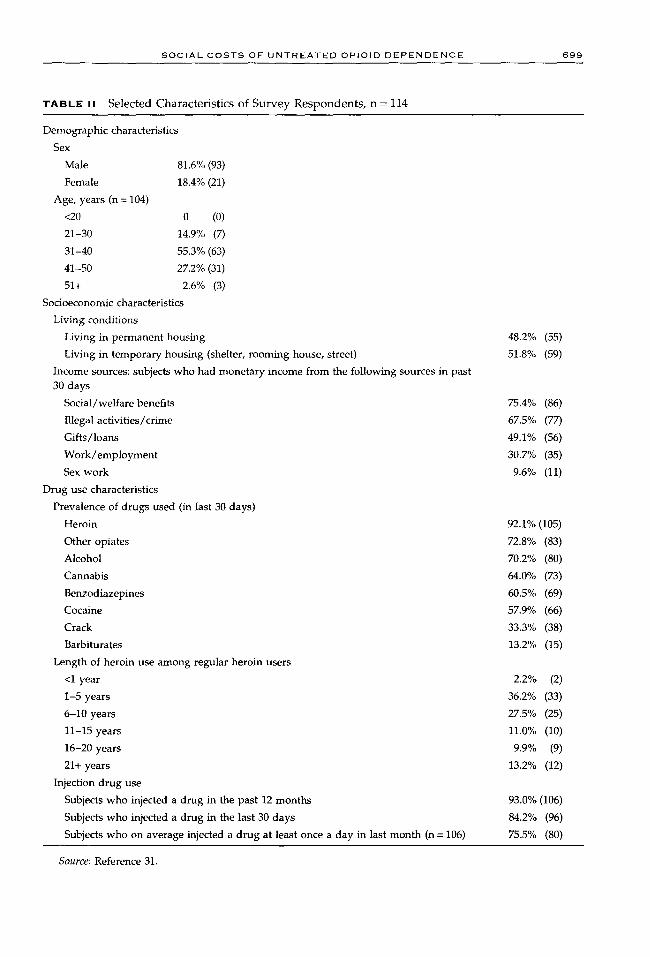
The survey collected data on demographic and socioeconomic characteristics,
drug use history, physical and mental health status, use of health care and drug
treatment services, modality of drug use, risks of infectious diseases, sources of
income, as well as criminality and involvement with the law enforcement system
(see Table I for overview and Table II for selected characteristics). Most subjects
had a fairly long history of opiate use, had been unemployed or underemployed,
and did not have stable living arrangements. The main sources of income were
illegal activities and social benefits. Subjects typically used different forms of
natural and synthetic opioids, as well as a wide variety of other licit and illicit
drugs daily, most of which were purchased from illegal markets. Most respon-
dents injected their drugs and did so multiple times per day. Many subjects
reported both physical and mental health problems, as well as frequent utilization
of the health care system for these and other drug-related problems. Although
few HIV infections were reported, a considerable number of subjects recounted
engaging in unsafe sex and hazardous injection techniques over the past year.
The majority of subjects had been in drug treatment before, many of them more
than once. Finally, about half of the sample had been arrested for criminal
offenses, half had spent some time in prison, and half were under some form of
criminal justice supervision in the past year.
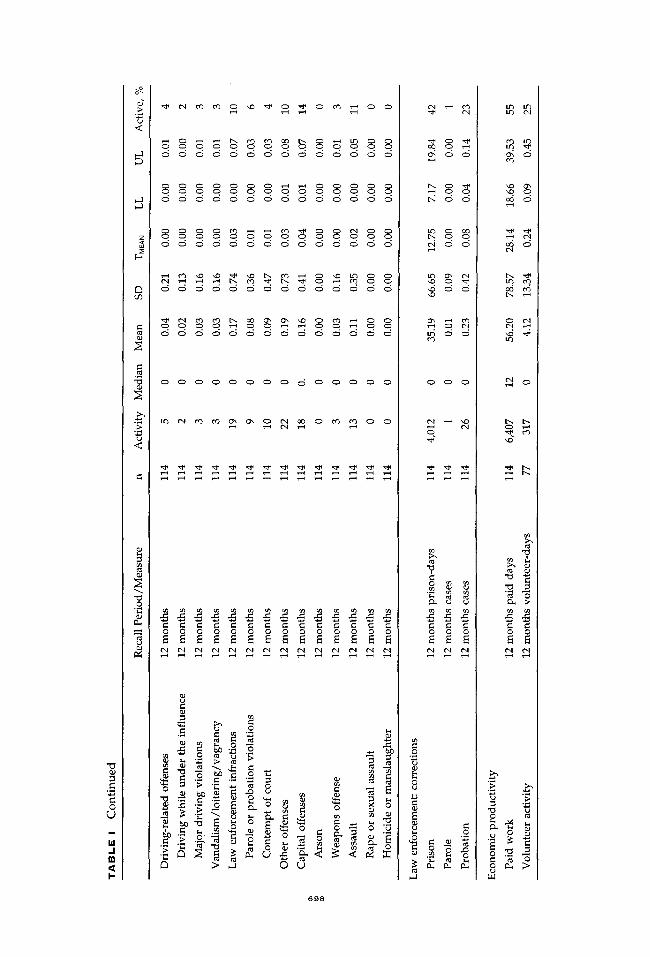
Analysis was concerned with estimating the total economic burden of the
study sample of untreated (dependent) opioid users. As such, the sum of the
economic activities reported by the respondents was used to estimate social cost
(see Activity in Table I). Cost was calculated as the product of reported activity
over 12 months multiplied by the corresponding unit cost and adjusted for the
proportion attributable to opioid dependence. Table I summarizes the survey
data used to estimate the social costs. Economic data are reported by component
and source (cost-item). Data derived from a 30-day recall period were deemed

0 r.lj
o
.I In
2
�9 . . ~ o ~
o o d o d o o o o o o o
. . . . . . ~ ! R ~
~ 8 '~
�9 . ~ ~ . . . .
�9 -" .-" N .-" ~ N N N N N s ~ .~ .~ ~ ~ ~ o ~ ~ ~ ~ ~ ~ ~~ ~ ~ ~ ~ ~ . ~ ~
-H
u
~'i
0 ~ :~
6 9 4

( '~ E) . d o o o
o . iq.
r4 o-; o
,.4 ~., ('-.i ~ o
b . e3 Q', o
'4:) ~ o (3", ' ~ ,..0
0
o ,-,
o o "~ ~ ~., .~,
<
~ ~ o ~ o o ~ o o o o o
. . . . . . . . . ~ ~
• o o o o o o o o o o o 0
o ~
L )
~o~ ~.~ ~ ~ ~ ~.~ ~.~
6 9 5

0 ~J
m
hi .I m
I-
o~
<
03
"0
<
" a
0 .g
~ 0 ~ 0 0 ~ 0 0 0
0 0 0 0 0 0 0 0 0 0 0 0
~ 0 0 0 0 ~ 0 ~ 0 0 0
0 0 0 0 0 0 0 0 0 0 0 0
~ 0 0 0 0 ~ 0 ~ 0 0 0 0
~ 0 0 0 0 ~ 0 ~ 0 0 0 0
0 0 0 0 0 0 0 0 0 0 0 0
0
,.n;
•
~ ' ~ ~ ~ 0 U
6 9 6
d o d d d o o d o d o
o
~ - ~ o ~ . ~ ~ .~ ~ ~ ~

0 0 0 0 0 0 0 0 0 0 0 0 0 0 0
0 0 0 0 0 0 0 0 0 0 0 0 0 0 0
�9 . ~ ~
0
6 9 7
O 0 ~ 0 0 0 0 0 O 0
~ 0 ~ 0 0 0 0 0 O 0
o o o o o o o o o o o
0 0
O 0 ~ 0 0 0 0 0 O 0
. . . . 0 O 0
O 0 0 0 0 0 0 0 0 O 0
~ o o o o o o o o o
,...1
"U
C
C 0
L)
hi /
I "
<
E~
U~
c
c
<
o
0 0 0 0 0 0 0 0 0 0 0 0 0 0
$ $ $ $ $ $ $ S S $ $ $ $ $ 6 6 5 6 6 5 6 6 6 6 6 6 6 6
6 5 6 6 6 6 6 6 6 6 6 6 6 6
0 0 0 0 0 0 0 0 0 0 0 0 0 0
0 0 0 0 0 0 0 0 0 0 0 ~ 0 0
8 c
~ o
~ . ~ ? ~ - ~ -;
> ~ O ~
6 9 8
t-. o ~
rr
0 0 0
u
c c ~ o o o
0 ".7-,
8 4-;, c
8 " .~ 0
{",1
iq. ~.
Lr~
b . b-. 0 ,a"
~ k
.,-L S-
"8 0 e{
S O C I A L C O S T S O F U N T R E A T E D O P I O I D D E P E N D E N C E 6 9 9
T A B L E II Selected Characterist ics of Survey Respondents , n = 114
Demographic characteristics
Sex
Male
Female
Age, years (n = 104)
<2O
21-30
31-40
41-50
51+
81.6% (93)
18.4% (21)
0 (0)
14.9% (7)
55.3% (63)
27.2% (31)
2.6% (3)
Socioeconomic characteristics
Living conditions
Living in permanent housing
Living in temporary housing (shelter, rooming house, street)
Income sources: subjects who had monetary income from the following sources in past 30 days
Social/welfare benefits
Illegal activities/crime
Gifts/loans
Work/employment
Sex work
Drug use characteristics
Prevalence of drugs used (in last 30 days)
Heroin
Other opiates
Alcohol
Cannabis
Benzodiazepines
Cocaine
Crack
Barbiturates
Length of heroin use among regular heroin users
<1 year
1-5 years
6-10 years
11-15 years
16-20 years
21+ years
Injection drug use
Subjects who injected a drug in the past 12 months
Subjects who injected a drug in the last 30 days
Subjects who on average injected a drug at least once a day in last month (n = 106)
48.2% (55)
51.8% (59)
75.4% (86)
67.5% (77)
49.1% (56)
30.7% (35)
9.6% (11)
92.1% (105)
72.8% (83)
70.2% (80)
64.0% (73)
60.5% (69)
57.9% (66)
33.3% (38)
13.2% (15)
2.2% (2)
36.2% (33)
27.5% (25)
11.0% (10)
9.9% (9)
13.2% (12)
93.0% (106)
84.2% (96)
75.5% (80)
Source: Reference 31.

7 0 0 W A L L E T A L .
to represent typical (average) activity and were extrapolated to estimate cost for
the full year. Economic data reported for other periods were adiusted to 1996
using the consumer price index (for Canada, Ontario, or Toronto, as required).
Analysis was adjusted for missing data using mean (proxy) values calculated
from the responding sample (see Activity in Tables III-VI).
Projecting these findings to the Toronto population, however, should account
for the effects of the sample size (see n in Table I) and response distribution on the
precision of point estimates (i.e., mean, median). As the distribution of reported
activities is skewed positively, count data with a high proport ion of zero responses
(i.e., few active respondents; see Active in Table I), the ~ y + %/activity + 1
transformation 35'36 was employed to estimate the mean point estimate (TMEAN) and
its 95% confidence interval (LL, UL) for the cost-items. 37 The means and confidence
intervals displayed in the Table I have been converted back from the transformed
scale.
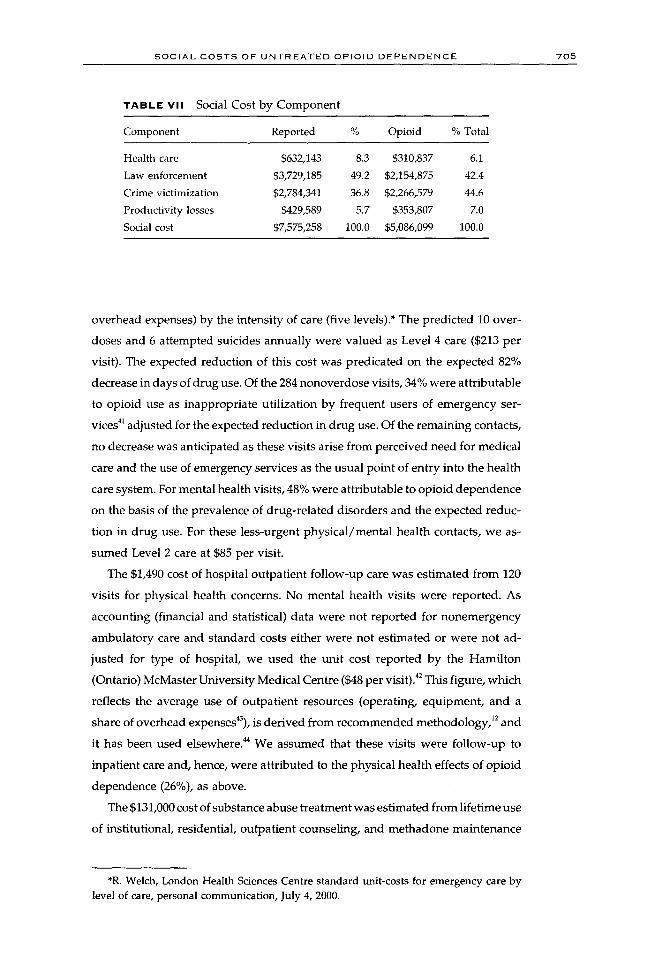
R E S U L T S
To facilitate interpretation of s tudy findings, estimated social costs are reported
in Tables III to VII by component and source: health care (inpatient, emergency,
outpatient, substance abuse treatment, medical, ambulance, pharmaceutical), law
enforcement (police, courts, corrections), crime victimization (out-of-pocket ex-
penses, compensation for pain and suffering, productivity losses, health care),
and productivity losses (morbidity, mortality). For the baseline analysis, the cost
of each component was estimated as the arithmetic sum of the constituent sources
(see Tables III-VI). Social cost is the arithmetic sum of these components (see
Table VII). All costs are in 1996 Canadian dollars.
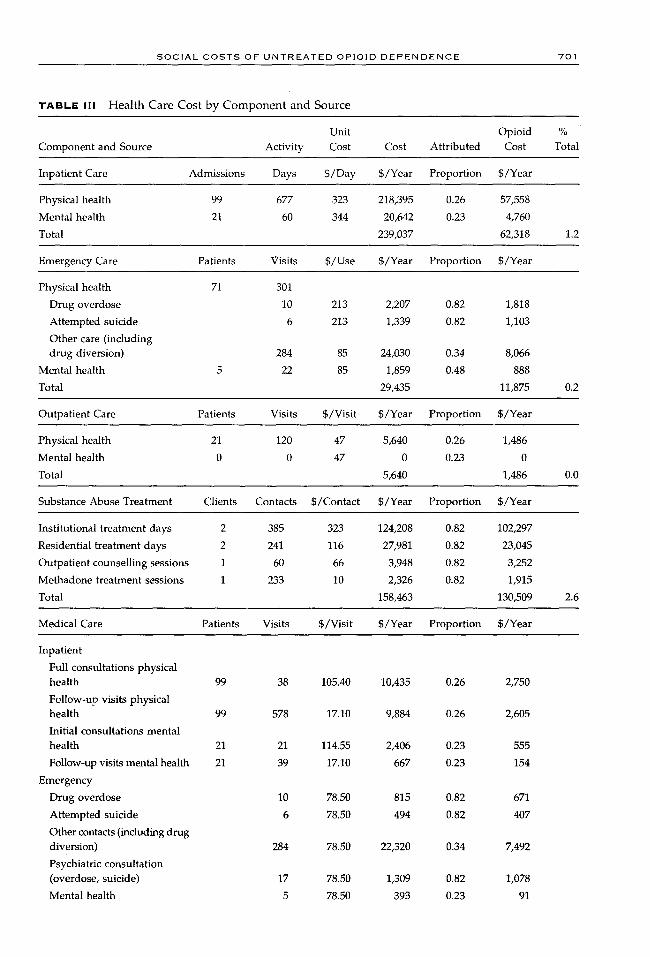
c o s t o r H ~ A L T H C A R E
The $311,000 cost of health care (Table III) derived from opioid dependence
arises from the use of hospitals, emergency departments, outpatient departments,
medical care, ambulance services, substance abuse treatment, and prescription
pharmaceuticals.
The $62,300 cost of inpatient care was estimated from 120 hospital admissions
and 737 hospital days. Standard unit costs of inpatient care for opioid abuse /
dependence ($323 per day) and for depressive neuroses ($344 per day) estimated
for the Province of Alberta 38 were used (see also the comparable figures for the
Province of Manitoba39). As these figures were derived from urban tertiary care
settings, they represent the cost of inpatient care provided to the respondents.
S O C I A L C O S T S O F U N T R E A T E D O P I O I D D E P E N D E N C E 701
TABLE I | | Health Care Cost by Component and Source
Unit Opioid % Component and Source Activity Cost Cost Attributed Cost Total
Inpatient Care Admissions Days S/Day S/Year Proportion S/Year
Physical health 99 677 323 218,395 0.26 57,558
Mental health 21 60 344 20,642 0.23 4,760
Total 239,037 62,318 1.2
Emergency Care Patients Visits S/Use S/Year Proportion S/Year
Physical health 71 301
Drug overdose 10 213 2,207 0.82 1,818
Attempted suicide 6 213 1,339 0.82 1,103
Other care (including drug diversion) 284 85 24,030 0.34 8,066
Mental health 22 85 1,859 0.48 888
Total 29,435 11,875 0.2
Outpatient Care Patients Visits S/Visit S/Year Proportion S/Year
Physical health 21 120 47 5,640 0.26 1,486
Mental health 0 0 47 0 0.23 0
Total 5,640 1,486 0.0
Substance Abuse Treatment Clients Contacts S/Contact S/Year Proportion S/Year
Institutional treatment days 2 385 323 124,208 0 . 8 2 102,297
Residential treatment days 2 241 116 27,981 0.82 23,045
Outpatient counselling sessions 1 60 66 3,948 0.82 3,252
Methadone treatment sessions 1 233 10 2,326 0.82 1,915
Total 158,463 130,509 2.6
Medical Care Patients Visits S/Visit S/Year Proportion S/Year
Inpatient
Full consultations physical health 99 38 105.40 10,435 0.26 2,750
Follow-up visits physical health 99 578 17.10 9,884 0.26 2,605
Initial consultations mental health 21 21 114.55 2,406 0.23 555
Follow-up visits mental health 21 39 17.10 667 0.23 154
Emergency
Drug overdose 10 78.50 815 0.82 671
Attempted suicide 6 78.50 494 0.82 407
Other contacts (including drug diversion) 284 78.50 22,320 0.34 7,492
Psychiatric consultation (overdose, suicide) 17 78.50 1,309 0.82 1,078
Mental health 5 78.50 393 0.23 91

7 0 2 W A L L E T A L .
T A B L E III Continued
%
Medical Care Patients Visits S/Visit S/Year Proportion S/Year Total
Outpatient
General assessments physical health 21 2l 53.60 1,126 0.26 297
Partial assessments physical health 21 99 23.10 2,287 0.26 603
All mental health 0 0 0
Treatment (annual) 6 6 48.20 299 0.82 246
Primary
Physician-office
General assessment physical health 90 90 48.20 4,338 0.00 0
Intermediate assessments 83 2,046
Diverted prescriptions 47 1,632 24.80 40,468 0.72 29,201
Physical health 83 414 24.80 26,602 0.00 0
All mental health sessions 13 267 111 .60 29,770 0.48 14,221
Total 137,282 60,369 1.2
Annual Ambulance Services Events S/Event S/Year Proportion S/Year
Treated overdoses 10 313 3,251 0.82 2,678
Drug-related attempted suicide 6 313 1,972 0.82 1,624
Total 5,223 4,302 0.1
Pharmaceuticals Patients Prescriptions Charge S/Year Proportion S/Year
Follow-up after attempted suicide 6 6 21.33 134 0.23 31
Drug-related mental health 9 108 42.99 4,643 0.48 2,218 conditions
Diverted prescriptions 48 1,697 30.81 52,286 0.72 37,729
Total 57,063 39,978 0.8
Total health care 632,143 310,837 6.1
These per diem unit costs, which exclude emergency, outpatient, and long-term
care, as well as education and research activities (and corresponding shares of
ancillary and overhead expenses), 4~ were adjusted for the intensity of resource
utilization. 1228~9 The respective 26% and 23% of inpatient care for physical and
mental health attributable to opioid dependence were determined from the pre-
dicted annual rates of treated drug overdoses and drug-related attempted sui-
cides, both adjusted for the expected 82% expected reduction in days of drug
use (see Cost of Law Enforcement, below). The predicted 10 overdoses and 6
attempted suicides were calculated as reported lifetime incidences standardized
for tile period of opioid use.
The $11,900 cost of emergency care was estimated from 323 visits for physical
S O C I A L C O S T S O F U N T R E A T E D O P I O I D D E P E N D E N C E -703
T A B L e : i V Law Enforcement Cost by Component and Source
Unit Opioid % Component and Source Activity Cost Cost Attributed Cost Total
Police Arrests Incidents S/Incident S/Year Proportion S/Year
Illicit drug possession or use 22 169 2,613 442,181 0.82 364,178
Illicit drug sale, distribution, or 1 8 2,613 20,099 0.72 14,503 manufacture
Income-related property crimes 92 696 2,613 1,818,254 0.48 871,268
Income-related other illegal 3 23 2,613 60,297 0.21 12,946 activities
Driving-related violations 5 38 2,613 100,496 0.82 82,768
Vandalism/loitering/vagrancy 3 23 2,613 60,297 0.82 49,661
Law enforcement infractions 18 18 2,613 47,032 0.77 36,419
Other offenses 12 92 2,613 241,190 0.22 53,950
Capital offenses 16 29 2,613 74,654 0.72 53,870
Total 2,864,500 1,539,563 30.3
Court Charges S/Case S/Year Proportion S/Year
Drug possession/use 22 1,305 28,710 0.82 23,645
Income-related drug business 1 1,305 1,305 0.72 942
Income-related property 94 1,472 138,344 0.48 66,291
Income-related other illegal activities 4 1,305 5,220 0.21 1,121
Driving-related violations 5 2,873 14,364 0.29 4,104
Vandalism/loitering/vagrancy 3 1,305 3,915 0.29 1,119
Legal status violations 19 1,305 24,795 0.77 19,200
Other offenses 22 1,305 28,710 0.29 8,202
Capital offenses 18 4,467 80,406 0.72 58,020
Total 325,769 182,644 3.6
Case S/Day; Corrections Cases Days S/Case S/Year Proportion S/Year
Prison 48 4,012 127 509,026 0.80 409,361
Parole 1 3,973 3,973 0.80 3,195
Probation 26 997 25,917 0.78 20,114
Total 538,916 432,670 8.5
Total law enforcement 3,729,185 2,154,877 42.4
and mental health concerns. For physical health visits, analysis distinguished
among contacts for drug overdose, drug-related attempted suicide, and other
concerns (including obtaining prescription drugs for illicit purposes and as a
source of primary care). Selected Ontario hospitals report the unit cost of emer-
gency care (i.e., operating expenses, equipment depreciation, and a share of
7 0 4 W A L L ET A L .
T A B L E V Crime Victimization Cost by Component and Source
Unit Opioid % Component and Source Activity Cost Cost Attributed Cost Total
Out-of-Pocket Expenses Incidents S/Infraction S/Year Proportion S/Year
Household victimization 2,999 664 1,991,547 0.81 1,622,742
Vandalism 799 383 306,012 0.82 252,030
Personal victimization 115 48 5,508 0.80 4,429
Total 2,303,067 1,879,201 36.9
Pain and Suffering Incidents S/Incident S/Year Proportion S/Year
Personal victimization 115 3,728 430,304 0 .80 345,980
Total 430,304 345,980 6.8
Productivity Losses Victims Days/Victim S/Day S/Year Proportion S/Year
Household victimization 2,999 0.27 51.38 41,599 0.81 33,895
Personal victimization 115 0.61 51.38 3,617 0.80 2,909
Total 45,216 36,804 0.7
Health Care Emergency Inpatient Primary S/Year Proportion S/Year
Unit cost (S/event) 369.69 560.35 48.20
Robbery (85 victims) 8% 2% 12% 3,966 0.83 3,305
Assault (30 victims) 11% 2% 16% 1,788 0.72 1,290
Total 5,754 4,595 0.1
Total victimization 2,784,341 2,266,580 44.5
T A B L E V I Productivity Loss by Component and Source
Unit Opioid % Component and Source Activity Cost Cost Attributed Cost Total
Morbidity Participants Lost Days S/Day S/Year Proportion S/Year
Paid work 63 5,518 51.38 283,494 0 . 8 2 233,484
Volunteer activities 28 -165 51.38 -8,477 0.82 -6,982
Total 275,017 226,502 4.5
Expected Mortality Deaths S/Death S/Year Proportion S/Year
Opioid overdoses 0.63 213,349 134,410 0 . 8 2 110,699
AIDS from contaminated needles 0.09 213,349 20,161 0.82 16,605
Total 154,571 127,304 2.5
Total productivity 429,588 353,807 7.0
S O C I A L C O S T S O F U N T R E A T E D O P I O I D D E P E N D E N C E "705
" t A B L e V i i Social Cost by Component
Component Reported % Opioid % Total
Health care $632,143 8.3 $310,837 6.1
Law enforcement $3,729,185 49.2 $2,154,875 42.4
Crime victimization $2,784,341 36.8 $2,266,579 44.6
Productivity losses $429,589 5.7 $353,807 7.0
Social cost $7,575,258 100.0 $5,086,099 100.0
overhead expenses) by the intensity of care (five levels).* The predicted 10 over-
doses and 6 at tempted suicides annual ly were valued as Level 4 care ($213 per
visit). The expected reduction of this cost was predicated on the expected 82%
decrease in days of drug use. Of the 284 nonoverdose visits, 34% were at tr ibutable
to opioid use as inappropr ia te util ization by frequent users of emergency ser-
vices 41 adjusted for the expected reduction in drug use. Of the remaining contacts,
no decrease was anticipated as these visits arise from perceived need for medical
care and the use of emergency services as the usual point of entry into the health
care system. For mental health visits, 48% were attributable to opioid dependence
on the basis of the prevalence of drug-rela ted disorders and the expected reduc-
tion in drug use. For these less-urgent phys ica l /menta l health contacts, we as-
sumed Level 2 care at $85 per visit.
The $1,490 cost of hospital outpat ient fol low-up care was est imated from 120
visits for physical health concerns. No mental health visits were reported. As
accounting (financial and statistical) data were not reported for nonemergency
ambula tory care and s tandard costs either were not est imated or were not ad-
justed for type of hospital, we used the unit cost reported by the Hamil ton
(Ontario) McMaster University Medical Centre ($48 per visit).42 This figure, which
reflects the average use of outpat ient resources (operating, equipment , and a
share of overhead expenses43), is der ived from recommended methodology, 12 and
it has been used elsewhere. 44 We assumed that these visits were fol low-up to
inpatient care and, hence, were at tr ibuted to the physical health effects of opioid
dependence (26%), as above.
The $131,000 cost of substance abuse t reatment was est imated from lifetime use
of institutional, residential, outpat ient counseling, and methadone maintenance
*R. Welch, London Health Sciences Centre standard unit-costs for emergency care by level of care, personal communication, July 4, 2000.
7 0 6 W A L L ET A L .
interventions adjusted for the respondent 's duration of regular opioid use (a
mean of 12.0 years). On average, a total of 385 days of institutional care, 241
days of residential care, 60 sessions of outpatient counseling, and 233 sessions
of methadone maintenance were used annually. The per diem cost of institutional
care was estimated as above for inpatient care. 38 The unit costs (i.e., operating,
equipment, and a share of overhead expenses) of treatment in the remaining
settings were reported by the Ontario Drug and Alcohol Treatment Information
System ~ as $116 per day for residential care (excluding intake assessment), $68 per
session for one-on-one outpatient counseling, and $10 per session for methadone
maintenance (adjusted for decreasing cost over time). These services were attrib-
uted fully to opioid use, but were adjusted for the expected reduction in drug
u s e .
The $60,400 cost of medical care includes reported office visits for primary
care, as well as imputed physician services that would have been provided
in inpatient, emergency, outpatient, and substance abuse treatment settings.
Following the Ontario Schedule of Benefits for Medical Services, 46 analysis distin-
guishes between the tariffs paid for initial and follow-up care by medical specialty.
Hospital admissions for physical health concerns generated 99 initial consulta-
tions by attending internists ($105.40 per consultation), followed by 578 visits
($17.10 per visit) to monitor patient progress. Similarly, admissions for mental
health care generated 21 psychiatric consultations ($114.55 per admission), fol-
lowed by 39 visits ($17.10 per visit). Each of the 323 emergency visits involved
an examination by the attending physician ($78.50 per examination). For the 6
attempted suicides and 10 drug overdoses (see ambulance services discussion,
below), patients were also seen by a psychiatrist while in the emergency room
($78.50 per consultation). The 120 physical health outpatient visits required the
attending clinic internist to perform 21 general assessments ($53.60 per assess-
ment), one for each of the 21 respondents reporting care, followed by 99 partial
assessments to monitor patient progress ($23.10 per assessment). No visits were
reported for mental health disorders. Finally, the 6 subjects in substance abuse
treatment annually were assumed to have been examined by a general prac-
titioner ($48.20 per assessment). These imputed costs were attributed respectively
to the health effects of opioid dependence as above for inpatient, emergency,
outpatient, and treatment services.
The 2,139 office visits to general practitioners for physical health concerns
were interpreted as 90 initial visits ($48.20 per general assessment), one for each
of the 90 respondents reporting care, and 2,046 visits thereafter ($24.80 per
intermediate assessment). For the follow-up visits, 1,632 were explained as con-
S O C I A L C O S T S O F U N T R E A T E D O P I O I O D E P E N D E N C E 70 '7
tacts made to obtain prescriptions for illicit purposes.* To the extent that the 72%
decrease in drug trafficking following the switch from opioid dependence to
irregular use (see law enforcement discussion, below) reduced the diversion of
prescriptions, 1,175 visits would be eliminated. Analysis assumed that, as the 90
initial contacts and the remaining follow-up visits were for the treatment of
chronic physical health conditions arising from historical physiological and life-
style circumstances (including the use of psychoactive substances), no reduction
in this cost was anticipated. The 267 visits for mental health care consisted of 1-
hour sessions with a psychiatrist ($111.60 per hour). As above, 48% of the reported
cost was attributable to opioid dependence.
The $4,300 cost of ambulance services was estimated from the reported number
of lifetime overdoses for which medical treatment was sought and for drug-
related attempted suicides. The average unit cost of emergency ambulance ser-
vices ($313 per event) was calculated from unpublished Ontario Ministry of
Health data. 44 Of the reported cost, 82% is attributable to opioid dependence on
the basis of the predicted reduction in days of drug use (i.e., the period in which
users are at risk of drug overdose and drug-related attempted suicide).
Finally, the $40,000 cost of pharmaceuticals includes prescriptions issued to
patients discharged from the hospital following treatment for attempted suicide,
drugs prescribed to treat mental health conditions (mostly depression), and
prescription drugs diverted for illicit purposes. Costs were estimated using On-
tario Drug Formulary prices a7 adjusted for the customary $10.50 pharmacy dis-
pensing fee. Treatment of the 6 attempted suicides (emergency, inpatient, follow-
up care by a psychiatrist) included a small supply of antidepressants (e.g., 10
tablets of Prozac at $1.083 per tablet) provided to cover the period between
hospital discharge and psychiatric office care. Also, the 9 respondents who re-
ported chronic drug-related mental health concerns were assumed to take Prozac
for the full year (30 tablets per prescription and 12 refills). As above, 23% and
48% of the cost of antidepressants were attributable, respectively, to opioid
dependence. Diverted prescriptions (e.g., morphine, oxycodone) are used to
finance the purchase of illicit drugs and as a substitute when preferred psychoac-
tive substances are not available. 4a-5~ The $38,800 cost was estimated from the
responses of 76 subjects questioned about this activity.* An average cost of $30.80
per prescription (including dispensing fee) was calculated from the reported mix
*R. Wall, B. Brands, and J. Blake, The diversion of prescription opioids by a cohort of untreated opiate users, unpublished memo, 1999.

7 0 8 W A L L ET A L .
of diverted analgesics. Of the cost, 72% was attributed to opioid dependence on
the basis of the expected reduction in drug trafficking (see law enforcement
discussion below).
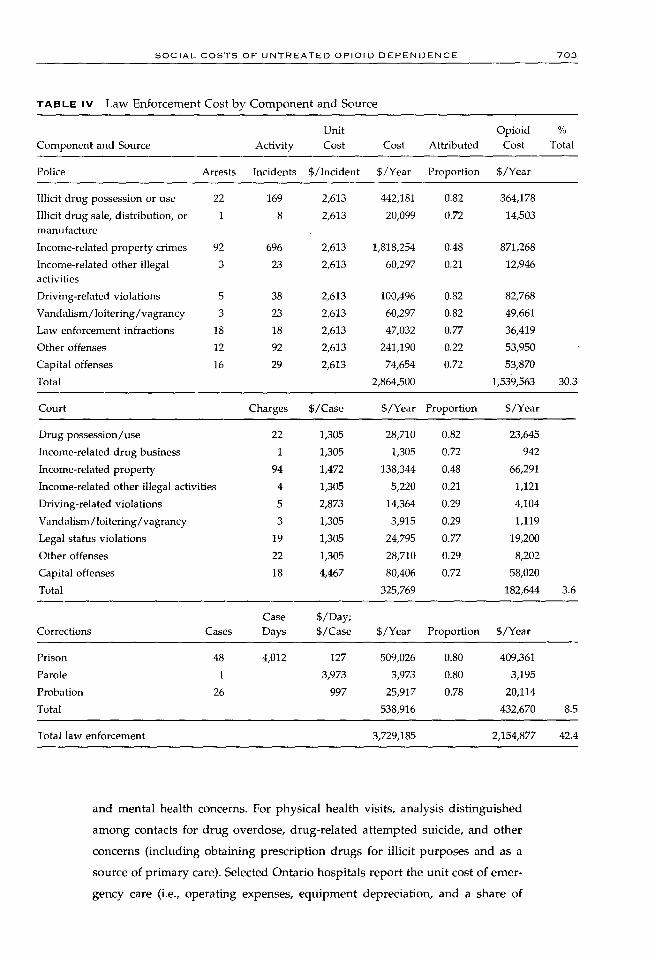
C O S T oF' L A W E N F O R C E M E N T
The $2,155,000 cost of law enforcement (Table IV) for opioid-related crimes
consists of
�9 the police costs of investigating incidents, making arrests, and laying charges
�9 the court costs of processing charges
�9 the correction costs of enforcing sentences
These costs were estimated using operating expenses and statistics reported by
the Canadian Centre for Justice Statistics.
To distinguish better between drug-related and other criminal activity, re-
ported infractions, arrests, and charges were grouped as follows:
�9 possession or use of illicit drugs
�9 sale, distribution, or manufacture of illicit drugs (i.e., trafficking)
�9 income-related property crimes (shoplifting, minor theft, burglary, theft,
breaking and entering, auto theft, robbery, forgery, fraud)
�9 other income-related activity (tax evasion, defrauding social assistance, pim-
ping, sex trade)
�9 driving-related offenses (driving while under the influence, major driving
violations)
�9 vandalism, loitering, vagrancy
�9 legal status violations (violations of parole or probation, contempt of court),
other illegal activities
�9 capital offenses (arson, weapons charges, assaults, rape and sexual assaults,
homicide, murder, other)
Typical of opioid use behavior, 17~1 most reported criminal activity was for illicit
drug possession/use (59%) and income-generating trafficking, property, and
other crimes (35%). For arrests, however, while possession/use and income-
related crimes still accounted for the majority of arrests (13% and 57%, respec-
tively) and charges (12% and 54%, respectively), income-generating property
crimes were of particular importance--that is, 9% of the criminal activity was
responsible for 54% of the arrests and 51% of the charges.
Among the 94% of survey respondents reporting lifetime arrests, 81% were
for infractions committed while using drugs or to obtain money to purchase
drugs. Estimating the proportion of criminal activity attributable to opioid-related
S O C I A L C O S T S O F U N T R E A T E D O P I O I D D E P E N D E N C E 7 0 9
crime was problematic. Although criminal activity was related to heavy drug
use, s2-54 reduction in criminality was determined by the effectiveness of treatment
and was limited by prior criminal history (especially that before the onset of
drug use). s556 Moreover, sustained change in criminality is mitigated by users'
generally poorer health, lower educational attainment, fewer resources, and social
stigma that limits their (re)integration into mainstream society, s3
Findings by scientific studies of reduced criminal activity among opioid users
in methadone maintenance are encouraging (e.g., the 84% reduction in trafficking
and property-related crimeS6), but may be overstated for estimating untreated
social costs from the self-selection of subjects into treatment, confounding by
rigorous monitoring and sanctions, and the potential for information bias. The
study by Johnson and colleagues 51 of the economics of crime among New York
City heroin users provides a more conservative estimate of excess criminal infrac-
tions attributable to untreated opioid dependence. As criminal activity is reported
by degree of heroin use (daily, regular, irregular), the attributable proportion
was estimated as the difference in rates of criminal activity between daily (6 to
7 days per week) and irregular (0 to 2 days per week) users. This calculation
assumes that dependent users are unlikely to withdraw completely from using
opioids for the rest of their lives (i.e., the chronic disease model), and that
in remaining socially disadvantaged, they will continue to engage in income-
generating crime.
Using the New York data, the 82% between-group (daily vs. irregular) differ-
ence in the number of use-days in which psychoactive substances were used is
a proxy measure for the reduction in the risk of being arrested and charged for
drug possession/use. Similarly, reductions in the rates of income-related crimes
(trafficking, property, other) were calculated as between-group differences in
self-reported offenses (72%, 48%, 21%, respectively). The risks of committing
driving-related and vandalism/loitering/vagrancy infractions were also deemed
to diminish with the expected decrease in drug use. The reduction in capital
offenses (mostly weapons) was assumed to correspond to the predicted decrease
in drug trafficking. In assuming equal risk of violating the terms of probation/
parole, the proportion of law enforcement offenses attributed to opioid depen-
dence was calculated as the weighted average of the above rates. Finally, the
proportions of prison, parole, and probation sentences assigned to opioid depen-
dence account for the distribution of charges and patterns of sentencing in
Canada. 57
The $1.54 million police cost was calculated using the $2,613 average cost of
the Toronto Metropolitan Police to investigate criminal code incidents during
7 1 0 W A L L ET A L .
1996 and the imputed number of cases investigated, that is, the reported arrests
adjusted for the prevailing clearance rate for property (13%), violent (56%), and
other (13%) crimes. 58 The $183,000 cost of prosecuting, defending, and sentencing
cases was estimated from average court, prosecution, and legal aid operating
expenses and statistics reported for the Province of Ontario and adjusted for the
expected duration of trial. 42 Finally, the $433,000 cost of enforcing convictions
served in prison and under supervision in the community was estimated from
operating expenses 59 and statistics 6~ reported for Ontario.
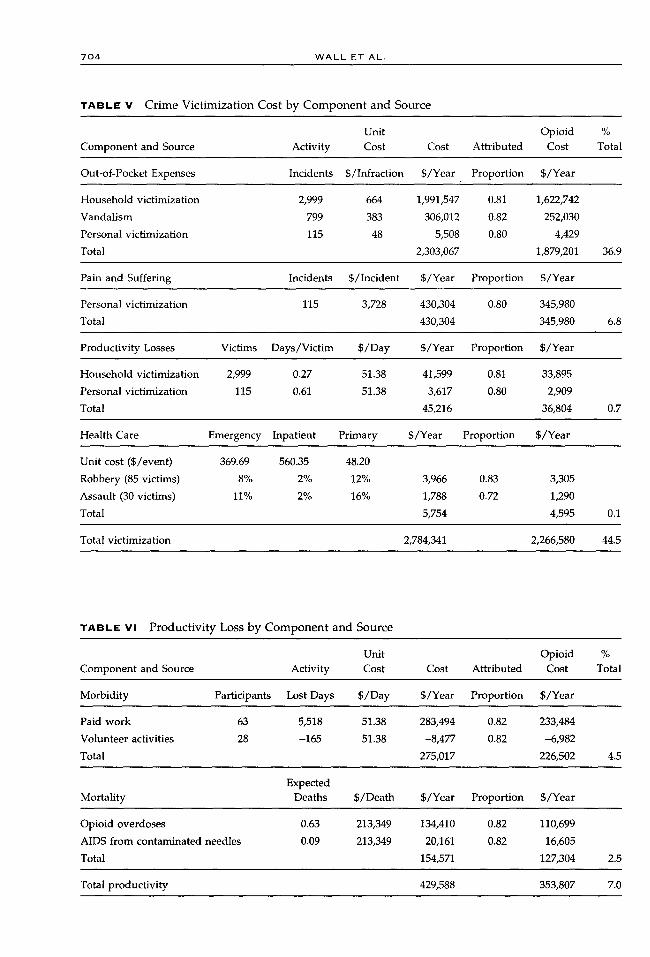
c o s t o F CR~MK V ~ C T , ~ Z A T ~ O n
The $2,267,000 cost of crime victimization (Table V) includes the cost to the
victims of
�9 out-of-pocket expenses
�9 pain and suffering
�9 productivity losses
�9 use of health care
The cost attributed to opioid dependence was estimated as between-group differ-
ences in income-related infractions recounted by daily and irregular heroin users
in New York City 51 and data on assaults reported by Ball and ROSS. 56
The $1,879,000 out-of-pocket expenses of the victims of household (i.e., break-
ing and entering, motor vehicle theft, theft), vandalism, and personal (i.e., sexual
assault, robbery, assault) crimes were estimated from data reported by the 1993
General Social Survey, which reported the value of stolen/damaged property,
the compensation paid by third parties, and the proportion of stolen goods
recovered. 6t The $346,000 compensation awarded by the Ontario Criminal Injuries
Compensation Board 62 was a proxy for the value placed by society on the pain
and suffering of the victims of personal incidents. The Province of Ontario data
distinguishes compensation to redress pain and suffering from other compensa-
tion (e.g., lost wages, legal expenses). To the extent that victims' valuations of
their loss of well-being are understated, however, this estimate is conservative.
The $36,800 productivity loss stemming from household and personal infractions
was calculated as the expected number of days away from work 61 valued at the
minimum wage ($51.63 per day, see below). As the victims of opioid-related
crimes are disadvantaged disproportionally, 63 calculation was adjusted for the
rate of employment of this population. 42 Finally, the $4,595 cost of health care
used by the victims of violent crimes was calculated as their predicted utilization
of services 64 valued as the per diem cost of hospitalization for injury ($438) 38

S O C I A L C O S T S O F U N T R E A T E D O P I O I D D E P E N D E N C E "71 1
and the above unit costs of emergency, outpatient, and primary care, including
applicable physician fees.
C O S T O F P R O D U C T I V I T Y L o s s E s
Untreated opioid dependence is estimated to generate productivity losses of
$354,000 (Table VI). First, respondents' performance of economically valuable
paid and volunteered activities is impaired by opioid-related physical and mental
health morbidities. Second, periods spent in hospitals, institutions, residential
facilities, and prisons reduce the time available for performing such activities.
Third, preoccupation with financing the opioid-related lifestyle detracts many
users from meaningful participation in the formal economy. Finally, premature
mortality (i.e., before age 65 years) reduces the duration of life in which these
activities can be performed. The Ontario minimum wage of $6.85 per hour and
a standard working day of 7.5 hours was used to assign monetary value to these
losses of productive activities ($51.38 per day). The cost attributable to opioid
dependence accounts for the expected 82% reduction in the days of drug use.
The $227,000 cost of opioid-related morbidity was estimated from respondents'
report of 6,407 days worked and 469 days volunteered over the past 12 months.
Days worked were compared to the 21,579 potential workdays reported by a
comparable sample of Ontario residents 42 and reduced by 55% to correspond to
the proportion of untreated (dependent) opioid users most likely to participate
in the formal economy, that is, those respondents reporting at least some paid
work. This comparator was standardized for demographic (age, sex) structure and
adjusted for rates of unemployment and workforce participation. For volunteer
activities, more time was provided by the respondents. 42
The $127,000 cost of premature mortality among intravenous drug users was
estimated as the earnings generated by the 114 survey respondents as they
advance through a series of stages (defined by seven age groupings and two
genders) until retiring at the age of 65 . 42 Earnings were calculated using prevailing
rates of unemployment and labor force participation in these groupings adjusted
for a 1% annual growth in productivity and discounted to the present using the
3% rate of time preference. ~ Cost was estimated as the average lifetime earnings
foregone due to opioid-related mortality (1% lower rate 66) and mortality related
to AIDS (acquired immunodeficiency syndrome) (0.15% among Toronto injection
drug users [IDUs]*) reduced by 55% to adjust for the number of respondents
most likely to engage in paid work.
*R. S. Remis, M. Millson, and C. Major, The HIV epidemic among injection drug users in Ontario: the situation in 1997, unpublished study, University of Toronto Department of Public Health Sciences, Toronto, Ontario, Canada, 1997.
7 1 2 W A L L E T A L .
S A M P L E S O C I A L C O S T
Of the $5.086 million annual social cost (Table VI) of untreated opioid dependence
during 1996 that was estimated for this sample of 114 residents of Toronto, crime
victimization explains the largest amount (44.6%), followed by law enforcement
(42.4%), productivity losses (7.0%), and, finally, the use of health care (6.1%).
This amount expressed in US currency is $3.730 million. In 1999 Canadian dollars,
this cost is $5.307 million ($3.572 million in US dollars).
Consistent with findings of the recent bottom-up British NTORS75 sample
variation estimated as standard deviation (see SD in Table I) was high for most
cost-items. Although our smaller sample (n = 114) may explain some variation,
comparison to the larger NTORS (n = 1075) suggests that response heterogeneity
is characteristic of dependent illicit drug users, with implications for generalizing
sample findings to populations. The distributions of survey responses for the
cost-items are count data positively skewed, with many respondents reporting
zero activity (see Active in Table I). Also consistent with the NTORS, mean point
estimates are larger than the median values, which are generally zero (see mean,
median in Table I). Survey responses confirmed that a set of interrelated activities 25
explains the social cost of untreated opioid dependence (% of survey respondents
reporting activity): inpatient (33%), emergency (62%), and office (79%) care for
physical health concerns; ambulance use for drug overdoses (32%) and attempted
suicides (28%); diversion of prescriptions (42%); income-related property victim-
izations (38%), arrests (36%), and charges (38%); imprisonment (42%); and no
paid work over the past 12 months (45%).
G E N E R A L I Z A T I O N OF S A M P L E S O C I A L C O S T S TO T H E T O R O N T O P O P U L A T I O N
In the absence of other samples of untreated illicit opioid users in Toronto
and elsewhere, assessing the external validity of samples drawn from hidden
populations is problematic. Comparison to other North American surveys of
illicit drug users finds that our respondents exhibited and confirmed relevant
demographics and socioeconomic characteristics, history and profile of illicit
drug use, health status and health risks, as well as involvement with criminal
justice system. 67-7~ One major caveat limiting the generalization of our findings,
however, is that most respondents were recruited within the context of needle
exchanges and social service agencies. To the extent that these users are informed
better about risks to their health and better motivated to access health/social
services, their social costs may be lower compared to otherwise similar but more
isolated individuals. Overall, we believe that these data provide valuable insights
into a typical sample of these less-isolated untreated (dependent) opioid users.
The $105-$171 million range of the social cost of untreated opioid use and

S O C I A L C O S T S O F U N T R E A T E D O P I O I D D E P E N D E N C E 7 ! 3
the corresponding $43 to $69 spread in the economic burden per capita was
estimated for Toronto (2.456 million residents, 9 8,000 to 13,000 untreated users)
using the expected $13,100 per user estimated from the mean of the transformed
data of the cost-items accounting for uncertainty in the estimated number of
opioid users (10,000 to 15,00031-n) and the proportion not in methadone mainte-
nance (80% to 85%).* In contrast to the sample, law enforcement (39.1%) and
productivity losses (33.2%) explain the greatest proportions of social cost, fol-
lowed by crime victimization (21.2%) and health care (6.6%).
S E N S I T I V I T Y A N A L Y S I S
Analysis is sensitive to the precision of estimated statistics for the model cost-
items, the set of items used, and uncertainty in the specification of model parame-
ters. Social cost is also sensitive to assumptions made about crime victimization,
out-of-pocket costs, productivity losses, and the expected reduction in the days
of drug use.
The 95% confidence intervals estimated for means of the cost-items (see LL,
UL in Table I) provide guidance on the precision of the estimated social cost per
untreated (dependent) opioid user. The $6,950 smaller social cost per user was
estimated from the lower 95% confidence limits for health care, law enforcement,
and crime victimization cost-items, but the upper limit for reported paid/volun-
teer activities. Similarly, the $24,700 greater social cost per user was estimated
from the upper 95% confidence limits for health care, law enforcement, and
crime victimization cost-items, but the lower limit for reported paid/volunteer
activities.
Assuming that crime victimization expenses constitute a transfer from the
victim to the culprit, excluding this cost-item reduces the average social cost to
$10,600 ($6,610 to $17,700). Excluding productivity losses (i.e., assuming zero
friction cost) reduces the average social cost attributable to opioid dependence
to $8,760, with similar effects on the range of values ($3,100 to $20,000). Alterna-
tively, if 100% of the sample otherwise would have engaged in minimum wage
employment, the average social cost increases to $17,600 ($11,400 to $29,200).
Finally, changing the expected reduction in days of drug use from 82% to 55%
decreases the average social cost to $11,200 ($5,540 to $22,300). Analysis excluding
productivity losses and crime victimization expenses and using the lower ex-
pected reduction in days of drug use estimates the average social cost as $5,880
($2,610 to $13,200).
*R. S. Remis, M. Millson, and C. Major, The HIV epidemic among injection drug users in Ontario: the situation in 1997, unpublished study, University of Toronto Department of Public Health Sciences, Toronto, Ontario, Canada, 1997.
7 1 4 W A L L E T A L .
D I S C U S S I O N A N D P O L I C Y I M P L I C A T I O N S
The $34 to $55 range in per capita social cost estimated here for untreated opioid
dependence in Toronto includes the revised $46 figure for all illicit drug use in
Ontario 6 (11.256 million residents ~) after excluding items not common to both
studies (e.g., crime victimization, employee assistance programs) and adjusting
for inflation. The distribution of the economic burden across cost components,
however, differs, with untreated opioid dependence generating greater law en-
forcement expenditures (50% vs. 29%), comparable health care costs (8% vs. 8%),
but lower productivity losses (42% vs. 63%). These variances are likely explained
by differences in the mix of psychoactive substances consumed (opioids vs. all
illicit drugs), greater heterogeneity among opioid users (untreated dependent
vs. all users), the degree of social disadvantage (the disadvantaged vs. a broader
cross section of citizens), and the data used (aggregate secondary sources vs.
responses to a comprehensive questionnaire).
The key concern of economic analysis using survey data is the accuracy of
self-reported responses--especially those reporting on illegal activities. While
we have no data about the current survey, there are a number of factors that
provide some confidence about the accuracy of these responses. Kilias and col-
leagues found a favorable agreement between subjective self-reports and objective
administrative records of criminal activity. 72-75 Comprehensive reviews 76-8~ con-
clude that self-reported data provide a reliable and valid basis for studying drug
users' criminal activity, HIV risk behaviors, work status, and sources of income.
Finally, the comparability of the average 496 drug trafficking and property infrac-
tions reported here with the findings of other surveys--between 223 and 630
incidents per subject]8'25~3~s~6~l-S--provide further support for the accuracy of our
data.
The costs of health care attributable here to untreated opioid dependence are
comparable to differences reported for untreated chronic IDUs compared to
nonusers, ~ as well as reductions observed 3 years following discharge from
involuntary treatment ss (study vs. nonusers vs. involuntary): inpatient care (25%
vs. 33% vs. 21%), emergency care (37% vs. 51% vs. 35%), and outpatient care
(26% vs. -34% vs. 32%), nondiverted prescriptions (38% vs. not reported vs.
23%). Finally, the 32% drug overdoses receiving treatment used here to calculate
the cost of ambulance, emergency, inpatient, and outpatient physical health care
attributable to opioid dependence is similar to the 27% reported by IDUs in
London, UK. ~ Agreement among these figures provides assurance about our
estimates.
The accuracy of the calculated cost of follow-up office visits for physical health

S O C I A L C O S T S O F U N T R E A T E D O P I O I D D E P E N D E N C E 7 1 5
was examined through unadjusted comparison to the 1996-1997 Canadian National
Population Health SurveyY Comparable rates of contact with general practitioners
(79% vs. 77%) but lower utilization of follow-up visits (4.6 vs. 6.1) is explained by
the use of the emergency room for ambulatory care (6.7 vs. 6.1 visits).
The proportion of criminal activity attributable to untreated opioid depen-
dence estimated here from between-group differences in the activities of New
York City daily and irregular heroin users appear to be a reasonable proxy
measure for the City of Toronto. The proportion of overall illicit drug-related
criminality (possession/use, trafficking, property, and other income-related in-
fractions) is similar to the 81% reported by the survey respondents and compara-
ble across US areas, regardless of differences in samples of users, settings, and
data collection methods, sl Also, the 48% difference in property crime is very
similar to the 49% decline following the introduction of prescription heroin in
the recent Swiss trial. ~4 Moreover, the difference in income-related criminality
(trafficking, property, and other income-related crimes) is remarkably similar to
the amount that the survey respondents report they would eliminate if heroin
were provided to them (62.6% vs. 62.9%). Finally, the predicted 82% reduction
in days of drug consumption between daily and irregular drug users is compara-
ble to reductions over i year achieved by patients in continuous treatment (83%)
and other long-term methadone maintenance treatment (71%). ~
Analysis is sensitive to the out-of-pocket expense of crime victimization. Al-
though including stolen property in economic analysis is controversial (see Meth-
ods, above), simply excluding victims' out-of-pocket expense underestimates the
economic burden of untreated opioid dependence. Whereas the theft of personal/
household goods and retail stock--an (involuntary) transfer between members
of society--does not generate economic loss per se, the victim's net out-of-pocket
expense can be viewed as a proxy measure of the lower bound of their willingness
to pay to avoid victimization. 25 While victims of household and personal crimes
experience uncompensated losses from stolen goods and damage to property,
poorer urban residents who use alcohol and other drugs are at greater risk of
victimization. 61'63~4 In contrast, to the extent that merchants are insured and able
to pass these expenses on to paying customers, the burden of retail victimization
is distributed in complex ways across society, and estimation of its economic
cost is correspondingly more difficult. In the absence of more accurate data,
out-of-pocket expense is a conservative proxy measure of the economic cost of
household/personal crime victimization.
The victim compensation approach used here to assign monetary value to
crime victims' pain and suffering is more consistent than jury-based awards as

7 ! 6 W A L L ET A L .
it better reflects society's willingness to pay to prevent crime. Unfortunately, we
have no data sources from which to estimate the monetary value of the pain and
suffering of opioid users and their family/friends. However, a recent exercise
assumed that users or their friends/family would be willing to pay US $10,000
(Can $15,000) to avoid 1 year of the day-to-day suffering caused by drug addic-
t inny
The 85% underernployment among survey respondents is comparable to rates
reported elsewhere) z'22 For this sample, 45% reported no paid work over the past
12 months. Among those reporting paid work, however, respondents were not
active throughout the year (an average of 27.7 weeks worked per year), but they
worked full time when employed (an average of 4.9 days worked per week).
More respondents reported volunteering than the general Ontario population
(25% vs. 16%). Compared to the general population, differences in paid and
nonpaid activities reflect personal choice, stigma, and other barriers to obtaining
employment, as well as performing mandated community service.
As to the amount of economic productivity lost through opioid dependence,
guidance was sought from the evaluation literature. Empirical findings on the
effects of treatment on employment are inconsistent and inconclusive, but em-
ployment prior to treatment is an important predictor of future economic activ-
i ty9 Restricting analysis to the 55% of respondents who reported paid work in
the past 12 months yielded a conservative estimate of productivity losses. A
recent analysis reporting differences of 55% and 47%, respectively, in full- and
part-time employment between chronic IDUs and otherwise comparable
nonusers provides support for this assumption, s4 Consistent with the users' lim-
ited education and work experience, 3~ the minimum wage is a conservative
valuation of the value of their time in the formal economy. Productivity losses
may be overstated, however, if lower activity within the formal economy is
balanced partially by drug lifestyle benefits obtained from the alternative use of
this time. 2s
Finally, the predicted 1.15% per annum incidence of premature mortality from
drug overdoses and HIV infection is conservative compared to rates reported
for other countries during this period: 1.8% in England (heroin), 1.8% in Scotland
(drug injectors), and 4.4% in Sweden (drug addicts). ~ Although the survey re-
spondents were comparatively healthy, 3~ the recent 3.4% per annum rate esti-
mated from a 10-year survival analysis of a cohort of heroin users in Catalonia
with AIDS as the main cause of death s8 may foreshadow the future for Toronto
if public health measures are not implemented or expanded) While the effects
of existing (i.e., diagnosed and unknown) viral hepatitis and HIV infections

S O C I A L C O S T S O F U N T R E A T E D O P I O I D D E P E N D E N C E 7 1 7
should be reflected in subjects' reported use of health care, generalizing these
findings to the future and other settings is limited by differences in prevalence,
life expectancy, and cost of treating infected IDUs. As the prevalence of IDU-
related hepatitis and HIV are increasing in Canada, s'* these data may underesti-
mate future costs.
In conclusion, this study confirms the high economic burden of untreated
opioid dependence. The sources of harm, however, cannot be considered neces-
sarily social costs inherent to, or exclusively tied to, opioid dependence per se.
Rather, they emerge from a complex interplay among users, their drug use
behavior, and their environment as defined by social settings, drug markets,
and law enforcement and other controls. In this equation, policies directed at
controlling drug use behavior not only are limited in their effectiveness, but also
generate significant harms and costs themselves. 89 Therefore, caution must be
taken in interpreting this study to support increased law enforcement efforts or
more severe penalties for drug-related offenses. Such efforts are unlikely to be
effective deterrents to drug use. 9~ Rather, by further constraining the supply of
opioids, social cost likely would increase with greater law enforcement and crime
victimization from the increased criminal activity undertaken to purchase heroin
and other drugs.
Clearly, more effective and less-counterproductive approaches are needed to
reduce the social harm and cost of untreated opioid dependence. Comprehensive
research finds that substitution p rograms- - in the form of methadone or other
opioid maintenance--effectively reduce a broad range of harms: illicit opioid
and other drug use, crime and criminality (and related victimization), morbidity
and premature mortality, as well as poorer social and economic functioning. 93-95
Canada currently has 15% to 20% of its population with opioid dependence in
substitution treatment. 71 The strong evidence of the effectiveness of methadone
maintenance in reducing both opioid usage and crime argues for continuing the
expansion of methadone treatment availability seen over the past few years in
Ontario. 95 Opioid substitution is not a panacea as it is not acceptable to all users
nor is it universally effective among those electing treatment. However, increasing
the availability of substitution programs promises to be a first effective step in
reducing the social cost of untreated opioid dependence.
The social cost of untreated opioid dependence also argues for the examination
*R. S. Remis, M. Millson, and C. Major, The HIV epidemic among injection drug users in Ontario: the situation in 1997, unpublished study, University of Toronto Department of Public Health Sciences, Toronto, Ontario, Canada, 1997.

7 1 8 W A L L ET A L .
of novel approaches able to attract and retain users who find substi tute treatment
unacceptable. For example, low-threshold methadone programs or the medical
prescription of injection opioids have been found to reduce crime. 1 Patients with
concurrent severe mental and substance abuse disorders benefit from integrated
treatment. 96 Social cost may be reduced further from fewer overdoses, a decrease
in the complications from injecting impure drugs, and reducing the spread of
infectious diseases (viral hepatit is and HIV).
Significant in interpreting the results of this s tudy is that, of the $311,000
health care cost attributable to opioid dependence, 42% is devoted to substance
abuse treatment. This imbalance highlights the need to develop a more coordi-
nated del ivery of health care services in response to the problem of illicit d rug
use, encompassing screening to treatment options that cost-effectively engage
and retain users in therapeutic relationships. Moreover, for treating users for
whom substitution is not viable because of compliance and acceptabili ty issues,
other options should be considered. 8 Only then will the health care system cost-
effectively allocate resources to reducing the burden of opioid dependence on
both users and society. Clearly, further research is needed to increase our knowl-
edge on how to reduce the social harm and der ived cost of untreated opioid
dependence effectively and appropriately.
A C K N O W L E D G E M E N T
We would like to acknowledge constructive comments and helpful suggestions
by Greg Stoddart (Centre for Health Economics and Policy Analysis), David
Marsh (Centre for Addict ion and Mental Health), the members of the McMaster
University Polinomics Group, and two anonymous reviewers. Valuable informa-
tion was provided by Randy Welch (London Health Sciences Centre), John Land-
street (University of Western Ontario), Carol LaPrairie (Department of Justice),
Leigh-Ann Topfer (Institute of Health Economics), and Leah Malowaniec (Centre
for Addict ion and Mental Health).
R E F E R E N C E S
1. Fischer B, Rehm J, The case for a heroin substitution treatment trial in Canada. Can J Public Health. 1997;88:367-370.
2. Kendall P, Fischer B, Rehm J, Room R. Charting WHO goals for the year 2000: are we on track? Keynote address delivered at: 37th ICAA Congress; August 26, 1995; San Diego, CA.
3. Rehm J, Fischer B. Measuring harm: implications for alcohol epidemiology. In: Plant M, Single E, Stockwell T, ed. Alcohol: Minimising the Harm? What Works? London: Free Association Books; 1997:248-261.
4. Hodgson TA, Meiners MR. Cost-of-illness methodology: a guide to current practices and procedures. Milbank Memorial Fund Q/Heaith Soc. 1982;60:429-462.
S O C I A L C O S T S O F U N T R E A T E D O P I O I D D E P E N D E N C E 7 1 9
5. Single E, Robson L, Xie X, Rehm J. The economic costs of alcohol, tobacco and illicit drugs in Canada, 1992. Addiction. 1998;93:983-998.
6. Xie X, Rehm J, Single E, Robson L, Paul J. The economic costs of illicit drug use in Ontario, 1992. Health Econ [letter]. 1998;7:81-85.
7. Van Truong M, Williams B, Timoshenko G. Ontario Profile: Alcohol and Other Drugs, 1998. Toronto: Addiction Research Foundation; 1998.
8. Millar JS. A time for everything: changing attitudes and approaches to reducing sub- stance abuse. Can Med Assoc J [editorial]. 1998;159:485-487.
9. Research Group on Drug Use. Drug Use in Toronto. Toronto, ON, Canada: Drug Preven- tion Centre, City of Toronto Department of Public Health Services; 1998.
10. O'Flaherty B. Making Room: The Economics of Homelessness. Cambridge, MA: Harvard University Press; 1996.
11. Single E, Easton B, Collins D, Harwood H, Lapsley H, Maynard A, eds. International Guidelines for Estimating the Costs of Substance Abuse. Ottawa, ON, Canada: Canadian Centre on Substance Abuse; 1996.
12. Canadian CoordinatingOffice for Health Technology Assessment.A Guidance Document for the Costing Process. Version 1.0. Ottawa, ON, Canada: Canadian Coordinating Office for Health Technology Assessment; 1996.
13. Coleman C, Moynihan J. Understanding Crime Data: Haunted by the Dark Figure. Philadel- phia, PA: Open University Press; 1992.
14. Brantingham P, Easton ST. The Crime Bill: Who Pays and How Much? Victoria, BC, Canada: The Fraser Institute Critical Issues Bulletin; 1996.
15. Cohen MA. Alcohol, drugs and crime: is "crime" really one-third of the problem? [commentary]. Addiction. 1999;94:644-647.
16. Harwood HJ, Fountain D, Livermore G. The Economic Costs of AlcohoI and Drug Abuse in the United States, 1992. Rockville, MD: US Department of Health and Human Services, National Institutes of Health; 1998.
17. Deschenes EP, Anglin MD, Speckart G. Narcotics addiction: related criminal careers, social and economic costs. J Drug Issues. 1991;21:383-411.
18. Becker GS. Crime and punishment: an economic approach. ] Political Econ. 1968;82: 169-217.
19. Rajkumar AS, French MT. Drug abuse, crime costs, and the economic benefits of treatment. J Quant Criminol. 1997;13:291-323.
20. Brochu S. Estimating the costs of drug-related crime. Available at: ht tp: / /www.ccsa.ca/ brochu.htm. Accessed May 5, 1998.
21. Cohen MA. A note on the cost of crime to victims. Urban Stud. 1990;27:139-146. 22. Gillespie RW. Heroin addiction, crime and economic cost: a critical analysis. J Criminal
Justice. 1978;6:305-313. 23. Harwood HJ. Societal costs of heroin addiction. In: National Institutes of Health. NIH
Consensus Development Conference on Effective Medical Treatment of Heroin Addiction, Bethesda, Maryland, November 17-19, 1997. Washington, DC: National Institutes of Health; 1998;53-56.
24. Frei A, Greiner AR, Mehnert A, Dinkel R. Socioeconomic evaluation of heroin mainte- nance treatment. In: Gutzwiller F, Steffen T, eds. Cost Benefit Analysis of Heroin Mainte- nance Treatment. Basel, Switzerland: Karger Verlag; 2000;37-130.
25. Healey A, Knapp M, Astin J, Gossop M, Marsden J, Stewart D, et al. Economic burden of drug dependency: social costs incurred by drug users at intake to the National Treatment Outcome Research Study. Br J Psychiatry. 1998;173:160-165.
26. Harwood HJ, Fountain D, Fountain G. Economic cost of alcohol and drug abuse in the United States, 1992 [report]. Addiction. 1999;94:631-635.
27. Reuter P. Are calculations of the economic costs of drug abuse either possible or useful? [commentary]. Addiction. 1999;94:635-638.
28. Kleiman MAR. "Economic cost" measurements, damage minimization and drug abuse control policy [commentary]. Addiction. 1999;94:638-641.
7 2 0 W A L L ET A L .
29. Kopp P. Economic costs calculations and drug policy evaluation [commentary]. Addic- tion. 1999;94:641-644.
30. Goeree R, O'Brien BJ, Blackhouse G, Agro K, Goering P. The valuation of productivity costs due to premature mortality: a comparison of the human-capital and friction-cost methods for schizophrenia. Can J Psychiatry. 1999;44:455-463.
31. Fischer B, Medved W, Gliksman L, Rehm J. Illicit opiates in Toronto: a profile of current users. Addiction Res. 1999;7:377-415.
32. Dunn J, Ferri C. Epidemiological methods for research with drug misusers: review of methods for studying prevalence and morbidity. Rev Saude Publica. 1999;33:206- 215.
33. Spreen M, Zwaagstra R. Personal network sampling, out degree analysis and multilevel analysis: introducing the network concept on studies of hidden population. Int Sociol. 1994;9:475-491.
34. Watters J, Biernacki P. Targeted sampling: options for the study of hidden populations. Soc Probl. 1989;36:416-430.
35. Howell DC. Statistical Methods for Psychology. 3rd ed. Boston, MA: PWS-Kent; 1992. 36. Bolton S. Pharmaceutical Statistics: Practical and Clinical Applications. 2nd ed. New York,
NY: Marcel Dekker; 1990. 37. Altman DG, Gore SS, Gardner MJ, Pocock SJ. Statistical guidelines for contributors to
medical journals. In: Altman DG, Machin D, Bryant TN, Gardner MJ, eds. Statistics with Confidence. 2nd ed. London: BMJ Books; 2000:171-201.
38. Jacobs P, Bachynsky J. An Alberta Standard Cost List for Health Economics Evaluations. Edmonton, AB, Canada: Institute of Pharmaco-Economics; 1997. Working Paper 97-5.
39. Jacobs P, Shanahan M, Roos NP, Farnworth M. Cost List/or Manitoba Health Services. Winnipeg, MB, Canada: Manitoba Centre for Health Policy and Evaluation; 1999.
40. Wall R, DeCoster C, Roos N. Estimating per Diem Costs for Manitoba Hospitals: a First Step. Winnipeg, MB, Canada: Manitoba Centre for Health Policy and Evaluation; 1994.
41. Pope D, Fernandes CMB, Bouthillette F, Etherington J. Frequent users of the emergency department: a program to improve care and reduce visits. Can Med Assoc J. 2000;162: 1017-1020.
42. Stewart J, Rehm J, Fischer B, et al. The Social Costs of Untreated Opiate Use. Toronto, ON, Canada: Addiction Research Foundation; 1997 Research. Documents Series 137.
43. Nestman LJ. Management Control and Funding Systems:for Canadian Health Service Eexecu- tives. Ottawa, ON, Canada: Canadian College of Health Service Executives; 1989.
44. Krahn MD, Berka C, Langlois P, Detsky AS. Direct and indirect costs of asthma in Canada, 1990. Can Med Assoc J. 1996;154:821-831.
45. Rush B, Kim C, Schmidt G. A Manual for Cost Analysis of Substance Abuse Treatment. London, ON, Canada: Addiction Research Foundation; 1998.
46. Ontario Ministry of Health. Schedule of Benefits: Physician Services Under the Health Insurance Act. Toronto, ON, Canada: Ontario Ministry of Health Physician Services Branch; 1992.
47. Ontario Ministry of Health. Ontario Drug Benefit Formulary/Comparative Drug Index. Toronto, ON, Canada: Ontario Ministry of Health Drug Branch; 1996.
48. Cooper JR, Czechowicz DJ, Petersen RC, Molinari SP. Prescription drug diversion control and medical practice. ]AMA. 1992;268:1306-1310.
49. Sajan A, Corneil T, Grzybowski S. The street value of prescription drugs. Can Med Assoc J. 1998;159:139-142.
50. Goldman B. The news on the street: prescription drugs on the black market. Can Med Assoc ] [editorial]. 1998;159:149-150.
51. Johnson BD, Goldstein PJ, Preble E, et al. Taking Care o/Business: The Economics of Crime by Heroin Abusers. Lexington, MA: Lexington Books; 1985.
52. Fernandez H. Heroin. Center City, MN: Hazelden; 1998. 53. Wolff L, Reingold B. Drug Use and Crime. Ottawa, ON, Canada: Canadian Centre for
Justice Statistics; 1994. Statistics Canada, Juristat, Catalogue 85-002, Vol. 14, No. 6.
S O C I A L C O S T S O F U N T R E A T E D O P I O I D D E P E N D E N C E 7 2 1
54. Platt JJ. Heroin Addiction: Theory, Research, and Treatment. Volume 2: The Addict, the Treatment Process, and Social Control. Malabar, FL: Krieger; 1995.
55. Bell J, Mattick R, Hay A, Chan J, Hall W. Methadone maintenance and drug-related crime. J Subst Abuse. 1997;9:15-25.
56. Ball JC, Ross A. The Effectiveness of Methadone Maintenance Treatment: Patients, Programs, Services, and Outcome. New York, NY: Springer Verlag; 1991.
57. Grimes C. Adult Criminal Court Statistics, 1995-1996. Ottawa, ON, Canada: Canadian Centre for Justice Statistics; 1997. Statistics Canada, Juristat, Catalogue 85-002-XPE, Vol. 17, No. 6.
58. Swol K. Crime and Police Resources in Canadian Municipalities, 1996. Ottawa, ON, Canada: Canadian Centre for Justice Statistics; 1997. Statistics Canada Catalogue 85-223-XPE.
59. Foran T. Government Spending on Adult Correctional Services. Ottawa, ON, Canada: Canadian Centre for Justice Statistics; 1996. Statistics Canada, Juristat, Catalogue 85- 002, Vol. 16, No. 3.
60. Reed M, Morrison D. Adult Correctional Services Statistics, 1995-96. Ottawa, ON, Canada: Canadian Centre for Justice; 1997. Statistics Canada, Juristat, Catalogue 85-002, Vol. 17, No. 4.
61. Wright C. Risk of Personal and Household Victimization: Canada, 1993. Ottawa, ON, Can- ada: Canadian Centre for Justice Statistics; 1995. Statistics Canada, Juristat, Catalogue 85-002, Vol. 15, No. 2.
62. Criminal Injuries Compensation Board. Twenty-fourth Annual Report. Toronto, ON, Canada: Criminal Injuries Compensation Board; 1996.
63. McElrath K, Chitwood DD, Comerford M. Crime victimization among injection drug users. J Drug Issues. 1997;27:771-783.
64. Himelfarb A. Cost of crime to victims: preliminary findings of the Canadian urban victimization survey. Impact. 1984;2:36-49.
65. Hanvelt RA, Ruedy NS, Hogg KS, et al. Indirect costs of HIV/AIDS mortality in Canada. AIDS. 1994;8:F7-F11.
66. Rehm J, Ialomiteaunu D, Walsh G, Adlaf E, Single E. The Quantification of Mortality Caused by Illicit Drugs in Canada, 1992. Toronto, ON, Canada: Addiction Research Foundation; 1996.
67. Rettig R, Yarmolinsky A. Federal Regulation of Methadone Treatment. Washington, DC: National Academy Press; 1995.
68. Faupel C, Klockars C. Drugs-crime connections: elaborations from the life histories of hard-core heroin addicts. Soc Probl. 1987;34:54-68.
69. Strathdee SA, Patrick DM, Currie SL, et al. Needle exchange is not enough: lessons from the Vancouver injecting drug use study. AIDS. 1997;11:59-65.
70. Bruneau J, Lamothe F, Franco E, et al. High rates of HIV infection among injection drug users participating in needle exchange programs in Montreal: results of a cohort study. Am J Epidemiol. 1997;146:994-1002.
71. Fischer B. Opiate addiction treatment, research and policy in Canada--past, present and future issues. In: Rehs-Middel M, Haemmig R, Matthias R, Matthias L, eds. Heroin- Assisted Treatment for Dependent Drug Users: State of the Art and New Research Perspectives, Scientific Findings and Political Perspectives. Berne, Switzerland: University of Berne; in press.
72. Kilias M, Rabasa J. Schlussbericht zu den Auswirkungen der Verschreibung von Betaeubungs- mitteln auf die Delinquenz von Drogenabhaengigen. Lausanne, Switzerland: Institut de police scientifique et de criminologie; 1997.
73. Kilias M, Rabasa J. Less crime in the cities through heroin prescription? Preliminary results from the evaluation of the Swiss Heroin Prescription projects. Howard J Criminal Justice. 1997;36:424-429.
74. Kilias M, Rabasa J. Auswirkungen der Heroin-Verschreibung auf die Delinquenz von Drogenabhaengiger. Monatsschrift fuer Kriminologie und Strafrechtsreform. 1998;81: 1-16.
' 7 2 2 W A L L E T A L .
75. Kilias M, Rabasa J. Does heroin prescription reduce crime? Results from the evaluation of the Swiss Heroin Prescription projects. Stud Crime Crime Prey. 1998;7:127-133.
76. Drake S. Self-report among injecting drug users: a review. Drug Alcohol Depend. 1998; 51:253-263.
77. Des Jarlais DC. Validity of self-reported data, scientific methods and drug policy [commentary]. Drug Alcohol Depend. 1998;51:265-266.
78. Bell J. Self report among injecting drug users [commentary]. Drug Alcohol Depend. 1998; 51:267-268.
79. Finch E, Strang J. Reliability and validity of self-report: on the importance of considering context [commentary]. Drug Alcohol Depend. 1998;51:269.
80. Johnson ME, Fisher DG, Reynolds G. Reliability of drug users' self-report of economic variables. Addict Res. 1999;7:227-238.
81. Chaiken J, Chaiken M. Varieties of Criminal Behavior. Santa Monica, CA: RAND; 1982. Publication R-2814-ICJ.
82. Inciardi JA. Heroin use and street crime. Crime Delinquency. 1979;25:335-346. 83. Inciardi JA. Criminal Justice. Orlando, FL: Academic; 1984. 84. French MT, McGeary KA, Chitwood DD, McCoy CB. Chronic illicit drug use, health
services utilization and the cost of medical care. Soc Sci Med. 2000;50:1703-1713. 85. Maynard C, Cox GB, Krupski A, Stark D. Utilization of services by persons discharged
from involuntary chemical dependency treatment. J Addict Dis. 2000;19;83-93. 86. Powis B, Strang J, Griffiths P, et al. Self-reported overdose among injecting drug users
in London: extent and nature of the problem. Addiction. 1999;94:471-478. 87. Dunlop S, Coyte PC, McIsaac W. Socio-economic status and the utilisation of physicians"
services: results from the Canadian National Population Health Survey. Soc Sci Med. 2000;51:123-133.
88. Sanchez-Carbonell X, Seus L. Ten-year survival analysis of a cohort of heroin addicts in Catalonia: the EMETYST project [research report]. Addiction. 2000;95:941-948.
89. Fischer B, Kendall P, Rehm J, Room R. Charting WHO goals for licit and illicit drugs for the year 2000: are we on track? Public Health. 1997;111:271-277.
90. Giffen J, Endicott S, Lambert S. Panic and Indifference--the Politics of Canada's Drug Laws. Ottawa, ON, Canada: Canadian Centre on Substance Abuse; 1991.
91. Musto DF. The American Disease: Origins of Narcotic Control. New York, NY: Oxford University Press; 1987.
92. National Institute on Drug Abuse. Methadone Maintenance Treatment: Translating Re- search into Policy. Washington, DC: National Institute on Drug Abuse; 1995.
93. National Institute on Health National Consensus Development Panel on Effective Medical Treatment of Opiate Addiction. Effective medical treatment of opiate addiction. lAMA. 1998;280:1936-1943.
94. Ralston G, Wilson P. Methadone programs: the cost and benefits to society. Pharmaco- Economics. 1997;10:321-326.
95. Brands J, Brands B, Marsh DC. The expansion of methadone prescribing in Ontario, 1996-1997. Addict Res. In press.
96. Drake RE, Mercer-McFadden C, Mueser KT, McHugo GJ, Bond GR. Review of inte- grated mental health an substance abuse treatment for patients with dual disorders. Schizophr Bull. 1998;24:589-608.
Related Documents