SOCIAL CAPITAL, COLLECTIVE EFFICACY, AND THE MICRO-MACRO PROBLEM: A MULTI-LEVEL MODEL OF VIOLENCE Ross L. Matsueda University of Washington Kevin Drakulich Northeastern University Maria Grigoryeva University of Washington Rough Draft – Do not quote or cite without the author’s permission Direct correspondence to: Ross L. Matsueda, Department of Sociology, University of Washington, Seattle, Washington 98195, [email protected]. The study was supported by grants from the National Science Foundation (SES-0004324, SES-0966662) and the National Consortium on Violence Research (SBR-9513040). The funding agencies bear no responsibility for the analyses and interpretations drawn here. We thank Richard Serpe, Allen Risley, and the Social and Behavioral Research Institute for conducting the surveys, Genesys for assistance in sampling, the Seattle Police Department for providing crime data by census tract, and Jane Cover and Charis Kubrin for research assistance in our data collection efforts.

Welcome message from author
This document is posted to help you gain knowledge. Please leave a comment to let me know what you think about it! Share it to your friends and learn new things together.
Transcript
SOCIAL CAPITAL, COLLECTIVE EFFICACY, AND THE MICRO-MACRO PROBLEM: A MULTI-LEVEL MODEL OF VIOLENCE
Ross L. Matsueda
University of Washington
Kevin Drakulich
Northeastern University
Maria Grigoryeva
University of Washington
Rough Draft – Do not quote or cite without the author’s permission
Direct correspondence to: Ross L. Matsueda, Department of Sociology, University of Washington, Seattle, Washington 98195, [email protected]. The study was supported by grants from the National Science Foundation (SES-0004324, SES-0966662) and the National Consortium on Violence Research (SBR-9513040). The funding agencies bear no responsibility for the analyses and interpretations drawn here. We thank Richard Serpe, Allen Risley, and the Social and Behavioral Research Institute for conducting the surveys, Genesys for assistance in sampling, the Seattle Police Department for providing crime data by census tract, and Jane Cover and Charis Kubrin for research assistance in our data collection efforts.

ii
SOCIAL CAPITAL, COLLECTIVE EFFICACY, AND THE MICRO-MACRO PROBLEM: A MULTI-LEVEL MODEL OF VIOLENCE
ABSTRACT
This paper draws on principles of Coleman’s (1990) Foundations of Social Theory to expand upon
the concept of collective efficacy, specified by Sampson and colleagues. We begin by specifying
collective efficacy as a collective property of neighborhoods that is produced through individual
action of residents. Individual rational action, such as developing reciprocal obligations and
expectations to maximize utility in various neighborhood interactions, gives rise to social capital.
When aggregated to the neighborhood level, this form of social capital has positive externalities for
residents, and therefore becomes a public good. Residents can draw on the neighborhood social
capital to solve local problems. Moreover, in those neighborhoods with high collective efficacy,
residents are able to overcome free rider problems and establish norms of building social ties and
helping to resolve neighborhood problems. We test the central proposition that reciprocal ties
provide positive externalities (in the form of social capital) which can then be drawn upon by
residents to solve social problems, resulting in collective efficacy at the neighborhood level. We
estimate multi-level models and control for spatial effects using the Seattle Neighborhoods and
Crime Survey.

A central theoretical question in sociology concerns the micro-macro problem: How are micro-
level processes involving individual actors related to macro-level processes involving social
structure and organization? Recent theorizing has moved beyond strictly reductionist or holist
positions and conceptualized the problem as one of specifying the micro-macro link (e.g.,
Alexander et al. 1987). In an intriguing essay on emergence in sociology, Sawyer (2001)
distinguished two competing accounts of the micro-macro link. A methodologically collectivist
position concedes that individuals exist, but that macro-level entities are not reducible to
individual properties, thereby rejecting social realism. A methodological individualist position, by
contrast, grants that emergence exists, but argues that emergent properties can be explained by
relationships among individuals. Here, the challenging question concerns the micro-to-macro
transition, or how macro-outcomes are produced from individual interactions (e.g., Axelrod 1997;
Coleman 1987, 1990). Sawyer (2001) concludes that we cannot adjudicate between
methodological collectivism versus methodological individualism on a priori grounds; instead, this
is an empirical question, answerable only with the accumulation of empirical studies. Whether the
distinctions between collectivist and individualist positions consist mainly of untestable
presuppositions or empirically testable propositions is debatable; the need for empirical research
on the micro-macro problem, however, is beyond debate.
This paper presents an empirical study of the micro-macro problem, focusing on social
capital theory and examining the utility of a methodologically individualist view of emergence.
Perhaps the strongest operationalization and empirical application of Coleman’s (1990) social
capital theory is the work of Sampson and colleagues on neighborhood social capital, collective
efficacy, and informal social control. Sampson et al. (1997, 1999) develop operational indicators
of neighborhood social capital, merge Bandura’s (1985) concept of collective efficacy with Shaw
and McKay’s (1969) concept of informal neighborhood control, and find support for their theory
2
of crime using survey data on Chicago neighborhoods. These studies, however, specify purely
macro-level models of neighborhoods, in which aggregate social capital, collective efficacy and
informal social control are positively intercorrelated and negatively associated with crime rates—
all at the level of the neighborhood.
In developing social capital theory, Coleman (1987; 1990) explicitly addressed the micro-
macro problem, using a rational choice model of micro processes and specifying social capital as a
key mechanism producing the micro-to-macro transition. We follow this approach in examining a
multi-level conceptual model of social capital, collective efficacy, and informal control. Drawing
on microeconomic models of social capital (e.g., Glaeser, Laibson, and Sacerdote 2002), we
specify an individual-level rational choice model of investment in neighborhood social capital.
We argue that neighborhood social capital has positive externalities that produce resources for the
neighborhood as a whole. In turn, these resources facilitate purposive action—such as
maintaining neighborhood safety—through collective efficacy, the shared expectations that
activate social ties. We specify a hierarchical linear (mixed effects) model of individual
investment in social capital, a neighborhood model of social capital and collective efficacy, and a
spatial regression model of collective efficacy and violence. We estimate the model using data
from the Seattle Neighborhoods and Crime Survey, which interviewed over 4,000 respondents
within 123 census tracts in Seattle.
SOCIAL CAPITAL THEORY AND THE MICRO-MACRO PROBLEM
We use a methodological individualist view of emergence and the micro-macro problem, a
position dating back to Mill (1843), Menger (1883), and Hayek (1944). This position is consistent
with productive research in many areas of the social sciences, including non-linear systems,
complex adaptive systems theory (Holland 1995), multi-agent-based simulations of complex
society-level outcomes (Axelrod 1995), Schelling’s (1971) model of residential segregation (e.g.
3
Bruch and Mare (2006), Granovetter’s (1978) threshold model of collective action, and
economists’ concept of social interaction effects (e.g., Durlaf 2010).
In Foundations of Social Theory, Coleman (1990) not only developed fully a theory of
social capital, but also provided an elegant framework for addressing the micro-macro problem
from the perspective of methodological individualism. Building on McClelland (1961), Coleman
conceptualized the problem with an abstract multi-level diagram—sometimes colloquially termed,
“the Coleman boat” (see Fig. 1)—which specifies a model of macro-process, micro-process, and
links between micro- and macro-processes. From this perspective, analyses of social systems—in
which a macro explanatory concept produces a macro outcome (link 4)—is incomplete without an
internal analysis of the social system, which consists of moving to a lower level of explanation
within the system (Coleman 1990). An internal analysis entails specifying a micro process, in
which a micro-level explanatory concept produces a micro-level outcome (link 2). The model is
completed by identifying links between levels. The macro-micro link (1) specifies the effect of a
system-level explanatory concept on an individual characteristic, and is common in sociological
studies of individuals nested within social contexts (e.g., surveys of individuals within groups), in
which contextual effects are identified after controlling for individual characteristics.
The micro-macro transition (link 3) specifies how the outcomes of an individual-level
process produce a system-level outcome. This is the most challenging link to specify theoretically
and examine empirically—unless one is willing to embrace extreme methodological reductionism
and view macro outcomes as mere aggregations of micro outcomes. Otherwise, the micro-to-
macro transition entails emergence, in which “collective phenomena are collaboratively created by
individuals yet are not reducible to individual action” (Sawyer 2001, p. 552). Emergence is tied to
purpose in interaction: “The interaction among individuals is seen to result in emergent
phenomena at the system level, that is, phenomena that were neither intended nor predicted by

4
individuals” (Coleman 1990, p. 5). Moreover, emergent macro structures and organizations
“persist despite continual turnover in their constituents” (Holland, 1998. p. 7).
We can identify a variety of micro-to-macro transitions. The most elementary are
externalities, defined as costs and benefits to third party stakeholders—usually in the form of a
public or club good—for which compensation is neither collected nor paid. Economists have long
recognized that parties to a bilateral exchange do not necessarily reap all the costs or benefits of
the transaction, as in the classic case of smokers whose second hand smoke poses health risks to
nearby parties (e.g., Cornes and Sandler 1996). Externalities, which can be positive or negative,
are a special case of Merton’s (1936) unanticipated consequences of purposive action. The
concept of externalities in economics was formalized by Pigou (1920) and the idea that individual
interactions can produce unintended macro-level outcomes is likely due to Menger (1963).
Although they are the most elementary form of movement from individual action to system-level
properties, externalities may be the most prevalent micro-macro link in any society and clearly
demonstrate the concept of emergence.
Coleman (1990) identified more complex micro-macro transitions. Bilateral exchange can
be generalized to multilateral exchange, such as a market for goods. This is the prototypical
micro-macro transition because it demonstrates that certain macro-level outcomes—in this case,
the exchange price of goods—cannot be reduced to aggregations of individual behaviors, but
instead involves a broader social organization, such as the organization of a market. Prices are an
emergent property, explained by equilibrium theory, in which individual preferences and capital
combine to produce equilibrium prices through competitive exchange. Another key example of
micro-macro transitions involves authority and control. Individuals who trust others may give up
rights of control over certain actions to those others, such as citizens entering into a social contract
in which they give up the right to violate the terms of the contract (codified in law) in exchange

5
for protection over their own rights (e.g., Beccaria 1764). Such vesting of authority in others
forms the basis for the emergence of social norms, such as laws, an emergent property of social
systems based on common interests of members. Furthermore, authority relations and norms are
crucial for the emergence of hierarchical organizations, an elaborate macro-outcome (see also
Holland 1998).
Our models of neighborhood social capital and collective efficacy will focus on the role of
positive externalities, norms, and informal organizations in the micro-to-macro transition. In the
discussion section, we will return to the possibility of other more elaborate micro-macro
transitions in the transition from individual investments in social capital and neighborhood
collective efficacy.
SOCIAL CAPITAL AND THE MICRO-MACRO TRANSITION
The concept of social capital has become a major explanatory framework in the social sciences.
Originally developed by the economist Glen Loury (1977) as resources inhering in family and
community organization that facilitate child development, social capital has been popularized by
the political scientist Robert Putman (2000, p. 19), who defines social capital as “connections
among individuals—social networks and the norms of reciprocity and trustworthiness that arise
from them,” and sociologist Pierre Bourdieu (1986, p. 249), who defines social capital less
succinctly as the “aggregate of the actual or potential resources that are linked to possession of a
durable network of more or less institutionalized relationships of mutual acquaintance and
recognition—or in other words, to membership in a group—which provides each of its members
with the backing of the collectively-owned capital, a ‘credential’ that entitles them to credit in the
various forms of the word.” For our purposes, Coleman’s (1990) formulation of social capital is
most useful because he develops it within an explicit framework of the micro-macro problem.
6
Social capital is defined by two characteristics: it inheres not in an individual, but in the
structure of social relationships, and it facilitates certain forms of purposive action (Coleman
1990, p. 302). From the standpoint of the individual, social capital is a resource within a social
structure available for individuals to realize their interests. In this way, it is a capital asset—as is
physical capital and human capital—although one that is less tangible and not owned by
individuals. From the standpoint of the social system, social capital is the stuff that binds
individuals, the fundamental elements of social organization, the substrate through which social
structure facilitates purposive actions, and the medium through which those actions constitute and
reconstitute that structure (Matsueda 2013). Social capital formalizes Granovetter’s (1985)
concept of “embeddedness” of economic transactions in social relations, and thus accounts for
interdependencies between otherwise atomized individuals.
Coleman (1990) identifies four interrelated dimensions of social capital: (1) Obligations
and expectations; (2) information potential; (3) norms and sanctions; and (4) authority relations.
As the stuff that binds individuals, each of these forms of social capital constitute links in the
micro-macro transition. Rooted in a context of trust in the community, as well as the ubiquity of
the norm of reciprocity, obligations and expectations are favors exchanged among individuals.
The density of obligations and expectations in a system is determined by the level of trust in the
system (which insures that obligations will be repaid) the number of outstanding obligations, and
the degree to which members are self-sufficient versus potentially dependent on others.
Individuals who have done favors for many others hold outstanding obligations, and therefore,
have greater resources to draw upon for their purposive actions. In addition, reciprocated
exchange feeds back to create more trust: every instance of an obligation fulfilled, a favor
reciprocated, and an expectation realized adds to the stock of trust in the group or community.
Thus, social capital builds on itself. At the social system level, the density of social capital is

7
increased when exchange relationships overlap, which creates complex social networks and the
potential for multiplier effects. The specific structure of exchange relationships can facilitate
purposive action. For example, closed social networks (in which nodes form a closed system)
provide a structure that is more conducive to social capital than open networks (in which a missing
link leaves the system incomplete and open). Thus, when parents know the parents of their
children’s friends—which closes a social system—they are able to collaborate in supervising their
children.
The potential for information in social networks is another form of social capital that
facilitates purposive behavior. Clearly, the absence of relevant information can impede
instrumental action. The acquisition of information can be costly and to reduce costs, individuals
typically rely on information from social relations—such as neighbors, friends, and coworkers—
maintained for other reasons. Of course, as Granovetter (1973) pointed out long ago, weak ties
between individuals located in disparate positions of the social structure can provide novel, and
consequently at times more valuable information.1 Information can produce macro-level
outcomes. For example, Bikhchandani, Hirshleifer, and Welch (1992) showed how informational
cascades can produce irrational macro outcomes, such as stock market bubbles, even when actors
are individually acting rationally.
Norms and sanctions constitute a more elaborate form of social capital. As noted above,
the key element of norms is control or authority over action, which is transferred from the
individual to the social group based on consensus among group members—making power a
central focus of social capital theory (Coleman 1990). The emergence of norms is dependent on
social relations, such as obligations and expectations—again, illustrating that social capital builds
1 Following Granovetter (1973), Putnam (2000) distinguishes “bridging social capital” (i.e., weak ties), which links otherwise isolated groups and disparate information, from “bonding social capital (i.e., strong ties), which firmly links similar individuals (based on kinship, social class, neighborhood) and their overlapping information.

8
upon itself. Norms specify proper and improper conduct and generalize bilateral exchange
between individuals to multilateral control by groups. Norms and sanctions are needed when a
behavior creates negative externalities for multiple parties, and neither serial bilateral exchange
nor the creation of a market for rights of control—in which parties lacking control over the
behavior purchase rights of control from those who do—is easily established. The prototypical
example of a normative and sanctioning system is the social contract underlying legal systems, in
which individuals give up their freedom to violate the rights of others in exchange for the
protection of their individual rights by the legitimate threat of punishment by a political authority
(e.g., Beccaria 1764). A system of norms and sanctions, such as found in legal systems, are an
intentional macro-level outcome of purposive action. As noted by Mancur Olson (1965), norms
with sanctions are a form of selective incentives that provide a potential solution to the free rider
problem (but also raise second order free rider problems). We will return to this issue when we
discuss collective efficacy.
Finally, authority relations per se provide the basis for elaborate forms of social capital.
Authority relations arise when one individual transfers rights of control over certain behaviors to
another individual, who now has access to social capital. In the example of norms, rights of
control are vested in the group, which now has the right to sanction violators of the norm. As we
saw for norms and sanctions, the transfer of rights of control helps overcome the free rider
problem among individuals with similar interests. Authority relations provide building blocks for
hierarchical organizations, of which we can distinguish two forms: intentional versus appropriated
organizations (Coleman (1990, pages 311-13). Intentional organizations are created by members
to realize a return on their investments of time, energy, and other resources, such as a business
organization. Intentional organizations can also produce public goods, as when civic
organizations help build parks and recreation centers. Appropriable organizations are those
9
originally created for one purpose and then appropriated for another purpose (e.g., Coleman 1990).
For example, the organizational capacity of religious or charitable organizations can be mobilized
for another purpose when needed, such as when an emergency arises. This capacity illustrates a
crucial characteristic of social capital: it is not inherently defined by the normative or moral
quality of its use, but rather is neutral with respect to the potential purposive ends it may facilitate.
NEIGHBORHOOD SOCIAL CAPITAL, COLLECTIVE EFFICACY, AND CRIME
Collective efficacy theory, developed by Sampson (2012) and colleagues (e.g., Sampson,
Raudenbush, and Earls 1997), is an important recent theoretical development in criminology.
Building on Shaw and McKay’s (1942) theory of social disorganization and informal control,
Sampson et al. (1997) specified a causal mechanism by which social disorganization, reflected in
structural disadvantages of neighborhoods, produces high rates of crime and delinquency.
Drawing on Coleman (1990), they argued that neighborhood social capital provides the resources
for neighborhoods to enact informal social control. Moreover, they borrowed Bandura’s (1986, p.
449) term, “collective efficacy,” to refer to the process by which local residents activate social ties
to intervene when problems arise in the neighborhood.2
The innovation made by Sampson and colleagues was to apply the concept of collective
efficacy to neighborhood action, tie it to Coleman’s (1990) specification of neighborhood social
capital, and develop operational indicators of the concepts taken, in part, from previous surveys
(e.g., Taylor 1996). In the process, Sampson et al. (1999, p. 635) redefined collective efficacy as a
“task-specific construct that relates to the shared expectations and mutual engagement by adults in
the active support and social control of children.” Whereas social capital is the resource potential,
2 For Bandura (1986) collective efficacy is the group counterpart to self-efficacy. Whereas self-efficacy refers to “people’s judgments of their capabilities to organize and execute courses of action required to attain designated types of performances,” collective efficacy refers to group members’ individual perceptions of the group’s ability to “solve their problems and improve their lives through concerted effort” (Bandura 1986:391).

10
collective efficacy is the activation of that potential, translating social capital into purposive
action. Thus, collective efficacy is the “linkage of mutual trust and the willingness to intervene for
the common good that defines the neighborhood context of collective efficacy” (Sampson et al.
1997, p. 919). Drawing on Portes and Sensenbrenner’s (1993, p. 1323) conceptualization of social
capital as “shared expectations for action within a collectivity,” Sampson (2012) emphasizes that
collective efficacy is based on shared expectations for intervening on behalf of the common good.
We might add that once the expectations are established, behavior that conforms to expectations is
likely to be rewarded with approval and, conversely, behavior that violates expectations is likely to
be punished with disapproval. Therefore, collective efficacy has a normative aspect.
In their empirical studies, Sampson et al. (1997, 1999) provide perhaps the best
operationalization of social capital. Following Coleman (1990) they specify intergenerational
closure (parents knowing the parents of their children’s friends), reciprocated exchange (residents
incurring obligations by doing favors for neighbors), and generalized trust. They also develop
measures of “child-centered social control,” the active component of collective efficacy. They use
respondents as informants for their neighborhoods, asking them whether neighbors would
intervene if problems arose, such as youth spray-painting graffiti, disrespecting adults, and
hanging out on the street during school hours.3
Using data on Chicago neighborhoods, Sampson et al. (1997) combine two highly-
correlated constructs—cohesion and trust, and informal social control—into a single construct of
collective efficacy—and find that disadvantage, immigration, and residential stability are
negatively associated with collective efficacy. Furthermore, they find collective efficacy
negatively associated with homicide and violent victimization. Sampson, Morenoff, and Earls
3 Taylor (1994) developed these items to measure informal social control, building on the earlier work of Maccoby, Johnson and Church (1958, p. 45) who, in a study of social disorganization, operationalized informal control as “individual residents unwilling to take action if they observed their neighbors’ children engaged in some sort of deviant behavior.”
11
(1999) operationalize collectively efficacy differently and examine spatial processes across
neighborhoods. They retain informal control, renaming it child-centered control, drop social
cohesion and trust, and add two new neighborhood-level constructs: intergenerational closure and
reciprocated exchange. After combining the new highly-correlated constructs into a single index
of adult-child exchange, they find it to be positively associated with concentrated affluence and
residential stability, and negatively associated with population density. They find child-centered
social control positively associated with affluence and negatively associated with disadvantage,
immigration, and population density. Finally, they find positive spatial effects: net of other
covariates, a given neighborhood’s collective efficacy is positively associated with that of
contiguous neighborhoods. Moreover, this effect is racially patterned: white neighborhoods
disproportionately enjoy the advantage of spillover effects from surrounding high efficacy
neighborhoods, while black neighborhoods face a double disadvantage, suffering from low
average efficacy and the absence of surrounding efficacious neighborhoods. Other work has
found collective efficacy to be related to neighborhood violence (e.g., Morenoff et al. 2001), and
to mediate the effects of physical and social disorder on violence rates (Sampson and Raudenbush
1999).
Research on neighborhood social capital, collective efficacy, and informal social control is
one of the best applications of a general social capital framework to a specific social problem. As
a neighborhood study, it operates exclusively at the macro-sociological level, specifying how
macro-neighborhood structure produces social capital and collective efficacy, which affects
neighborhood crime rates, a macro-outcome (e.g., Fig 2). Recently, Sampson (2012) and others
(e.g., Matsueda 2013) have argued that collective efficacy theory should be specified within the
framework of the micro-macro problem. In the next section, we turn to the relationship between
individual behavior and the macro-social outcome of collective efficacy.

12
A MULTI-LEVEL MODEL OF SOCIAL CAPITAL, COLLECTIVE EFFICACY, AND
CRIME
We specify a multi-level model of social capital, collective efficacy, and criminal violence (see
Fig. 3). We begin with a macro-macro model of neighborhood structure producing collective
efficacy (link 4), which in turn, reduces criminal violence. We specify a rational choice model of
investment in social capital (link 2), in which investments in obligations and expectations,
intentional organizations, and appropriable organizations are a function of incentives, constraints,
and opportunities conditioned by neighborhood structure (link 1). Social capital creates a positive
externality for the neighborhood as a whole, producing resources available for collective efficacy,
the activation of social capital (link 3). In turn, collective efficacy is negatively associated with
rates of criminal violence in the neighborhood.
A Rational Choice Model of Individual Investment in Social Capital
An elementary model of social capital would rely on principles of rational choice: individuals
invest in social capital to maximize utility subject to constraints. For example, neighbors
exchange favors for instrumental reasons—they borrow a snow blower to clear their sidewalk in
compliance with local ordinances; they ask for help to repair a roof to save time and effort; they
ask neighbors to babysit their children when they cannot be home. Similarly, neighbors invest in
social ties because they provide information needed to maximize utility. Finally, residents invest
in community organizations for instrumental reasons—join a neighborhood watch to increase
safety, join a church or congregation to have a place of worship and meet likeminded people, and
join an ethnic club to maintain an ethnic identity.
We first draw on the work of Glaeser, Laibson, and Sacerdote (2002), who apply standard
micro-economic theory to a dynamic model of individual investment in social capital and then
13
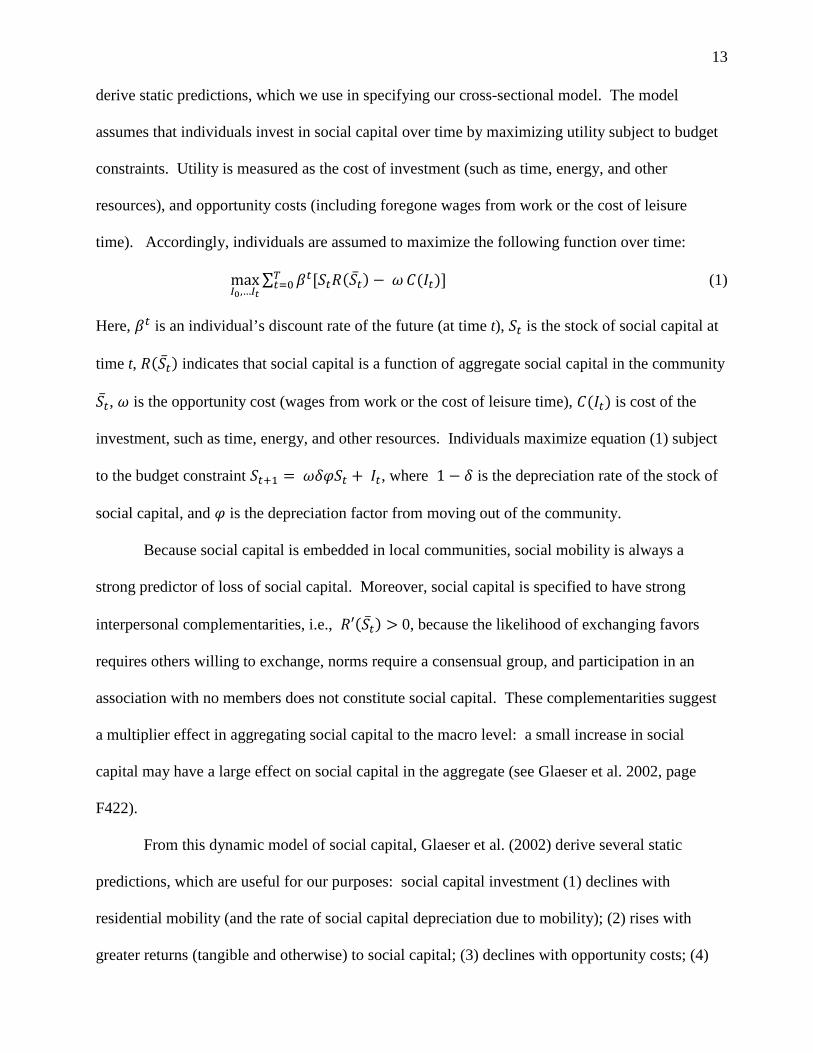
derive static predictions, which we use in specifying our cross-sectional model. The model
assumes that individuals invest in social capital over time by maximizing utility subject to budget
constraints. Utility is measured as the cost of investment (such as time, energy, and other
resources), and opportunity costs (including foregone wages from work or the cost of leisure
time). Accordingly, individuals are assumed to maximize the following function over time:
max𝐼𝐼0,…𝐼𝐼𝑡𝑡
∑ 𝛽𝛽𝑡𝑡[𝑆𝑆𝑡𝑡𝑅𝑅(𝑆𝑆�̅�𝑡) − 𝜔𝜔𝑇𝑇𝑡𝑡=0 𝐶𝐶(𝐼𝐼𝑡𝑡)] (1)
Here, 𝛽𝛽𝑡𝑡 is an individual’s discount rate of the future (at time t), 𝑆𝑆𝑡𝑡 is the stock of social capital at
time t, 𝑅𝑅(𝑆𝑆�̅�𝑡) indicates that social capital is a function of aggregate social capital in the community
𝑆𝑆�̅�𝑡, 𝜔𝜔 is the opportunity cost (wages from work or the cost of leisure time), 𝐶𝐶(𝐼𝐼𝑡𝑡) is cost of the
investment, such as time, energy, and other resources. Individuals maximize equation (1) subject
to the budget constraint 𝑆𝑆𝑡𝑡+1 = 𝜔𝜔𝜔𝜔𝜔𝜔𝑆𝑆𝑡𝑡 + 𝐼𝐼𝑡𝑡, where 1 − 𝜔𝜔 is the depreciation rate of the stock of
social capital, and 𝜔𝜔 is the depreciation factor from moving out of the community.
Because social capital is embedded in local communities, social mobility is always a
strong predictor of loss of social capital. Moreover, social capital is specified to have strong
interpersonal complementarities, i.e., 𝑅𝑅′(𝑆𝑆�̅�𝑡) > 0, because the likelihood of exchanging favors
requires others willing to exchange, norms require a consensual group, and participation in an
association with no members does not constitute social capital. These complementarities suggest
a multiplier effect in aggregating social capital to the macro level: a small increase in social
capital may have a large effect on social capital in the aggregate (see Glaeser et al. 2002, page
F422).
From this dynamic model of social capital, Glaeser et al. (2002) derive several static
predictions, which are useful for our purposes: social capital investment (1) declines with
residential mobility (and the rate of social capital depreciation due to mobility); (2) rises with
greater returns (tangible and otherwise) to social capital; (3) declines with opportunity costs; (4)

14
rises with the discount factor; (5) declines with age; and (6) rises with greater community social
capital. Empirically, they use data from the General Social Survey and find that age covaries with
social capital according to an inverted ∪-shaped curve, rising from age 20 to a peak of age 55, and
then slowly falling off. Education exerts a large positive effect, suggesting human capital and
social capital are complements. Finally, they find that expected mobility and not owning your
own home are negatively associated with social capital.
We apply this model of investment to neighborhood social capital, including obligations
and expectations, information potential, intentional organizations, and appropriable organizations
(see Fig. 4). We emphasize neighborhood exchange relationships for two reasons. First, they
have been found to be important for informal social control in previous research (e.g., Warner and
Rountree 1997; Sampson et al. 1997). Second, neighborhood social ties are the fundamental
building blocks of social capital, from which information flow and local organization develop.
Neighbors routinely borrow tools, help with problems, and do other favors when needed.
In a context in which trust is imperfect—particularly among strangers—they may ask neighbors to
watch their property when they are away. Whereas economic exchange is depersonalized by the
institutionalized rules and expectations of the market, social exchange is personal and “engenders
feelings of personal obligation, gratitude, and trust” (Blau 1964, p. 94). Failure to reciprocate
produces distrust and eventually ends the relationship; repeated reciprocation builds trust and
strengthens relationships. Moreover, repeated reciprocation within organized groups may produce
and reproduce a norm of reciprocity, including informal sanctions for failure to reciprocate. Why
would rational actors do favors for neighbors when there is a chance of non-reciprocation, or when
reciprocated, the return favor will likely be equal to or less than the value of the initial favor? An
obligation is a debt to be repaid at a time of the creditor’s choosing. A rational actor does favors
and chooses a time when the return favor is maximally valuable (Coleman 1990).

15
Our individual-level model specifies investment in neighborhood social ties, information
potential, and local organizations as a function of neighborhood social context, which implies a
macro-to-micro transition (link 1 of Fig. 4). Here, we include, most notably, residential mobility,
which depletes the community of social capital and impedes the development of new social
capital, and previous obligations, expectations, and community organizations. We also include
concentrated affluence and concentrated disadvantage, which may have countervailing
mechanisms: affluent neighborhoods may have greater resources to develop social capital but
fewer needs; conversely disadvantaged neighborhoods may have fewer resources but greater
needs.
Our rational choice model also specifies that investment in social capital is associated with
characteristics of individuals, a micro-micro effect (link 2 of Fig. 4). We expect age to affect
social capital according to an inverted ∪-shape, peaking in mid-adulthood (Glaeser et al. 2002).
Gender may be positively associated with social capital, particularly reciprocated exchange among
housewives. Racial and ethnic minorities and immigrants are expected to invest more in local
organizations, such as churches, but underinvest in exchange, given their minority numbers
combined with homophily. This effect may interact positively with neighborhood rates of
minorities and immigrants. As noted above, residential mobility should be negatively associated
with social capital investments: residents who have moved recently and who expect to move in
the near future are less likely to invest in residential exchange and local organizations, since the
investment depreciates with each move. We expect that, all else constant, higher education will be
associated with greater social capital. Income, on the other hand, may reflect an opportunity cost
and be negatively associated with social capital. Marriage and children in the home provide
incentives to invest in social capital, both organizational and exchange, as well as a potential
16
multiplier effect in the creation of social ties. Finally, having friends and family in the community
provides local social ties that facilitate exchange and organizational participation.
Micro-to-Macro Transition: Emergence from Social Capital to Collective Efficacy
Our main proposition is that investments in neighborhood social capital—obligations and
expectations, information potential, and intentional and appropriable local organizations—become
resources for purposive action within neighborhoods (link 3 of Fig. 4). We focus on collective
efficacy, the purposive action taken to maintain safe neighborhoods. In this section, we provide a
theoretical discussion of some specific mechanisms by which social capital is translated into
collective efficacy. Although our empirical analyses will not allow us to adjudicate among
specific mechanisms, it is important to provide a full accounting of the causal mechanisms
underlying our empirical models. Moreover, this discussion pays additional dividends: it explains
why collective efficacy has a public goods aspect, why it has a normative aspect, and why it raises
additional theoretical issues, such as free rider problems.
Once created, reciprocal obligations and the social ties they imply, serve as resources for
the community as a whole. This leads to our principal hypothesis to be examined empirically:
social obligations created for self-interested reasons of the parties to the exchange create the
capacity for collective efficacy in the neighborhood. That capacity is a public good, available to
all members of the community, and is a positive externality of bilateral exchange. This raises an
important question: if social ties produce greater capacity to solve neighborhood problems, how is
that capacity activated? In other words, what is the dynamic process by which neighborhoods
translate social capital into collective efficacy? We can answer that question using the problem of
controlling crime and other incivilities that arise in the neighborhood.
17
The principal mechanism by which collective efficacy reduces crime and incivilities is
informal social control. When problems of crime or incivility arise in collectively efficacious
neighborhoods, local residents recognize the problem—that is, they are paying attention—and
respond with purposive action to solve the problem informally, in the shadow of the legal system
(see Merry 1981). Typically, this involves residents confronting the offender or, in the case of
juveniles, their parents. In neighborhoods rich in social capital, residents are more likely to
perceive problems, more likely to intervene, and more likely to intervene effectively. For
example, residents are more likely to respond with, “I know your mother, and she will be very
upset with you.”
Social ties also reduce the costs of intervening in crime. At times, a crime or incivility will
entail a bilateral interchange between victim and offender, when for example the crime is an
isolated incident affecting only one victim. Here, any attempt by the victim to intervene or
sanction is costly. Acting in isolation, the victim would shoulder the entire cost of intervening,
including investing time and energy, absorbing opportunity costs, and facing potential retaliation
or unpleasant interaction with the offender. Thus, all else being equal, the victim is unlikely to
intervene and sanction the offender in isolation due to the high cost and limited effectiveness of
acting. In contrast, if local residents were capable of acting collectively, rather than individually,
the costs of intervening would disperse within the collectivity, reducing the cost for any one
individual. When neighborhood social ties are dense and multiplex, not only are collective
responses more likely, but isolated responses are more likely because individuals are confident
their neighbors have their back. Collective intervention by two or more residents also increases
the efficiency of interventions, as residents can pool resources and jointly consider alternate
strategies. For example, residents can decide to monitor and sanction transgressors jointly in
small groups or rotate such activities.
18
Collective action, of course, raises the problem of free riding.4 Collective action is rational
for the community as a whole because if all neighbors contributed, the costs would be dispersed
and, for any one individual, the reward of a safe neighborhood would outweigh the cost. At the
same time, it would be in the interest of any one individual to free ride—refrain from incurring the
cost of participating, and still reap the reward of a safe neighborhood. But if everyone pursued
their self-interest, the neighborhood would be unsafe and everyone would lose. There are two
countervailing mechanisms that make free riding more or less salient in neighborhoods. In
informal settings, such as a neighborhood, authority cannot be easily vested in a leader, who could
then command residents to contribute to the commons. Conversely, problems of social control
rarely require the simultaneous contributions of every neighbor, but instead can typically be
carried out in smaller groups.5
Social ties among residents make it possible to overcome the free rider problem by
establishing a norm of intervening when problems of local control arise. Such a norm requires
social relationships to disseminate information and create a consensus about the severity of the
problem and the efficacy, importance, and organization of intervening. Social relationships built
on trust allow members to vest authority to the social group as a whole to sanction members for
noncompliance. Thus, such organization can range from simple tacit understandings of a critical
mass of residents to a complex set of interrelated rules, expectations, and sanctions among a
widespread set of actors. Sanctioning is costly, requiring time and effort among those acting as
enforcers, which raises the second order free rider problem: potential enforcers may avoid the cost
by refraining from sanctioning and rely on others to act as enforcers. 4 By collective action, here, we include not only joint actions by two or more individuals, but also the willingness of group members to contribute to the commons—that is, to act when called upon to resolve problems of neighborhood control. 5 Mancur Olsen (1965) argued that in large groups, the costs for organizing collectively are high, the marginal return to successful action for any one individual is low, and the incentive to free ride is high. Therefore, in the absence of selective incentives, collective action to provide public goods (non-excludible and non-rivalrous) is unlikely for large groups.
19
Preexisting social ties can reduce sanctioning costs, and thereby reduce the likelihood of
second-order free riding. Residents can rely on existing relationships to sanction jointly, rather
than having to create a new relationship for the purpose of carrying out a sanction. If a resident
has an outstanding obligation due from the norm violator from an earlier exchange, he or she can
use the chip to insure compliance. Moreover, costs can be reduced by relying on social approval,
compliments, and other informal rewards, which are less costly than punitive sanctions. This
structure can transform free riding into zeal, the ultimate in collective efficacy, in which residents
receive a two-fold benefit in intervening: a safer neighborhood for themselves, and social
approval from neighbors who also benefit from the safer neighborhood. Because of this multiplier
effect, neighbors will respond by sanctioning each other with zeal, increasing the likelihood that a
given resident will contribute to the public good by intervening when problems in the
neighborhood arise. Such processes, however, cannot increase indefinitely, but have a natural
upper bound. Kudos, approval, and social status have limits as a reward in finite groups because,
as Kitts (2007) has shown, when such incentives are rival—that is, rewarding one neighbor will
reduce the value of the reward to another—perverse outcomes can result, such as an anti-social
norm in which neighbors try to stop other neighbors from rewarding others.
The existence of social relationships facilitates the flow of information relevant to
purposive action, such as contributing to a safe neighborhood. Indeed, the quick dissemination of
information about problem neighborhood youth, unsavory outsiders, and minor acts of vandalism
can be crucial for repressing early acts of incivilities before they spread. Collecting such
information can be costly, requiring a search of residents in the know and investment of time to
acquire the information. Such costs are substantially reduced when information is gleaned from
relationships established for other purposes. Thus, neighborhoods with strong network ties, as
well as weak ties to disparate groups, will be rich in information relevant to neighborhood safety.
20
Social relationships and social norms are also building blocks for intentional and
appropriated neighborhood organizations, allowing residents to vest authority in a group, which
develops rules, expectations, and norms. The prototypical neighborhood association is a block
watch, which organizes residents to monitor and report crimes in their neighborhoods. Block
watches can vary from ineffectual symbolic compliance by a few victims to police-initiated
programs to active forums that build social networks and collective efficacy. Other community
organizations, such as religious, political, and recreational organizations can be appropriated to
address problems of social control when they arise. Previous work has found only modest effects
of neighborhood organizations on collective efficacy (e.g., Sampson et al. 1999).
In sum, when purposive acts by youth—such as vandalism, loitering, and fighting—have
negative externalities for multiple residents, collective intervention becomes possible if social
relationships exist, regardless of the original purpose for which the relationships were formed.
From the standpoint of the original bilateral exchange, the social relationship has a positive
externality in which it becomes a public good by serving as a foundation for collective
intervention. From the standpoint of the social system—in this case the neighborhood—the
purposive action generating social relationships have “unanticipated consequences” that are
latently functional for the system as a whole (Merton 1936). From the standpoint of social capital
theory, the public goods aspect of social capital, in which the returns are only partially consumed
by the investors—the two parties to the initial bilateral exchange—illustrates three important
theoretical points: (1) social capital is often an unintended by-product of purposive interaction, (2)
social capital created for one purpose can later be used for other purposes; and (3) there is a
tendency to under-invest in social capital compared to other forms of capital.
Having established principal causal mechanisms by which social capital generates informal
social control, we turn now to an empirical test of (1) whether social capital is generated in ways
21
consistent with rational choice at the individual level, (2) whether social capital is related to
informal social control at the neighborhood level, and (3) whether collective efficacy is, in turn,
related to neighborhood rates of criminal violence.
DATA, METHODS, AND HYPOTHESES
The Seattle Neighborhoods and Crime Survey
To examine these hypothesized relationships, we use survey data from the Seattle Neighborhoods
and Crime Survey (SNCS). Because of its geographic proximity, tucked away in the Pacific
Northwest of the U.S., its historical development and migration patterns, and its lower levels of
residential segregation and absolute poverty, Seattle provides a fairly large city that contrasts with
metropolitan areas, such as Chicago and New York, used in previous research on neighborhood
social capital. The SNCS collected data from three separate sampling schemes: (1) a stratified
random sample of households within each of 124 inhabited census tracts in Seattle, (2) a sample of
households within each of six street segments sampled within each of 100 census tracts by
Terrance Miethe’s (1991) earlier survey of Seattle residents, and (3) a race-ethnic oversample of
census blocks with the highest proportion of racial and ethnic minorities. Sampling used a
constantly-updated multi-sourced set of white pages. The telephone survey, conducted by the
Social and Behavioral Research Institute in 2002-03, asked adult respondents about their
neighboring behavior, their views of the neighborhood, collective efficacy and social capital,
demographics, and crime victimization. The number of completed interviews was 4,994,
corresponding to a CASRO-4 response rate of 51.3 percent and cooperation rate of 97 percent. To
examine whether the sampled households differed from households with either no phones or
unlisted numbers, we drew a supplemental random sample of nearly 400 households with no
telephone listing, administered a written questionnaire, and found very similar distributions on key
22
variables. After dealing with small amounts of missing values, our analysis sample is 4,606
households within 123 census tracts, an average of 37 households per tract.6
The survey data are supplemented with data from the U.S. Census, which provides
characteristics of census tracts, including socioeconomic status, racial and ethnic composition, and
residential stability. The final source of data, from the Seattle Police Department, provides rates
of criminal violence for the years 1996-1998 and 2003-2005.
Measures
Our measures are listed in Appendix Table A1; descriptive statistics appear in Table 1. We use
five constructs from the U.S. Census to capture neighborhood structure. Concentrated
disadvantage is an index comprised of percent poverty, percent unemployed, percent female-
headed household, and percent black (e.g., Land, McCall, and Cohen 1990). Concentrated
affluence is an index comprised of percent income above $75,000, percent adults with a college
education, and percent employed in professional or managerial occupations (e.g., Brooks-Gunn,
Duncan, Kato, and Sealand 1993). Because percent immigrant and percent Asian are nearly
coterminous at the tract level in Seattle, we combine them into a single index, but treat percent
Latino separately. Residential stability is an index of percent homeowners and percentage of
residents living in same household over the last five years, and population density is the number of
residents in the census tract. We use separate measures of violent crimes rates per census tract
based on police reports, one for 1996-98 and the other for 2003-05.
Individual respondent characteristics are taken from the SNCS survey, including the
respondent’s age, years of education completed, household income, length of residence, and
number of moves in the last five years. A set of dummy variables captures dichotomous
6 To control for disproportionate sampling of census blocks for our ethnic oversample, we control for the racial-ethnic composition of the census block. We are interested in making model based inferences to population parameters, rather than descriptive inferences to population summary statistics (for a discussion of this issue, see DuMouchel and Duncan 1983; Winship and Radbill 1994).

23
characteristics of respondents including female, African-American, Latino, Asian, foreign born,
homeowner, and married or cohabitating. Other respondent characteristics, which may affect
social capital formation include number of children, number of relatives in the neighborhood,
number of friends inside and outside the neighborhood, the likelihood of moving, and the
likelihood of missing the neighborhood if the respondent had to move. We control for additional
dummy variables for methodological reasons, including being in the ethnic over-sample, the
Miethe replication sample, and the mail-back sample. For our response bias models of collective
efficacy, we include a dummy variable for respondents who changed their answer to our repeated
measure of informal social control, suggesting uncertainty in their assessment.
We examine five endogenous variables capturing social capital and informal social control.
First is obligations and expectations, measured with four Likert-scale items, such as watched
neighbors property when out of town, and borrowed tools from neighbors. These items have been
used extensively in the neighborhoods and crime literature (e.g., Miethe and Meier 1994; Sampson
et al. 1997, 1999; Rountree and Warner 1999). The second is informal social control, measured
with five Likert-scale items, such as “Would your neighbors do something about children (1)
skipping school and hanging out on the street; (2) spray painting graffiti; (3) showing disrespect to
an adult; (4) fighting in the street.” This is the classic measure of informal social control, which
derives from Maccoby et al. (1958), Taylor (1994), and Sampson et al. (1997, 1998). Third are
intentional organizations, measured by four items, including participate in neighborhood
associations and in block activities sponsored by the police. This concept captures organizational
forms of neighborhood social capital intended to serve the neighborhood. Fourth are appropriable
organizations, including participation in church, charitable, or racial-ethnic organizations. This
captures organizational forms of neighborhood social capital that could be appropriated to address
local problems. Finally, we examine informal information potential by a single item measuring

24
whether residents stop to chat with neighbors. Our final outcome is the rate of violent crime,
measured by police reports of murder, rape, robbery, and aggravated assault between 2003-2005.
We also control for prior violence between 1996-98.
Statistical Models and Hypotheses
To link an individual-level model of investment in social capital to a neighborhood-level model of
community structure, aggregate social capital, and collective efficacy, we estimate a multi-level
(linear-mixed) model for data in which individuals are nested within neighborhoods. As a
preliminary matter, we estimated confirmatory factor measurement models of informal social
control and found reasonable measurement properties (see Appendix B). Our multi-level models
of social capital begin with an individual-level equation of investment in three forms of social
capital—obligations and expectations, intentional organizations, and appropriable organizations:
01
,Q
ij j qj qij ijq
y Xβ β ε=
= + +∑ (1)
where yij is social capital for individual i in the census tract j, β0j is the intercept for census tract j,
βqj is the coefficient for Xqij, the covariate q measuring incentives, constraints, and opportunities
for individual i in neighborhood j, and εij is the disturbance term capturing the unique variance in
social capital for individual i in neighborhood j and assumed to be normally distributed and iid.
The model also includes a neighborhood-level equation of the effect of neighborhood structure on
aggregate social capital:
0 00 01
P
j p pj jp
Z Uβ θ θ=
= + +∑ (2)
where θ00 is the grand mean, θp is the coefficient for Zpj the covariate p for neighborhood j, and U0j
is the error term for neighborhood j, assumed to be normally distributed and iid.

25
These multi-level models of social capital amount to a classic contextual effects model
with random effects to control for dependence across individuals within neighborhoods. We can
see this clearly by substituting the second equation for the neighborhood intercepts, β0j, into the
first equation:
00 01 1
QP
ij p pj qj qij j ijp q
y Z X Uθ θ β ε= =
= + + + +∑ ∑ (3)
Here, the individual-level (within neighborhood) component represents a rational choice process
in which βqj captures incentives and constraints Xqij of individuals within neighborhoods. The
neighborhood-level (between neighborhood) component represents the contextual effects of
structural covariates on obligations and expectations once individual-level covariates are
controlled.7 The two error components consist of variation across neighborhoods (U0j) orthogonal
to regressors and variation across individuals and neighborhoods ( ijε ) orthogonal to regressors and
U0j.
The multi-level model for informal social control has the identical structure described by
equations (1) and (2), but a substantially different interpretation (e.g., Sampson et al. 1997). The
measure of informal control asks respondents not whether they would intervene if problems arose
in their neighborhoods, but rather whether their neighbors would intervene. Respondents are
treated here as informants about the objective characteristics of their neighborhoods. Of course,
some respondents may make better informants than others, providing more accurate reports of
neighborhoods. For example, suppose the elderly tend to be isolated in their homes and therefore
isolated from neighbors exhibiting efficacious behavior. They may, on average, under-report the
amount of collective efficacy in any neighborhood. If some neighborhoods have
disproportionately more elderly, those neighborhoods will score lower on collective efficacy 7 Given our specification of individual characteristics as a function of neighborhood structural covariates, these contextual effects are more accurately termed total effects.
26
measures than neighborhoods with few elders. Therefore, one would want to adjust neighborhood
scores by weighting: in neighborhoods with few elderly, the responses of elders would be
weighted more heavily, and in neighborhoods with many elderly, the responses will be weighted
lightly. Our response models do precisely this, using regression weights βqj for those
characteristics of respondents Xqij that we believe may bias individual responses, and εij captures
individual-specific random response variability. Consequently, the adjusted scores will equal the
neighborhood scores expected if their composition of resident characteristics approximated the
average of all neighborhoods. The second level equation, then, is the usual macro-level or
aggregate equation of neighborhood collective efficacy—purged of response bias—regressed on
structural characteristics of the neighborhood.
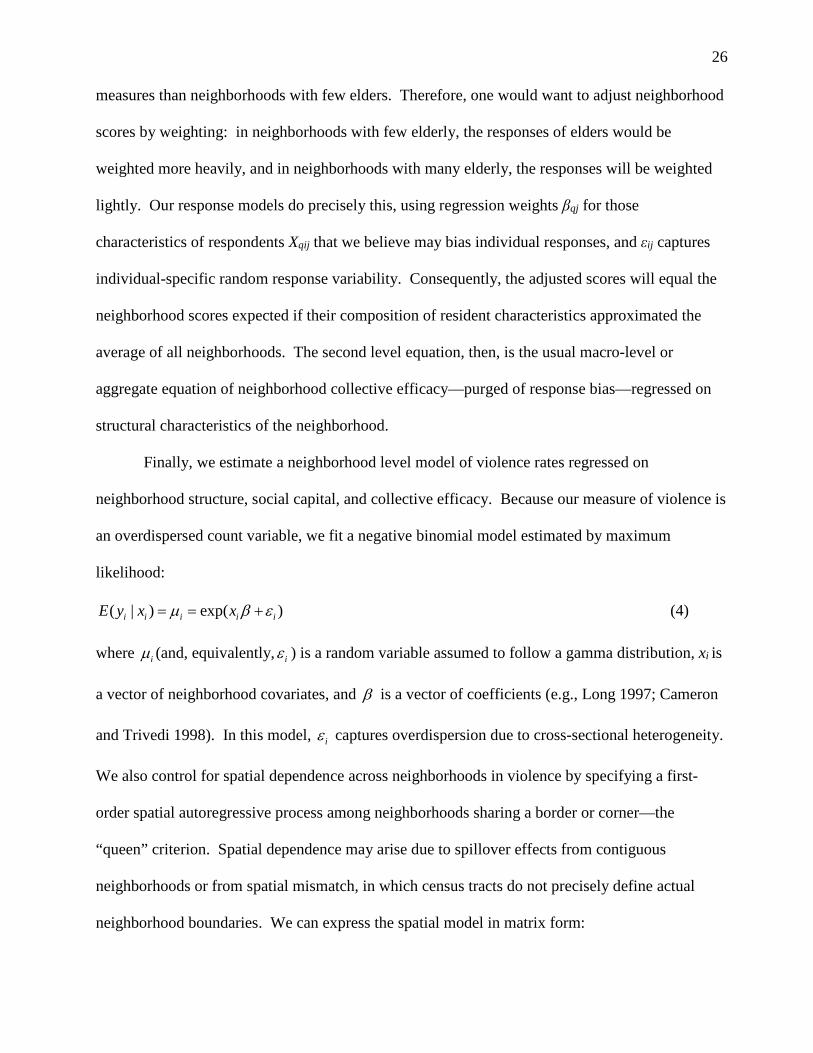
Finally, we estimate a neighborhood level model of violence rates regressed on
neighborhood structure, social capital, and collective efficacy. Because our measure of violence is
an overdispersed count variable, we fit a negative binomial model estimated by maximum
likelihood:
( | ) exp( )i i i i iE y x xµ β ε= = + (4)
where iµ (and, equivalently, iε ) is a random variable assumed to follow a gamma distribution, xi is
a vector of neighborhood covariates, and β is a vector of coefficients (e.g., Long 1997; Cameron
and Trivedi 1998). In this model, iε captures overdispersion due to cross-sectional heterogeneity.
We also control for spatial dependence across neighborhoods in violence by specifying a first-
order spatial autoregressive process among neighborhoods sharing a border or corner—the
“queen” criterion. Spatial dependence may arise due to spillover effects from contiguous
neighborhoods or from spatial mismatch, in which census tracts do not precisely define actual
neighborhood boundaries. We can express the spatial model in matrix form:

27
𝑦𝑦 = 𝜌𝜌𝜌𝜌𝑦𝑦 + 𝑋𝑋𝛽𝛽 + 𝑢𝑢 (5)
where 𝑦𝑦 is a j × 1 vector of violence rates, 𝜌𝜌 is an autoregressive parameter, 𝜌𝜌 is a j × j spatial
weight matrix indicating a first-order process, 𝑋𝑋 is a j × q matrix of independent variables, 𝛽𝛽 is a
q × 1 vector of coefficients, and 𝑢𝑢 is a j × 1 error term assumed iid. This model assumes not only
that 𝑦𝑦𝑖𝑖 at one location is related to 𝑦𝑦𝑗𝑗 at all other locations in the city—diminishing with
distance—but is also related to 𝑋𝑋𝑗𝑗 at all other locations (Anselin 1988).8 The latter is revealed by
examining the reduced form:
𝑦𝑦 = (𝐼𝐼 − 𝜌𝜌𝜌𝜌)−1 𝑋𝑋𝛽𝛽 + (𝐼𝐼 − 𝜌𝜌𝜌𝜌)−1𝑢𝑢 (6)
where 𝑦𝑦𝑖𝑖 is related to 𝑋𝑋𝑖𝑖, as well as 𝑋𝑋𝑗𝑗 at all other locations in the city, again diminishing with
distance from the neighborhood i.
RESULTS
Models of Individual Investment in Neighborhood Social Capital
Table 1 decomposes the variance in measures of social capital and informal social control into
within-neighborhood (𝜎𝜎2) and between-neighborhood (𝜏𝜏00) variance. For each of the variables,
the majority of variance occurs within neighborhoods: intraclass correlation coefficients reveal
that the percentage of total variance that is between neighborhoods ranges from a low of .011 for
appropriable organization to a high of .146 for informal social control (column 5). Nevertheless,
in each case, the between-neighborhood component is statistically significant (p < .001) as shown
by the χ2 test (see column 4). These results translate into reasonable reliabilities for our measures,
with the possible exception of appropriable organization, as indicated by average reliabilities
(column 6) and range of reliabilities across neighborhoods (column 7). Thus, it appears that we
have significant between-neighborhood variation to model, which is measured reasonably reliably.
8 By distance, we mean the number of neighborhoods that intervene between two neighborhoods.

28
The results of our multi-level models of social capital appear in Table 2. The top panel
presents our individual-level rational choice models of investing in each of four forms of social
capital. Turn first to obligations and expectations, the most fundamental form of neighborhood
social capital (column 1). As hypothesized, age has a significant association with neighborly
exchange, following an inverted ∪ shape (rows 1 and 2). As hypothesized, women are slightly
more likely to exchange, whereas Hispanics, Asians, and immigrants are less likely to exchange.
As expected, education is positive associated with exchange. Also as expected from a rational
choice model, homeowners and long-term residents are more likely to invest in obligations,
whereas those who move frequently are less likely to invest (rows 8-10). Residents who are
married or cohabiting and who have more children in the home have stronger incentives and
greater opportunities to exchange favors with neighbors. As expected, those residents who have
friends in the neighborhood (as well as outside the neighborhood) are more much more likely to
exchange with their neighbors, as it eliminates the cost of establishing a new relationship for
exchange. Local friends exerts the strongest effect on obligations and expectations (standardized
coefficient of .28). Finally, residents who express an affective relationship with their
neighborhoods are more likely to exchange. The model explains 30 percent of the variance in
obligations and expectations.
Columns 2-4 of Table 2 present individual-level results for information potential,
intentional organizations, and appropriable organizations. Not surprisingly given that most
information flows through exchange relationships, the model for information potential closely
resembles the model for exchange, although age is only slightly and linearly associated with
information. Asian and foreign-born residents are less likely to exchange information, whereas
homeowners, the highly educated, the married and cohabiters, and residents with more children in
the home are more likely to talk to neighbors. Friends in the neighborhood exerts the strongest
29
effect on information flow (standardized coefficient of .15), followed by affective attachment
(.14). The one anomaly is the slightly negative effect of years in the neighborhood. Our model
explains 13 percent of the variance in information potential.
The model for participating in intentional organizations (such as a neighborhood watch)
also reveals a strong inverted ∪ shape (column 3, rows 1 and 2). Neither race-ethnicity nor
immigrant status affect the likelihood of participating in intentional organizations. As
hypothesized, however, residents who have moved more in the past are less involved in intentional
organizations, whereas residents who have lived in the neighborhood longer and who are
homeowners are more involved. As expected, residents who are married or cohabitating and have
more children at home have greater incentives to join a neighborhood watch. Also as expected,
those with more local friends are more likely to join as well as those with stronger attachment to
the neighborhood. The model explains 20 percent of the variance in intentional organizations.
Turning to appropriable organizations, such as churches, racial-ethnic associations, and
charitable organizations, we find, with two exceptions, similar results: greater participation
among residents who have lived in the neighborhood longer, are more educated, have more
children, have more friends in and out of the neighborhood, and are more attached to the
neighborhood. The exceptions include a ∪-shaped age-curve—perhaps because the incentives to
attend church and other organizations are greater when children are young and after retirement.
The other exception is that African-Americans are substantially more likely to participate, and to a
lesser extent, Asians and Latinos—perhaps because we include church and racial-ethnic
organizations. The model explains 13 percent of the variance in participation in appropriable
organization. In sum, our individual-level models are consistent with a rational choice explanation
of social capital, in which investments are a function of opportunities, expected costs and expected
30
benefits. We turn now to our second-level equations which estimate effects for our macro-level
models of aggregate social capital.
Figure 4 shows that the macro effects of neighborhood context are hypothesized to affect
investments in social capital indirectly through individual characteristics reflecting utility
maximization (link 1 × link 4). A test of this specification would examine whether the effects of
neighborhood covariates on social capital are mediated by individual characteristics, which is
revealed by comparing the total effects of neighborhood covariates to contextual effects that
control for individual covariates. Table 3 presents total effects of neighborhood covariates in a
random-intercepts HLM model emptied of individual covariates.
The lower panel of Table 2 presents coefficients for social capital regressed on
neighborhood covariates, while holding constant individual covariates. These models explain a
substantial amount of between neighborhood variance, ranging from .60 for intentional
organization to .99 for appropriable organization.9 The neighborhood coefficients correspond to
the classic definition of contextual effects as “macro processes that are presumed to have an
impact on the individual actor over and above the effects of any individual-level variables that
may be operating” (Blalock 1984, p. 354). We find that, net of individual covariates,
neighborhood exchange is less likely in densely populated and predominantly Asian and
immigrant neighborhoods, and more likely in residentially-stable neighborhoods. Information
potential is also more likely in neighborhoods that are predominantly Asian and immigrant and
have greater residential stability. In contrast, investment in intentional and appropriable
organizations are much more likely in disadvantaged neighborhoods (standardized effects over
9 These models suggest that, with the exception of information potential, our individual-level covariates explain nontrivial amounts of between-neighborhood variance in social capital. This increased variance is revealed by comparing the R2 for these models to corresponding models that exclude individual covariates: for intentional organizations, .60 vs. .45; for appropriable organizations, .99 vs. .81, for information potential, .85 vs. .82, and for obligations and expectations, .96 vs. .85. See Appendix C for a comparison of these models.

31
two-fifths of a standard deviation). Intentional organizations are also more likely in Latino
neighborhoods.
Models of Informal Social Control
Table 3 presents coefficients from a multi-level model of informal social control. The top panel
presents our individual-level model of respondent bias. We find that informal control is overstated
by older respondents, Hispanics, and foreign-born. Although residents with greater income
slightly overstate informal control, those with greater education tend to understate it. As expected
those with more children in the home and who are less certain about informal control (changed
their responses to the test-retest item) tend to understate informal control. Also as expected those
who have invested in social capital, including intentional and appropriable organizations,
information potential, and obligations and expectations, tend to overstate informal social control,
compared to those who have not made such investments. Our response model explains 14 percent
of the variance in responses to informal control, suggesting a nontrivial amount of compositional
bias due to characteristics of residents. Having reweighted responses to informal social control
questions, we now turn to our substantive models of neighborhood informal control.
The bottom panel of Table 3 presents coefficients for our neighborhood-level model of
informal social control. Column 1 presents reduced form coefficients for neighborhood census
characteristics. Column 2 adds our neighborhood social capital variables. We find that, as
hypothesized, informal control is positively associated with concentrated affluence and negatively
associated with concentrated disadvantage. Informal control is also less likely in neighborhoods
with higher percentages of Latinos and higher population densities. Net of social capital,
residential stability has a slightly positive but nonsignificant effect on informal control.
Turning to our social capital measures, we find that, as hypothesized, obligations and
expectations—the most fundamental and elementary form of social capital—are positively

32
associated with informal social control. Combined with our micro-level findings, this is the key
hypothesis of our study, illustrating the micro-macro transition. Local residents exchange favors
for instrumental reasons, following a utility maximization model; the resulting social capital
contributes to the stock of neighborhood social capital, which in turn, becomes a resource for the
neighborhood as a whole to activate when problems of control arise. Thus, through a positive
externality, social capital created for instrumental private reasons contributes to aggregate
neighborhood social capital, which in turn, produces neighborhood collective efficacy. The
standardized coefficient for obligations and expectations (.26) is the largest of the model for
informal social control, followed by concentrated disadvantage (-.24) and concentrated affluence
(.20). The other dimensions of social capital do not significantly affect informal social control.
Contrary to our hypothesis, intentional organizations are slightly negatively associated with
informal control. Statistically, we fail to reject the null hypothesis of no effect. The negative sign
perhaps reflects the reality that neighborhood watches are more likely to appear in crime-ridden
neighborhoods lacking collective efficacy. Appropriable organizations and information potential,
likewise, have no effect on informal control. Our macro-level model explains 93 percent of the
variance in informal social control.
We examined the possibility that neighborhood informal social control is spatially
dependent across contiguous neighborhoods (e.g., Sampson et al. 1999). Spatial dependence can
arise through two mechanism, including (1) spillover effects, in which the collective efficacy of
one neighborhood spills over and increases collective efficacy in adjacent neighborhoods, and (2)
spatial mismatch, in which the neighborhood boundaries used—in this case, census tracts—do not
adequately capture true boundaries. To examine and test for spatial dependence, we estimated a

33
model with a first-order autoregressive spatial lag parameter.10 The results appear in Table 4. The
principal results from this analysis are twofold: First, the spatial lag parameter provides evidence
for spillover effects or spatial mismatch: the coefficient is positive in sign, statistically significant,
and substantial in magnitude (standardized coefficient of .28), a finding consistent with that of
Sampson et al. (1999).11 Second, controlling for the spatial lag, obligations and expectations exert
a significant effect on informal social control of about the same magnitude of our HLM models
(.23). The other forms of social capital again fail to affect informal social control significantly.
Our models have assumed that obligations and expectations are causally prior to informal
control. We have assumed that informal control does not feed back on obligations and
expectations and that the disturbances of the two equations are not correlated. If either of these
assumptions are violated, our key estimate of the effect of obligations-expectations on informal
control may be biased. Therefore, we examined the sensitivity of this estimate to a model with
weaker assumptions. If the true model is a simultaneous equation model with reciprocal causation
and correlated disturbances, we can partially identify the model with an instrumental variable for
obligations and expectations and obtain a consistent estimate for the effect of reciprocated
exchange on informal control (for details see Appendix C). We use as an instrumental variable,
obligations and expectations measured in 1990 from Miethe’s (1991) survey of 5,302 residents
spread over 100 census tracts in Seattle neighborhoods. Together, the two datasets constitute a
10 In regression models, if the spatial dependence process is uncorrelated with regressors, the result is consistent but inefficient parameter estimates and biased standard errors, which can be overcome by allowing for spatially autocorrelated disturbances. If the spatial dependence process is correlated with regressors, the result is biased and inconsistent parameter estimates, which can be overcome by including a spatial autoregressive term that is allowed to correlate with regressors. A Lagrangian multiplier test suggested an autoregressive model, which we estimated after computing a bias-corrected score for informal social control using empirical Bayes residuals (see Raudenbush and Bryk 2002). 11 We do not find the racial patterning of spatial externalities found in Chicago, in which white neighborhoods low in collective efficacy benefit from surrounding neighborhoods high in collective efficacy, whereas black and Latino neighborhoods high in collective efficacy are challenged by surrounding low collective efficacy neighborhoods (see Sampson et al. 1999). In Seattle, white neighborhoods tend to be high in collective efficacy and surrounded by high collective efficacy neighborhoods, while black neighborhoods tend to be low in collective efficacy and surrounded by low collective efficacy.

34
two-wave repeated cross-section design. We assume that controlling for 2002 reciprocated
exchange, 1990 reciprocated exchange has no direct effect on 2002 informal social control.12 The
results of this model appear in Table 5. We find that lagged obligations-expectations is a strong
instrumental variable, exerting a standardized effect of .38 on 2002 obligations-expectations.
Moreover, when controlling for the potential biasing effects of reciprocal effects and correlated
disturbances, obligations-expectations maintains a strong and significant positive effect on
informal control.
Models of Violent Crime
Having found that obligations and expectations follows a rational choice model of investment in
social capital, which creates a neighborhood resource that translates into informal control, we turn
now to whether this process produces safe neighborhoods, as hypothesized by Sampson (2012)
and colleagues (1997, 1999). Table 6 presents results of a negative binomial regression model of
violent crime. Model 1 regresses violence on neighborhood structure and social capital. As
hypothesized, violence is significantly higher in concentrated disadvantaged neighborhoods,
substantially lower in residentially stable neighborhoods (standardized coefficient of .50), and
lower in more densely populated neighborhoods. Moreover, violence is significantly lower in
neighborhoods rich in social capital (standardized coefficient of -.21). Model 2 adds informal
social control to the equation, which, as hypothesized is strongly and negatively associated with
violent crime (standardized coefficient of -.32). With informal control in the model, the
coefficient for obligations and expectations drops by half and is no longer statistically significant.
Thus, neighborhoods rich in social capital experience less violence because they translate social
12 In other words, we are assuming no lagged effect in the presence of a simultaneous effect. This exclusion restriction identifies the effect of reciprocated exchange on informal social control, while controlling for a potential reciprocal effect and correlated disturbances. This is assumption assumes that if reciprocated exchange and informal control for a simultaneous system, the system has yet to reach equilibrium. This assumption is substantially weaker than simply assuming that causation is unidirectional and disturbances are uncorrelated.

35
capital into informal social control. Finally, model 3 controls for previous violent crime, which
exerts a strong effect on current violence (standardized coefficient of .41), implying stability in
violence over time. Nevertheless, model 3 reveals that informal control maintains a significant
effect on violence when controlling for previous violence. This result supports the central
proposition of collective efficacy theory.
DISCUSSION Our results
The key to collective efficacy is the development of a critical mass of individuals who (1) have a
very high interest in the public good (maintaining a safe neighborhood), (2) have access to
resources available for producing the public good (including the time, energy, and requisite social
and physical skills to devote to matters of crime), and (3) for whom the cost of contributing to the
public good is low (e.g., have few opportunity costs). All else being equal, neighborhoods with
greater numbers of residents and residents more heterogeneous on these three dimensions will be
more efficacious because they are more likely to achieve a critical mass of residents who have
very high interest, access to resource, and low costs of contribution (Oliver and Marwell 1985).
To this point, we have been treating the neighborhood as a voluntary system of collective
action, in which residents face a first-level choice of whether or not to contribute to the public
good. Neighborhoods characterized by normative systems of collective action achieve greater
collective efficacy by mandating cooperation via social norms with effective sanctions. In
normative systems, residents face not only the decision to contribute to the public good, but also a
second-level choice of whether or not to control others by either (1) ignoring others; (2) enforcing
norms of compliance; or (3) opposing such norms by undermining compliance. Voluntary
systems lack social norms of compliance; compliance control systems consist of norms of

36
compliance; and balanced systems contain compliance control systems as well as oppositional
systems.
37
REFERENCES
Alexander, Jeffrey C., Bernhard Giesen, Richard Münch, and Neal J. Smelser. 1987. The Micro-
Macro Link. Berkeley: University of California Press.
Bandura, Albert. 1986. Social Foundations of Thought & Action: A Social Cognitive Theory.
Englewood Cliffs, NJ: Prentice-Hall.
———. 1997. Self-Efficacy: The Exercise of Control. New York: W. H. Freeman.
Beccaria, Cesare. 1963 [1764]. On Crimes and Punishments. Indianapolis, IN: Bobbs-Merrill.
Blau, Peter M. 1964. Exchange and Power in Social Life. New York: Wiley.
Bourdieu, Pierre. 1986. “The Forms of Social Capital.” In Handbook of Theory and Research for
the Sociology of Education, edited by J. Richardson, 241–58. New York: Greenwood.
Brock, William A., and Steven N. Durlauf. 2001. “Interactions-Based Models.” In Handbook of
Econometrics, edited by J. J. Heckman and E. Leamer, 3297–380. New York: Elsevier
Science.
Buchanon, James M. 1965. “An Economic Theory of Clubs.” Economica 32: 1–14.
Coleman, James S. 1983. “Microfoundations and Macrosocial Behavior.” In The
Microfoundations of Macrosociology, edited by M. Hechter, 153–73. Philadelphia: Temple
University Press.
———. 1986. “Social Theory, Social Research, and a Theory of Action.” American Journal of
Sociology 6: 1309–35.
———. 1988a. “Free Riders and Zealots: The Role of Social Networks.” Sociological Theory 6:
52–57.
———. 1988b. “Social Capital in the Creation of Human Capital.” American Journal of
Sociology 94: 95–120.
———. 1990. Foundations of Social Theory. Cambridge: Harvard.

38
Durlauf, Steven N., and Marcel Fafchamps. 2005. “Social Capital.” In Handbook of Economic
Growth. Vol. 1B, edited by P. Aghion and S. N. Durlauf, 1640–99. Amsterdam: Elsevier.
Friedman, Milton. 1953. “Choice, Chance, and the Personal Distribution of Income.” Journal of
Political Economy 61: 277–90.
Glaeser, Edward L., David Laibson, and Bruce Sacerdote. 2002. “An Economic Approach to
Social Capital.” Economic Journal 112: 437–58.
Granovetter, Mark. 1973. “The Strength of Weak Ties.” American Journal of Sociology 78: 1360–
80.
———. 1985. “Economic Action and Social Structure: The Problem of Embeddedness.”
American Journal of Sociology 91: 481–510.
Hechter, Michael. 1987. Principles of Group Solidarity. Berkeley: University of California Press.
———, ed. 1983. The Microfoundations of Macrosociology. Philadelphia: Temple University
Press.
Hechter, Michael, and Satoshi Kanazawa. 1997. “Sociological Rational Choice Theory.” Annual
Review of Sociology 23: 191–214.
Hechter, Michael, and Karl-Dieter Opp, eds. 2001. Social Norms. New York: Russell Sage.
Heckathorn, Douglas D. 1988. “Collective Sanctions and the Creation of Prisoner’s Dilemma
Norms.” American Journal of Sociology 94, no. 3: 535–62.
Hirschi, Travis. 1969. Causes of Delinquency. Berkeley: University of Californial Press.
Huber, Joan, ed. 1991. Macro-micro Linkages in Sociology. Newbury Park, CA: Sage.
Jöreskog, Karl G., and Dag Sörbom. 2001. LISREL 8: User’s Reference Guide. Lincolnwood, IL:
Scientific Software.

39
Kollock, Peter. 1998. “Social Dilemmas: The Anatomy of Cooperation.” Annual Review of
Sociology 24: 183–214.
Land, Kenneth, Patricia McCall, and Lawrence Cohen. 1990. “Structural Covariates of Homicide
Rates: Are there any Invariances Across Time and Space?” American Journal of Sociology
95:922-63.
Lederman, Daniel, Norman Loayza, and Ana María Menéndez. 2002. “Violent Crime: Does
Social Capital Matter?” Economic Development and Cultural Change 50: 509–39.
Manski, Charles F. 1995. Identification Problems in the Social Sciences. Cambridge, MA:
Harvard University Press.
Matsueda, Ross L. 2006. “Differential Social Organization, Collective Action, and Crime.” Crime,
Law and Social Change 46: 3–33.
Matsueda, Ross L. 2010. Seattle Neighborhoods and Crime Survey, 2002-2003. ICPSR28701-v1.
Ann Arbor, MI: Inter-university Consortium for Political and Social Research [distributor],
2010-12-10. doi:10.3886/ICPSR28701.v1
Matsueda, Ross L. 2013. “Rational Choice Research in Criminology: A Multi-Level Framework.”
Pp. 283-321 in Handbook of Rational Choice Social Research, edited by R. Wittek, T.
Snijders, and V. Nee. Palo Alto: Stanford University Press.
Matsueda, Ross L., Derek A. Kreager, and David Huizinga. 2006. “Deterring Delinquents: A
Rational Choice Model of Theft and Violence.” American Sociological Review 71: 95–122.
McCarthy, Bill. 2002. “New Economics of Sociological Criminology.” Annual Review of
Sociology 28: 417–42.
Merry, Sally Engel. 1984. “Rethinking Gossip and Scandal.” In Toward a General Theory of
Social Control. Vol. II, edited by D. Black, 271–302. New York: Academic Press.
40
Merton, Robert K. 1936. “The Unanticipated Consequences of Purposive Social Action.”
American Sociological Review 1: 894–904.
———. 1957. Social Theory and Social Structure. Rev. and enl. ed. New York: Free Press.
Miethe, Terrance D. (1991). Testing Theories of Criminality and Victimization in Seattle, 1960-
1990 [Computer File]. 2nd ICPSR version. Blacksburg, VA: Virginia Polytechnic Institute
[producer], 1991. Ann Arbor, MI: Inter-university Consortium for Political and Social
Research [distributor], 1998.
Messner, Steven F., Eric P. Baumer, and Richard Rosenfield. 2004. “Dimensions of Social Capital
and Rates of Criminal Homicide.” American Sociological Review 69: 882–903.
Morenoff, Jeffrey D., Robert J. Sampson, and Stephen W. Raudenbush. 2001. “Neighborhood
Inequality, Collective Efficacy, and the Spatial Dynamics of Homicide.” Criminology 39:
517–60.
Olson, Mancur. 1971. The Logic of Collective Action: Public Goods and the Theory of Groups.
Cambridge: Harvard University Press.
Portes, Alejandro. 1998. “Social Capital: Its Origins and Applications in Modern Sociology.”
Annual Reviews in Sociology 24: 1–24.
Putnam, Robert D. 1995. “Tuning In, Tuning Out: The Strange Disappearance of Social Capital in
America.” Political Science and Politics 28: 664–83.
———. 2000. Bowling Alone: The Collapse and Revival of American Community. New York:
Simon and Schuster.
R Development Core Team. 2010. R: A Language and Environment for Statistical Computing. R
Foundation for Statistical Computing: Vienna, Austria.

41
Raudenbush, Stephen W. and Robert Sampson. 1999. "Ecometrics: Toward a Science of
Assessing Ecological Settings, with Application to the Systematic Social Observation of
Neighborhoods." Sociological Methodology 29: 1-41.
Raudenbush, Stephen W. and Anthony S. Bryk. 2002. Hierarchical Linear Models: Applications
and Data Analysis Methods. Second Edition. Thousand Oaks, CA: Sage Publications.
Rosenfeld, Richard, Steven F. Messner, and Eric P. Baumer. 2001. “Social Capital and
Homicide.” Social Forces 80: 283–309.
Sampson, Robert J., Jeffrey D. Morenoff, and Felton Earls. 1999. “Beyond Social Capital: Spatial
Dynamics of Collective Efficacy for Children.” American Sociological Review 64: 633–60.
Sampson, Robert J., Jeffrey D. Morenoff, and Thomas Gannon-Rowley. 2002. “Assessing
‘Neighborhood Effects’: Social Processes and New Directions in Research.” Annual Review of
Sociology 28: 443–78.
Sampson, Robert J., and Stephen W. Raudenbush. 1999. “Systematic Social Observation of Public
Spaces: A New Look at Disorder in Urban Neighborhoods.” American Journal of Sociology
105: 603–51.
Sampson, Robert J., Stephen W. Raudenbush and Felton Earls. (1997). “Neighborhoods and
Violent Crime: A Multilevel Study of Collective Efficacy.” Science 277: 918-24.
Sampson, Robert J., Stephen W. Raudenbush, and Felton Earls. 1997. “Neighborhoods and
Violent Crime: A Multilevel Study of Collective Efficacy.” Science 277: 918–24.
Sampson, Robert J., and William J. Wilson. 1995. “Race, Crime and Urban Inequality.” In Crime
and Inequality, edited by J. Hagan and R. Peterson, 37–56. Stanford: Stanford University
Press.
Sandler, Todd, and John Tschirhart. 1994. “Club Theory: Thirty Years Later.” Public Choice 93:
335–55.

42
Sawyer, R. Keith. 2001. “Emergence in Sociology: Contemporary Philosophy of Mind and Some
Implications for Sociological Theory.” American Journal of Sociology 107: 551–85.
Shaw, Clifford R., and Henry D. McKay. 1969 [1942]. Juvenile Delinquency in Urban Areas.
Rev. ed. Chicago: University of Chicago Press.
Silver, Eric, and Lisa L. Miller. 2004. “Sources of Informal Social Control in Chicago
Neighborhoods.” Criminology 42: 551–83.
Taylor, Ralph B. 1996. “Neighborhood Responses to Disorder and Local Attachments: The
Systemic Model of Attachment, Social Disorganization, and Neighborhood Use Value.”
Sociological Forum 11: 41–74.
Von Neumann, John, and Oskar Morgenstern. 1944. Theory of Games and Economic Behavior.
Princeton: Princeton University Press.
Wilson, William Julius. 1987. The Truly Disadvantaged: The Inner City, the Underclass, and
Public Policy. Chicago: University of Chicago Press.

43
43
Obligations & Expectations
Watch Property
Help with Problem
Borrow Tools
Ask about Jobs or
Parenting
ε1 ε2 ε3 ε4 .16
.76 .69 .81 .58
RMSEA: .057; χ2=17.20; df=1; p<.001
Figure 1. Confirmatory Factor Model of Obligations and Expectations

44
44
Stop Truant Children
Hanging on Corner
ε1 ε2 ε3 ε4 -.10
.81 .74 .82 .65
RMSEA: .023; χ2=14.74; df=4; p<.01
Stop Children
from Fighting
Stop from Spray-
painting Graffiti
Scold Disrespectful
Child
Watch Out that Children
are Safe
Informal Social Control
.60
ε5
Figure 2. Confirmatory Factor Model of Informal Social Control
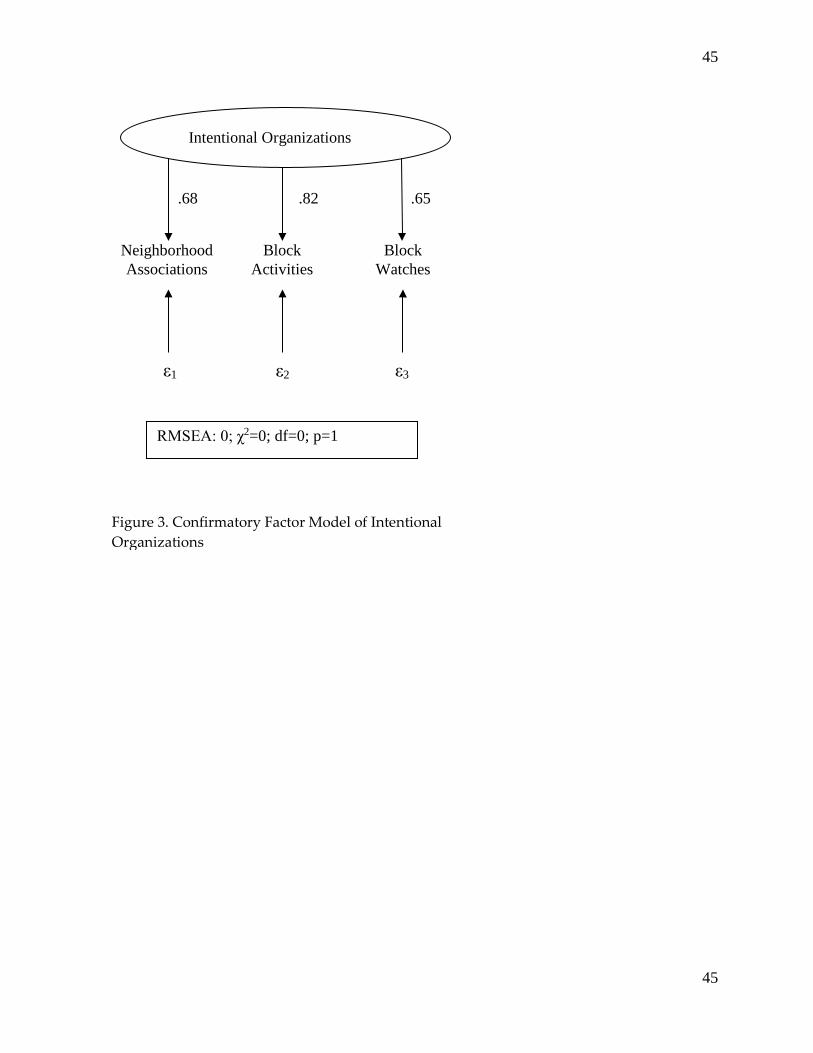
45
45
Intentional Organizations
Neighborhood Associations
Block Activities
Block Watches
ε1 ε2 ε3
.68 .82 .65
RMSEA: 0; χ2=0; df=0; p=1
Figure 3. Confirmatory Factor Model of Intentional Organizations
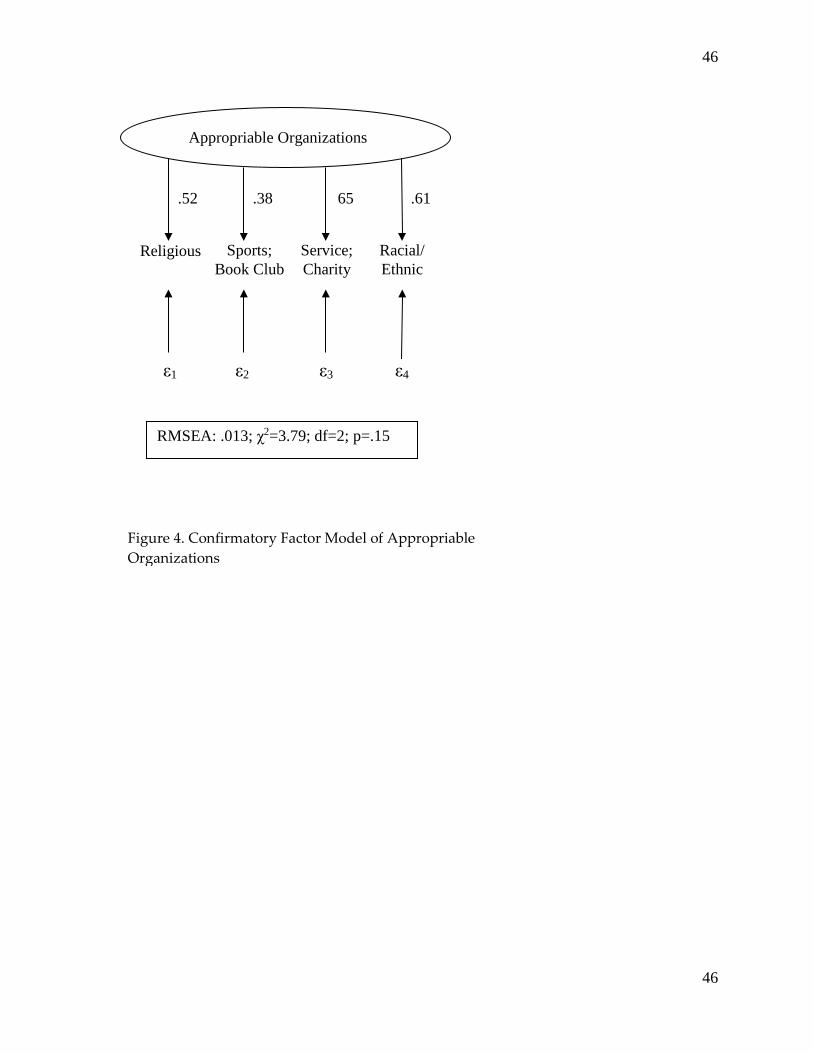
46
46
Appropriable Organizations
Religious Sports; Book Club
Service; Charity
Racial/ Ethnic
ε1 ε2 ε3 ε4
.52 65 .38 .61
RMSEA: .013; χ2=3.79; df=2; p=.15
Figure 4. Confirmatory Factor Model of Appropriable Organizations

47
47
Obligations & Expectations: 1990
Watch Property
Help with Problem
Borrow Tools
ε1 ε2 ε3
.68 .70 .81
RMSEA: .0; χ2=0; df=0; p=1
Figure 5. Confirmatory Factor Model of Obligations and Expectations from 1990 Survey
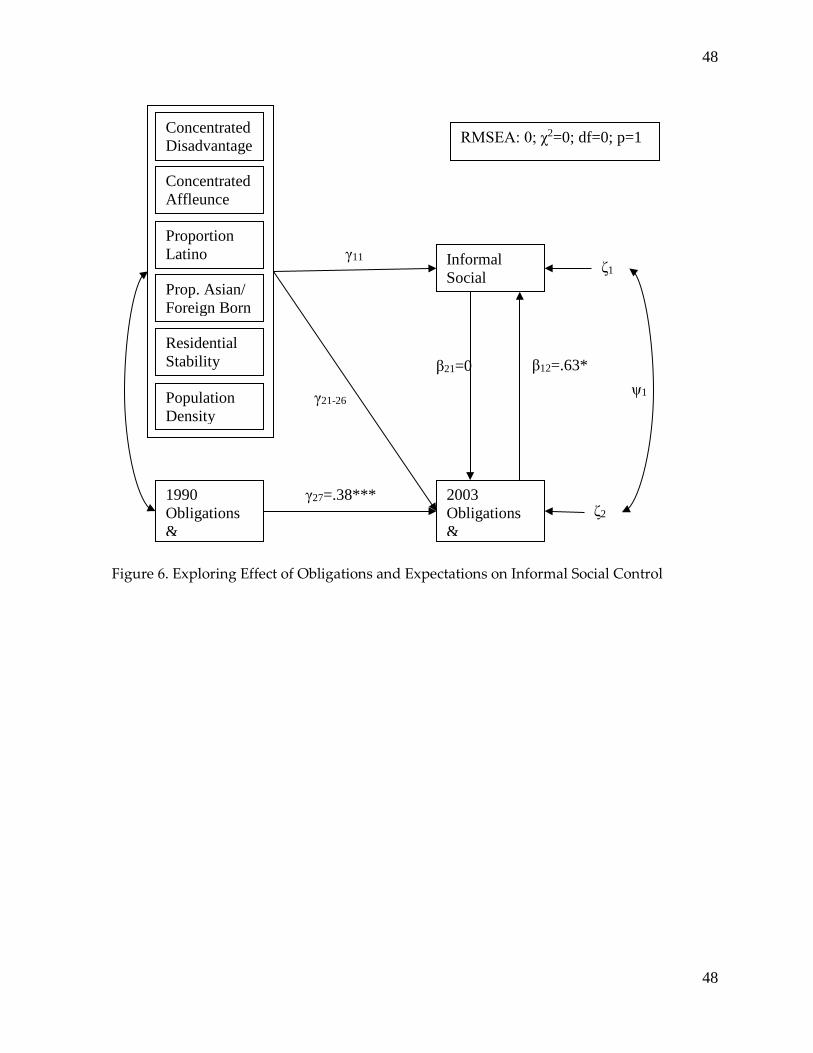
48
48
Concentrated Disadvantage
Concentrated Affleunce
Proportion Latino
Prop. Asian/ Foreign Born
Residential Stability
Population Density
1990 Obligations &
2003 Obligations &
Informal Social
ζ1
ζ2
ψ1
β21=0 β12=.63**
γ21-26
γ11
γ27=.38***
RMSEA: 0; χ2=0; df=0; p=1
Figure 6. Exploring Effect of Obligations and Expectations on Informal Social Control

49
49
Table 1. Measures of Social Capital and Informal Social Control Mean S.D. Intentional organizational participation (alpha=.65) Latent factor score 1.14 .39 Participation in neighborhood associations 1.43 .63 Participation in block activities sponsored by the SPD 1.37 .62 Participation in other block activities 1.53 .64 Appropriable organizational participation (alpha=.46) Latent factor score 1.04 .30 Participation in church, synagogue, temple, or mosque 1.61 .81 Participation in recreational sports, book club, or cards 1.64 .78 Participation in service or charitable organization 1.47 .66 Participation in racial or ethnic organization 1.17 .45 Information potential Say hello to neighbors or stop to chat 2.73 .49 Obligations and expectations (alpha=.73) Latent factor score 1.78 .49 Watched neighbor’s property 2.02 .77 Borrowed tools or food 1.72 .68 Helped with a problem 2.05 .61 Asked advice about job or kids 1.63 .70 Informal social control (alpha=.79) Latent factor score 2.92 .64 Neighbors would respond: kids hanging out 2.61 .91 Neighbors would respond: kids graffiti 3.37 .75 Neighbors would respond: kids disrespecting adult 2.50 .83 Neighbors would respond: kids fighting 3.11 .81 Count on adults to watch out that children are safe 3.03 .73 1990 obligations and expectations (alpha=.60) Latent factor score .54 .28 Watched neighbor’s property .71 .45 Borrowed tools or food .51 .50 Helped with a problem .73 .44 N=4664; 1990 N=5266

50
50
Table 1A. Measures of Social Capital and Informal Social Control
Mean
S.D. Factor Loading
Intentional organizational participation (alpha=.65) Latent factor score (RMSEA: 0; χ2=0; df=0; p=1) 1.14 .39 Participation in neighborhood associations 1.43 .63 .65 Participation in block activities sponsored by the SPD 1.37 .62 .82 Participation in other block activities 1.53 .64 .68 Appropriable organizational participation (alpha=.46) Latent factor score (RMSEA: .013; χ2=3.79; df=2; p=.15) 1.04 .30 Participation in church, synagogue, temple, or mosque 1.61 .81 .52 Participation in recreational sports, book club, or cards 1.64 .78 .38 Participation in service or charitable organization 1.47 .66 .65 Participation in racial or ethnic organization 1.17 .45 .61 Information potential Say hello to neighbors or stop to chat 2.73 .49 Obligations and expectations (alpha=.73) Latent factor score (RMSEA: .057; χ2=17.20; df=1; p<.001) 1.78 .49 Watched neighbor’s property 2.02 .77 .76 Borrowed tools or food 1.72 .68 .69 Helped with a problem 2.05 .61 .81 Asked advice about job or kids 1.63 .70 .58 Informal social control (alpha=.79) Latent factor score (RMSEA: .023; χ2=14.74; df=4; p<.01) 2.92 .64 Neighbors would respond: kids hanging out 2.61 .91 .81 Neighbors would respond: kids graffiti 3.37 .75 .74 Neighbors would respond: kids disrespecting adult 2.50 .83 .65 Neighbors would respond: kids fighting 3.11 .81 .82 Count on adults to watch out that children are safe 3.03 .73 .60 1990 obligations and expectations (alpha=.60) Latent factor score (RMSEA: 0; χ2=0; df=0; p=1) .54 .28 Watched neighbor’s property .71 .45 .68 Borrowed tools or food .51 .50 .70 Helped with a problem .73 .44 .81 N=4664; 1990 N=5266

51
51
Table 1B. Coefficients from Confirmatory Factor Models of Social Capital and Informal Social Control
λy ε Coef. S.E. Std. Coef. S.E. Intentional organizational participation (RMSEA: 0; χ2=0; df=0; p=1) Participation in block activities by the SPD 1.00a .65 .57*** .03 Participation in other block activities 1.25*** .05 .82 .33*** .03 Participation in neighborhood associations 1.05*** .04 .68 .53*** .03 Appropriable organizational participation (RMSEA: .013; χ2=3.79; df=2; p=.15) Participation in church 1.00a .52 .73*** .03 Participation in recreational group .74*** .06 .38 .85*** .02 Participation in service or charitable organization 1.26*** .09 .65 .58*** .04 Participation in racial or ethnic organization 1.18*** .08 .61 .63*** .04 Obligations and expectations (RMSEA: .057; χ2=17.20; df=1; p<.001) Watched neighbor’s property 1.00a .76 .42*** .03 Borrowed tools or food .91*** .03 .69 .52*** .02 Helped with a problem 1.06*** .03 .81 .35*** .03 Asked advice about job or kids .76*** .03 .58 .67*** .02 Borrowed tools/ Asked advice (ε24) .16*** .02 Informal social control (RMSEA: .023; χ2=14.74; df=4; p<.01) Neighbors would respond: kids hanging out 1.00a .81 .34*** .02 Neighbors would respond: kids graffiti .90*** .02 .74 .46*** .02 Neighbors would respond: disrespecting adult .80*** .02 .65 .58*** .02 Neighbors would respond: kids fighting 1.01*** .02 .82 .33*** .02 Count on adults to watch that children are safe .74*** .02 .60 .63*** .02 Hanging out/ Fighting (ε14) -.10*** .02 1990 obligations and expectations (RMSEA: 0; χ2=0; df=0; p=1) Watched neighbor’s property 1.00a .68 .53*** .03 Borrowed tools or food 1.02*** .04 .70 .51*** .03 Helped with a problem 1.19*** .05 .81 .34*** .04 N=4664; 1990 N=5266; a Coefficient is fixed.

52
52
Table 2. Variance Decomposition for Measures of Social Capital and Informal Social Control Variance Components Reliability σ2 τ00 χ2(τ00>0)a I.C.C. �̂�𝜆𝑗𝑗 range Intentional organizational participation .141 .010 462*** .069 .723 (.573, .870) Appropriable organizational participation .091 .001 175** .011 .291 (.168, .503) Information potential .220 .008 287*** .035 .565 (.397, .767) Obligations and expectations .220 .018 484*** .077 .744 (.601, .883) Informal social control .357 .061 870*** .146 .855 (.755, .939) *p<.05, **p<.01, ***p<.001. aDF=122 (J-1) for each test. Nj range: (18, 90), Nj mean, median: 37.9, 34.
Table 3. Measures of Neighborhood Social Structure Mean S.D. Concentrated Disadvantage (alpha=.80) Average of z-scores .00 .80 Proportion in poverty .12 .08 Proportion unemployed .05 .04 Proportion on public assistance .03 .03 Proportion single-mother households .09 .07 Proportion African-American .08 .10 Concentrated Affluence (alpha=.90) Average of z-scores .00 .92 Proportion households with income > $100K .16 .10 Proportion college graduates .47 .17 Proportion managerial or professional occupations .48 .13 Ethnicity/ Immigration Proportion Latino .05 .04 Asian/ foreign born (average of z-scores) (alpha=.97) .00 1.97 Proportion Asian .12 .12 Proportion foreign born .16 .11 Residential stability (alpha=.87) Average of z-scores .00 .97 Proportion homeowners .50 .23 Proportion in same residence 5 years ago .44 .13 Population density Tens of thousands of person per square mile by tract .94 .69 Violent Crime Rate Average yearly violent crimes (murder, rape, robbery, aggravated assault) per 1K population 1996-1998 9.62 15.50 Average yearly violent crimes (murder, rape, robbery, aggravated assault) per 1K population 2003-2005 8.21 12.01 N=123
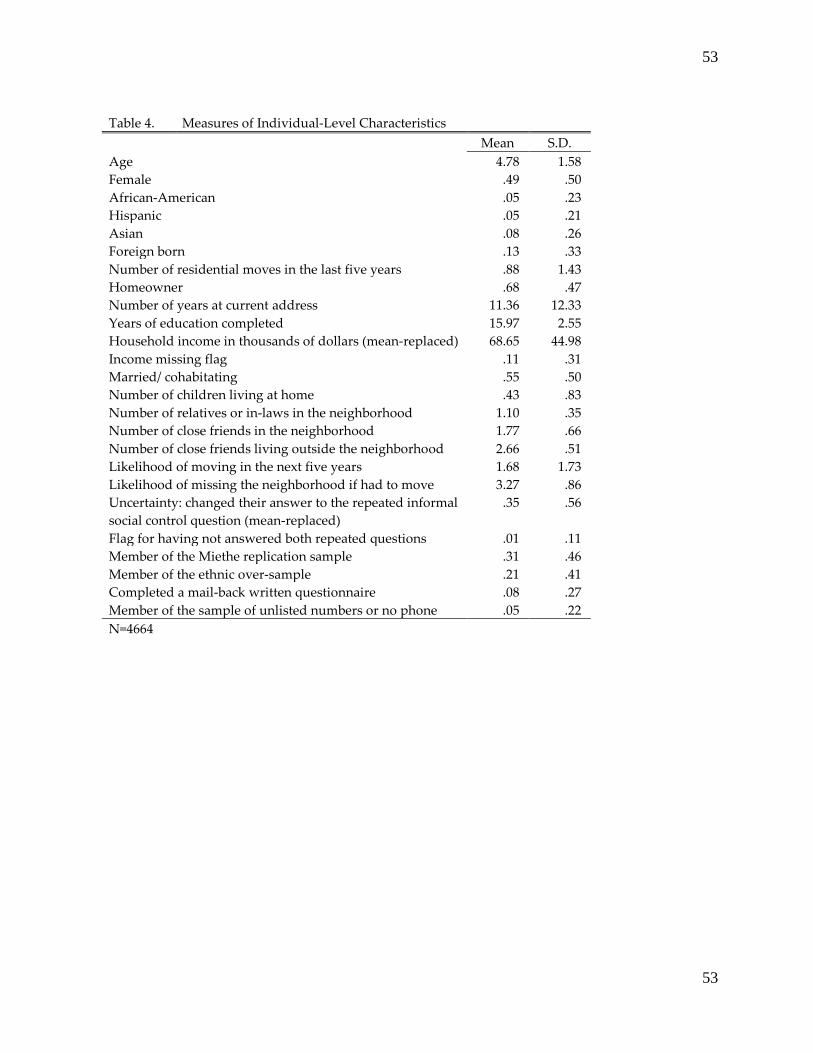
53
53
Table 4. Measures of Individual-Level Characteristics Mean S.D. Age 4.78 1.58 Female .49 .50 African-American .05 .23 Hispanic .05 .21 Asian .08 .26 Foreign born .13 .33 Number of residential moves in the last five years .88 1.43 Homeowner .68 .47 Number of years at current address 11.36 12.33 Years of education completed 15.97 2.55 Household income in thousands of dollars (mean-replaced) 68.65 44.98 Income missing flag .11 .31 Married/ cohabitating .55 .50 Number of children living at home .43 .83 Number of relatives or in-laws in the neighborhood 1.10 .35 Number of close friends in the neighborhood 1.77 .66 Number of close friends living outside the neighborhood 2.66 .51 Likelihood of moving in the next five years 1.68 1.73 Likelihood of missing the neighborhood if had to move 3.27 .86 Uncertainty: changed their answer to the repeated informal social control question (mean-replaced)
.35 .56
Flag for having not answered both repeated questions .01 .11 Member of the Miethe replication sample .31 .46 Member of the ethnic over-sample .21 .41 Completed a mail-back written questionnaire .08 .27 Member of the sample of unlisted numbers or no phone .05 .22 N=4664
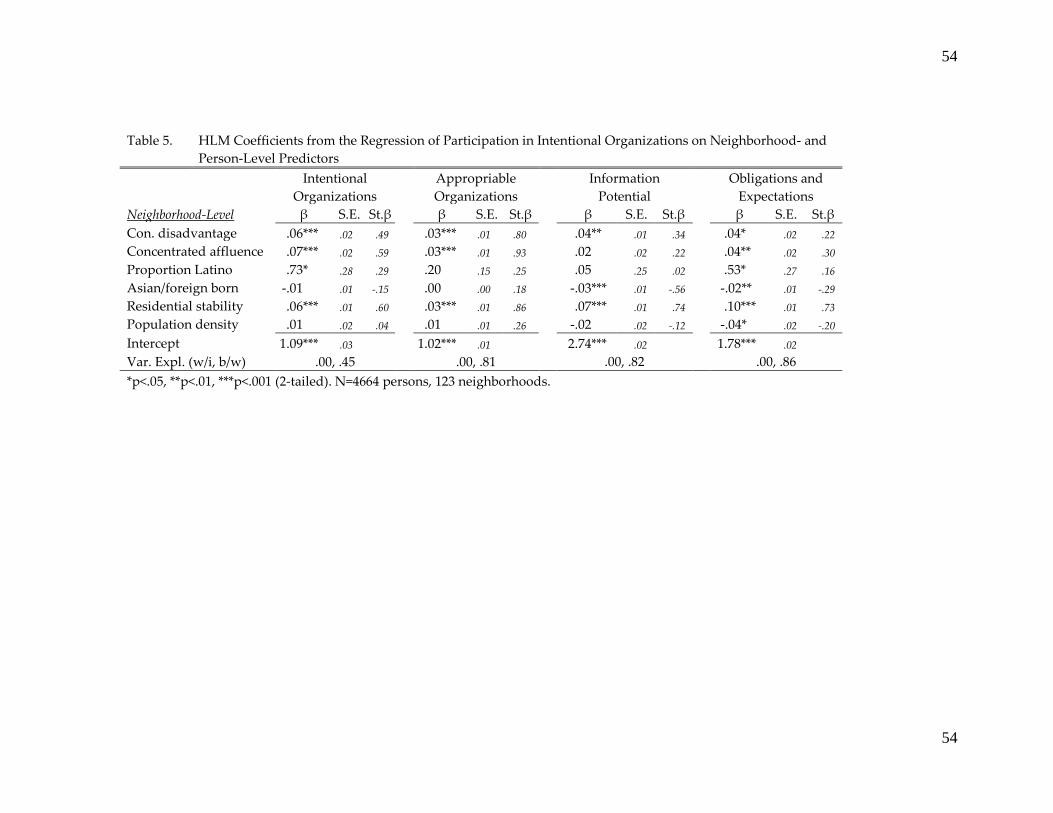
54
54
Table 5. HLM Coefficients from the Regression of Participation in Intentional Organizations on Neighborhood- and Person-Level Predictors
Intentional
Organizations
Appropriable Organizations
Information Potential
Obligations and Expectations
Neighborhood-Level β S.E. St.β β S.E. St.β β S.E. St.β β S.E. St.β Con. disadvantage .06*** .02 .49 .03*** .01 .80 .04** .01 .34 .04* .02 .22 Concentrated affluence .07*** .02 .59 .03*** .01 .93 .02 .02 .22 .04** .02 .30 Proportion Latino .73* .28 .29 .20 .15 .25 .05 .25 .02 .53* .27 .16 Asian/foreign born -.01 .01 -.15 .00 .00 .18 -.03*** .01 -.56 -.02** .01 -.29 Residential stability .06*** .01 .60 .03*** .01 .86 .07*** .01 .74 .10*** .01 .73 Population density .01 .02 .04 .01 .01 .26 -.02 .02 -.12 -.04* .02 -.20
Intercept 1.09*** .03 1.02*** .01 2.74*** .02 1.78*** .02
Var. Expl. (w/i, b/w) .00, .45 .00, .81 .00, .82 .00, .86 *p<.05, **p<.01, ***p<.001 (2-tailed). N=4664 persons, 123 neighborhoods.
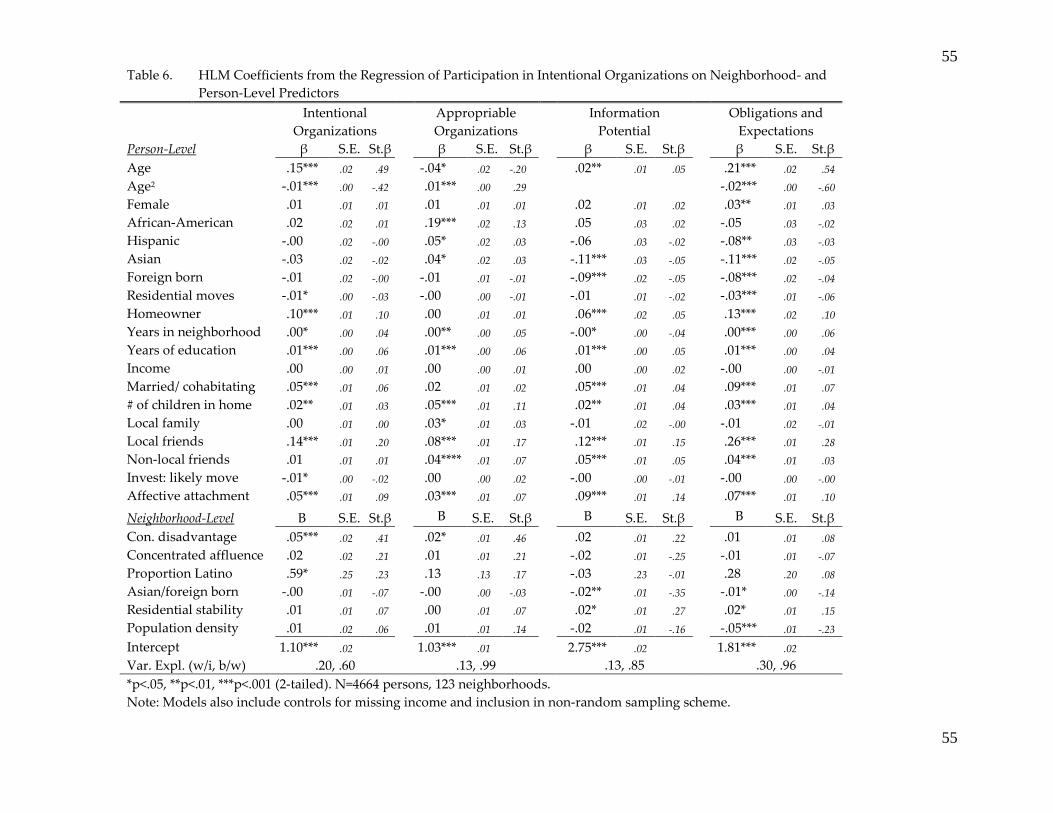
55
55 Table 6. HLM Coefficients from the Regression of Participation in Intentional Organizations on Neighborhood- and
Person-Level Predictors
Intentional
Organizations
Appropriable Organizations
Information Potential
Obligations and Expectations
Person-Level β S.E. St.β β S.E. St.β β S.E. St.β β S.E. St.β Age .15*** .02 .49 -.04* .02 -.20 .02** .01 .05 .21*** .02 .54 Age2 -.01*** .00 -.42 .01*** .00 .29 -.02*** .00 -.60 Female .01 .01 .01 .01 .01 .01 .02 .01 .02 .03** .01 .03 African-American .02 .02 .01 .19*** .02 .13 .05 .03 .02 -.05 .03 -.02 Hispanic -.00 .02 -.00 .05* .02 .03 -.06 .03 -.02 -.08** .03 -.03 Asian -.03 .02 -.02 .04* .02 .03 -.11*** .03 -.05 -.11*** .02 -.05 Foreign born -.01 .02 -.00 -.01 .01 -.01 -.09*** .02 -.05 -.08*** .02 -.04 Residential moves -.01* .00 -.03 -.00 .00 -.01 -.01 .01 -.02 -.03*** .01 -.06 Homeowner .10*** .01 .10 .00 .01 .01 .06*** .02 .05 .13*** .02 .10 Years in neighborhood .00* .00 .04 .00** .00 .05 -.00* .00 -.04 .00*** .00 .06 Years of education .01*** .00 .06 .01*** .00 .06 .01*** .00 .05 .01*** .00 .04 Income .00 .00 .01 .00 .00 .01 .00 .00 .02 -.00 .00 -.01 Married/ cohabitating .05*** .01 .06 .02 .01 .02 .05*** .01 .04 .09*** .01 .07 # of children in home .02** .01 .03 .05*** .01 .11 .02** .01 .04 .03*** .01 .04 Local family .00 .01 .00 .03* .01 .03 -.01 .02 -.00 -.01 .02 -.01 Local friends .14*** .01 .20 .08*** .01 .17 .12*** .01 .15 .26*** .01 .28 Non-local friends .01 .01 .01 .04**** .01 .07 .05*** .01 .05 .04*** .01 .03 Invest: likely move -.01* .00 -.02 .00 .00 .02 -.00 .00 -.01 -.00 .00 -.00 Affective attachment .05*** .01 .09 .03*** .01 .07 .09*** .01 .14 .07*** .01 .10
Neighborhood-Level Β S.E. St.β Β S.E. St.β Β S.E. St.β Β S.E. St.β Con. disadvantage .05*** .02 .41 .02* .01 .46 .02 .01 .22 .01 .01 .08 Concentrated affluence .02 .02 .21 .01 .01 .21 -.02 .01 -.25 -.01 .01 -.07 Proportion Latino .59* .25 .23 .13 .13 .17 -.03 .23 -.01 .28 .20 .08 Asian/foreign born -.00 .01 -.07 -.00 .00 -.03 -.02** .01 -.35 -.01* .00 -.14 Residential stability .01 .01 .07 .00 .01 .07 .02* .01 .27 .02* .01 .15 Population density .01 .02 .06 .01 .01 .14 -.02 .01 -.16 -.05*** .01 -.23
Intercept 1.10*** .02 1.03*** .01 2.75*** .02 1.81*** .02
Var. Expl. (w/i, b/w) .20, .60 .13, .99 .13, .85 .30, .96 *p<.05, **p<.01, ***p<.001 (2-tailed). N=4664 persons, 123 neighborhoods. Note: Models also include controls for missing income and inclusion in non-random sampling scheme.
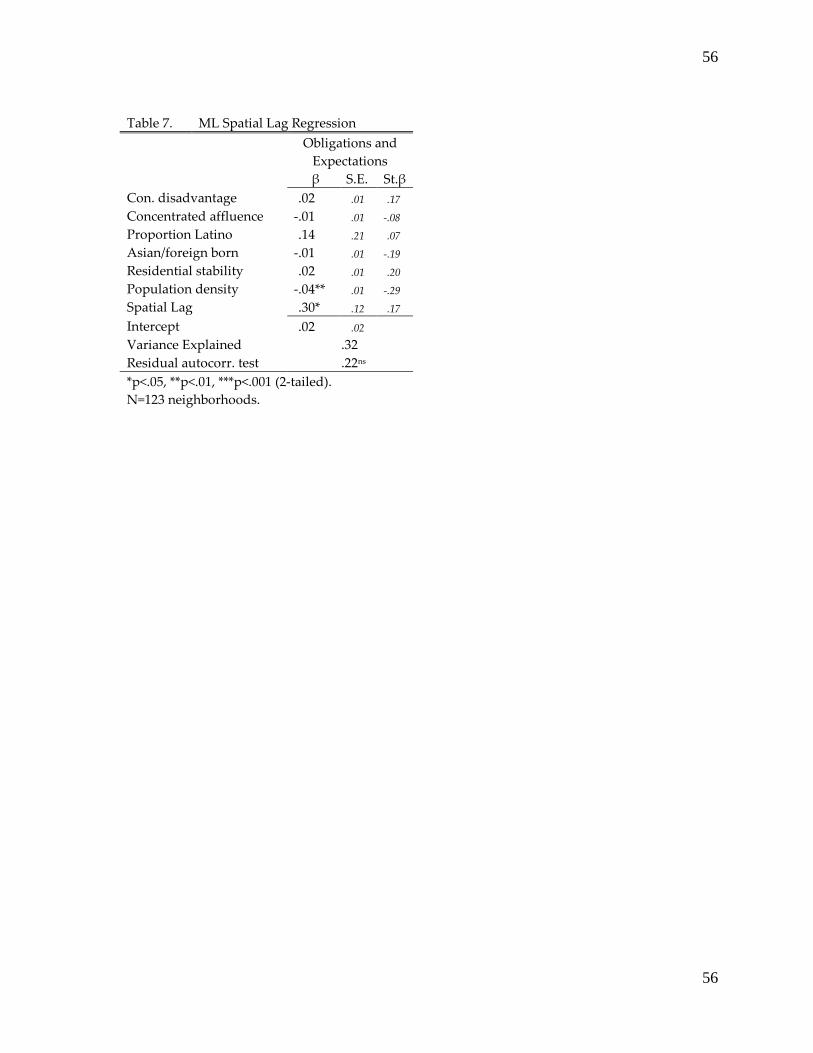
56
56
Table 7. ML Spatial Lag Regression
Obligations and
Expectations β S.E. St.β
Con. disadvantage .02 .01 .17 Concentrated affluence -.01 .01 -.08 Proportion Latino .14 .21 .07 Asian/foreign born -.01 .01 -.19 Residential stability .02 .01 .20 Population density -.04** .01 -.29 Spatial Lag .30* .12 .17
Intercept .02 .02
Variance Explained .32 Residual autocorr. test .22ns *p<.05, **p<.01, ***p<.001 (2-tailed). N=123 neighborhoods.

57
57
Table 8. HLM Coefficients from the Regression of Informal Social Control on Neighborhood- and Person-Level Predictors
Person-Level β S.E. St.β Age .06*** .01 .10 Female .02 .02 .01 African-American -.04 .04 -.01 Hispanic .08* .04 .02 Asian -.07 .03 -.02 Foreign born .16*** .03 .06 Residential moves .00 .01 .00 Homeowner .03 .02 .01 Years in neighborhood -.00 .00 -.02 Years of education -.01*** .00 -.04 Income .00*** .00 .04 Married/ cohabitating .03 .02 .02 # of children in home .03* .01 .02 Uncertainty – Rep. Measure -.12*** .01 -.08 Uncertainty – Missing Repeated -.16* .07 -.02 Intentional organizations .21*** .03 .10 Appropriable organizations .06* .03 .02 Information potential .16*** .02 .09 Obligations and expectations .11*** .02 .07
Neighborhood-Level Β S.E. St.β Con. disadvantage -.07*** .02 -.24 Concentrated affluence .05* .02 .20 Proportion Latino -.89* .34 -.15 Asian/foreign born -.00 .01 -.02 Residential stability .02 .02 .09 Population density -.06** .02 -.17 Intentional organizations -.25 .13 -.12 Appropriable organizations .06 .22 .01 Information potential -.12 .14 -.06 Obligations and expectations .38** .12 .26
Intercept 2.88*** .37
Proportion of Variance Explained Within neighborhoods .14 B/w neighborhoods .93 *p<.05, **p<.01, ***p<.001 (2-tailed). N=4664 persons, 123 neighborhoods. Note: Models also include controls for missing income and inclusion in non-random sampling scheme.
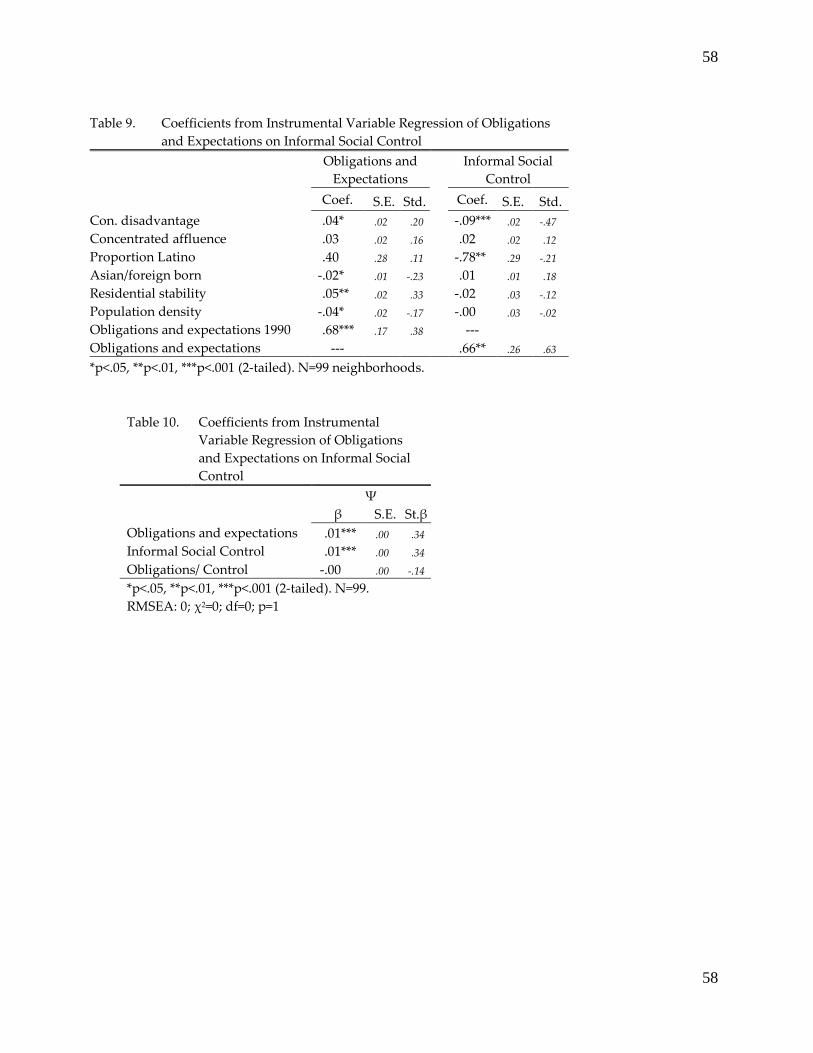
58
58
Table 9. Coefficients from Instrumental Variable Regression of Obligations
and Expectations on Informal Social Control
Obligations and
Expectations Informal Social
Control
Coef. S.E. Std. Coef. S.E. Std. Con. disadvantage .04* .02 .20 -.09*** .02 -.47 Concentrated affluence .03 .02 .16 .02 .02 .12 Proportion Latino .40 .28 .11 -.78** .29 -.21 Asian/foreign born -.02* .01 -.23 .01 .01 .18 Residential stability .05** .02 .33 -.02 .03 -.12 Population density -.04* .02 -.17 -.00 .03 -.02 Obligations and expectations 1990 .68*** .17 .38 --- Obligations and expectations --- .66** .26 .63
*p<.05, **p<.01, ***p<.001 (2-tailed). N=99 neighborhoods.
Table 10. Coefficients from Instrumental Variable Regression of Obligations and Expectations on Informal Social Control
Ψ β S.E. St.β
Obligations and expectations .01*** .00 .34 Informal Social Control .01*** .00 .34 Obligations/ Control -.00 .00 -.14
*p<.05, **p<.01, ***p<.001 (2-tailed). N=99. RMSEA: 0; χ2=0; df=0; p=1
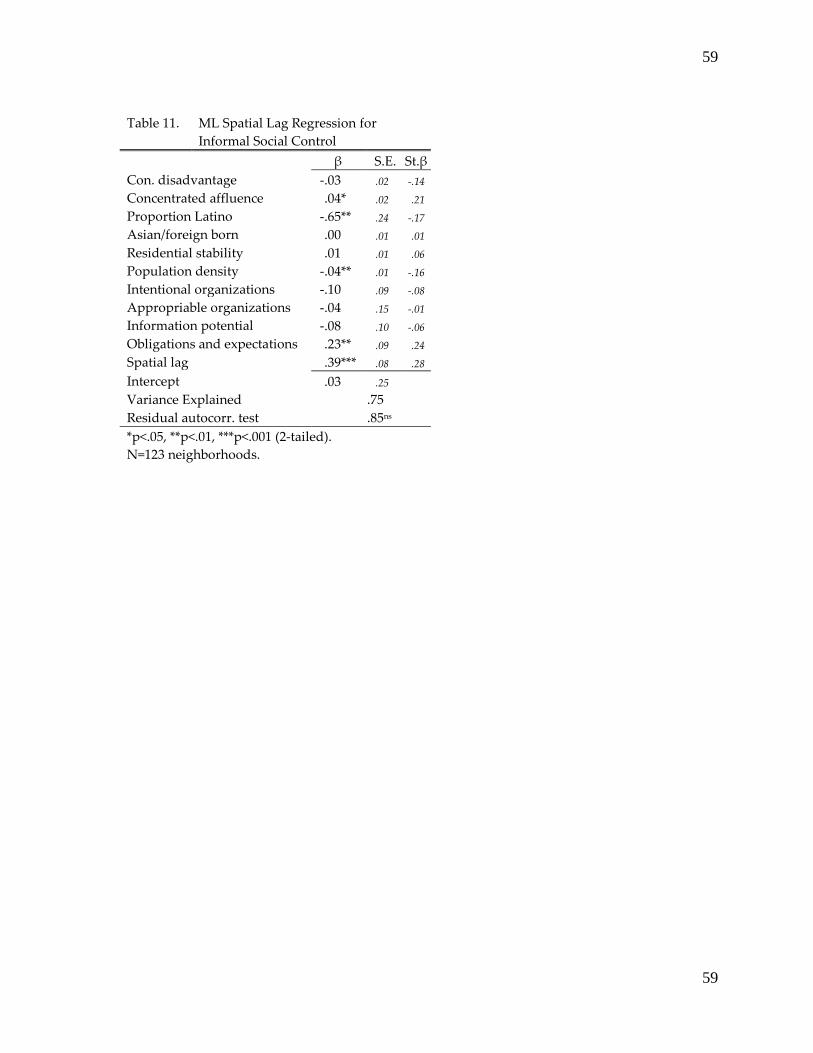
59
59
Table 11. ML Spatial Lag Regression for
Informal Social Control β S.E. St.β
Con. disadvantage -.03 .02 -.14 Concentrated affluence .04* .02 .21 Proportion Latino -.65** .24 -.17 Asian/foreign born .00 .01 .01 Residential stability .01 .01 .06 Population density -.04** .01 -.16 Intentional organizations -.10 .09 -.08 Appropriable organizations -.04 .15 -.01 Information potential -.08 .10 -.06 Obligations and expectations .23** .09 .24 Spatial lag .39*** .08 .28
Intercept .03 .25
Variance Explained .75 Residual autocorr. test .85ns *p<.05, **p<.01, ***p<.001 (2-tailed). N=123 neighborhoods.
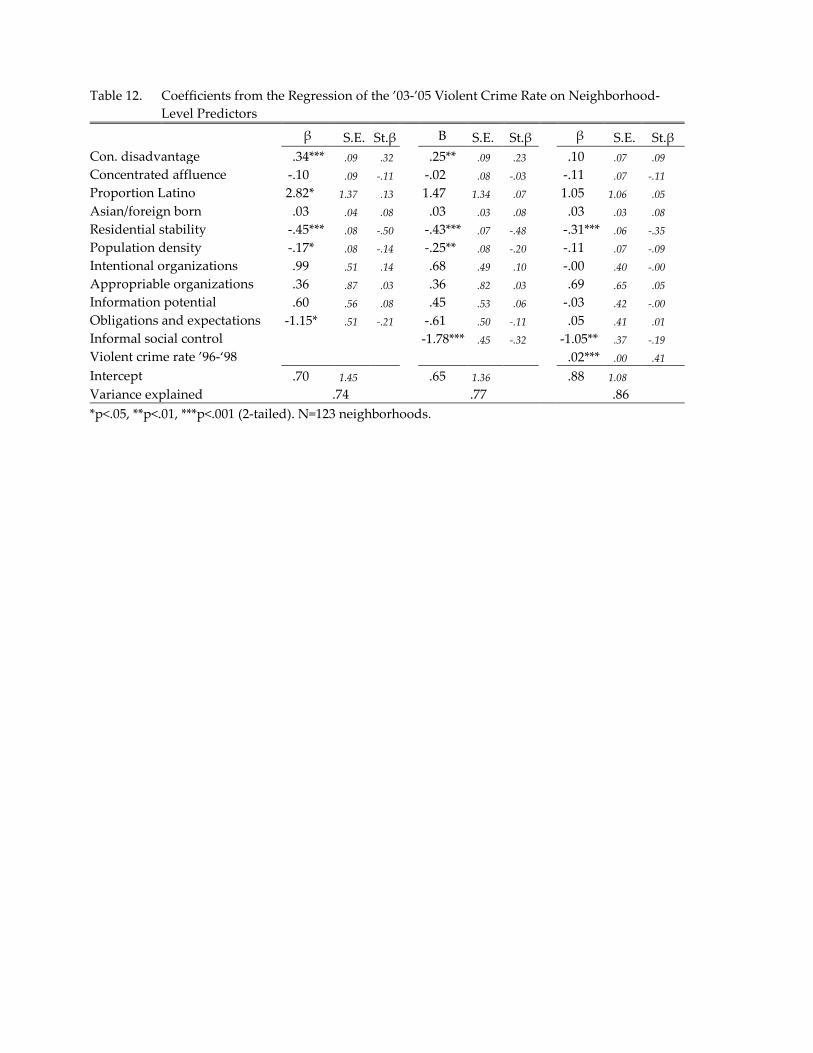
Table 12. Coefficients from the Regression of the ’03-’05 Violent Crime Rate on Neighborhood-Level Predictors
β S.E. St.β Β S.E. St.β β S.E. St.β Con. disadvantage .34*** .09 .32 .25** .09 .23 .10 .07 .09 Concentrated affluence -.10 .09 -.11 -.02 .08 -.03 -.11 .07 -.11 Proportion Latino 2.82* 1.37 .13 1.47 1.34 .07 1.05 1.06 .05 Asian/foreign born .03 .04 .08 .03 .03 .08 .03 .03 .08 Residential stability -.45*** .08 -.50 -.43*** .07 -.48 -.31*** .06 -.35 Population density -.17* .08 -.14 -.25** .08 -.20 -.11 .07 -.09 Intentional organizations .99 .51 .14 .68 .49 .10 -.00 .40 -.00 Appropriable organizations .36 .87 .03 .36 .82 .03 .69 .65 .05 Information potential .60 .56 .08 .45 .53 .06 -.03 .42 -.00 Obligations and expectations -1.15* .51 -.21 -.61 .50 -.11 .05 .41 .01 Informal social control -1.78*** .45 -.32 -1.05** .37 -.19 Violent crime rate ’96-‘98 .02*** .00 .41
Intercept .70 1.45 .65 1.36 .88 1.08
Variance explained .74 .77 .86 *p<.05, **p<.01, ***p<.001 (2-tailed). N=123 neighborhoods.

2
2
Macro-Level Outcome
Micro-Level Predictor
Micro-Level Outcome
Macro-Level Context
1
2
3
Figure 1. Links between micro- and macro-level mechanisms. Source: Coleman (1990).
4
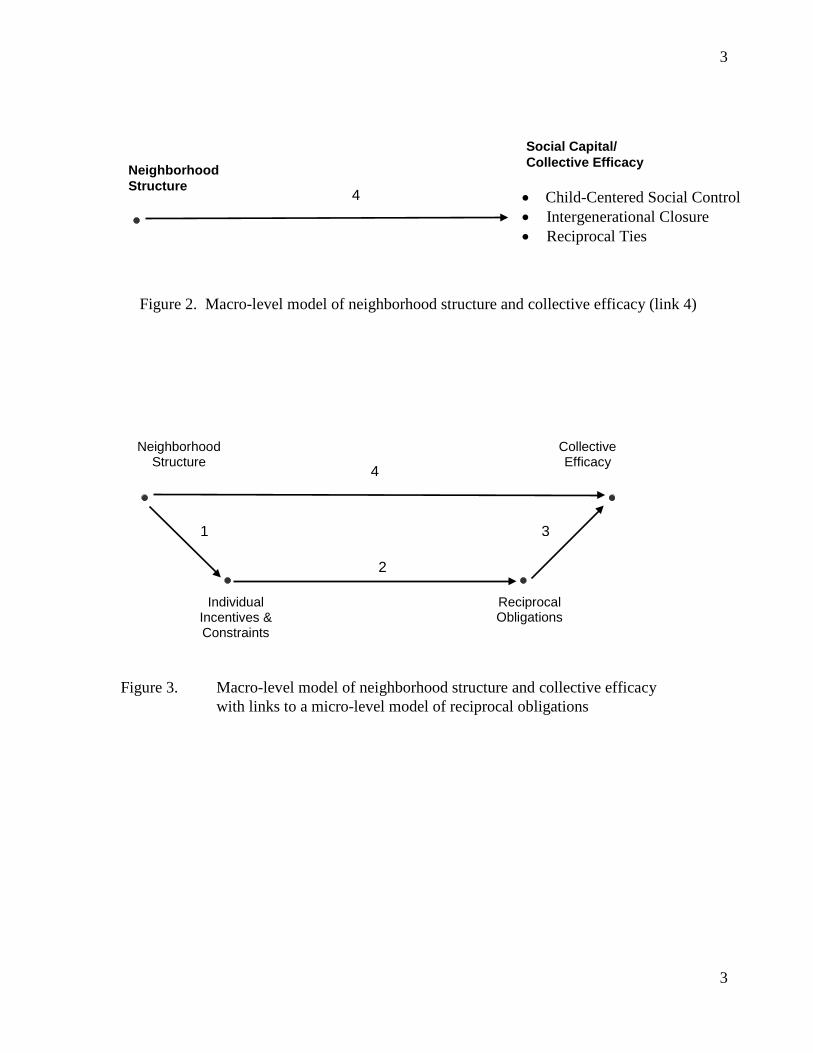
3
3
Neighborhood Structure
Figure 2. Macro-level model of neighborhood structure and collective efficacy (link 4)
4
• Child-Centered Social Control • Intergenerational Closure • Reciprocal Ties
Social Capital/ Collective Efficacy
Collective Efficacy
Individual Incentives & Constraints
Reciprocal Obligations
Neighborhood Structure
1
2
3
Figure 3. Macro-level model of neighborhood structure and collective efficacy with links to a micro-level model of reciprocal obligations
4

4
4
Figure 4. A Multi-Level Model of Neighborhood Disadvantage, Social Capital, and
Collective Efficacy
Disadvantage
Affluence
Race/Ethnicity
Residential Stability
Population
Density
Gender
SES
Race/Ethnicity
Residential Stability
Married Children
Friends in
Neighborhood
Obligations Expectations
Information
Potential
Intentional Organization
Appropriable Organization
Collective Efficacy
4
2
3
1
Neighborhood Structure
Individual Incentives & Constraints
Individual Investment in Social Capital
Neighborhood Capacity
5

Table 1. Measures of Collective Efficacy Sampson, Raudenbush, and Earls (1997) Sampson, Morenoff, and Earls (1999) Informal Social Control Child-Centered Social Control Neighbors can be counted on to intervene if Neighbors can be counted on to intervene if 1. Children were skipping school and hanging out on a street corner 1. Children were skipping school and hanging out on a street corner 2. Children were spray-painting graffiti on a local building 2. Children were spray-painting graffiti on a local building 3. Children were showing disrespect to an adult 3. Children were showing disrespect to an adult 4. A fight broke out in front of their house 5. The fire station closest to their home was threatened with budget cuts Intergenerational Closure Social Cohesion and Trust 1. Parents in this neighborhood know their children’s friends 2. Adults in this neighborhood know who the local children are 1. People around here are willing to help their neighbors 3. There are adults in this neighborhood that children can look up to 2. This is a close-knit neighborhood 4. Parents in this neighborhood generally know each other 3. People in this neighborhood can be trusted 5. You can count on adults in this neighborhood to watch out that 4. People in this neighborhood generally don’t get along with each other children are safe and don’t get into trouble 5. People in this neighborhood do not share the same values Reciprocated Exchange
How often do you and people in your neighborhood 1. do favors for each other? 2. have parties or other get-togethers where other people in the
neighborhood are invited? 3. visit in each other’s homes or in the street? 4. ask each other advice about personal things such as childrearing
or job openings? 5. watch over other property when a neighbor is not at home
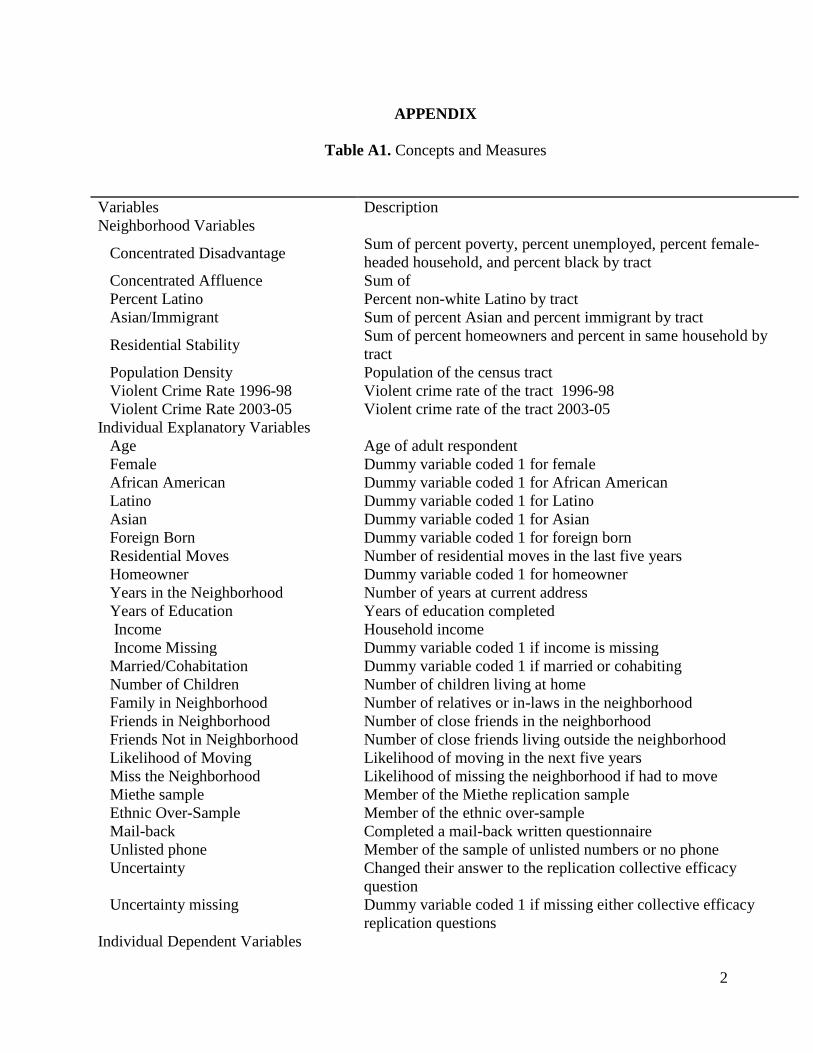
2
APPENDIX
Table A1. Concepts and Measures
Variables Description Neighborhood Variables
Concentrated Disadvantage Sum of percent poverty, percent unemployed, percent female-headed household, and percent black by tract
Concentrated Affluence Sum of Percent Latino Percent non-white Latino by tract Asian/Immigrant Sum of percent Asian and percent immigrant by tract
Residential Stability Sum of percent homeowners and percent in same household by tract
Population Density Population of the census tract Violent Crime Rate 1996-98 Violent crime rate of the tract 1996-98 Violent Crime Rate 2003-05 Violent crime rate of the tract 2003-05
Individual Explanatory Variables Age Age of adult respondent Female Dummy variable coded 1 for female African American Dummy variable coded 1 for African American Latino Dummy variable coded 1 for Latino Asian Dummy variable coded 1 for Asian Foreign Born Dummy variable coded 1 for foreign born Residential Moves Number of residential moves in the last five years
Homeowner Dummy variable coded 1 for homeowner Years in the Neighborhood Number of years at current address Years of Education Years of education completed Income Household income Income Missing Dummy variable coded 1 if income is missing Married/Cohabitation Dummy variable coded 1 if married or cohabiting Number of Children Number of children living at home Family in Neighborhood Number of relatives or in-laws in the neighborhood Friends in Neighborhood Number of close friends in the neighborhood Friends Not in Neighborhood Number of close friends living outside the neighborhood Likelihood of Moving Likelihood of moving in the next five years Miss the Neighborhood Likelihood of missing the neighborhood if had to move Miethe sample Member of the Miethe replication sample Ethnic Over-Sample Member of the ethnic over-sample Mail-back Completed a mail-back written questionnaire
Unlisted phone Member of the sample of unlisted numbers or no phone Uncertainty Changed their answer to the replication collective efficacy
question Uncertainty missing Dummy variable coded 1 if missing either collective efficacy
replication questions Individual Dependent Variables
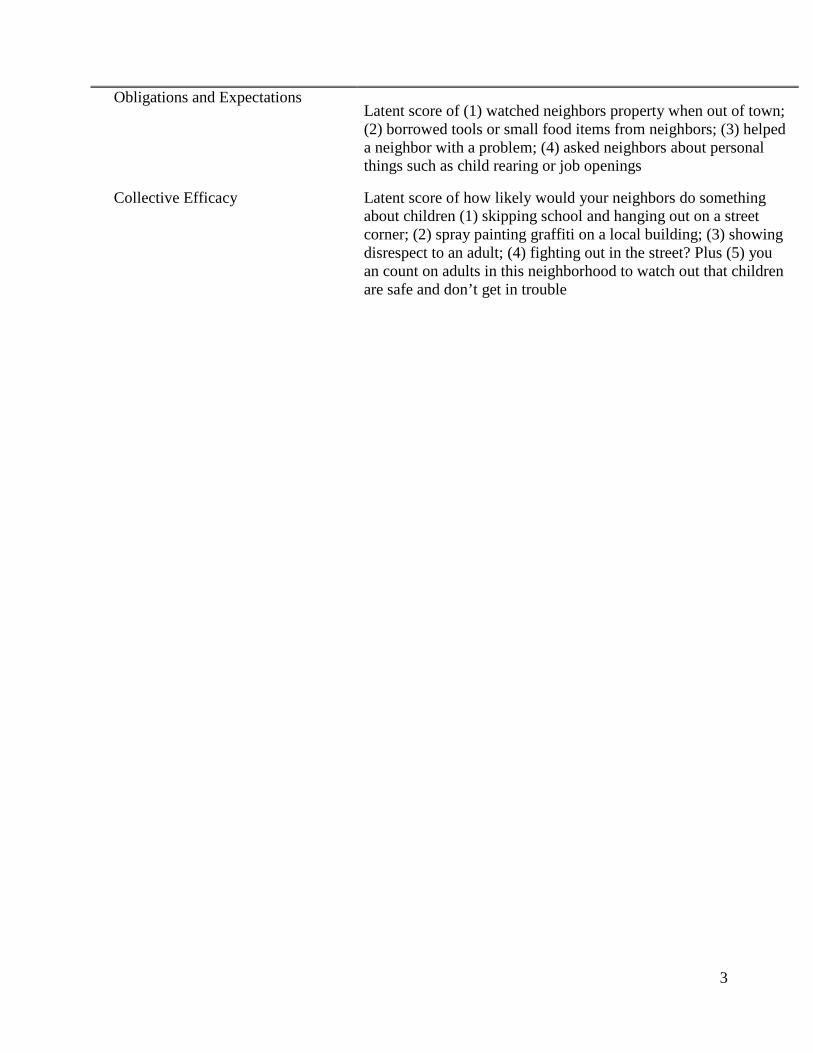
3
Obligations and Expectations Latent score of (1) watched neighbors property when out of town; (2) borrowed tools or small food items from neighbors; (3) helped a neighbor with a problem; (4) asked neighbors about personal things such as child rearing or job openings
Collective Efficacy Latent score of how likely would your neighbors do something about children (1) skipping school and hanging out on a street corner; (2) spray painting graffiti on a local building; (3) showing disrespect to an adult; (4) fighting out in the street? Plus (5) you an count on adults in this neighborhood to watch out that children are safe and don’t get in trouble
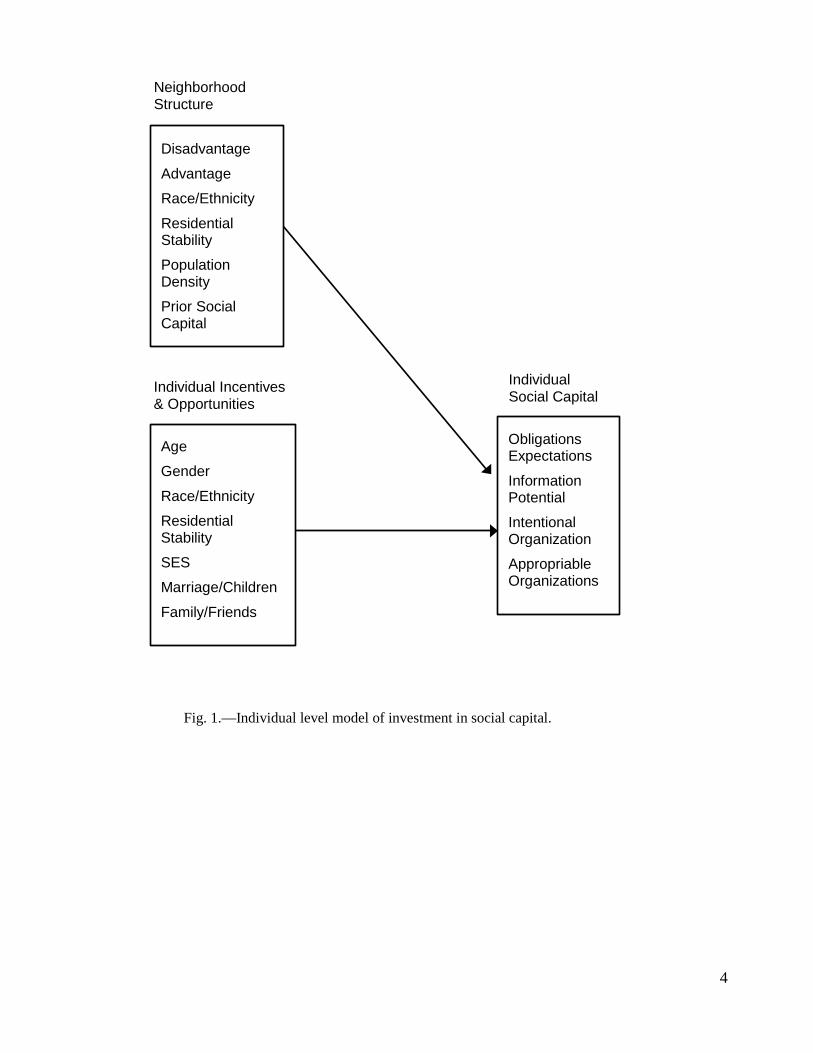
4
Disadvantage Advantage Race/Ethnicity Residential Stability Population Density Prior Social Capital
Age Gender Race/Ethnicity Residential Stability SES Marriage/Children Family/Friends
Neighborhood Structure
Individual Incentives & Opportunities
Obligations Expectations Information Potential Intentional Organization Appropriable Organizations
Fig. 1.—Individual level model of investment in social capital.
Individual Social Capital
Related Documents