RUHR ECONOMIC PAPERS Social Accountability and Service Delivery: Experimental Evidence from Uganda #752 Nathan Fiala Patrick Premand

Welcome message from author
This document is posted to help you gain knowledge. Please leave a comment to let me know what you think about it! Share it to your friends and learn new things together.
Transcript
RUHRECONOMIC PAPERS
Social Accountability and Service Delivery: Experimental Evidence from Uganda
#752
Nathan FialaPatrick Premand

Imprint
Ruhr Economic Papers
Published by
RWI – Leibniz-Institut für Wirtschaftsforschung Hohenzollernstr. 1-3, 45128 Essen, Germany
Ruhr-Universität Bochum (RUB), Department of Economics Universitätsstr. 150, 44801 Bochum, Germany
Technische Universität Dortmund, Department of Economic and Social Sciences Vogelpothsweg 87, 44227 Dortmund, Germany
Universität Duisburg-Essen, Department of Economics Universitätsstr. 12, 45117 Essen, Germany
Editors
Prof. Dr. Thomas K. Bauer RUB, Department of Economics, Empirical Economics Phone: +49 (0) 234/3 22 83 41, e-mail: [email protected]
Prof. Dr. Wolfgang Leininger Technische Universität Dortmund, Department of Economic and Social Sciences Economics – Microeconomics Phone: +49 (0) 231/7 55-3297, e-mail: [email protected]
Prof. Dr. Volker Clausen University of Duisburg-Essen, Department of Economics International Economics Phone: +49 (0) 201/1 83-3655, e-mail: [email protected]
Prof. Dr. Roland Döhrn, Prof. Dr. Manuel Frondel, Prof. Dr. Jochen Kluve RWI, Phone: +49 (0) 201/81 49-213, e-mail: [email protected]
Editorial Office
Sabine Weiler RWI, Phone: +49 (0) 201/81 49-213, e-mail: [email protected]
Ruhr Economic Papers #752
Responsible Editor: Manuel Frondel
All rights reserved. Essen, Germany, 2018
ISSN 1864-4872 (online) – ISBN 978-3-86788-874-5The working papers published in the series constitute work in progress circulated to stimulate discussion and critical comments. Views expressed represent exclusively the authors’ own opinions and do not necessarily reflect those of the editors.
Ruhr Economic Papers #752
Nathan Fiala and Patrick Premand
Social Accountability and Service Delivery: Experimental Evidence from Uganda

Bibliografische Informationen der Deutschen Nationalbibliothek
The Deutsche Nationalbibliothek lists this publication in the Deutsche National-bibliografie; detailed bibliographic data are available on the Internet at http://dnb.dnb.de
RWI is funded by the Federal Government and the federal state of North Rhine-Westphalia.
http://dx.doi.org/10.4419/86788874ISSN 1864-4872 (online)ISBN 978-3-86788-874-5
Nathan Fiala and Patrick Premand1
Social Accountability and Service Delivery: Experimental Evidence from Uganda AbstractCorruption and mismanagement of public resources can affect the quality of government services and undermine growth. Can citizens in poor communities be empowered to demand better-quality public investments? We look at whether providing social accountability training and information on project performance can lead to improvements in local development projects. The program we study is unique in its size and integration in a national program. We find that offering communities a combination of training and information on project quality leads to significant improvements in household welfare. However, providing either social accountability training or project quality information by itself has no welfare effect. These results are concentrated in areas that are reported by local officials as more corrupt or mismanaged, suggesting local agents have significant information about where corruption and mismanagement is worse. We show evidence that the impacts come in part from community members increasing their monitoring of local projects, making more complaints to local and central officials and increasing cooperation. We also find modest improvements in people’s trust in the central government. The results suggest that government-led, large-scale social accountability programs can strengthen communities’ ability to address corruption and mismanagement as well as improve services.
JEL Classification: D7, H4, O1
Keywords: Social accountability; community training; scorecards; corruption; service delivery
May 2018
1 Nathan Fiala, University of Connecticut, Makerere University and RWI; Patrick Premand,World Bank. – This study was pre-registered under AEARCTR-0001115. We are very thankful to Suleiman Namara and Endashaw Tadesse, who led the design and supervision of the program at the World Bank; and James Penywii and Munira Ali, who managed it at the Ugandan Inspectorate of Government. We thank Filder Aryemo and Jillian Larsen for outstanding research and operational contributions; Iker Lekuona, Kalie Pierce, Simon Robertson, Areum Han and Mariajose Silva Vargas for excellent research assistance; the study participants for generously giving their time; as well as the field officers of Innovations for Poverty Action. Data collection was funded by a Vanguard Charitable Trust and the World Bank, including grants from the i2i and NTF Trust Funds. We are grateful for comments provided at various points during this study by Colin Andrews, Chris Blattman, Bénédicte de la Brière, Robert Chase, Deon Filmer, Vincenzo Di Maro, Christina Malmberg Calvo, Ezequiel Molina, Obert Pimhidzai, Pia Raffler, Ritva Reinikka, Dena Ringold, Danila Serra and Lynne Sherburne-Benz, as well as audiences at Harvard University, Makerere University, GIGA, RWI, DIW Berlin, the University of Connecticut and the World Bank. All findings, interpretations, and conclusions in this paper are those of the authors and do not necessarily represent the views of the World Bank or the government of Uganda. – All correspondence to: Nathan Fiala, University of Connecticut, USA, e-mail: [email protected]
1
11 Introduction Corruption and mismanagement of public resources can undermine development by
generating costs for society. Those costs can range from an increase in bureaucratic
hurdles to extract payments from citizens, to the creation of an unappealing economic
environment for foreign investments, or a reduction of human capital stemming from low-
quality delivery of health or education services (Bertrand et al., 2007; Woo, 2010;
Reinikka and Svensson, 2004; Bjorkman and Svensson, 2009). Corruption and
mismanagement can also increase inequality by affecting more severely those with less
voice but greater need for public services (Olken, 2006; Hunt, 2007).
Recent research has suggested that empowering local populations and promoting
transparency on the performance of local leaders and service providers can improve public
governance by increasing the demand for accountability. A recent systematic review by
Molina et al. (2016) finds that local monitoring can improve health services, though the
evidence is limited due to a small number of studies. There is particularly little empirical
evidence on the effectiveness of promoting social accountability in the context of large-
scale national programs (Devarajan et al., 2011).
Community and government officials may misuse or divert funds from local
populations. When combined with collective action problems and lack of information and
skills to address these issues, corruption could lead to significant problems in service
delivery. Can citizens in poor communities be empowered to demand better-quality public
services and programming from local officials and bureaucrats? To answer this, we worked
with the Inspectorate of Government of Uganda to conduct an experiment with a large
sample of communities. We test whether providing monitoring skills and encouraging the
reporting of cases of mismanagement, as well as disseminating information on the absolute

2
and relative performance of community projects, pushes citizens to demand and obtain
more from local development projects.
Communities from across the broad north of Uganda were selected by the central
government to receive a community-driven development program called the Second
Northern Uganda Social Action Fund (NUSAF2). From a list of 940 communities that
received a NUSAF2 project, we randomly selected 634 to receive a six-day training on
how to monitor community projects, including how to identify and make complaints
about corruption and mismanagement to implementing partners and local, sub-national,
or national leaders. The trainings were managed by the Inspectorate of Government (IG),
an independent arm of the government responsible for fighting corruption, and
implemented in partnership with local civil society organizations (CSOs). The sample size
for this intervention is between five and 20 times larger than sample sizes in similar
research, covering more than 45 districts and 485 sub-counties throughout the northern
half of Uganda, with more than 10,000 direct beneficiaries. The design is thus well
powered and allows for a minimum detectible effect size of less than 10% for most
outcomes.
As NUSAF2 comprised a wide range of project types, including building teachers’
houses, providing livestock to households, putting up fencing, and establishing enterprise
development, we developed a normalized index of project quality obtained through
physical assessments of the projects (similar to audits). These data were collected about
six months after the mean completion of the local NUSAF2 projects and were used to
measure the immediate impacts of the training. We then used the information collected
from this assessment to create a scorecard that ranks the performance of the community
projects relative to other community projects within a district. We randomly selected 283
communities to be given this information during a community meeting, which included a

3
facilitated discussion about why communities did or did not perform well relative to
others.
This produced a 2x2 design where communities received training, a scorecard, both
training and a scorecard, or no intervention. This design allows us to test directly whether
training communities on social accountability or simply providing information on relative
project quality can lead to improved service delivery, or if a combination of the two is
needed.
We conducted individual surveys with community members six months after the
initial assessment and scorecards were delivered to measure household welfare impacts.
The sample includes over 6,900 individuals. Almost two-thirds of the projects provided
livestock to households, making these projects more easily comparable to one another and
more likely to have welfare implications for individual households. For these reasons, we
focus our welfare analysis on these projects, though we also present results from the full
sample.
We find that the social accountability training led to a small increase in the overall
quality of projects by 0.135 standard deviations. From the follow-up household survey
conducted six months later, we find that neither the training nor the project quality
scorecard alone had any impact on household welfare. However, the combination of the
two led to very large household welfare increases: households in communities that received
both training and information scorecards have approximately 0.6 more head of cattle per
household, or 27% more than the control group. This is equivalent to approximately $114
per household ($1,140 per community) worth of animals. These findings indicate that for
rural Ugandans, who often have limited interactions with the government, providing
training alone or information about the quality of a project alone is not sufficient to
increase the quality of service delivery. Rather, the combination of training on how to

4
identify issues and report problems with information on the performance of projects leads
to large welfare improvements.
We explore mechanisms for the observed impacts and find that the training and
information increased community monitoring of the projects and cooperation among
community members. People report spending more time visiting and monitoring projects
and making complaints to various levels of government. Individuals also report an
increased ability of communities to solve collective action problems and a modest increase
in trust in the central government.
During a survey conducted before the experiment, we asked local leaders to
identify areas near them that they thought had more corruption or mismanagement
issues. We conduct heterogeneity analysis using these responses. We find that program
impacts are concentrated in areas that local officials report as being more likely to be
corrupt or mismanaged. We do not find spillovers across communities on our outcomes of
interest, but we do find increased rates of monitoring of other projects or government
services within treatment communities, suggesting the impacts observed here could
expand to other public investments in treated communities.
Uganda, like many developing countries, faces significant challenges with service
delivery. For example, though lowering child mortality and increasing rates of primary
school enrollment are both major goals of the government, both of these measures of
service delivery are poor (Bold and Svensson, 2013). Low-quality services can obviously be
related to a lack of funding for programs, but even when money is available, service
provision can also be a problem. Hard data on the sources of these issues are rare, though
corruption and mismanagement by officials or service providers, as well as citizens’
behaviors are often blamed.
5
An active body of research seeks to identify the most cost-effective approaches to
reduce corruption and improve management of development projects. Research on the
impact of community-based monitoring can be broadly divided into two types of
interventions. The first involves providing trainings for communities to learn to identify
issues on local development projects and how to act on them. The second involves
providing information to communities on the quality or process of local development
projects.
The evidence for the first type of intervention is extremely limited. In the only
study we are aware of that provides trainings to communities, Bjorkman and Svensson
(2009) experimentally tested a program that combines information on the quality of
providers and two half-day trainings to communities to improve provision of health care
in Uganda. They find communities receiving this combined intervention monitored
providers more, and these providers increased their effort levels. This led to reductions in
child mortality and increased child weight. Nyquist, De Walque, and Svensson (2017) find
that these results were sustained four years after the program. They also introduced
another treatment arm with training only, but their findings suggest that this was not
enough to lead to sustained changes in the communities. They did not, however, have an
information-only treatment. Note that both studies have a relatively small sample size,
with 50 communities per treatment arm, which means there could be low statistical power
for some tests.
Evidence for providing information to communities is a bit more developed, though
the results obtained thus far are mixed. In a well-known experiment, Olken (2007) tested
the effect of dramatically increasing top-down audit rates and encouraging citizen
monitoring of road projects in Indonesia. The community monitoring was done through
accountability meetings, where local leaders explained how funds were used. Communities
6
received no other trainings or support to monitor that spending. Olken found significant
decreases in leakages from the audits, but no effects from the community monitoring.
Andrabi, Das, and Khwaja (2017) randomly provided report cards on school performance
to communities in Pakistan. They found the report cards led to increases in test scores
and enrollment, and decreases in school fees. Banerjee et al. (2010) conducted a
randomized evaluation of a program that tested whether community-created scorecards
could lead to increased community participation in child education in India. They found
this program had little impact. In another study, however, Banerjee et al. (2018) mailed
information on a rice distribution program in Indonesia to inform households about the
program, and find beneficiaries received significantly more rice. Finally, Barr et al. (2012)
tested community-created scorecards on school performance in Uganda. Their findings
indicate that the use of the scorecards increased student test scores and decreased teacher
absenteeism. These varied results suggest that providing information can lead to improved
service delivery, but information alone may not be enough, and the mechanisms and
distributional effects are not well known.
Our contributions to this literature are as follows. First, we provide evidence that
social accountability training and information on project performance can empower
communities to improve the public investments they receive. Our design allows us to
conclude that project quality information or accountability training alone is not sufficient
to improve services in a low-capacity environment; instead, both interventions need to be
used together.
Second, these interventions were part of a large-scale, government-run program
managed by the Inspectorate of Government and implemented in cooperation with local
civil society organizations. As such, the scope, delivery mechanism, and scale of the
program make it particularly relevant for learning about policy effectiveness. Recent
7
evidence on the differences in approach and impact of interventions by governments,
NGOs, and small tightly designed experiments has led to concerns about external validity.
Peters, Langbein and Roberts (2018) review 54 RCTs and find that almost two thirds are
run with NGO or researcher managed interventions. Bold et al. (2015) find large impacts
from an NGO run intervention in schools in Kenya, while the same intervention run by
the government leads to no impacts. Our results show that large-scale, government-led
versions of social accountability programs can be effective.
Third, we provide evidence of the mechanisms behind these effects. While we
cannot rule out all potential mechanisms, we present evidence that increased
empowerment obtained through the combination of training and information led to
greater monitoring by the community and increased complaints to all levels of
government. Our findings also suggest significant spillovers from the intervention onto
other government services in these communities.
Fourth, we estimate the distributional impacts of corruption and mismanagement
by using a novel data collection strategy. We asked local officials to identify areas that
were more likely to have problems with corruption and mismanagement before the start of
the program. We find that increases in household welfare are concentrated in areas
identified as being more likely to be corrupt, suggesting the program is more effective
where government services are performing worse. While research has shown there can be
important distributional implications of corruption and mismanagement, this has not been
well tested in the context of social accountability interventions.
These findings also suggest that local officials are aware of where there are
corruption and service delivery problems, to a better extent than the central government.
Our results thus add to recent research on the information asymmetries of principals and
agents, including work on organization decentralization (Dal Bo et al, 2018; Aghion and

8
Tirole, 1997; Bloom et al., 2012; Mookerjee, 2006), manager decision making for
deployment of monitoring systems (de Rochambeau, 2017) and who to target for
programming (Hussam et al., 2017).
The results of this experiment suggest that low-income citizens can successfully
demand better services, when empowered with both proper skills and information. Large-
scale, government-led versions of social accountability programs can increase the returns
on investments in local development projects and improve citizen engagement with
government. This can happen when social accountability training is combined with
information about performance of local development projects. The effects can be especially
strong in areas where local service delivery is particularly poor. Recent calls by
international organizations for greater accountability is leading some to argue for reducing
investments in areas where corruption and mismanagement can be high. Our results
suggest that programs can instead implement a community-based approach, thus
“shrinking the [black] box [of corruption] by minimizing the impact that corruption can
have on aid outcomes” (Kenny 2017).
The remainder of this paper proceeds as follows. In the next section, we describe
the NUSAF2 program, training and scorecard interventions. In section 3 we present the
experimental design. In section 4 we present the data. We examine the results in section
5. Section 6 then concludes with a discussion of the implications of this work and a cost-
benefit analysis.
22 The NUSAF2 program and interventions
NUSAF2 was a large-scale community-driven development program implemented by the
Office of the Prime Minister (OPM) in coordination with local, sub-county, and district
authorities, with $135 million funding from the World Bank and the UK’s Department for
9
International Development (DFID) to the government of Uganda. We present a simple
representation of the various levels of government in Uganda in the context of NUSAF2 in
Figure 1. As part of the program, communities were invited to formulate projects and
submit proposals to project offices based in the sub-counties3. Once approved by the sub-
county, the proposals were then passed to the district, which assessed the feasibility of the
projects before passing them on to OPM for final approval and funding. The submitted
projects fell under three categories: (i) public works, (ii) livelihood investment, and (iii)
infrastructure rehabilitation.
Once projects were approved by OPM, funds were managed directly by the
communities themselves through a variety of committees. The Community Project
Management Committee and Community Procurement Committee were responsible for
the delivery of the selected projects. Community Social Accountability Committees were
created to oversee and monitor project progress and provide oversight within the
community. Sub-county and district authorities were then expected to undertake
monitoring and supervision in coordination with NUSAF2 project staff.
A highly decentralized project like NUSAF2 can create a range of transparency and
accountability challenges.4 Some concerns include that community and government
officials may potentially misuse, or divert funds from community projects. Anecdotal
evidence from a previous phase of the program suggests some cases of misappropriation of
funds by officials. If transparency is limited, communities may lose control over how
money is spent. Officials may insist on low-quality suppliers for community projects,
potentially expecting kickbacks. Community elites may try to engage in similar behavior
3 ”Community” refers to either a village or a collection of villages that come together to propose a NUSAF2 project. They are thus not legal designations but are official designations under NUSAF2. 4 Evidence from Fisman and Gatti (2002) suggest that decentralization can actually reduce corruption. We do not take a position on whether decentralization in Uganda has increased or decreased corruption, only that a highly decentralized program can create a range of potential challenges.

10
to attempt to manage funds with little oversight or to induce fellow community members
to hire low-quality suppliers.
At the same time, it is often impossible to separate corruption from general
mismanagement of resources. Communities and local governments may simply not have
the capacity to make optimal decisions, and so funds may be used inefficiently or
ineffectively. It is also possible that there may be issues with collective action, where
communities may fail to implement a project well because it is too difficult to organize
community members to complete the activities. This could be an especially large problem
in the case of public works programs, which require local labor, or construction projects
where monitoring of suppliers is difficult and time consuming. Finally, beneficiaries
themselves may simply fail to take sufficient care of public investments they receive.
To address these potential concerns, a Transparency, Accountability, and Anti-
Corruption (TAAC) component was included in the design of the NUSAF2 project. We
worked with the Inspectorate of Government to embed a randomized control trial as part
of the component. In the seventh and eighth rounds of NUSAF2 funding (out of a total of
12 rounds), communities were trained on the details of project implementation and how to
identify and prevent cases of corruption and mismanagement. The training was
implemented by seven different CSOs across the broad north of Uganda,5 which sent
representatives to communities to implement detailed training on social accountability
and community monitoring of NUSAF2 projects. The program also organized follow-up
visits by CSO representatives to provide ongoing training and advise the communities on
how to monitor implementation of NUSAF2 projects.
5 Due to the size of the program, one civil society organization managed the implementation of the program but sub-contracted to seven individual CSOs that were present in the districts where the training was implemented.

11
When the CSO trainers first entered a community, they organized community
assemblies. The assemblies discussed the principles of social accountability and
community monitoring. As part of this mobilization phase, each community elected
additional representatives to add to an existing social accountability committee. The
existing committees were generally considered to be untrained and poorly prepared to
monitor issues in the project. The social accountability training was thus designed to give
them new capacity and revive their mandate. Members of the new committees made a
public pledge to participate in the training program, undertake monitoring of the project
on behalf of the community, and report back to the community.
The training provided background on social accountability and the NUSAF2
program, taught participants community-monitoring skills, and provided tools to monitor
NUSAF2 projects. The training also provided hands-on skills in writing reports, providing
feedback to the community, generating a community action plan, and applying
monitoring skills to projects other than NUSAF2 in the community. The training gave
special focus to encouraging communities to reach out and make complaints to the local
and central governments, including the IG if necessary. People could contact the IG either
by approaching a local office in their district or by texting a new national corruption
hotline. A detailed description of the program components is presented in the appendix,
including some of the visual training materials used for illiterate populations (Figures A1
and A2).6
6 In addition to the main training treatment, an additional treatment was also attempted in a random sub-sample of communities. This additional treatment was supposed to increase incentives for individuals to monitor projects through non-monetary rewards. These took the form of pins provided to participants showing they served as community monitors. These individual incentives were low value. In addition, group rewards were considered for communities who completed the entire training, conducted the community monitoring and produced timely monthly reports. However, these group rewards were not implemented. We compare the treatment effects between the different treatments and do not observe a meaningful difference in coefficients and significance. For the analysis presented here, we thus do not differentiate between the different treatments and instead present results of the pooled treatment.
12
Approximately six months after the mean completion date of these projects, from
December 2015 through January 2016, we conducted an assessment of the quality and
quantity of the community projects. This was done through physical observations. We
then used this information to construct a score for the projects in each community. In
February 2016, individual community facilitators, trained by the research team but
identifying themselves as representing the IG, went to communities to present these
scores. The facilitators also provided communities a ranking of their performance, relative
to other NUSAF2 communities in their district. The scorecard stated that their project
was ranked X out of Y projects in the district based on their performance in the
assessment. An example of a scorecard is presented in Figure 2.
To ensure comparability of scores, the scorecard was done only for livestock
projects. (Due to operational issues, we also had to exclude the Karamoja region)7.
Treatment communities were presented summary information on the health of animals,
animal productivity, assistance from the district veterinary officer (who was supposed to
assist communities with their animals but was not always present), and a constructed
value for money score that was calculated by multiplying the number of animals received
by the productivity score of all the animals, divided by the total money received for the
sub-project.
During the dissemination of the scorecards, the communities were invited to
discuss the results. This discussion was supported by the community facilitator and
included opening remarks from community leaders and a speech introducing the goals of
the meeting. The scorecard results were then announced, with each component of the
7 The focus on livestock means that the information treatment was conducted only in projects that were a private good, as opposed to infrastructure projects that were a public good. We provide evidence below that the training treatment had similar impacts in livestock and other project types, but we do not have direct evidence on whether project quality information could have led to improvements in public good projects.

13
score fully explained. The meeting ended with a discussion about how communities could
use the results of the score to improve service delivery and accountability in the
community. Some of the actions suggested by communities that were discussed during
these meetings included: (1) voicing concerns to the sub-county and district leadership;
(2) participating actively in the community projects; (3) voting for local politicians whom
they believe can best help the community develop; (4) selecting the best possible sub-
project leaders and monitoring them closely; and (5) working together as a community to
resolve issues whenever they can.
The facilitator brought to each community five copies of the scorecard in English
and five copies in the local language, a number line to graphically show the ranking of the
community project, and sodas and soap as gifts to participants. Once the facilitators left,
they did not return to the community.
The interventions we study here were based on a well-defined curriculum that was
directly relevant for projects being implemented in communities. The training intensity
was relatively long compared to other studies cited above. The scorecard information was
also tailored to the projects and meant to encourage specific action by communities and
presented direct comparisons to other communities in their area.
33 Experimental design
Due to the large size of the NUSAF2 program, it was implemented in twelve rounds over
five years. Working with the IG, we were given a list of all projects to be funded in the
seventh and eighth rounds and randomized which communities would be given the social
accountability and community monitoring training. The randomization was done in Stata.
Due to the limited amount of administrative data from the government that had been
digitized, we were only able to observe the location, budget, and rough classification of
14
projects ex ante (whether public works, livelihood investments, or infrastructure
rehabilitation projects). The communities’ choice of project type was based on an
endogenous process that we were not able to observe. We present some discussion in the
next section about what predicts the type of project that is chosen. Note that every
community in our sample received a NUSAF2 project. As the interventions we study here
were randomly distributed across projects, and project types are well balanced for each
treatment and control condition, the type of project chosen by a community does not bias
our inference of impacts from the training and information treatments.
The timeline for this study is presented in Figure 3. An initial survey of local
officials, discussed below, was conducted in early 2013. In November 2013, we received the
list of NUSAF2 projects from the seventh and eighth funding rounds. We randomly
assigned communities into social accountability training treatment or control in January
2014, with the NUSAF2 program and social accountability trainings beginning in June
2014. In December 2014, 80% of the funds were distributed, with the other 20% funded in
the preceding six months. Some projects were completed quickly, such as livestock
projects, while road and building construction took up to one year to complete. All
projects were completed by October 2015, with a mean completion of June 2015. We
conducted the project quality assessment from December 2015 to early February 2016.
From this assessment we constructed the project quality information scorecard and
randomized communities to receive the scorecard intervention in February. We then
distributed the scorecards from February to March 2016. Six months after the assessment,
in June to July 2016, we completed the final household survey. The final household data
collection was done on a rolling basis to coincide with the timing of the project assessment
and ensure that communities were visited on a consistent timeline.

15
The design and number of projects by type and treatment status for the social
accountability training intervention are presented in Table 1. A total of 940 projects were
included in the sample. However, our main outcomes are not easily comparable across
each of the project types. In the project types with the smallest number of communities,
we were unable to create a reliable index of outcomes from the first project assessment,
and so we focus on the most common project types: enterprise development, fencing,
livestock, road and housing construction, and tree planting. This reduces our sample to
895 projects8. For household-level welfare outcomes, we include all project types.
In Table 2 we present the information scorecard design. As described previously,
we developed and delivered the project quality information scorecard only to communities
with livestock projects to improve comparability. Due to operational difficulties, we did
not include the northeast part of the country, the Karamoja region, with 61 communities.
A total of 574 communities are thus included in the sample. The end design is a 2x2 that
includes both social accountability training treatment and control communities.
The NUSAF2 program and the social accountability training were implemented
across the broad north of Uganda. We present a map of training treatment intensity in
Figure 4. The figure shows the number of NUSAF2 communities that received training by
parish across the entire sample9. In some areas, there is a high concentration of projects,
but for the most part they are distributed across the broad region. We also look at
8 Because we had limited information on project type before selecting communities for the social accountability training treatment, we were not able to pre-drop project types that were implemented in numbers too small to allow for reasonable comparison of project quality, as is commonly done in similar experiments. We instead drop them in our analysis here. As the number of such projects is small (less than 5% of the sample in total), and given that we target all the projects delivered by NUSAF2 in two funding tranches, this post-dropping should not affect our internal or external validity. 9 Administrative units in Uganda, from largest to smallest, go from the central government to the district, then sub-county, parish, and village. We present the intensity of projects by parish as it is a medium level of administration and best displays the intensities across the area.

16
spillovers at the sub-county level to test if the number of treated projects within a local
area affects outcomes for the control group.
Before data were analyzed, all the outcomes were pre-registered with the American
Economic Association registration system, number AEARCTR-0001115. The main
outcomes of interest are the quality of the NUSAF2 project10 and household welfare as
captured by assets. To explore potential mechanisms, we also look at whether
accountability training and project quality information scorecards affected the
procurement and contracting process for communities, the level of monitoring by
community members, and the interaction with local officials and technical staff. Our
secondary effects of interest are whether the program changed individuals’ perceptions of
the legitimacy of local and central government, and whether there were spillovers to other
programs in communities.
We measure household welfare using an index of assets. We use both total
household assets and the number of cattle owned by the household, as the latter is a
direct outcome of the livestock projects and is the most common way households store
wealth in the area studied. We explore these effects for all projects but do not expect
animal ownership to change in the non-livestock projects. We therefore constrain some
analysis to livestock projects only.
While we were able to confirm that all of the selected communities received
training, and that training was of satisfactory quality overall, there were delays in some
communities receiving the training. The expectation was that communities would receive
training either before or within a few months of receiving the NUSAF2 project funds.
However, there are three reasons why this did not always happen. First, training
implementers had limited information from the NUSAF2 program office about the timing
10 We describe in the next section and in Tables A1 and A2 the construction of this indicator.
17
of fund disbursements. Second, funds went from the central government to the districts
before going to communities, and there was little information from the districts about
their fund disbursement schedule. These two issues meant that timing the training
precisely was very difficult in practice. Finally, the local CSOs often had difficulties
organizing their activities to implement the training on time, and so delivered training
later than originally planned in some cases.
Soon after the trainings were completed, we conducted a short process evaluation
in a randomly selected 96 projects to determine when funds were received relative to when
the trainings were conducted. We found that 17 projects received their training after they
started using their funds, with 11 receiving training within two weeks of using their funds.
Four projects (4.2% of the randomly selected sample) began using their funds at least a
month before they received training. We consider this late treatment to be non-
compliance. Given the low rate of late trainings, we do not make corrections for non-
compliance and so focus on the intention-to-treat (ITT) estimates.
44 Data and balance
4.1 Data
The data for the analysis presented here come from several sources. Before the program
began, we were given limited administrative data on what projects were to be funded by
NUSAF2. From this list, we obtained information on the location, budget, and general
types of projects.
We conducted a survey of local officials between January and March 2013 in which
we included all 45 districts and 485 sub-counties in areas where NUSAF2 operated at that
time. Sub-county officials interviewed in the survey include elected and appointed
officials, as well as local NUSAF2 officers. We were interested in obtaining information on
18
levels of corruption or mismanagement. To measure this, we asked each respondent the
following question: “In your personal opinion, within your district, which sub-county has
the biggest problem with corruption?” We then counted the number of times a sub-county
was mentioned. Of the sub-counties in the sample, 47% were never mentioned by an
official and 20% were mentioned only once. We created an indicator if the sub-county was
mentioned more than once11.
As mentioned above, outcome data were obtained from two separate surveys: first,
a project quality assessment captures effects on community project outputs, and second, a
survey of individual households conducted six months later that captures effects on the
households.
The first source of follow-up data collected is a project assessment conducted
between December 2015 and February 2016. The project quality assessment includes
observations of community projects by a team of enumerators. For projects with a single
output (e.g., a staff house or a borehole), enumerators directly observed characteristics of
the output. For livelihood support projects where outputs were distributed to
beneficiaries, a sample of beneficiaries was drawn and beneficiary-level outputs were
observed. For example, for livestock projects, a sample of beneficiaries was selected, and
enumerators visited the sampled beneficiaries to observe the animals provided by the
project. The project assessment data allow for the measurement of a set of core outcomes
for the impact evaluation, but also of intermediary outcomes (or main underlying
mechanisms) that can lead to changes in final outcomes. For each domain, the project
assessment allows us to capture a range of variables, which can later be aggregated into
indices. The next sub-sections provide additional information on the main outcomes and
11 It is possible that communities select project types based on local prevalence of corruption. We in fact observe this. Communities that are in areas cited as corrupt choose livestock projects 58% of the time, while those in areas not cited as corrupt choose livestock 70% of the time.

19
intermediary outcomes to be tested and the indicators that were collected to measure
them. The appendix provides tables with the full list of variables composing the indices
(Tables A1 and A2).
The primary outcome is a measure of a project overall score, which is composed of
indices that measure the quality of the project and the quantity of outputs delivered. The
project overall score is the main outcome for the analysis. It is built as an interaction of a
quality measure and a quantity measure. This allows us to account for situations in which
a community received more output from a project but at lesser quality, and vice versa.
The quality and quantity indices are also analyzed separately. As the quality and quantity
indicators are created across different project types, the indices constructed are
normalized within each project type to ensure comparability.
Project quality is measured within each project type through direct observation of
a range of attributes of the project output. For livestock, the project quality score is an
additive index of whether the animal received was of the appropriate age, whether it was
a local or improved breed of animal, whether the animal was productive when visited by
the survey team, and whether the animal displayed any signs of illness. For staff houses,
the quality is measured in terms of how well the walls, roof, windows, doors, ceilings, and
floors meet quality standards. For enterprise projects, quality is determined by whether
individuals have access to materials, transportation, credit, labor, and markets. Road
quality is measured by the material used in the construction. The quality of tree planting
projects is determined by whether the seeds or seedlings are certified by the government
or other NGOs.
The quantity measure captures the outputs delivered as part of the community
project. It is determined by the number of animals received, length and height of the
building constructed, number of people engaged in the enterprise, length of the road
20
constructed, and the number of trees planted. These measures are obtained from direct
observations of the outputs by enumerators at the time of the project assessment. In cases
where the output could not be observed, the quantity measure takes a value of zero. This
happens for livestock projects, for example, when the livestock have died or are otherwise
missing at the time of the follow-up project assessment. We provide the full list of quality
and quantity indicators in the appendix. In addition, Figures A3 and A4 in the appendix
illustrate how some project assessments were conducted in practice.
To complement the observed measures of project quality and quantity of outputs,
we also constructed an index of project implementation. This score is composed of
subjective questions asked of the community about whether they felt the project was
useful, whether it was completed as expected, and whether the materials met expectations
and were not deemed to be too expensive.
The final indicator considered is whether the project could be located for the
project assessment. When the survey team was unable to find a project during data
collection, a research assistant was sent to confirm whether the project existed. In total,
23 of the projects, or 2.6% of the sample, could not be found by the survey team during
any of the attempts at data collection and so were considered missing projects. At the end
of the data collection, the IG was notified of these missing projects. The IG office sent a
team to verify their existence, which reported that they had identified each of the missing
projects and confirmed they had been operating. It is unclear how these projects should be
considered in our analysis. Significant efforts were made by the survey team to locate the
projects and confirm their existence. In addition, the missing projects were livestock and
enterprise projects, which can be hard to identify because most households had multiple
animals and income-generating activities prior to the projects. It is possible that
communities did not declare these projects to the survey team. It is also possible that,
21
when the IG team arrived to confirm the existence of the projects, some communities
presented similar types of output as coming from NUSAF2, even though these outputs
may have previously existed. For our analysis, we test whether the share of these missing
projects varies between treatment and control. For our measures of quality, we code these
projects as zeros. Most importantly, the results are also robust when treating these
projects as survey attrition and dropping them from the analysis entirely.
In addition to the primary outcomes, the project assessment also measures three
sets of intermediary outcomes that capture the main underlying mechanisms that can
explain changes in final outcomes. These include (i) the procurement and contracting
process, (ii) community monitoring, and (iii) community interactions with local leaders.
These three domains relate to some of the key areas covered by the social accountability
training curriculum. Indicators on the procurement and contracting process include an
index of challenges faced by communities in the procurement process, an index of
satisfaction with suppliers of goods and materials, and whether the community hired a
contractor. For communities that did hire a contractor, indicators also include an index of
challenges faced by communities in the contracting process and an index of satisfaction
with the contractor. The second main domain for intermediary outcomes includes
indicators of community monitoring, such as an index of the intensity of project
community monitoring, and an index of the intensity of social accountability committee
(SAC) project monitoring. Finally, the third main domain for intermediary outcomes
captures interactions between communities and local officials. This domain includes
indicators of whether a payment was made to a district official or staff, and an index of
satisfaction with the sub-county NUSAF2 official and district veterinarian officer.
The second source of follow-up data is an endline survey conducted with
households in the sample communities in June and July 2016. The sample surveyed was a
22
selection of individuals who directly benefited from the NUSAF2 project, as well as a
sample of the broader community. Eight people per community were surveyed, including
the chairpersons of each of the executive committees in the project, two members of the
original community social accountability committee, two members from the expanded
community accountability committee (called the CMG) in the social accountability
training treatment group, and two regular members. In social accountability training
control communities, the CMG does not exist and so this group was replaced with two
regular members. The sample is thus composed of eight beneficiaries in social
accountability training control communities and six in social accountability training
treatment communities. The remaining two individuals in the treated communities are
people associated with the program but not necessarily directly affected by it.
The data from the household survey includes assets, including animals and
household durables; whether the individuals had made complaints to local leaders about
their NUSAF2 project or other projects in the community; and the individuals’ level of
trust in local leaders. The descriptive statistics for the project assessment and household
data collections are presented in Table 3. The description is separated by whether data
were collected at the project or household level. While NUSAF2 targeted very low-income
households, most had livestock in their home, with the mean household having 2.45 cattle
at the endline12.
The sample size for the household survey was determined to provide the highest
statistical power given a fixed budget. The intra-cluster correlation (ICC) for the main
outcome of interest, number of cattle, is 0.045. For the scorecard sample, which includes
12 As part of a separate experiment, the enumeration teams were randomly assigned to villages during the second data collection. This was done to test for enumerator effects on reported household characteristics and outcomes. There is no or very little enumerator bias introduced on the main outcomes of interest, especially number of animals. While the experiment is not able to directly test for Hawthorne effects, the lack of enumerator bias and the fact that the enumeration team was separate from the implementation team reduces the likelihood of such issues impacting the main results.
23
574 clusters, the minimum detectible effect (MDE) size is below 10%. For total assets, the
ICC is 0.35 and so the MDE is approximately 15%.
44.2 Balance tests
Tables 4 and 5 present balance tests for the social accountability training and project
quality scorecard samples, respectively. Due to the project timeline and funding, a full
baseline with communities was not feasible. We do have four indicators that were
available before the beginning of the NUSAF2 projects in the sample: the amount of
money approved per community, the type of project, when the program grants were
received, and the level of corruption and mismanagement in the areas where the
communities exist. We also present tests for whether the randomly drawn respondent in
the household survey was a man, whether that person could write or read, and the
distance from the respondent’s household to the sub-county headquarters. We include
these last four measures because we believe they are not likely to have changed due to the
program and so reflect the characteristics of the communities before the social
accountability training treatment.
We do not find a statistically or economically significant difference between the
social accountability training treatment and control groups for any of the project-level
indicators. For the broader sample (Table 4), the amount of funding received by project
averaged over 20 million USH (a little over USD 6,000)13. The test for balance shows a
difference of less than 1% from the control group and is not statistically significant.
Similarly, there is no difference in the likelihood of the project being livestock, or in the
date when the funding was received in the communities. There is a small difference in
13 This average included very large projects such as teachers’ houses. The amount for livestock and enterprise projects averaged just less than half this amount.

24
whether participants were men and whether they could write, but while these differences
are significant, they are relatively small. The scorecard sample, presented in Table 5, is
likewise well balanced, with no characteristic being significantly different between
scorecard treatment and control communities. We conclude, therefore, that the
characteristics of the communities and the people within the communities are generally
well balanced due to randomization.
55 Results
To identify the impact of the programs on project- and household-level outcomes, we run
the following intention to treat (ITT) OLS regression model:
Yi = β0 + β1Ti + β2Si + β3Ti*Si + φR + εi (1)
where i refers to a project or household and Yi is the outcome of interest. Ti is whether a
community was randomly selected to the social accountability training treatment, Si is the
scorecard treatment, and Ti*Si refers to communities assigned to both social accountability
trainings and scorecard distribution. R is a matrix of region dummies and εit is the error
term. The coefficient β thus presents the impact of the social accountability training
treatment only, γ the impact of the scorecard treatment only, and β1 + β2 + β3 the
impact of combining social accountability training and scorecard treatments. For
household-level outcomes, we cluster the standard errors at the project level.
We begin by discussing the impacts of the intervention on project quality as
measured through the project assessment. This analysis is done on data collected before
the scorecard intervention, and so we do not consider the β2Si and β3Ti*Si terms in
25
Equation (1)14. We then present the results of the household survey conducted six months
later, including the scorecard effects. To explore the potential mechanisms, we discuss
impacts on monitoring of projects and reporting to government officials as well as other
community activities as reported by respondents. We end by looking at important
heterogeneities in treatment and local spillovers.
Note that we do not use multiple hypothesis correction for outcomes. This is
because we have only two main outcomes: project score (measured during the assessment)
and household assets (measured at the household endline). Both of these are indices of
family of outcomes. We present analysis on the individual family components and test for
mechanisms without correction as we consider these to be exploratory analyses. Note that
the endline survey was powered to identify a minimum detectible effect size of 8% on our
main household outcome and mechanisms. Due to the endline survey being very well
powered and the high level of significance of estimations, most of the results from that
survey would pass conservative correction procedures.
55.1 Initial impacts on project performance
The impacts for the main outcomes from the project assessment survey are presented in
Table 6. These include the overall score for each of the NUSAF2 projects in the sample
(columns 1 and 2), which is created by multiplying the project quality score (columns 3
and 4) and quantity score (columns 5 and 6) together. We also look at whether the
project could not be located (columns 7 and 8). Each of these indicators is from the first
project assessment and is estimated at the community level. The indicators are
standardized, as discussed previously.
14 However, we estimate equation (1) for some outcomes measured before the scorecard intervention to provide additional balance tests.
26
Odd-numbered columns report results for all project types in the sample. We find a
small positive and statistically significant impact on the overall score of the project of
0.135 standard deviations. This effect appears to be coming mostly from the quantity
indicator (column 5) and is not driven by whether the project could not be located. The
results suggest that the training led to an increase in quantity of outputs delivered by
projects by approximately 0.177 standard deviations. There are no statistically significant
effects on the quality score. In appendix Table A9, we also look at these results when
trimming the top and bottom 0.5% outcomes and find broadly similar results15.
Even-numbered columns report outcomes for interacting treatment with whether
the NUSAF2 project was non-livestock. We look at this difference specifically as we are
interested in whether the results are being driven by a specific project type. As most
project types are a small portion of our total sample, we are only able to look at livestock
projects, which are about two-thirds of the total sample. Livestock projects are also the
project type most likely to directly lead to welfare impacts at the household level, which
we discuss in the next sub-section. The coefficients for treatment effects remain about the
same size. However, most likely due to decreases in power, the project overall score is not
significant at the 10% level, though the quantity score is of the same significance as the
non-interacted results. None of the interaction terms are significant. We conclude that
there is likely very little difference between the impact of the program by project type, at
least when comparing to livestock.
To help reduce power concerns and further explore impacts, we present in Table 7
the scores and score components for livestock-only projects. The livestock projects offer an
opportunity to further improve our power as we have five observations per project as
15 A randomized inference test produces results similar to the OLS results, and so we only present the results of the OLS specification.
27
opposed to just one data point for the road, fencing, and house projects. The analysis
conducted in Table 7 is thus at the animal level, rather than at the project level. All of
the analysis includes clustered standard errors at the project level.
Similar to the results in Table 6, we find a small but statistically significant effect
from the training on the quantity score in column 3. Treatment increased livestock
quantity by 0.125 standard deviations, significant at the 10% level. The total score and
quality score are not statistically significant. We further explore the components of the
score in columns 4 to 8 and find no statistically significant impacts on the age of the
animal when it was purchased by the community, the breed of the animal, whether the
animal was deemed productive, or the health of the animal16. We do find a decrease in
whether the animal was reported to the project assessment team as dead, stolen, or sold.
To provide additional information on the balance of the scorecard randomization,
we present in Table 8 the same analysis as Table 7 but include the scorecard treatment
and interaction terms. This is a form of balance test, as the data from Table 8 is from
before the scorecard treatment. We thus expect no statistically significant coefficients
from the scorecard and interaction terms. We do not find anything significant except for a
small positive effect on the interaction term for whether the animal was productive. The
coefficient is small relative to the control and significant at the 10% level. Combining this
and the results from Table 5, we conclude that the scorecard sample is well balanced.
55.2 Impacts on welfare
Six months after the initial project assessment, we conducted an additional household
survey in the communities to measure household-level welfare outcomes. The household
16 Note that the illness index is reweighted as 1 minus the mean number of illnesses, so the positive coefficient means fewer observed illnesses.

28
survey allows us to go beyond the measure of project quality obtained from the project
assessment and estimate potential welfare impacts of the program at the household level.
In Table 9 we present the main outcome of interest for the household survey: the
number of cattle and an index of total household asset ownership. Columns 1 and 2
present the asset outcomes for all project types, columns 3 and 4 present these outcomes
only for livestock projects, and columns 5 and 6 present results for projects in the
information scorecard sample. Note that we do not expect impacts on the number of
household animals for any but the livestock projects. We prespecified a focus on this
outcome as livestock projects represent 68% of the sample, and we believe these are the
projects that are most likely to lead to direct changes at the household level. They are
also the focus on the scorecard intervention. For this analysis, we restrict the sample to
those who were direct beneficiaries of the program, i.e., those who were selected to receive
animals from NUSAF217.
We do not find statistically significant impacts on the number of animals from all
of the projects in the sample, though the coefficient for cattle is large. However, we do
find statistically significant and very large effects on the total number of assets in the
household. For livestock-only projects, we find statistically significant effects for both
cattle and total household assets. The effects on cattle are large at 0.31 additional animals
per household, an increase of 15% relative to the control group18. As there were 10
households per community that received cattle as part of livestock projects, this
represents an increase of approximately 3 cattle per community, on average.
17 The endline survey was conducted on eight beneficiaries per community in the control group. In the treatment group, we included six beneficiaries, as well as two non- beneficiaries who were selected to join the community managements committee as part of the training intervention. We do not include non-beneficiaries in this analysis as we do not expect impacts from the treatment on household welfare. 18 While NUSAF2 delivered only one animal to households, a goal of the project was to lead to new animal births, thus theoretically multiplying the number of animals beneficiaries have over time. Thus, the comparison of treatment effects should not be made to the one animal delivered, but to the number of animals in the control group.
29
Looking at the impacts for the scorecard sample in columns 5 and 6, we test the
full model presented in Equation (1), which includes a dummy for social accountability
training treatment, scorecard treatment, and the interaction of the two treatments. None
of the coefficients in column 5 are statistically significant. However, a joint test of the
social accountability training plus scorecard plus interaction terms is significant at the 2%
level for cattle. We cannot reject equality of the social accountability training and
scorecard treatments. We find similar results for the total assets indicator.
The results from the household survey analysis show that the interaction of the
two treatments drives impacts, not training or the scorecard alone. Households that
received both the social accountability training and project quality information scorecard
interventions obtain an increase in their number of animals of 0.61, or approximately 27%
relative to the control group.19 This is a highly statistically significant effect of large
economic magnitude.
55.3 Potential mechanisms: impacts on community monitoring and reporting
During the project assessment survey, we measured the actions taken by communities to
monitor their projects. Table 10, column 1 presents the results for an index of how much
the broader community monitored the program, while column 2 presents the monitoring
activities of the local accountability group that is present in all communities. The broader
community does not report statistically significant changes in monitoring. However, for
the social accountability committee group, we find very large and significant increases in
the monitoring activities they conduct.
19 We also test for whether impacts are concentrated in communities that had the lowest scores (not shown) and do not find a relationship between the absolute score and the number of animals in households. The impact of the training and scorecard information appear to exist across the distribution of scores.

30
In columns 3 to 7 we explore the impacts on reporting of issues in the community
to officials at different levels of government. This measure comes from the household
survey conducted six months after the project assessment. The results show significant
increases in the number of reports at all levels of government. Reports to the lowest level
of government, LC1 and sub-county officials, increase by approximately 10%. Reports to
officials at a slightly higher level of local government, the district, increases by 14%. Most
strikingly, reporting to the central government through the IG increases by 59%. In
appendix Table A3 we find similar results when looking at the full list of project types
and only the social accountability training treatment.
We also look at reported issues during the procurement and contracting process
and the quality of interactions with bureaucrats in Tables A4 and A5 in the appendix. We
do not find statistically significant impacts on whether communities reported issues with
procurement or contracting, their satisfaction with suppliers, whether they hired a
contractor, or their satisfaction with the contractor. We also do not find impacts on
whether they made a payment to a district representative, their satisfaction with the local
NUSAF2 coordinator, or their satisfaction with the local veterinarian officer.
In Table 11 we explore several additional outcomes and potential mechanisms. In
columns 1 and 2 we test whether treatment affected individuals’ perceptions of the
performance of the project leaders. In columns 3 and 4 we ask about general satisfaction
with the quality of the project and management committee, respectively. We do not find
meaningful changes in any of these measures. In columns 5 and 6 we look at two measures
of the ability of communities to deliver public goods and find there does appear to be a
significant, though small, effect on whether people believe members of the community can
come together to solve issues in the community. In appendix Table A6 we look at the full
sample and only social accountability training treatment status. Here we find statistically
31
significant decreases in whether people report choosing the same project leadership,
increases in public goods provision, and an increase in the perception of being able to
make their community a better place to live. However, all of these effects are very small
relative to control group means. These results suggest that the social accountability
training and project information scorecard may have affected the ability of communities
to cooperate, but the effects are relatively small.
There are of course several other mechanisms that could have led to the outcomes
we observe. In particular, the trainings could have changed information asymmetries by
supporting communities in understanding better what was to be delivered to their
communities and how that was to be done. The trainings could have also led to changes
in bargaining power by communities. For instance, a local newspaper reported on the
arrest of a NUSAF2 official by the IG, instigated at the request of a treatment
community20.The trainings may have also had a social impact by increasing pressure on
participants to take better care of their animals. Overall, we see large and significant
effects on monitoring of projects and complaints to officials, though our data do not allow
us to rule out other mechanisms.
55.4 Impacts on trust in community leaders and government
We also analyze whether the program changed the way people view local and government
officials. In Table 12 we present the results from asking respondents whether they thought
their leaders acted in the interests of local communities21. In columns 1 to 6 we look at the
village leaders for the NUSAF2 program, the elected sub-county official, sub-county
20 http://www.monitor.co.ug/News/National/Nusaf-officials-arrested-over-theft-of-more-than-Shs4O0m/688334-2704288-j4ahwnz/index.html 21 The analysis presented in Tables A7 and A8 are for the entire sample. We also look at just livestock projects and find the same results.
32
bureaucrats, the elected district official, the district bureaucrats, and the central
government, respectively.
We do not find significant changes in how people perceive project leaders or the
sub-county and district elected and appointed officials. We do find a small but
statistically significant increase in trust in the central government. This effect is only a
2.5% increase over the control group. We find a similar result in appendix Table A7 on
the full sample, looking only at social accountability training treatment effects. We believe
this effect reflects the increased visibility of the IG, the agency from the central
government that managed the training delivered to these communities.
55.5 Heterogeneities by local levels of corruption
To determine which communities in our sample had the largest issues with corruption and
mismanagement, we conducted a survey of all local officials in the areas that would be
part of the study before the start of the experiment. As described above, we asked officials
to name the most corrupt or mismanaged sub-county in their district.22 We then count the
number of times a sub-county is listed and create an indicator of whether a given sub-
county is in the top most cited sub-counties. If a sub-country is mentioned more than
once we consider it to have high reported corruption. This is the case in 33% of the
sample sub-counties.
In Table 13 we present the results of dividing the sample by this indicator and
testing for the impacts on the number of cattle owned by individuals. The impact of the
treatments is concentrated entirely in communities in the sub-counties noted by local
officials as most corrupt or mismanaged. The social accountability training treatment
indicator is marginally not statistically significant, while the interaction between social
22 A district is composed of approximately five sub-counties.
33
accountability training and project information scorecard is significant at the less than 1%
level and very large. Households in areas that are reported more corrupt or mismanaged
that received both treatments have, on average, an additional 0.77 to 1.19 animals. This
is an increase of between 35% and 59% over the control group. This result suggests there
are substantial distributional effects from the interventions, and so there could be large
benefits from targeting such a program to areas that have the biggest issues with
corruption or mismanagement. We also test for differential mechanism effects (not
shown), which we presented in Tables 10 to 12, and find no difference in these outcomes
between areas of high or low reported corruption. We conclude that people made similar
levels of complaints in these areas, but they were most effective in the areas reported as
more corrupt.
While we do not observe a large difference in control means across the high and
low reported corruption groups in Table 13, we cannot rule out that this measure could
also be correlated with other community characteristics, including performance of local
government and overall poverty levels. We compare the results of the reporting of officials
and the scores in the scorecards and find a significant relationship between the two.
Communities in sub-counties that are most more likely to be corrupt have a lower
absolute score of 2.39 points, out of an average of 70.85, significant at the less than 1%
level. The results suggest that local officials likely have very useful information on the
level of corruption and mismanagement in their areas.
55.6 Spillovers
The randomization process for the selection of treatment communities was not stratified.
However, it led to natural variation in the number of treated communities within sub-
counties. We utilize this variation to look at the spillovers of treatment to control
34
communities. To do this, we focus on the treatment group that received both the training
and information treatments, and calculate the total number of treated communities by
sub-county, divided by the total number of projects in our sample. This indicator is our
intensity of treatment. Spillover effects could be positive if local officials feel pressure from
communities and so improve all of their operations. They could also be negative if officials
shift corruption or mismanagement from treatment to control communities.
We present the results in Table 14. The size and significance of the coefficient for
treatment is identical to that found in Table 9, column 5. The coefficient for the intensity
of treatment in a sub-county is large, but not significant. It appears that there are no
observable spillovers from the program on control communities.
However, within communities there could be spillovers from treatment on other
projects not related to the NUSAF2 projects. In Table 15 we recreate the analysis on
reporting of issues conducted in Table 10, columns 3 to 7, but for other community
projects that are not related to NUSAF2. Like the results for NUSAF2-related projects,
we find statistically significant and large effects on whether people report issues to local
leaders or central officials. Reports from individuals about making complaints to officials
at all levels about non-NUSAF2 projects (column 5) goes from 22% in the control group
to 32% in in the scorecard treatment – an increase of 34% – significant at the 3% level.
This effect is only in scorecard treatment communities. However, when looking at the full
sample of communities in appendix Table A8, we find significant effects from the
unconditional social accountability training treatment on all levels of reporting, although
the effect sizes relative to a control group are generally small.
We also look at heterogeneities by the region where the community is located and
distance from individual beneficiaries’ homes to the main sub-county office, as well as
beneficiary sex and education level for the full sample using the unconditional social
35
accountability training treatment. The results of these tests are presented in appendix
Table A10. Overall, we do not find significant variation in outcomes on the individual
characteristics, though there does appear to be some variation in outcomes across regions.
However, this variation is no longer significant when we interact the region and treatment
with the measure of local corruption. It appears that the quality of the sub-county
leadership matters more than the specific region a community is in.
66 Discussion
The impacts from the social accountability training and scorecard information treatments
on household welfare in communities that received livestock projects are quite large. We
estimate that there are over five additional cattle in communities that received both
treatments. Cattle are valued at approximately 800,000 USH, or about $230 each. The
program thus led to approximately $114 worth of additional animals per household, or
$1,140 per community. However, the cost of the program was significant, given the
geographic spread and relative intensity of the training. We estimate that the total cost of
the program, measured by the amount paid to the CSOs that ran the trainings, was
between $900 and $1,200 per community, depending on how costs are accounted23.
There are two points to keep in mind with this cost/benefit calculation. The first is
that we find small but potentially important impacts on attitudes toward the central
government, and potentially large impacts on other, non-NUSAF2-related programs being
implemented in communities. We are not able to monetize these additional impacts, but
we expect they are not trivial. The second point is about the potential distributional
effects, which we observed through heterogeneity by the local levels of corruption. The
23 These costs reflect the time spent developing the material; training of the CSO representatives; transport, materials, and drinks for participants during the trainings; and scorecard dissemination.
36
impacts we observe are concentrated in communities that were considered by local leaders
as more corrupt or mismanaged: the effects are up to four times larger than the estimated
average treatment effects. For communities that are particularly likely to be affected by
corruption or mismanagement, the combination of social accountability training and
information has especially large effects.
Overall, we present evidence that increasing engagement in poor communities can
produce higher returns from public investments. The social accountability training
combined with a project quality information scorecard intervention resulted in individuals
owning a significant number of additional animals. These effects appear to come from
increased monitoring by communities, as well as an increase in the reporting of issues to
officials from the local to the central government. We also find that the program led to
some modest improvements in people’s trust in the central government.
The results suggest a positive role and significant potential for programs that seek
to promote citizen engagement and increase local populations’ participation in the
development process. This approach is becoming popular, with similar interventions being
conducted in government programs in Liberia and Sierra Leone, as well as being expanded
considerably in Uganda. We show that this approach is feasible, impactful, and, under
some conditions, of good value. But it is clear that communities in this context need more
than training on how to identify and report issues alone, or simple information about their
project’s performance. Rather, it is necessary to combine these interventions, especially in
areas where citizen’s interactions with government are difficult or not the norm.
37
RReferences Aghion, P. and J. Tirole. 1997. Formal and real authority in organizations. Journal of Political Economy, 105(1):1–29. Baird, S., B. Ozler, C. Mcintosh. 2011. The regressive demands of demand-driven development, The World Bank. Banerjee, A., Green, D., Green, J. & Pande, R. 2010. Can voters be primed to choose better legislators? Experimental evidence from rural India. Banerjee, A., R. Hanna, J. Kyle, B. Olken and S. Sumarto (2018). Tangible information and citizen empowerment: identification cards and food subsidy programs in Indonesia. Journal of Political Economy 126(2). Barr, A. And D. Serra (2009). The effects of externalities and framing on bribery in a petty corruption experiment. Experimental Economics 12(4): 488-503. Barr, A. And A. Zeitlin. 2011. Conflict of interest as a barrier to local accountability. CSAE working paper, Oxford University. Bertrand, M., Djankov, S., Hanna, R. & Mullainathan, S. 2007. Obtaining a driver's license in India: An experimental approach to studying corruption. Quarterly Journal of Economics, 122, 1639-1676. Bhargava, V. E. 2006. Global Issues for Global Citizens: An Introduction to Key Development Challenges, Washington, D.C.: World Bank. Bjorkman, M. & Svensson, J. 2009. Power to the People: Evidence from a Randomized Field Experiment on Community-Based Monitoring in Uganda. Quarterly Journal of Economics, 124, 735-769. Bjorkman, M. & Svensson, J., 2010. When is community-based monitoring effective? Evidence from a randomized experiment in primary health in Uganda. Journal of the European Economic Association 8(2-3): 571-581. Bloom, N., Sadun, R., and Van Reenen, J. 2012. The organization of firms across countries. The Quarterly Journal of Economics, 127(4):1663–1705.
38
Dal Bo, E., F. Finan, N. Li and L. Schechter, 2018. Government Decentralization Under Changing State Capacity: Experimental Evidence from Paraguay. Working paper. de Rochambeau, G. 2017. Monitoring and intrinsic motivation: Evidence from Liberia’s trucking firms. Working paper. Deininger, K. And P. Mpuga, 2004. Does greater accountability improve the quality of delivery of public services? Evidence from Uganda. World Bank Policy Research Working Paper. 3277. Devarajan, S., S. Khemani, And M. Walton. (2011). Civil society, public action and accountability in Africa, The World Bank. Djankov, S., La Porta, R., Lopez-De-Silanes, F. & Shleifer, A. 2010. Disclosure by Politicians. American Economic Journal: Applied Economics, 2, 179-209. Ferraz, C. & Finan, F. 2008. Exposing Corrupt Politicians: The Effects of Brazil's Publicly Released Audits on Electoral Outcomes. The Quarterly Journal of Economics, 123, 703-745. Fisman, R And Gatti, R. 2002. Decentralization and corruption: evidence across countries, Journal of Public Economics. Fiszbein, A, D. Ringold And H. Rogers (2009). Making Services Work; Indicators, Assessments, and Benchmarking of the Quality and Governance of Public Service Delivery in the Human Development Sectors. Mimoe, The World Bank, Washington DC. Hunt, J. 2007. How Corruption Hits People When They Are Down. Journal of Development Economics, 84, 574-589. Hussam, R., Rigol, N., and Roth, B. 2017. Targeting high ability entrepreneurs using community information: Mechanism design in the field. Working paper. Koziol, M. And C. Tolmie (2010). Using Public Expenditure Tracking Surveys to Monitor Projects and Small-Scale Programs. Washington DC, World Bank.
39
Litschig, S. And Y. Zamboni (2011). Audit risk and rent extraction: Evidence from a randomized evaluation in Brazil, Department of Economics and Business, Universitat Pompeu Fabra. Molina, E., & Carella, L. & Pacheco, A & Cruces, G & Gasoarini, L. Community monitoring interventions to curb corruption and increase access and quality of service delivery in low- and middle-income countries: a systematic review. Campbell Collaboration, 2016. Mookherjee, D. 2006. Decentralization, hierarchies, and incentives: A mechanism design perspective. Journal of Economic Literature, 44(2):367–390. Nyquist, M. & De Waque, D. & Svensson, J. Experimental evidence on the long-run impact of community-based monitoring, American Economic Journal: Applied Economics 2017, 9(1): 33-69. Olken, B. & Pande, R. 2012. Corruption in Developing Countries. Annual Review of Economics, 4. Olken, B. A. 2006. Corruption and the costs of redistribution: Micro evidence from Indonesia. Journal of Public Economics, 90, 853-870. Peters, J., J. Langbein & G. Roberts 2018. Generalization in the Tropics – Development Policy, Randomized Controlled Trials, and External Validity. The World Bank Research Observer, 33: 34–64. Reinikka, R. & Svensson, J. 2004. "Local Capture: Evidence from a Central Government Transfer Program in Uganda. The Quarterly Journal of Economics, 119, 679-705. Reinikka, R. & Svensson, J. 2006. "Using Micro-Surveys to Measure and Explain Corruption." World Development 34(2): 359-370. Reinikka, R. & Svensson, J. 2011. "The power of information in public services: Evidence from education in Uganda." Journal of Public Economics 95(7-8): 956-966. Rose-Ackerman, S. 2004. Governance and Corruption. In: LOMBORG, B. (ed.) Global crises, global solutions. Cambridge; New York and Melbourne: Cambridge University Press.
40
Rubio, G. M. 2011. Measuring governance and service delivery in safety net programs, World Bank Social Protection Working Paper Series, Washing ton DC. Serra, D., 2009. "Combining Top-down and Bottom-up Accountability: Evidence from a Bribery Experiment", Centre for the Study of African Economies, University of Oxford. Van Stolk, C. And E. Tesliuc, 2010. Toolking on Tackling Error, Fraud and Corruption in Social Protection Programs. World Bank Social Protection Working Paper Series, Washing ton DC. Woo, J.-Y. 2010. The Impact of Corruption on a Country's FDI Attractiveness: A Panel Data Analysis, 1984-2004. Journal of International and Area Studies, 17, 71-91. World Bank, 2009. Implementation Completion And Results Report, for Northern Uganda Social Action Fund. World Bank, 2015, Uganda Systematic Country Diagnostic, Boosting Inclusive Growth and Accelerating Poverty Reduction. World Bank, Washington DC.
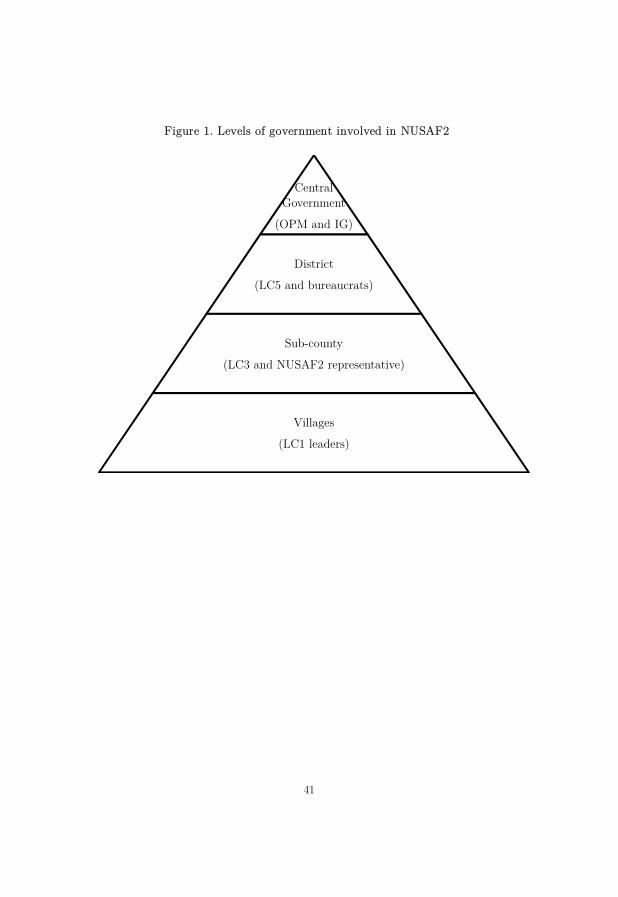
41
FFigure 1. Levels of government involved in NUSAF2
Central Government
(OPM and IG)
District
(LC5 and bureaucrats)
Sub-county
(LC3 and NUSAF2 representative)
Villages
(LC1 leaders)

42
FFigure 2. Example of community scorecard
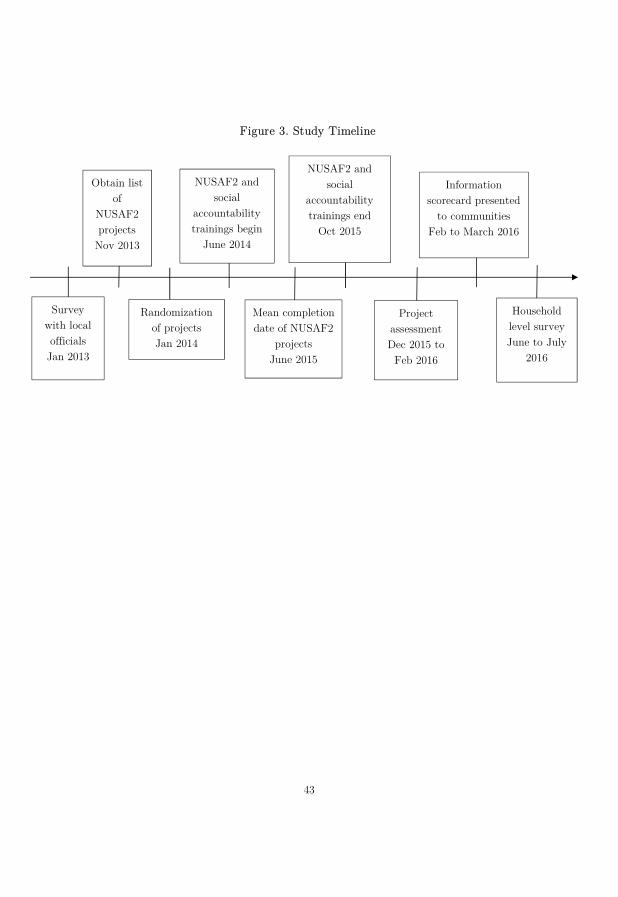
43
FFigure 3. Study Timeline
Survey with local officials Jan 2013
Obtain list of
NUSAF2 projects
Nov 2013
Randomization of projects Jan 2014
NUSAF2 and social
accountability trainings begin
June 2014
Mean completion date of NUSAF2
projects June 2015
Project assessment Dec 2015 to Feb 2016
NUSAF2 and social
accountability trainings end
Oct 2015
Information scorecard presented
to communities Feb to March 2016
Household level survey June to July
2016
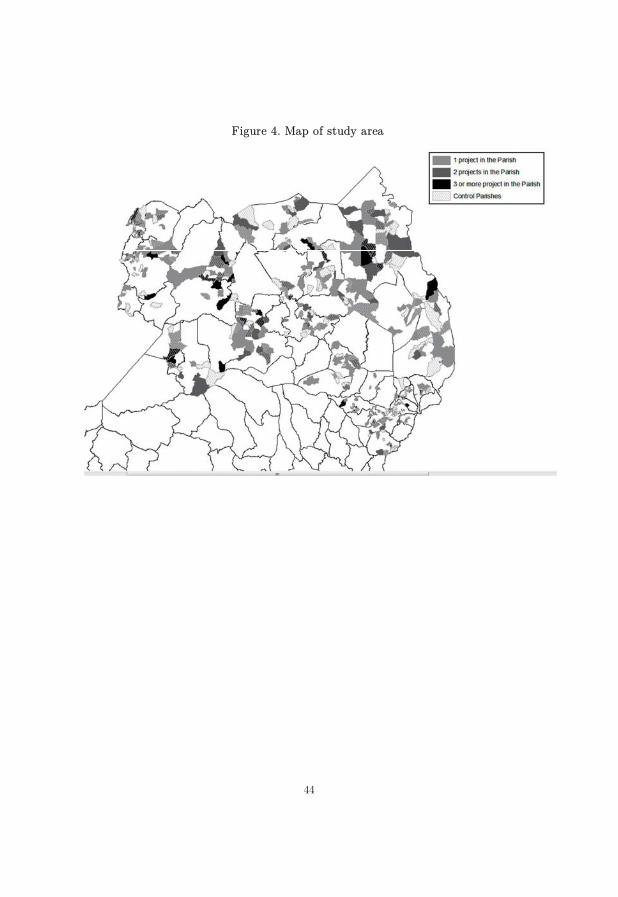
44
FFigure 4. Map of study area
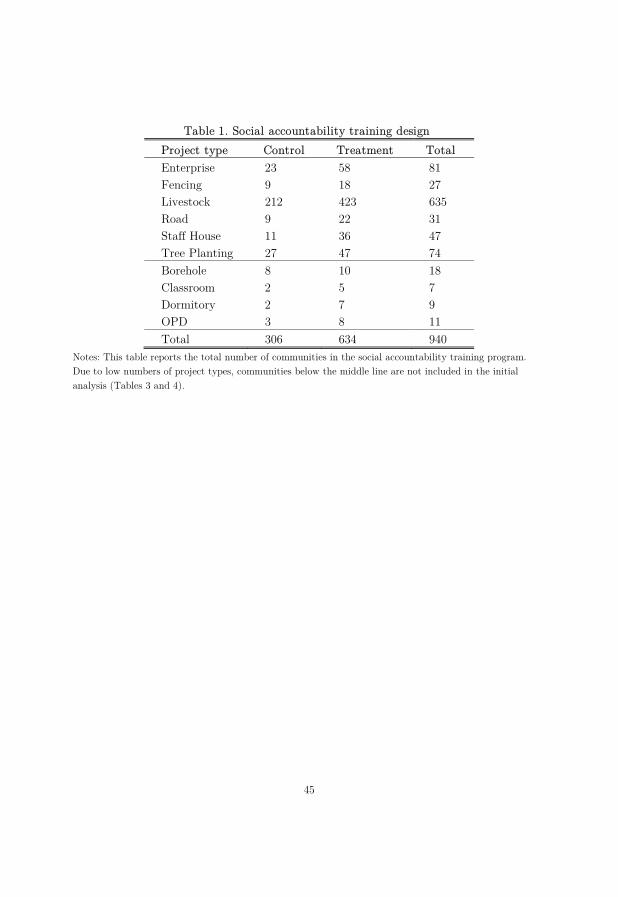
45
TTable 1. Social accountability training design Project type Control Treatment Total Enterprise 23 58 81 Fencing 9 18 27 Livestock 212 423 635 Road 9 22 31 Staff House 11 36 47 Tree Planting 27 47 74 Borehole 8 10 18 Classroom 2 5 7 Dormitory 2 7 9 OPD 3 8 11 Total 306 634 940
Notes: This table reports the total number of communities in the social accountability training program. Due to low numbers of project types, communities below the middle line are not included in the initial analysis (Tables 3 and 4).
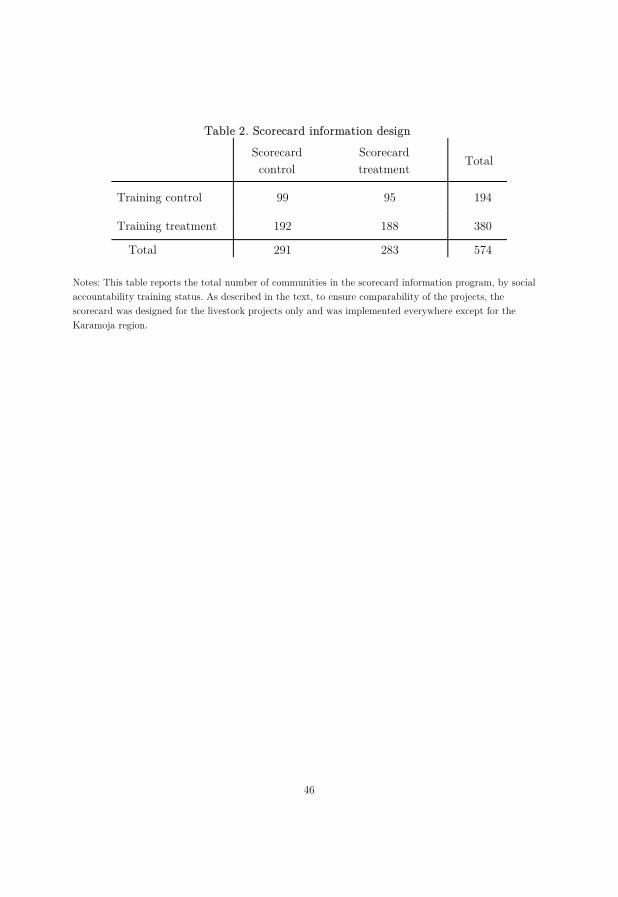
46
TTable 2. Scorecard information design
Scorecard control
Scorecard treatment Total
Training control 99 95 194
Training treatment 192 188 380
Total 291 283 574 Notes: This table reports the total number of communities in the scorecard information program, by social accountability training status. As described in the text, to ensure comparability of the projects, the scorecard was designed for the livestock projects only and was implemented everywhere except for the Karamoja region.
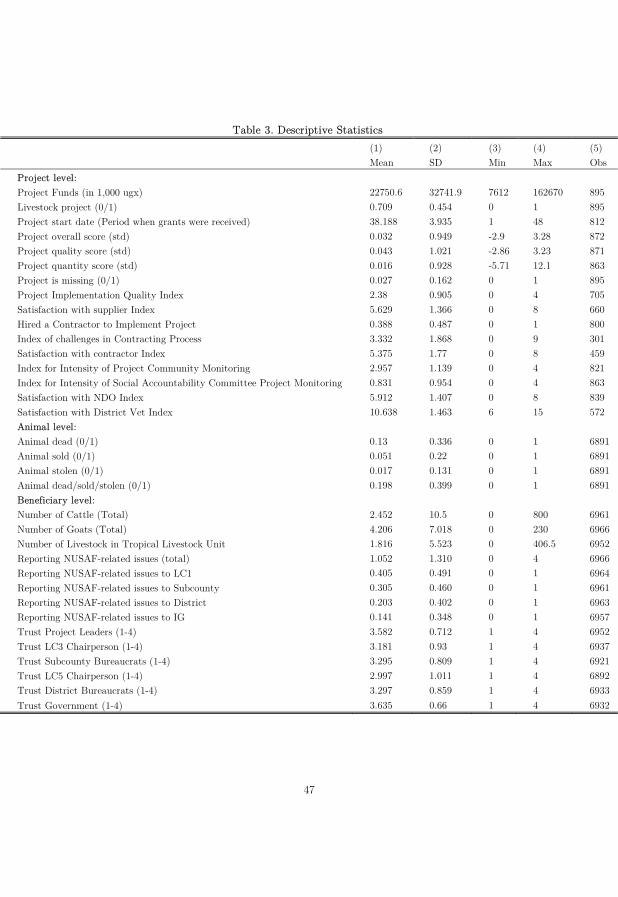
47
TTable 3. Descriptive Statistics
(1) (2) (3) (4) (5) Mean SD Min Max Obs Project level: Project Funds (in 1,000 ugx) 22750.6 32741.9 7612 162670 895 Livestock project (0/1) 0.709 0.454 0 1 895 Project start date (Period when grants were received) 38.188 3.935 1 48 812 Project overall score (std) 0.032 0.949 -2.9 3.28 872 Project quality score (std) 0.043 1.021 -2.86 3.23 871 Project quantity score (std) 0.016 0.928 -5.71 12.1 863 Project is missing (0/1) 0.027 0.162 0 1 895 Project Implementation Quality Index 2.38 0.905 0 4 705 Satisfaction with supplier Index 5.629 1.366 0 8 660 Hired a Contractor to Implement Project 0.388 0.487 0 1 800 Index of challenges in Contracting Process 3.332 1.868 0 9 301 Satisfaction with contractor Index 5.375 1.77 0 8 459 Index for Intensity of Project Community Monitoring 2.957 1.139 0 4 821 Index for Intensity of Social Accountability Committee Project Monitoring 0.831 0.954 0 4 863 Satisfaction with NDO Index 5.912 1.407 0 8 839 Satisfaction with District Vet Index 10.638 1.463 6 15 572 Animal level:
Animal dead (0/1) 0.13 0.336 0 1 6891 Animal sold (0/1) 0.051 0.22 0 1 6891 Animal stolen (0/1) 0.017 0.131 0 1 6891 Animal dead/sold/stolen (0/1) 0.198 0.399 0 1 6891 Beneficiary level:
Number of Cattle (Total) 2.452 10.5 0 800 6961 Number of Goats (Total) 4.206 7.018 0 230 6966 Number of Livestock in Tropical Livestock Unit 1.816 5.523 0 406.5 6952 Reporting NUSAF-related issues (total) 1.052 1.310 0 4 6966 Reporting NUSAF-related issues to LC1 0.405 0.491 0 1 6964 Reporting NUSAF-related issues to Subcounty 0.305 0.460 0 1 6961 Reporting NUSAF-related issues to District 0.203 0.402 0 1 6963 Reporting NUSAF-related issues to IG 0.141 0.348 0 1 6957 Trust Project Leaders (1-4) 3.582 0.712 1 4 6952 Trust LC3 Chairperson (1-4) 3.181 0.93 1 4 6937 Trust Subcounty Bureaucrats (1-4) 3.295 0.809 1 4 6921 Trust LC5 Chairperson (1-4) 2.997 1.011 1 4 6892 Trust District Bureaucrats (1-4) 3.297 0.859 1 4 6933 Trust Government (1-4) 3.635 0.66 1 4 6932
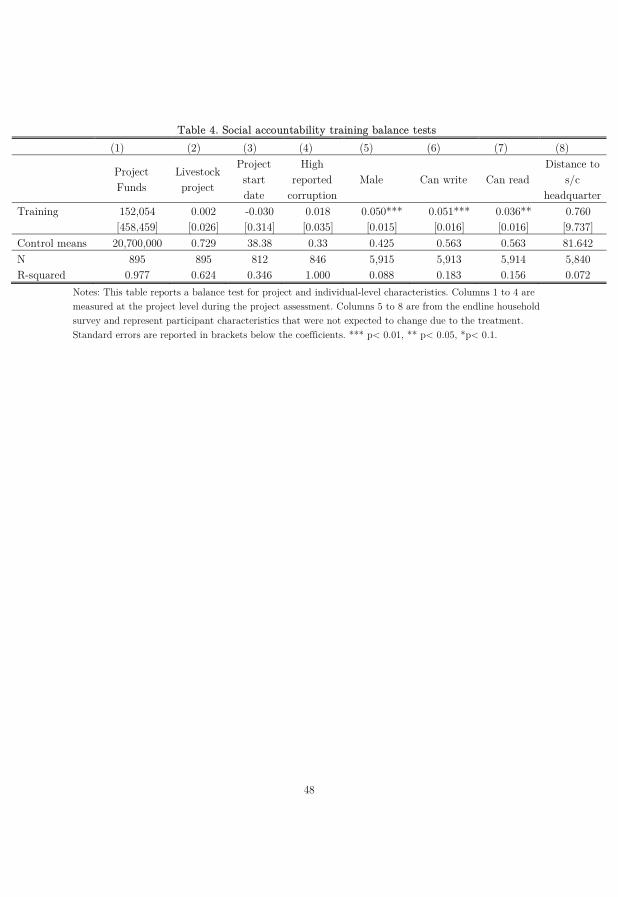
48
TTable 4. Social accountability training balance tests (1) (2) (3) (4) (5) (6) (7) (8)
Project Funds
Livestock project
Project start date
High reported
corruption Male Can write Can read
Distance to s/c
headquarter Training 152,054 0.002 -0.030 0.018 0.050*** 0.051*** 0.036** 0.760
[458,459] [0.026] [0.314] [0.035] [0.015] [0.016] [0.016] [9.737] Control means 20,700,000 0.729 38.38 0.33 0.425 0.563 0.563 81.642 N 895 895 812 846 5,915 5,913 5,914 5,840 R-squared 0.977 0.624 0.346 1.000 0.088 0.183 0.156 0.072
Notes: This table reports a balance test for project and individual-level characteristics. Columns 1 to 4 are measured at the project level during the project assessment. Columns 5 to 8 are from the endline household survey and represent participant characteristics that were not expected to change due to the treatment. Standard errors are reported in brackets below the coefficients. *** p< 0.01, ** p< 0.05, *p< 0.1.
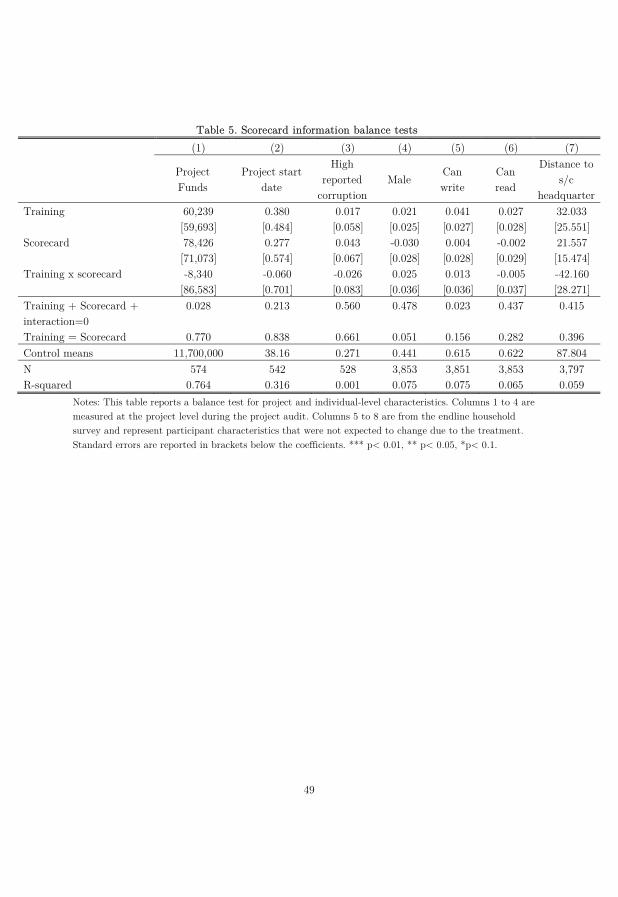
49
TTable 5. Scorecard information balance tests (1) (2) (3) (4) (5) (6) (7)
Project Funds
Project start date
High reported
corruption Male
Can write
Can read
Distance to s/c
headquarter Training 60,239 0.380 0.017 0.021 0.041 0.027 32.033
[59,693] [0.484] [0.058] [0.025] [0.027] [0.028] [25.551] Scorecard 78,426 0.277 0.043 -0.030 0.004 -0.002 21.557
[71,073] [0.574] [0.067] [0.028] [0.028] [0.029] [15.474] Training x scorecard -8,340 -0.060 -0.026 0.025 0.013 -0.005 -42.160
[86,583] [0.701] [0.083] [0.036] [0.036] [0.037] [28.271] Training + Scorecard + interaction=0
0.028 0.213 0.560 0.478 0.023 0.437 0.415
Training = Scorecard 0.770 0.838 0.661 0.051 0.156 0.282 0.396 Control means 11,700,000 38.16 0.271 0.441 0.615 0.622 87.804 N 574 542 528 3,853 3,851 3,853 3,797 R-squared 0.764 0.316 0.001 0.075 0.075 0.065 0.059
Notes: This table reports a balance test for project and individual-level characteristics. Columns 1 to 4 are measured at the project level during the project audit. Columns 5 to 8 are from the endline household survey and represent participant characteristics that were not expected to change due to the treatment. Standard errors are reported in brackets below the coefficients. *** p< 0.01, ** p< 0.05, *p< 0.1.
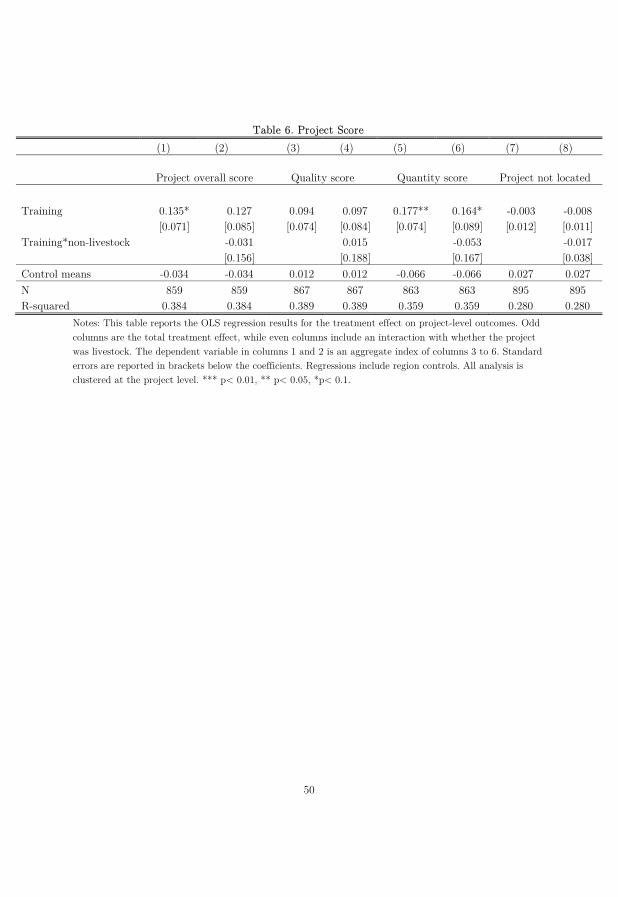
50
TTable 6. Project Score (1) (2) (3) (4) (5) (6) (7) (8)
Project overall score Quality score Quantity score Project not located
Training 0.135* 0.127 0.094 0.097 0.177** 0.164* -0.003 -0.008 [0.071] [0.085] [0.074] [0.084] [0.074] [0.089] [0.012] [0.011]
Training*non-livestock
-0.031
0.015
-0.053
-0.017
[0.156]
[0.188]
[0.167]
[0.038]
Control means -0.034 -0.034 0.012 0.012 -0.066 -0.066 0.027 0.027 N 859 859 867 867 863 863 895 895 R-squared 0.384 0.384 0.389 0.389 0.359 0.359 0.280 0.280
Notes: This table reports the OLS regression results for the treatment effect on project-level outcomes. Odd columns are the total treatment effect, while even columns include an interaction with whether the project was livestock. The dependent variable in columns 1 and 2 is an aggregate index of columns 3 to 6. Standard errors are reported in brackets below the coefficients. Regressions include region controls. All analysis is clustered at the project level. *** p< 0.01, ** p< 0.05, *p< 0.1.
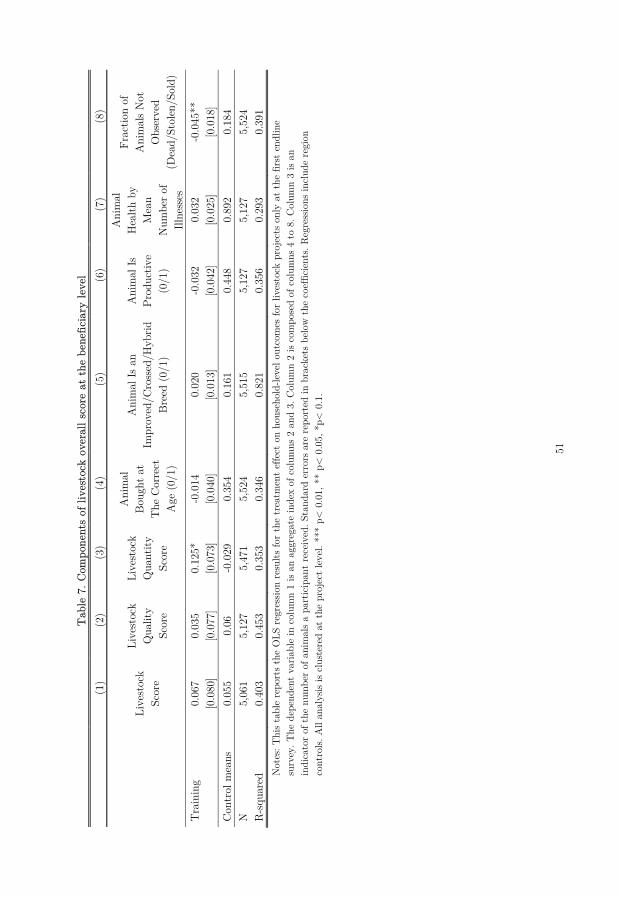
51
T Tab
le 7
. Com
pone
nts
of li
vest
ock
over
all s
core
at
the
bene
ficia
ry le
vel
(1
) (2
) (3
) (4
) (5
) (6
) (7
) (8
)
Li
vest
ock
Scor
e
Live
stoc
k Q
ualit
y Sc
ore
Live
stoc
k Q
uant
ity
Scor
e
Ani
mal
Bo
ught
at
The
Cor
rect
A
ge (0
/1)
Ani
mal
Is a
n Im
prov
ed/C
ross
ed/H
ybrid
Br
eed
(0/1
)
Ani
mal
Is
Prod
uctiv
e (0
/1)
Ani
mal
H
ealth
by
Mea
n N
umbe
r of
Illne
sses
Frac
tion
of
Ani
mal
s N
ot
Obs
erve
d (D
ead/
Stol
en/S
old)
Tra
inin
g
0.06
7 0.
035
0.12
5*
-0.0
14
0.02
0 -0
.032
0.
032
-0.0
45**
[0.0
80]
[0.0
77]
[0.0
73]
[0.0
40]
[0.0
13]
[0.0
42]
[0.0
25]
[0.0
18]
Con
trol
mea
ns
0.05
5 0.
06
-0.0
29
0.35
4 0.
161
0.44
8 0.
892
0.18
4 N
5,
061
5,12
7 5,
471
5,52
4 5,
515
5,12
7 5,
127
5,52
4 R
-squ
ared
0.
403
0.45
3 0.
353
0.34
6 0.
821
0.35
6 0.
293
0.39
1 N
otes
: Thi
s ta
ble
repo
rts
the
OLS
reg
ress
ion
resu
lts fo
r th
e tr
eatm
ent
effe
ct o
n ho
useh
old-
leve
l out
com
es fo
r liv
esto
ck p
roje
cts
only
at
the
first
end
line
surv
ey. T
he d
epen
dent
var
iabl
e in
col
umn
1 is
an a
ggre
gate
inde
x of
col
umns
2 a
nd 3
. Col
umn
2 is
com
pose
d of
col
umns
4 t
o 8.
Col
umn
3 is
an
indi
cato
r of
the
num
ber
of a
nim
als
a pa
rtic
ipan
t re
ceiv
ed. S
tand
ard
erro
rs a
re r
epor
ted
in b
rack
ets
belo
w th
e co
effic
ient
s. R
egre
ssio
ns in
clud
e re
gion
co
ntro
ls. A
ll an
alys
is is
clus
tere
d at
the
pro
ject
leve
l. **
* p<
0.0
1, *
* p<
0.0
5, *
p< 0
.1.
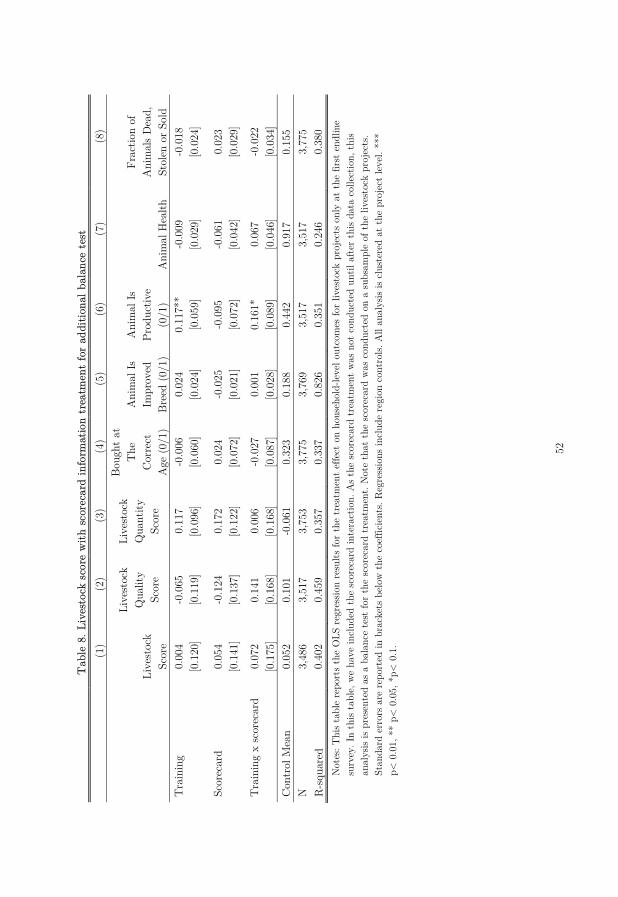
52
T Tab
le 8
. Liv
esto
ck s
core
with
sco
reca
rd in
form
atio
n tr
eatm
ent
for
addi
tiona
l bal
ance
tes
t
(1)
(2)
(3)
(4)
(5)
(6)
(7)
(8)
Li
vest
ock
Scor
e
Live
stoc
k Q
ualit
y Sc
ore
Live
stoc
k Q
uant
ity
Scor
e
Boug
ht a
t T
he
Cor
rect
A
ge (0
/1)
Ani
mal
Is
Impr
oved
Br
eed
(0/1
)
Ani
mal
Is
Prod
uctiv
e (0
/1)
Ani
mal
Hea
lth
Frac
tion
of
Ani
mal
s D
ead,
St
olen
or
Sold
T
rain
ing
0.00
4 -0
.065
0.
117
-0.0
06
0.02
4 0.
117*
* -0
.009
-0
.018
[0
.120
] [0
.119
] [0
.096
] [0
.060
] [0
.024
] [0
.059
] [0
.029
] [0
.024
]
Scor
ecar
d 0.
054
-0.1
24
0.17
2 0.
024
-0.0
25
-0.0
95
-0.0
61
0.02
3
[0
.141
] [0
.137
] [0
.122
] [0
.072
] [0
.021
] [0
.072
] [0
.042
] [0
.029
]
Tra
inin
g x
scor
ecar
d 0.
072
0.14
1 0.
006
-0.0
27
0.00
1 0.
161*
0.
067
-0.0
22
[0
.175
] [0
.168
] [0
.168
] [0
.087
] [0
.028
] [0
.089
] [0
.046
] [0
.034
] C
ontr
ol M
ean
0.05
2 0.
101
-0.0
61
0.32
3 0.
188
0.44
2 0.
917
0.15
5 N
3,
486
3,51
7 3,
753
3,77
5 3,
769
3,51
7 3,
517
3,77
5 R
-squ
ared
0.
402
0.45
9 0.
357
0.33
7 0.
826
0.35
1 0.
246
0.38
0 N
otes
: Thi
s ta
ble
repo
rts
the
OLS
reg
ress
ion
resu
lts fo
r th
e tr
eatm
ent
effe
ct o
n ho
useh
old-
leve
l out
com
es fo
r liv
esto
ck p
roje
cts
only
at
the
first
end
line
surv
ey. I
n th
is ta
ble,
we
have
incl
uded
the
sco
reca
rd in
tera
ctio
n. A
s th
e sc
orec
ard
trea
tmen
t w
as n
ot c
ondu
cted
unt
il af
ter
this
data
col
lect
ion,
thi
s an
alys
is is
pres
ente
d as
a b
alan
ce te
st fo
r th
e sc
orec
ard
trea
tmen
t. N
ote
that
the
sco
reca
rd w
as c
ondu
cted
on
a su
bsam
ple
of t
he li
vest
ock
proj
ects
. St
anda
rd e
rror
s ar
e re
port
ed in
bra
cket
s be
low
the
coe
ffici
ents
. Reg
ress
ions
incl
ude
regi
on c
ontr
ols.
All
anal
ysis
is cl
uste
red
at t
he p
roje
ct le
vel.
***
p< 0
.01,
**
p< 0
.05,
*p<
0.1
.
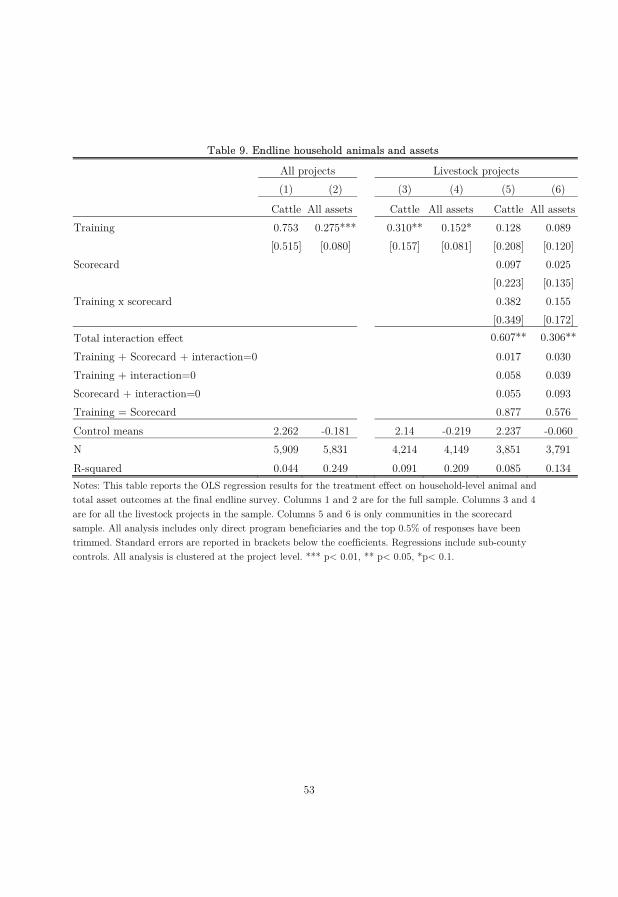
53
TTable 9. Endline household animals and assets
All projects Livestock projects
(1) (2) (3) (4) (5) (6)
Cattle All assets Cattle All assets Cattle All assets Training 0.753 0.275*** 0.310** 0.152* 0.128 0.089
[0.515] [0.080] [0.157] [0.081] [0.208] [0.120] Scorecard 0.097 0.025
[0.223] [0.135] Training x scorecard 0.382 0.155
[0.349] [0.172] Total interaction effect 0.607** 0.306** Training + Scorecard + interaction=0 0.017 0.030 Training + interaction=0 0.058 0.039 Scorecard + interaction=0 0.055 0.093 Training = Scorecard 0.877 0.576 Control means 2.262 -0.181 2.14 -0.219 2.237 -0.060 N 5,909 5,831 4,214 4,149 3,851 3,791 R-squared 0.044 0.249 0.091 0.209 0.085 0.134 Notes: This table reports the OLS regression results for the treatment effect on household-level animal and total asset outcomes at the final endline survey. Columns 1 and 2 are for the full sample. Columns 3 and 4 are for all the livestock projects in the sample. Columns 5 and 6 is only communities in the scorecard sample. All analysis includes only direct program beneficiaries and the top 0.5% of responses have been trimmed. Standard errors are reported in brackets below the coefficients. Regressions include sub-county controls. All analysis is clustered at the project level. *** p< 0.01, ** p< 0.05, *p< 0.1.
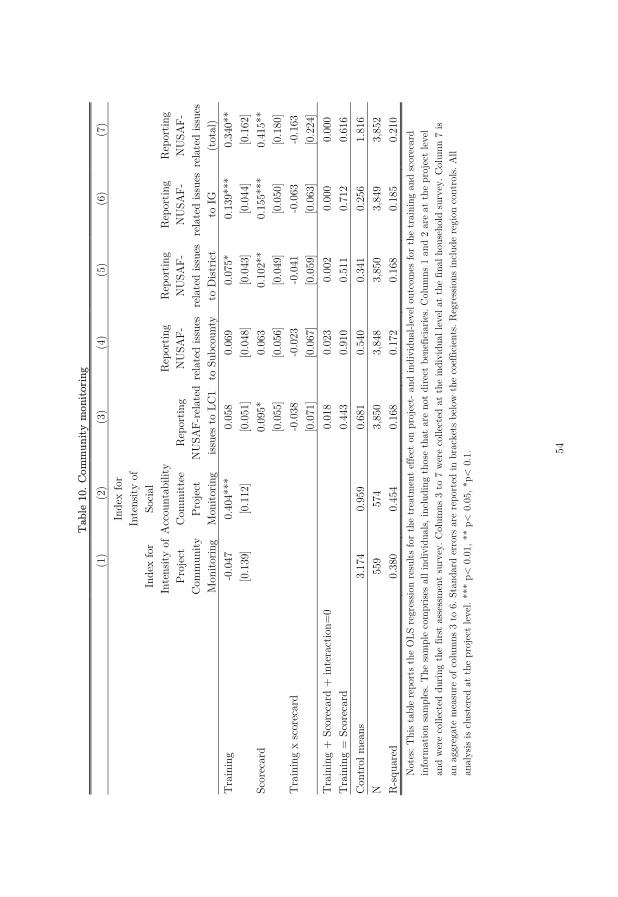
54
T Tab
le 1
0. C
omm
unity
mon
itorin
g
(1)
(2)
(3)
(4)
(5)
(6)
(7)
Inde
x fo
r In
tens
ity o
f Pr
ojec
t C
omm
unity
M
onito
ring
Inde
x fo
r In
tens
ity o
f So
cial
A
ccou
ntab
ility
C
omm
ittee
Pr
ojec
t M
onito
ring
Rep
ortin
g N
USA
F-re
late
d iss
ues
to L
C1
Rep
ortin
g N
USA
F-re
late
d iss
ues
to S
ubco
unty
Rep
ortin
g N
USA
F-re
late
d iss
ues
to D
istric
t
Rep
ortin
g N
USA
F-re
late
d iss
ues
to IG
Rep
ortin
g N
USA
F-re
late
d iss
ues
(tot
al)
Tra
inin
g
-0.0
47
0.40
4***
0.
058
0.06
9 0.
075*
0.
139*
**
0.34
0**
[0
.139
] [0
.112
] [0
.051
] [0
.048
] [0
.043
] [0
.044
] [0
.162
] Sc
orec
ard
0.
095*
0.
063
0.10
2**
0.15
5***
0.
415*
*
[0.0
55]
[0.0
56]
[0.0
49]
[0.0
50]
[0.1
80]
Tra
inin
g x
scor
ecar
d
-0
.038
-0
.023
-0
.041
-0
.063
-0
.163
[0.0
71]
[0.0
67]
[0.0
59]
[0.0
63]
[0.2
24]
Tra
inin
g +
Sco
reca
rd +
inte
ract
ion=
0
0.
018
0.02
3 0.
002
0.00
0 0.
000
Tra
inin
g =
Sco
reca
rd
0.44
3 0.
910
0.51
1 0.
712
0.61
6 C
ontr
ol m
eans
3.
174
0.95
9 0.
681
0.54
0 0.
341
0.25
6 1.
816
N
559
574
3,85
0 3,
848
3,85
0 3,
849
3,85
2 R
-squ
ared
0.
380
0.45
4 0.
168
0.17
2 0.
168
0.18
5 0.
210
Not
es: T
his
tabl
e re
port
s th
e O
LS r
egre
ssio
n re
sults
for
the
trea
tmen
t ef
fect
on
proj
ect-
and
indi
vidu
al-le
vel o
utco
mes
for
the
trai
ning
and
sco
reca
rd
info
rmat
ion
sam
ples
. The
sam
ple
com
prise
s al
l ind
ivid
uals,
incl
udin
g th
ose
that
are
not
dire
ct b
enef
icia
ries.
Col
umns
1 a
nd 2
are
at
the
proj
ect l
evel
an
d w
ere
colle
cted
dur
ing
the
first
ass
essm
ent
surv
ey. C
olum
ns 3
to
7 w
ere
colle
cted
at
the
indi
vidu
al le
vel a
t th
e fin
al h
ouse
hold
sur
vey.
Col
umn
7 is
an a
ggre
gate
mea
sure
of c
olum
ns 3
to
6. S
tand
ard
erro
rs a
re r
epor
ted
in b
rack
ets
belo
w t
he c
oeffi
cien
ts. R
egre
ssio
ns in
clud
e re
gion
con
trol
s. A
ll an
alys
is is
clus
tere
d at
the
pro
ject
leve
l. **
* p<
0.0
1, *
* p<
0.0
5, *
p< 0
.1.
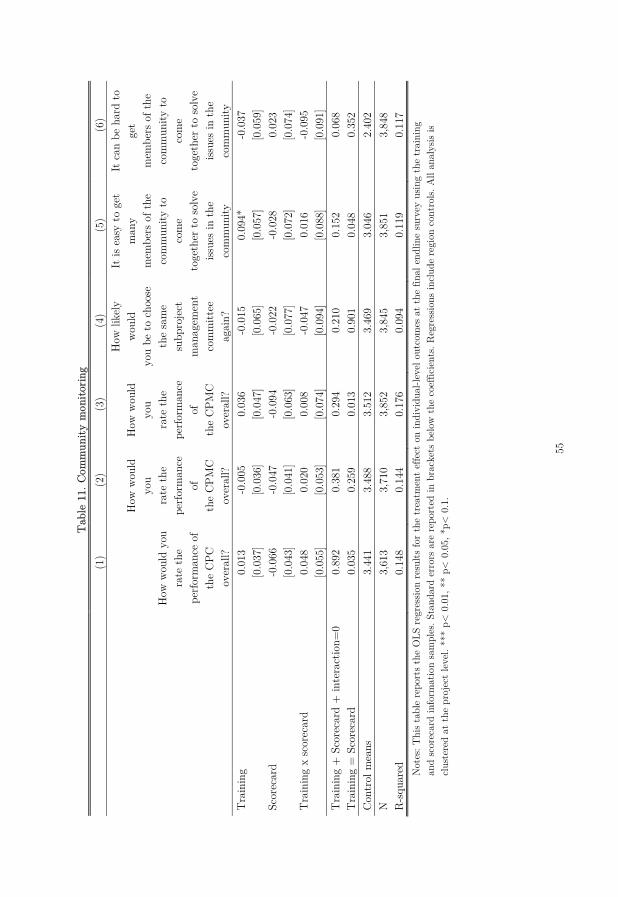
55
T Tab
le 1
1. C
omm
unity
mon
itorin
g
(1)
(2)
(3)
(4)
(5)
(6)
How
wou
ld y
ou
rate
the
perfo
rman
ce o
f th
e C
PC
over
all?
How
wou
ld
you
rate
the
perfo
rman
ce
of
the
CPM
C ov
eral
l?
How
wou
ld
you
rate
the
perfo
rman
ce
of
the
CPM
C ov
eral
l?
How
like
ly
wou
ld
you
be to
cho
ose
the
sam
e su
bpro
ject
m
anag
emen
t co
mm
ittee
ag
ain?
It is
eas
y to
get
m
any
mem
bers
of t
he
com
mun
ity to
co
me
toge
ther
to so
lve
issue
s in
the
co
mm
unity
It c
an b
e ha
rd to
ge
t m
embe
rs o
f the
co
mm
unity
to
com
e to
geth
er to
solv
e iss
ues
in t
he
com
mun
ity
Tra
inin
g
0.01
3 -0
.005
0.
036
-0.0
15
0.09
4*
-0.0
37
[0
.037
] [0
.036
] [0
.047
] [0
.065
] [0
.057
] [0
.059
] Sc
orec
ard
-0
.066
-0
.047
-0
.094
-0
.022
-0
.028
0.
023
[0
.043
] [0
.041
] [0
.063
] [0
.077
] [0
.072
] [0
.074
] T
rain
ing
x sc
orec
ard
0.04
8 0.
020
0.00
8 -0
.047
0.
016
-0.0
95
[0
.055
] [0
.053
] [0
.074
] [0
.094
] [0
.088
] [0
.091
] T
rain
ing
+ S
core
card
+ in
tera
ctio
n=0
0.89
2 0.
381
0.29
4 0.
210
0.15
2 0.
068
Tra
inin
g =
Sco
reca
rd
0.03
5 0.
259
0.01
3 0.
901
0.04
8 0.
352
Con
trol
mea
ns
3.44
1 3.
488
3.51
2 3.
469
3.04
6 2.
402
N
3,61
3 3,
710
3,85
2 3,
845
3,85
1 3,
848
R-s
quar
ed
0.14
8 0.
144
0.17
6 0.
094
0.11
9 0.
117
Not
es: T
his
tabl
e re
port
s th
e O
LS r
egre
ssio
n re
sults
for
the
trea
tmen
t ef
fect
on
indi
vidu
al-le
vel o
utco
mes
at
the
final
end
line
surv
ey u
sing
the
trai
ning
an
d sc
orec
ard
info
rmat
ion
sam
ples
. Sta
ndar
d er
rors
are
rep
orte
d in
bra
cket
s be
low
the
coe
ffici
ents
. Reg
ress
ions
incl
ude
regi
on c
ontr
ols.
All
anal
ysis
is cl
uste
red
at t
he p
roje
ct le
vel.
***
p< 0
.01,
**
p< 0
.05,
*p<
0.1
.
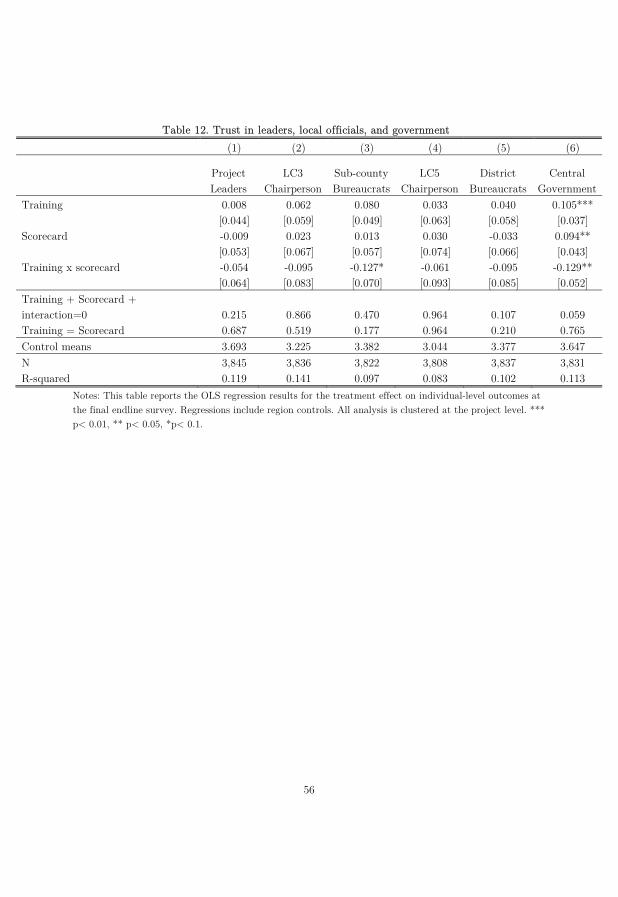
56
TTable 12. Trust in leaders, local officials, and government (1) (2) (3) (4) (5) (6)
Project Leaders
LC3 Chairperson
Sub-county Bureaucrats
LC5 Chairperson
District Bureaucrats
Central Government
Training 0.008 0.062 0.080 0.033 0.040 0.105*** [0.044] [0.059] [0.049] [0.063] [0.058] [0.037]
Scorecard -0.009 0.023 0.013 0.030 -0.033 0.094** [0.053] [0.067] [0.057] [0.074] [0.066] [0.043]
Training x scorecard -0.054 -0.095 -0.127* -0.061 -0.095 -0.129** [0.064] [0.083] [0.070] [0.093] [0.085] [0.052]
Training + Scorecard + interaction=0 0.215 0.866 0.470 0.964 0.107 0.059 Training = Scorecard 0.687 0.519 0.177 0.964 0.210 0.765 Control means 3.693 3.225 3.382 3.044 3.377 3.647 N 3,845 3,836 3,822 3,808 3,837 3,831 R-squared 0.119 0.141 0.097 0.083 0.102 0.113
Notes: This table reports the OLS regression results for the treatment effect on individual-level outcomes at the final endline survey. Regressions include region controls. All analysis is clustered at the project level. *** p< 0.01, ** p< 0.05, *p< 0.1.
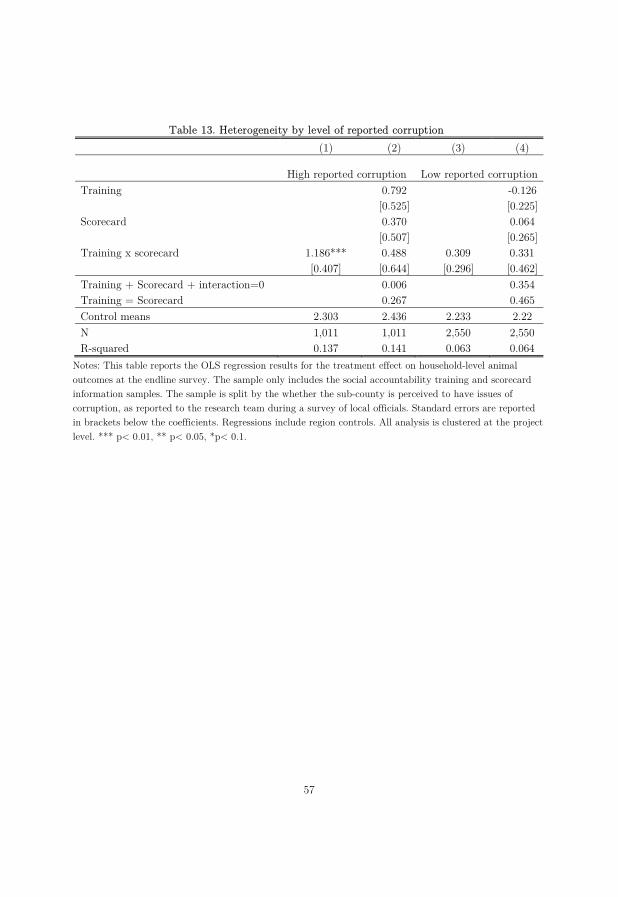
57
TTable 13. Heterogeneity by level of reported corruption (1) (2) (3) (4)
High reported corruption Low reported corruption Training 0.792 -0.126 [0.525] [0.225] Scorecard 0.370 0.064
[0.507] [0.265] Training x scorecard 1.186*** 0.488 0.309 0.331
[0.407] [0.644] [0.296] [0.462] Training + Scorecard + interaction=0 0.006 0.354 Training = Scorecard 0.267 0.465 Control means 2.303 2.436 2.233 2.22 N 1,011 1,011 2,550 2,550 R-squared 0.137 0.141 0.063 0.064
Notes: This table reports the OLS regression results for the treatment effect on household-level animal outcomes at the endline survey. The sample only includes the social accountability training and scorecard information samples. The sample is split by the whether the sub-county is perceived to have issues of corruption, as reported to the research team during a survey of local officials. Standard errors are reported in brackets below the coefficients. Regressions include region controls. All analysis is clustered at the project level. *** p< 0.01, ** p< 0.05, *p< 0.1.
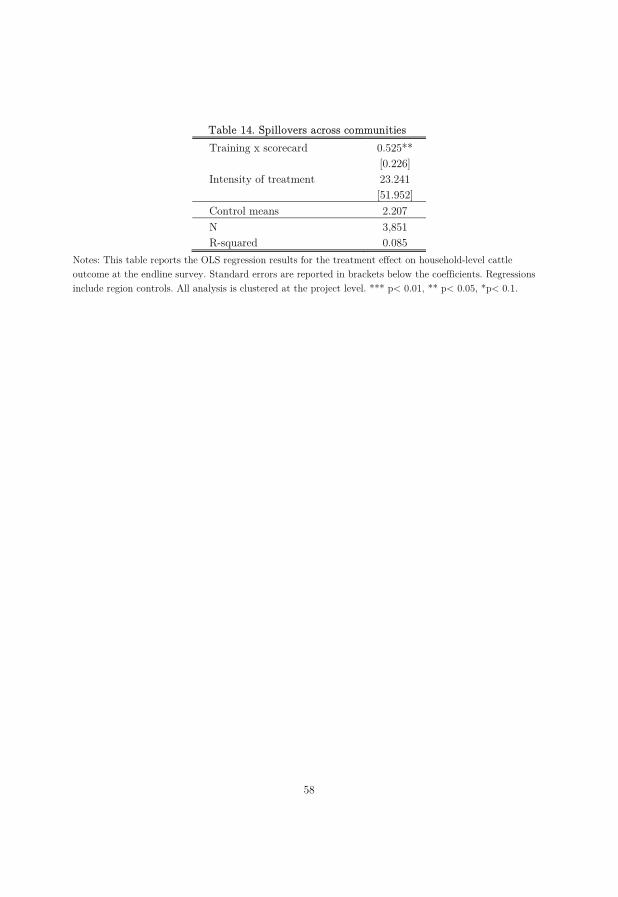
58
TTable 14. Spillovers across communities Training x scorecard 0.525** [0.226] Intensity of treatment 23.241 [51.952] Control means 2.207 N 3,851 R-squared 0.085
Notes: This table reports the OLS regression results for the treatment effect on household-level cattle outcome at the endline survey. Standard errors are reported in brackets below the coefficients. Regressions include region controls. All analysis is clustered at the project level. *** p< 0.01, ** p< 0.05, *p< 0.1.
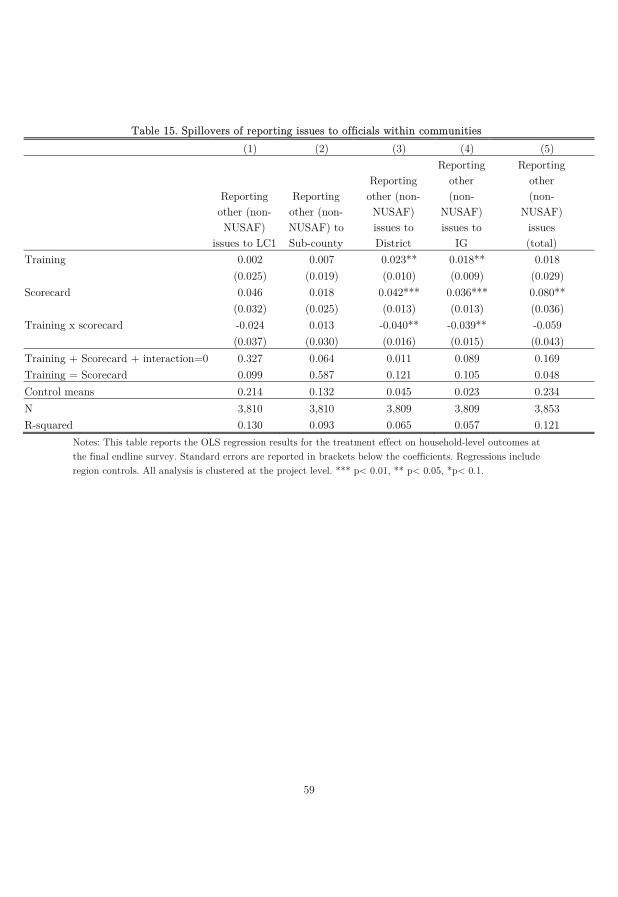
59
TTable 15. Spillovers of reporting issues to officials within communities (1) (2) (3) (4) (5)
Reporting other (non- NUSAF)
issues to LC1
Reporting other (non- NUSAF) to Sub-county
Reporting other (non- NUSAF) issues to District
Reporting other (non-
NUSAF) issues to
IG
Reporting other (non-
NUSAF) issues (total)
Training 0.002 0.007 0.023** 0.018** 0.018
(0.025) (0.019) (0.010) (0.009) (0.029) Scorecard 0.046 0.018 0.042*** 0.036*** 0.080**
(0.032) (0.025) (0.013) (0.013) (0.036) Training x scorecard -0.024 0.013 -0.040** -0.039** -0.059
(0.037) (0.030) (0.016) (0.015) (0.043) Training + Scorecard + interaction=0 0.327 0.064 0.011 0.089 0.169 Training = Scorecard 0.099 0.587 0.121 0.105 0.048 Control means 0.214 0.132 0.045 0.023 0.234 N 3,810 3,810 3,809 3,809 3,853 R-squared 0.130 0.093 0.065 0.057 0.121
Notes: This table reports the OLS regression results for the treatment effect on household-level outcomes at the final endline survey. Standard errors are reported in brackets below the coefficients. Regressions include region controls. All analysis is clustered at the project level. *** p< 0.01, ** p< 0.05, *p< 0.1.
60
AAppendix
A. Curriculum components The Social Accountability and Community Monitoring training curriculum was developed to be delivered to low-skilled populations, with intensive piloting and heavy focus on visual-based learning. The 7 main modules of the curriculum were as follows.
Module 1: Community Mobilization and Introduction to Social Accountability This module includes 2 to 3 hours of interaction with mobilized members of the community within which a selected NUSAF2 sub project is implemented. In the meeting, the community trainer leads the discussion on key concepts of accountability and community engagement, the roles and responsibilities of the Social Accountability Committee (SAC) and conducts the election of 4 willing members of the community to strengthen the existing SAC and form the Community Monitoring Group (CMG).
Part of the discussion include an overview of NUSAF2 and identifying existing government programs, targeted beneficiaries and why it is important for the wider community members to monitor these projects even if they are not direct beneficiaries.
Discussions on key concepts of accountability includes: a) common types of corruption at the central, local government and community levels such as bribery, embezzlement, nepotism, absenteeism and solicitation of favors; b) social accountability and the constitutional right of every Ugandan to participate in conducting accountability and combating corruption. This session is concluded with brainstorming on key actions the community can take as individuals or group to conduct social accountability, combat corruption and thus improve project outcomes.
The module ends with the election and introduction of the CMG. Preceding the election, community members are taken through the roles of the monitoring group and characteristics of people who would be suitable for this role. Both the SAC chairman and coordinator of the newly formed CMG are given an opportunity to give short speeches on how they will execute their duties to meet the expectations of the community. The CMG members are then invited for a 3 days training at a selected venue and date.
Module 2: Social Accountability and NUSAF2 The second module is delivered on the first day of the 3 days’ comprehensive training. It reviews into detail all the basic concepts discussed at the enrollment meeting as well as provides a deeper understanding of the different stages of implementation of the NUSAF2 sub project and the guidelines, for instance, at the procurement stage, what are the

61
procurement rules and procedures. In this module, the trainer leads the community in identifying key implementation areas that are more prone to mismanagement and explores ways in which the community can engage in monitoring to ensure achievement of the project outcomes.
The module ends with the announcement of the individual and group incentives for completing the comprehensive training and all the stages of community monitoring respectively.
MModule 3: Community Monitoring Skills This module aims at providing basic skills in community monitoring of NUSAF2 projects. The CMGs are taken through steps in monitoring, identifying sources of information and gathering monitoring data and management of monitoring data. The module includes practical sessions that help CMGs to generate critical questions for monitoring the procurement, timelines, technical support, financial management and quality of inputs for the NUSAF2 project of their own community.
Module 4: Post-monitoring Activities This module provides basic understanding on how to review, store and manage monitoring data and outcome. It includes using monitoring data to generate simple monthly reports for submission to relevant authorities. Practical sessions include conducting a mock monitoring session and writing a simple report.
The module ends with a session on how to provide feedback on findings from monitoring to the community members as well as explore possible actions to respond to the findings.
Module 5: How to Generate a Community Action Plan This is a practical step by step session on how to develop an action plan relevant to the sub project of any given community. CMGs are taken through a participatory discussion that results into key action plans that will be implemented and reviewed with the community trainer during the first follow up support visit.
The session includes actual planning and setting timelines for all monitoring activities and allocation of tasks among the CMGs.
Module 6: Follow-up Support Visit This module provides step by step guidance on how the CMGs can review the action plan generated in module 5 and provide technical support and/or a full refresher training to the CMGs depending on identified technical gaps.

62
The module ends with guidance on how to revise and create new action plans at the end of every follow up support visit.
Module 7: Applying Lessons Learnt to Other Government Services The aim of this module is to help CMGs apply the monitoring skills they gained from monitoring NUSAF2 to other government programs in their communities. The module uses an example of teacher absenteeism from the education sector to help CMGs learn and apply their skill to other sectors.
The module ends with a practical session on creating a monitoring check list using teacher absenteeism as an example, from the original NUSAF2 checklist.
B. Scorecard construction For the community scorecard, we construct 4 scores for the following dimensions:
Health when animals arrived Animal Productivity Assistance from the District Veterinary Officer (DVO) Value for money.
We detail how these scores are assigned and present kernal density graphs for each score’s distribution. All data comes from the community assessment conducted from December 2015 to February 2016. Health when animals arrived To construct the health when animals arrived score, we give up to 50 points for the health of animals when they arrived as stated by respondents, and another 50 points for the number of animals that died within 3 months of being received by the respondent.
The 50 points for health as it is stated is constructed by looking at the total number of illnesses identified by respondents within a project (they are asked which illnesses they think each of their animals had when they arrived), divided by the number of animals surveyed. This gives us the average number of illnesses each animal had when they arrived. This is then linearly scaled sending the max average in the dataset to 0, and the minimum average (the fewest illnesses) to 50 points.
For the death within three months, we take the total number of animals that did not die within three months of old age/illness divided by the number of animals they started this. We then multiple this by 50, so that a sub-project gets 50 if no animals died, and 0 if all their animals died of illness/old age.

63
The final score is then constructed by adding together the respondent health out of 50 and the animal died out of 50, to make a score out of 100.
AAnimal Productivity This score is produced by assigning 50 marks for the percentage of animals which are productive (either producing milk or offspring, or ploughing) and another 50 marks for the health of the animals measured by the average number of poor health indicators across a variety of indicators. The score is then finally scaled by the number of animals we were able to survey divided by the total number of animals we tried to survey.
For animal productivity we simple define an animal as productive if either it produces milk, has produced calves or is currently able to pull a plough. For example, projects that bought animals that are still too young to be productive get a low score. The score from 50 is the total number of productive animals, divided by the total number of animals we surveyed, and then multiplied by 50.
For the current health of animals, we define a health score for each animal based on the following health indicators: signs of illness, abnormal discharges, skin conditions, parasites, temperament and body score. For each of these indicators each animal gets either a 1 to represent some abnormality or a zero for “healthy”. we then total across all these indicators to give the animal and overall health score (which is an integer between 0 and 6). We then take the mean across the of the animal health scores in the project. Finally we scale linearly again sending the sub-project with highest number of illnesses to zero and the project with the lowest average number of illnesses to 50.
To make the final score, we add together the productivity score and the health score. We scaled this score by multiplying by the number of animals were able to survey divided by the number of animals we tried to survey. For example, if in one sub-project we were trying to find 5 cows, we only found 3 but they were perfectly productive and healthy (so would have got a score of 100), then their score will be scaled down to 60 to account for the animals that were not around.
Assistance from the DVO Assistance from the DVO is constructed using the indicators for the six roles that DVO were supposed to complete for each sub-project. These were: 1) follow-up after inspection, 2) animal treatment/prophylaxis 3) animal ear tagging 4) training sub-project committees 5) animal selection 6) animal inspection.
The first three roles were asked to survey respondents and we assign a score equal to the fraction of respondents that said the DVO provided that service (e.g. 0.6 if 3 of 5 respondents said the DVO ear tagged their animals). The last three roles were asked
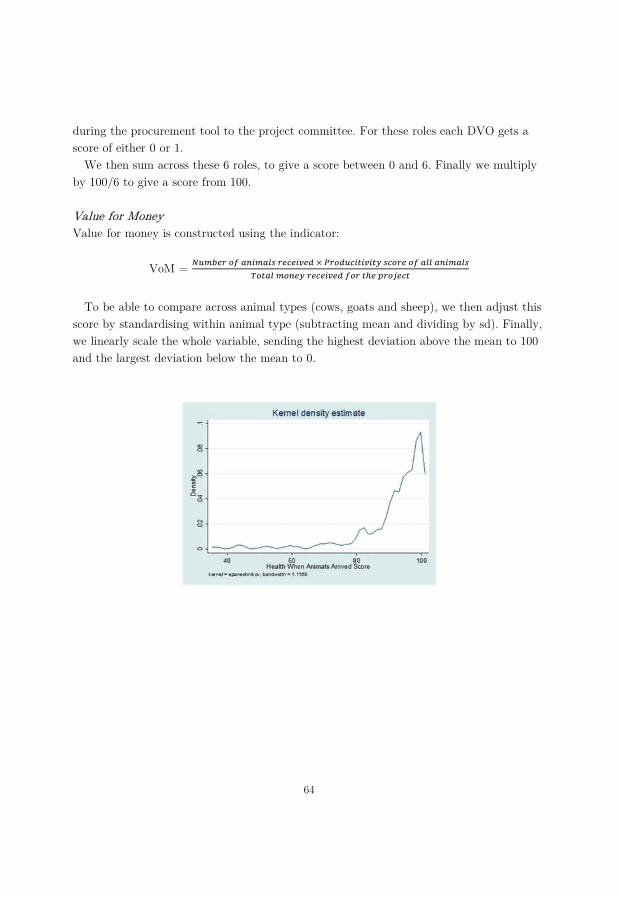
64
during the procurement tool to the project committee. For these roles each DVO gets a score of either 0 or 1.
We then sum across these 6 roles, to give a score between 0 and 6. Finally we multiply by 100/6 to give a score from 100.
VValue for Money Value for money is constructed using the indicator:
VoM =
To be able to compare across animal types (cows, goats and sheep), we then adjust this
score by standardising within animal type (subtracting mean and dividing by sd). Finally, we linearly scale the whole variable, sending the highest deviation above the mean to 100 and the largest deviation below the mean to 0.
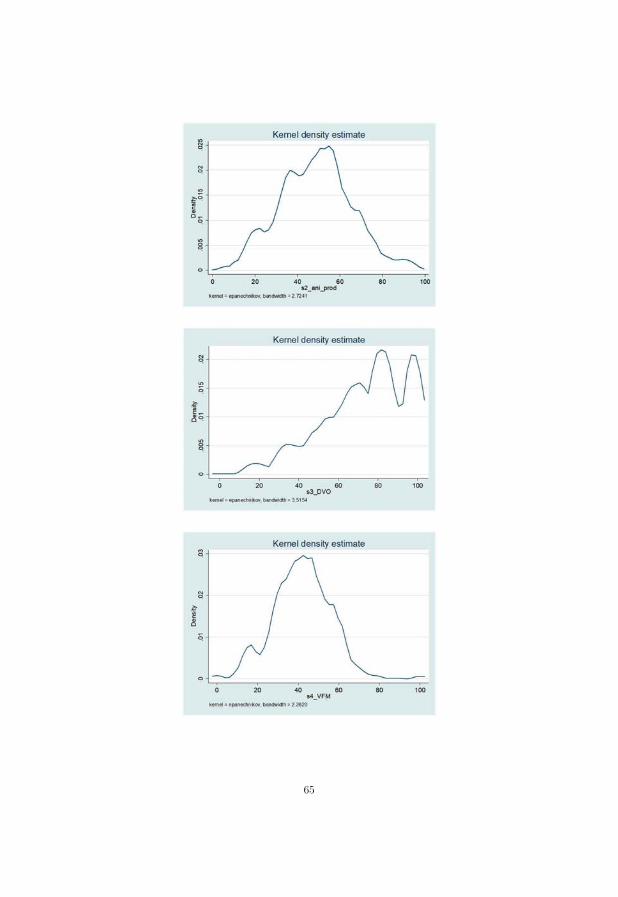
65
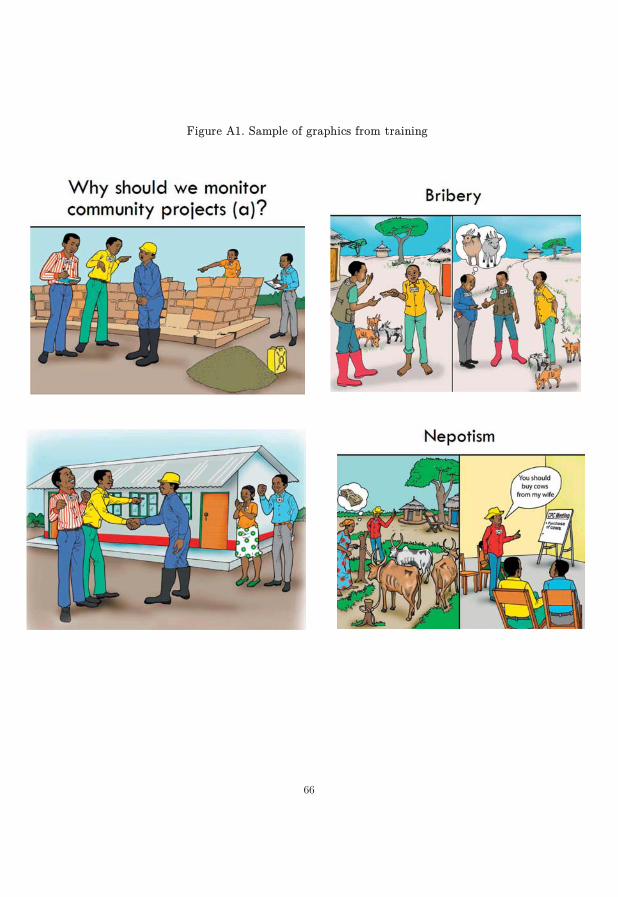
66
FFigure A1. Sample of graphics from training
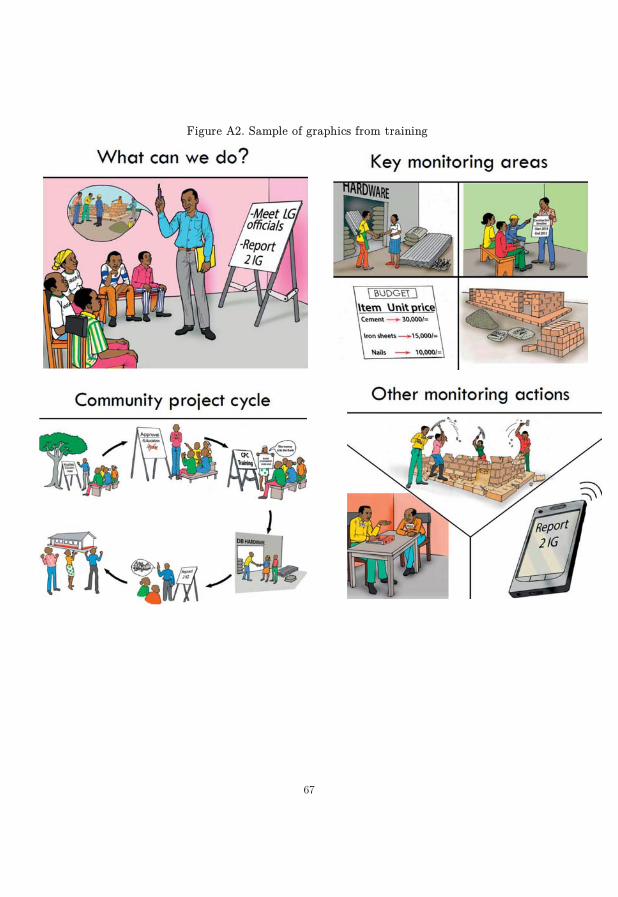
67
FFigure A2. Sample of graphics from training
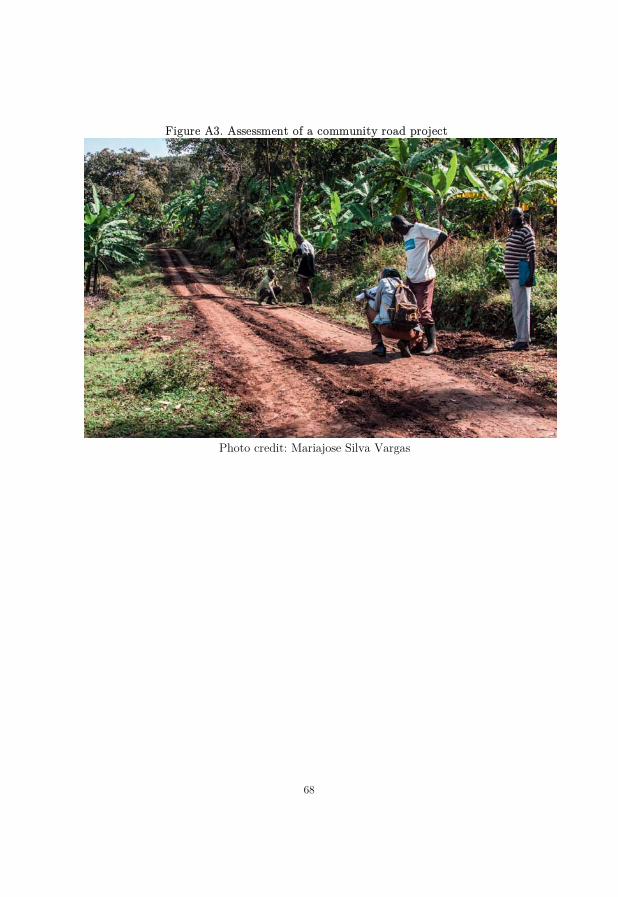
68
FFigure A3. Assessment of a community road project
Photo credit: Mariajose Silva Vargas
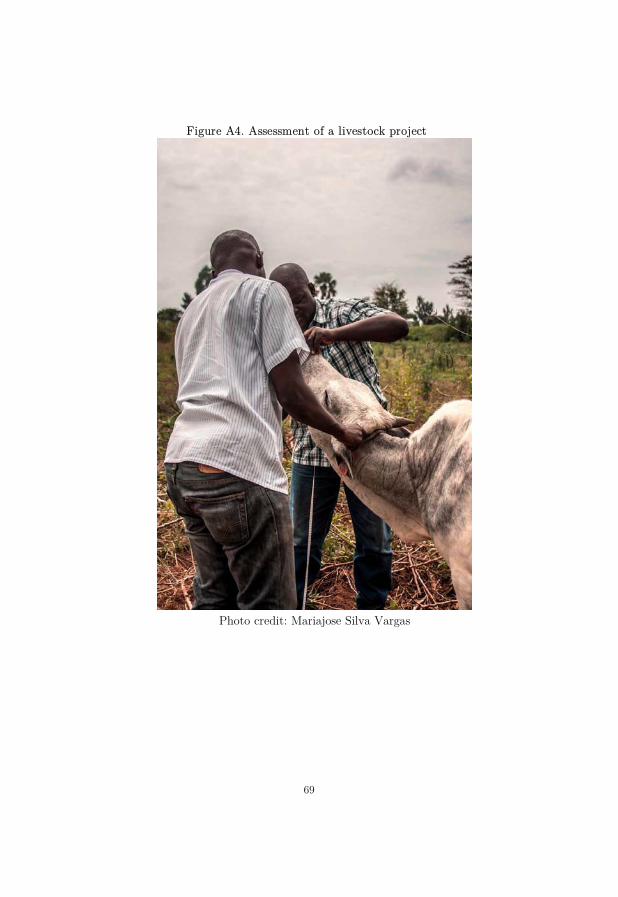
69
FFigure A4. Assessment of a livestock project
Photo credit: Mariajose Silva Vargas
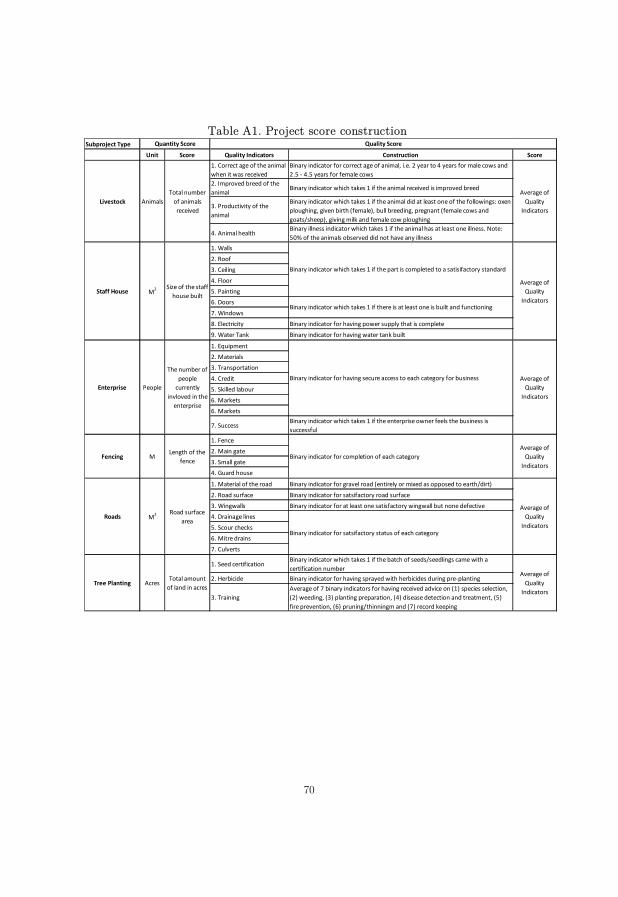
70
TTable A1. Project score construction
Subproject TypeUnit Score Quality Indicators Construction Score
1. Correct age of the animal when it was received
Binary indicator for correct age of animal, i.e. 2 year to 4 years for male cows and 2.5 - 4.5 years for female cows
2. Improved breed of the animal
Binary indicator which takes 1 if the animal received is improved breed
3. Productivity of the animal
Binary indicator which takes 1 if the animal did at least one of the followings: oxen ploughing, given birth (female), bull breeding, pregnant (female cows and goats/sheep), giving milk and female cow ploughing
4. Animal healthBinary illness indicator which takes 1 if the animal has at least one illness. Note: 50% of the animals observed did not have any illness
1. Walls2. Roof3. Ceiling4. Floor5. Painting6. Doors7. Windows8. Electricity Binary indicator for having power supply that is complete9. Water Tank Binary indicator for having water tank built
1. Equipment2. Materials3. Transportation4. Credit5. Skilled labour6. Markets6. Markets
7. SuccessBinary indicator which takes 1 if the enterprise owner feels the business is successful
1. Fence2. Main gate3. Small gate4. Guard house
1. Material of the road Binary indicator for gravel road (entirely or mixed as opposed to earth/dirt)2. Road surface Binary indicator for satsifactory road surface3. Wingwalls Binary indicator for at least one satisfactory wingwall but none defective4. Drainage lines5. Scour checks6. Mitre drains7. Culverts
1. Seed certificationBinary indicator which takes 1 if the batch of seeds/seedlings came with a certification number
2. Herbicide Binary indicator for having sprayed with herbicides during pre-planting
3. TrainingAverage of 7 binary indicators for having received advice on (1) species selection, (2) weeding, (3) planting preparation, (4) disease detection and treatment, (5) fire prevention, (6) pruning/thinningm and (7) record keeping
AcresTotal amount
of land in acres
Average of Quality
Indicators
Livestock
Staff House
Enterprise
Fencing
Roads
Tree Planting
MLength of the
fenceBinary indicator for completion of each category
Average of Quality
Indicators
M2 Road surface area
Average of Quality
IndicatorsBinary indicator for satsifactory status of each category
M2 Size of the staff house built
Binary indicator which takes 1 if the part is completed to a satisifactory standard
Average of Quality
IndicatorsBinary indicator which takes 1 if there is at least one is built and functioning
People
The number of people
currently invloved in the
enterprise
Binary indicator for having secure access to each category for business Average of Quality
Indicators
Quantity Score Quality Score
AnimalsTotal number
of animals received
Average of Quality
Indicators
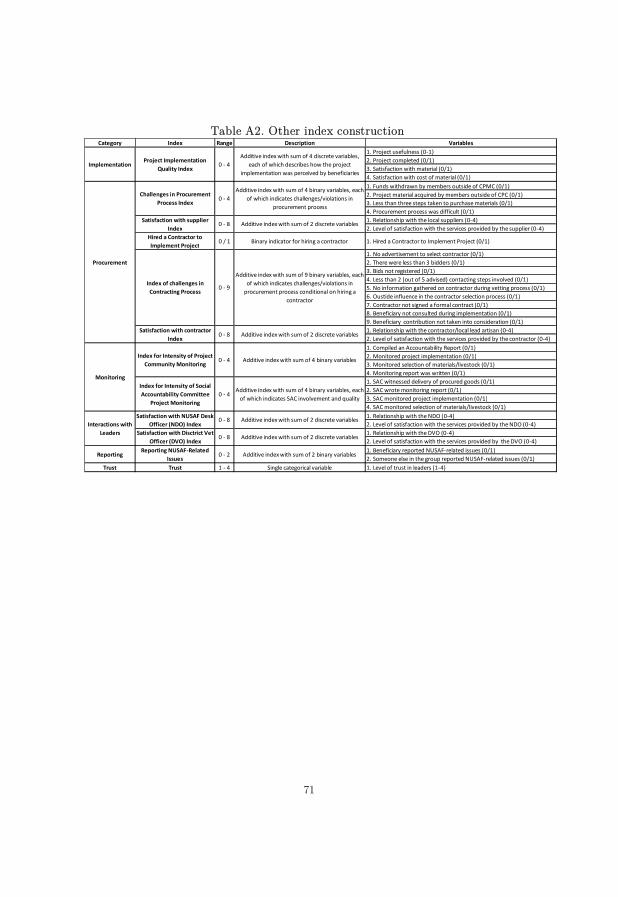
71
TTable A2. Other index construction
Category Index Range Description Variables1. Project usefulness (0-1)2. Project completed (0/1)3. Satisfaction with material (0/1)4. Satisfaction with cost of material (0/1)1. Funds withdrawn by members outside of CPMC (0/1)2. Project material acquired by members outside of CPC (0/1)3. Less than three steps taken to purchase materials (0/1)4. Procurement process was difficult (0/1)1. Relationship with the local suppliers (0-4)2. Level of satisfaction with the services provided by the supplier (0-4)
Hired a Contractor to Implement Project
0 / 1 Binary indicator for hiring a contractor 1. Hired a Contractor to Implement Project (0/1)
1. No advertisement to select contractor (0/1)2. There were less than 3 bidders (0/1)3. Bids not registered (0/1)4. Less than 2 (out of 5 advised) contacting steps involved (0/1)5. No information gathered on contractor during vetting process (0/1)6. Oustide influence in the contractor selection process (0/1)7. Contractor not signed a formal contract (0/1)8. Beneficiary not consulted during implementation (0/1)9. Beneficiary contribution not taken into consideration (0/1)1. Relationship with the contractor/local lead artisan (0-4)2. Level of satisfaction with the services provided by the contractor (0-4)1. Compiled an Accountability Report (0/1)2. Monitored project implementation (0/1)3. Monitored selection of materials/livestock (0/1)4. Monitoring report was written (0/1)1. SAC witnessed delivery of procured goods (0/1)2. SAC wrote monitoring report (0/1)3. SAC monitored project implementation (0/1)4. SAC monitored selection of materials/livestock (0/1)1. Relationship with the NDO (0-4)2. Level of satisfaction with the services provided by the NDO (0-4)1. Relationship with the DVO (0-4)2. Level of satisfaction with the services provided by the DVO (0-4)1. Beneficiary reported NUSAF-related issues (0/1)2. Someone else in the group reported NUSAF-related issues (0/1)
Trust Trust 1 - 4 Single categorical variable 1. Level of trust in leaders (1-4)
ReportingReporting NUSAF-Related
Issues0 - 2 Additive index with sum of 2 binary variables
Interactions with Leaders
Satisfaction with NUSAF Desk Officer (NDO) Index
0 - 8 Additive index with sum of 2 discrete variables
Satisfaction with Disctrict Vet Officer (DVO) Index
0 - 8 Additive index with sum of 2 discrete variables
Monitoring
Index for Intensity of Project Community Monitoring
0 - 4 Additive index with sum of 4 binary variables
Index for Intensity of Social Accountability Committee
Project Monitoring0 - 4
Additive index with sum of 4 binary variables, each of which indicates SAC involvement and quality
Additive index with sum of 2 discrete variables
Index of challenges in Contracting Process
0 - 9
Additive index with sum of 9 binary variables, each of which indicates challenges/violations in
procurement process conditional on hiring a contractor
Satisfaction with contractor Index
0 - 8 Additive index with sum of 2 discrete variables
ImplementationProject Implementation
Quality Index0 - 4
Additive index with sum of 4 discrete variables, each of which describes how the project
implementation was perceived by beneficiaries
Procurement
Challenges in Procurement Process Index
0 - 4Additive index with sum of 4 binary variables, each
of which indicates challenges/violations in procurement process
Satisfaction with supplier Index
0 - 8
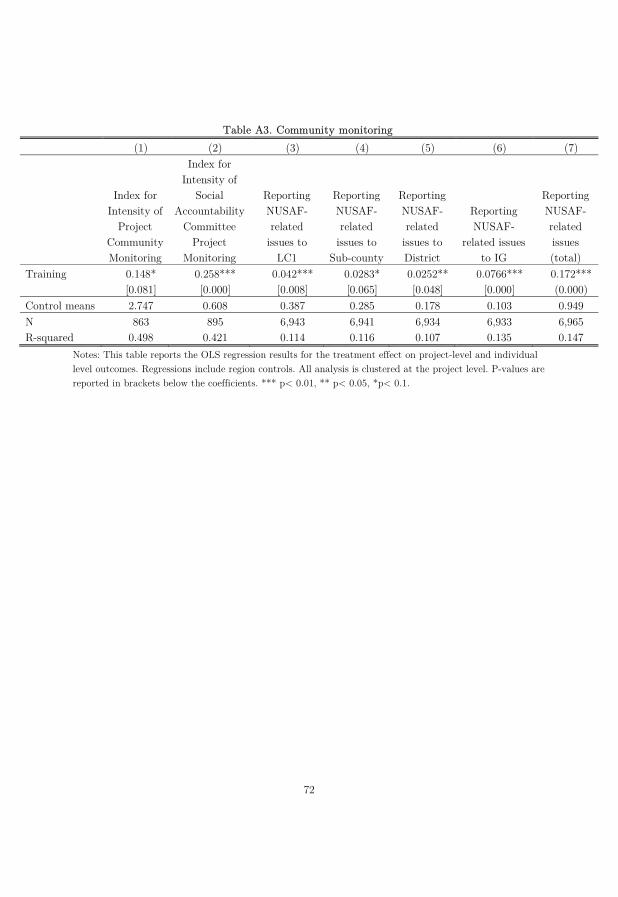
72
TTable A3. Community monitoring (1) (2) (3) (4) (5) (6) (7)
Index for Intensity of
Project Community Monitoring
Index for Intensity of
Social Accountability
Committee Project
Monitoring
Reporting NUSAF-related
issues to LC1
Reporting NUSAF-related
issues to Sub-county
Reporting NUSAF-related
issues to District
Reporting NUSAF-
related issues to IG
Reporting NUSAF-related issues (total)
Training 0.148* 0.258*** 0.042*** 0.0283* 0.0252** 0.0766*** 0.172*** [0.081] [0.000] [0.008] [0.065] [0.048] [0.000] (0.000)
Control means 2.747 0.608 0.387 0.285 0.178 0.103 0.949 N 863 895 6,943 6,941 6,934 6,933 6,965 R-squared 0.498 0.421 0.114 0.116 0.107 0.135 0.147
Notes: This table reports the OLS regression results for the treatment effect on project-level and individual level outcomes. Regressions include region controls. All analysis is clustered at the project level. P-values are reported in brackets below the coefficients. *** p< 0.01, ** p< 0.05, *p< 0.1.
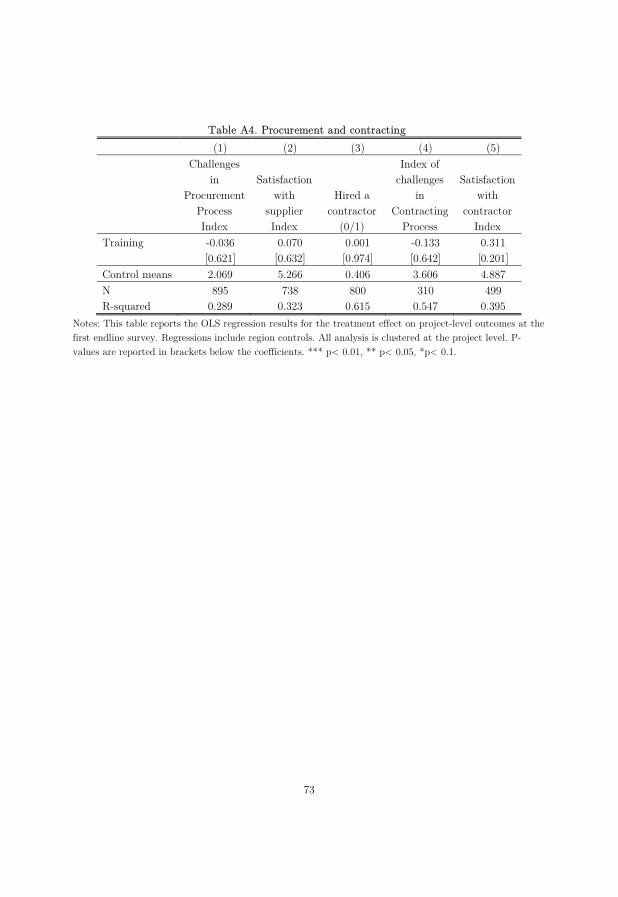
73
TTable A4. Procurement and contracting (1) (2) (3) (4) (5)
Challenges in
Procurement Process Index
Satisfaction with
supplier Index
Hired a contractor
(0/1)
Index of challenges
in Contracting
Process
Satisfaction with
contractor Index
Training -0.036 0.070 0.001 -0.133 0.311 [0.621] [0.632] [0.974] [0.642] [0.201]
Control means 2.069 5.266 0.406 3.606 4.887 N 895 738 800 310 499 R-squared 0.289 0.323 0.615 0.547 0.395
Notes: This table reports the OLS regression results for the treatment effect on project-level outcomes at the first endline survey. Regressions include region controls. All analysis is clustered at the project level. P-values are reported in brackets below the coefficients. *** p< 0.01, ** p< 0.05, *p< 0.1.
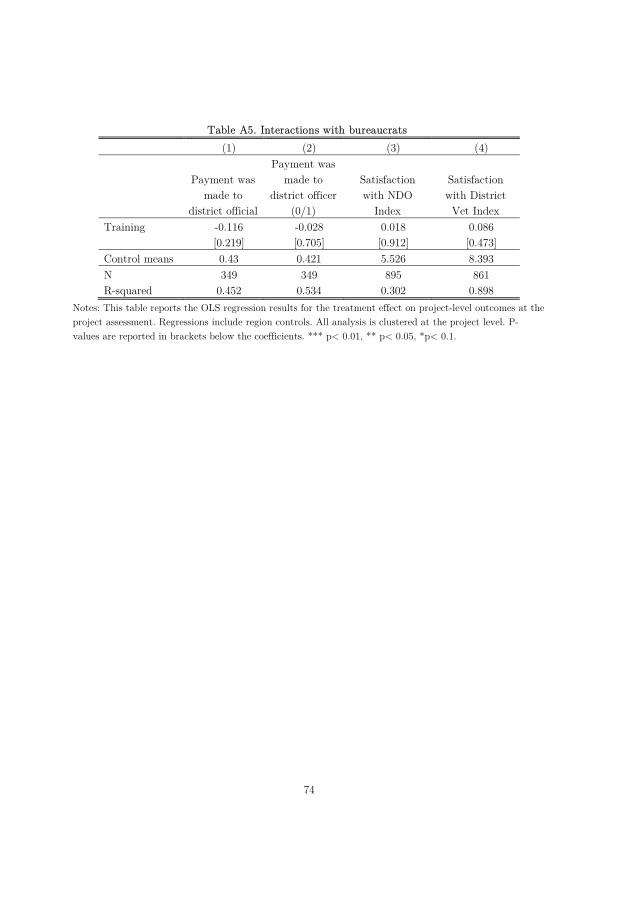
74
TTable A5. Interactions with bureaucrats (1) (2) (3) (4)
Payment was made to
district official
Payment was made to
district officer (0/1)
Satisfaction with NDO
Index
Satisfaction with District Vet Index
Training -0.116 -0.028 0.018 0.086 [0.219] [0.705] [0.912] [0.473]
Control means 0.43 0.421 5.526 8.393 N 349 349 895 861 R-squared 0.452 0.534 0.302 0.898
Notes: This table reports the OLS regression results for the treatment effect on project-level outcomes at the project assessment. Regressions include region controls. All analysis is clustered at the project level. P-values are reported in brackets below the coefficients. *** p< 0.01, ** p< 0.05, *p< 0.1.
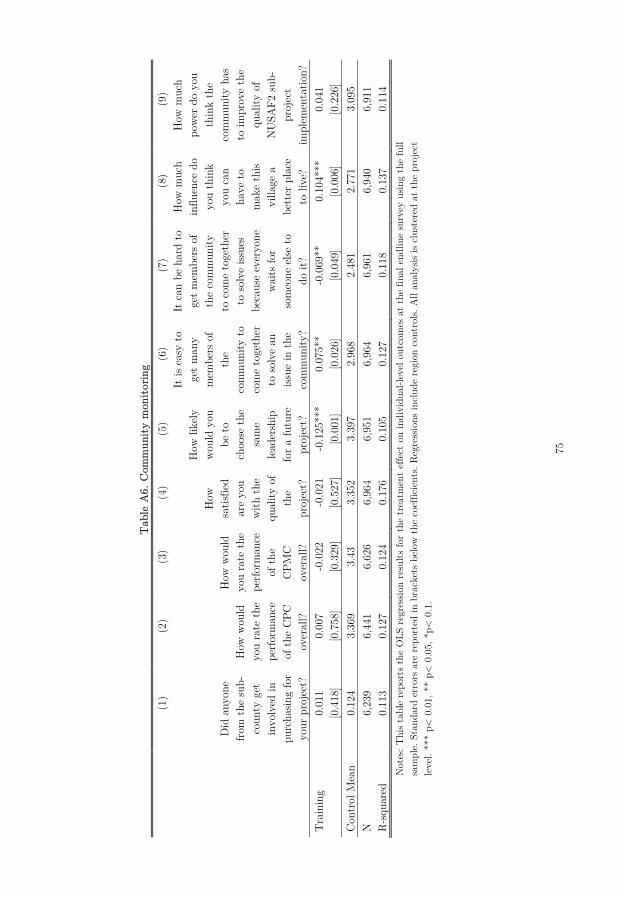
75
T
able
A6.
Com
mun
ity
mon
itor
ing
(1
) (2
) (3
) (4
) (5
) (6
) (7
) (8
) (9
)
Did
any
one
from
the
sub-
coun
ty g
et
invo
lved
in
purc
hasin
g fo
r yo
ur p
roje
ct?
How
wou
ld
you
rate
the
perfo
rman
ce
of t
he C
PC
over
all?
How
wou
ld
you
rate
the
perfo
rman
ce
of t
he
CPM
C
over
all?
How
sa
tisfie
d ar
e yo
u w
ith th
e qu
ality
of
the
proj
ect?
How
like
ly
wou
ld y
ou
be to
ch
oose
the
sam
e le
ader
ship
fo
r a
futu
re
proj
ect?
It is
eas
y to
ge
t man
y m
embe
rs o
f th
e co
mm
unity
to
com
e to
geth
er
to s
olve
an
issue
in t
he
com
mun
ity?
It c
an b
e ha
rd to
ge
t mem
bers
of
the
com
mun
ity
to c
ome
toge
ther
to
sol
ve is
sues
be
caus
e ev
eryo
ne
wai
ts fo
r so
meo
ne e
lse to
do
it?
How
muc
h in
fluen
ce d
o yo
u th
ink
you
can
have
to
mak
e th
is vi
llage
a
bett
er p
lace
to
live
?
How
muc
h po
wer d
o yo
u th
ink
the
com
mun
ity h
as
to im
prov
e th
e qu
ality
of
NU
SAF2
sub
-pr
ojec
t im
plem
enta
tion?
T
rain
ing
0.01
1 0.
007
-0.0
22
-0.0
21
-0.1
25**
* 0.
075*
* -0
.069
**
0.10
4***
0.
041
[0
.418
] [0
.758
] [0
.329
] [0
.527
] [0
.001
] [0
.026
] [0
.049
] [0
.006
] [0
.226
] C
ontr
ol M
ean
0.12
4 3.
369
3.43
3.
352
3.39
7 2.
968
2.48
1 2.
771
3.09
5 N
6,
239
6,44
1 6,
626
6,96
4 6,
951
6,96
4 6,
961
6,94
0 6,
911
R-s
quar
ed
0.11
3 0.
127
0.12
4 0.
176
0.10
5 0.
127
0.11
8 0.
137
0.11
4 N
otes
: Thi
s ta
ble
repo
rts
the
OLS
reg
ress
ion
resu
lts fo
r th
e tr
eatm
ent
effe
ct o
n in
divi
dual
-leve
l out
com
es a
t th
e fin
al e
ndlin
e su
rvey
usin
g th
e fu
ll sa
mpl
e. S
tand
ard
erro
rs a
re r
epor
ted
in b
rack
ets
belo
w th
e co
effic
ient
s. R
egre
ssio
ns in
clud
e re
gion
con
trol
s. A
ll an
alys
is is
clus
tere
d at
the
pro
ject
le
vel.
***
p< 0
.01,
**
p< 0
.05,
*p<
0.1
.
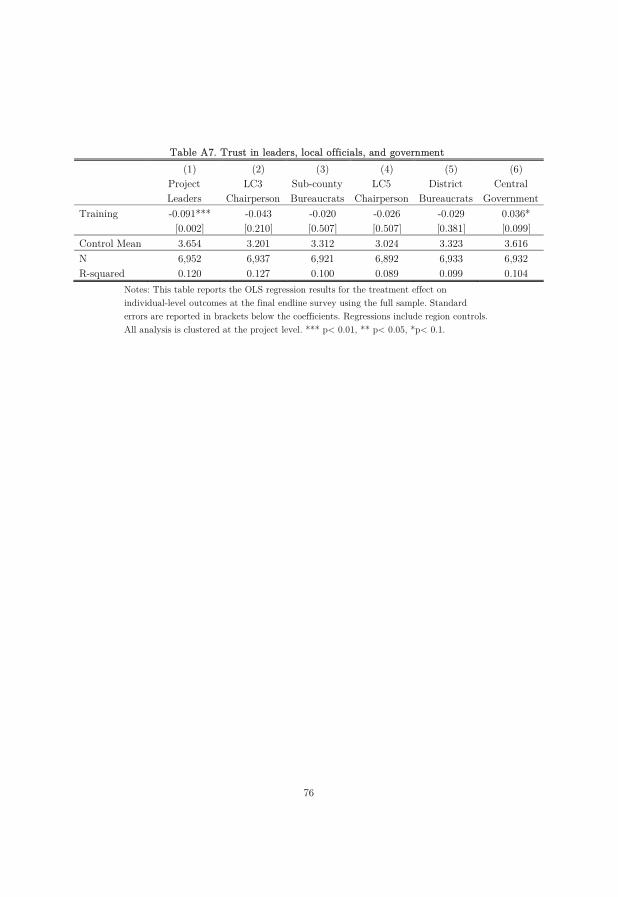
76
TTable A7. Trust in leaders, local officials, and government
(1) (2) (3) (4) (5) (6)
Project Leaders
LC3 Chairperson
Sub-county Bureaucrats
LC5 Chairperson
District Bureaucrats
Central Government
Training -0.091*** -0.043 -0.020 -0.026 -0.029 0.036* [0.002] [0.210] [0.507] [0.507] [0.381] [0.099]
Control Mean 3.654 3.201 3.312 3.024 3.323 3.616 N 6,952 6,937 6,921 6,892 6,933 6,932 R-squared 0.120 0.127 0.100 0.089 0.099 0.104
Notes: This table reports the OLS regression results for the treatment effect on individual-level outcomes at the final endline survey using the full sample. Standard errors are reported in brackets below the coefficients. Regressions include region controls. All analysis is clustered at the project level. *** p< 0.01, ** p< 0.05, *p< 0.1.
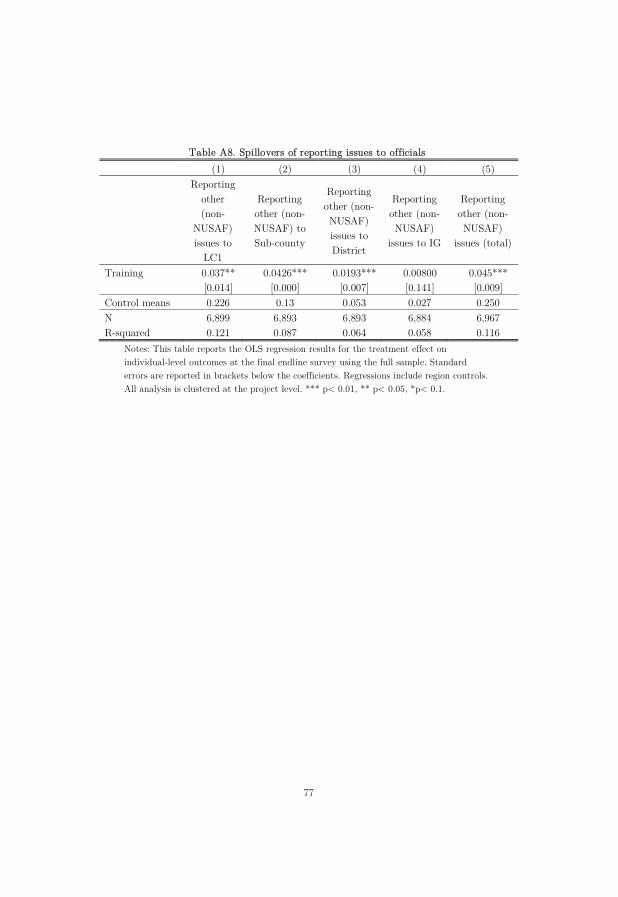
77
TTable A8. Spillovers of reporting issues to officials (1) (2) (3) (4) (5)
Reporting other (non-
NUSAF) issues to
LC1
Reporting other (non-NUSAF) to Sub-county
Reporting other (non-NUSAF) issues to District
Reporting other (non-NUSAF)
issues to IG
Reporting other (non-NUSAF)
issues (total)
Training 0.037** 0.0426*** 0.0193*** 0.00800 0.045*** [0.014] [0.000] [0.007] [0.141] [0.009]
Control means 0.226 0.13 0.053 0.027 0.250 N 6,899 6,893 6,893 6,884 6,967 R-squared 0.121 0.087 0.064 0.058 0.116
Notes: This table reports the OLS regression results for the treatment effect on individual-level outcomes at the final endline survey using the full sample. Standard errors are reported in brackets below the coefficients. Regressions include region controls. All analysis is clustered at the project level. *** p< 0.01, ** p< 0.05, *p< 0.1.
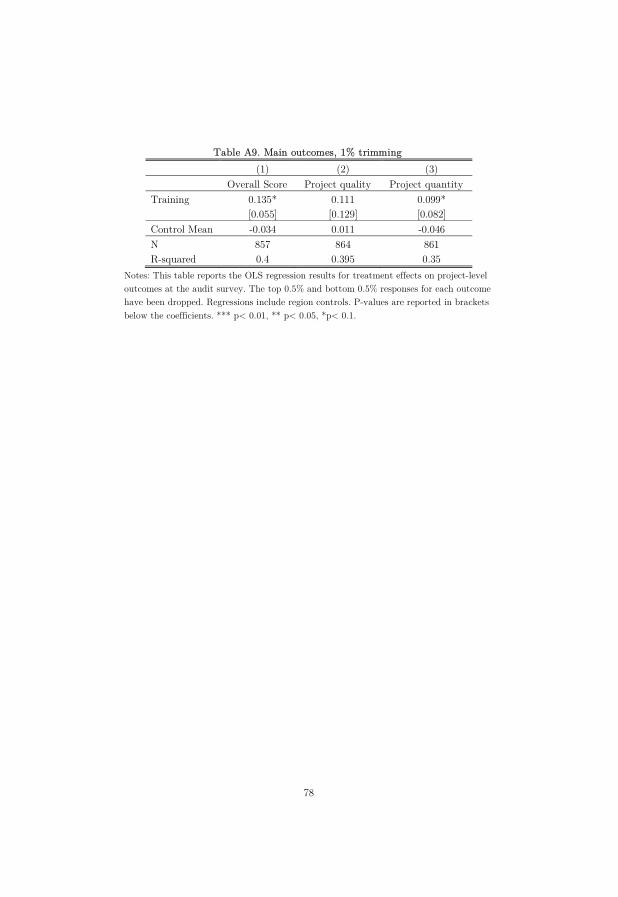
78
TTable A9. Main outcomes, 1% trimming (1) (2) (3) Overall Score Project quality Project quantity
Training 0.135* 0.111 0.099* [0.055] [0.129] [0.082]
Control Mean -0.034 0.011 -0.046 N 857 864 861 R-squared 0.4 0.395 0.35
Notes: This table reports the OLS regression results for treatment effects on project-level outcomes at the audit survey. The top 0.5% and bottom 0.5% responses for each outcome have been dropped. Regressions include region controls. P-values are reported in brackets below the coefficients. *** p< 0.01, ** p< 0.05, *p< 0.1.
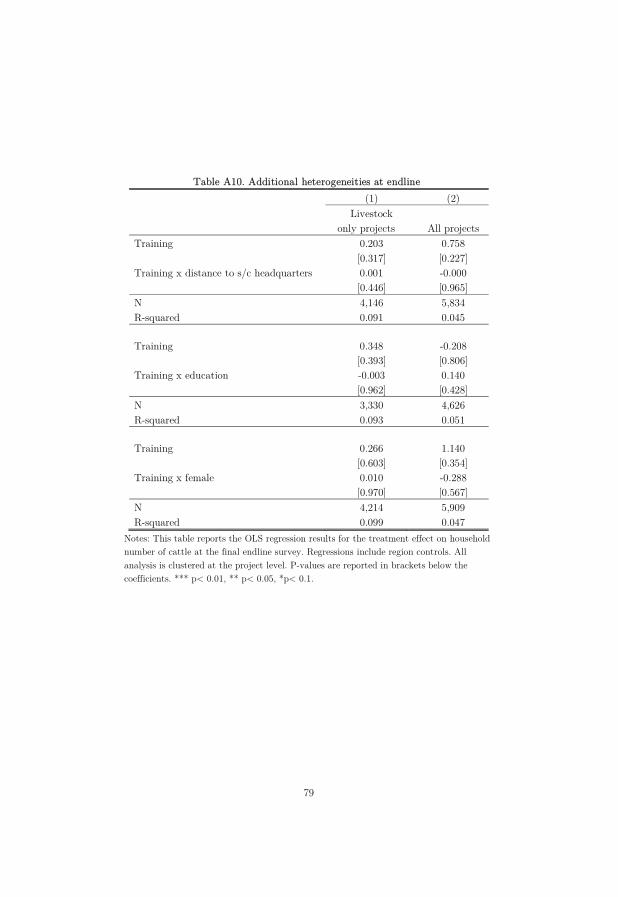
79
Table A10. Additional heterogeneities at endline
(1) (2)
Livestock
only projects All projects Training 0.203 0.758
[0.317] [0.227] Training x distance to s/c headquarters 0.001 -0.000
[0.446] [0.965] N 4,146 5,834 R-squared 0.091 0.045
Training 0.348 -0.208
[0.393] [0.806] Training x education -0.003 0.140
[0.962] [0.428] N 3,330 4,626 R-squared 0.093 0.051
Training 0.266 1.140
[0.603] [0.354] Training x female 0.010 -0.288
[0.970] [0.567] N 4,214 5,909 R-squared 0.099 0.047
Notes: This table reports the OLS regression results for the treatment effect on household number of cattle at the final endline survey. Regressions include region controls. All analysis is clustered at the project level. P-values are reported in brackets below the coefficients. *** p< 0.01, ** p< 0.05, *p< 0.1.
Related Documents