Actuarial 2000-2011 SOA LTC Intercompany Experience Study Experience Study March 22, 2015 Jon Prince Great American Insurance Group Jon Prince, Great American Insurance Group Matthew Morton, LTCG Ben Williams, Towers Watson

Welcome message from author
This document is posted to help you gain knowledge. Please leave a comment to let me know what you think about it! Share it to your friends and learn new things together.
Transcript

Actuarial
2000-2011 SOA LTC Intercompany
Experience StudyExperience StudyMarch 22, 2015
Jon Prince Great American Insurance GroupJon Prince, Great American Insurance GroupMatthew Morton, LTCG
Ben Williams, Towers Watson,

Agenda
• Introductions• Goals & Project PlanGoals & Project Plan• Data gathering
A t f D t• Assessment of Data• Morbidity experience• Experience table: Model build
SOA Experience Study 2

Introductions
Multi-faceted team• Society of Actuaries (sponsor)Society of Actuaries (sponsor)• Steering Committee
T W t• Towers Watson• LIMRA• MIB
SOA Experience Study 3

Goals and Project Plan
• Goals of this study:– Obtain, review and model morbidity Ob a , e e a d ode o b d y
experience for long term care insurance– Use the most complete datap– Provide aggregate databases to the industry– Build experience tableBuild experience table
SOA Experience Study 4

Data gathering
• Data gathering (Steering Committee)– Data request sent to top carriers in USa a eques se o op ca e s US– Conversations with carriers– Policy history filePolicy history file– Claim file– 22 companies submitted full or partial data– 22 companies submitted full or partial data– Exposure period: 2000-2011
Data scrubbing (MIB & LIMRA)• Data scrubbing (MIB & LIMRA)– Valid data fields
SOA Experience Study 5

Data Assessment
• Data Assessment (Towers Watson)– Created summariesC ea ed su a es
• Policy history• Policyholder characteristics• Benefit characteristics
– Confirmatory calls with participants– Identified key data items & find companies
with sufficient data quality to analyze
SOA Experience Study 6

Data Assessment
• For each morbidity component– Identified key data fields (approximately 12 de ed ey da a e ds (app o a e y
characteristics)– Participants with sufficient quality and complete p q y p
data were selected– Analyzed variety of remaining data to ensure
good mixture of policyholder and benefit characteristics
• Maximizing data while minimizing unknowns
SOA Experience Study 7

Morbidity Experience Review
• Reviewed each key morbidity experience metric– Incidencec de ce– Claim termination– Claim utilizationClaim utilization
• Reviewed for reasonableness & trendsC i t t d fi iti f i l i• Consistent definition of unique claim:– Payment made and– Multiple claims for single policyholder combined if
service dates are within 6 months
SOA Experience Study 8
Morbidity Experience Review
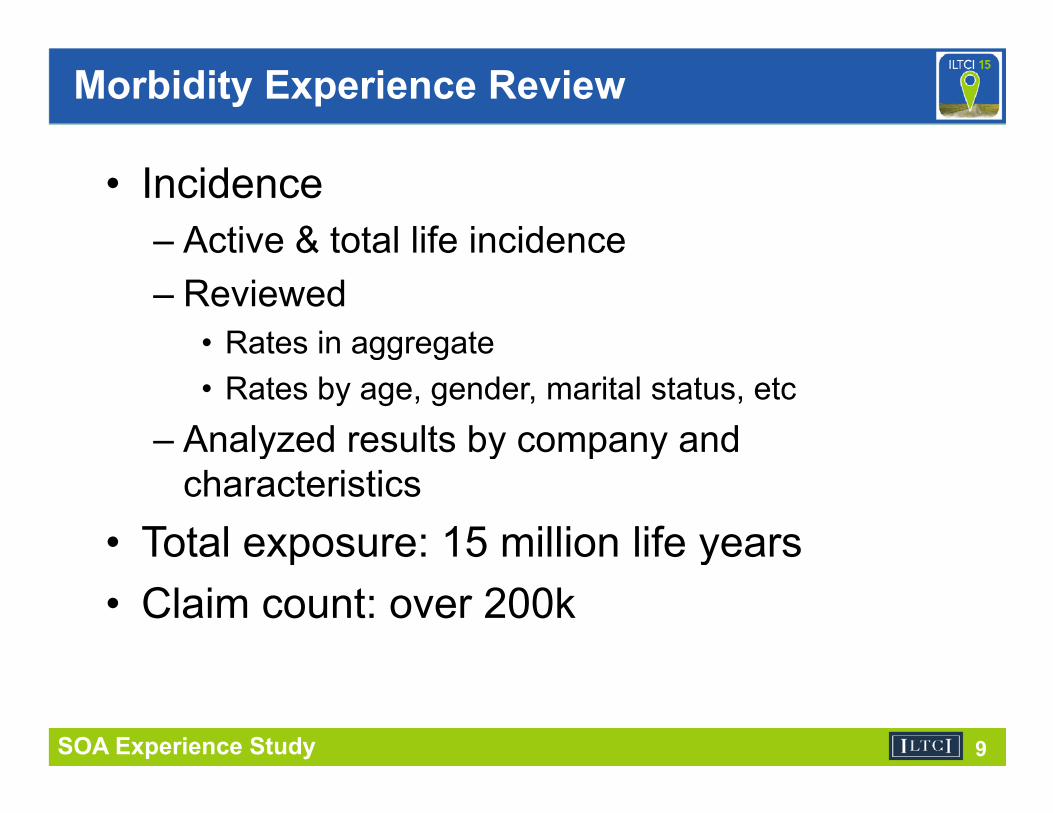
• Incidence– Active & total life incidencec e & o a e c de ce– Reviewed
• Rates in aggregategg g• Rates by age, gender, marital status, etc
– Analyzed results by company and y y p ycharacteristics
• Total exposure: 15 million life yearsp y• Claim count: over 200k
SOA Experience Study 9

Morbidity Experience Review
• Claim terminations– Total terminations & disabled mortalityo a e a o s & d sab ed o a y– 4 million years of disabled exposure– Claim counts: 200kClaim counts: 200k
• Claim utilizationGPO and unknown benefit inflation excluded– GPO and unknown benefit inflation excluded as benefit schedules were not providedResulting database has over $7 billion of– Resulting database has over $7 billion of claims paid
SOA Experience Study 10

Morbidity Experience Review
• Aggregate databases– Separate tables for each morbidity componentSepa a e ab es o eac o b d y co po e– Publicly available pivot tables that allow user to
manipulate data and analyze results at granular p y glevel
– Ability to view results more dynamically than static tables
– Confidentiality of data from participants– No manipulation to scale data
SOA Experience Study 11
Experience Table
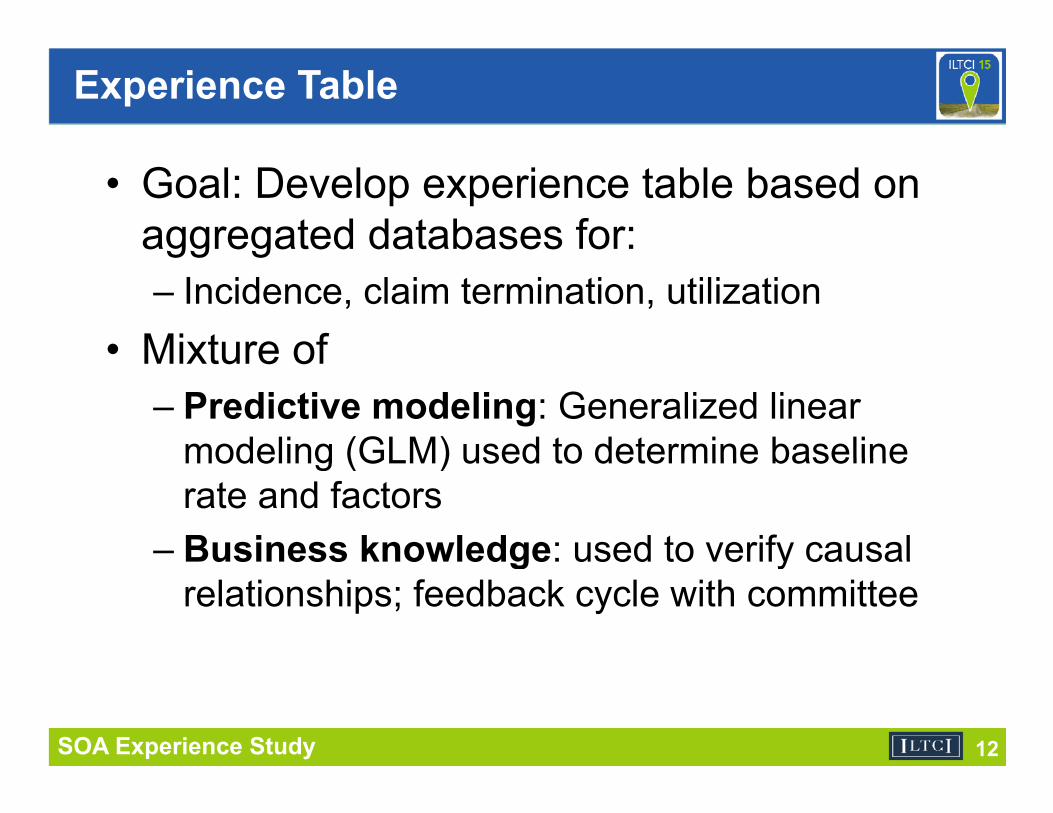
• Goal: Develop experience table based on aggregated databases for:gg g– Incidence, claim termination, utilization
• Mixture ofMixture of – Predictive modeling: Generalized linear
modeling (GLM) used to determine baselinemodeling (GLM) used to determine baseline rate and factors
– Business knowledge: used to verify causalBusiness knowledge: used to verify causal relationships; feedback cycle with committee
SOA Experience Study 12
Experience Table
• Predictive modeling background:– Is the process of developing a model that estimates
the outcome of a given process– Uses statistical tests to determine the factors, and
which combinations of factors impact the processwhich combinations of factors, impact the process– Separates signal from noise in actual experience
• Predictive models are used to make• Predictive models are used to make projections of future results
SOA Experience Study 13

Experience Table
• GLM uses statistical methods to analyze data and determine relationshipsp
• Key metrics utilized include:– Chi-square:– Chi-square:– AIC (Akaike Information Criterion)
BIC (Bayesian Information Criterion)– BIC (Bayesian Information Criterion)
SOA Experience Study 14

Experience Table
• Claim incidence model:– Data drivena a d e– Multiplicative models
• Total lives• Active lives
– Base factor & vectors based on cell selection determine model output
SOA Experience Study 15

Experience Table
• Claim incidence model predictors:Incurred age Underwriting class– Incurred age
– Elimination periodBenefit period
– Underwriting class– Daily benefit
R i– Benefit period– Policy duration
M ti l t t
– Region– Tax Qualified status
C– Martial status– Underwriting type
– Coverage– Gender
SOA Experience Study 16
Experience Table
100
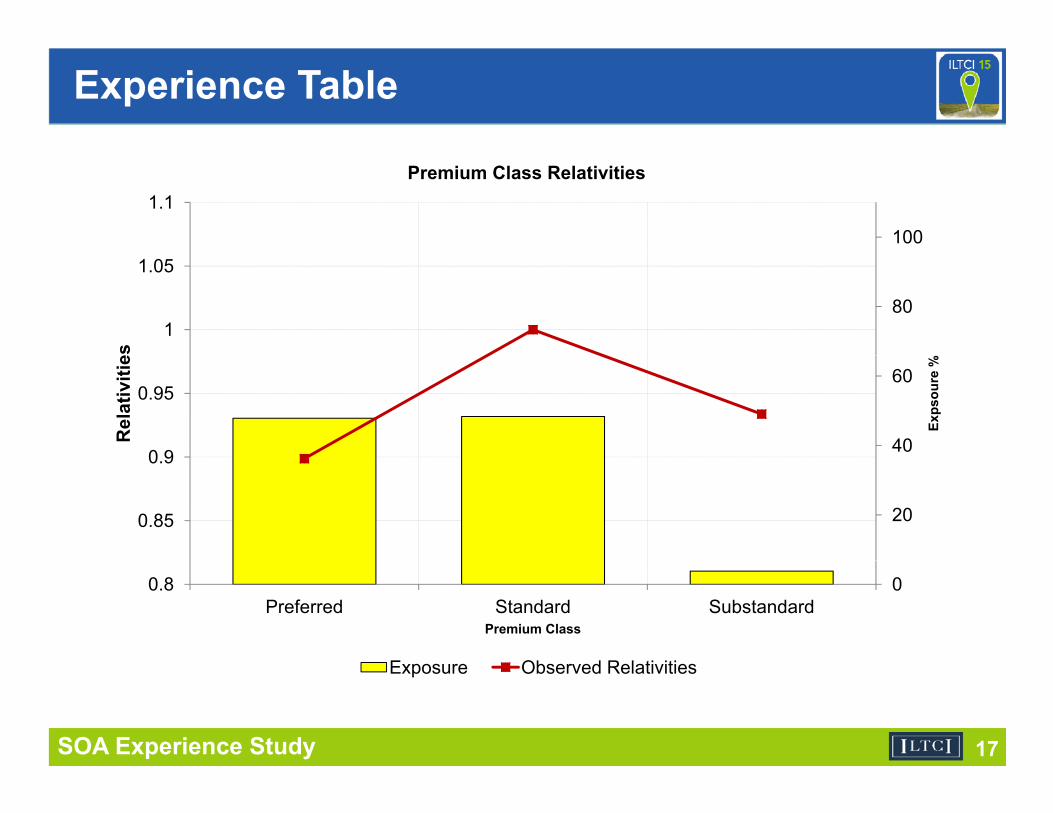
1.1Premium Class Relativities
801
1.05
es
40
60
0 9
0.95
Exps
oure
%
Rel
ativ
itie
200.85
0.9
00.8Preferred Standard Substandard
Premium Class
E Ob d R l ti iti
SOA Experience Study 17
Exposure Observed Relativities

Experience Table
100
1.1
Premium Class Relativities
80
1
1.05
s
40
60
0 9
0.95
Exps
oure
%
Rel
ativ
ities
200.85
0.9
00.8Preferred Standard Substandard
Premium Class
SOA Experience Study 18
Exposure Model Relativities

Experience Table
• Claim incidence model interactions:Gender by incurred age– Gender by incurred age
– Tax qualified by policy durationCoverage by incurred age– Coverage by incurred age
– Region by daily benefitU d iti l b li d ti– Underwriting class by policy duration
– Underwriting type by policy durationM it l t t b i d– Marital status by incurred age
SOA Experience Study 19

Experience Table
7
8
2.4
2.6Incurred Age interacted with Marital Status
5
6
7
1 8
2
2.2
es
3
4
1.4
1.6
1.8
Expo
sure
%
Rel
ativ
itie
1
2
0.8
1
1.2
00.6
35-
36 37 38 39 40 41 42 43 44 45 46 47 48 49 50 51 52 53 54 55 56 57 58 59 60 61 62 63 64 65 66 67 68 69 70 71 72 73 74 75 76 77 78 79 80 81 82 83 84 85 86 87 88 89 90 91 92 93 94 95 96 97 98 9910
0+
Incurred Age
E M it l St t (M i d) M it l St t (Si l )
SOA Experience Study 20
Exposure Marital_Status (Married) Marital_Status (Single)

Experience Table
Example of model fit: by attained age8
Predicted Values - IncurredAge
6
7
9%
11%
4
5
5%
7%
2
3
1%
3%
0
1
-3%
-1%
5- 37 39 41 43 45 47 49 51 53 55 57 59 61 63 65 67 69 71 73 75 77 79 81 83 85 87 89 91 93 95 97 99
SOA Experience Study 21
35 3 3 4 4 4 4 4 5 5 5 5 5 6 6 6 6 6 7 7 7 7 7 8 8 8 8 8 9 9 9 9 9
Exposure Observed Average Fitted Average
Experience Table
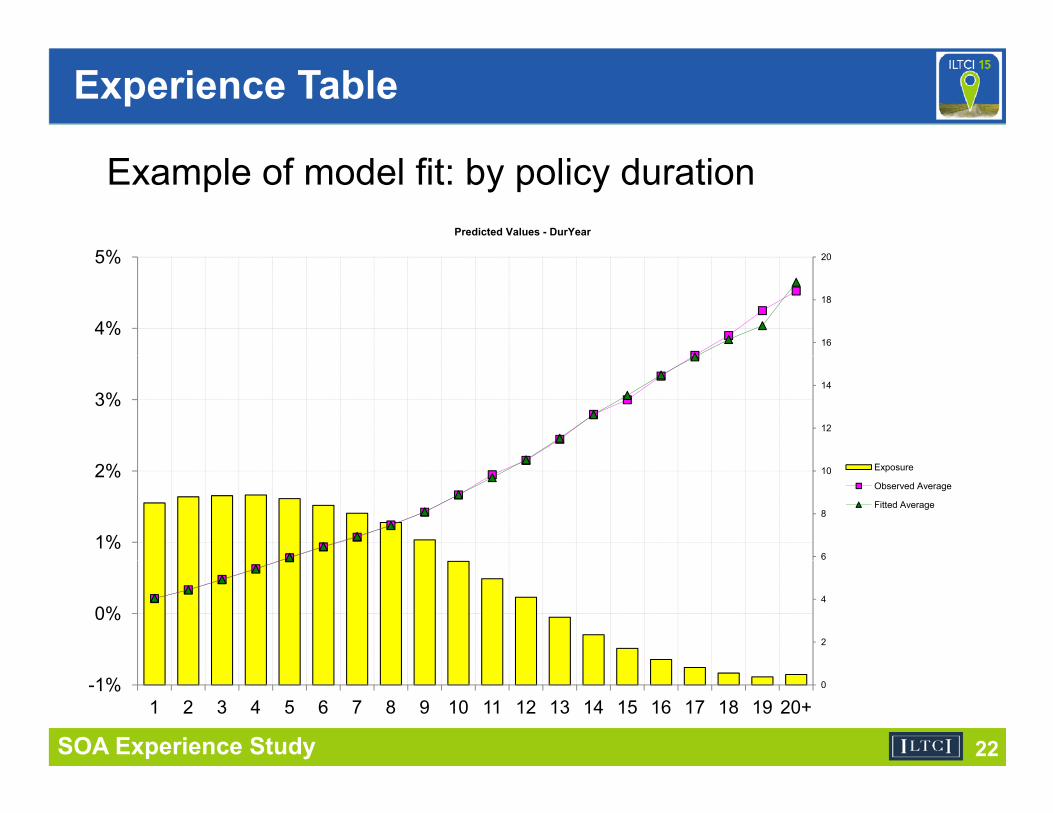
Example of model fit: by policy duration
5%Predicted Values - DurYear
16
18
20
4%
5%
12
14
3%
6
8
10
1%
2% Exposure
Observed Average
Fitted Average
2
4
0%
SOA Experience Study 22
0-1%1 2 3 4 5 6 7 8 9 10 11 12 13 14 15 16 17 18 19 20+

Experience Table
Example of model fit: by issue age1414%
10
12
8%
10%
12%
6
8
4%
6%
8%
Exposure
4
6
0%
2%
4% Observed Average
Fitted Average
0
2
-4%
-2%
0%
- 7 9 3 5 7 9 3 5 7 9 3 5 7 9 3 5 7 9 3 +
SOA Experience Study 23
35-
37 39 41 43 45 47 49 51 53 55 57 59 61 63 65 67 69 71 73 75 77 79 81 83 85+

Experience Table
Example of model fit: by issue year25
5%
20
3%
4%
152%
3%
10
0%
1%Exposure
Observed Average
Fitted Average
5
2%
-1%
SOA Experience Study 24
0-2%
1988
1989
1990
1991
1992
1993
1994
1995
1996
1997
1998
1999
2000
2001
2002
2003
2004
2005
2006
2007
2008
2009
2010
2011

A t l E t d I id h ld t l
Experience Table
1200000
1400000
80
90Actual vs Expected Incidence on hold-out sample
800000
1000000
50
60
70
reer 1
000)
400000
600000
30
40
50
Exps
our
ncid
ence
(pe
200000
400000
10
20
In
00
<=0.
266
>0.2
66, <
=0.4
14
>0.4
14, <
=0.5
72
>0.5
72, <
=0.7
5
>0.7
5, <
=0.9
59
>0.9
59, <
=1.2
1
>1.2
1, <
=1.5
3
>1.5
3, <
=1.9
3
>1.9
3, <
=2.4
4
>2.4
4, <
=3.1
1
>3.1
1, <
=4
>4, <
=5.1
9
>5.1
9, <
=6.8
3
>6.8
3, <
=9.0
8
>9.0
8, <
=12.
3
>12.
3, <
=16.
9
>16.
9, <
=23.
8
>23.
8, <
=35
>35,
<=5
5.9
>55.
9
Expected Incidence (per '000)
SOA Experience Study 25
p (p )
Exposure Observed Expected

Experience Table
Back-testing by company• This graph shows a comparison of observed vs.
di t d i id t b i th t dpredicted incidence rates by company in the study• While the factor “company” is not in the model,
observed and predicted are closeobserved and predicted are close• This indicates that most differences between
observed incidence rates can be attributed to differences in composition of business (age, gender, marital status, duration, underwriting type etc.) among the companiesamong the companies
• Note that company codes have been anonymized
SOA Experience Study 26

Experience TableB k t ti b
3.5%Predicted Values - Company_Code
Back-testing by company
2.5%
3.0%
1 0%
1.5%
2.0%
0 0%
0.5%
1.0%
-1.0%
-0.5%
0.0%
SOA Experience Study 27
%1 2 3 4 5 6 7 8 9 10 11
Observed Average Fitted Average

Experience Table
Other models to be released• Claim terminationC a e a o
– Total termination with diagnosis & claim type– Total termination without diagnosis or claim type– Termination due to death with diagnosis & claim type– Termination due to death without diagnosis or claim type
• Claim utilization– With diagnosis & claim type
Wi h di i l i– Without diagnosis or claim type
SOA Experience Study 28
Benefit period factor analysis
• Impact of benefit period on incidence was inconsistent with expectation
• Slightly higher incidence for limited BP – (less than 1.5% for active life model)
• Significant discussion / investigation about relationship
• Note: for claim termination and claim utilization, – lifetime BP yields higher morbidity costs
SOA Experience Study 29

Benefit period factor analysis
70
80
5%
6%
50
60
4%
30
40
2%
3%
10
20
1%
2%
0-1%0-1 1-2 2-3 3-4 4-5 5-6 6+ Lifetime
E Ob d A Fitt d A
SOA Experience Study 30
Exposure Observed Average Fitted Average

Benefit period factor analysis
4.0%
4.5%
3.0%
3.5%
2.0%
2.5% Company 1Company 2Company 3C 4
1.0%
1.5%Company 4
0.0%
0.5%
SOA Experience Study 31
<3 3-4 4-5 5+ Lifetime

Benefit period factor analysis
8%
9%
10%
Limited vs Lifetime Incidence Rate
6%
7%
8% Limited vs Lifetime Incidence Rate by Attained Age
4%
5%
1%
2%
3%
0%
1%
65 66 67 68 69 70 71 72 73 74 75 76 77 78 79 80 81 82 83 84 85 86 87 88 89 90 91
Lif ti A t l Li it d A t l
SOA Experience Study 32
Lifetime Actual Limited Actual

Benefit period factor analysis
3.0%
3.5%
Limited vs Lifetime Incidence Rate
2.0%
2.5%
Limited vs Lifetime Incidence Rate by Policy Duration
1.5%
2.0%
0.5%
1.0%
0.0%1 2 3 4 5 6 7 8 9 10 11 12 13 14
Limited Actual Lifetime Actual
SOA Experience Study 33
Limited Actual Lifetime Actual

Benefit period factor analysis
3.0%
3.5%
Limited vs Lifetime Incidence Rate
2 0%
2.5%
Limited vs Lifetime Incidence Rate by Policy Duration
1.5%
2.0%
0.5%
1.0%
0.0%1 2 3 4 5 6 7 8 9 10 11 12 13 14
Limited Actual Limited Model Lifetime Actual Lifetime Model
SOA Experience Study 34
Limited Actual Limited Model Lifetime Actual Lifetime Model
Experience Table
Potential Drivers• Other factors account for differencesO e ac o s accou o d e e ces• Coding of BP data received (internal vs external)• Other factors not considered Examples couldOther factors not considered. Examples could
include:– Company sales distribution modelp y– Company specific underwriting guidelines– Mixture of companies included in study– etc
SOA Experience Study 35

Special Thanks
Steering Committee• Sheryl Babcock• Barry Koklefsky
Society of Actuaries• Cynthia MacDonald• Muz Waheedy y
• Susan Oberman Smith• Eric Perry• Eric Poirier
• Korrel Rosenberg• Erika Schulty
• Eric Poirier• Jon Prince• Steve Schoonveld
M Sh h• Maureen Shaughnessy• Bruce Stahl• Kevin Waterman• Perry Wiseblatt• Bob Yee
SOA Experience Study 36

Special Thanks - Participants
• Allianz• Berkshire Life
C lP
• United of Omaha• New York Life
N th t M t l• CalPers• Continental Casualty• Fortis
• Northwestern Mutual• Penn Treaty• PrudentialFortis
• Genworth Financial• John Hancock
Prudential• Senior Health• State Farm
• Lincoln Benefit Life• Mass Mutual
M Lif
• Thrivent AAL• Thrivent LB
T i A• MetLife• Mutual of Omaha
• Transamerica – Aegon• UNUM
SOA Experience Study 37

Wrap Up
• Questions?
Location of Aggregate Database Reporthttps://soa org/Research/Experience Study/Ltc/researchhttps://soa.org/Research/Experience-Study/Ltc/research-ltc-study-2000-11-aggregrated.aspx
SOA Experience Study 38
Related Documents