Snow accumulation rate on Qomolangma (Mount Everest), Himalaya: synchroneity with sites across the Tibetan Plateau on 50–100 year timescales Susan KASPARI, 1 Roger LeB. HOOKE, 1 Paul Andrew MAYEWSKI, 1 Shichang KANG, 2,3 Shugui HOU, 2 Dahe QIN 2 1 Climate Change Institute and Department of Earth Sciences, University of Maine, Orono, Maine 04469, USA E-mail: [email protected] (for dating and meteorological interpretations) E-mail: [email protected] (for numerical model and other calculations) 2 Key Laboratory of Cryosphere and Environment, Chinese Academy of Sciences, Lanzhou 730000, China 3 Institute of Tibetan Plateau Research, Chinese Academy of Sciences, Lanzhou 730000, China ABSTRACT. Annual-layer thickness data, spanning AD 1534–2001, from an ice core from East Rongbuk Col on Qomolangma (Mount Everest, Himalaya) yield an age–depth profile that deviates systematically from a constant accumulation-rate analytical model. The profile clearly shows that the mean accumulation rate has changed every 50–100 years. A numerical model was developed to determine the magnitude of these multi-decadal-scale rates. The model was used to obtain a time series of annual accumulation. The mean annual accumulation rate decreased from 0.8 m ice equivalent in the 1500s to 0.3 m in the mid-1800s. From 1880 to 1970 the rate increased. However, it has decreased since 1970. Comparison with six other records from the Himalaya and the Tibetan Plateau shows that the changes in accumulation in East Rongbuk Col are broadly consistent with a regional pattern over much of the Plateau. This suggests that there may be an overarching mechanism controlling precipitation and mass balance over this area. However, a record from Dasuopu, only 125km northwest of Qomolangma and 700 m higher than East Rongbuk Col, shows a maximum in accumulation during the 1800s, a time during which the East Rongbuk Col and Tibetan Plateau ice-core and tree-ring records show a minimum. This asynchroneity may be due to altitudinal or seasonal differences in monsoon versus westerly moisture sources or complex mountain meteorology. INTRODUCTION Ice cores from the mid-latitudes provide an extended record of the Earth’s climate in a densely inhabited part of the globe where instrumental records are short and other proxy records sparse. Records from the Himalaya and Tibetan Plateau are of special interest for the information they contain about the variability of the Asian monsoon. Previous studies have demonstrated that there is a significant difference in the isotopic composition (d 18 O, dD, deuterium excess) of precipitation across the Tibetan Plateau (Aragua ´s-Aragua ´s and others, 1998; Tian and others, 2001, 2003). This difference has been used to infer that precipitation in northern regions of the Plateau originates from continental moisture sources, whereas in southern regions it is primarily controlled by the strength of the Asian monsoon. Herein we present an ice-core accumulation record from East Rongbuk Col on Qomo- langma (Mount Everest), Himalaya, that bears century-scale similarities to records from the Puruogangri ice cap in the central Tibetan Plateau and from Dunde and Guliya ice caps on the northeastern and northwestern margin of the Plateau, respectively. These similarities suggest that, despite the isotopic variations, there may be a common overarching mechanism controlling accumulation across the Plateau. The 108 m ice core studied was retrieved from East Rongbuk Col (28.038 N, 86.968 E; 6518 m a.s.l.) on the north- east ridge of Qomolangma in 2002 (Kaspari and others, 2007) (Fig. 1). Each core segment was weighed and the density determined to within 5%, assuming a constant core diameter. A density–depth profile was constructed and fitted with a polynomial. The ice-equivalent thickness of each annual layer was determined from this function. Henceforth all depths mentioned will be ice equivalent. The ice- equivalent length of the core was 96.7 m. The core was melted into 3123 samples, each of which was analyzed for soluble ions (Na + ,K + , Mg 2+ , Ca 2+ , Cl – , NO 3 – , SO 4 2– ) using ion chromatography, hydrogen isotopes (dD) using mass spectrometry, and 32 trace elements using inductively coupled plasma mass spectrometry (Osterberg and others, 2006). Strong monsoon activity during the summer results in more depleted heavy isotopes (more negative dD), and is commonly referred to as the amount effect (Tian and others, 2001, 2003). Dust source elements (e.g. Ca, Al, Fe, Ti) in this region peak during the winter and spring due to unstable atmospheric conditions and strong winds. Owing to the relatively high accumulation rate (0.52 m a –1 ), seasonal variations in dD, soluble ions and trace elements are well preserved in the core, and were used to date ice in the core by counting annual layers. We found that ice at a depth of 86.84 m was deposited in AD 1534 5 years (Fig. 2). The timescale was verified by using the first high-resolution measurements of bismuth (Bi) on an Asian ice core to identify major volcanic horizons, including Pinatubo, Agung and Tambora (Kaspari and others, 2007). Dating uncertainties are estimated to be 0 years at 1963 (20 samples per year) based on a volcanic Bi horizon from the Agung (Indonesia) eruption, and 5 years at 1534 (4 samples per year). Journal of Glaciology, Vol. 54, No. 185, 2008 343

Welcome message from author
This document is posted to help you gain knowledge. Please leave a comment to let me know what you think about it! Share it to your friends and learn new things together.
Transcript
Snow accumulation rate on Qomolangma (Mount Everest)Himalaya synchroneity with sites across the Tibetan Plateau
on 50ndash100 year timescales
Susan KASPARI1 Roger LeB HOOKE1 Paul Andrew MAYEWSKI1 Shichang KANG23
Shugui HOU2 Dahe QIN2
1Climate Change Institute and Department of Earth Sciences University of Maine Orono Maine 04469 USAE-mail susankasparimaineedu (for dating and meteorological interpretations)
E-mail rhookeverizonnet (for numerical model and other calculations)2Key Laboratory of Cryosphere and Environment Chinese Academy of Sciences Lanzhou 730000 China
3Institute of Tibetan Plateau Research Chinese Academy of Sciences Lanzhou 730000 China
ABSTRACT Annual-layer thickness data spanning AD1534ndash2001 from an ice core from East RongbukCol on Qomolangma (Mount Everest Himalaya) yield an agendashdepth profile that deviates systematicallyfrom a constant accumulation-rate analytical model The profile clearly shows that the meanaccumulation rate has changed every 50ndash100 years A numerical model was developed to determine themagnitude of these multi-decadal-scale rates The model was used to obtain a time series of annualaccumulation The mean annual accumulation rate decreased from 08m ice equivalent in the 1500sto 03m in the mid-1800s From 1880 to 1970 the rate increased However it has decreased since1970 Comparison with six other records from the Himalaya and the Tibetan Plateau shows that thechanges in accumulation in East Rongbuk Col are broadly consistent with a regional pattern over muchof the Plateau This suggests that there may be an overarching mechanism controlling precipitation andmass balance over this area However a record from Dasuopu only 125 km northwest of Qomolangmaand 700m higher than East Rongbuk Col shows a maximum in accumulation during the 1800s a timeduring which the East Rongbuk Col and Tibetan Plateau ice-core and tree-ring records show a minimumThis asynchroneity may be due to altitudinal or seasonal differences in monsoon versus westerlymoisture sources or complex mountain meteorology
INTRODUCTION
Ice cores from the mid-latitudes provide an extended recordof the Earthrsquos climate in a densely inhabited part of the globewhere instrumental records are short and other proxyrecords sparse Records from the Himalaya and TibetanPlateau are of special interest for the information theycontain about the variability of the Asian monsoon
Previous studies have demonstrated that there is asignificant difference in the isotopic composition (d18OdD deuterium excess) of precipitation across the TibetanPlateau (Araguas-Araguas and others 1998 Tian andothers 2001 2003) This difference has been used to inferthat precipitation in northern regions of the Plateauoriginates from continental moisture sources whereas insouthern regions it is primarily controlled by the strengthof the Asian monsoon Herein we present an ice-coreaccumulation record from East Rongbuk Col on Qomo-langma (Mount Everest) Himalaya that bears century-scalesimilarities to records from the Puruogangri ice cap in thecentral Tibetan Plateau and from Dunde and Guliya icecaps on the northeastern and northwestern margin of thePlateau respectively These similarities suggest thatdespite the isotopic variations there may be a commonoverarching mechanism controlling accumulation acrossthe Plateau
The 108m ice core studied was retrieved from EastRongbuk Col (28038N 86968 E 6518masl) on the north-east ridge of Qomolangma in 2002 (Kaspari and others2007) (Fig 1) Each core segment was weighed and the
density determined to within5 assuming a constant corediameter A densityndashdepth profile was constructed and fittedwith a polynomial The ice-equivalent thickness of eachannual layer was determined from this function Henceforthall depths mentioned will be ice equivalent The ice-equivalent length of the core was 967m
The core was melted into 3123 samples each of whichwas analyzed for soluble ions (Na+ K+ Mg2+ Ca2+ ClndashNO3
ndash SO42ndash) using ion chromatography hydrogen isotopes
(dD) using mass spectrometry and 32 trace elements usinginductively coupled plasma mass spectrometry (Osterbergand others 2006) Strong monsoon activity during thesummer results in more depleted heavy isotopes (morenegative dD) and is commonly referred to as the amounteffect (Tian and others 2001 2003) Dust source elements(eg Ca Al Fe Ti) in this region peak during the winter andspring due to unstable atmospheric conditions and strongwinds Owing to the relatively high accumulation rate(052mandash1) seasonal variations in dD soluble ions andtrace elements are well preserved in the core and were usedto date ice in the core by counting annual layers We foundthat ice at a depth of 8684m was deposited in AD 15345 years (Fig 2) The timescale was verified by using thefirst high-resolution measurements of bismuth (Bi) on anAsian ice core to identify major volcanic horizons includingPinatubo Agung and Tambora (Kaspari and others 2007)Dating uncertainties are estimated to be 0 years at 1963(20 samples per year) based on a volcanic Bi horizon fromthe Agung (Indonesia) eruption and 5 years at 1534(4 samples per year)
Journal of Glaciology Vol 54 No 185 2008 343
The resulting timescale provides among other things arecord of the present thicknesses of annual layers (thethickness of ice between two annual timelines) To recoveraccumulation rates from this record we need to estimate theamount by which the layers were thinned by layer-parallelextending strain as they became buried We first describe anumerical model used to estimate the amount of thinningthat has occurred and thus recover the original layerthickness We then compare the East Rongbuk Col accumu-lation-rate history with others in the region (Thompson andothers 2000 2006 Davis and Thompson 2004 Yao andYang 2004) and examine factors that may have contributedto differences between them
FLOW MODELAnalytical approachWe approximate East Rongbuk Col as a (mathematical)saddle (Fig 1) and consider the variation in vertical velocitywith depth beneath such a saddle The temperature at thebed was ndash898C (Hou and others 2004) so there is nosignificant slip there We use a coordinate system with theorigin at the surface in the middle of the saddle The x and yaxes are aligned with the axes of the saddle with x parallelto the principal direction of flow away from the saddle thez axis is vertical and pointing downward Along the xand y axes the strain rates _xy and _yx vanish Ice flowssymmetrically toward or away from the origin so thevelocities u and v in the x and y directions respectivelyreach a symmetrical minimum (of 0) at the origin Thus thestrain rates _xz _zx _yz and _zy also vanish and the effectiveshear strain rate _e becomes
_e frac14 1ffiffiffi2
p _2xx thorn _2yy thorn _2zz
12 eth1THORN
Continuity requires that
_zz frac14 _xx thorn _yy
eth2THORN
In addition in the steady state ws frac14 _b frac14 _zzH where _zz isthe depth-averaged vertical strain rate ws is the verticalvelocity at the surface _b is the ice-equivalent accumulationrate and H is the glacier thickness Thus there is a tendencyfor the geometry of the glacier surface to adjust to yield the
values of _xx and _yy that will in turn yield values of _zz andH that balance _b For example an increase in _b leads to anincrease in H and hence surface slope This in turnincreases _xx and hence _zz until _zzH frac14 _b
Because slip at the bed is negligible while both u and vare non-zero above the bed for all xy gt 0 _xx and _yy
mustdecrease with depth Here we take extension as positivefollowing the normal convention Along the y axis icesurface slopes are towards the origin from both directions so_yy will be compressive or negative Because the site is in anaccumulation area we may assume that _zz is compressivethroughout the ice column so _xx gt _yy
everywhere Thus_zzj j must decrease with depth by Equation (2) As
w zeth THORN frac14Z Hz
H_zz dz eth3THORN
any change in _zz with depth leads to a non-linear decreasein the vertical velocity w with depth (Raymond 1983)
The variation in w with depth cannot be determinedanalytically because the stresses are not known wellenough and because the value of _zz is needed tocalculate _e However using numerical modeling Raymond(1983 equation (14)) showed that the variation with depthbeneath a two-dimensional divide in an isothermal ice sheetis well described by
w frac14 ws 1 zH
m eth4THORN
with m frac14 2 If alternatively _zz were independent of depththe decrease in w would be linear and m frac14 1
The age of the ice can be determined as a function ofdepth by integrating Z
dt frac14Z
dzw eth5THORN
Carrying out the integration using Equation (4) for w yields
t frac14 Hm
m 1eth THORNws
1
H zeth THORNm1 1
Hm1
m 6frac14 10 eth6aTHORN
t frac14 Hws
lnH
H z
m frac14 10 eth6bTHORN
A least-squares fit of Equation (6a) (see Appendix (1)) toour measured agendashdepth profile yields m frac14 111 and
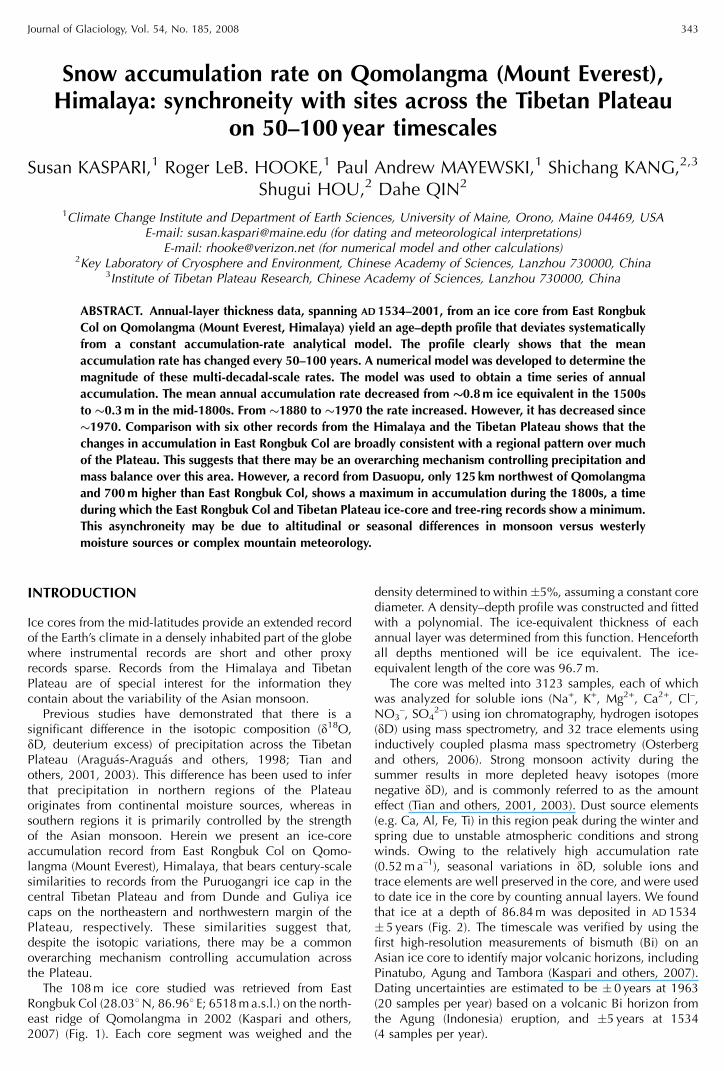
Fig 1 Location of the 2002 Qomolangma drill site in East Rongbuk Col (solid black circle) and of other ice-core sites mentioned in the text(open circles) In the panel on the right black lines are 500m contours white areas are snow and ice and gray areas are rock
Kaspari and others Snow accumulation rate on Qomolangma344
ws frac14 049mandash1 (Fig 3) The rleatively low value of msuggests that _zz is nearly constant over much of the depthand that most of the decrease in velocity occurs near the bed
The low value of m could reflect the presence of warmerice near the bed the location of the hole some distance fromthe true divide or the three-dimensional nature of the colWe used Equation (4) a temperature-dependent form ofthe flow law and the measured temperature gradientndash0008Kmndash1 between 15 and 96m in the borehole to studythe effect of temperature and found that the softening effectof warmer temperatures near the bed could account for onlya small part of the difference Similarly Raymondrsquos two-dimensional numerical results for locations greater than oneice thickness away from the divide are well approximated byEquation (4) with m 14 so our appreciably lower value isnot consistent with his modeling We thus suspect that thethree-dimensional geometry of the col is likely to beresponsible for most of the difference
However it is clear from Figure 3 that there are systematicdifferences between the model and the measured profilessuch that the accumulation rate appears to have been higherrecently and lower when the ice between 33 and 49m wasdeposited To study these further we note that breaks inslope marked by crosses in Figure 3 and clearly visible inenlarged versions of the figure occur at about AD 19351835 1720 and 1620 We thus wrote Equation (6a) inthe form
x frac14 athornwst where x frac14 Hm
m 11
H zeth THORNm1 1
Hm1
and using m frac14 111 obtained least-squares fits to the curvesegments between these pairs of dates For the fit to thesegment between 1935 and 2000 we specified a frac14 0 Theresulting values of ws are shown in Table 1
Fig 3 Measured agendashdepth profile compared with profiles calcu-lated using Equation (6a) with m frac14 101 111 and 121 andws frac14 049mandash1 Also shown is the profile calculated with m frac14 13and ws frac14 068mandash1 the solution from the equation used by Davisand others (2005) Breaks in slope in the observed timendashdepth curveare marked by +
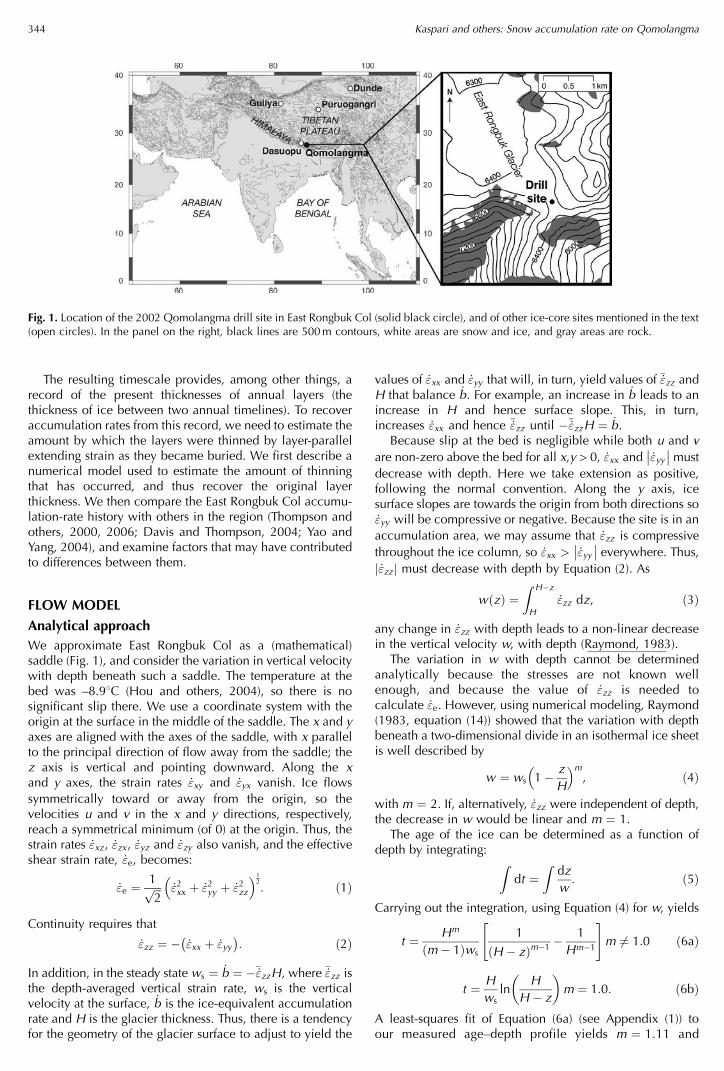
Fig 2 Example of high-resolution multi-parameter dating of the Qomolangma ice core Al Clndash Ca2+ and dD for the periods AD1650ndash601820ndash30 and 1980ndash90 are shown dD is more negative during the summer monsoon season and dust species (eg Ca2+ Al) peak in thewinterspring
Kaspari and others Snow accumulation rate on Qomolangma 345
A NUMERICAL MODELTo further analyze the systematic departures of Equation (6a)from our agendashdepth profile based on layer counting wedeveloped a numerical model This model simulates growthof the glacier from zero thickness
In a previous study Hou and others (2004) measured CH4
and 18Oatm profiles in the ice core used in this study and alsoin a slightly longer core collected from East Rongbuk Col ayear earlier in 2001 They compared the CH4 and d18Oatm
signatures in the East Rongbuk Col cores with those in theGRIP and GISP2 cores two gt3000m cores from centralGreenland They estimated that ice 06ndash09m above the bedin the 2002 East Rongbuk Col core and 005ndash18m abovethe bed in the 2001 core dated to between 50 BC andAD 500
To provide spin-up time for the model we assumed thatthe col was free of snow 4000 years ago and began ourintegration then (A sensitivity study discussed below showsthat this assumption has no significant effect on our results)We then allowed ice to accumulate at a rate _b teth THORNmandash1 andto flow away at a rate that resulted in thinning
To determine the rate of thinning we note that when iceis frozen to the bed laminar flow theory gives a depth-averaged velocity u of
u frac14 2n thorn 2
SfgB
n
Hnthorn1 eth7THORN
where is the slope of the glacier surface Sf is a shapefactor is the density of ice and g is the acceleration due togravity (Nye 1952 Hooke 2005 p 87) Neglecting thesmall change in H as we move away from the divide andtaking the derivative of u with respect to x gives
dudx
frac14 2nn thorn 2
SfgB
n
n1Hnthorn1 ddx
eth8THORN
and similarly for dv=dy Over a short distance from thedivide noting that frac14 0 at the divide we can approximate by x 2 where x is the slope at x frac14 x Then d dx isx x and Equation (8) becomes
dudx
frac14 _xx frac14 2nn thorn 2
Hnthorn1
2n1
SfgB
nnx
x eth9THORN
A similar relation would apply for _yy Thus using Equa-tion (2) we assume that
_zz Sfeth THORNn eth10THORNwhere is a measure of the excess of the (positive)longitudinal slope over the (negative) transverse slope in thecol and the constant of proportionality (with n frac14 3) is
3H4
10gB
3 eth11THORN
As ws frac14 _zzH we then have
ws frac14 03H5 SfgB
3
eth12THORN
The vertical velocity at any depth is then calculated fromEquation (4) with m frac14 111
To run the model one first enters the accumulation rate asa function of time and guesses a value of Sf In the initialyear 2000 BC a layer of ice is deposited on the bedrock anda new ice thickness is calculated as isws from Equation (12)For the first layer this ws is simply subtracted from thethickness and the new z coordinate of the top of the layeris saved Another layer of ice is then added For this andsubsequent layers Equations (4) and (12) are used to de-termine w at the level of each previously deposited layerand the elevation of each such layer is adjusted accordinglyAt the end of 4000 years of accumulation the ice thicknessis compared with the measured value of 967m and thevalue of Sf is adjusted accordingly Once the calculatedand measured thicknesses are in agreement within 005mwhen Sf is specified to five decimal places the resultingagendashdepth profile is compared with the measured one
For the initial run of the model we used the accumu-lation history from the above least-squares analysis (Table 1row 2) with m frac14 111 For the period prior to that coveredby the layer-counting data we used the weighted mean ofthe other accumulation rates (Table 1) The agreement withthe measured profile is quite good though the calculatedcurve falls slightly below the observed one (Fig 4) This isprobably because the least-squares fits tend to give too muchweight to transitional regions in the vicinity of the breakpoints By making small adjustments in the accumulationpattern and seeking new values of Sf that gave a satis-factory agreement with the measured thickness we wereable to obtain a significantly better fit (Fig 4) The resultingaccumulation rates are shown in the third row of Table 1 Inthe basal ice where we did not have layer-counting data toconstrain the accumulation rate we again used theweighted mean of the other values
The model dates for the basal ice in our core are AD776 at06m above the bed and AD 900 at 09m These ages are300ndash400 years younger than the younger limit (AD 500)estimated by Hou and others (2004) but are within theuncertainty in their approach
Also shown in Figure 4 is the ice thickness as a function oftime The glacier reached a thickness of 94467m ie (iceequivalent) after 542 years of integration starting at 2000 BC
(not shown) and owing to the constant accumulation rateassumed maintained this thickness until AD 1535 when wechanged the accumulation rate Thereafter it asymptoticallyapproached a new equilibrium thickness some years aftereach change in accumulation rate According to the model
Table 1 Accumulation rates (m andash1) during time intervals (AD) for the values of m shown in the lefthand column
m 2000 BCndashAD1535 1535ndash1620 1620ndash1720 1720ndash1835 1835ndash1935 1935ndash2000
101 052 055 042 039 029 064111 (by least squares) 053 077 053 046 033 069111 (model) 052 080 050 044 030 066121 052 110 058 049 031 068
Kaspari and others Snow accumulation rate on Qomolangma346
the first 542 years of accumulation is represented today bythe basal 3mm of ice and the first 2000 years by the basal67mm
Lastly we divided the final thickness of each ice layer byits original thickness to illustrate in Figure 4 the verticalshortening experienced by each layer as a function of depth
To investigate the effect of the initial condition (no ice at2000 BC) on the results we also ran a model starting at500 BC With the same accumulation pattern and values ofmand used previously results were essentially identical tothose in Figure 4 to within 00002 from AD700 to thepresent Thus our initial condition that the col was ice-free4000 years ago appears to have no effect on the final results
As a sensitivity test we also ran the model with m frac14 101and 121 (Fig 3) To match the observed accumulationpattern we then had to alter the accumulation rate by a fewcentimeters per year near the top of the core and a fewdecimeters per year near the bottom (Table 1) The yearAD 1535 is at a depth of 8656m in our reference model(m frac14 111) With m frac14 101 and 121m the year AD 1535occurs 063m higher and 014m lower respectively
ACCUMULATION-RATE HISTORYTo study variations in accumulation rate from year to yearwe divided the measured thickness of each layer by thenormalized layer thickness at the appropriate depth (Fig 5)As already anticipated from the above results (Table 1) theaccumulation rate decreases from AD1534 to 1880 andthen increases until 1970 (Fig5) In the following30 years it decreases again The decreasing trend inaccumulation since AD 1534 is consistent with the Clndash
and Ca2+ record from this core Clndash (from marine sources)has decreased and Ca2+ (from continental sources) has
increased since AD 1400 suggesting a decrease in north-ward incursions of the summer South Asian monsoon(Kaspari and others 2007)
Errors in picking boundaries between annual layers areunlikely to be responsible for these century-scale trendsMissing an annual layer would result in an apparentdoubling of the accumulation rate for that year andconversely Few such anomalies are observed in the datingand such errors would have little effect on the long-termaverages However the dating uncertainty increases withdepth in the core Thus it is possible that the higheraccumulation rates particularly prior to AD1600 could bein part an artifact of having missed some annual layersConsequently in the following discussion we focus primar-ily on the record since AD 1600
On a multi-decadal timescale the variations in climatethat are most likely to affect the accumulation rate arechanges in temperature and atmospheric circulation thatalter the amount and pattern of precipitation Increasedconcentrations of greenhouse gases for example areprojected to result in warming of the Indian Ocean anincrease in precipitation in the region affected by the Asianmonsoon and a change in Asian monsoon circulation (egUeda and others 2006 Kripalani and others 2007) Rain-gauge data indicate that the amount of monsoon rainfall inIndia has remained fairly stable since 1871 (Parthasarathyand others 1995) however there has been a trend towardan increase in frequency and magnitude of extreme events incentral India since the 1950s This trend is associated withwarmer summer sea surface temperatures (Goswami andothers 2006)
Thus the 20th-century increase in accumulation in EastRongbuk Col could be associated with recent changes inmonsoon dynamics If this is the case a similar accumulation
Fig 4 Output of the numerical model (b) is an enlargement of the area in the dashed box in (a) Of the three timendashdepth curves the thickgray curve is based on our layer counting and the two black curves are from our numerical model The dashed black curve uses theaccumulation rates determined by least squares and the solid black curve uses accumulation rates obtained by trial and error that bettermatch the observed curve Breaks in slope in the observed timendashdepth curve are marked by + (Use the top and left axes for normalized layerthickness and the bottom and right axes for ice thickness)
Kaspari and others Snow accumulation rate on Qomolangma 347
increase would be expected in other Asian ice cores that arestrongly influenced by the monsoon However regionaldifferences in accumulation patterns may occur due tovariations in atmospheric circulation and hence precipi-tation patterns
COMPARISON WITH OTHER ASIAN ICE-COREACCUMULATION-RATE HISTORIESOur accumulation-rate time series is broadly similar to thosederived from four other ice cores from the Tibetan Plateau(Fig 5) Before discussing this in detail however weconsider the extent to which differences in the method ofanalysis may have affected the results
In previous studies of accumulation rates using Asian icecores (Thompson and others 1989 2000 Yao and Yang2004 Davis and others 2005) the authors have fitted afunction of the form
zeth THORN frac14 0 1 zH
pthorn1eth13THORN
to observed layer-thickness data and then calculated theoriginal thickness of each layer by comparing the calculatedwith the observed thickness Here (z) is the layer thicknessas a function of depth z 0 is the layer thickness at z frac14 0(the ice-equivalent accumulation rate) and p is a fittingparameter The papers by Thompson and others (19892000) and by Davis and others (2005) attribute Equation (13)to Bolzan (1985) although it does not appear in his paperit can be derived from equations appearing there (see
Appendix (2)) Equation (13) is very similar to our Equa-tion (4) but layer thicknesses are substituted for w and wsThese substitutions are logical in a steady state ws frac14 0and at depth z vertical velocity w(z) must be sufficient tomove the top of layer (z) down one layer thickness in ayear Based on comparison of Equations (4) and (13) it isclear that p frac14 m ndash 1
Davis and others (2005 equation (2)) point out thatEquation (13) can be solved for p and ws if annual layers attwo different depths can be dated accurately (see Appendix(3)) However when we do this for the respective segmentsof our agendashdepth curves between successive break pointswe get values of m that range from 07 to 29 As m shouldnot vary significantly with time unless the divide has movedseveral ice thicknesses and as m lt 1 is physically unreal-istic (see Appendix (4)) this approach is not suitable in ourcase Furthermore if we solve for p and ws using datedlayers at the top and bottom of the core the values obtainedp frac14 03 (m frac14 13) and ws frac14 068mandash1 yield an agendashdepthprofile (Fig 3) that is in quite poor agreement with theobserved profile
Were we to have used only Equation (13) in ourmodeling we would have ignored the obvious breaks inslope in the curve of age versus depth obtained from layercounting (Figs 3 and 4) For example if we calculate layerthicknesses from Equation (13) and the values of m and ws
(111 and 046mandash1 respectively) from our least-squares fitto obtain p (= m ndash 1) and 0 (= ws) (see Appendix (5)) theresulting accumulation rates from AD1550 to 1900 aresystematically 01ndash02mandash1 higher than those in Figure 5
Fig 5 Reconstructed Tibetan Plateau precipitation record from tree rings (Wu 1995) and ice-core accumulation-rate time series fromDunde (Davis and Thompson 2004) Guliya (Yao and Yang 2004) Puruogangri (Thompson and others 2006) East Rongbuk Col (Kaspariand others 2007 this work) and Dasuopu (Thompson and others 2000) The horizontal line through each time series is the average and thegray shaded regions denote below-average accumulation
Kaspari and others Snow accumulation rate on Qomolangma348
with differences being greatest during years with the highestaccumulation rates (Fig 6) However the long-term trendsare the same
Lacking the original layer-thickness data and informationon how Equation (13) was implemented (least-squares or atwo-point approximation) for the other sites we cannotassess the extent to which accumulation rates calculatedusing Equation (13) would differ from those obtained fromour numerical model For example if agendashdepth profiles likeFigure 3 for the other sites did not have any breaks in slopeand if a least-squares approach was used to obtain p theapproaches would be essentially identical However theprolonged periods during which accumulation deviatessystematically from the mean in the other records (Fig 5)suggest that agendashdepth profiles for these sites would containbreaks in slope
As noted our accumulation-rate time series is similar tothose from Guliya (6200masl) (Yao and Yang 2004) andDunde (5325masl) (Thompson and others 1989) ice capson the northern edge of the Tibetan Plateau and fromPuruogangri ice field (5970masl) (Thompson and others2006) at the western end of the Tanggula range 700 kmnorth-northeast of Qomolangma (Figs 1 and 5) inasmuch asall show a gradual decline over two to three centuriesfollowed by an increase starting in the late 1800s to early1900s and then a decline in the late 1900s The significanceof this correspondence is not clear however given thepotential for substantial differences in moisture source andtransport between the Himalaya and the northern TibetanPlateau Our time series is most similar to a precipitationrecord derived from a composite tree-ring record (Wu 1995)from lower elevations (3000ndash4000m) on the Plateau (Fig 5)As this record is from sites scattered over the Plateau it mayimply that despite the potential differences in moisturetransport correspondence between the several records fromthe northern part of the Plateau and that from East RongbukCol is more than coincidental
Paradoxically the period of rising accumulation ratesbroadly coincides with a period of retreat of glaciersworldwide including those in the Himalaya (eg Mayewskiand Jeschke 1979 Yao and others 2004) This retreat in theHimalaya particularly in the late 1800s and early 1900s
may be a response to past changes in climate includinglower accumulation during the 1800s andor warmingfollowing the cooler Little Ice Age However the continuingrecent retreat of many glaciers in the Himalaya and on theTibetan Plateau during a time when accumulation rateshave increased suggests that glaciers now are respondingmore to temperature than to accumulation This is consistentwith the conclusion reached by Thompson and others(2006) that glacier retreat in the tropics and subtropics iscaused by rising air temperature rather than reducedprecipitation
However on Dasuopu glacier (7200masl) 125 kmnorthwest of Qomolangma accumulation appears to havebeen highest between 1800 and 1880 (Thompson andothers 2000) a period during which it was relatively lowelsewhere Given that the Dasuopu record is that closest toEast Rongbuk Col this difference is puzzling Previousauthors have suggested that variations in snow accumulationat Dasuopu are related to the intensity of the Asian monsoon(Thompson and others 2000 Davis and Thompson 2004Duan and others 2006) the regional Hadley circulation(Zhao and Moore 2002) or weakening of the Pacific tradewinds (Zhao and Moore 2006) If ice-core accumulation-rate time series are representative of large-scale atmosphericcirculation processes such as these one would not expectsuch large differences between the Dasuopu and EastRongbuk Col records It seems unlikely that uncertaintiesrelated to the application of Equation (13) could explain sopronounced a difference Other factors that could contributeto such differences include
Different moisture trajectoriesThe majority of precipitation in the Himalaya is de-posited between June and September during the summermonsoon In the western Himalaya moisture comesdirectly from the Arabian Sea (Fig 1) while in the east itis transported from the Arabian Sea across southern Indiato the Bay of Bengal and thence northward along theBrahmaputra river valley (Lin and Wu 1990 Shresthaand others 2000) Davis and Thompson (2004) suggestthat Dasuopu is located close to the dividing pointbetween these two moisture regimes Thus Dasuopu
Fig 6 Accumulation rate for the East Rongbuk Col ice core calculated with the numerical model (solid line) and with Equation (13) (dashedline) and the difference between the two
Kaspari and others Snow accumulation rate on Qomolangma 349
may be more heavily influenced by the western moistureregime and East Rongbuk Col by the eastern oneHowever the East Rongbuk Col annual accumulationrate since 1871 is significantly correlated with the all-India Precipitation (Parthasarathy and others 1995) inregions of northwest India (n frac14 131 p lt 0005 westernUttar Pradesh (r frac14 022) Haryana Chandigarh andDelhi (r frac14 026) and Punjab (r frac14 024)) suggesting thatthe western moisture regime may indeed be an import-ant control on East Rongbuk Col accumulation
Moisture associated with the westerlies during non-monsoon periods could contribute to the differencesbetween the two records Although winter depositionhas been thought to make only a small contribution tothe net budget in the Himalaya recent research suggeststhat winter precipitation events may account for asubstantial amount of the annual precipitation atDasuopu (Tian and others 2005) and increased earlywinter snowfall was identified as a possible cause forthe higher accumulation at Dasuopu during the 1800s(Davis and others 2005) The Dasuopu drill site(7200masl) is higher than the East Rongbuk Colsite (6518masl) and the mean accumulation fromAD1534 to 1997 is greater at Dasuopu (080m forcore 2 099m for core 3) than at East Rongbuk Col(052m) The higher accumulation at Dasuopu may becaused by larger contributions of winter snow depositionfrom the westerlies at higher elevations and couldaccount for the differences in the Dasuopu and EastRongbuk Col records In this case the accumulationrecord from East Rongbuk Col may be a better proxy forsummer monsoon variability and that from Dasuopu forwinter snow deposition from westerly sources
Complex mountain meteorologyThe large vertical relief and complicated topography inthe Himalaya influence the distribution of precipitationthrough localized storms strong orographic effects anddrifting Previous studies of the spatial variability ofprecipitation in Nepal (Sankar-Rao and others 1996) andIndia (Parthasarathy and others 1995 Goswami andothers 2006) demonstrated that precipitation may behighly variable over short distances For example theaccumulation-rate time series from two ice cores drilled100m apart at Dasuopu show similar long-term trendsbut on shorter timescales there are systematic differencesbetween the two records (Thompson and others 2000)(Fig 5 Dasuopu cores 2 and 3)
If non-monsoon westerly sources are insignificant at bothEast Rongbuk Col and Dasuopu so accumulation at bothis controlled by monsoon moisture sources the differ-ences between them during the 19th century wouldrequire systematic changes in opposite directions lastingseveral decades This would suggest a long-term changein microclimate such as might be brought about by asubtle but persistent regional shift in wind directionandor speed that altered local storm tracks or driftingpatterns
Lastly the Dasuopu drill site is 700m higher than EastRongbuk Col and is located closer to the subtropical jetstream Thus Dasuopu is likely to be more sensitive tovariations in the strength and position of the jet stream
Ice-flow dynamicsUnder appropriate circumstances basal ice at a core sitemay have originated in a location with a differentaccumulation regime and this could be responsible foran apparent long-term change in accumulation How-ever the East Rongbuk Col record and the two Dasuopurecords are from cores taken in cols and the Dunde andPuruogangri records are from lsquosummitsrsquo or domes Innone of these cases would we expect any significant flowto have taken place in the last 500 years
The Guliya core is from 6200masl in a broad cirque-like basin (Yao and Yang 2004) The basin is fed by muchthinner ice from as high as 6700m to the north The ice iscold-based so no sliding is expected The flowline is8000m long mean accumulation rate is 02mandash1
and the ice is300m thick so the balance velocity at thecore site would be 5mandash1 Thus ice may have moved2 km in 400 years Given the topography it does notappear that this would change the accumulation ratesubstantially but subtle changes due to drifting arepossible
Inaccuracies in identifying annual layersMisidentification of annual layers could result in calcu-lated accumulation rates that differ from the actual onesDifficulty in correctly identifying annual layers can occurwhen the seasonal signal is ambiguous or at depth in anice core when the sampling resolution decreases due tolayer thinning However to explain the more thandoubling of the accumulation rate between the late19th century and the mid-20th century in the EastRongbuk Col core in this way would mean that wemissed more than 60 layers in the last 60 years This isextremely unlikely
In conclusion we suspect that differences in moisturetrajectories and the vagaries of mountain meteorology arethe most likely causes for the different accumulation-ratehistories at Dasuopu and East Rongbuk Col
CONCLUSIONSWe have developed a numerical model to refine thecalculation of annual accumulation rates from annual-layerthickness data and applied it to an ice core from EastRongbuk Col Our model suggests that the accumulation rateat East Rongbuk Col decreased from AD1534 to 1880 Thisis consistent with a reduction in northward incursions of thesummer south Asian monsoon inferred from geochemicalevidence from the same ice core (Kaspari and others 2007)
The model further suggests an increase in accumulationrate in the 20th century This may be related to enhancedmonsoon precipitation associated with a change in mon-soon dynamics At sites further north on the Tibetan Plateauthe accumulation rate doubles during this time periodwhereas on East Rongbuk Col it increases by a factor of45 possibly indicating that the former are not as stronglyinfluenced by the monsoon
On centennial timescales the East Rongbuk Col accumu-lation-rate record is in broad agreement with other paleo-climate records from the Tibetan Plateau including thosefrom Guliya (Yao and Yang 2004) and Dunde (Davis andThompson 2004) ice caps from the Puruogangri ice field(Thompson and others 2006) and from tree-ring records
Kaspari and others Snow accumulation rate on Qomolangma350
(Wu 1995) These records all show a gradual decrease inaccumulation (or precipitation) over two to three centuriesfollowed by an increase starting in the late 1800s to early1900s and finally a decrease in the late 1900s The similaritybetween these records suggests that there may be anoverarching mechanism controlling precipitation over theHimalaya and Tibetan Plateau
Paradoxically accumulation-rate trends on nearby Dasu-opu glacier differ substantially from the East Rongbuk Coland other Asian records The factors that are most likely tocontribute to this discrepancy are differences in moisture tra-jectories and complex mountain meteorology The Dasuopusite is at a higher elevation than the other sites and may bemore affected by variations in the jet stream andor receivelarger contributions of precipitation from winter westerlymoisture sources This is consistent with the higher meanaccumulation rate at Dasuopu relative to the East RongbukCol Alternatively or in addition subtle changes in winddirection andor speed may have altered drifting patterns
The dissimilarity between the Dasuopu and other Asianpaleoclimate records highlights the need for caution whenusing single records to reconstruct past variations in large-scale atmospheric circulation such as the strength of themonsoon or of Hadley circulation However when com-bined these records can be used to refine our understandingof moisture transport and climate variability in the Himalayaand across the Tibetan Plateau
Finally the inconsistencies uncovered by our analysis ofthe East Rongbuk Col core using Equation (13) suggest theneed for caution in applications of this equation
ACKNOWLEDGEMENTSThis research was funded by the US National Science Foun-dation (NSF ATM 0139491) the US National Oceanic andAtmospheric Administration (NOAA(NA05OAR4311109))the Natural Science Foundation of China (9041100340401054) and the Chinese Academy of Sciences (lsquoTalentsProjectrsquo and the Innovation Programs KZCX3-SW-339344)We thank CF Raymond for reviewing an early version of themodeling discussion and B Hanson and J Walder for in-sightful reviews
REFERENCESAraguas-Araguas L K Froelich and K Rozanski 1998 Stable
isotope composition of precipitation over southeast AsiaJ Geophys Res 103(D22) 28721ndash28742
Bolzan JF 1985 Ice flow at the Dome C ice divide based on adeep temperature profile J Geophys Res 90(D5) 8111ndash8124
Davis ME and LG Thompson 2004 Four centuries of climaticvariation across the Tibetan Plateau from ice-core accumulationand d18O records In Cecil LD JR Green and LG Thompsoneds Earth paleoenvironments records preserved in mid- andlow-latitude glaciers Dordrecht Kluwer 145ndash162
Davis ME LG Thompson T Yao and N Wang 2005 Forcing ofthe Asian monsoon on the Tibetan Plateau evidence from high-resolution ice core and tropical coral records J Geophys Res110(D4) D04101 (1010292004JD004933)
Duan K T Yao and LG Thompson 2006 Response of monsoonprecipitation in the Himalayas to global warming J GeophysRes 111(D19) D19110 (1010292006JD007084)
Goswami BN V Venugopal D Sengupta MS Madhusoodananand PK Xavier 2006 Increasing trend of extreme rain eventsover India in a warming environment Science 314(5804)1442ndash1445
Hooke RLeB 2005 Principles of glacier mechanics Secondedition Cambridge etc Cambridge University Press
Hou S and 7 others 2004 Correspondence Age of Himalayanbottom ice cores J Glaciol 50(170) 467ndash468
Kaspari S and 11 others 2007 Reduction in northward incursionsof the South Asian monsoon since 1400AD inferred from a MtEverest ice core Geophys Res Lett 34(16) L16701 (1010292007GL030440)
Kripalani RH JH Oh A Kulkarni SS Sabade and HS Chaud-hari 2007 South Asian summer monsoon precipitation vari-ability coupled climate model simulations and projectionsunder IPCC AR4 Theor Appl Climatol 90(3ndash4) 133ndash159
Lin Z and X Wu 1990 [A preliminary analysis about the tracks ofmoisture transportation on the QinghaindashXizang Plateau] [GeogrRes] 9(3) 30ndash49 [In Chinese with English summary]
Mayewski PA and PA Jeschke 1979 Himalayan and trans-Himalayan glacier fluctuations since AD 1812 Arct Alp Res11(3) 267ndash287
Nye JF 1952 The mechanics of glacier flow J Glaciol 2(12)82ndash93
Osterberg EC MJ Handley SB Sneed PA Mayewski andKJ Kreutz 2006 Continuous ice core melter system withdiscrete sampling for major ion trace element and stableisotope analyses Environ Sci Technol 40(10) 3355ndash3361
Parthasarathy B AA Munot and DR Kothawale 1995 Monthlyand seasonal rainfall series for All-India homogeneous regionsand meteorological subdivisions 1871ndash1994 Pune IndianInstitute of Tropical Meteorology (Research Report RR-065)
Raymond CF 1983 Deformation in the vicinity of ice dividesJ Glaciol 29(103) 357ndash373
Sankar-Rao M KM Lau and S Yang 1996 On the relationshipbetween Eurasian snow cover and the Asian summer monsoonInt J Climatol 16(6) 605ndash616
Shrestha AB CP Wake JE Dibb and PA Mayewski 2000Precipitation fluctuations in the Nepal Himalaya and its vicinityand relationship with some large scale climatological par-ameters J Climatol 20(3) 317ndash327
Thompson LG and 9 others 1989 HolocenendashLate Pleistoceneclimatic ice core records from QinghaindashTibetan PlateauScience 246(4929) 474ndash477
Thompson LG T Yao E Mosley-Thompson ME DavisKA Henderson and P Lin 2000 A high-resolution millennialrecord of the south Asian monsoon from Himalayan ice coresScience 289(5486) 1916ndash1919
Thompson LG and 8 others 2006 Abrupt tropical climatechange past and present Proc Nat Acad Sci USA (PNAS)103(28) 10 536ndash10 543
Tian L V Masson-Delmotte M Stievenard T Yao and J Jouzel2001 Tibetan Plateau summer monsoon northward extentrevealed by measurements of water stable isotopesJ Geophys Res 106(D22) 28081ndash28088
Tian L and 7 others 2003 Oxygen-18 concentrations in recentprecipitation and ice cores on the Tibetan Plateau J GeophysRes 108(D9) 4293 (1010292002JD002173)
Tian L T Yao JWC White W Yu and N Wang 2005 Westerlymoisture transport to the middle of Himalayas revealedfrom the high deuterium excess Chinese Sci Bull 50(10)1026ndash1030
Ueda H A Iwai K Kuwako and ME Hori 2006 Impact ofanthropogenic forcing on the Asian summer monsoon assimulated by eight GCMs Geophys Res Lett 33(6) L06703(1010292005GL025336)
Wu XD 1995 Dendroclimatic studies in China In Bradley RSand PD Jones eds Climate since AD 1500 LondonRoutledge 432ndash445
Yao T and M Yang 2004 Climatic changes over the last 400 yearsrecorded in ice collected from the Guliya Ice Cap TibetanPlateau In Cecil LD JR Green and LG Thompson edsEarth paleoenvironments records preserved in mid- and low-latitude glaciers Dordrecht Kluwer 163ndash180
Kaspari and others Snow accumulation rate on Qomolangma 351
Yao T Y Wang S Liu J Pu and A Lu 2004 Recent glacial retreatin High Asia in China and its impact on water resource inNorthwest China Sci China D 47(12) 1065ndash1075
Zhao H and GWK Moore 2002 On the relationship betweenDasuopu snow accumulation and the Asian summer monsoonGeophys Res Lett 29(24) 2222 (1010292002GL015757)
Zhao H and GWK Moore 2006 Reduction in Himalayan snowaccumulation and weakening of the trade winds over the Pacificsince the 1840s Geophys Res Lett 33(17) L17709 (1010292006GL027339)
APPENDIX1 To obtain the least-squares solution we first specifiedvalues of m and ws and calculated
S mwseth THORN frac14Xn1
tc toeth THORN2
where tc and to are the times of deposition calculated fromEquation (6a) and obtained from the layer countingrespectively and n is the total number of layers identified(465) We then incremented either m or ws and repeated thecalculation The procedure was implemented in FortranDuring each run of the program 400 pairs of values of mand ws were tested The starting values and increment werevaried between runs to narrow down the interval withinwhich the minimum S occurred The final increment was001 for both m and ws The values that yielded theminimum S were m frac14 111 and ws frac14 049
2 To obtain Equation (13) from Bolzan (1985) integrateour Equation (3) using his equation (7) for _zz zeth THORN and use thearguments in the paragraph containing Equation (13) tojustify substituting (0) for his _a and (z) for w(z)
3 To solve Equation (13) for p and ws using two knownpairs of z and t note the congruence between Equations (13)and (4) and use Equation (4) in Equation (5) to obtainEquation (6) Then substitute the known values of z and t inEquation (6) to get two equations in ws and m and solve forthese two unknowns The resulting equation given by Davisand Thompson (2005 equation (2)) but not derived bythem is
1t1
HH z1
p
1
frac14 1t2
HH z2
p
1
ethA1THORN
where p frac14 m ndash 1 and t1 z1 t2 and z2 are the known values
Inserting the known values this can be reduced to
Ap1 BAp
2 thorn B frac14 1 ethA2THORNwhere Ai frac14 [H(H ndash zi )] and B frac14 t1t2 Clearly p frac14 0 is atrivial solution of no interest The other solution for p mustbe obtained by trial and error which is relatively simpleusing a spreadsheet Equation (6) can then be used to obtainws thus
ws frac14 Hpt1
HH z1
p
1
ethA3THORN
Note that z frac14 0 t frac14 0 cannot be used as one of the pairs ofknown values as one of the values of Ai then becomes 1and B is either 0 or infinite It is also important to note that ifone of the known values of zi is at a relatively shallow depthand the corresponding ti is thus small ws z1t1 in otherwords ws approaches the accumulation rate This can beseen by expanding the term in inner brackets inEquation (A3) in a Maclaurin series
ws frac14 Hpt1
1thorn pHz1 thorn p p thorn 1eth THORN
H2
z212
thorn 1
frac14 z1t1thorn z1
t1
p thorn 1eth THORNz12H
thorn ethA4THORN
When p 1 and z1 H the second term on the right isnegligible compared with the first term
4 Values of m lt 1 imply that _zzj j increases with depthThis would require that the horizontal velocity increase withdepth which is highly unlikely in this situation
5 To calculate layer thicknesses using Equation (13) werearranged Equation (6a) to obtain
z frac14 H 1m1eth THORNwst
Hm thorn 1Hm1
1m1
ethA5THORN
and solved this for integer values of t We then obtained theaccumulation rate for each year ti from
_bi frac14 zizithorn1 zieth THORN=ws
ethA6THORN
where zi and zi+1 are the depths to the top and bottom of thelayer deposited between times ti and ti+1 calculated fromEquation (A3) and zi is the measured thickness of icebetween these two times measured in the core
MS received 13 April 2007 and accepted in revised form 12 January 2008
Kaspari and others Snow accumulation rate on Qomolangma352
The resulting timescale provides among other things arecord of the present thicknesses of annual layers (thethickness of ice between two annual timelines) To recoveraccumulation rates from this record we need to estimate theamount by which the layers were thinned by layer-parallelextending strain as they became buried We first describe anumerical model used to estimate the amount of thinningthat has occurred and thus recover the original layerthickness We then compare the East Rongbuk Col accumu-lation-rate history with others in the region (Thompson andothers 2000 2006 Davis and Thompson 2004 Yao andYang 2004) and examine factors that may have contributedto differences between them
FLOW MODELAnalytical approachWe approximate East Rongbuk Col as a (mathematical)saddle (Fig 1) and consider the variation in vertical velocitywith depth beneath such a saddle The temperature at thebed was ndash898C (Hou and others 2004) so there is nosignificant slip there We use a coordinate system with theorigin at the surface in the middle of the saddle The x and yaxes are aligned with the axes of the saddle with x parallelto the principal direction of flow away from the saddle thez axis is vertical and pointing downward Along the xand y axes the strain rates _xy and _yx vanish Ice flowssymmetrically toward or away from the origin so thevelocities u and v in the x and y directions respectivelyreach a symmetrical minimum (of 0) at the origin Thus thestrain rates _xz _zx _yz and _zy also vanish and the effectiveshear strain rate _e becomes
_e frac14 1ffiffiffi2
p _2xx thorn _2yy thorn _2zz
12 eth1THORN
Continuity requires that
_zz frac14 _xx thorn _yy
eth2THORN
In addition in the steady state ws frac14 _b frac14 _zzH where _zz isthe depth-averaged vertical strain rate ws is the verticalvelocity at the surface _b is the ice-equivalent accumulationrate and H is the glacier thickness Thus there is a tendencyfor the geometry of the glacier surface to adjust to yield the
values of _xx and _yy that will in turn yield values of _zz andH that balance _b For example an increase in _b leads to anincrease in H and hence surface slope This in turnincreases _xx and hence _zz until _zzH frac14 _b
Because slip at the bed is negligible while both u and vare non-zero above the bed for all xy gt 0 _xx and _yy
mustdecrease with depth Here we take extension as positivefollowing the normal convention Along the y axis icesurface slopes are towards the origin from both directions so_yy will be compressive or negative Because the site is in anaccumulation area we may assume that _zz is compressivethroughout the ice column so _xx gt _yy
everywhere Thus_zzj j must decrease with depth by Equation (2) As
w zeth THORN frac14Z Hz
H_zz dz eth3THORN
any change in _zz with depth leads to a non-linear decreasein the vertical velocity w with depth (Raymond 1983)
The variation in w with depth cannot be determinedanalytically because the stresses are not known wellenough and because the value of _zz is needed tocalculate _e However using numerical modeling Raymond(1983 equation (14)) showed that the variation with depthbeneath a two-dimensional divide in an isothermal ice sheetis well described by
w frac14 ws 1 zH
m eth4THORN
with m frac14 2 If alternatively _zz were independent of depththe decrease in w would be linear and m frac14 1
The age of the ice can be determined as a function ofdepth by integrating Z
dt frac14Z
dzw eth5THORN
Carrying out the integration using Equation (4) for w yields
t frac14 Hm
m 1eth THORNws
1
H zeth THORNm1 1
Hm1
m 6frac14 10 eth6aTHORN
t frac14 Hws
lnH
H z
m frac14 10 eth6bTHORN
A least-squares fit of Equation (6a) (see Appendix (1)) toour measured agendashdepth profile yields m frac14 111 and
Fig 1 Location of the 2002 Qomolangma drill site in East Rongbuk Col (solid black circle) and of other ice-core sites mentioned in the text(open circles) In the panel on the right black lines are 500m contours white areas are snow and ice and gray areas are rock
Kaspari and others Snow accumulation rate on Qomolangma344
ws frac14 049mandash1 (Fig 3) The rleatively low value of msuggests that _zz is nearly constant over much of the depthand that most of the decrease in velocity occurs near the bed
The low value of m could reflect the presence of warmerice near the bed the location of the hole some distance fromthe true divide or the three-dimensional nature of the colWe used Equation (4) a temperature-dependent form ofthe flow law and the measured temperature gradientndash0008Kmndash1 between 15 and 96m in the borehole to studythe effect of temperature and found that the softening effectof warmer temperatures near the bed could account for onlya small part of the difference Similarly Raymondrsquos two-dimensional numerical results for locations greater than oneice thickness away from the divide are well approximated byEquation (4) with m 14 so our appreciably lower value isnot consistent with his modeling We thus suspect that thethree-dimensional geometry of the col is likely to beresponsible for most of the difference
However it is clear from Figure 3 that there are systematicdifferences between the model and the measured profilessuch that the accumulation rate appears to have been higherrecently and lower when the ice between 33 and 49m wasdeposited To study these further we note that breaks inslope marked by crosses in Figure 3 and clearly visible inenlarged versions of the figure occur at about AD 19351835 1720 and 1620 We thus wrote Equation (6a) inthe form
x frac14 athornwst where x frac14 Hm
m 11
H zeth THORNm1 1
Hm1
and using m frac14 111 obtained least-squares fits to the curvesegments between these pairs of dates For the fit to thesegment between 1935 and 2000 we specified a frac14 0 Theresulting values of ws are shown in Table 1
Fig 3 Measured agendashdepth profile compared with profiles calcu-lated using Equation (6a) with m frac14 101 111 and 121 andws frac14 049mandash1 Also shown is the profile calculated with m frac14 13and ws frac14 068mandash1 the solution from the equation used by Davisand others (2005) Breaks in slope in the observed timendashdepth curveare marked by +
Fig 2 Example of high-resolution multi-parameter dating of the Qomolangma ice core Al Clndash Ca2+ and dD for the periods AD1650ndash601820ndash30 and 1980ndash90 are shown dD is more negative during the summer monsoon season and dust species (eg Ca2+ Al) peak in thewinterspring
Kaspari and others Snow accumulation rate on Qomolangma 345
A NUMERICAL MODELTo further analyze the systematic departures of Equation (6a)from our agendashdepth profile based on layer counting wedeveloped a numerical model This model simulates growthof the glacier from zero thickness
In a previous study Hou and others (2004) measured CH4
and 18Oatm profiles in the ice core used in this study and alsoin a slightly longer core collected from East Rongbuk Col ayear earlier in 2001 They compared the CH4 and d18Oatm
signatures in the East Rongbuk Col cores with those in theGRIP and GISP2 cores two gt3000m cores from centralGreenland They estimated that ice 06ndash09m above the bedin the 2002 East Rongbuk Col core and 005ndash18m abovethe bed in the 2001 core dated to between 50 BC andAD 500
To provide spin-up time for the model we assumed thatthe col was free of snow 4000 years ago and began ourintegration then (A sensitivity study discussed below showsthat this assumption has no significant effect on our results)We then allowed ice to accumulate at a rate _b teth THORNmandash1 andto flow away at a rate that resulted in thinning
To determine the rate of thinning we note that when iceis frozen to the bed laminar flow theory gives a depth-averaged velocity u of
u frac14 2n thorn 2
SfgB
n
Hnthorn1 eth7THORN
where is the slope of the glacier surface Sf is a shapefactor is the density of ice and g is the acceleration due togravity (Nye 1952 Hooke 2005 p 87) Neglecting thesmall change in H as we move away from the divide andtaking the derivative of u with respect to x gives
dudx
frac14 2nn thorn 2
SfgB
n
n1Hnthorn1 ddx
eth8THORN
and similarly for dv=dy Over a short distance from thedivide noting that frac14 0 at the divide we can approximate by x 2 where x is the slope at x frac14 x Then d dx isx x and Equation (8) becomes
dudx
frac14 _xx frac14 2nn thorn 2
Hnthorn1
2n1
SfgB
nnx
x eth9THORN
A similar relation would apply for _yy Thus using Equa-tion (2) we assume that
_zz Sfeth THORNn eth10THORNwhere is a measure of the excess of the (positive)longitudinal slope over the (negative) transverse slope in thecol and the constant of proportionality (with n frac14 3) is
3H4
10gB
3 eth11THORN
As ws frac14 _zzH we then have
ws frac14 03H5 SfgB
3
eth12THORN
The vertical velocity at any depth is then calculated fromEquation (4) with m frac14 111
To run the model one first enters the accumulation rate asa function of time and guesses a value of Sf In the initialyear 2000 BC a layer of ice is deposited on the bedrock anda new ice thickness is calculated as isws from Equation (12)For the first layer this ws is simply subtracted from thethickness and the new z coordinate of the top of the layeris saved Another layer of ice is then added For this andsubsequent layers Equations (4) and (12) are used to de-termine w at the level of each previously deposited layerand the elevation of each such layer is adjusted accordinglyAt the end of 4000 years of accumulation the ice thicknessis compared with the measured value of 967m and thevalue of Sf is adjusted accordingly Once the calculatedand measured thicknesses are in agreement within 005mwhen Sf is specified to five decimal places the resultingagendashdepth profile is compared with the measured one
For the initial run of the model we used the accumu-lation history from the above least-squares analysis (Table 1row 2) with m frac14 111 For the period prior to that coveredby the layer-counting data we used the weighted mean ofthe other accumulation rates (Table 1) The agreement withthe measured profile is quite good though the calculatedcurve falls slightly below the observed one (Fig 4) This isprobably because the least-squares fits tend to give too muchweight to transitional regions in the vicinity of the breakpoints By making small adjustments in the accumulationpattern and seeking new values of Sf that gave a satis-factory agreement with the measured thickness we wereable to obtain a significantly better fit (Fig 4) The resultingaccumulation rates are shown in the third row of Table 1 Inthe basal ice where we did not have layer-counting data toconstrain the accumulation rate we again used theweighted mean of the other values
The model dates for the basal ice in our core are AD776 at06m above the bed and AD 900 at 09m These ages are300ndash400 years younger than the younger limit (AD 500)estimated by Hou and others (2004) but are within theuncertainty in their approach
Also shown in Figure 4 is the ice thickness as a function oftime The glacier reached a thickness of 94467m ie (iceequivalent) after 542 years of integration starting at 2000 BC
(not shown) and owing to the constant accumulation rateassumed maintained this thickness until AD 1535 when wechanged the accumulation rate Thereafter it asymptoticallyapproached a new equilibrium thickness some years aftereach change in accumulation rate According to the model
Table 1 Accumulation rates (m andash1) during time intervals (AD) for the values of m shown in the lefthand column
m 2000 BCndashAD1535 1535ndash1620 1620ndash1720 1720ndash1835 1835ndash1935 1935ndash2000
101 052 055 042 039 029 064111 (by least squares) 053 077 053 046 033 069111 (model) 052 080 050 044 030 066121 052 110 058 049 031 068
Kaspari and others Snow accumulation rate on Qomolangma346
the first 542 years of accumulation is represented today bythe basal 3mm of ice and the first 2000 years by the basal67mm
Lastly we divided the final thickness of each ice layer byits original thickness to illustrate in Figure 4 the verticalshortening experienced by each layer as a function of depth
To investigate the effect of the initial condition (no ice at2000 BC) on the results we also ran a model starting at500 BC With the same accumulation pattern and values ofmand used previously results were essentially identical tothose in Figure 4 to within 00002 from AD700 to thepresent Thus our initial condition that the col was ice-free4000 years ago appears to have no effect on the final results
As a sensitivity test we also ran the model with m frac14 101and 121 (Fig 3) To match the observed accumulationpattern we then had to alter the accumulation rate by a fewcentimeters per year near the top of the core and a fewdecimeters per year near the bottom (Table 1) The yearAD 1535 is at a depth of 8656m in our reference model(m frac14 111) With m frac14 101 and 121m the year AD 1535occurs 063m higher and 014m lower respectively
ACCUMULATION-RATE HISTORYTo study variations in accumulation rate from year to yearwe divided the measured thickness of each layer by thenormalized layer thickness at the appropriate depth (Fig 5)As already anticipated from the above results (Table 1) theaccumulation rate decreases from AD1534 to 1880 andthen increases until 1970 (Fig5) In the following30 years it decreases again The decreasing trend inaccumulation since AD 1534 is consistent with the Clndash
and Ca2+ record from this core Clndash (from marine sources)has decreased and Ca2+ (from continental sources) has
increased since AD 1400 suggesting a decrease in north-ward incursions of the summer South Asian monsoon(Kaspari and others 2007)
Errors in picking boundaries between annual layers areunlikely to be responsible for these century-scale trendsMissing an annual layer would result in an apparentdoubling of the accumulation rate for that year andconversely Few such anomalies are observed in the datingand such errors would have little effect on the long-termaverages However the dating uncertainty increases withdepth in the core Thus it is possible that the higheraccumulation rates particularly prior to AD1600 could bein part an artifact of having missed some annual layersConsequently in the following discussion we focus primar-ily on the record since AD 1600
On a multi-decadal timescale the variations in climatethat are most likely to affect the accumulation rate arechanges in temperature and atmospheric circulation thatalter the amount and pattern of precipitation Increasedconcentrations of greenhouse gases for example areprojected to result in warming of the Indian Ocean anincrease in precipitation in the region affected by the Asianmonsoon and a change in Asian monsoon circulation (egUeda and others 2006 Kripalani and others 2007) Rain-gauge data indicate that the amount of monsoon rainfall inIndia has remained fairly stable since 1871 (Parthasarathyand others 1995) however there has been a trend towardan increase in frequency and magnitude of extreme events incentral India since the 1950s This trend is associated withwarmer summer sea surface temperatures (Goswami andothers 2006)
Thus the 20th-century increase in accumulation in EastRongbuk Col could be associated with recent changes inmonsoon dynamics If this is the case a similar accumulation
Fig 4 Output of the numerical model (b) is an enlargement of the area in the dashed box in (a) Of the three timendashdepth curves the thickgray curve is based on our layer counting and the two black curves are from our numerical model The dashed black curve uses theaccumulation rates determined by least squares and the solid black curve uses accumulation rates obtained by trial and error that bettermatch the observed curve Breaks in slope in the observed timendashdepth curve are marked by + (Use the top and left axes for normalized layerthickness and the bottom and right axes for ice thickness)
Kaspari and others Snow accumulation rate on Qomolangma 347
increase would be expected in other Asian ice cores that arestrongly influenced by the monsoon However regionaldifferences in accumulation patterns may occur due tovariations in atmospheric circulation and hence precipi-tation patterns
COMPARISON WITH OTHER ASIAN ICE-COREACCUMULATION-RATE HISTORIESOur accumulation-rate time series is broadly similar to thosederived from four other ice cores from the Tibetan Plateau(Fig 5) Before discussing this in detail however weconsider the extent to which differences in the method ofanalysis may have affected the results
In previous studies of accumulation rates using Asian icecores (Thompson and others 1989 2000 Yao and Yang2004 Davis and others 2005) the authors have fitted afunction of the form
zeth THORN frac14 0 1 zH
pthorn1eth13THORN
to observed layer-thickness data and then calculated theoriginal thickness of each layer by comparing the calculatedwith the observed thickness Here (z) is the layer thicknessas a function of depth z 0 is the layer thickness at z frac14 0(the ice-equivalent accumulation rate) and p is a fittingparameter The papers by Thompson and others (19892000) and by Davis and others (2005) attribute Equation (13)to Bolzan (1985) although it does not appear in his paperit can be derived from equations appearing there (see
Appendix (2)) Equation (13) is very similar to our Equa-tion (4) but layer thicknesses are substituted for w and wsThese substitutions are logical in a steady state ws frac14 0and at depth z vertical velocity w(z) must be sufficient tomove the top of layer (z) down one layer thickness in ayear Based on comparison of Equations (4) and (13) it isclear that p frac14 m ndash 1
Davis and others (2005 equation (2)) point out thatEquation (13) can be solved for p and ws if annual layers attwo different depths can be dated accurately (see Appendix(3)) However when we do this for the respective segmentsof our agendashdepth curves between successive break pointswe get values of m that range from 07 to 29 As m shouldnot vary significantly with time unless the divide has movedseveral ice thicknesses and as m lt 1 is physically unreal-istic (see Appendix (4)) this approach is not suitable in ourcase Furthermore if we solve for p and ws using datedlayers at the top and bottom of the core the values obtainedp frac14 03 (m frac14 13) and ws frac14 068mandash1 yield an agendashdepthprofile (Fig 3) that is in quite poor agreement with theobserved profile
Were we to have used only Equation (13) in ourmodeling we would have ignored the obvious breaks inslope in the curve of age versus depth obtained from layercounting (Figs 3 and 4) For example if we calculate layerthicknesses from Equation (13) and the values of m and ws
(111 and 046mandash1 respectively) from our least-squares fitto obtain p (= m ndash 1) and 0 (= ws) (see Appendix (5)) theresulting accumulation rates from AD1550 to 1900 aresystematically 01ndash02mandash1 higher than those in Figure 5
Fig 5 Reconstructed Tibetan Plateau precipitation record from tree rings (Wu 1995) and ice-core accumulation-rate time series fromDunde (Davis and Thompson 2004) Guliya (Yao and Yang 2004) Puruogangri (Thompson and others 2006) East Rongbuk Col (Kaspariand others 2007 this work) and Dasuopu (Thompson and others 2000) The horizontal line through each time series is the average and thegray shaded regions denote below-average accumulation
Kaspari and others Snow accumulation rate on Qomolangma348
with differences being greatest during years with the highestaccumulation rates (Fig 6) However the long-term trendsare the same
Lacking the original layer-thickness data and informationon how Equation (13) was implemented (least-squares or atwo-point approximation) for the other sites we cannotassess the extent to which accumulation rates calculatedusing Equation (13) would differ from those obtained fromour numerical model For example if agendashdepth profiles likeFigure 3 for the other sites did not have any breaks in slopeand if a least-squares approach was used to obtain p theapproaches would be essentially identical However theprolonged periods during which accumulation deviatessystematically from the mean in the other records (Fig 5)suggest that agendashdepth profiles for these sites would containbreaks in slope
As noted our accumulation-rate time series is similar tothose from Guliya (6200masl) (Yao and Yang 2004) andDunde (5325masl) (Thompson and others 1989) ice capson the northern edge of the Tibetan Plateau and fromPuruogangri ice field (5970masl) (Thompson and others2006) at the western end of the Tanggula range 700 kmnorth-northeast of Qomolangma (Figs 1 and 5) inasmuch asall show a gradual decline over two to three centuriesfollowed by an increase starting in the late 1800s to early1900s and then a decline in the late 1900s The significanceof this correspondence is not clear however given thepotential for substantial differences in moisture source andtransport between the Himalaya and the northern TibetanPlateau Our time series is most similar to a precipitationrecord derived from a composite tree-ring record (Wu 1995)from lower elevations (3000ndash4000m) on the Plateau (Fig 5)As this record is from sites scattered over the Plateau it mayimply that despite the potential differences in moisturetransport correspondence between the several records fromthe northern part of the Plateau and that from East RongbukCol is more than coincidental
Paradoxically the period of rising accumulation ratesbroadly coincides with a period of retreat of glaciersworldwide including those in the Himalaya (eg Mayewskiand Jeschke 1979 Yao and others 2004) This retreat in theHimalaya particularly in the late 1800s and early 1900s
may be a response to past changes in climate includinglower accumulation during the 1800s andor warmingfollowing the cooler Little Ice Age However the continuingrecent retreat of many glaciers in the Himalaya and on theTibetan Plateau during a time when accumulation rateshave increased suggests that glaciers now are respondingmore to temperature than to accumulation This is consistentwith the conclusion reached by Thompson and others(2006) that glacier retreat in the tropics and subtropics iscaused by rising air temperature rather than reducedprecipitation
However on Dasuopu glacier (7200masl) 125 kmnorthwest of Qomolangma accumulation appears to havebeen highest between 1800 and 1880 (Thompson andothers 2000) a period during which it was relatively lowelsewhere Given that the Dasuopu record is that closest toEast Rongbuk Col this difference is puzzling Previousauthors have suggested that variations in snow accumulationat Dasuopu are related to the intensity of the Asian monsoon(Thompson and others 2000 Davis and Thompson 2004Duan and others 2006) the regional Hadley circulation(Zhao and Moore 2002) or weakening of the Pacific tradewinds (Zhao and Moore 2006) If ice-core accumulation-rate time series are representative of large-scale atmosphericcirculation processes such as these one would not expectsuch large differences between the Dasuopu and EastRongbuk Col records It seems unlikely that uncertaintiesrelated to the application of Equation (13) could explain sopronounced a difference Other factors that could contributeto such differences include
Different moisture trajectoriesThe majority of precipitation in the Himalaya is de-posited between June and September during the summermonsoon In the western Himalaya moisture comesdirectly from the Arabian Sea (Fig 1) while in the east itis transported from the Arabian Sea across southern Indiato the Bay of Bengal and thence northward along theBrahmaputra river valley (Lin and Wu 1990 Shresthaand others 2000) Davis and Thompson (2004) suggestthat Dasuopu is located close to the dividing pointbetween these two moisture regimes Thus Dasuopu
Fig 6 Accumulation rate for the East Rongbuk Col ice core calculated with the numerical model (solid line) and with Equation (13) (dashedline) and the difference between the two
Kaspari and others Snow accumulation rate on Qomolangma 349
may be more heavily influenced by the western moistureregime and East Rongbuk Col by the eastern oneHowever the East Rongbuk Col annual accumulationrate since 1871 is significantly correlated with the all-India Precipitation (Parthasarathy and others 1995) inregions of northwest India (n frac14 131 p lt 0005 westernUttar Pradesh (r frac14 022) Haryana Chandigarh andDelhi (r frac14 026) and Punjab (r frac14 024)) suggesting thatthe western moisture regime may indeed be an import-ant control on East Rongbuk Col accumulation
Moisture associated with the westerlies during non-monsoon periods could contribute to the differencesbetween the two records Although winter depositionhas been thought to make only a small contribution tothe net budget in the Himalaya recent research suggeststhat winter precipitation events may account for asubstantial amount of the annual precipitation atDasuopu (Tian and others 2005) and increased earlywinter snowfall was identified as a possible cause forthe higher accumulation at Dasuopu during the 1800s(Davis and others 2005) The Dasuopu drill site(7200masl) is higher than the East Rongbuk Colsite (6518masl) and the mean accumulation fromAD1534 to 1997 is greater at Dasuopu (080m forcore 2 099m for core 3) than at East Rongbuk Col(052m) The higher accumulation at Dasuopu may becaused by larger contributions of winter snow depositionfrom the westerlies at higher elevations and couldaccount for the differences in the Dasuopu and EastRongbuk Col records In this case the accumulationrecord from East Rongbuk Col may be a better proxy forsummer monsoon variability and that from Dasuopu forwinter snow deposition from westerly sources
Complex mountain meteorologyThe large vertical relief and complicated topography inthe Himalaya influence the distribution of precipitationthrough localized storms strong orographic effects anddrifting Previous studies of the spatial variability ofprecipitation in Nepal (Sankar-Rao and others 1996) andIndia (Parthasarathy and others 1995 Goswami andothers 2006) demonstrated that precipitation may behighly variable over short distances For example theaccumulation-rate time series from two ice cores drilled100m apart at Dasuopu show similar long-term trendsbut on shorter timescales there are systematic differencesbetween the two records (Thompson and others 2000)(Fig 5 Dasuopu cores 2 and 3)
If non-monsoon westerly sources are insignificant at bothEast Rongbuk Col and Dasuopu so accumulation at bothis controlled by monsoon moisture sources the differ-ences between them during the 19th century wouldrequire systematic changes in opposite directions lastingseveral decades This would suggest a long-term changein microclimate such as might be brought about by asubtle but persistent regional shift in wind directionandor speed that altered local storm tracks or driftingpatterns
Lastly the Dasuopu drill site is 700m higher than EastRongbuk Col and is located closer to the subtropical jetstream Thus Dasuopu is likely to be more sensitive tovariations in the strength and position of the jet stream
Ice-flow dynamicsUnder appropriate circumstances basal ice at a core sitemay have originated in a location with a differentaccumulation regime and this could be responsible foran apparent long-term change in accumulation How-ever the East Rongbuk Col record and the two Dasuopurecords are from cores taken in cols and the Dunde andPuruogangri records are from lsquosummitsrsquo or domes Innone of these cases would we expect any significant flowto have taken place in the last 500 years
The Guliya core is from 6200masl in a broad cirque-like basin (Yao and Yang 2004) The basin is fed by muchthinner ice from as high as 6700m to the north The ice iscold-based so no sliding is expected The flowline is8000m long mean accumulation rate is 02mandash1
and the ice is300m thick so the balance velocity at thecore site would be 5mandash1 Thus ice may have moved2 km in 400 years Given the topography it does notappear that this would change the accumulation ratesubstantially but subtle changes due to drifting arepossible
Inaccuracies in identifying annual layersMisidentification of annual layers could result in calcu-lated accumulation rates that differ from the actual onesDifficulty in correctly identifying annual layers can occurwhen the seasonal signal is ambiguous or at depth in anice core when the sampling resolution decreases due tolayer thinning However to explain the more thandoubling of the accumulation rate between the late19th century and the mid-20th century in the EastRongbuk Col core in this way would mean that wemissed more than 60 layers in the last 60 years This isextremely unlikely
In conclusion we suspect that differences in moisturetrajectories and the vagaries of mountain meteorology arethe most likely causes for the different accumulation-ratehistories at Dasuopu and East Rongbuk Col
CONCLUSIONSWe have developed a numerical model to refine thecalculation of annual accumulation rates from annual-layerthickness data and applied it to an ice core from EastRongbuk Col Our model suggests that the accumulation rateat East Rongbuk Col decreased from AD1534 to 1880 Thisis consistent with a reduction in northward incursions of thesummer south Asian monsoon inferred from geochemicalevidence from the same ice core (Kaspari and others 2007)
The model further suggests an increase in accumulationrate in the 20th century This may be related to enhancedmonsoon precipitation associated with a change in mon-soon dynamics At sites further north on the Tibetan Plateauthe accumulation rate doubles during this time periodwhereas on East Rongbuk Col it increases by a factor of45 possibly indicating that the former are not as stronglyinfluenced by the monsoon
On centennial timescales the East Rongbuk Col accumu-lation-rate record is in broad agreement with other paleo-climate records from the Tibetan Plateau including thosefrom Guliya (Yao and Yang 2004) and Dunde (Davis andThompson 2004) ice caps from the Puruogangri ice field(Thompson and others 2006) and from tree-ring records
Kaspari and others Snow accumulation rate on Qomolangma350
(Wu 1995) These records all show a gradual decrease inaccumulation (or precipitation) over two to three centuriesfollowed by an increase starting in the late 1800s to early1900s and finally a decrease in the late 1900s The similaritybetween these records suggests that there may be anoverarching mechanism controlling precipitation over theHimalaya and Tibetan Plateau
Paradoxically accumulation-rate trends on nearby Dasu-opu glacier differ substantially from the East Rongbuk Coland other Asian records The factors that are most likely tocontribute to this discrepancy are differences in moisture tra-jectories and complex mountain meteorology The Dasuopusite is at a higher elevation than the other sites and may bemore affected by variations in the jet stream andor receivelarger contributions of precipitation from winter westerlymoisture sources This is consistent with the higher meanaccumulation rate at Dasuopu relative to the East RongbukCol Alternatively or in addition subtle changes in winddirection andor speed may have altered drifting patterns
The dissimilarity between the Dasuopu and other Asianpaleoclimate records highlights the need for caution whenusing single records to reconstruct past variations in large-scale atmospheric circulation such as the strength of themonsoon or of Hadley circulation However when com-bined these records can be used to refine our understandingof moisture transport and climate variability in the Himalayaand across the Tibetan Plateau
Finally the inconsistencies uncovered by our analysis ofthe East Rongbuk Col core using Equation (13) suggest theneed for caution in applications of this equation
ACKNOWLEDGEMENTSThis research was funded by the US National Science Foun-dation (NSF ATM 0139491) the US National Oceanic andAtmospheric Administration (NOAA(NA05OAR4311109))the Natural Science Foundation of China (9041100340401054) and the Chinese Academy of Sciences (lsquoTalentsProjectrsquo and the Innovation Programs KZCX3-SW-339344)We thank CF Raymond for reviewing an early version of themodeling discussion and B Hanson and J Walder for in-sightful reviews
REFERENCESAraguas-Araguas L K Froelich and K Rozanski 1998 Stable
isotope composition of precipitation over southeast AsiaJ Geophys Res 103(D22) 28721ndash28742
Bolzan JF 1985 Ice flow at the Dome C ice divide based on adeep temperature profile J Geophys Res 90(D5) 8111ndash8124
Davis ME and LG Thompson 2004 Four centuries of climaticvariation across the Tibetan Plateau from ice-core accumulationand d18O records In Cecil LD JR Green and LG Thompsoneds Earth paleoenvironments records preserved in mid- andlow-latitude glaciers Dordrecht Kluwer 145ndash162
Davis ME LG Thompson T Yao and N Wang 2005 Forcing ofthe Asian monsoon on the Tibetan Plateau evidence from high-resolution ice core and tropical coral records J Geophys Res110(D4) D04101 (1010292004JD004933)
Duan K T Yao and LG Thompson 2006 Response of monsoonprecipitation in the Himalayas to global warming J GeophysRes 111(D19) D19110 (1010292006JD007084)
Goswami BN V Venugopal D Sengupta MS Madhusoodananand PK Xavier 2006 Increasing trend of extreme rain eventsover India in a warming environment Science 314(5804)1442ndash1445
Hooke RLeB 2005 Principles of glacier mechanics Secondedition Cambridge etc Cambridge University Press
Hou S and 7 others 2004 Correspondence Age of Himalayanbottom ice cores J Glaciol 50(170) 467ndash468
Kaspari S and 11 others 2007 Reduction in northward incursionsof the South Asian monsoon since 1400AD inferred from a MtEverest ice core Geophys Res Lett 34(16) L16701 (1010292007GL030440)
Kripalani RH JH Oh A Kulkarni SS Sabade and HS Chaud-hari 2007 South Asian summer monsoon precipitation vari-ability coupled climate model simulations and projectionsunder IPCC AR4 Theor Appl Climatol 90(3ndash4) 133ndash159
Lin Z and X Wu 1990 [A preliminary analysis about the tracks ofmoisture transportation on the QinghaindashXizang Plateau] [GeogrRes] 9(3) 30ndash49 [In Chinese with English summary]
Mayewski PA and PA Jeschke 1979 Himalayan and trans-Himalayan glacier fluctuations since AD 1812 Arct Alp Res11(3) 267ndash287
Nye JF 1952 The mechanics of glacier flow J Glaciol 2(12)82ndash93
Osterberg EC MJ Handley SB Sneed PA Mayewski andKJ Kreutz 2006 Continuous ice core melter system withdiscrete sampling for major ion trace element and stableisotope analyses Environ Sci Technol 40(10) 3355ndash3361
Parthasarathy B AA Munot and DR Kothawale 1995 Monthlyand seasonal rainfall series for All-India homogeneous regionsand meteorological subdivisions 1871ndash1994 Pune IndianInstitute of Tropical Meteorology (Research Report RR-065)
Raymond CF 1983 Deformation in the vicinity of ice dividesJ Glaciol 29(103) 357ndash373
Sankar-Rao M KM Lau and S Yang 1996 On the relationshipbetween Eurasian snow cover and the Asian summer monsoonInt J Climatol 16(6) 605ndash616
Shrestha AB CP Wake JE Dibb and PA Mayewski 2000Precipitation fluctuations in the Nepal Himalaya and its vicinityand relationship with some large scale climatological par-ameters J Climatol 20(3) 317ndash327
Thompson LG and 9 others 1989 HolocenendashLate Pleistoceneclimatic ice core records from QinghaindashTibetan PlateauScience 246(4929) 474ndash477
Thompson LG T Yao E Mosley-Thompson ME DavisKA Henderson and P Lin 2000 A high-resolution millennialrecord of the south Asian monsoon from Himalayan ice coresScience 289(5486) 1916ndash1919
Thompson LG and 8 others 2006 Abrupt tropical climatechange past and present Proc Nat Acad Sci USA (PNAS)103(28) 10 536ndash10 543
Tian L V Masson-Delmotte M Stievenard T Yao and J Jouzel2001 Tibetan Plateau summer monsoon northward extentrevealed by measurements of water stable isotopesJ Geophys Res 106(D22) 28081ndash28088
Tian L and 7 others 2003 Oxygen-18 concentrations in recentprecipitation and ice cores on the Tibetan Plateau J GeophysRes 108(D9) 4293 (1010292002JD002173)
Tian L T Yao JWC White W Yu and N Wang 2005 Westerlymoisture transport to the middle of Himalayas revealedfrom the high deuterium excess Chinese Sci Bull 50(10)1026ndash1030
Ueda H A Iwai K Kuwako and ME Hori 2006 Impact ofanthropogenic forcing on the Asian summer monsoon assimulated by eight GCMs Geophys Res Lett 33(6) L06703(1010292005GL025336)
Wu XD 1995 Dendroclimatic studies in China In Bradley RSand PD Jones eds Climate since AD 1500 LondonRoutledge 432ndash445
Yao T and M Yang 2004 Climatic changes over the last 400 yearsrecorded in ice collected from the Guliya Ice Cap TibetanPlateau In Cecil LD JR Green and LG Thompson edsEarth paleoenvironments records preserved in mid- and low-latitude glaciers Dordrecht Kluwer 163ndash180
Kaspari and others Snow accumulation rate on Qomolangma 351
Yao T Y Wang S Liu J Pu and A Lu 2004 Recent glacial retreatin High Asia in China and its impact on water resource inNorthwest China Sci China D 47(12) 1065ndash1075
Zhao H and GWK Moore 2002 On the relationship betweenDasuopu snow accumulation and the Asian summer monsoonGeophys Res Lett 29(24) 2222 (1010292002GL015757)
Zhao H and GWK Moore 2006 Reduction in Himalayan snowaccumulation and weakening of the trade winds over the Pacificsince the 1840s Geophys Res Lett 33(17) L17709 (1010292006GL027339)
APPENDIX1 To obtain the least-squares solution we first specifiedvalues of m and ws and calculated
S mwseth THORN frac14Xn1
tc toeth THORN2
where tc and to are the times of deposition calculated fromEquation (6a) and obtained from the layer countingrespectively and n is the total number of layers identified(465) We then incremented either m or ws and repeated thecalculation The procedure was implemented in FortranDuring each run of the program 400 pairs of values of mand ws were tested The starting values and increment werevaried between runs to narrow down the interval withinwhich the minimum S occurred The final increment was001 for both m and ws The values that yielded theminimum S were m frac14 111 and ws frac14 049
2 To obtain Equation (13) from Bolzan (1985) integrateour Equation (3) using his equation (7) for _zz zeth THORN and use thearguments in the paragraph containing Equation (13) tojustify substituting (0) for his _a and (z) for w(z)
3 To solve Equation (13) for p and ws using two knownpairs of z and t note the congruence between Equations (13)and (4) and use Equation (4) in Equation (5) to obtainEquation (6) Then substitute the known values of z and t inEquation (6) to get two equations in ws and m and solve forthese two unknowns The resulting equation given by Davisand Thompson (2005 equation (2)) but not derived bythem is
1t1
HH z1
p
1
frac14 1t2
HH z2
p
1
ethA1THORN
where p frac14 m ndash 1 and t1 z1 t2 and z2 are the known values
Inserting the known values this can be reduced to
Ap1 BAp
2 thorn B frac14 1 ethA2THORNwhere Ai frac14 [H(H ndash zi )] and B frac14 t1t2 Clearly p frac14 0 is atrivial solution of no interest The other solution for p mustbe obtained by trial and error which is relatively simpleusing a spreadsheet Equation (6) can then be used to obtainws thus
ws frac14 Hpt1
HH z1
p
1
ethA3THORN
Note that z frac14 0 t frac14 0 cannot be used as one of the pairs ofknown values as one of the values of Ai then becomes 1and B is either 0 or infinite It is also important to note that ifone of the known values of zi is at a relatively shallow depthand the corresponding ti is thus small ws z1t1 in otherwords ws approaches the accumulation rate This can beseen by expanding the term in inner brackets inEquation (A3) in a Maclaurin series
ws frac14 Hpt1
1thorn pHz1 thorn p p thorn 1eth THORN
H2
z212
thorn 1
frac14 z1t1thorn z1
t1
p thorn 1eth THORNz12H
thorn ethA4THORN
When p 1 and z1 H the second term on the right isnegligible compared with the first term
4 Values of m lt 1 imply that _zzj j increases with depthThis would require that the horizontal velocity increase withdepth which is highly unlikely in this situation
5 To calculate layer thicknesses using Equation (13) werearranged Equation (6a) to obtain
z frac14 H 1m1eth THORNwst
Hm thorn 1Hm1
1m1
ethA5THORN
and solved this for integer values of t We then obtained theaccumulation rate for each year ti from
_bi frac14 zizithorn1 zieth THORN=ws
ethA6THORN
where zi and zi+1 are the depths to the top and bottom of thelayer deposited between times ti and ti+1 calculated fromEquation (A3) and zi is the measured thickness of icebetween these two times measured in the core
MS received 13 April 2007 and accepted in revised form 12 January 2008
Kaspari and others Snow accumulation rate on Qomolangma352
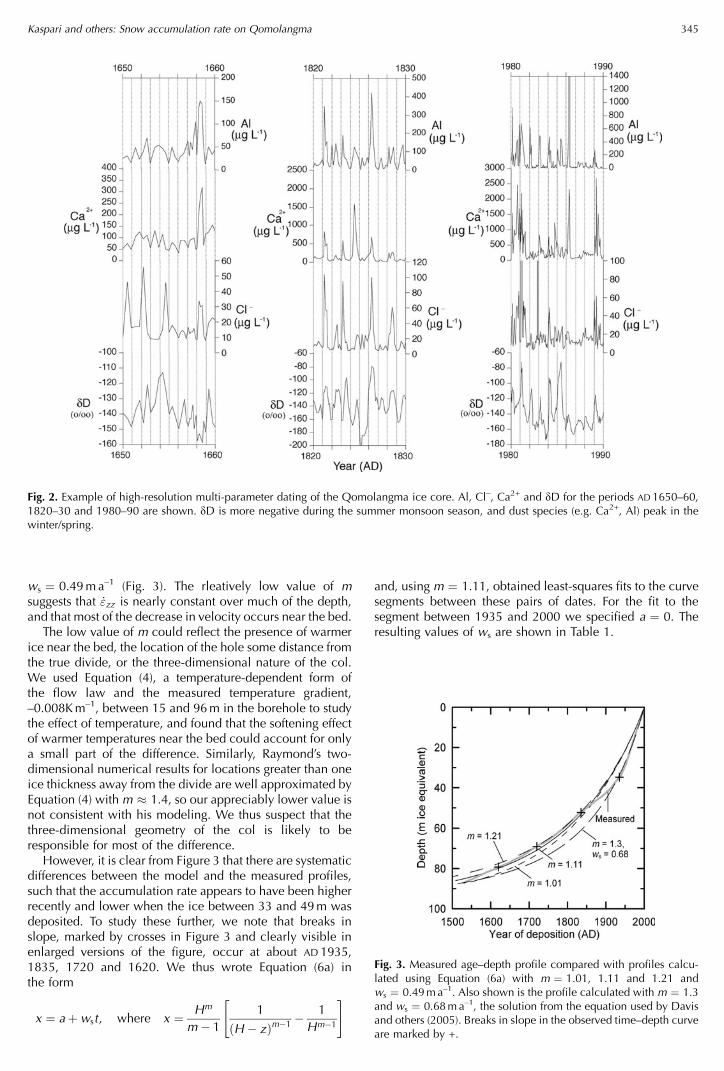
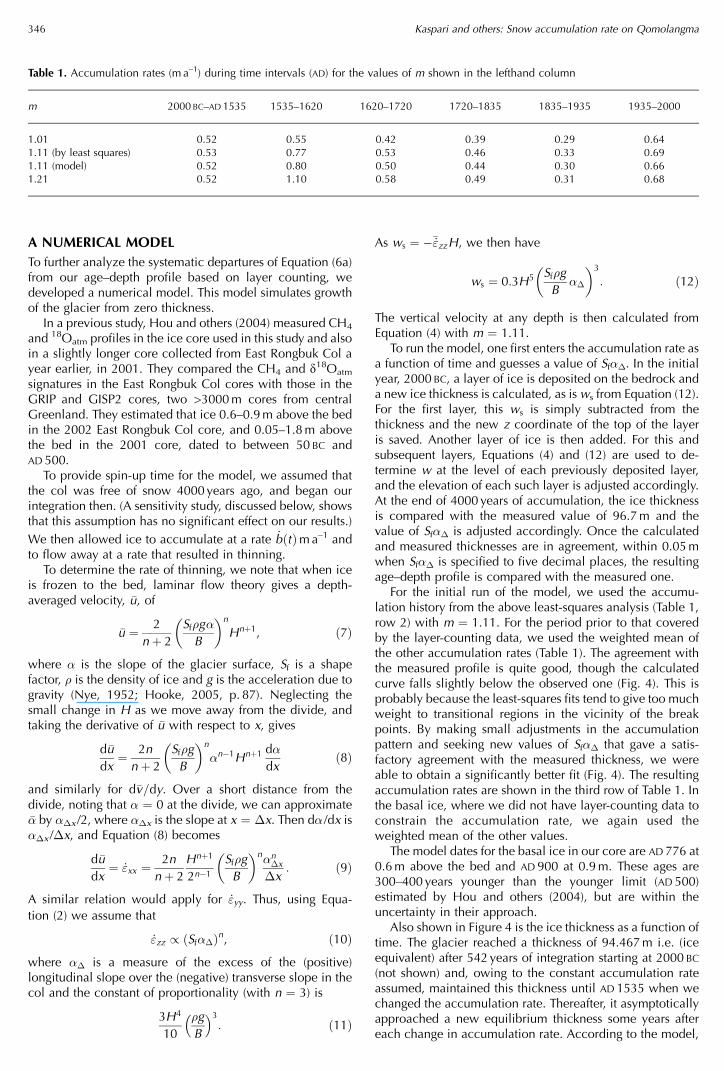
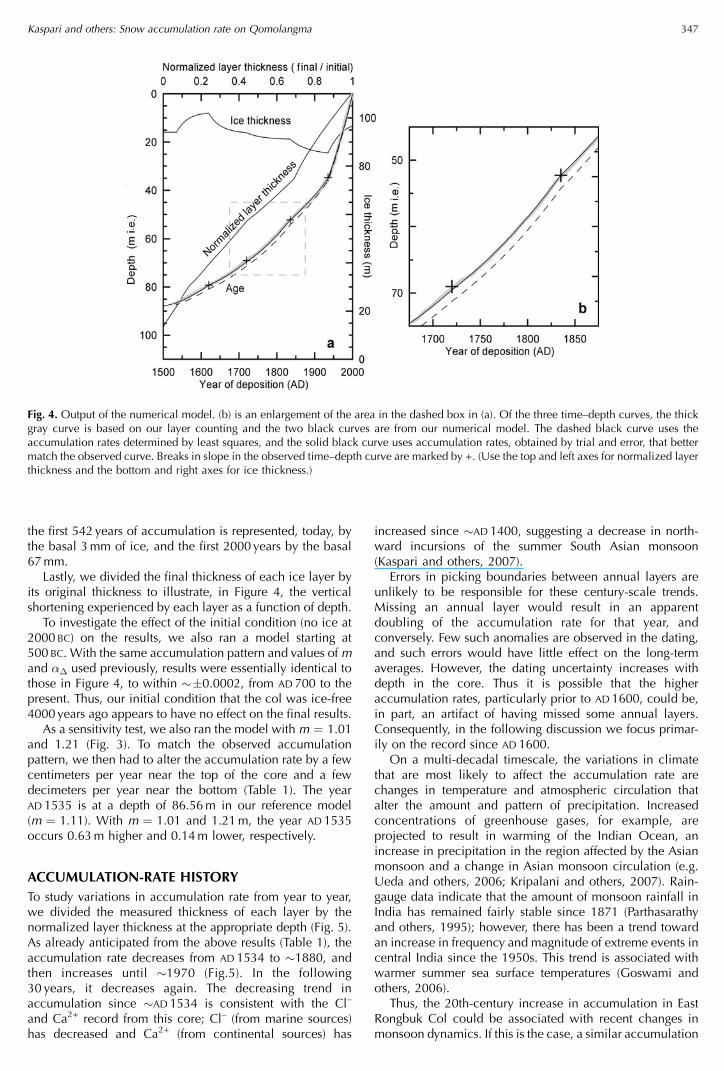
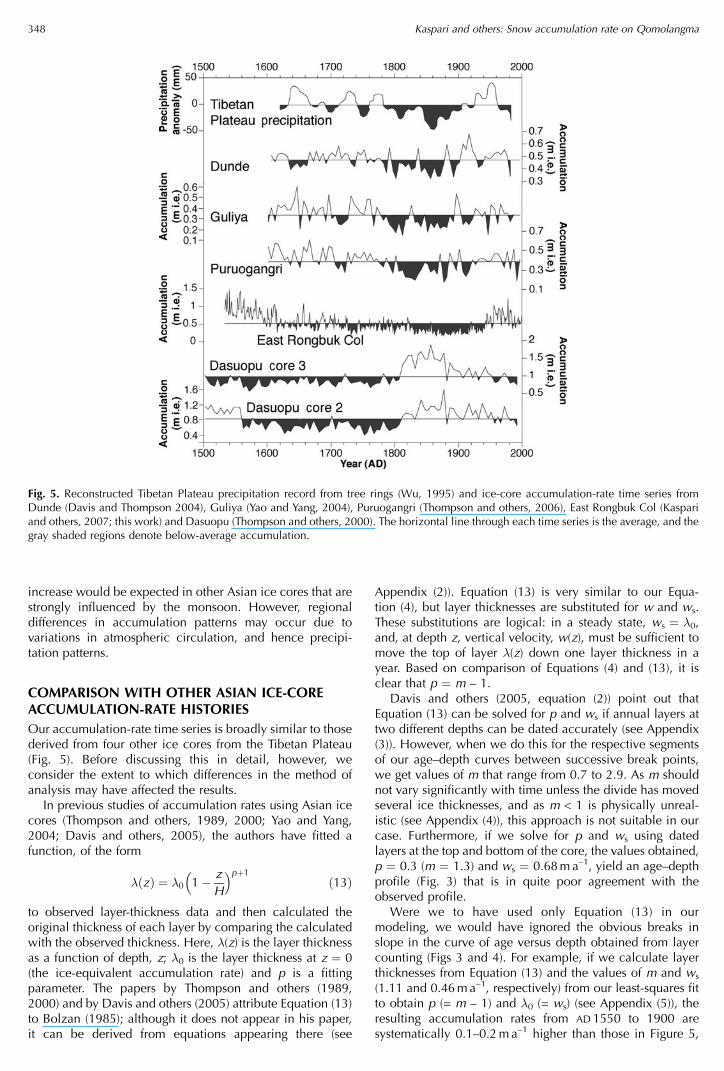
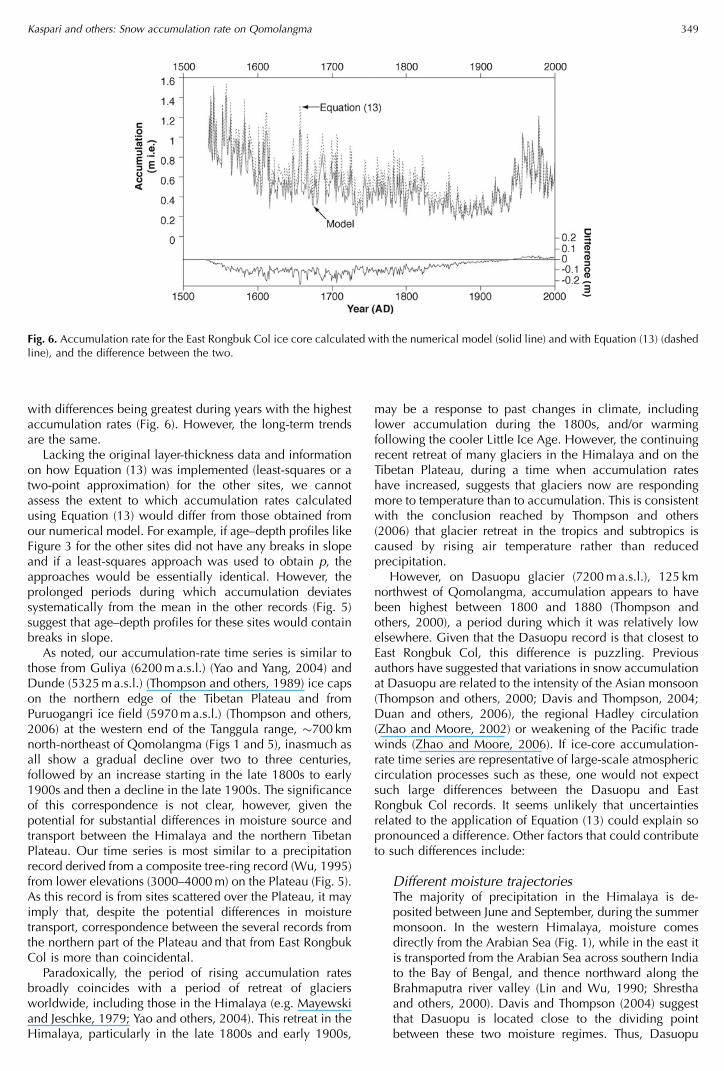
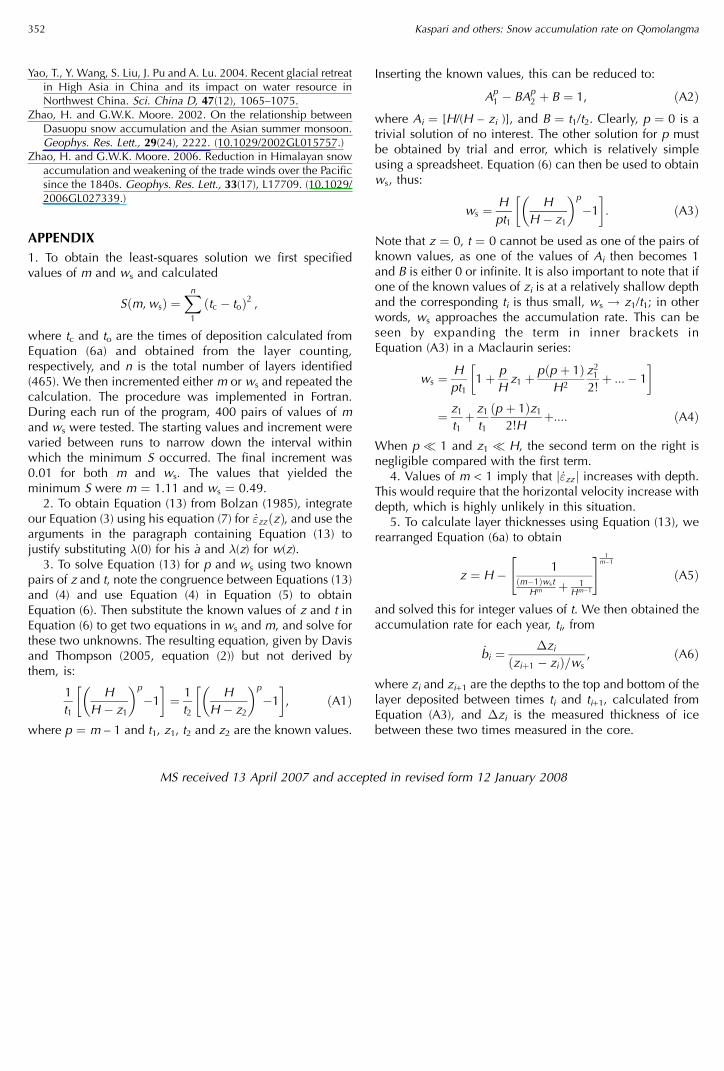
Related Documents