A Snapshot of the Egyptian Economy 2013 A Snapshot of .. the Egyptian Economy 2013 General Authority for Investment and Free Zones

Welcome message from author
This document is posted to help you gain knowledge. Please leave a comment to let me know what you think about it! Share it to your friends and learn new things together.
Transcript

A Snapshot of the Egyptian Economy 2013
A Snapshot of .. the Egyptian Economy
2013
General Authority for Investment and Free Zones

A Snapshot of the Egyptian Economy 2013
Con
tent
s
A Snapshot of the Egyptian Economy‐2013 Page
1.Introduction to the Political and Economic Developments in Egypt 5
2.Egypt in the International Investment Reports 11
3.Macroeconomic Indicators: 13 − Economic growth 13 − Inflation 13 − Unemployment 14 − Sectoral growth rates 14 − Net international reserves 15 − Imports and Exports 15 − Interest rates 16 − Exchange rates 16
4.Leading Sectors of the Egyptian economy: 17
− Tourism 17 − Construction and building 19 − Communications and information technology 20 − Manufacturing 22 − Financial services (banking) 24
5.Capital Market 27
6.Foreign Direct Investment 35
4.Investments and Establishments 36 − Total implemented investments 36 − New establishments 36 − Sectoral and geographical distribution and jobs in new establishments 38 − Companies expansions 41 − Procedures to improve the investment climate in Egypt 42
4. Free zones, Investment Zones and North West Suez Gulf Zone 45
9. Small and Mediumsized Enterprises 48
10. Investment Projects 50
11. Publicprivate Partnerships 52
12.Success Stories in Egypt 54

A Snapshot of the Egyptian Economy 2013
3
Population: 84.1 million (March 2013) Economic growth:
)2011/12 (2.2 % 2.4 % (First half 2012/13)
GDP at current prices: EGP 1542.3 billion (2011/12) EGP 867 billion (July‐December 2012/13) Net international reserves: USD 13.4 billion (March 2013) Foreign direct investment: USD 2.1 billion (2011/12) USD 301 million (first half 2012/13) Unemployment:
13 % (Q4 2012) Inflation:
8.2 % (March 2013) Exports: USD 26.98 billion (2011/12) USD 13.5 billion (July‐December 2012/13) Imports: USD 58.7 billion (2011/12) USD 30.2 billion (July‐December 2012/13) Exchange rate: (March 2013) USD 1 = EGP 6.8519 Euro 1 = EGP 8.9664 Pound Sterling = EGP 10.4902

A Snapshot of the Egyptian Economy 2013
Action has continued to achieve more political growth in Egypt over the past few months in or‐der to build the state's institutions and attain the political stability, which is indispensable for economic progress and developments. Main developments in the political arena include the following: • Finalizing the new Egyptian Constitution, offering it for referendum and adopting it in De‐
cember 2012; • According to the new constitution, the Shura Council has taken up the task of legislation until
election is over and a new People's assembly is set up; • Taking procedures and arrangements to organize parliamentary election to set up the Peo‐
ple's Assembly in order to complete the building of the States bodies and institutions in a democratic manner, which is supportive to the climate of freedom and respect for rights and freedoms;
• Action to support Egypt's bilateral relations with Arab and foreign countries in order to re‐store its regional role and enhance economic and investment cooperation with different countries of the world.
Political developments in Egypt over the past year have undoubtedly constituted a significant challenge to the economic activity and affected different economic sectors. The Egyptian economy, however, is one of the most diversified economies in the Middle East with its multiple and diversified pillars, flexible productive structure and capability to adapt to the economic changes. This would render it able to face such challenges and set off robustly towards high growth rate and attract more domestic, Arab and foreign investments. Main recent economic developments in Egypt include the following: • The economic growth rate in Egypt hit 2.2 percent during Q2 FY 2012/13, bringing the
growth rate during the first half of FY 2012/13 to 2.4 percent. Final consumption remains the main positive contributor to economic growth over the first half of FY 2012/13. This highlights the vitality of expansion policies, which target to activate local markets in terms of increasing demand and enhance production.1
• The overall inflation rate (consumer price index) amounted to 8.7 percent during February 2013 and 8.2 percent during March of the same year compared to 6.27 percent in January 2013, according to the Central Agency for Public Mobilization and Statistics (CAPMAS). Meanwhile, the basic inflation rate issued by the Central Bank of Egypt (CBE) recorded an increase in the annual rate up to 7.68 percent in February 2013 from 5.23 percent in January 2013. The increase in the inflation rate is attributed to the price increase in food and non‐food items compared to previous months.2
• Total investments implemented during the first half of FY 2012/13 amounted to some EGP 111.3 billion, whereby the private sector accounted for the bulk with EGP 78.6 billion or 70.6 percent of total investments implemented. The public sector accounted for EGP 32.7 billion or 29.4 percent of those investments.3
• Net foreign direct investments amounted to EGP 301 million during the first half of FY 2012/13 due to the negative repercussions caused by the political and economic develop‐ments in Egypt.4
1 Ministry of Planning, Follow up Report on the First Half of FY 2012/13 2 Central Bank of Egypt 3 Ministry of Planning, Follow up Report on the First Half of FY 2012/13 4 Central Bank of Egypt
Political developments
Economic developments
Political & Econom
ic developments in Egypt
4
A Snapshot of the Egyptian Economy 2013
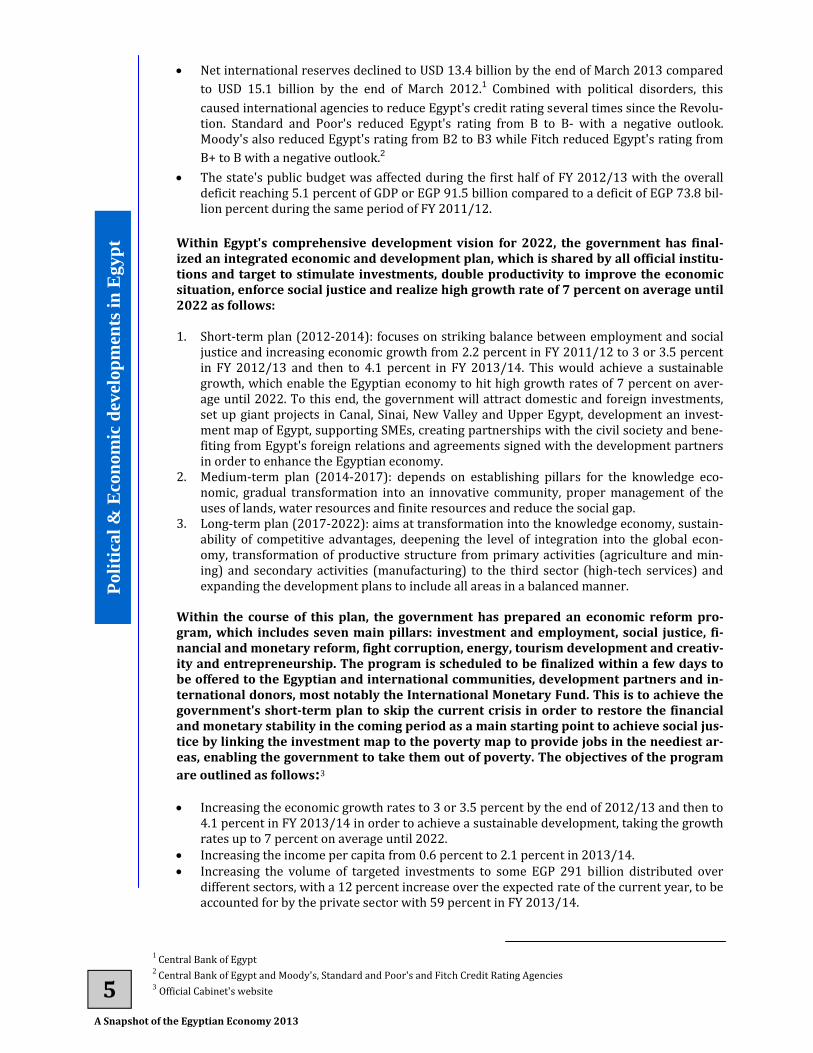
• Net international reserves declined to USD 13.4 billion by the end of March 2013 compared
to USD 15.1 billion by the end of March 2012.1 Combined with political disorders, this caused international agencies to reduce Egypt's credit rating several times since the Revolu‐tion. Standard and Poor's reduced Egypt's rating from B to B‐ with a negative outlook. Moody's also reduced Egypt's rating from B2 to B3 while Fitch reduced Egypt's rating from B+ to B with a negative outlook.2
• The state's public budget was affected during the first half of FY 2012/13 with the overall deficit reaching 5.1 percent of GDP or EGP 91.5 billion compared to a deficit of EGP 73.8 bil‐lion percent during the same period of FY 2011/12.
Within Egypt's comprehensive development vision for 2022, the government has finalized an integrated economic and development plan, which is shared by all official institutions and target to stimulate investments, double productivity to improve the economic situation, enforce social justice and realize high growth rate of 7 percent on average until 2022 as follows: 1. Short‐term plan (2012‐2014): focuses on striking balance between employment and social
justice and increasing economic growth from 2.2 percent in FY 2011/12 to 3 or 3.5 percent in FY 2012/13 and then to 4.1 percent in FY 2013/14. This would achieve a sustainable growth, which enable the Egyptian economy to hit high growth rates of 7 percent on aver‐age until 2022. To this end, the government will attract domestic and foreign investments, set up giant projects in Canal, Sinai, New Valley and Upper Egypt, development an invest‐ment map of Egypt, supporting SMEs, creating partnerships with the civil society and bene‐fiting from Egypt's foreign relations and agreements signed with the development partners in order to enhance the Egyptian economy.
2. Medium‐term plan (2014‐2017): depends on establishing pillars for the knowledge eco‐nomic, gradual transformation into an innovative community, proper management of the uses of lands, water resources and finite resources and reduce the social gap.
3. Long‐term plan (2017‐2022): aims at transformation into the knowledge economy, sustain‐ability of competitive advantages, deepening the level of integration into the global econ‐omy, transformation of productive structure from primary activities (agriculture and min‐ing) and secondary activities (manufacturing) to the third sector (high‐tech services) and expanding the development plans to include all areas in a balanced manner.
Within the course of this plan, the government has prepared an economic reform program, which includes seven main pillars: investment and employment, social justice, financial and monetary reform, fight corruption, energy, tourism development and creativity and entrepreneurship. The program is scheduled to be finalized within a few days to be offered to the Egyptian and international communities, development partners and international donors, most notably the International Monetary Fund. This is to achieve the government's shortterm plan to skip the current crisis in order to restore the financial and monetary stability in the coming period as a main starting point to achieve social justice by linking the investment map to the poverty map to provide jobs in the neediest areas, enabling the government to take them out of poverty. The objectives of the program are outlined as follows:3
• Increasing the economic growth rates to 3 or 3.5 percent by the end of 2012/13 and then to 4.1 percent in FY 2013/14 in order to achieve a sustainable development, taking the growth rates up to 7 percent on average until 2022.
• Increasing the income per capita from 0.6 percent to 2.1 percent in 2013/14. • Increasing the volume of targeted investments to some EGP 291 billion distributed over
different sectors, with a 12 percent increase over the expected rate of the current year, to be accounted for by the private sector with 59 percent in FY 2013/14.
1 Central Bank of Egypt 2 Central Bank of Egypt and Moody's, Standard and Poor's and Fitch Credit Rating Agencies 3 Official Cabinet's website
Polit
ical
& E
cono
mic
dev
elop
men
ts in
Egy
pt
5

A Snapshot of the Egyptian Economy 2013
• Implementing 336 investment projects in different governorates in industrial, tourist and
technological sectors in addition to giant development projects. Topped by these projects is the Suez Canal Axis, which aims to develop the Sharq Al Tafreea Port, the Middle Upper Egypt Project, the Alamein Project and development projects along the Upper Egypt‐Red Sea Road.
• Reducing the unemployment rate from 13 percent to 12.4 percent by the end of 2013 while linking the investment map to the poverty map to provide jobs in the neediest areas.
• Taking the budget deficit to EGP 196.1 billion or 9.5 percent of GDP in FY 2013/14 and to EGP 183.5 billion or 7.7 percent of GDP in FY 2014/15.
• Increasing foreign currency reserves to USD 19 billion by the end of FY 2012/13 and then to USD 22.5 billion in FY 2013/14.
Under changes to the political life in Egypt after the 25th of January Revolution and different approaches to solving the economic crisis in Egypt, the government has taken the following procedures to achieve these objectives: 1. The government has initiated executive procedures to launch a national program for youth
training and employment on the short and medium terms. The program will provide 700,000 real jobs for youth from a development perspective, which is related to opportunities in each sector. The program focuses on geographical areas and categories with a high unemployment rate and considers the difference between the unemployment rate among males (9.2 percent) and females (24 percent).1
2. The government has pursued some policies to increase the state's revenues and decrease the budget deficit including economization of subsidy to petroleum products and natural gas through: a. maintaining the policy of lifting subsidy off natural gas used in energy‐intensive industries, b. listing subsidy off some petroleum products such as petrol octane 95 and using smart cards to economize the consumption of petrol, diesel and butane.2
3. The Minister of Investment has issued a decree to exempt the informal economy enterprises from taxes for a while once they join the formal economy system.
4. The legal reserve on local currency deposits has been reduced by 400 bps. from 14 to 10 per‐cent in 2012 in an attempt to make available additional liquidity in the banking system and facilitate the credit situations in the market.3
5. With the decline of net international reserves, which reached their minimum, the Central Bank of Egypt has announced the launching of a new mechanism, FX Auctions, as of Sunday, December 30, 2012. The mechanism, used to offer regular auctions for banks to purchase or sell USD, is effective in several countries, which endeavour to maintain their monetary reserve and economize its purchases. It will not affect but rather complement and support the US Inter‐bank system.
6. March, 2013 has witnessed a series of resolutions by the Central Bank of Egypt and the gov‐ernment as follows:4
• Launching an initiative to support the tourism sector especially with regards to credit facili‐ties to investors in that sector; the initiative covers both performing and nonperforming cli‐ents.
• The Cabinet has amended the Central Bank Law on allowing travellers to "enter foreign cash" provided that it should be disclosed if exceeding USD 10,000. This resolution has had a posi‐tive impact on the FX market, helping to make available foreign currencies, partially providing additional liquidity of main foreign currencies, acquiring the confidence of Egyptians transfer‐ring their money for investments or as expenses and achieving more flexibility in the move‐ment of money.
• A decision has been taken to reactivate the mechanism of repatriation of funds of foreign in‐vestors, which was implemented in 2000. The mechanism has been expanded to include treasury bills and bonds together with shares.
1 Egypt State Information Service's website 2 Ministry of Planning 3 Central Bank of Egypt, "MPC Press Release". 4 Ministry of Planning
Political & Econom
ic developments in Egypt
6

A Snapshot of the Egyptian Economy 2013
All in all, these actions target to acquire investors' confidence, encourage foreign investments and reactivate the FX market positively. 7. The deposit and lending rates overnight have been increased by 50 bps. up to 9.75 percent
and 10.75 percent respectively. The rate of main transactions (repurchases or auctions) has been increased by 50 bps. up to 10.25 percent. The credit and discount rate has been in‐creased by 75 bps. up to 10.25 percent.1 There is a consensus over the importance of the resolution of the CBE's Monetary Policy Committee to raise the interest rate by 0.5 percent on deposits and loans in order to fight inflation and the increased dollarization. This reflects the that fact the CEB has carried out mechanisms and instruments, which strike balance between priorities under the current economic conditions and the current gap in supply and demand in the FX market due to the shortage of FX resources, which necessitate protection and maintenance of the value of local currency given the increased demand on dollar.
Together with these procedures, the government is discussing new techniques and instruments to finance economic projects in order to increase investments and growth rates. Following is an overview of procedures and legislations suggested by the government and the state's institutions to enhance the Egyptian economy: 1. The Ministry of Petroleum has finalized studies on petrol distribution using smart cards in
order to address abnormal forms of subsidy to petroleum products. According to the new system, the government will not implement the subsidy system for one car per family. Rather, it will implement the subsidy system for a citizen's individual ownership. Each citi‐zen will receive smart petrol cards together with his/her car license while petrol stations will be equipped with a special machine to discount from the citizen's balance on the card. Each owner will have 1,800 litres of subsidized petrol for a 1,600 CC car. Once exceeding the amount of subsidized petrol, the owner should purchase petrol for free non‐subsidised prices. Modern cars over 1,600 CC will have petrol for free prices. 2
2. Within the National Initiative for Economic Take‐off3 adopted by the Ministry of Investment, an SMEs development program was suggested based on the following pillars: access to fi‐nance, provision of business development services in Cairo and governorates, access to mar‐kets, access to information, provision of trained labour, provision of an incentive package to SMEs and rebuilding the pioneering climate in Egypt in order to create a new generation of entrepreneurs and develop thinking and innovation skills.
3. Within the efforts to integrate the informal sector into the formal sector, the government has suggested a plan to overcome the increasing number of projects outside the formal sec‐tor. This includes reduction of bureaucracy and administrative complexities related to the government bodies, provision of alternative sites for workshops in populated areas, ap‐proval of the tax exemption law for years preceding official registration, provision of advi‐sory services (financial and non‐financial) and facilitation of a safe market exist for such projects.
4. The government has the idea of "Islamic Sukuk"4 being the way out from the current crisis. The aim of the sukuk is to provide new and diversified sources of finance together with treasury notes and bonds to overcome the budget deficit.
1 Central Bank of Egypt, press release 2 Egypt State Information Service's website 3 A national initiative for agreement and economic take‐off, which targets to establish the take‐off and comprehensive develop‐
ment phase using the pillar of investment and employment. The investment and employment pillar targets all the state's sectors and governorates in order to provide new resources and achieve economic growth rates starting from 3.5 percent and inject invest‐ments close to EGP 276 billion during this year FY 2012/13 in order to reach an economic growth rate of 7 percent over the coming five years. The initiative focuses in five pillars: business facilitation and clearing out investment barriers; providing investment op‐portunities and national projects to ensure sustainable development, support to SMEs and entrepreneurship, transformation of unofficial to official sector and the public business sector development program (the Ministry of Investment). 4 Sukuk means the involvement of sukuk holders into industrial, agricultural or services projects where they are entitled to dispose
them by sale. Sukuk are subject to profits and losses i.e. a sukuk holder may obtain profits when the relevant project has made profits and bears losses including the loss of capital itself if the project achieves losses. They are by no means different from high‐risk investment funds created by western banks two centuries ago, equity rights in any listed company or forms of participation in ancient civilizations thousands of years ago.
Polit
ical
& E
cono
mic
dev
elop
men
ts in
Egy
pt
7

A Snapshot of the Egyptian Economy 2013
The sukuk are the solely available alternative to borrowing from external donor and means to provide financial liquidity necessary to establish investment and development projects.1 It is worthy of note that it is important for foreigners to take part into these sukuk due to the low lev‐els of local saving whereas the achieving an economic growth rate of more than 7 percent re‐quires to take that level to 30 percent at least. Small savers can also take part in those sukuk. Ma‐laysia, for example, which is the largest market for issuing sukuk, allots a specific portion of su‐kuk issuances to small investors and guarantees their capitals. The government is keen on pro‐viding benefits to attract small savers to take part in the sukuk subscriptions including tax ex‐emption on returns and stipulating that sukuk shall be listed into the stock market, allowing small investors a trading mechanism once they are willing to liquidate their equity.
1 Ministry of Finance 8
Political & Econom
ic developments in Egypt

A Snapshot of the Egyptian Economy 2013
• The Global Consumer Confidence Survey, Nielsen issued in Q2 of 2012 has demonstrated
that the Egyptians' confidence in their economy is still high following a year after the 25th of January Revolution in spite of disturbances, which pervaded the country. Nielsen's inves‐tor's confidence index reported that the Egyptian people's confidence in the economy in‐creased by 6 points in Q2 of 2012.
• A report issued in February 1, 2012 by CI Capital stated that Egypt still remains a major des‐tination for investment and investors in spite of all demonstrations and sit‐ins, which oc‐curred during 2011. The report indicated that the main reason for this is the overpopula‐tion, which represents a real potential for demand in addition to the close transformation into a democratic civil rule, which stimulates investment.
• The report issued by Capital Link Globe in 2013 on the movement of mergers and acquisi‐tions in the Arab world indicated that Egypt accounted for the bulk of acquisitions during 2012 albeit being the most risky year. It highlighted major transactions on the Egyptian market including France Telecom's acquisition of Mobinil, Q‐Invest's acquisition of Hermes, National Bank of Qatar's acquisition of Societie General, National Dubai's acquisition of BNP Paribas, Al Fatim's acquisition of Metro and Kheir Zaman and Gulf Capital's acquisition of Haidlina Medical.
• Egypt was ranked first as the most attractor of transactions in the Middle East for USD 4.6 billion in the first nine months of 2012 according to data issued by Merger Market, a British agency, which is specialised in mergers and acquisitions in Q4 of 2012.
• The Arab Monetary Fund, Standard and Poor's and Middle East News Agency hailed the Egyptian Exchange's performance, which has been classified as one of the highest attractors of investments, having realized relatively high returns in 2012 by 8.3 percent compared to 3.2 percent for the Middle East and Africa and 2.6 percent for the emerging markets.
• Egypt has advanced for position in the Doing Business Report issued by the World Bank and the International Finance Corporation in 2013 compared to the 2012 Report. Egypt was ranked the 109th out of 185 countries, having occupied the best rank in the resolving insol‐vency index in 2013 compared to 2012.
• Egypt was ranked third on GDP as the third largest Arab economy in 2012, having amounted to USD 257 billion in spite of the country's economic crises, according to the In‐ternational Institute of Finance, based on Washington.
• A World Bank's report issued by the end of November 2012 indicated that Egypt was ranked sixth among the largest ten recipients of remittances by Egyptian working abroad totalling USD 18 billion.
• According to the Annual Investment Climate Report issued by the Arab Investment and Ex‐port Credit Guarantee Corporation in 2011, Egypt was ranked first in the Arab World in terms of nest capital inflows during the past eleven years, having amounted to USD 51.2 billion, followed by Saudi Arabia for USD 33.5 billion and Lebanon for USD 26.1 billion. The report expected that total investment expenditure in the Arab World (21 countries) will amount to some USD 4260 billion during the six years between 2012 and 2017. It is ex‐pected to maintain a permanent growth from USD 559 billion in 2012 to USD 778.6 billion in 2017.
• Standard and Poor's has reduced the credit rating of three Egyptian banks from B/B to B‐/C just two days after reducing Egypt's sovereign rating from B to B‐ in December 2012. The agency stated that it has reduced its long and short term credit ratings of the National Bank of Egypt, Misr Bank and the Commercial International Bank. It added that it has a negative outlook of those banks. Standard and Poor's had reduced the long term sovereign rating to B‐. It noted that the rating is subject to more reduction if the exacerbation of political condi‐tions undermines the efforts exerted to support the economy and public budget.
• Moody's has reduced the credit rating of five Egyptian banks including three stated‐owned banks: the National Bank of Egypt, Misr Bank and Banque du Caire from B3 to Caa2 and two private banks: the Commercial International Bank and Bank of Alexandria from B3 to Caa1. Also, it has downgraded all banks' foreign‐currency deposit ratings to Caa2 from Caa1. This followed Moody's reduction of the credit rating of the government's bonds from B3 to Caa1 in March 2013, with the increased purchase of bonds by those five banks and the banking sector increased exposure to risks.1
Egypt in the International Investment Reports
9 1 Reduction of the five banks' credit ratings resulted from the emergency case and curfew in the three Canal governorates (Ismailia, Port Said and Suez) imposed by a presidential decree, ‐

A Snapshot of the Egyptian Economy 2013
It is worthy of note that this reduction does not mean loss of confidence in the Egyptian banking sector. Rather, it highlights a difficulty in obtaining external loans by those banks. • Fitch has reduced the credit rating of Egypt from B+ to B due to the confusion surrounding
the political scene, decline of cash reserves, uncertainty of obtaining the IMF loan, the diffi‐cult financial situation of the government and foreign money exist from the Egyptian mar‐ket.
• In spite of Egypt's position falling back from the second to fourth rank generally in the 2011/12 report, it has been ranked first in the economic and human resources index, which is primarily attributed to the big number of large and giant FDI projects established since 2003 in Egypt compared to other African countries, according to the FDI African Countries of the Future 2011/12 Report. Moreover, Egypt was ranked second as the best FDI recipient and the best infrastructure owner.
Egypt in the International Investment Reports
10
‐ the decline of foreign reserves during January 2013 by USD 1.4 billion down to USD 13.6 billion compared to USD 15 billion by the end of last December and the rating of the government's bonds being affected by the uncertain conclusion of a final agreement with IMF on a loan to Egypt amounting to USD 4.8 billion, which questions the government's capability of implementing a program to enhance the country's economy.

A Snapshot of the Egyptian Economy 2013
The gross national product in market prices declined during Q2 of FY 2012/13, whereby it grew by 2.2 percent compared to 2.6 percent during Q1 of FY 2012/13.
The inflation rate recorded by the headline consumer price index (CPI) (year‐on‐year basis) amounted to 9 percent during May 2013 compared to 8.6 percent during May 2012, according to the data issued by the Central Agency for Public Mobilization and Statistics.
Gross National Product (GDP)
Fig(1): GDP Growth Rates: (Q1 2008/09—Q2 2012/13)
Source: Ministry of Planning
Inflation
Fig(2): Consumer Price Index (yearonyear basis)
Source: CAPMAS
Main Macroeconom
ic Indicators
11

A Snapshot of the Egyptian Economy 2013
According to the ILO's standards, the unemployment rate recorded relative stability, whereby it hit 13.2 percent of the workforce during Q1 of 2013 compared to 13 percent during Q4 of 2012, whereas it recorded 12.6 percent during Q1 of 2012.
Some major sectors have recorded a gradual improvement, whereby the manufacturing sector grew from ‐3.1 percent during the first half of FY 2011/12 to a positive growth of 2.4 percent during the first half of FY 2012/13. The tourism sector also recorded a growth of 7.8 percent during the first half of the current fiscal year compared to ‐8.6 percent during the same period of FY 2011/12. The construction and building sector grew by 4.5 percent during the first half of FY 2012/13 compared to ‐1.6 percent during the corresponding period of the previous fiscal year. The manufacturing, tourism, agriculture, construction and building and retail and wholesale trade accounted for 70 percent of the GDP increase achieved during the first half of FY 2012/13.
Unemployment
Fig(3): Unemployment Rate
Source: CAPMAS
Sectoral Growth Rates
Fig(4): Sectoral Growth Rates
Source: Ministry of Planning
Main Macroeconom
ic Indicators
12

A Snapshot of the Egyptian Economy 2013
The net international reserves held by the Central Bank of Egypt declined to USD 16 billion by the end of May 2013, down by 55.6 percent compared to a balance of USD 36 billion by the end of December 2010, which is the highest level. In May 2013, the cash reserve went up by 11.1 per‐cent compared to April 2013.
The trade deficit increased by 7.6 percent up to USD 16.8 billion during the period from July to December of FY 2012/13 compared to USD 15.6 billion during the corresponding period of the previous fiscal year. This is attributed to the increase of payments for commodity imports by 3.6 percent to reach USD 30.2 billion during the first half of FY 2012/13 compared to USD 29.2 bil‐lion during the same period of the previous fiscal year, in addition to the decrease of the pay‐ments for commodity exports by 1% reaching USD 13.4 billion during the first half of the current fiscal year compared to USD 13.6 billion during the same period of previous fiscal year.
Fig(5): Net International Reserves
Source: Central Bank of Egypt
Fig(6): Imports & Exports
Source: Central Bank of Egypt
Main Macroeconom
ic Indicators
13
Imports and Exports
Net International Reserves

A Snapshot of the Egyptian Economy 2013
Following its meeting held on Thursday, March 21, 2013, the Monetary Policy Committee (MPC) decided to raise the overnight deposit and lending rates by 50 bps to reach 9.75 percent and 10.75 percent, respectively compared to their previous levels of 9.25 percent and 10.25 percent respectively. Moreover, the CBE decided to raise the credit and discount rates to reach 10.25 percent by 75 bps from its previous level of 9.5 percent and raise the repurchase transactions (Repo) rate to 10.25 percent compared to its previous level of 9.75 percent.
The Arab and foreign exchange rates continued their upward trend with the USD reaching new record level due to the rare demand at exchangers. During April 2013, the USD exchange rate in banks reached EGP 6.965 with projections to maintain its upward trend in the coming period. The exchange rates of Euro, Pound Sterling and other currencies recorded an upward trend.
Fig(7): Deposit & Lending Rates
Source: Central Bank of Egypt
Main Macroeconom
ic Indicators
14
Interest Rates
Exchange Rates
Fig(8): Exchange Rates (EGP vs USD)
Source: Ministry of Finance and Central Bank of Egypt

A Snapshot of the Egyptian Economy 2013
During the first half of FY 2012/13, a significant number of economic sectors achieved positive growth rates compared to the corresponding period of FY 2011/12, especially such sectors as tourism, construction and building and manufacturing industries while other sectors such as the communications and information technology, real estate activities, public utilities and agriculture achieved high growth rates during the first half of FY 2012/13 compared to the corresponding period of the previous fiscal. The following graph shows the leading sectoral economic growth rates during the first half of FY 2012/13:
The following part shows the major economic sectors i.e. tourism, construction and building, communications and information technology and manufacturing industries in addition to the banking sector which had a significant role in supporting the Egyptian economy during the past period:
Tourism is one of the main economic sectors in Egypt being a major source of foreign exchange during the period from 2001 to 2010. Moreover, it is a main source of national economy, attract‐ing to Egypt some USD 12.5 billion per year, accounting for 12 percent of GDP and absorbing some 1.4 million direct and four million indirect workers.1
In spite of the economic recession in EU markets, which caused the decrease in the number of European tourists visiting Egypt, the country enjoys an outstanding location and a mild weather, which enables it to attract middle‐class tourists from emerging markets in order to offset the decline in the number of European tourists.2 Egypt was ranked fourth in terms of price competition in the tourism industry although Egypt went back by ten ranks in the classification of the Global Economic Forum for Tourism in 2013 to occupy the 85th rank out of 140 countries instead of the 75th rank in 2011. This is attributed to the absence of sufficient safety and security in addition to the low quality of public services in the Egyptian street. Egypt was ranked 76th in terms of the rules of politics and regulations; ranked 18th in terms of priorities of travel and tourism; ranked 57th in terms of health care and infrastructure of air transport; ranked 80th in providing communications and information technology; ranked 96th in terms of the infrastructure of inland transport and ranked 90th in the tourism infrastructure. The report explained that the Egyptian human resources in the tourism sector occupied the 105th rank on the international ranking, the 60th rank in the availability of tourist attraction factors and the 87th ranks in the way of natural resources usage.3
Leading Sectors of the Egyptian Econom
y
Fig(1): Sectoral Economic Growth Rates (First Half of FY 2012/13)
Source: Ministry of Planning
Tourism Sector
1 Oxford Business Group, “The Report – Egypt 2012”. 2 Oxford Business Group, “The Report – Egypt 2012”. 3 World Economic Forum (2013), "The Travel and Competitiveness Report" .
7.8
4.5 4.3
3.6
2.92.4
0
1
2
3
4
5
6
7
8
9
Tourism Building and Construction
Communication and Information Technology
Real estate Agriculture Manufacturing
�
15

A Snapshot of the Egyptian Economy 2013
Recently, Russian tourists have been among the most frequent visitors to Egypt, having accounted for 1.8 million tourists in 2011 while the Gulf area represents a promising market for tourists coming to Egypt.1 Action has been taken to attract more tourists to Egypt by reducing prices and promoting a number of tourist offers and entertainments.2 The tourism sector has witnessed a gradual and notable im‐provement in terms of the sector's growth, whereby it has changed its position from a nega‐tive growth (‐8.6 percent) during the first half of FY 2011/12 to a positive growth rate of 7.8 percent during the first half of FY 2012/13.3
Tourist revenues increased by 12 percent during the first half of FY 2012/13 compared to the corresponding period of the previous fiscal year. This has coincided with an accelerated growth in the number of incoming tourists in terms of the num‐ber of visitors and the number of nights by 10 percent and 8.5 percent, respectively during the first half of FY 2012/13 compared to the corresponding period of the previous fiscal year.4
The following table indicates revenues, tourist nights and the number of tourists during the first half of FY 2012/13 as follows:
It is worthy of note that the current Egyptian economic reform program in‐cludes new procedures to support the tourism sector such as the establish‐ment of a tourism support fund, which will provide the necessary subsidy dur‐ing the period when the energy subsidy will be lifted off the tourism sector in order to alleviate its repercussions.5 The Ministry of Tourism targets to attract some 25 million tourists by 2010 in spite of the current situation in Egypt, while attention will be paid to niche classes by the development of retirement tourism and entertainment activities.6
1 Oxford Business Group, "The Report‐Egypt 2012". 2 Oxford Business Group, "The Report‐ Egypt 2012". 3 Ministry OF Planning. 4 Ministry OF Planning. 5 Central Bank of Egypt. 6 Oxford Business Group, "The Report‐Egypt 2012".
Table (1): Tourism Sector Indicators
Source: Ministry of Planning and Ministry of Finance
Leading Sectors of the Egyptian Econom
y
16
Tourism Sector Indicators First Half of FY 2012/13
Tourism revenues USD 5.66 billion
No. of tourism nights 77.4 million nights
No. of tourists 6.3 million tourists
"Egypt is a pivotal destination on the company's map. The tourism sector currently needs to send assurance messages to investors, highlighting Egypt's position as a significant tourist destination in the region. This requires proving the restoration of security and stability, which together contribute into the recovery of activity and growth in all eco‐nomic sectors, but not only the tourism sector". Enan El Galaly, Chairman and Founder of Helnan International Hotel Group.

A Snapshot of the Egyptian Economy 2013
The construction and building sector is one the most affected sectors by the global crises (such as the global financial crisis in 2008 and the Euro‐pean crisis in 2011) and local crises following the 25th of January Revolution. Over the past two months, the real estate sector has suffered from political disturbances and judicial disputes on lands obtained by some property companies, caus‐ing the sector to suffer from risks related to the implementation of projects, finance and sluggish‐ness of sales.1
The government acts to support the growth of the sector by paying attention to the design and inno‐vation services in order to cope with the require‐ments of global markets, the development and improvement of new exporters and increasing companies' productivity. This will be achieved by supporting the quality control systems, increasing productive efficiency, reducing energy consump‐tion and preserving the environment.2 As part of efforts to improve the sector, the Housing and Building National Research Center, through its Construction Engineering and Construction Management Research Institute, contrib‐utes to academic and applied research and provides technical advice in the field of construction engineering, project management and overall quality systems in order to develop the construction and building technology, increase the efficiency of project management in addition to amend legis‐lation affecting the industry in collaboration with official bodies and regional organizations and taking action to integrate such legislation regionally.3 It is worthy of note that the chairman of Jones Lang Lasalle, a leading property investments and consultations company, highlighted the positive outlook of the real estate market in Cairo on the long run in spite of challenges of political instability, according to the company's report of 2012. He added that the real estate activity in Cairo will remain suffering from recession on the short run due to the post‐revolution political instability. Nevertheless, despite those developments, the ba‐sics of the property market in Cairo remain unchanged and prospects seem to be positive with the increasing transparency, which would make Egypt more attractive to business on the long run compared to the pre‐revolution period. The report explained that the local demand will remain a momentous for the sector growth once security and safety are regained. The construction and building sector has witnessed a development in the growth rate, achieving a positive rate of 4.5 percent during the first half of this fiscal year compared to a negative rate of ‐1.6 percent during the corresponding period of FY 2011/12.
Meanwhile, the sector revenues increased remarkably during the first half of FY 2012/13, having contributed 8.6 percent into GDP, in spite of the recent economic and political repercussions in Egypt.6
Construction and Building Sector
1 General Authority for Investment and Free Zones (2012), "Snapshot of the Egyptian Economy, September 2012". 2 Industrial Modernization Center website, Building materials and mineral industries. 3 The Housing and Building National Research Center, Construction Engineering and Construction Research Institute. 4 http://www.companiesandmarkets.com/MarketInsight/Construction/Global‐Construction‐Market/NI5936 5 http://www.companiesandmarkets.com/MarketInsight/Construction/Global‐Construction‐Market/NI5936 6 Ministry of Planning.
Generally, there are four types of construction and building:4
1. Residential buildings; 2. Industrial buildings' 3. Commercial compounds; 4. Heavy civil establishments. Often in most of the developed or emerging countries, the residential construction and building accounts for almost half of the total market. On the other hand, building of in‐frastructure and commercial establishments accounts for the same portion with some 25 percent of total sector for each.5
Leading Sectors of the Egyptian Econom
y
17

A Snapshot of the Egyptian Economy 2013
The following table presents the growth rate and the number of new establishments and expansions in the sector during the first half of FY 2012/13:
According to the Business Doing Report 2013 issued by the World Bank and the International Fi‐nance Corporation, Egypt was ranked 165th among 185 countries covered by the report in terms of issuing building licenses versus the 158th rank in the past year.1 Therefore, main challenges facing the construction and building sector in Egypt include the ab‐sence of a clear legislative and legal framework, which governs the procedures of land ownership and project finance, in addition to high prices of building materials and lack of trust between in‐vestors and the government.2
The communication and information technology sector is one of the four pillars for building the knowledge economy being a major contributor of the economic and social development. The sec‐tor accounted for 5.3 percent of the GDP during the first half of FY 2012/13, while the sector real growth amounted to 4.3 percent during the first half of FY 2012/13.3 Therefore, the development of the CIT infrastructure has become the focus of activities along with building a national industry, which is based on modern technology in order to prepare a young generation, which is capable of acquiring knowledge and information and keeping abreast of the information revolution. The Ministry of Communication and Information Technology's ITIDA adopts the Education Devel‐opment Program for Egyptian Universities, which was launched in Egypt in 2008 for the develop‐ment of the skills of a group of the university students from 13 Egyptian universities in the CIT field. The ITIDA was established in 2004 to develop the IT industry, attract FDI and prepare trained and skilled calibers.4 Egypt occupies an advanced rank in the field of out‐sourcing, having been ranked 4th in 2011, according to the Global Service Location Index, issued by AT Kearney, which measures the main elements for a location to be an attractive location for service pro‐vision. The 50 countries on the index have been selected this year on the basis of companies' inputs, services to current activities and the government's initiatives to support the sector. Assessment has taken place using 39 indices covering three main categories: financial attractiveness, available skills and the availability of business environment.5
1 The World Bank and IFC (2013), "Doing Business Report". 2 http://www.companiesandmarkets.com/MarketInsight/Construction/Global‐Construction‐Market/NI5936 3 Ministry of Communication and Information Technology 4 Oxford Business Group, "The Report‐ Egypt 2012" 5 A.T Kearney Global Services Location Index (2011), Offshoring Opportunities Aimed Economic Turbulence.
Communication and Information Technology (CIT)
Table (2): Construction and building sector indicators
Source: General Authority for Investment and Free Zones
Leading Sectors of the Egyptian Econom
y
18
Construction and Building Sector
Indicators
First half of FY 2012/13
Sector Growth rate %4.5
Sector share in economic growth %8.6
No. of new establishments companies487
No. of expansions companies67

A Snapshot of the Egyptian Economy 2013
Main indicators of the CIT Sector I. Number of Internet users
The number of internet users amounted to 32.67 million users during February 2013, growing by 11.24 percent per annum during the same period. The number of ASDL subscribers amounted to 2.29 million during February 2013, growing by 23.11 percent per annum. The mobile broadband internet subscribers amounted to 10.78 million during the same period, growing by 3.59 percent per annum. The following graph presents the relative distribution of the internet users during February 2013:
II. Number of mobile and landline phone subscribers The number of the landline phone amounted to 8.61 million subscribers during February 2013 while the number of mobile phone subscribers amounted to 94.47 million subscribers during the same period. The growth of mobile phone users recorded an annual growth of 2.87 percent during February 2013 while the mobile penetration reached 113.76 percent, growing annually by 1.02 percent during February 2013 as shown in the following graph:
III. International internet bandwidth per capital during February 2013: The international internet bandwidth reached 214.40 Gbps during February 2013, while recording an annual growth of 17.02 percent during the same period. The Ministry of Communication and Information Technology targets to provide the mobile money transfer within a year in addition to the GPS‐based tracing services in 2013.1
Fig(2): Internet Users by Mode of Access (Feb 2013)
Source: Ministry of Communication and Information Technology
Leading Sectors of the Egyptian Econom
y
19
Fig(3): Mobile Subscription (Feb 2012—Feb 2013)
Source: Ministry of Communication and Information Technology
1 Ministry of Communication and Information Technology

A Snapshot of the Egyptian Economy 2013
The manufacturing sector remains the heart of the Egyptian economy being based on strong and concrete industries such as garments, food industries, consumer commodity and car assembly. The large population of Egypt has created an attractive market for manufactured goods due to the purchasing power and increased demand for consumer goods. This would increase the pace of macroeconomic growth and national income per capita.1
During Q2 of FY 2012/13, the manufacturing industries sector has recorded a growth rate of 2 percent compared to 2.8 percent during Q1 of the same fiscal year. The first half of FY 2012/13 recorded an increase in the growth rate, having amounted to 2.4 percent compared to ‐3.1 percent during the first half of FY 2011/12. 2 Investments in the manufacturing industries sector accounted for 12.8 percent of total invest‐ments implemented during Q2 of FY 2012/13 compared to 11.8 percent during the same period of FY 2011/12 as explained in the following table.3
The industrial policies are being implemented by a number of bodies including GAFI's One‐stop Shop in order to serve investors and promote investments as well as the Industrial Modernization Center, which seeks to develop and encourage both public and private sectors in order to deepen the Egyptian ties at the level of global economy.4
The sector faces a number of challenges including the closure of several factories following the 25th of January Revolution. "The Egyptian Democratic Labour Congress (EDLC) and the Solidarity Center" issued its annual report on the status of syndicate freedoms in Egypt during the second year of the Revolution. The report has monitored initial indictors of the current economic situa‐tion including the closure of more than 4,000 factories It emphasized figures related to the num‐ber of closed factories, which is proved by Egypt's declined position on the project closure and resolving insolvency index, having occupied the 131st rank globally out of 185 countries in 2013. This means that investors suffer from several difficulties in safe exist from the market, which is a barrier to making a decision to invest in Egypt. However, Egypt was ranked 26th on the starting of a business index according to the World Bank. Other challenges include the absence of skilled technical workers and the necessity of improving the technical education; the education experts in Egypt agree that the technical schools and insti‐tutes are of a rather low level and need substantial improvements; trainers need to be trained in modern teaching methodology; such technical schools provide no skills of communication and critical thinking; technical schools lack tools and equipment and have congested workshops and labs.
1 Oxford Business Group, "The Report‐ Egypt 2012" 2 Ministry of Planning 3 Ministry of Planning 4 Oxford Business Group, "The Report‐ Egypt 2012"
Manufacturing Sector
20
Leading Sectors of the Egyptian Econom
y
Table (3): Manufacturing Sector Indicators
Source: Ministry of Planning and General Authority for Investment and Free Zones
Manufacturing Sector Indicators FY 2012/13 Q1 Q2 First Half
Growth rate of the sector 2% 2.8% 2.4% Sector share in total investments
implemented (Q2) 12.8% 11.8% 12%
No. of new establishments 444 622 1066 No. of expansions 109 141 250

A Snapshot of the Egyptian Economy 2013
All these factors make it difficult to provide high quality training for teachers or provide opportuni‐ties for the development of practical skills, which meet the requirements of the private sector. For these challenges to be surmounted, attention should be paid to the technical education sector in order to prepare a skilled workforce and cope with the need of the labor market. This will be achieved through flexibility in development and innovation, creating standards, conduction regular assessments to measure how far these schools comply with common standards and developing training programs for all ages and professional levels so that personnel may find an appropriate training for their needs and the market's needs. 1 Empirical studies have shown that well‐designed programs for technical and vocational education and training play a major role in creating jobs, enhancing social justice and supporting the global competitiveness of a given country. 2
The banking financial services sector is a major economic one not only because it affects and is af‐fected by other sectors but also because it has social impact, which touches different classes di‐rectly and indirectly. This is true through the tasks carried out by various financial bodies and insti‐tutions, leading to economic and social results. Regulations, laws and procedures adopted seek to enhance confidence into the Egyptian financial and banking system, enabling investors to have complete access to services within a short time, given measures and legal restrictions, which en‐sure direction of investments, especially foreign ones, into sectors targeted for diversification by the state's economic plan.
The Central Bank has improved the Egyptian banking sector over two phases as follows: −
The first phase, initiated in 2004 and ended in 2008, included such main pillars as the privati‐zations and mergers in the banking sector and overcoming the banks' non‐performing loans. The Central Bank of Egypt decided to exempt banks, which provide loans and credit facilities to different enterprises, from the legally decided reserve level, depending on loans and credit fa‐cilities granted by them. It also decided to implement the corporate governance principles in Egyptian banks, restructure the public sector banks both financially and administratively and ensure facilitation of the establishment and development of SMEs. Moreover, it pursued the development of technical and professional development of the Supervision and Control De‐partment of the Central Bank of Egypt. 3
− The second phase started in January 2009 and ended in March 2012; its main pillars included the development and implementation of a comprehensive financial and administrative restruc‐turing of public banks and regular follow up of the results of the first phase of the restructuring program of the National Bank of Egypt, Misr Bank and Banque du Caire. This phase also cov‐ered the implementation of Basel 2 standards in Egyptian banks to support their risk manage‐ment capacity by adopting a twofold strategy: facilitation and consultation with banks to en‐sure implementation of those standards by all units of the banking sector and taking action to review and issue corporate governance principles of banks and the Central Bank. The second phase adopted an initiative to increase and improve access to finance and banking services especially for SMEs.4
As part of action to develop the sector and overcome the recent political and economic conditions, the Central Bank has adopted the following procedures and resolutions:
− The Cabinet has amended the Central Bank Law on allowing travellers to "enter foreign cash" provided that it should be disclosed if exceeding USD 10,000. This resolution has had a positive impact on the FX market, helping to make available foreign currencies, partially providing ad‐ditional liquidity of main foreign currencies, acquiring the confidence of Egyptians transferring their money for investments or as expenses and achieving more flexibility in the movement of money.
1 Handousa, Heba (2010), "Situation Analysis: Key Development Challenges Facing Egypt". 2 USAID Egypt. 3 Central Bank of Egypt, “Basil & the Egyptian financial sector—October 2012”. 4 Central Bank of Egypt, "Annual Report 2011/12" 21
Leading Sectors of the Egyptian Econom
y
Financial Services Sector

A Snapshot of the Egyptian Economy 2013
− The Central Bank has issued several initiatives including one to support the tourism sector with an incentive package to support investors in the tourism sector. It also included exemp‐tion of deferred debts from default penalties, while interests would be maintained.
− The Central Bank has issued two initiatives to surmount obstables to FDI inflows into securi‐
ties and treasury notes; as the decision of the repatriation mechanism that has been taken to reactivate the mechanism for repatriating funds of foreign investors and foreign investments funds, which was implemented in 2000. The mechanism has been expanded to include treas‐ury bills and bonds together with shares.
− The Central Bank of Egypt launched a new mechanism, FX Auctions, as of December 30, 2012.
The mechanism, used to offer regular auctions for banks to purchase or sell USD, is effective in several countries, which endeavour to maintain their monetary reserve and economize its purchases. It will not affect but rather complement and support the US Interbank system.
The following table presents main indicators of the banking sector, which reflect its potential and capacity to cope with crises of the country:
The above table indicates that international reserves has remained at USD 15 to 15.5 billion since February 2012, declining in March 2013 to USD 13.4 billion because the Central Bank has paid some installments of international debts and intervened to prevent speculations. The USD –EGP exchange rate increased whereby the USD exchange rate grew by 1.7 percent during the pe‐riod from July to December 2012. As for the banks' financial soundness indicators, their capital adequacy ratio (capital/ risk‐weighed assets) amounted to 15.7 percent by the end of June 2012 versus a minimum of 10 per‐cent. Non‐performing loans amounted to 9.9 percent of total gross loans by the end of June 2012 compared to 11 percent by the end of June 2011 while the loan provisions accounted for 95.4 per‐cent of non‐performing loans compared to 93.6 percent by the end of June 2011. Total credit facilities balance amounted to EGP 516842 million by the end of December 2012 dis‐tributed over the government (EGP 35141 million) and non government (EGP 481701 million).
Leading Sectors of the Egyptian Econom
y
22
Table (4): Main indicators of the Egyptian banking sector
Source: Central Bank of Egypt
Item Indicators
Net interna onal reserves: end of FY 2011/12 End of March 2013
USD 15.5 billion USD 13.4 billion
USD exchange rate change (July‐ December 2012) 1.7%
Banks' financial soundness indicators (FY 2011/12) including: Capital adequacy ra o Non‐performing loans to total gross loans Loan provision to non‐performing loans
15.7% 9.9% 95.4%
Total credit facili es balance by the end of December 2012 (EGP million): Government Non‐government
516842 35141 481701
Development of interest rates on deposits and loans (December 2012): Interest on loans for less than or equalling one year Interest on deposits for more than six months and less than or equalling one year Interest on deposits for more than three months and less than or equalling six months Interest on deposits for more than one month and less than or equalling three months
12.2% 9% 7.9% 7.6%

A Snapshot of the Egyptian Economy 2013
As for the development of interest rates on deposits and loans, which reflect the sector per‐formance during December 2012, the table indicates the slight increase of the interest rate on loans for less than or equaling one year up to 12.2 percent in the last week of December 2012. Interest rates on deposits for more than six months and less than or equaling one year up to 9 percent dur‐ing the same period. The interest rate on deposits for more than three months and less than or equaling six months did not change during November and December 2009, remaining at 7.9 per‐cent. The interest rate on deposits for more than one month and less than or equaling three months amounted to 7.6 percent during the last week of December 2012. In spite of the efforts exerted by the government and the Central Bank to overcome the negative effects of the current situation, some challenges still hinder the Egyptian banking sec‐tor including the political and security instability in Egypt, the negative impact on the international reserve, which went down to USD 13.4 billion in March 2003, the emergence of a parallel FX mar‐ket, which overwhelmed the official market and the decline of Egypt's credit rating over the past two years according to the international rating agencies reports. However, the governor of the Cen‐tral Bank said that the decline of credit rating has not affected much the Egyptian banks for they are not borrowers from abroad while the main effect takes place during external transactions espe‐cially when opening documentary credits and letters of guarantee.
Leading Sectors of the Egyptian Econom
y
23

A Snapshot of the Egyptian Economy 2013
a. Market Totals EGX has witnessed a relatively high trading records in 2012 compared to 2011, registering a trad‐ing value of EGP 185 billion as opposed to EGP 148 billion last year. Moreover, the volume traded soared to reach 34 billion securities in 2012 compared to 18.5 billion securities in 2011. Likewise, the number of transactions recorded 6 million transactions in 2012 versus 5.6 million transactions in 2011. The value traded of the main market amounted to EGP 166.5 billion in 2012 compared to EGP 131 billion in 2011. Worth mentioning that a deal was executed on Egyptian Company for Mobile Ser‐vices (MobiNil) in May 2012, with a value of EGP 19 billion. Additionally, volume traded of the main market reached 33 billion securities this year as opposed to 17 billion securities in 2011. On the other hand, Over the Counter (OTC) market registered a trading value of EGP 18 billion dur‐ing the year compared to EGP 17.5 billion in 2011. Meanwhile, the OTC trading volume retreated to 1.4 billion securities in 2012, down from 1.6 billion securities last year. From anther perspective, Nilex market trading figures surged in 2012 compared to the year before, recording a trading value of EGP 247 million compared to EGP 191 million in 2011. Moreover, the trading volume amounted to 81 million securities in 2012 as opposed to 31 million securities last year. The market capitalization of the main market listed stocks witnessed a 28% increase in 2012, con‐cluding the year at EGP 376 billion as opposed to EGP 294 billion at the end of 2011, representing 24% of GDP.
Market Aggregates
The Egyptian
Stock Excha
nge Market
25
Table (1): Sector Indices, 5 Most Active Sectors in terms of Volume Traded in 2012
Source: The Egyptian Exchange
Fig(2): Sectoral Indices Performance in 2012
Source: The Egyptian Exchange

A Snapshot of the Egyptian Economy 2013
The Egyptian Exchange grew by 51 percent during 2012; a level, which has not been achieved since 2007. The stock market is almost the sole economic sector, which managed to grow as such amidst these events in spite of the remarkable fluctuations in the market during 2012. All in all, the Egyptian Exchange has attained a record growth, with is the highest among all emerging and developed exchanges (following Turkey) in 2012. At the level of trade volumes in 2012, the market's performance improved compared to the previ‐ous year, with the volume jumping to 34 billion securities; a figure, which has not been achieved even during the pre‐ Revolution period. The value of trade amounted to EGP 185 billion compared to EGP 148 billion in 2011. The number of transactions implemented went up to over six million transactions compared to 5.6 million transactions in 2011. The market capitalization of shares listed on the man market soared to EGP 376 billion by the end of 2012 compared to EGP 294 bil‐lion by the end of 2011. The Egyptian Exchange is expecting more economic and political stability in order to realize more growth in the period to come. The Egyptian market witnessed an outstanding performance during the year 2012, with all indices realizing gains. EGX 30 index surged by 51% over the year. Likewise, EGX 70 & EGX 100 indices soared by 15% & 24%, respectively. The Egyptian market started the year on a positive note, following the parliamentary elections and the transfer of legislative power to the parliament. The market continued its good performance till the end of February & took off remarkably during the month of March. The market, however, pulled down affected by the political unrest related to the constitutional committee & the preparation for the presidential election. This lackluster performance lasted till the end of the Presidential election's second round. With the beginning of the 2nd half of the year, the market showed an upward tend performance till the month of November, during which political tensions took place, which affected the market negatively till the beginning of December. The market, however, rebounded again on the back of the finalization of the constitutional referendum, which pushed the market up to continue rising till the end of the year despite being disturbed by the credit rating downgrade.
All sectors traded on the Egyptian Exchange recorded an increase during the 2012 transactions, with the basic supplies sector accounting for the bulk of increase by 146 percent, followed the banks sector with 82 percent in growth.
The Egyptian
Stock Excha
nge Market
24
Fig(1): Market Indices Performance in 2012
Source: The Egyptian Exchange
Sectoral Indicators

A Snapshot of the Egyptian Economy 2013
b. EGX Indices' Constituents EGX30 achieved EGP 81.3 billion in the value of trade and 26.4 billion securities in the volume of trade during 2012. The value and volume of trades for EGX70 amounted to EGP 40.1 billion and 5.2 billion securities respectively. The value of trade on EGX70 amounted to EGP 121.4 billion dur‐ing 2012 while the volume of trade on EGX70 reached 31.6 billion securities.
Fig(3): Monthly Trading Value and Volume during 2012
Source: The Egyptian Exchange
Fig(4): Listed vs. Traded Companies in the Main Market (2007 2012)
Source: The Egyptian Exchange
26
The Egyptian
Stock Excha
nge Market
Fig(5): Trading Value & Volume (2007 2012)
Source: The Egyptian Exchange

A Snapshot of the Egyptian Economy 2013
c. Activities of the most ten active companies in terms of the volume and value of trade on the main market Oracrom Telecom, Media and Technology was ranked first in terms of the volume of trade on the main market during 2012, having recorded 10.9 billion securities in the volume of trade and EGP 9.5 billion in the value of trade. It was followed by Palm Hills for Development with EGP 2.7 billion in the volume of trade and EGP 5.8 billion in the value of trade. The following table shows the most ten active companies in terms of the volume and value of trade on the main market:
The Egyptian
Stock Excha
nge Market
27
Fig(6): Trading Value and Volume & No. of Trades in 2012
Source: The Egyptian Exchange
Table (3): The Most Ten Active Companies in Terms of the Volume and Value of Trade on
the Main Market in 2012
Source: The Egyptian Exchange
Table (2): Trading Value and Volume & No. of Trades in 2012
Source: The Egyptian Exchange

A Snapshot of the Egyptian Economy 2013
Performance of the Nile Exchangelisted companies The Nile Exchange recorded a relative increase in the volume of trade during 2012 compared to 2011, with the volume of trade more than doubling to 81 million securities, while the value of trade increased up to EGP 247 million compared to EGP 191 million during 2011. The number of the Nile Exchange‐listed companies was 22 by the end of 2012.
A Individuals vs. Institutions The Egyptian market was dominated by Institutions, accounting for 50% of the value traded dur‐ing 2012, as opposed to 59% during 2011. Likewise, individuals accounted for 50% of the value traded during 2012, as opposed to 41% during the previous year. Meanwhile, institutions ended the year 2012 as net sellers, recording net outflows of EGP 1.5 bil‐lion versus EGP 1 billion net outflows during 2011, after excluding deals.
Table (4): Nilex Companies Performance in 2012
Source: The Egyptian Exchange
The Egyptian
Stock Excha
nge Market
28
Investors’ Trading Activity in the Egyptian Market
Fig(7): Individuals vs. Institutions in Terms of Value Traded in 2012
Source: The Egyptian Exchange

A Snapshot of the Egyptian Economy 2013
B Egyptians vs. Foreigners Foreigners accounted for 21% of the total value traded in 2012, of which 6% was captured by Arab investors, while the remaining 15% was captured by non‐Arab foreign investors, after excluding deals. The non‐Arab foreign investors' trading activity was significantly affected by the successive events Egypt witnessed which led to a state of political unrest. As a result, they generated net outflows of EGP 3.6 billion compared to net outflows of EGP 4.3 billion in 2011. Meanwhile, Arab investors re‐corded net inflows of EGP 1.6 billion compared to EGP 188 million net inflows in 2011, after ex‐cluding deals.
The market capitalization of the listed stocks on the main market inched up by 28% during 2012 to culminate at EGP 376 billion, recording an increase of more than EGP 82 billion and representing 24% of the GDP, as depicted in the table and the figure below.
Fig(8): Egyptians vs. Foreigners in Terms of Value Traded in 2012
Source: The Egyptian Exchange
The Egyptian
Stock Excha
nge Market
Market Capitalization
Table (5): Market Capitalization Indices in 2012 vs. 2011
Source: The Egyptian Exchange
29

A Snapshot of the Egyptian Economy 2013
The bond market's trading activity surged remarkably during 2012 as opposed to the previous year. The value traded of bonds reached EGP 38 billion compared to EGP 31 billion in 2011. Like‐wise, the volume traded of bonds recorded 37.5 million bonds versus 35 million bonds in 2011. Treasury bonds issued through the Primary Dealers System still account for the lion’s share of the total bond's trading activity, making up 99.8% of the total bonds' trading value and 98% of the total bonds' trading volume during the year. Meanwhile, corporate bonds witnessed a decline in their trading activity in 2012, with their value traded registering EGP 68 million, down from EGP 227 million last year. Similarly, corporate bonds' trading volume reached 760 thousand bonds versus 1.7 million bonds in 2011.
Bonds
Table (6): Trading Aggregates for Bonds in 2012
Source: The Egyptian Exchange
The Egyptian
Stock Excha
nge Market
30

A Snapshot of the Egyptian Economy 2013
FDI flows are a main source of external finance to developing countries, being used to finance the gap between investment and domestic savings. FDI has positive impact on the national economy, being able to transfer advanced technology and marketing and administrative expertise as well as contributing into raising the productivity level and creating more jobs. As such, both developing and developed countries seeks to put in place policies, which help attract FDI. During the first half of FY 2012/13, FDI net inflows amounted to USD 301.4 million due to the de‐cline of FDI in the petroleum sector. Investments in new establishments or expansions achieved net inflows of USD 979.6 million compared to USD 1.4 billion during the corresponding period of FY 2011/12. The following graph presents FDI inflows since FY 2003/04 until the first half of FY 2012/13:
During Q1 of FY 2012/13, net FDI declined by 94 percent of USD 1.75 billion down to USD 108 mil‐lion compared to USD 1.8 billion during the last quarter of FY 2011/12. Net FDI recorded its high‐est level in Egypt in FY 2007/08, having reached USD 13.2 billion. The following graph presents the sectoral distribution of net FDI flows during FY 2010/11 and 2011/12 and the first half of FY 2012/13:
Foreign Direct Investmen
t
Fig(1): Net FDI (FY 2003/04 First Half of FY 2012/13)
Source: Central Bank of Egypt
Fig(2): FDI Breakdown (2010/11 First Half of FY 2012/13)
Source: Central Bank of Egypt
2 .2 2 .10 .98 0
0.0 19
1 .7
0.0 30
‐0 .19 1
‐1 .8
‐0.7 10
0 .13 4 0. 10 0 0 .0
‐3 .0
‐2 .0‐1 .0
0 .01 .0
2 .03 .0
20 10/20 11 2 01 1/201 2 S em i Annu al 20 12 /2 01 3
Ne w es ta blis hm en ts & ex pa nsi on s Sa le of ass et s t o n on ‐re sid en tsIn flo ws in th e p et rol eum s ec tor Re al Sta te
31

A Snapshot of the Egyptian Economy 2013
The table below shows the sectoral distribution of net FDI flows since FY 2005/06 until the first half of FY 2012/13:
Although the volume of FDI declined during the first half of FY 2012/13 in Egypt, the overall invest‐ment climate is attractive and encouraging for investments. Recent efforts managed to attract Arab and foreign capitals and investments by signing contracts or agreement with foreign companies to establish projects in Egypt as follows: − Samsung has established its first plant in Egypt for investments of EGP 1.7 billion. The Head of Samsung MENA said that his company is committed to supporting the Egyptian economy. He added that Egypt was selected from among MENA countries to establish the first Samsung plant for digital TV screens for its significant location and outstanding technical and logistical potential. The new plant will be established in Abo Radi, Beni Suef over 370,000 square meters and for in‐vestments of USD 1.7 billion.
− In July 2012, the French L'Oréal Group for Cosmetics and Emeris for Industrial Metal decided to inject new investments in Egypt totaling Euro 45 million. The investment covers the establishment of a L'Oréal Group's first plant in the Middle East in the Tenth of Ramadan City to export the com‐pany's products worldwide. Emeris will establish a plant for producing components of the ceram‐ics industry in the Jordanian compounds in the Tenth of Ramadan City.
− The first styrene and polystyrene plan in Egypt in Africa was established in Al Dekhela Port, Al‐exandria for an investment cost of USD 408 million, which is 100 percent Egyptian capitals with inputs from the petroleum sector, Ministry of Finance and National Investment Bank. The capacity of the plant is 200 thousand tons/ year of the two materials, which are used in several industries including the manufacturing of fridges, electric device structures, automotive complementary in‐dustries, medical appliances and packaging materials The value of production is USD 400 million including 100 thousand tons for export, achieving returns of USD 180 million. The new plant will make available the polystyrene locally, which is equal to USD 220 million. Some 6,500 direct and indirect jobs will be created in first phase.
− British Gas decided to inject USD 3 to 5 billion into development projects in Egypt in addition to its current investments of USD 10 billion in exploration and excavation. Being one of the excellent companies in the field of exploration on seas and wells, the company's business includes deep sea spots in Africa and the Middle East.
− It was agreed that the Indian TATA, a major global company, will establish a new giant invest‐ment project in Egypt to manufacture its famous branded cars.
− The Ministry of Investment concluded successful negotiations with the Malaysian Petronas to inject new investments into the Egyptian market, including a giant oil and grease product com‐pany for investments of USD 100 million. The company will export its products to the Egyptian, African and Middle East markets.
Foreign Direct Investmen
t
32
Table(1): sectoral distribution of net FDI flows since FY 2005/06 until the first half of FY
2012/13:
Source: Central Bank of Egypt
USD Billion

A Snapshot of the Egyptian Economy 2013
Total investments implemented during the first half of FY 2012/13 amounted to EGP 111.3 billion, the bulk of which was accounted for by the private sector with EGP 78.6 billion or 29.4 percent of these investments. The public sector's share amounted to EGP 32.7 billion or 32.7 percent of these investments. The following graph shows total public and private investments implemented since FY 2003/04 until the first half of FY 2012/13:
During the first half of FY 2012/13, a total of 4116 new companies were established with total issued capital of EGP 5716 million, compared to some 3277 new companies with issued capital of EGP 5709 during the corresponding period of FY 2011/12. The following graph presents the development of company establishments during the first half of FY 2004/05 until FY 2012/13:
The above graph indicates an increase in the new establishments by 20.4 percent during the first half of FY 2012/13 compared to the corresponding period of FY 2011/12. The first half of FY 2012/13 recorded the highest level of company establishment compared to the corresponding period since FY 2004/05.
Investmen
ts and
Estab
lishm
ents
1.Total Implemented Investments
Fig(1): Public and private investments shares in the total implemented investments in EGP billion (First half of FY 2002/2003First half of FY 2012/2013)
Source: Ministry of Planning
33
2. New Establishments
Fig(2): Newly established companies (First half of FY 2004/2005 First half of FY 2012/2013)
Source: GAFI
EGP Billion

A Snapshot of the Egyptian Economy 2013
The following graph shows the development of issued capital of companies established since FY 2004/05 until the first half of FY 2012/13:
The above graph indicates that the first half of FY 2006/07 witnessed the largest issued capital com‐pared to the corresponding periods of the comparison years. It also indicates that issued capital in‐creased slightly during the first half of FY 2012/13 compared to the corresponding period of FY 2011/12. The following graph presents the number of companies established from FY 2004/05 until the first half of FY 2012/13:
The above figure indicates that FY 2007/08, 2009/10 and 2011/12 have achieved the highest rates of establishments and that the establishment of 4,116 companies during the first half of FY 2012/13 only, while maintaining the same rate until the end of the current fiscal, signifies a high rate of estab‐lishment of companies by the end of FY 2012/13 just like the said previous years.
Fig(4): Newly established companies (2004/2005First half of FY 2012/2013)
Source: GAFI
34
Investmen
ts and
Estab
lishm
ents
Fig(3): Issued capital for newly established companies (First half of FY 2004/2005First
half of FY 2011/2012)
Source: GAFI

A Snapshot of the Egyptian Economy 2013
The following graph presents capital issued in companies established from FY 2004/05 until the first half of FY 2012/13:
The above figure indicates that FY 2006/07 has recorded the largest issued capital, followed by FY 2007/08. Capital issued in companies established during the first half of FY 2012/13 amounted to EGP 5,716 million.
The service sector accounted for the bulk of investments during the first half of FY 2012/13, having attracted 1761 new companies, followed by the manufacturing sector with 1105 new companies. The graph below presents the sectoral distribution of new companies established during the first half of FY 2012/13 compared to the first half of FY 2011/12:
35
Investmen
ts and
Estab
lishm
ents
Figure (5) Issued Capital in New Establishments (FY 2004/05 – First half FY 2012/13)
Source: GAFI
Sectoral distribution of new establishments
Fig(6): Sectoral Distribution of newly established companies (First half of FY 2011/2012
First half of FY 2012/2013)
Source: GAFI

A Snapshot of the Egyptian Economy 2013
The manufacturing sector accounted for the bulk of capital issued during the first half of FY 2012/13, having attracted EGP 2421.3 million, followed by the construction and building sector with EGP 1340.8 million and the service sector with EGP 1170.9 million in issued capital. The following graph presents issued capital of companies established during the first half of FY 2012/13 compared to the corresponding period of FY 2011/12:
Cairo attracted the largest number of new establishments during the first half of FY 2012/13, with 1958 new companies followed by Giza with 893 new companies. The following graph presents the geographical distribution of new companies and issued capital during the first half of FY 2012/13 compared to the first half of FY 2011/12:
Fig(7): Sectoral distribution of Issued capital for new establishments:
Source: GAFI
Fig(8): Geographical distribution of new establishments (First half of FY 2011/2012 –
First half of FY 2012/2013)
Source: GAFI
36
Investmen
ts and
Estab
lishm
ents
Geographical distribution of new establishments

A Snapshot of the Egyptian Economy 2013
Cairo accounted for the bulk of issued capital, having attracted EGP 2833.2 million, followed by Giza with EGP 862.1 million in issued capital. The following figure indicates the geographical distribution of companies established during the first half of FY 2012/13 compared to the corresponding period of FY 2011/12:
New companies established during the first half of FY 2012/13 are estimated to provide 46993 new jobs for Egyptians as follows: 55 percent for males, 7 percent for females and 38 percent for either males or females. The following graph presents the distribution of new jobs for Egyptians by gender since FY 2007/08 until the first half of FY 2012/13:
37
Investmen
ts and
Estab
lishm
ents
Fig (9): Issued capital in new establishments by location:
Source: GAFI
Estimation of jobs for Egyptians in new establishments
Fig(10): No. of job opportunities created for Egyptians by newly established companies
(FY 2007/2008 First half of FY 2012/2013)
Source: GAFI

A Snapshot of the Egyptian Economy 2013
The following graph presents the sectoral distribution of job estimations in new companies established during the first half of FY 2012/13:
The above graph indicates that the manufacturing sector has attracted the bulk of new jobs esti‐mated during the first half of FY 2012/13, having accounted for 23378 jobs, followed by the service sector (12518 jobs), the construction and building sector (4567 jobs), the agriculture sector (3370 jobs), the tourism sector (1625 jobs), the CIT sector (1474 jobs) and the finance sector (61 jobs).
During the first half of FY 2012/13, some 710 companies were expanded, with issued capital of EGP 35940 million compared to 852 companies expanded with issued capital of EGP 15882.7 million during the corresponding period of FY 2011/12. The following table presents the sectoral distribution of expansions in existing companies during the first half of FY 2012/13 compared to the corresponding period of FY 2011/12:
Fig(11): Sectoral distribution of no. of job opportunities created for Egyptians by newly established companies (First half of FY 2012/2013)
Source: GAFI
3. Expansions
38
Investmen
ts and
Estab
lishm
ents
Table (1): Sectoral Distribution of Expansions in Existing Companies (First half of FY
2011/12 First half of FY 2012/13)
Source: GAFI
Sector First half of FY 2011/12 First half of FY 2012/13 No. of
Companies
Value (EGP million)
No. of
Companies
Value (EGP million)
CIT 33 254.3 26 285.7
Construc on and building 102 1790.7 67 803.5
Finance 30 1361 23 1827.6
Services 255 3020.8 261 23202.2
Agriculture 23 1097.7 27 371.6
Tourism 149 1669.9 60 1922
Industry 260 6688.4 246 7527.3
Total 852 15882.7 710 35940

A Snapshot of the Egyptian Economy 2013
The above table indicates that the service sector accounted for the bulk of capital issued in expan‐sions during the first half of FY 2012/13, having attracted EGP 23202.2 million, followed by the manufacturing sector (EGP 7527.3 million), the tourism sector (EGP 1922 million) and the finance sector (EGP 1827.6 million). The following table presents the geographical distribution of capital issued in expansions during the first half of FY 2012/13 compared to the corresponding period of FY 2011/12:
The above table indicates that Cairo attracted the largest number of expansions in existing companies during the first half of FY 2012/13, having attracted 255 companies with issued capital of EGP 24387.3 million, followed by Giza with 152 companies and EGP 2665.6 million in issued capital and the Lower Egypt governorates with 137 companies and EGP 2605.5 million in issued capital.
The Ministry of Investment and the General Authority for Investment and Free Zones endeavor to create an investment conducive climate and attract and encourage domestic, Arab and foreign investments. A set of procedures have been taken recently to surmount barriers to investments, attract more investment and create more jobs. The following main procedures have been taken during the first half of FY 2012/13:
1. The General Authority for Investment and Free Zones adopts a clear and integrated vision, which is being implemented in cooperation with all relevant ministries and bodies. It targets to encour‐age the informal sector's projects to join the formal sector, increasing their levels and improving their productivity. The vision also includes improvement of standards of living of some 8 million workers in these projects as follows:
− Tax exemption for these projects' activities before joining the formal sector; − The possibility of obtaining a temporary licenses following finalization of procedures necessary to perform an official business provided that a permanent licenses should be obtained within three months if procedures are proper;
− Allocating a window in all GAFI's one stop shops for a quicker finalization of procedures and a better service delivery;
Table (2): Geographical Distribution of Expansions in Existing Companies (First half of FY 2011/12 First half of FY 2012/13)
Source: GAFI
39
Investmen
ts and
Estab
lishm
ents
Geographical Distribu on
of Governorates
First half FY 2011/12 First half FY 2012/13
No. of
Companies
Value )EGP million)
No. of
Companies
Value )EGP million)
Sixth of October 26 655.8 20 1048.1
Alexandria 76 1940.8 52 1911.1
Giza 176 3038.8 152 2665.6
Cairo 323 5599.6 255 24387.3
Helwan 19 141.4 13 154
Border Governorates 33 872.8 24 772.5
Canal Governorates 23 1248.8 18 1945.1
Lower Egypt Governorates 132 1854.7 137 2605.5
Upper Egypt Governorates 44 530.2 39 450.8
Total 852 15882.7 710 35940.0
4. Procedures to improve the investment climate in Egypt

A Snapshot of the Egyptian Economy 2013
− GAFI's "Bedaya Center for SMEs and Entrepreneurship" provides all forms of technical and training support to project owners to be qualified to join the formal economy with the necessary economic experience and knowledge;
2. The General Authority for Investment and Free Zones has prepared a promotional plan to at‐tract investments to Egypt including such main pillars as providing an adequate support to do‐mestic and foreign investors by offering integrated investment opportunities, with a view to achieving the objectives of both the state and investors. The plan includes selective focus on spe‐cific projects and countries in the external promotional campaigns. Target sectors include trans‐port and infrastructure, logistical services, retail, tourist development and agriculture.
3. A ministerial committee has been set up to examine and follow up the energy file. The six‐minister committee currently examines aspects and issues related to the provision of energy to investment projects. It aims at finding out successful and quick mechanisms and solutions to maintain rights of the state and investors, help improve production and address investors' issues.
4. The government has adopted several procedures to support companies during the current economic conditions including decree law No. 4 for 2012 on the setup of investment dispute settlement com‐mittees.
5. The government has approved nine investment dispute settlements presented by the Investment Dispute Settlement Committee with different bodies including the Tax Authority, GAFI, Ministry of Justice, municipalities and the Ministry of Housing.
6. The Ministry of Investment is examining the settlement of case of 17 property investment companies to maintain the rights and interests of companies and the state.
7. An office was set up in the Ministry of Investment, which includes advisors and competent figures to solve issues of Saudi investors. The Regional Office for the Arab Federation is establishing an office to finalize investors' licenses to overcome bureaucracy in different ministries.
8. The government will soon finalize settlement with some investors who have issues in accessing lands. Recent amendments of the law allow for settlement with businessmen even in the case of judgment in abestenia. This is part of the government's action to encourage investments.
9. Approving the establishment of a special software building in Nasr City Free Zone to serve as the first IT free zone in order to develop this vital sector, which is well known as a large job provider for youth. Moreover, this targets to restore Egypt's advanced regional and global position in the field of outsourcing and support initial steps to transform into the knowledge.
10.Approving to extend the deadline for establishing the Technological Zone in Maadi until 2017 within GAFI's efforts of facilitation for serious investors and attract more IT investments.
11.GAFI board of directors resolved to consider the establishment of a new investment zone in Qalioyebia to implement agricultural manufacturing projects.
12.GAFI has resolved to a provide a proposal to the Cabinet on the use of a number of lands for PPP development in order to establish new urban communities without adding more burdens to the state's budgets.
40
Investmen
ts and
Estab
lishm
ents

A Snapshot of the Egyptian Economy 2013
As part of efforts exerted by the state and the Ministry of Investment to provide a number of invest‐ment activities, which allow investors to have access to privileges and facilities based on the type of business, sector and location, work is being developed in free zones, investment zones and the North‐West Gulf of Suez Special Economic Zone as follows:
Free Zones are an investment system by which the state seeks to attract investments to establish or expand projects, capable of adding value to the national economy. The system is based on four stra‐tegic objectives: creating genuine jobs; attracting necessary technology to advance national goods and services; contributing into maximization of exports; providing free currencies to finance stra‐tegic commodity imports. − Freedom to select the investment field. − Freedom to repatriate profits and capital. − Freedom to import from local or external markets. − Freedom to price products. − Freedom to import and export without being listed into the importers and exporters registry. − No restriction on the nationality or limitation of capital. − A project's imports and exports are not subject to import and custom rules applicable in the
country. − Exempting a project's capital assets and inputs from taxes and custom duties. − The imports and exports of free zone projects are exempted from taxes and custom duties. − Local components are fully exempted from custom duties in the case of sale to local markets. − Projects are not nationalized or confiscated. − General litigations are not filed against projects without obtaining GAFI's approval. − Foreign investors are granted residence facilities. − Foreign staff is granted residence permits based on requests from projects.
Special investment zones are those lands allocated for establishing investment projects in order to provide and carry out a distinguished administrative approach, which is easy and flexible by having government bodies dealing with projects in one place to make render procedures easier for inves‐tors. Privileges of investment in the special investment zones are as follows:
− Business homogeneousness in the single zone, offering competitive costs for operation and marketing thanks to industrial integration.
− Unique administration system that facilitate the application of all management procedures through dealing with one single regulator.
− No restrictions over projects' capital and legal form. − Projects established in the investment zones have the right to deal with the local market.. − Streamlined customs system for smoother importation and exportation for the projects at the
zone. − Availability of a package of logistic services for projects. − Goods manufactured within investment zones enjoy the Egyptian origin feature as regards to
bilateral agreements with Arab and African countries (COMESA ‐ European Association), − Projects established in the investment zones enjoy the incentives that are mentioned in the
investment law. 41
Free
zon
es, Investm
ent Zone
s an
d North W
est Suez
1. Free Zones
2. Special Investment Zones

A Snapshot of the Egyptian Economy 2013
The North‐West Gulf of Suez Special Economic Zone (SEZone) is the first investment zones to be established in Egypt, serving as a model for other economic zones in the future. Once the develop‐ment works are finalized, the zone will increasingly attract giant investment projects, being a promising destination of global investments. Main advantages of investment in SEZone are as follows: − 10 percent income tax. − 5 percent tax on business gains. − 100 percent exemption from custom duties and sale taxes on the zone's imports. − Enjoying privileges of international trade agreements. − One stop shop provides all facilities to investors within the zone. − Issuing Egyptian certificates of origin. − Payment of custom duties on foreign components only in the case of import to local markets. − A distinguished location for logistic operations and added value industries. − Competitive prices for shipping to main Egyptian and foreign ports. − A strategic location, which is a crossway for more than 10 percent of the volume of trade.
1. Simplification and facilitation of investment procedures
The General Authority for Investment and Free Zones has taken several procedures to simplify and facilitate the investment procedures in free zones so that projects working under this system can achieve their strategic objectives. These procedures are as follows: a. Streamlining dealing with projects by preparing a working paper on necessary amendments
to laws and executive regulations, which govern investments in free zones. b. Alleviating projects' burdens and renewing licenses of projects working in the field of storing
uses cards for one year; then each case will be examined separately when applying for re‐newal.
c. Reducing approvals and licenses for projects, which do not comply with the requirements of approvals based on the real added value achieved by these projects to the national economy. The objective of this is to achieve the optimum use of lands in their possession for new pro‐jects in public free zones, with the occupation rate approaching 100 percent in public free zones. The procedure also seeks to filter free zones from unserious projects, which do not abide by the regulations of free zones or those violating the law and its executive regulations.
d. Developing services rendered to projects whereby procedures taken to improve free zones and working systems in administrative bodies have led to growth of services provided by these bodies on free zones to project thereupon.
e. Supporting the working system of projects and encouraging suspended projects to commit to set off their activities after examining or directing each project to change its business to an activity, which achieves as added value to the national economy and provide genuine jobs.
2. Improvement of free zones' performance
Total areas of public free zones amounted to 10.7 million square meters by the end of FY 2011/12. The General Authority for Investment and Free Zones is currently examining the economic feasi‐bility of creating new public free zones. Areas ready to receive projects amounted to 6.9 million square meters or 65 percent of total areas for public free zones, totaling 10.7 million square me‐ters by the end of FY 2011/12. The number of projects established under the free zone system amounted to 1108 projects by the end of FY 2011/12, for capital of more than USD 9.1 billion and investment costs of USD 17.9 billion. These projects provide some 213.9 thousand jobs for esti‐mated wages of more than USD 264 million on average per year and produce exports of some USD 16.2 billion.
3. North‐West Gulf of Suez Special Economic Zone (SEZone)
Main developments in the three zones:
Free
zon
es, Investm
ent Zone
s an
d North W
est Suez
42

A Snapshot of the Egyptian Economy 2013
As part of the state's efforts to simplify and facilitate procedures for investors, Law. No. 19 for 2007 has been issued to amend some provisions of the Investment Guarantees and Incentives Law No. 8 for 1997, which stipulates for establishing investment zones. The vision for establishing special investment zones includes the implementation of a simplified administrative approach to the investment procedures by having government bodies dealing with projects in a single place. Main developments in the investment zones are as follows:
− Approving the establishment of five investment zones for different industries including fabrics
and ready‐ made garments; engineering industries; building materials and food industries. These zones have commenced the infrastructure works and started to receive investors' appli‐cations. Boards of directors have approved 201 projects to set off business in these zones.
− Approving the establishing of four investment zones including three for high education and academic research in cooperation with three Egyptian universities.
− Establishing a technological investment zone in Maadi in cooperation with the Ministry of Communication and Information Technology; five projects have been approved to operate within the zone.
− Approving the establishment of two investment zones in Meet Ghamr and Ard Al Saff for SMEs and the establishment of an investment zone in Cairo Airport in cooperation with the Egyptian Holding Company for Airports and Air Navigation comprising 14 projects.
Action is being taken to harness all efforts and support to give the priority of development to the North‐West Gulf of Suez Special Economic Zone, transforming it into a main economic set off loca‐tions in the period to come, especially with the commencement of the Suez Canal Axis Development project.
43
Free
zon
es, Investm
ent Zone
s an
d North W
est Suez
Table (1) The Situation of Investments in Free Zones in FY 2011/12 compared to FY
2010/11
Source: General Authority for Investment and Free Zones
Situa on in End of FY 2011/12
End of FY 2010/11
Volume of
change
Percentage
of Change
(%) No. projects established under the
free zone system
1108 1120 ‐12 ‐1.1
Invested Capital (USD billion) 9.1 9.3 ‐0.2 ‐2.2
Arab and foreign contribu ons (USD
billion)
1.9 1.9 0 ‐‐
Investment costs (USD billion) 17.9 17.1 0.8 +4.7
Jobs created (thousand workers) 213.9 224.9 ‐11 ‐4.9
Targeted annual wages (USD million) 264 360 ‐96 ‐26.7
No. projects which started ac vity 883 882 +1 +0.1
Volume of business for projects
during the year (USD billion)
16.2 14.9 1.3 +8.7
II. Investment Zones
III. North‐West Gulf of Suez Special Economic Zone (SEZone)

A Snapshot of the Egyptian Economy 2013
Procedures are being taken to announce offering of the largest industrial economic zone in Egypt over GAFI's land (20 square kilometers). The offer will be made to domestic and international investors. The project will be offered to international investors under a fiftyyear usufructory system and will be available for local and international developers. The plan includes the development of the zone using the following procedures: − Exerting more efforts to implement schemes for the zone to transform the SEZone into a
global destination for industries and logistics. − Maximizing benefit from the unique location and the investment and tax systems of the special
economic zones under Law No. 83 for 2002, which imposes 10 percent tax on companies and 5 percent tax on individuals.
− Creating special custom departments and providing several export advantages with a view to labor‐intensive activities with a high added value to the Egyptian economy.
− Action not to use the highest price criteria only as a basis for competition over the develop‐ment of the zone. Rather, priority will be given to the pace of implementation and offers ap‐plying for usufructory in foreign currencies.
− Attracting local and foreign investments of USD 10 billion, allowing 140 to 150 thousand jobs for Egyptians from the Suez Canal area.
44
Free
zon
es, Investm
ent Zone
s an
d North W
est Suez

A Snapshot of the Egyptian Economy 2013
Small and medium‐sized enterprises (SMEs) in Egypt face a number of challenges and obstacles to their expansion, growth and investment. These include multiplicity of bodies, which provide sup‐port to SMEs, lack of coordination among them, lack of an agreed‐upon definition of SMEs, lack of available data and absence of an accurate list of the number of SMEs. To face these challenges, the General Authority for Investment and Free Zones has established "Bedaya Center for Entrepreneurship and SMEs Development" in January 2010. The center facili‐tates SMEs' access to non‐finance services in the form of direct advice and technical support as well as the direct finance services from the Investment Fund for SMEs Finance. The center adopts the following programs:
The Business Clinics Program was launched in July 2011 to provide business development services or non‐finance services to ensure growth of SMEs so that technical support and economic advice are rendered to enterprises by creating a large database of advisors and voluntary experts.
The program targets to upgrade youth's projects and SMEs to be the main driver of job creation and economic development. It also aims to provide conducive environment for the development of entrepreneurship and innovation among the youth and provide skills and potential necessary to create generations of entrepreneurs who are able to develop the economy, achieve an added value and create new jobs by: 1. Coordination and liaising between government, non‐government bodies and donors as well as
education and research institutions and the private sector in Egypt in order to create an envi‐ronment, which is conducive to the development of entrepreneurship.
2. Changing the young people's culture from job seekers to job generators by establishing the entrepreneurship skills and principles such as searching for jobs, taking reasonable risks and dealing with mistakes.
3. Stimulating and enabling entrepreneurs to create and intellectually protect innovative oppor‐tunities in order to realize the required growth.
4. Creating a new generation of entrepreneurs by proper selection and training of a group of en‐trepreneurs, providing them with practical training and advice during the preparation period and linking them to academic institutions and sources of finance during the implementation period.
Access to finance is a basic pillar for the success of SMEs including traditional sources of finance (banks and credit risk guarantors) and non‐traditional sources (financial leasing, factoring and venture capital funds). Although SMEs account for a large portion into total establishments, pro‐vide a large number of jobs and contribute into the GNP, they have access to very few credit facili‐ties. These enterprises are mostly rejected by traditional donors due to the absence of sufficient financial guarantees and high Levels of risks. Bedaya Center has launched the following initiatives: A. Facilitating access to finance from financial institutions Bedaya Center has signed a protocol of cooperation with the credit risk guarantee company to achieve the following objectives: − Providing guarantees for financial institutions in order to cover the risks of credit granted to
SMEs in order to support their sustainability. − Action to target more SMEs to deal with different financial institutions. Transactions shall be
guaranteed by the second party in order to strike balance and achieve economic growth.
45
Small and
Med
ium‐sized
Enterprises (S
MEs):
1. Business Clinics Program
2. Entrepreneurships and Innova on Program
3. Access to finance
A Snapshot of the Egyptian Economy 2013
B. Bedaya 1 Fund for Direct Investment Bedaya 1 Fund for Direct Investment has been launched and licensed for a total capital of EGP 134 million. The fund invests directly by purchasing stakes in existing companies or partnering in es‐tablishing new ones. Securities of these funds shall be offered on a special placement while money will be invested in listed and non‐listed securities, commercial notes and other movables accord‐ing to the regulations set by the Capital Market Authority. The director of the fund was selected to be an alliance between Ahly for Development and Invest‐ment (ADI) and Cairo Financial Holding (CFH) to manage Bedaya 1 Fund in order to increase the added value and maximize benefit from experience and achievements of those directors.
− The fund targets to realize at least 20 percent return on investments. − Investment in companies established by virtue of Egyptian laws, provided that the value of
their capital or net assets is not more than EGP 50 million and not less than EGP 2 million. − At least 2 percent and at most 15 percent of the investment portfolio will be allocated for in‐
vestment in new companies. − The fund's investments in a single sector will not exceed 25 percent of the volume of the
fund's investment portfolio.
− Investment in SMEs located in Greater Cairo (Cairo, Giza, Sixth of October, Helwan and Shobra El Kheima) will not exceed 40 percent of the investment portfolio.
− The fund's investments will cover different sectors with the exception of property develop‐ment, tobacco, alcohol, gambling and exclusively exporting companies.
− The fund will exit SMEs after three to five years by the Nile Exchange, resale to other investors (local or foreigners) or by the project owner's acquisition or purchase of the fund's shares.
C. Initiative to legalize the informal sector It is an initiative by the General Authority for Investment and Free Zones to commence a pilot model to legalize the situation of workers in the projects of waste recycle to leave the informal sector for the formal sector by registering and licensing these enterprises commercially and indus‐trially. A series of meeting and negotiations have been held with different bodies (Cairo Governorate, GAFI's Tax Authority, Civil Protection Department, NGOs and the Ministry of Environment) in an attempt to overcome administrative bureaucracies and restore confidence between project own‐ers and government bodies. A draft law on tax incentives and exemptions has been prepared to encourage informal activities to join the formal sector.
Small and
Med
ium‐sized
Enterprises (S
MEs):
Investment Policy of the Fund
Geographical distribu on of investments
46

A Snapshot of the Egyptian Economy 2013
Investment is one of the main pillars for economic development, increasing investments and em‐ployment and achieving high growth rates within the state's economic development plan (2012‐2022). Therefore, action is being taken to stimulate the economic activity, inject investments of EGP 276 billion by the end of FY 2012/13, where the private sector contributes EGP 170 billion and support mega projects and PPPs. In coordination with relevant ministries and governorates, the Ministry of Investment has gathered all available investment opportunities into an investment map of Egypt covering 336 projects as follows: 243 projects from ministries, 77 projects from governorates, 4 mega projects and 16 PPPs. 1. National Investment Map (336 projects): − The Ministry of Investment has gathered all investment opportunities available at ministries,
their affiliates and governorates to create an investment map of Egypt. − These investment opportunities and projects are updated bi‐annually in order to locate eco‐
nomic industries and activities at the level of all governorates in competitive sectors. This re‐flects the state's vision of sectoral and local development, with a view to sustainable and bal‐anced development. The projects fulfill the following criteria:
− Compliance with the state's development plan and available and necessary potential to carry
out projects and analyze their economic feasibility. − Identifying lands available for investment together with their location, maps, coordinates, type
of business and the body in charge of granting the land. − Availability of utilities in these lands; relevant ministries should support serious investors in
accessing necessary licenses to establish projects on these lands. 2. Follow up the implementation of projects agreed upon during previous governorate
conferences, which the Ministry of Investment used to organize annually with regards to port and airport development and facilitation of import of machines and equipment.
3. Extending GAFI's services countrywide. 4. Providing investment incentives according to the sectoral and geographical
distribution. 5. Marketing large development projects, which open up new horizons for urban, agricultural,
industrial and tourist expansion. These projects should receive national consensus to create an effective popular participation into the efforts of development. Moreover, citizens should feel that the improvement of the investment climate is into their direct interest. Action is being taken to implement and develop mega economic projects, most notably:
− Suez Canal Development Axis (east Port Said, North West Suez Gulf) − Development of Sinai Peninsula − Development of the North West coast − Development along the Upper Egypt‐Red Sea Road (Sohag/ Safaga) 6. Completing the establishment of special investment zones, being a main factor for at
tracting investments. 7. Encouraging the establishment of special economic zones for their tax and customs
privileges.1 8. As part of the government's efforts to implement a number of development projects in
different governorates, the Cabinet approved the following:2 − Reallocation of an area of 3908.93 acres for the Ministry of Industry and Foreign Trade to es‐
tablish an industrial zone in Abo Zenima, South Sinai. − Reallocation of an area of 261.32 acres of the state's land in Al Zarabi, Jabal Wadi Serga, Assiut
in favor of the Ministry of Industry and Foreign Trade to establish a grey cement plant.
Investmen
t Projects
47 1 National Initiative for Economic Take‐off, Investment and Employment Axis, January 2013 2 Egyptian Cabinet's website

A Snapshot of the Egyptian Economy 2013
9. Action is being taken to offer a number of investment projects during the coming months
to enhance the Egyptian market and economy as follows:1
− Establishing three electricity stations (BOT system). − The project of establishing AL Alamin Tourist Center. − Pursuing a strong promotional campaign on the housing project of Egyptians abroad. − Offering the airport city project. − Global exhibition land project. − Offering the development of the 9th district of Sixth of October to a group of giant companies. − The project of establishing the 5th basin in El Sokhna Port. − The mining project in the Eastern Desert. − The petrochemical project (Ethylene). − The development project of areas along the Upper Egypt‐ Red Sea Road and offering ten thou‐
sand acres of agricultural land in Qena. − The project of offering 300 thousand acres in Al Qattara Depression for land reclamation for
large investment companies while the remaining spots will be distributed to the youth. − Offering 11 licenses to establish cement plants (with a view to the approach to saving energy
first). − The project of moving tanneries to Al Robiki city. − The project of allocating 3‐4 million square meters in West Suez Gulf to an industrial devel‐
oper. − Using the Turkish loan in introducing utilities in some industrial zones, developing the spin‐
ning and weaving sector and purchasing 500 buses. − The project of establishing the Suez Canal tunnel. − The project of establishing an industrial area and a logistical zone East Port Said. − Offering the project of electronic industries to the Chinese side. − The project of salt extraction in Qaron Lake in Fayoum. − The project of obtaining a development and agriculture concession of two million acres in Su‐
dan along the land road between Egypt and Sudan.
1 Egyptian Cabinet's website
Investmen
t Projects
48

A Snapshot of the Egyptian Economy 2013
The Central Unit for Partnership with the Private Sector of the Ministry of Finance seeks to make available a new source of finance to necessary infrastructure projects and reduce the state's bor‐rowing. This would alleviate the burdens on the state's public budget by disseminating partner‐ships with the private sector, gaining the support of local and international experts, coordination with relevant ministries and the private sector to develop the PPP program and develop a clear action plan for the program. The Central Unit is mainly assigned to the following tasks:1 − Examining projects presented by administrative bodies to offer them under the PPP system,
studying their feasibility and reporting its recommendations to the Higher Committee. − Designing standard and technical criteria for implementing PPP projects. − Examining the feasibility of projects in terms of applicability through the partnership with the
private sector program. − Structuring guarantees provided by the Ministry of Finance. − Examining the finance mechanisms of the market. − Identifying the risk matrix of projects. − Supporting finance at affordable prices. − Supporting access to finance at reasonable prices.2
The Unit's role has become prominent due to the fact that Egyptian companies cannot be involved into partnerships in projects offered by the government because they suffer from restrictions, which render them unable to pay installments to the banks especially after the government bodies no longer pay their dues to these companies. Moreover, current conditions and issues of the local economy discourage investors to partnership with the government. Although some investors are risk takers, this affects the final cost and the volume of expected return from these projects. Addi‐tionally, investors specify in contracts to resort to international arbitration centers once a dispute arises as to the enforcement of the items of contract. Main procedures taken by the Unit to support PPP projects:
− Developing a national standardized policy for the private sector's participation so that its ob‐jectives and mechanisms are understood by ministries, government agencies, donors, contrac‐tors, press and the public.
− Proposing and developing new legislation and regulations on the implementation of the pri‐vate sector's participation that should be considered by ministries, which provide proposals on such projects.
− Attracting experience from other countries and tailoring a series of guidelines for Egypt. − Assisting in devising a finance structure, securities packages and a system on the private sec‐
tor's participation such as the Sukuk system. − Coordinating the national program for the private sector's participation between different
ministries, the private sector and donors. − Managing PPPs and providing technical and advisory experience.
1 Ministry of Finance 2 Ministry of Finance
Public‐private Partnerships
49

A Snapshot of the Egyptian Economy 2013
The PPP Unit will offer investment projects of a cost of more than EGP 17 billion. The Unit has received more than 454 applicants from global companies willing to invest in Egypt. Main projects coordinated and prepared by the Unit recently are as follows:
These projects are long term service contracts implemented by the private sector; the value of these services is paid by the government in the form of partial payments throughout the contract term. The service is sold to consumers and supervised by the government rather than the private sector. PPPs are exposed to serious risks including the change of exchange rates, depreciation of the Egyptian pound, high cost of borrowing and labor issues. Investors ask the government to bear part of risks, given the fact that the government is eventually entitled to own part of the project. Moreover, offering national investments projects for private participation means that the government has regained its confidence into the private sector. This trend should be highlighted in order to achieve reconciliation with businessmen after recent accu‐sations and confiscation of their money. Partnership should not mean exaggeration of final costs of products i.e. prices of services should be compatible with global prices while such harmful prac‐tices as monopoly should be avoided.
Public‐private Partnerships
50
Table (1) Main PublicPrivate Partnership Projects Recently
Source: Ministry of Finance
Project Sector Status Waste Water Treatment Station in Abo Rawash Sanitation Under offer
Railway Line from Ain Shams to Tenth of Ramadan City
Railway and metro Under study and preparation for offer
Zagazig University Hospital Higher Education Near future
Cardiology Surgery Academy‐ Ain Shams University
Higher Education Near future
Al Yousr Station for Seawater desalination ‐ Hurghada Water and desalination Under study and preparation for offer
Al Mowasah University Hospital Higher Education Signed
Waste Water Treatment Station in New Cairo Sanitation Signed
New Children Hospital, Ain Shams University Higher Education Near future
Solid Waste Recycle for electricity and other products Solid Waste Recycle and High Under study and preparation for offer
River Bus Ministry of Transport Under study and preparation for offer
River transport projects Ministry of Transport Near future
Safaga Industrial Port Seaports Under study and preparation for offer
Seawater Desalination Station in Sharm El Sheikh Water and desalination Under study and preparation for offer
Shobra‐ Banha Road Roads and axes Under study and preparation for offer
Somoha University Hospital, Higher Education Signed
Specialized Center (neurology and road accidents) Health Near future
Suez Canal University Specialized Hospital Higher Education Under study and preparation for offer

A Snapshot of the Egyptian Economy 2013
− GlaxoSmithKilne announced that it would invest USD 84.7 million in the health care sector in
Egypt over five years in order to increase its products in the Egyptian market. − Al Fatim Group will invest USD 300 million in 2012 to continue building of Cairo Festival City. − In April 2011, the Kuwaiti Investment Authority (KIA) established a company for a capital of
USD one billion to be invested in the Egyptian Exchange. − The Swedish Electrolux has acquired 52 percent of Olympic Group's shares for USD 350 mil‐
lion. − The Turkish KCG announced that it would increase its investments in Egypt by establishing
three projects for investments totaling USD 400 million in the field of textiles, electricity gen‐eration and mining in Sinai.
− The Indonesian Multistrada announced that it would establish a tire plan in cooperation with
an Egyptian company for a total cost of USD 320 million. − In April 2011, the Chinese Development Bank signed an MOU with the Commercial Interna‐
tional Bank and the Commercial International Company for Investment in Egypt to build infra‐structure and lend SMEs.
− In July 2011, the EHC for petroleum and natural gas was established with an issued capital of
USD 150 million. It is the first private industrial project to be implemented in Egypt at global prices with no subsidy. Total investments of the project amounted to USD 454 million. Further expansions into the company are expected in the years to come.
− In June 2011, Cisco announced an investment of USD 10 million to create a sustainable model
for job creation and economic development in Egypt. The project targets small enterprises with high potential, which provide innovative services and products.
− The Turkish Limak Group intends to implement a project to increase the capacity of terminal 3
of Cairo International Airport for investments of USD 387 million. − The Indian Dhunseri Group for Petrochemicals has established a company for USD 160 million
in El Sharkeya to produce plastics, providing 500 jobs. − The Malaysian AMANI for Islamic Finance announced the establishment of USD 500 million
fund. − Coca Cola announced an investment of USD one bullion in African countries, including Egypt, to
expand its investments in the years to come. − The Chinese Jushi intends to establish the largest Chinese project for optical fibers and related
electronic industries for investments and USD 300 million, creating 450 jobs. − The Indian Sinmar for Chemicals announced that it would invest USD 200 million in Port Said
to produce PVC to meet the increasing demands of the Egyptian market. − Samsung intends to establish an electric devices project in Egypt for total investments of USD
270 million, creating 1200 jobs. − LG announced an investment of USD 265 million to establish a household devices compound,
creating 1000 new jobs. 51
Succ
ess S
tori
es

A Snapshot of the Egyptian Economy 2013
Published by General Authority for Investment and Free Zones (GAFI) Arab Republic of Egypt
Prepared by:
Dr. Mona Farid Badran
Amr Abul El‐Ela
Mona Emad
Ola Mamdouh
Ahmed Ismail
Asmaa Anes
Translated by:
Tarek Fawzy
www.gafinet.org
Distributed in the Arab Republic of Egypt and abroad to individuals and institutions concerned with monitor‐ing the performance of investment in Egypt. The information in this publication may be freely re‐used and reproduced provided appropriate credit is given to the source.

A Snapshot of the Egyptian Economy 2013
Related Documents