GASOLINE DISTRIBUTION ed050501 Activities 050501 - 050503 SNAP CODES: 050500 050501 050502 050503 SOURCE ACTIVITY TITLES: GASOLINE DISTRIBUTION Refinery Dispatch Station Transport and Depots (Except 050503) Service Stations (Including Refuelling of Cars) NOSE CODE: NFR CODE: 1 B 2 a v 1 ACTIVITIES INCLUDED 050501 Refinery dispatch station 050502 Transport and depots (except 050503) 050503 Service stations (including refuelling of cars) Refinery dispatch station category includes emissions from filling of transport equipment (e.g. tank trucks) taking place within the refinery area. Transport and depots category includes emissions from transport equipment and from storage tanks outside refinery. Additionally emissions from Border Terminal Dispatch Stations should be considered under this SNAP code since in some countries the gasoline is not only produced in the respective country but also imported by pipelines, ships, barges and road tankers (Schürmann, 1994). Service stations category includes emissions from tanks at the station (e.g. during filling, withdrawal) and emissions while refuelling cars. For more details see section 3.4. 2 CONTRIBUTION TO TOTAL EMISSIONS Table 2.1 shows the contribution of the gasoline distribution sector to total man-made NMVOC emissions reported in the CORINAIR’90 emission inventory. On average this sector (0505) contributes about 3.5%, of which about 2/3 are emissions from service stations. The contribution in different countries varies from less than 2%, e.g. in Bulgaria and Poland to as much as 7% in Slovenia. Table 2.2 shows the contribution of this sector to total emissions in different countries in Europe as presented in various emission inventories. Emission Inventory Guidebook 4 August, 2006 B551-1

Welcome message from author
This document is posted to help you gain knowledge. Please leave a comment to let me know what you think about it! Share it to your friends and learn new things together.
Transcript

GASOLINE DISTRIBUTION ed050501 Activities 050501 - 050503
SNAP CODES: 050500 050501 050502 050503 SOURCE ACTIVITY TITLES: GASOLINE DISTRIBUTION Refinery Dispatch Station Transport and Depots (Except 050503) Service Stations (Including Refuelling of Cars) NOSE CODE: NFR CODE: 1 B 2 a v 1 ACTIVITIES INCLUDED
050501 Refinery dispatch station 050502 Transport and depots (except 050503) 050503 Service stations (including refuelling of cars) Refinery dispatch station category includes emissions from filling of transport equipment (e.g. tank trucks) taking place within the refinery area. Transport and depots category includes emissions from transport equipment and from storage tanks outside refinery. Additionally emissions from Border Terminal Dispatch Stations should be considered under this SNAP code since in some countries the gasoline is not only produced in the respective country but also imported by pipelines, ships, barges and road tankers (Schürmann, 1994). Service stations category includes emissions from tanks at the station (e.g. during filling, withdrawal) and emissions while refuelling cars. For more details see section 3.4. 2 CONTRIBUTION TO TOTAL EMISSIONS
Table 2.1 shows the contribution of the gasoline distribution sector to total man-made NMVOC emissions reported in the CORINAIR’90 emission inventory. On average this sector (0505) contributes about 3.5%, of which about 2/3 are emissions from service stations. The contribution in different countries varies from less than 2%, e.g. in Bulgaria and Poland to as much as 7% in Slovenia. Table 2.2 shows the contribution of this sector to total emissions in different countries in Europe as presented in various emission inventories.
Emission Inventory Guidebook 4 August, 2006 B551-1
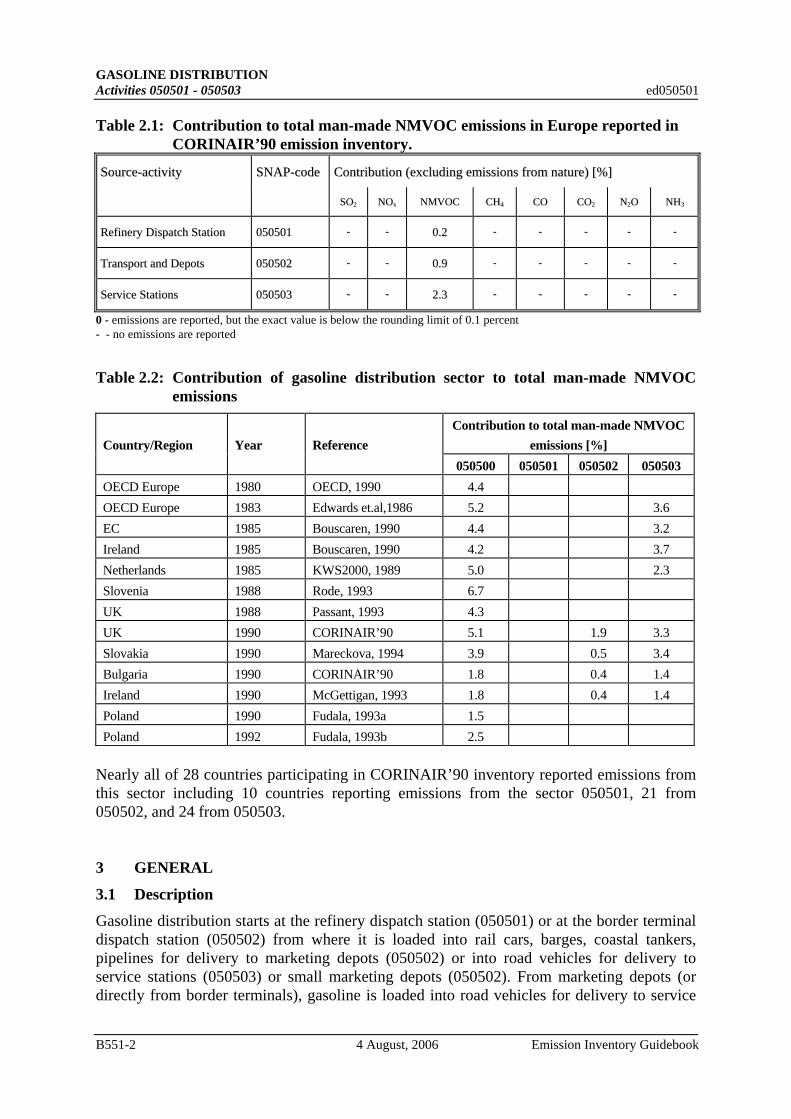
GASOLINE DISTRIBUTION Activities 050501 - 050503 ed050501 Table 2.1: Contribution to total man-made NMVOC emissions in Europe reported in
CORINAIR’90 emission inventory.
SSoouurrccee--aaccttiivviittyy SSNNAAPP--ccooddee CCoonnttrriibbuuttiioonn ((eexxcclluuddiinngg eemmiissssiioonnss ffrroomm nnaattuurree)) [[%%]]
SSOO22 NNOOxx NNMMVVOOCC CCHH44 CCOO CCOO22 NN22OO NNHH33
RReeffiinneerryy DDiissppaattcchh SSttaattiioonn 005500550011 -- -- 00..22 -- -- -- -- --
TTrraannssppoorrtt aanndd DDeeppoottss 005500550022 -- -- 00..99 -- -- -- -- --
SSeerrvviiccee SSttaattiioonnss 005500550033 -- -- 22..33 -- -- -- -- --
0 - emissions are reported, but the exact value is below the rounding limit of 0.1 percent - - no emissions are reported
Table 2.2: Contribution of gasoline distribution sector to total man-made NMVOC emissions
Country/Region
Year
Reference
Contribution to total man-made NMVOC emissions [%]
050500 050501 050502 050503 OECD Europe 1980 OECD, 1990 4.4 OECD Europe 1983 Edwards et.al,1986 5.2 3.6 EC 1985 Bouscaren, 1990 4.4 3.2 Ireland 1985 Bouscaren, 1990 4.2 3.7 Netherlands 1985 KWS2000, 1989 5.0 2.3 Slovenia 1988 Rode, 1993 6.7 UK 1988 Passant, 1993 4.3 UK 1990 CORINAIR’90 5.1 1.9 3.3 Slovakia 1990 Mareckova, 1994 3.9 0.5 3.4 Bulgaria 1990 CORINAIR’90 1.8 0.4 1.4 Ireland 1990 McGettigan, 1993 1.8 0.4 1.4 Poland 1990 Fudala, 1993a 1.5 Poland 1992 Fudala, 1993b 2.5
Nearly all of 28 countries participating in CORINAIR’90 inventory reported emissions from this sector including 10 countries reporting emissions from the sector 050501, 21 from 050502, and 24 from 050503. 3 GENERAL
3.1 Description
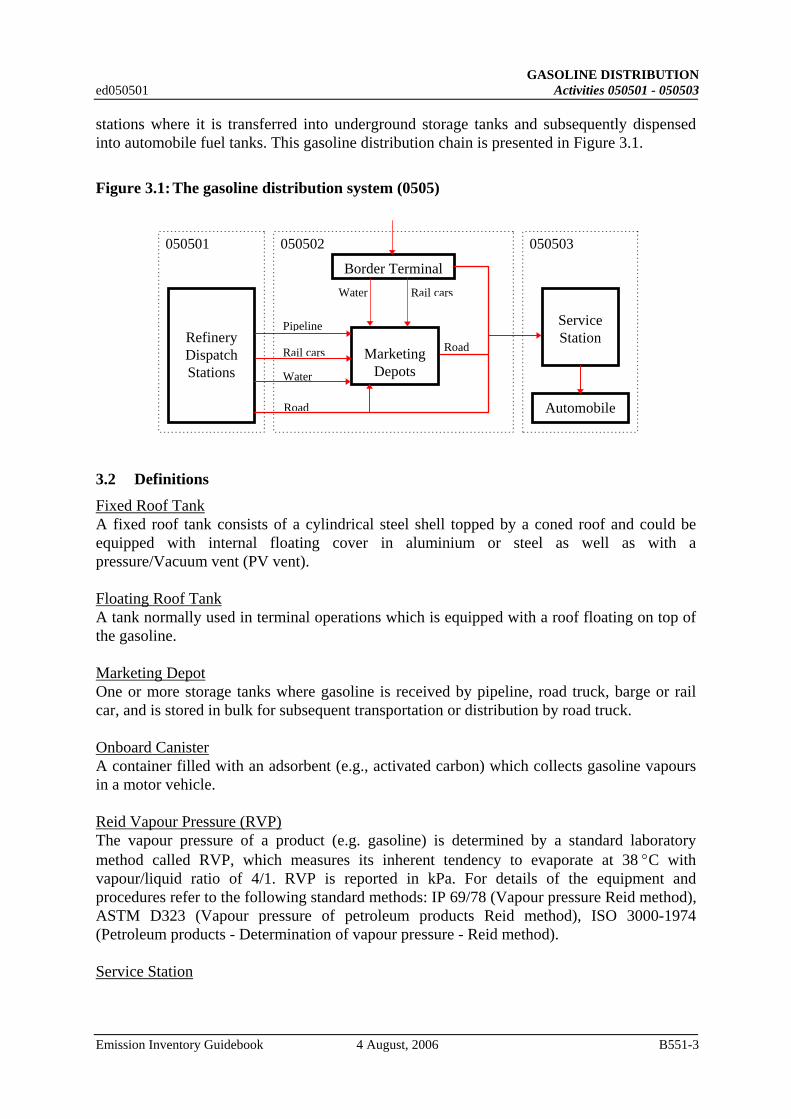
Gasoline distribution starts at the refinery dispatch station (050501) or at the border terminal dispatch station (050502) from where it is loaded into rail cars, barges, coastal tankers, pipelines for delivery to marketing depots (050502) or into road vehicles for delivery to service stations (050503) or small marketing depots (050502). From marketing depots (or directly from border terminals), gasoline is loaded into road vehicles for delivery to service
B551-2 4 August, 2006 Emission Inventory Guidebook
GASOLINE DISTRIBUTION ed050501 Activities 050501 - 050503
stations where it is transferred into underground storage tanks and subsequently dispensed into automobile fuel tanks. This gasoline distribution chain is presented in Figure 3.1.
Figure 3.1: The gasoline distribution system (0505)
RefineryDispatchStations
MarketingDepots
ServiceStation
Automobile
050501 050502 050503
Pipeline
Rail cars
Water
Road
Road
Border TerminalWater Rail cars
3.2 Definitions
Fixed Roof Tank A fixed roof tank consists of a cylindrical steel shell topped by a coned roof and could be equipped with internal floating cover in aluminium or steel as well as with a pressure/Vacuum vent (PV vent). Floating Roof Tank A tank normally used in terminal operations which is equipped with a roof floating on top of the gasoline. Marketing Depot One or more storage tanks where gasoline is received by pipeline, road truck, barge or rail car, and is stored in bulk for subsequent transportation or distribution by road truck. Onboard CanisterA container filled with an adsorbent (e.g., activated carbon) which collects gasoline vapours in a motor vehicle. Reid Vapour Pressure (RVP)The vapour pressure of a product (e.g. gasoline) is determined by a standard laboratory method called RVP, which measures its inherent tendency to evaporate at 38 °C with vapour/liquid ratio of 4/1. RVP is reported in kPa. For details of the equipment and procedures refer to the following standard methods: IP 69/78 (Vapour pressure Reid method), ASTM D323 (Vapour pressure of petroleum products Reid method), ISO 3000-1974 (Petroleum products - Determination of vapour pressure - Reid method). Service Station
Emission Inventory Guidebook 4 August, 2006 B551-3
GASOLINE DISTRIBUTION Activities 050501 - 050503 ed050501 Any premises at which gasoline is dispensed into the fuel tanks of motor vehicles, including marinas (gasoline fuelling point which services water craft) with land-based storage. Stage I Controls The equipment used to recover gasoline vapours at terminals (dispatch stations), marketing depots, and from service stations. Stage II Controls The equipment used to recover gasoline vapours emitted during motor vehicle refuelling at service stations. True Vapour Pressure (TVP)If any liquid is introduced into an evacuated container, molecules will escape from the liquid surface by virtue of their kinetic energy to form vapour. Thereafter, some vapour will condense and eventually a state of equilibrium is reached, which is sustained if the temperature remains constant. The observed pressure in absolute units in the vapour space is defined as the true vapour pressure (TVP) of the liquid at the constant temperature applicable. Vapour BalancingVapours displaced from tanks receiving gasoline are returned to tanks delivering the gasoline. Vapour Destruction Unit (VDU)An installation, normally located at a terminal, which receives gasoline vapours from cargo tank trucks and destroys them by thermal oxidation or other means. Vapour Recovery Unit (VRU)An installation, normally located at a terminal, which receives gasoline vapours from cargo tanks and recovers them for subsequent use, e.g. condensation. 3.3 Techniques
The refinery products (e.g. gasoline) are stored in tanks of different construction, i.e., fixed or floating roof tanks. Then the products are transferred to tank trucks, rail cars, etc., using various techniques of loading, i.e. top, bottom, or submerged loading. The gasoline is delivered directly to service station (stored in underground tanks) or to marketing depots where it is stored in tanks similar to those used in refineries. In some countries the products are imported and stored at border terminals before distribution (see Fig. 3.1).
Fixed Roof Tank
These tanks are normally equipped with a Pressure/Vacuum vent (PV vent) and can be vapour balanced. They continue to be used for motor gasoline at the smaller installations and depots, typified by lower throughput levels (Williams et al, 1986; ECE, 1990; CCME, 1991). These tanks could be classified as follows (Schürmann, 1994):
B551-4 4 August, 2006 Emission Inventory Guidebook
GASOLINE DISTRIBUTION ed050501 Activities 050501 - 050503
• Fixed roof tanks without internal floating roof and without pressure/vacuum (PV) vent; • Fixed roof tanks with internal floating roof and without PV vent; • Fixed roof tanks without internal floating roof and with PV valve, whereby pressure range
(e.g. +20mbar/-5mbar or +180mbar/-50mbar) has an influence on storage emissions. The internal floating roofs are typically made of steel or aluminium sheets. The steel internal covers are longitudinally welded and in direct contact with the liquid surface. The aluminium covers generally have a closed surface of clamped sheets and float several centimetres above the product surface on floats (VDI, 1985). Floating Roof Tank A tank normally used in terminal operations as well as at principal marketing installations away from refineries. It consists of a cylindrical steel wall equipped with a floating roof. The roof floats on top of the gasoline, and is equipped with seals to the sidewall to minimise vapour loss; the air space above a floating roof is vented to the atmosphere. Floating roof decks are of three general types: pontoons, pan, and double deck. A floating roof tank normally cannot be vapour balanced (Williams et al, 1986; ECE, 1990; CCME, 1991). Bottom loading A system for loading liquid petroleum products into a cargo tank truck from the bottom, through a system of pipes, valves and dry-disconnect fittings (CCME, 1991; Williams et al, 1986). Splash Loading The loading arm is positioned with the outlet above the tank bottom so that the gasoline falls to the liquid surface. This leads to a high vapour evolution (Williams et al, 1986; ECE, 1990). Submerged Top Loading A system for loading liquid petroleum products into any tank by means of a pipe to provide entry below the liquid surface, thereby minimising splash and vapour formation (CCME, 1991; Williams et al, 1986). Underground Storage Tank A storage tank that is completely buried by or covered with earth, backfill or concrete, or a partially buried tank. A partially buried tank means a storage tank that has 10% or more of its volume below adjacent ground level. These tanks normally have fixed fill pipes which discharge at the bottom of the tank (CCME, 1991; Williams et al, 1986).
3.4 Emissions
Emissions of hydrocarbons to atmosphere occur in nearly every element of the gasoline distribution chain. The emissions can be classified as follows (for details see Williams et al, 1986 and ECE, 1990):
1. Emissions from bulk storage tanks (refinery dispatch station, border terminals, marketing depots),
2. Service station storage tank emissions; 3. Transport vehicle filling emissions;
Emission Inventory Guidebook 4 August, 2006 B551-5
GASOLINE DISTRIBUTION Activities 050501 - 050503 ed050501
4. Other emissions.
3.4.1 Emissions from bulk storage tanks There are basically two types of bulk storage tanks: Floating Roof Tanks and Fixed Roof Tanks with internal floating covers
There are two major sources of emissions associated with the storage of intermediate volatility liquids:
a) Standing storage emissions are caused mainly by evaporation of liquid product through imperfections in the flexible peripheral seals. Included are any evaporative emissions through the deck structure and fittings such as manholes, gauge pipes and hatches, also roof support columns or legs. The emissions vary depending on design of surface covers (steel or aluminium), see section 3.3. Techniques and 3.5. Controls. Additionally the wind can have a significant influence on the magnitude of these emissions if the tanks are ventilated.
b) Withdrawal emissions occur following the withdrawal of liquid product. They are due to evaporation of the film of gasoline which adheres to the surface of the tank walls, and any tank roof support columns fitted. The magnitude of these emissions is mainly influenced by the surface condition e.g., presence of rust or a tank lining.
c) Filling of the tank after revisions or complete emptying when the floating roof stands on its supports causes additional emissions.
Fixed Roof Tanks without internal floating covers
a) Displacement emissions occur due to displacement of the mixture of air and hydrocarbon vapour by the incoming gasoline. The vapour emitted originates mainly by evaporation from the previous tank contents during storage.
b) Withdrawal emissions occur following intake of air via the pressure/vacuum relief valves. Dilution of the hydrocarbon vapour/air mixture previously contained in the vapour space will lead to further evaporation to restore the equilibrium.
c) Working emissions are defined as the sum of displacement and withdrawal emissions caused by gasoline movements.
d) Breathing emissions are caused by temperature variations and changes in the barometric pressure which in turn cause expansion and contraction of both liquid and vapour within the tank.
3.4.2 Service station storage tank emissions The main contribution comes from displacement when an incoming bulk delivery of gasoline is received into tanks. There are also withdrawal and breathing emissions, the latter being of minor significance since tanks are normally double walled underground tanks and are not subject to “above-ground” diurnal temperature changes but the variation in atmospheric pressure influences the breathing emissions.
B551-6 4 August, 2006 Emission Inventory Guidebook

GASOLINE DISTRIBUTION ed050501 Activities 050501 - 050503
See also note in section 14. Additional Comments on emissions from leaking underground storage tanks. 3.4.3 Transport vehicle filling emissions These occur when gasoline is transferred from storage tanks into transport vehicles, i.e. road tankers, rail cars, barges, and when dispensed into cars. The emissions are a combination of vapour from the previous tank contents and the vapour evolved as a result of splashing and turbulence during filling. The transit or breathing losses are minor (see section 3.4.4.d). It might be worth paying more attention to vapour emissions resulting from spillage when refuelling cars. Four categories of loss were identified (see below). Most of these losses can be avoided by correct maintenance and handling of the dispensing equipment. a) Pre-fill drip from the nozzle while being handled between the pump and the vehicle, b) Spit-back of gasoline from the fuel tank filler pipe, resulting from the pressure build -up in
the vapour space, c) Overflow from the filler pipe, d) Post-fill drip from the nozzle while being handled between the vehicle and the pump. 3.4.4 Other emissions Emissions described here are of minor magnitude as compared to those described above and include the following: a) Fugitive emissions occur following seepage of gasoline liquid through parts of handling
equipment such as pipeline gaskets, also pump and valve stem seals. Pipelines are closed systems and essentially emission free. They are however subject to some fugitive losses and possible leaks due to temperature rise.
b) Ship and barge ballasting emissions - hydrocarbon vapours are displaced into the atmosphere when a compartment, which has previously contained gasoline, is loaded with ballast water.
c) Transport vehicle emissions whilst travelling are often negligible because the vapour and pressure retention capability of the tank or compartment will be above the level at which breathing will be induced by the temperature variations that may occur. However, in some cases these emissions should not be neglected; the containers of road vehicles are subject to significant heating up (depending on colour also) whilst the pressure range of their PV vents is limited to 50 mbar, corresponding to a temperature difference of +15ºC, ignoring expansion of liquid. Many rail cars are free vented and their emissions are not negligible.
d) Spillage and leakage - any activity involving the transfer of gasoline from one form of container to another is a potential point of spillage. Also, leakage from storage and handling equipment such as loading arms, swivels and storage tanks, in addition to flanges and valves, can contribute to vapour emissions. Such emissions should only make a minimum contribution to the total which occur in the gasoline distribution sector, providing facilities are well designed and operated efficiently.
Emission Inventory Guidebook 4 August, 2006 B551-7

GASOLINE DISTRIBUTION Activities 050501 - 050503 ed050501 3.5 Controls
Considerable reduction of hydrocarbon emissions from gasoline distribution network is achieved by modifying truck, barge or rail car tanks loading practices, installing closed vapour recovery units (VRU), as well as providing fixed roof storage tanks with internal floating covers. Additionally, Stage I and Stage II control measures are being introduced. For more details on control options described in this section see Richards et al, 1990; ECE, 1990; Williams et al, 1986; CCME, 1991; VDI, 1985; EPA, 1985. 3.5.1 Storage Tanks There are several ways to control emissions from storage tanks. In most major terminals, vapour emissions from working tankage are controlled by the use of floating roof tanks or fixed roof tanks with internal floating covers (IFCs). These will reduce vapour emissions from tankage by at least 90% for welded steel pans (VDI, 1985). If aluminium pans are used the reduction efficiency may be lower (ca. 70%). A very simple but effective measure is to paint the shell of tank white. A white coating reflects 70% of the energy of the irradiating sunlight (see VDI, 1985 for more details on effects of different colour and type of coatings). Another option is to install Stage IA devices, described in section 3.5.2. There is an extensive experience in use of internal floating covers and replacement of fixed roof tanks by floating roof tanks. In Finland and Germany the majority of fixed roof tanks are equipped with IFCs. In Canada, in 1983, 89% of this category of tanks were equipped with floating roof (Made, 1988). Important note: It is believed that because of the change to unleaded gasoline, the rubber elements, like seals, are deteriorating faster. Therefore, the given reduction efficiencies for storage tanks might not be achieved in some cases (M. Wyser, J. Baumann; pers. communication). 3.5.2 Stage I Controls Stage I controls refer to a variety of techniques reducing VOC emissions at marketing terminals (Stage IA) and when gasoline is delivered to service stations (Stage IB). Stage IA Stage IA systems basically include two parts: a) Vapour Balance Lines between Tanks and Loading Gantries - When a group of fixed-roof
gasoline tanks is subject to simultaneous receipts and deliveries, interconnecting the tank vapour spaces can reduce emissions to atmosphere by allowing displaced vapours from a receiving tank to flow into the vapour space of a delivering tank. In some areas vapour return lines have been installed to reduce exposure of vehicle loading personnel to gasoline vapours. Currently, these lines are generally installed in conjunction with a vapour recovery unit (VRU). In Switzerland, all of the marketing depots are fully equipped with vapour balance lines between road tankers and tanks as well as between tanks and tank cars.
b) Vapour Recovery Units (VRU) remove hydrocarbons emitted from tanks or vehicle loading operations usually by either cooling/condensation, liquid loading absorption or carbon adsorption or a combination of these processes (for details of the processes see
B551-8 4 August, 2006 Emission Inventory Guidebook

GASOLINE DISTRIBUTION ed050501 Activities 050501 - 050503
ECE, 1990). The recovered hydrocarbons are usually returned to tankage in liquid form. VRUs are either single-stage, based on one of the above mentioned processes, with recovery efficiencies of the order of 95%, or double-stage, with additional processing of the first stage tail gas, with design efficiencies close to 100%. Until 1988, relatively small number of VRUs had been installed in Europe (Richards et al, 1990) of which the large majority are for road vehicle loading. Recently installed units are designed to meet the US EPA limits of VOC emissions per litre of product loaded into a vehicle, i.e. 35g/m3 requires single-stage unit, or more stringent TA-Luft limits, i.e. 150 mg/m3 requiring double-stage VRUs. In Switzerland, VRUs are installed at border terminals and refineries.
Richards et. al, 1990 gives average efficiencies of Stage IA systems, assuming 95% efficiency of VRU, 95% vapour collection efficiency at the loading gantry for bottom loading and 85% for top loading, as 90% and 80%, respectively. These numbers are based on an average TVP of 35 kPa. Schürmann, 1994 uses different efficiencies, namely 100% for bottom loading and 85% for top loading with gas balancing systems. Stage IB Stage IB applies to vapour balancing systems between service station tanks and trucks supplying gasoline to them. Saturated vapours, displaced from the tank vent pipes when receiving gasoline, are returned to the truck compartment from which the gasoline is supplied, via a piping system and/or hoses. There are several piping configurations possible, for details see Richards et. al, 1990, ECE, 1990, Williams et al, 1986. According to CONCAWE (Richards et. al, 1990) about 33% of service stations in EC12 countries in 1988 were equipped with Stage IB systems. It has been reported that with well designed systems vapour collection efficiencies are higher than 95%. Schürmann, 1994 uses in his report a reduction efficiency of 100% for stations equipped with Stage IB controls. 3.5.3 Tank Trucks To reduce emissions, modified loading techniques are recommend, namely: a) Submerged top loading (reduces VOC emissions by 40 to 60%), b) Submerged top loading with in-line vapour return, c) Submerged top loading with external vapour return, d) Bottom loading, e) Bottom loading with vapour return . Vapour collection and return from service stations is only undertaken in five European countries and both top and bottom loading trucks are equipped there with vapour return systems. In the USA, bottom loading with vapour return has been legally enforced by EPA standards since 1982. A typical emission reduction efficiency for vapour recovery at tank truck loading points given by OECD, EEC and CONCAWE is 89%. But there are several units installed in Germany to meet stringent regulations and their efficiency is 99.9% (ECE, 1990). This is also reported for Switzerland (Schürmann, 1994; M.Wyser pers. comm.). 3.5.4 Rail Cars Rail cars are generally top loaded in Europe. The recommended techniques to reduce emissions are the same as for tank trucks (see 3.5.3). According to OECD, EEC, and
Emission Inventory Guidebook 4 August, 2006 B551-9

GASOLINE DISTRIBUTION Activities 050501 - 050503 ed050501 CONCAWE, vapour recovery units are operating with an average efficiency of 89% at rail car loading points (ECE, 1990). Schürmann, 1994 reports 85% efficiency for top loading operations with gas balancing systems. This efficiency could be improved if bottom loading would be introduced on a wider scale. Its introduction would additionally require automatic overfill protection systems on all rail cars. 3.5.5 Barges/Ships Modified loading techniques reduce loading losses by 60 to 80%. This involves low initial loading to reduce turbulence when filling the bottom, fast bulk (bottom) loading and slow final loading to reduce turbulence in the vicinity of the ullage as the liquid approaches the top (ECE, 1990). Vapour return/recovery systems are not very common. For inland barges equipped with such systems efficiencies of 88% and for ocean ships of 89% are reported by the EEC (Bouscaren et. al, 1988). Sometimes, the controls are installed but not used, according to M. Wyser (pers. communication) inland tankers on the Rhine river are equipped with vapour balancing systems but the systems are not used. 3.5.6 Car Refuelling Stage II Controls Stage II applies to vapour balancing systems between automobile fuel tanks during refuelling and the service station tank supplying the gasoline. Saturated vapours are displaced from the automobile fuel tank and returned to the service station tank via special fittings in the dispensing nozzle. Vapour escape from the automobile fill-pipe to the atmosphere is prevented by a special bellows which seals the fill pipe and routes the displaced vapours through the body of the dispensing nozzle to the hose. Different systems are available, in some of which the vapour flow is boosted by a vacuum pump. Essential to this system are standardised fill pipes and existence of Stage IB controls in place, otherwise Stage II devices may only delay the venting of vapour to the atmosphere. In the late 80’s, comprehensive test programmes were carried out in Sweden and Switzerland to estimate the recovery efficiency applying Stage II controls. The recovery efficiency of the system, weighted to the Swedish car population, was determined to be 56% and for Switzerland 53% (Switzerland has decided in 1989 to introduce Stage I and II controls at all service stations and vapour recovery at the principal storage units by 1994). Similar results were achieved in an investigation of the BP oil company at one of its stations in Stockholm. The recovery efficiency varied from 11 to 89%, average 61%, depending on the car type. To achieve a better efficiency, it will be necessary to introduce modifications to all new European car fill-pipes and tank vents. In the absence of these changes, an average efficiency between 50 and 60% can be assumed (Richards et. al, 1990). In the USA, where standardisation has been introduced, the EPA estimates the average in-service efficiencies at 62 to 86%, depending on the level of regulatory enforcement, mainly regular inspection. Additional problems with Stage II equipment, mentioned in the literature, are that this system cannot be used with shallow fuel tanks (motorcycles) and that American experience indicates greater spillage when these systems are installed. On-board Canisters
B551-10 4 August, 2006 Emission Inventory Guidebook
GASOLINE DISTRIBUTION ed050501 Activities 050501 - 050503
These are a viable alternative to Stage II controls. According to the experience in the USA and CONCAWE (McArragher et al, 1988), enlarged carbon canisters could reduce refuelling emissions by more than 95%. Canisters are filled with activated carbon to which all external fuel system vents are connected. Any diurnal, hot soak as well as refuelling hydrocarbon emissions are adsorbed by the carbon and retained in the canister. The carbon is purged of hydrocarbons during normal driving by drawing the air back through the canister and into the engine where it is burnt. RVP Reduction This control option requires the reduction of gasoline volatility at the refinery from May to September. A reduction of volatility (RVP) of 17 kPa (from 79 to 62 kPa) would result in a 8 to 10% reduction of the annual emissions of VOC from the gasoline distribution sector (Environment Canada, 1989). Gasoline volatility reduction is reported to reduce VOC emissions from refuelling by 23% (ECE, 1990). 4 SIMPLER METHODOLOGY
The simpler methodology is based on aggregated average emission factors (see section 8.1) combined with information on pumped volume of gasoline in the country. Where the information on type, efficiency and extent of emission control measures applied in distinguished sectors is available, the detailed methodology should be used. Emission = (Average emission factor, see Table 8.1) x (pumped volume of gasoline) This simpler approach has been applied by CONCAWE to estimate emissions of VOC from the gasoline distribution sector in Western Europe (Edwards et. al, 1986). Similar average emission factors for the elements of gasoline distribution system are also given (with some reservations - see Veldt et. al, 1992) in the Second Edition of the CORINAIR Inventory Default Emission Factors Handbook (Bouscaren, 1992). 5 DETAILED METHODOLOGY
To improve the quality of emission estimates, country specific data should be taken into account. Therefore, the detailed methodology requires knowledge on specific parameters of the gasoline distribution system (see section 6 below). Additionally basic physical and chemical parameters of distributed gasoline should be known. For details see procedure described in reference studies i.e., Williams et al, 1986; Foster et al, 1987; VDI, 1985. An alternative methodology was offered by Swiss BUWAL (Bundesamt für Umwelt, Wald und Landschaft) (Schürmann, 1994). The following paragraph gives a general description of the methodology and is quoted after Schürmann, 1994. The proposed detailed methodology is based on the analysis of gasoline flows from imports and refineries to car filling stations and the various loading and unloading techniques used. From the gasoline flow, a gas flow model is derived, which is analysed with regard to gas
Emission Inventory Guidebook 4 August, 2006 B551-11
GASOLINE DISTRIBUTION Activities 050501 - 050503 ed050501 handling techniques to give distribution emissions on one hand and on determination of storage emissions on the other hand. It involves the following steps: a) Determination of the gasoline flows (in Mg/a) from the product sources (refineries and
imports) to the filling stations. b) Determination of the gas flows (in m3/a) from the gas source (car) to the various emission
locations or emission control locations c) Determination of the VOC-emissions for gasoline distribution (in kg/a) d) Determination of the VOC-emissions for gasoline storage (in kg/a) This methodology has the following advantages:
• It reflects the actual emission situation better than aggregated emission factors,
• The results reflect directly the percentage of introduction of gas handling control measures (e.g. stage I and stage II) and of VRU installations in terminals,
• The emission factors for the various emission sources can be adapted to the local properties of gasoline composition, to the level of introduction of integral gas balancing techniques etc.,
• The detailed methodology is a model calculation which allows an analysis of the efficiency of various control measures and as such is an instrument for the planning of the introduction of control techniques.
The current version of this methodology is being reviewed, extended and tested by Swiss BUWAL. An up-to-date version, description and the diskette may be ordered from Dr. Jürg Baumann, BUWAL, Laupenstr. 20, 3003 Bern, Switzerland. The following sections in this chapter of the guidebook do not refer to the ‘Swiss’ methodology since it was not available at the time of writing. 6 RELEVANT ACTIVITY STATISTICS
6.1 Simpler methodology
To estimate VOC emissions from the gasoline distribution sector (0505) the statistics of gasoline sold in the country/region are required. For calculation of emissions resulting from activities in relevant subsectors of gasoline distribution, distinguished in CORINAIR, emission factors given in section 8.1 of this document are used. To take into account emission control measures in place, necessary data may be available from sectoral statistics or country studies. The reduction efficiencies given in section 3.5 of this document could be applied or (preferably) the efficiencies reported in national studies should be used. However, it is considered that where information on controls is available the detailed methodology described below or the ‘Swiss’ method should be used.
B551-12 4 August, 2006 Emission Inventory Guidebook
GASOLINE DISTRIBUTION ed050501 Activities 050501 - 050503
6.2 Detailed methodology
More detailed country specific data are needed as far as the technical parameters of equipment as well as operation practices are concerned. This includes: a) Refinery Dispatch Station (050501) - volume of gasoline loaded into different transport
modes (e.g., rail truck, pipeline, tank truck); gasoline loading practices for specific modes of transport (e.g., top-submerged, bottom); type and extent of emission control measures in place (e.g., Stage I).
b) Transport and Depots (050502) and Border Terminal, where applicable - number, type, size of the tanks used as well as volume of gasoline stored in these tanks; gasoline loading practices for used transport modes; type and extent of emission control measures in place (e.g., Stage I).
c) Service Stations (050503) - volume of gasoline sold; type and extent of emission control measures in place (e.g., Stage II , percentage of cars equipped with enlarged carbon canisters, the latter not relevant for past year inventories as this technology is not yet in use).
d) Characteristics of distributed gasoline - RVP, TVP, density. Additionally, some meteorological data like average annual (or seasonal) temperature are needed to improve the quality of the inventory or calculate the seasonal variation in emissions. 7 POINT SOURCE CRITERIA
Not applicable - see section 12. 8 EMISSION FACTORS, QUALITY CODES AND REFERENCES
8.1 Simpler Methodology
The emission factors suggested in the past for simpler methodology were derived from the study of CONCAWE (Williams et al, 1986). The assumed liquid gasoline density is 730 kg/m3 and condensed vapour density is 600 kg/m3. Hydrocarbon emission factors for uncontrolled techniques are given in Table 8.1. These emission factors are declared as outdated and are maintained only for documentation purpose. To estimate emissions it is suggested to use the detailed methodology based on new CONCAWE study (CONCAWE 2006)
Emission Inventory Guidebook 4 August, 2006 B551-13
GASOLINE DISTRIBUTION Activities 050501 - 050503 ed050501
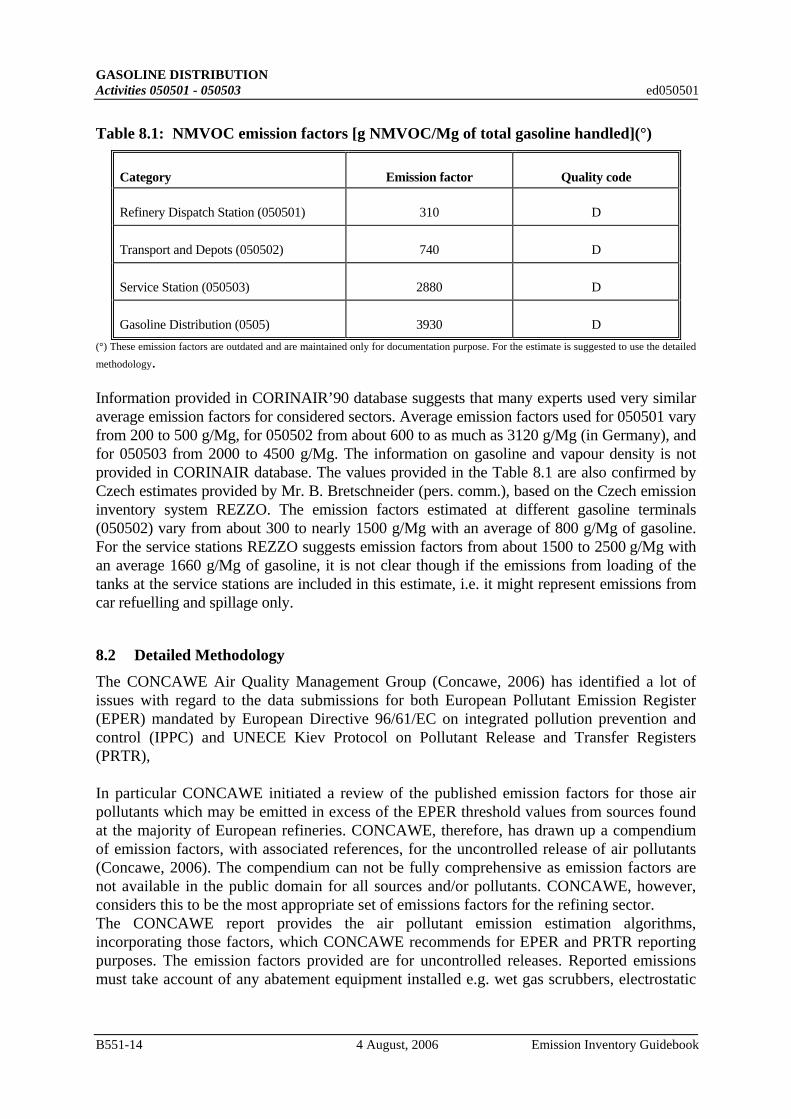
Table 8.1: NMVOC emission factors [g NMVOC/Mg of total gasoline handled](°)
Category
Emission factor
Quality code
Refinery Dispatch Station (050501)
310
D
Transport and Depots (050502)
740
D
Service Station (050503)
2880
D
Gasoline Distribution (0505)
3930
D
(°) These emission factors are outdated and are maintained only for documentation purpose. For the estimate is suggested to use the detailed
methodology. Information provided in CORINAIR’90 database suggests that many experts used very similar average emission factors for considered sectors. Average emission factors used for 050501 vary from 200 to 500 g/Mg, for 050502 from about 600 to as much as 3120 g/Mg (in Germany), and for 050503 from 2000 to 4500 g/Mg. The information on gasoline and vapour density is not provided in CORINAIR database. The values provided in the Table 8.1 are also confirmed by Czech estimates provided by Mr. B. Bretschneider (pers. comm.), based on the Czech emission inventory system REZZO. The emission factors estimated at different gasoline terminals (050502) vary from about 300 to nearly 1500 g/Mg with an average of 800 g/Mg of gasoline. For the service stations REZZO suggests emission factors from about 1500 to 2500 g/Mg with an average 1660 g/Mg of gasoline, it is not clear though if the emissions from loading of the tanks at the service stations are included in this estimate, i.e. it might represent emissions from car refuelling and spillage only. 8.2 Detailed Methodology
The CONCAWE Air Quality Management Group (Concawe, 2006) has identified a lot of issues with regard to the data submissions for both European Pollutant Emission Register (EPER) mandated by European Directive 96/61/EC on integrated pollution prevention and control (IPPC) and UNECE Kiev Protocol on Pollutant Release and Transfer Registers (PRTR), In particular CONCAWE initiated a review of the published emission factors for those air pollutants which may be emitted in excess of the EPER threshold values from sources found at the majority of European refineries. CONCAWE, therefore, has drawn up a compendium of emission factors, with associated references, for the uncontrolled release of air pollutants (Concawe, 2006). The compendium can not be fully comprehensive as emission factors are not available in the public domain for all sources and/or pollutants. CONCAWE, however, considers this to be the most appropriate set of emissions factors for the refining sector. The CONCAWE report provides the air pollutant emission estimation algorithms, incorporating those factors, which CONCAWE recommends for EPER and PRTR reporting purposes. The emission factors provided are for uncontrolled releases. Reported emissions must take account of any abatement equipment installed e.g. wet gas scrubbers, electrostatic
B551-14 4 August, 2006 Emission Inventory Guidebook
GASOLINE DISTRIBUTION ed050501 Activities 050501 - 050503
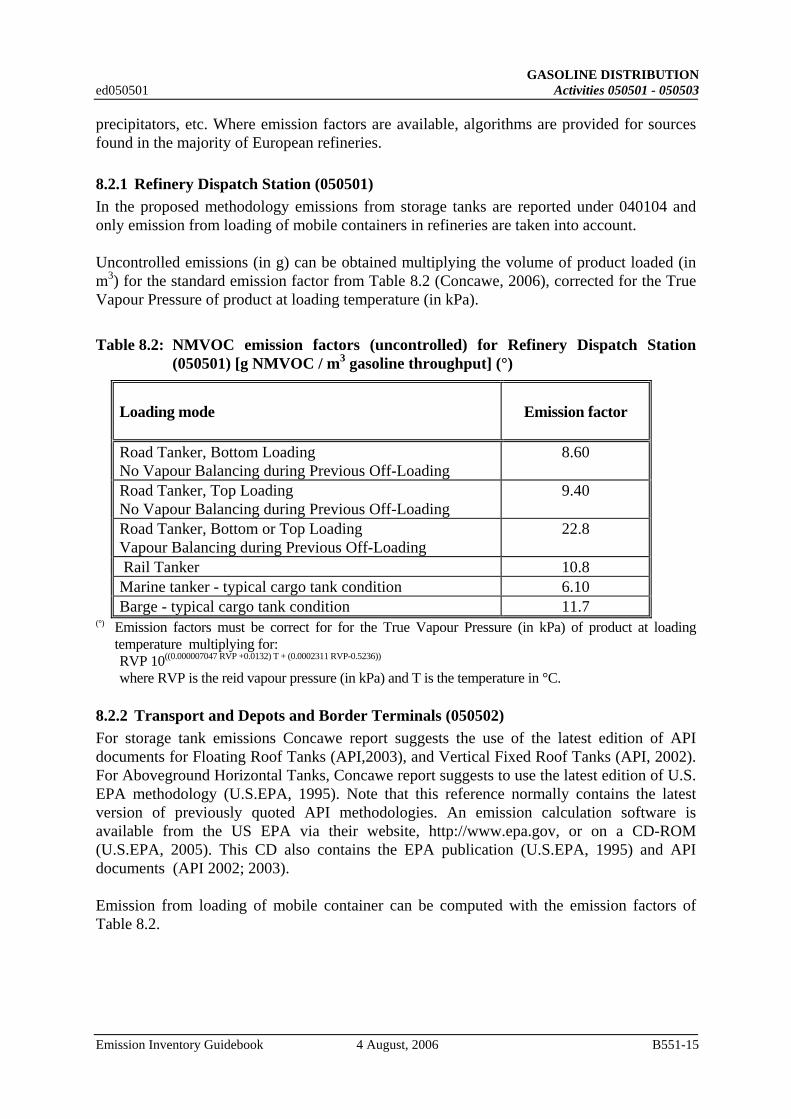
precipitators, etc. Where emission factors are available, algorithms are provided for sources found in the majority of European refineries. 8.2.1 Refinery Dispatch Station (050501) In the proposed methodology emissions from storage tanks are reported under 040104 and only emission from loading of mobile containers in refineries are taken into account. Uncontrolled emissions (in g) can be obtained multiplying the volume of product loaded (in m3) for the standard emission factor from Table 8.2 (Concawe, 2006), corrected for the True Vapour Pressure of product at loading temperature (in kPa).
Table 8.2: NMVOC emission factors (uncontrolled) for Refinery Dispatch Station (050501) [g NMVOC / m3 gasoline throughput] (°)
Loading mode
Emission factor
Road Tanker, Bottom Loading No Vapour Balancing during Previous Off-Loading
8.60
Road Tanker, Top Loading No Vapour Balancing during Previous Off-Loading
9.40
Road Tanker, Bottom or Top Loading Vapour Balancing during Previous Off-Loading
22.8
Rail Tanker 10.8 Marine tanker - typical cargo tank condition 6.10 Barge - typical cargo tank condition 11.7
(°) Emission factors must be correct for for the True Vapour Pressure (in kPa) of product at loading temperature multiplying for:
RVP 10((0.000007047 RVP +0.0132) T + (0.0002311 RVP-0.5236))
where RVP is the reid vapour pressure (in kPa) and T is the temperature in °C.
8.2.2 Transport and Depots and Border Terminals (050502) For storage tank emissions Concawe report suggests the use of the latest edition of API documents for Floating Roof Tanks (API,2003), and Vertical Fixed Roof Tanks (API, 2002). For Aboveground Horizontal Tanks, Concawe report suggests to use the latest edition of U.S. EPA methodology (U.S.EPA, 1995). Note that this reference normally contains the latest version of previously quoted API methodologies. An emission calculation software is available from the US EPA via their website, http://www.epa.gov, or on a CD-ROM (U.S.EPA, 2005). This CD also contains the EPA publication (U.S.EPA, 1995) and API documents (API 2002; 2003). Emission from loading of mobile container can be computed with the emission factors of Table 8.2.
Emission Inventory Guidebook 4 August, 2006 B551-15
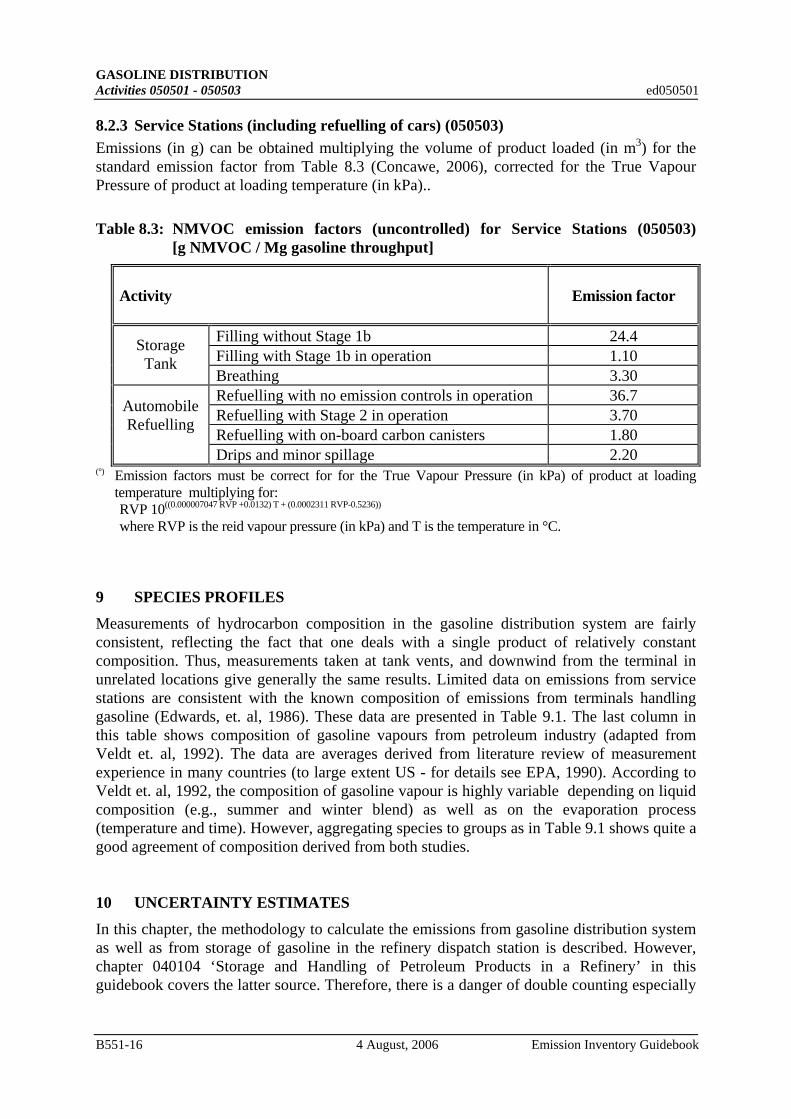
GASOLINE DISTRIBUTION Activities 050501 - 050503 ed050501 8.2.3 Service Stations (including refuelling of cars) (050503) Emissions (in g) can be obtained multiplying the volume of product loaded (in m3) for the standard emission factor from Table 8.3 (Concawe, 2006), corrected for the True Vapour Pressure of product at loading temperature (in kPa)..
Table 8.3: NMVOC emission factors (uncontrolled) for Service Stations (050503) [g NMVOC / Mg gasoline throughput]
Activity
Emission factor
Filling without Stage 1b 24.4 Filling with Stage 1b in operation 1.10
Storage Tank
Breathing 3.30 Refuelling with no emission controls in operation 36.7 Refuelling with Stage 2 in operation 3.70 Refuelling with on-board carbon canisters 1.80
Automobile Refuelling
Drips and minor spillage 2.20
(°) Emission factors must be correct for for the True Vapour Pressure (in kPa) of product at loading temperature multiplying for:
RVP 10((0.000007047 RVP +0.0132) T + (0.0002311 RVP-0.5236))
where RVP is the reid vapour pressure (in kPa) and T is the temperature in °C. 9 SPECIES PROFILES
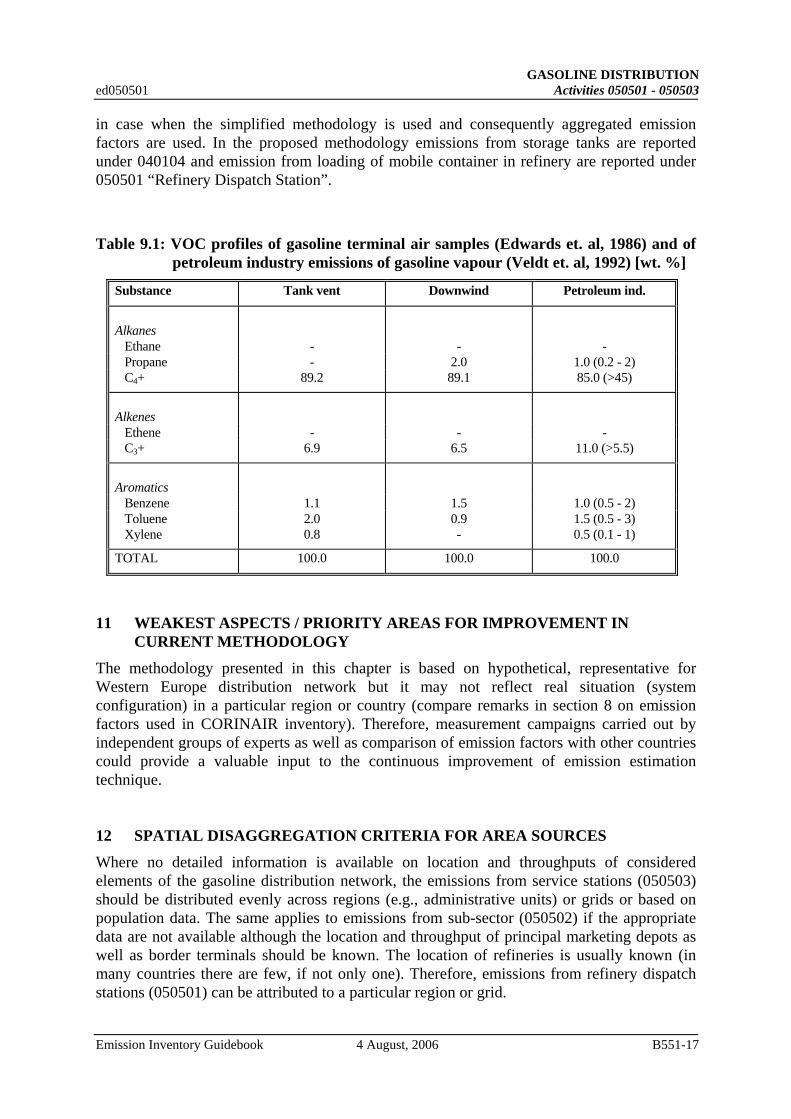
Measurements of hydrocarbon composition in the gasoline distribution system are fairly consistent, reflecting the fact that one deals with a single product of relatively constant composition. Thus, measurements taken at tank vents, and downwind from the terminal in unrelated locations give generally the same results. Limited data on emissions from service stations are consistent with the known composition of emissions from terminals handling gasoline (Edwards, et. al, 1986). These data are presented in Table 9.1. The last column in this table shows composition of gasoline vapours from petroleum industry (adapted from Veldt et. al, 1992). The data are averages derived from literature review of measurement experience in many countries (to large extent US - for details see EPA, 1990). According to Veldt et. al, 1992, the composition of gasoline vapour is highly variable depending on liquid composition (e.g., summer and winter blend) as well as on the evaporation process (temperature and time). However, aggregating species to groups as in Table 9.1 shows quite a good agreement of composition derived from both studies. 10 UNCERTAINTY ESTIMATES
In this chapter, the methodology to calculate the emissions from gasoline distribution system as well as from storage of gasoline in the refinery dispatch station is described. However, chapter 040104 ‘Storage and Handling of Petroleum Products in a Refinery’ in this guidebook covers the latter source. Therefore, there is a danger of double counting especially
B551-16 4 August, 2006 Emission Inventory Guidebook
GASOLINE DISTRIBUTION ed050501 Activities 050501 - 050503
in case when the simplified methodology is used and consequently aggregated emission factors are used. In the proposed methodology emissions from storage tanks are reported under 040104 and emission from loading of mobile container in refinery are reported under 050501 “Refinery Dispatch Station”.
Table 9.1: VOC profiles of gasoline terminal air samples (Edwards et. al, 1986) and of petroleum industry emissions of gasoline vapour (Veldt et. al, 1992) [wt. %]
Substance Tank vent Downwind Petroleum ind.
Alkanes
Ethane - - - Propane - 2.0 1.0 (0.2 - 2) C4+ 89.2 89.1 85.0 (>45)
Alkenes
Ethene - - - C3+ 6.9 6.5 11.0 (>5.5)
Aromatics
Benzene 1.1 1.5 1.0 (0.5 - 2) Toluene 2.0 0.9 1.5 (0.5 - 3) Xylene 0.8 - 0.5 (0.1 - 1)
TOTAL 100.0 100.0 100.0
11 WEAKEST ASPECTS / PRIORITY AREAS FOR IMPROVEMENT IN
CURRENT METHODOLOGY
The methodology presented in this chapter is based on hypothetical, representative for Western Europe distribution network but it may not reflect real situation (system configuration) in a particular region or country (compare remarks in section 8 on emission factors used in CORINAIR inventory). Therefore, measurement campaigns carried out by independent groups of experts as well as comparison of emission factors with other countries could provide a valuable input to the continuous improvement of emission estimation technique. 12 SPATIAL DISAGGREGATION CRITERIA FOR AREA SOURCES
Where no detailed information is available on location and throughputs of considered elements of the gasoline distribution network, the emissions from service stations (050503) should be distributed evenly across regions (e.g., administrative units) or grids or based on population data. The same applies to emissions from sub-sector (050502) if the appropriate data are not available although the location and throughput of principal marketing depots as well as border terminals should be known. The location of refineries is usually known (in many countries there are few, if not only one). Therefore, emissions from refinery dispatch stations (050501) can be attributed to a particular region or grid.
Emission Inventory Guidebook 4 August, 2006 B551-17

GASOLINE DISTRIBUTION Activities 050501 - 050503 ed050501 13 TEMPORAL DISAGGREGATION CRITERIA
The true vapour pressure (TVP) of gasoline is influenced by its temperature and reid vapour pressure (RVP). It is possible, using equations given in Williams et al, 1986, to calculate emissions, resulting from storage and loading operations, from gasoline distribution sector, including data on gasoline properties (e.g., RVP) and average annual or monthly temperature. An experimental work carried out by Deutsche Gesellschaft für Mineralölwissenschaft und Kohlechemie (DGMK, 1976) showed a seasonal variation, in filling/storage emissions from service stations, of 0.145/0.125% mass which occurred in summer/winter, respectively. 14 ADDITIONAL COMMENTS
Recently, US EPA has contracted Radian Corporation to develop the methodology to estimate VOC emissions from leaking underground storage tanks (LUST) (R.Ryan, US EPA, pers. communication). LUST are typically not considered a quantifiable source of air emissions until excavation and remediation efforts are initiated. In many cases, the leaking tank and surrounding soil are removed and either placed in piles or evenly spread to allow volatilisation of the contaminant. It is a common practice, especially where the contaminant is highly volatile, like for example gasoline. This note is only to inform about such activity as the final results are not yet available. It is believed that this source of emissions might contribute to local ozone episodes. To forecast the emissions of VOC from a gasoline distribution system the forecast of gasoline demand is necessary as well as the extent and type of control options introduced. There are usually several energy forecasts available but it is more difficult to find information on possible technical development as well as plans for introducing particular controls. In this case, the emission development scenario could be based on energy forecast and on known current and forthcoming emission regulations, and on current national or international agreements on emission reductions. 15 SUPPLEMENTARY DOCUMENTS
Williams, L. J., D. Beardshall, P. G. Edgington, F.O. Foster, R.H. Lilie, H.D. Richards (1986): Hydrocarbon Emissions from Gasoline Storage and Distribution Systems. Report No. 85/54, CONCAWE, DenHaag, September 1986. 16 VERIFICATION PROCEDURES
The emission factors presented in this chapter are not necessarily representative for a particular region/country due to substantial differences in handling practices, product properties as well as meteorological conditions. The verification can be based on local measurements or measurements performed for similar conditions.
B551-18 4 August, 2006 Emission Inventory Guidebook

GASOLINE DISTRIBUTION ed050501 Activities 050501 - 050503
17 REFERENCES
API (2002) Manual of petroleum measurement standards. Chapter 19: Evaporative loss measurement, Section 1: Evaporative loss from fixed-roof tanks. Formerly, API Publication 2518. Washington DC: American Petroleum Institute report no. 9/05R API (2003) Manual of petroleum measurement standards. Chapter 19: Evaporative loss measurement, Section 2: Evaporative loss from floating-roof tanks. Formerly, API Publications 2517 and 2519. Washington DC: American Petroleum Institute Bouscaren, R., N. Allemand, W. F. J. M. Engelhard, S. C. Wallin, K.-H. Zierock (1988): Volatile Organic Compounds and Nitrogen Oxides - Cost Effectiveness of Measures Designed to Reduce the Emissions of Precursors of Photochemical Oxidants, Phase 1 - Final Report. Commission of the European Communities, Report No. EUR 11856 EN, May 1988.
Bouscaren, R. (1990): Volatile Organic Compounds: EC - Emission Inventory (CORINAIR Project) in proceedings from “Workshop on Long-Range Transport of Organic Pollutants”, Stockholm, Sweden, March 12-14, 1990. Report 3807, Swedish Environmental Protection Agency.
BP (British Petroleum Co) (1973): Emissions of gasoline vapour when loading transport media in Germany. Parts 1 and 2. Operations Services Branch Report No. 187, British Petroleum Co., July 1973 London.
CCME (Canadian Council of Ministers of the Environment) (1991): Environmental Code of Practice for Vapour Recovery in Gasoline Distribution Networks. Prepared by the National Task Force on Vapour Recovery in Gasoline Distribution Networks. CCME-EPC/TRE-30E, CCME, Canada.
Concawe (2006) Air pollutant emission estimation methods for EPER and PRTR reporting by refineries (revised), Prepared by the CONCAWE Air Quality Management Group’s Special Task Force on Emission Reporting Methodologies (STF-64), P. Goodsell (Technical Coordinator), Report no. 9/05R, Brussels April 2006
DGMK (Deutsche Gesellschaft für Mineralölwissenschaft und Kohlechemie) (1976): Messung und Ermittlung von Kohlenwasserstoffen-Emissionen bei Lagerung, Umschlag und Transport von Ottokraftstoffen und Prüfen von Verfahren zur Beherrschung dieser Emissionen. Parts I, II and III. Report No. 4590. Hamburg, DGMK e.V.
ECE (Economic Commission for Europe) (1990): Emissions of Volatile Organic Compounds (VOC) from Stationary Sources and Possibilities of their Control - Final Report. ECE - VOC Task Force, Karlsruhe, July 1990.
Edwards, A. H. et. al (1986): Volatile Organic Compound Emissions: An Inventory for Western Europe. Report No. 2/86. DenHaag, CONCAWE
Environment Canada (1989): Development of a National Nitrogen Oxides (NOx) and Volatile Organic Compounds (VOC) Management Plan for Canada. Technical Annex on: I - Environmental Objectives and Criteria; II - NOx Emissions and Control Technologies; III - VOC Emissions and Control Technologies. Conservation and Protection, Environment Canada, July 1989
Emission Inventory Guidebook 4 August, 2006 B551-19
GASOLINE DISTRIBUTION Activities 050501 - 050503 ed050501 EPA (United States Environmental Protection Agency) (1997); “Compilation of Air Pollutant Emission Factors. Volume I: Stationary Point and Area Sources.” AP-42. 5th Edition. Office of Air Quality Planning and Standards, Research Triangle Park, North Carolina Chapter 7: Liquid storage tanks. (http://www.epa.gov/ttn/chief/ap42/ch07/index. html) EPA (United States Environmental Protection Agency) (2005): Air CHIEF CD-ROM. EPA No. EPA-454/C-04-001. Research Triangle Park NC: US Environmental Protection Agency (http://www.epa.gov/ttn/chief/software/airchief/) EPA (United States Environmental Protection Agency) (1990): Air Emissions Species Manual. Volume I: Volatile Organic Compound Species Profiles - Second Edition. EPA-450/2-90-001a, January 1990
Foster, F. O., R. H. Lilie, W. G. Roberts, G. A. van Ophem (1987): Cost-Effectiveness of Hydrocarbon Emission Controls in Refineries from Crude Oil Receipt to Product Dispatch. Report No. 87/52, CONCAWE, Den Haag, January 1987.
Fudala, J. (1993a): Report on NMVOC Emission in Poland in EMEP Grid for the year 1990. Institute for Ecology of Industrial Areas, Katowice, December 1993.
Fudala, J. (1993b): Report on NMVOC Emission in Poland for the year 1992. Institute for Ecology of Industrial Areas, Katowice, December 1993.
KWS 2000 (Project Group Hydrocarbons 2000) (1989): Control Strategy for Emissions of Volatile Organic Compounds. Ministry of Hausing, Physical Planning and Environment. The Netherlands, February 1989.
Made, B. (1988): Control of VOC Emissions from Oil Refineries - Technologies Currently in Place in Canada. Environment Canada.
Mareckova, K. (1994): CORINAIR 90 Emission Inventory for Slovakia - Final Report. Slovak Hydrometeorological Institute (SHMI), Department of Environmental Protection, Bratislava.
McArragher, J. S. et. al (1987): An Investigation Into Evaporative Hydrocarbon Emissions from European Vehicles. Report No. 87/60, CONCAWE, The Hague.
McGettigan, M. F. (1993): CORINAIR 1990 Emission Inventory for Ireland - Final Report. Environmental Research Unit, Department of the Environment. Dublin, July 1993.
OECD (Organisation for Economic Co-operation and Development) (1990): Emission Inventory of Major Air Pollutants in OECD European Countries. Environment Monographs No. 21. OECD, Paris
Passant, N. R. (1993): Emissions of Volatile Organic Compounds from Stationary Sources in the United Kingdom. LR 990, Warren Spring Laboratory, December 1993.
Pazdan, W. et. al (1994): CORINAIR - Poland 1990 - Final Report. ATMOTERM, Opole.
Richards, H. D. et. al (1990): VOC Emissions from Gasoline Distribution and Service Stations in Western Europe - Control Technology and Cost-effectiveness. Report No. 90/52. Brussels, CONCAWE
B551-20 4 August, 2006 Emission Inventory Guidebook

GASOLINE DISTRIBUTION ed050501 Activities 050501 - 050503
Rode, B. (1993): VOC Emissions in Slovenia in 1988. in Baars, H.P. et. al [ed] Proceedings of the TNO/EURASAP Workshop on the Reliability of VOC Emission Data Bases, June 9-10, 1993. IMW-TNO Publication P 93/040. Delft, The Netherlands.
Schürmann (1994): Study on the Detailed Methodology of the Determination of VOC-Emissions in Gasoline Distribution (DRAFT). Weyer Verfahrenstechnik, Basel, Switzerland. December 19, 1994. Study on request of Federal Office of Environment, Forests and Landscape, Section Air Pollution Control, Bern, Switzerland.
VDI (Verein Deutscher Ingenieure) (1985): Emissionsminderung Raffinerieferne Mineralölvertriebsläger. VDI - Kommission Reinhaltung der Luft, VDI 3479. VDI-Verlag GmbH, Düsseldorf, Germany, July 1985.
Veldt, C., A. Bakkum, R. Bouscaren (1992): Default Emission Factors from Stationary Sources (NOx - VOC including CH4) in R. Bouscaren: Default Emission Factors Handbook - Second Edition. CORINAIR Inventory, Commission of the European Communities. CITEPA, Paris, January 1992.
Williams, L. J., D. Beardshall, P. G. Edgington, F.O. Foster, R.H. Lilie, H.D. Richards (1986): Hydrocarbon Emissions from Gasoline Storage and Distribution Systems. Report No. 85/54, CONCAWE, DenHaag, September 1986. 18 BIBLIOGRAPHY
Allemand, N., R. Bouscaren, D. Heslinga, I. Marlowe, C.J. Potter, M. Woodfield, K. H. Zierock (1990): Costed Evaluation of Options for the Reduction of Photochemical Oxidant Precursors, Volume 2. - Abatement Technology and Associated Costs. Report No. EUR 12537/II EN, Commission of the European Communities, Brussels - Luxembourg.
Bouscaren, R. (1992): Default Emission Factors Handbook - Second Edition. Corinair Inventory, Commission of the European Communities. CITEPA, Paris, January 1992.
CPPI (Canadian Petroleum Products Institute) and Environment Canada (1991): Amospheric Emissions from Canadian Petroleum Refineries and the Associated Gasoline Distribution System for 1988. CPPI Report No. 91-7, February 1991.
CONCAWE (1990): Closing the Gasoline System - Control of Gasoline Emissions from the Distribution System and Vehicles. Report No. 3/90, CONCAWE, Brussels.
Thomas, Lee M. (1989): A US Perspective on Hydrocarbon Controls at Service Stations. Report No. 11/89, CONCAWE, The Hague. 19 RELEASE VERSION, DATE AND SOURCE
Version: 2.2 Date: August 2006 Original author: Zbigniew Klimont IIASA Austria
Emission Inventory Guidebook 4 August, 2006 B551-21
GASOLINE DISTRIBUTION Activities 050501 - 050503 ed050501 Integrated with CONCAWE (CONCAWE, 2006) suggestion by:
Carlo Trozzi Techne Consulting Italy
20. POINT OF ENQUIRY
Any comments on this chapter or enquiries should be directed to: Carlo Trozzi Techne Consulting Via G. Ricci Curbastro, 34 Roma, Italy Tel: +39 065580993 Fax: +39 065581848 Email: [email protected]
B551-22 4 August, 2006 Emission Inventory Guidebook

GAS DISTRIBUTION NETWORKS
ed050601 Activities 050601, 050603 & 010506
Emission Inventory Guidebook December, 2006 B561-1
SNAP CODES: 050601
050603
010506
SOURCE ACTIVITY TITLES: GAS DISTRIBUTION NETWORKS
Pipelines
Distribution Networks
Pipeline Compressors
NOSE CODE: 106.06.01
106.06.02
NFR CODE: 1 B 2 b
1 A 3 e i
1 ACTIVITIES INCLUDED
This chapter considers emissions from the transmission of gaseous fossil fuel from terminals
to consumers via pipelines, compressor stations and networks. Most of the information in
this chapter is based on data for natural gas.
Emissions from gas terminals are covered in the chapter on Extraction and first treatment of
liquid and gaseous fuels (50200/50300).
2 CONTRIBUTION TO TOTAL EMISSIONS
Methane and NMVOCs are the pollutants that are likely to be emitted from gas distribution
networks in significant quantities.
Table 2.1 refers to the UK only and to the year 1992. Data are from the UK Digest of
Environmental Protection & Water Statistics 1994. The NMVOC component of natural gas
was calculated using the UK species profile given in Section 9.
Table 2.1 - UK emissions from gas distribution networks (1992)
Methane NMVOC Total
Emission due to natural gas leakage (kt) 375 42 417
Total emission (kt) 4736 2556 7292
Natural gas leakage as % of total emission 7.9 1.6 5.7

GAS DISTRIBUTION NETWORKS
Activities 050601, 050603 & 010506 ed050601
B561-2 December, 2006 Emission Inventory Guidebook
Table 2.2: Contribution to total emissions of the CORINAIR90 inventory (up to 28
countries)
SSoouurrccee--aaccttiivviittyy SSNNAAPP--ccooddee CCoonnttrriibbuuttiioonn ttoo ttoottaall eemmiissssiioonnss [[%%]],, ((iinncclluuddiinngg eemmiissssiioonnss ffrroomm
nnaattuurree))
SSOO22 NNOOxx NNMMVVOOCC CCHH44 CCOO CCOO22 NN22OO NNHH33
GGaass ddiissttrriibbuuttiioonn nneettwwoorrkkss 005500660000 00..55 66..00
0 = emissions are reported, but the exact value is below the rounding limit of 0.1 per cent
- = no emissions are reported
These activities are not believed to be a significant source of PM2.5 (as of December 2006).
3 GENERAL
3.1 Description
Natural gas is a combustible gas that occurs in porous rock of the earth’s crust and is often
found with or near accumulations of crude oil. It may also occur alone in separate reservoirs.
Gas wells exist on land and offshore. Some countries may also use gas derived from coal.
Coal gasification has been practised since the early nineteenth century and can be done using
a number of different processes.
The main use of natural gas is heating buildings and processes and as a chemical feedstock,
for example in the manufacture of ammonia and fertilisers. Also, it is increasingly being used
as a fuel for power generation.
Natural gas is transferred from the well to a processing plant where it is separated by
cryogenic distillation to give ‘sales’ gas of the required specification as well as possibly other
products such as liquid hydrocarbon fractions. After this it is transferred via a network of
pipelines and networks or ‘mains’ to consumers ranging from large factories to small
dwellings. Natural gas may also be transported in liquefied form by ship, in which case it is
loaded and unloaded at specially designed marine terminals.
A gas transmission network covering a country or region consists of pipelines and mains of a
variety of different sizes, materials, and pressures. It will also contain storage facilities,
pumping stations and pressure reduction stations. Pipes will also make use of different types
of joint.
Transmission systems
Gas transmission systems can conveniently be divided into two interconnecting systems; the
national transmission system, which consists of large diameter high pressure pipelines
spanning distances of hundreds of kilometres, forms the backbone of the network and takes
gas from the terminals to each of many regional supply systems, which consist of smaller
diameter intermediate and low pressure pipelines and mains.
GAS DISTRIBUTION NETWORKS
ed050601 Activities 050601, 050603 & 010506
Emission Inventory Guidebook December, 2006 B561-3
Pipelines & mains
Pipelines and mains are made from the following materials:
• Welded steel
• Cast Iron
• Ductile Iron
• Polyethylene
Pipelines and mains are operated under a variety of different pressure regimes, usually
classified as follows:
• High pressure - up to 75 bar
• Intermediate pressure - 2 to 7 bar
• Medium pressure - 2 bar to 75 mbar
• Low pressure - < 75 mbar
Service pipes, which transfer gas from a main to a customer’s meter, are always at low
pressure.
Pipelines and mains can also be classified as jointed or unjointed. Jointed pipes have joints
which consist of flanges bolted together or similar arrangements. In unjointed pipes the
sections are welded together.
Storage
The gas transmission system incorporates a number of different types of storage elements.
These include high pressure liquid storage, underground salt cavities and gas holders.
Losses
Losses can occur in many different ways from the network. For example, losses due to
leakage and losses due to the purging of sections of pipe and items of equipment during
commissioning, decommissioning and maintenance. Leakage can be further classified
according to whether it is due to some malfunction, such as a crack in a pipe or a failure of a
joint, or whether it occurs in fully functioning equipment as a direct consequence of its design
and operation.
Emissions from gas transmission networks arise from a large number of small sources spread
over a large area (fugitive). It is estimated that up to 20% of the gas escaping from leaky
pipelines and mains is oxidised in the soil by micro-organisms.
3.2 Definitions
Compressor stations
These are pumping stations designed to either raise or maintain the pressure in the pipeline or
main.
GAS DISTRIBUTION NETWORKS
Activities 050601, 050603 & 010506 ed050601
B561-4 December, 2006 Emission Inventory Guidebook
Distribution System
The term ‘distribution’ usually refers to the low pressure part of a country’s gas supply
network rather than describing the system as a whole.
High pressure LNG storage
Large vessels in which natural gas is stored in liquid form under pressure.
Mains
Transmission pipes on a local level. Typically the sort of gas pipes found under the streets.
Classified as low, medium or intermediate pressure.
Pipeline
The term pipeline is generally restricted to the large diameter, high pressure pipes used in
national transmission systems and the high pressure parts of regional transmission systems.
The smaller pipes branching off from these are referred to as mains.
Ports
A facility at which liquid natural gas is loaded onto and off ships.
Service mains
Also referred to as service pipes or ‘services’. These are the narrow, low pressure pipes
leading directly to a customers premises.
STP
Standard Temperature & Pressure - refers to a temperature of 373.15 K and a pressure of
101325 Pa.
Terminals
A facility for storing and processing gas at the end of a pipeline from a well. The well can be
either on shore or offshore.
3.3 Techniques
The technology which forms part of a typical gas transmission network is described in
Sections 3.1, Description, and 3.2, Definitions, above.
3.4 Emissions
The pollutants emitted by the various parts of a typical gas transmission network are
described in Section 9, Species Profiles, below and the various emission sources within a gas
transmission network are described in Sections 3.1, Description, and 3.2, Definitions, above.
As mentioned in Section 3.1 above it is estimated that up to 20% of the gas escaping from
leaky pipelines and mains is oxidised in the soil by micro-organisms. However, since it is not
possible to measure how much of the gas gets oxidised in this way it is recommended that
this phenomenon is ignored in the estimation of emissions.
GAS DISTRIBUTION NETWORKS
ed050601 Activities 050601, 050603 & 010506
Emission Inventory Guidebook December, 2006 B561-5
3.5 Controls
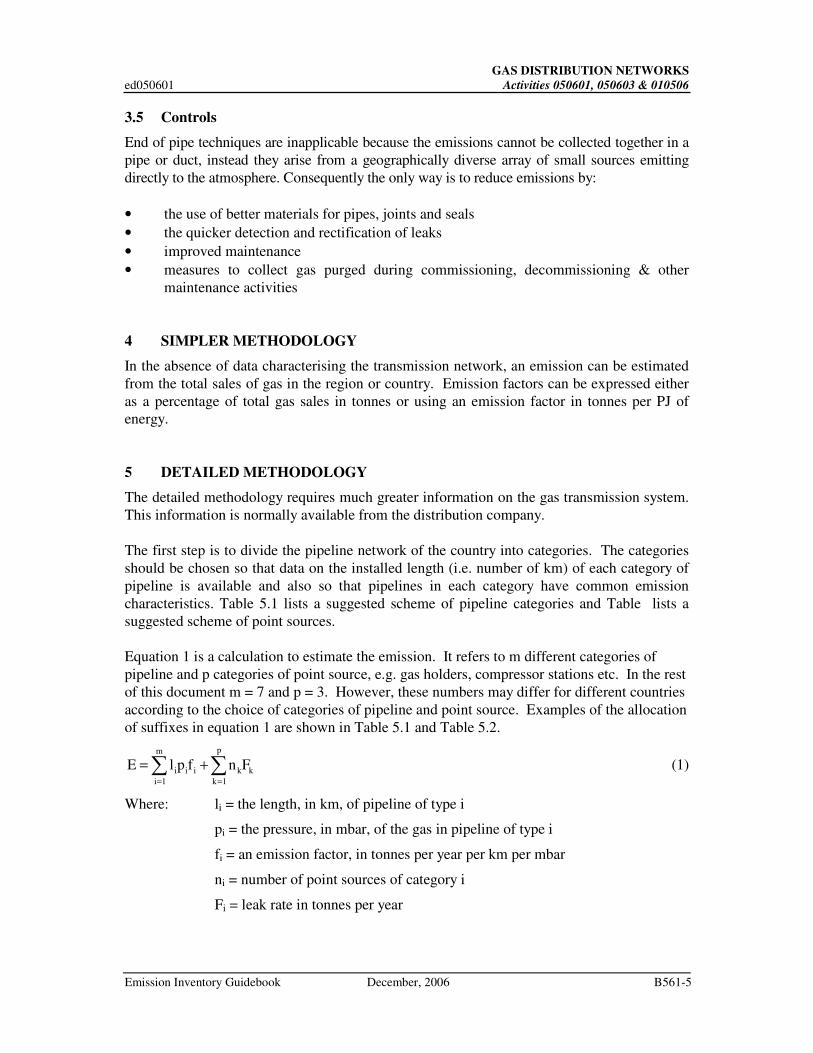
End of pipe techniques are inapplicable because the emissions cannot be collected together in a
pipe or duct, instead they arise from a geographically diverse array of small sources emitting
directly to the atmosphere. Consequently the only way is to reduce emissions by:
• the use of better materials for pipes, joints and seals
• the quicker detection and rectification of leaks
• improved maintenance
• measures to collect gas purged during commissioning, decommissioning & other
maintenance activities
4 SIMPLER METHODOLOGY
In the absence of data characterising the transmission network, an emission can be estimated
from the total sales of gas in the region or country. Emission factors can be expressed either
as a percentage of total gas sales in tonnes or using an emission factor in tonnes per PJ of
energy.
5 DETAILED METHODOLOGY
The detailed methodology requires much greater information on the gas transmission system.
This information is normally available from the distribution company.
The first step is to divide the pipeline network of the country into categories. The categories
should be chosen so that data on the installed length (i.e. number of km) of each category of
pipeline is available and also so that pipelines in each category have common emission
characteristics. Table 5.1 lists a suggested scheme of pipeline categories and Table lists a
suggested scheme of point sources.
Equation 1 is a calculation to estimate the emission. It refers to m different categories of
pipeline and p categories of point source, e.g. gas holders, compressor stations etc. In the rest
of this document m = 7 and p = 3. However, these numbers may differ for different countries
according to the choice of categories of pipeline and point source. Examples of the allocation
of suffixes in equation 1 are shown in Table 5.1 and Table 5.2.
E l p f n Fi
i
m
i i k k
k
p
= +
= =
∑ ∑1 1
(1)
Where: li = the length, in km, of pipeline of type i
pi = the pressure, in mbar, of the gas in pipeline of type i
fi = an emission factor, in tonnes per year per km per mbar
ni = number of point sources of category i
Fi = leak rate in tonnes per year
GAS DISTRIBUTION NETWORKS
Activities 050601, 050603 & 010506 ed050601
B561-6 December, 2006 Emission Inventory Guidebook
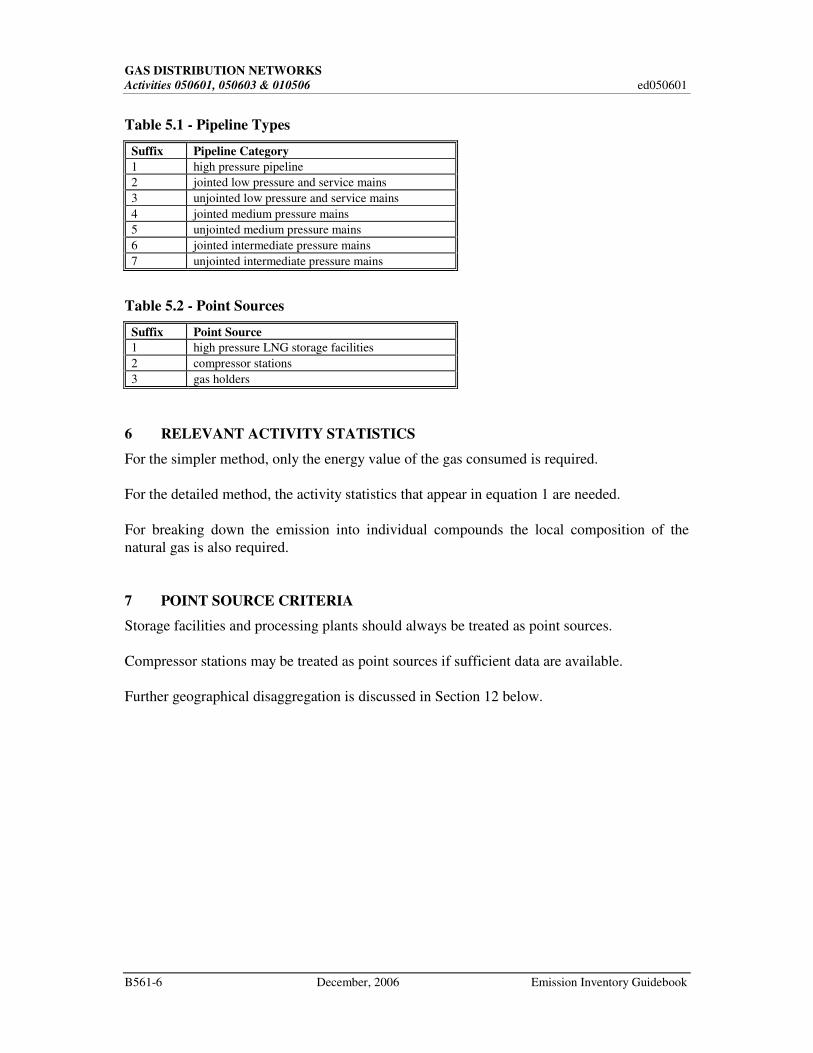
Table 5.1 - Pipeline Types
Suffix Pipeline Category
1 high pressure pipeline
2 jointed low pressure and service mains
3 unjointed low pressure and service mains
4 jointed medium pressure mains
5 unjointed medium pressure mains
6 jointed intermediate pressure mains
7 unjointed intermediate pressure mains
Table 5.2 - Point Sources
Suffix Point Source
1 high pressure LNG storage facilities
2 compressor stations
3 gas holders
6 RELEVANT ACTIVITY STATISTICS
For the simpler method, only the energy value of the gas consumed is required.
For the detailed method, the activity statistics that appear in equation 1 are needed.
For breaking down the emission into individual compounds the local composition of the
natural gas is also required.
7 POINT SOURCE CRITERIA
Storage facilities and processing plants should always be treated as point sources.
Compressor stations may be treated as point sources if sufficient data are available.
Further geographical disaggregation is discussed in Section 12 below.

GAS DISTRIBUTION NETWORKS
ed050601 Activities 050601, 050603 & 010506
Emission Inventory Guidebook December, 2006 B561-7
8 EMISSION FACTORS, QUALITY CODES AND REFERENCES
8.1 Simpler Method
Table 8.1: Default Emission Factors for Simpler Method
Compound Emission factor (tonnes per PJ of
energy)
Data
Quality
Abatement type Abatement
efficiency
Fuel type Country or
region
Reference
Methane 14.8 - 27 E NA NA NA Western
Europe 4
Total emission 19 - 35 E NA NA NA †
Methane 39.6 - 104 E NA NA NA US & Canada 4 Total emission 51 - 130 E NA NA †
Methane 218 - 568 E NA NA NA Former USSR,
Central & 4
Total emission 280 - 730 E NA NA NA Eastern Europe †
Methane 40 - 96 E NA NA NA Other Oil
Exporting 4
Total emission 51 - 120 E NA NA NA Countries †
Methane 40 - 96 E NA NA NA Rest of World 4 Total emission 51 - 120 E NA NA NA †
† derived from methane figures by assuming that the gas is 78 wt% methane
Error limits: ± >100% of emission estimate.
GAS DISTRIBUTION NETWORKS
Activities 050601, 050603 & 010506 ed050601
B561-8 December, 2006 Emission Inventory Guidebook
8.2 Detailed Method
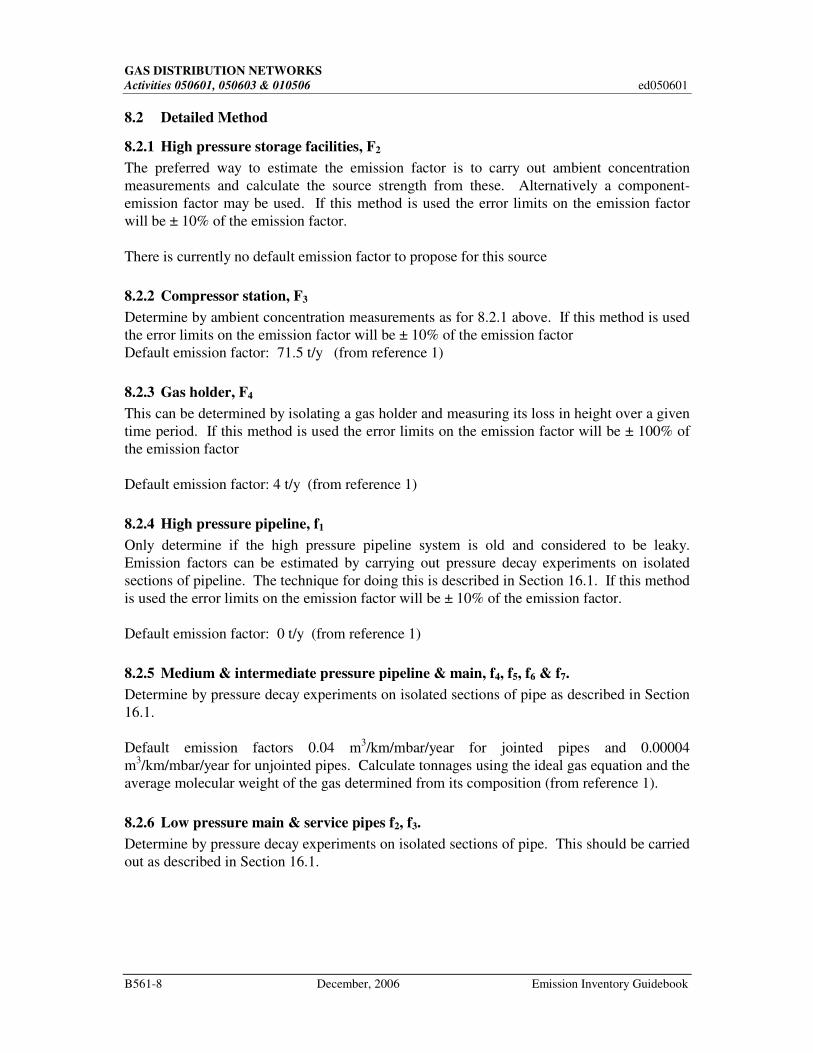
8.2.1 High pressure storage facilities, F2
The preferred way to estimate the emission factor is to carry out ambient concentration
measurements and calculate the source strength from these. Alternatively a component-
emission factor may be used. If this method is used the error limits on the emission factor
will be ± 10% of the emission factor.
There is currently no default emission factor to propose for this source
8.2.2 Compressor station, F3
Determine by ambient concentration measurements as for 8.2.1 above. If this method is used
the error limits on the emission factor will be ± 10% of the emission factor
Default emission factor: 71.5 t/y (from reference 1)
8.2.3 Gas holder, F4
This can be determined by isolating a gas holder and measuring its loss in height over a given
time period. If this method is used the error limits on the emission factor will be ± 100% of
the emission factor
Default emission factor: 4 t/y (from reference 1)
8.2.4 High pressure pipeline, f1
Only determine if the high pressure pipeline system is old and considered to be leaky.
Emission factors can be estimated by carrying out pressure decay experiments on isolated
sections of pipeline. The technique for doing this is described in Section 16.1. If this method
is used the error limits on the emission factor will be ± 10% of the emission factor.
Default emission factor: 0 t/y (from reference 1)
8.2.5 Medium & intermediate pressure pipeline & main, f4, f5, f6 & f7.
Determine by pressure decay experiments on isolated sections of pipe as described in Section
16.1.
Default emission factors 0.04 m3/km/mbar/year for jointed pipes and 0.00004
m3/km/mbar/year for unjointed pipes. Calculate tonnages using the ideal gas equation and the
average molecular weight of the gas determined from its composition (from reference 1).
8.2.6 Low pressure main & service pipes f2, f3.
Determine by pressure decay experiments on isolated sections of pipe. This should be carried
out as described in Section 16.1.

GAS DISTRIBUTION NETWORKS
ed050601 Activities 050601, 050603 & 010506
Emission Inventory Guidebook December, 2006 B561-9
Table 8.2: Default Emission Factors for Detailed Method
Compound Source Symbol Value Unit Data
Quality
Abatement
type
Abatement
efficiency
Fuel type Country or
region
Reference
methane high pressure storage
facilities F2 no data t/y E NA NA NA UK 1
methane high pressure pipeline f1 0 t/y/km E NA NA NA UK 1
methane jointed intermediate
pressure main f6 0.04 m
3/km/mb
ar/year E NA NA NA UK 1
methane unjointed intermediate
pressure main f7 0.00004 m
3/km/mb
ar/year E NA NA NA UK 1
methane jointed medium
pressure main f4 0.04 m
3/km/mb
ar/year E NA NA NA UK 1
methane unjointed medium
pressure main f5 0.00004 m
3/km/mb
ar/year E NA NA NA UK 1
methane jointed low pressure
main & service pipes f2 88 m3/km/ye
ar/mbar E NA NA NA UK 2
methane unjointed low pressure
main & service pipes f3 88 m
3/km/ye
ar/mbar E NA NA NA UK 2
methane compressor station F3 71.5 t/y E NA NA NA UK 1
methane gas holder F4 4 t/y E NA NA NA UK 1
GAS DISTRIBUTION NETWORKS ed050601
Activities 050601, 050603 & 010506
B561-10 December, 2006 Emission Inventory Guidebook
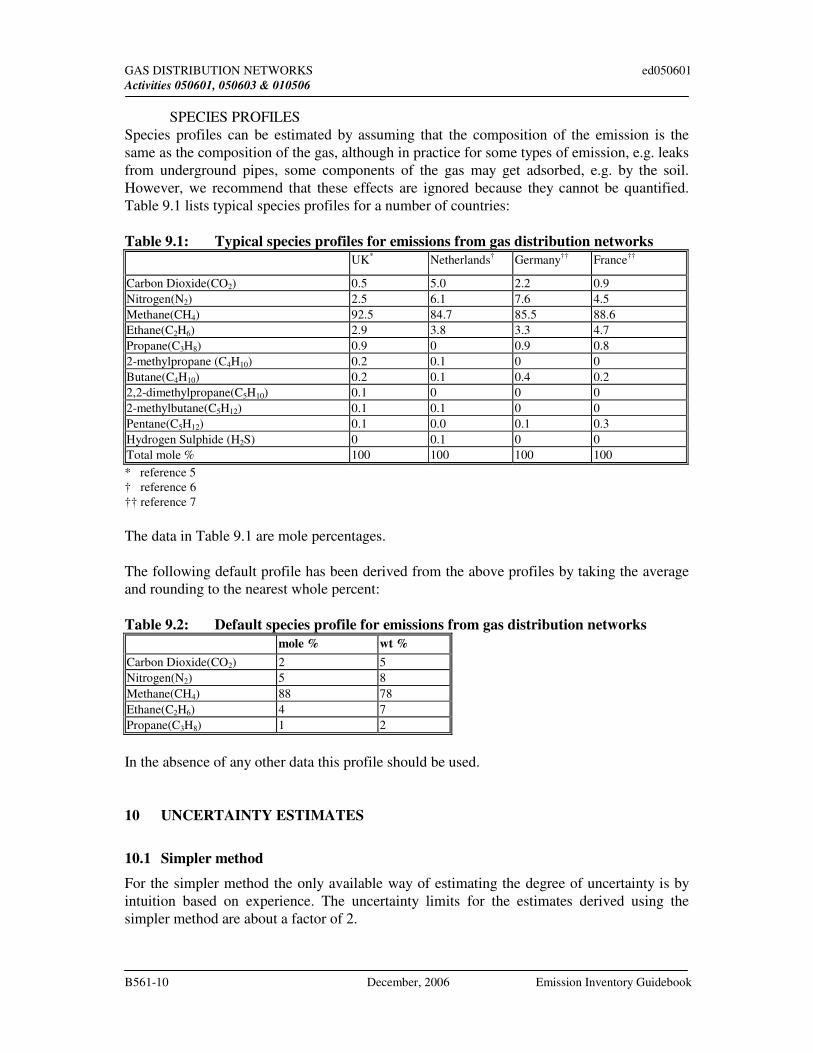
SPECIES PROFILES
Species profiles can be estimated by assuming that the composition of the emission is the
same as the composition of the gas, although in practice for some types of emission, e.g. leaks
from underground pipes, some components of the gas may get adsorbed, e.g. by the soil.
However, we recommend that these effects are ignored because they cannot be quantified.
Table 9.1 lists typical species profiles for a number of countries:
Table 9.1: Typical species profiles for emissions from gas distribution networks
UK* Netherlands† Germany†† France††
Carbon Dioxide(CO2) 0.5 5.0 2.2 0.9 Nitrogen(N2) 2.5 6.1 7.6 4.5 Methane(CH4) 92.5 84.7 85.5 88.6 Ethane(C2H6) 2.9 3.8 3.3 4.7 Propane(C3H8) 0.9 0 0.9 0.8 2-methylpropane (C4H10) 0.2 0.1 0 0 Butane(C4H10) 0.2 0.1 0.4 0.2 2,2-dimethylpropane(C5H10) 0.1 0 0 0 2-methylbutane(C5H12) 0.1 0.1 0 0 Pentane(C5H12) 0.1 0.0 0.1 0.3 Hydrogen Sulphide (H2S) 0 0.1 0 0 Total mole % 100 100 100 100
* reference 5
† reference 6
†† reference 7
The data in Table 9.1 are mole percentages.
The following default profile has been derived from the above profiles by taking the average
and rounding to the nearest whole percent:
Table 9.2: Default species profile for emissions from gas distribution networks
mole % wt %
Carbon Dioxide(CO2) 2 5 Nitrogen(N2) 5 8 Methane(CH4) 88 78 Ethane(C2H6) 4 7 Propane(C3H8) 1 2
In the absence of any other data this profile should be used.
10 UNCERTAINTY ESTIMATES
10.1 Simpler method
For the simpler method the only available way of estimating the degree of uncertainty is by
intuition based on experience. The uncertainty limits for the estimates derived using the
simpler method are about a factor of 2.
GAS DISTRIBUTION NETWORKS
ed050601 Activities 050601, 050603 & 010506
Emission Inventory Guidebook December, 2006 B561-11
10.2 Detailed method
The detailed method requires the determination of emission factors for various sources within
the gas transmission network and the error in the final emission estimate will depend on the
way in which these factors are determined. Section 8.2, suggests error limits for each of the
methods discussed. However, in practice the error limits may differ from these if the
techniques used to estimate the emission factors are not identical to those described in
Section 8.2. Section 8.2 also gives error limits for the default emission factors.
The error limits for the emission factors should be combined with the error limits for the
activity statistics (which should be available from the source of the statistics) according to the
usual rules of the propagation of errors to give an error limit for the total emission.
11 WEAKEST ASPECTS/PRIORITY AREAS FOR IMPROVEMENT IN
CURRENT METHOD
11.1 Simpler method
This method depends on the default emission factor. However, better estimates of the
emission factor can only be obtained by using the detailed method.
11.2 Detailed method
The main weakness of the detailed method is that it can be quite effort intensive to determine
accurate emission factors.
12 SPATIAL DISAGGREGATION
The gas transmission system can be divided into two, the two parts being the national
transmission system consisting of a relatively small number of high pressure pipelines
covering distances of hundreds of kilometres, the second part being the rest of the
transmission system. Data on the locations of the various pipelines which form the national
transmission system should be readily available for most countries. These can then be
regarded as line sources. Emissions from the rest of the system can be broken down into a
mixture of area sources, proportional to population density, and point sources corresponding
to the locations of major installations such as terminals, storage, processing plants and larger
compressor stations.
13 TEMPORAL DISAGGREGATION CRITERIA
Leakage rate is a function of pressure rather than throughput. It is therefore safe to assume
that the leakage rate is constant.
14 ADDITIONAL COMMENTS
No additional comments.

GAS DISTRIBUTION NETWORKS ed050601
Activities 050601, 050603 & 010506
B561-12 December, 2006 Emission Inventory Guidebook
15 SUPPLEMENTARY DOCUMENTS
No supplementary documents are required.
16 VERIFICATION PROCEDURES
The emission factors for the detailed method can be checked by carrying out pipeline leak
tests as described in Section 16.1.
16.1 Pipeline Leak Tests
Identify a representative sample of pipes to test. The best way of doing this is to compile a
table such as the figure below dividing up the national network into a number of categories
based on pipe diameter and material:
Table 16.1: Example table for pipeline leak tests
Diameter Steel Pit Cast Spun Cast Ductile PE ≤8cm 10-13cm 15-18cm 20-28cm
≥30cm
The categories described in the above figure are for illustration only. Different diameters and
materials may be more appropriate in different countries.
Start by entering into the table the number of kilometres of pipe of each category in the entire
distribution system. Next, decide how many sections of pipeline from each category should be
chosen for the experiments. The aim is to identify a sample of experimental pipeline sections
which are representative of the network as a whole. The number of test sections in each
category should generally be proportional to the number of kilometres in the network and to
the expected variability of leakage rates. The leakage rates from PE pipes are expected to be
less variable than those from cast iron pipes and so fewer tests are required for a given size of
population for PE pipes than for cast iron to establish the leak rate to the same level of
uncertainty.
For each section of ‘main’ identified agreement will be needed from the customer supplied by
that main to allow interruption of their supply for the duration of the test. Each section of
pipe to be isolated should be approximately 1km long. The service pipe should be capped on
the customer’s side of the meter isolation valve.
Two pressure decay experiments are required for each isolated section of pipe. In one test a
leak of known magnitude is introduced into the pipeline under test and a pressure decay curve
plotted. In the other the control leak is stopped. From the two pressure decay curves it is
possible to calculate the rate of gas leakage from the test section without prior knowledge of
the internal volume of the section.
GAS DISTRIBUTION NETWORKS
ed050601 Activities 050601, 050603 & 010506
Emission Inventory Guidebook December, 2006 B561-13
Leak rates should be determined in this way for a number of different pressures, both above,
below and at the normal operating pressure of the main.
The leak rate should also be determined with the service pipe disconnected from the main.
This allows separate leak rates to be calculated for the service pipe. Service pipes are made
of a number of different materials and the sample of test mains should include service pipes
of all the materials used.
Default emission factor: 88 m3/km/year/mbar including leakage from service pipes. The
emission factors fLj, and fLu can be calculated from these figures using the pressure in the pipe
and the composition of the gas (to estimate the weight of 1m3 of gas), (from reference 2)
17 REFERENCES
1 British Gas, submission to the Watt Committee, January 1993.
2 C Rose, ‘Establishing the level of methane leakage from the British gas distribution
system’, International Gas Union - 19th
World Gas Conference, Milan 20/23 June
1994.
3 UK Digest of Environmental Protection & Water Statistics 1994.
4 IPCC Greenhouse Gas Inventory Workbook.
5 Proceedings of the Congress “Gas quality specification and measurement and
chemical properties of natural gas”, Groningen, 22 - 25 April 1986
6 Procestechniek 42 (1987) Nr 10, p36(3)
7 International Gas Union working group on interchangeability of gases May 1976.
18 BIBLIOGRAPHY
Perry’s Handbook of Chemical Engineering, 6/e, McGraw Hill, 1984
19 RELEASE VERSION, DATE AND SOURCE
Version 2.2
Date: 1 February 1999
Source: H. J. Rudd
AEA Technology Environment
UK
Updated with particulate matter details by:
Mike Woodfield
AEA Technology
UK
December 2006

GAS DISTRIBUTION NETWORKS ed050601
Activities 050601, 050603 & 010506
B561-14 December, 2006 Emission Inventory Guidebook
20 POINT OF ENQUIRY
Any comments on this chapter or enquiries should be directed to:
Panagiota Dilara
Emissions and Health Unit
Institute for Environment and Sustainability (IES)
European Commission
Joint Research Centre
I-21020 Ispra (VA)
Italy
Tel: +39 0332 789207
Fax: +39 0332 785869
Email: [email protected]
GEOTHERMAL ENERGY EXTRACTION
ed050700 Activity 050700
Emission Inventory Guidebook December, 2006 B570-1
SNAP CODE: 050700
SOURCE ACTIVITY TITLE: GEOTHERMAL ENERGY EXTRACTION
NOSE CODE:
NFR CODE: 7
A specific methodology for this activity has not been prepared because the contribution to
total national emissions is thought to be currently insignificant, i.e. less than 1% of national
emissions of any pollutant.
If you have information contrary to this please contact the expert panel leaders.
This activity is not believed to be a significant source of PM2.5 (as of December 2006).
Updated with particulate matter details by:
Mike Woodfield
AEA Technology
UK
December 2006
Leaders of the Combustion and Industry Expert Panel
Jozef Pacyna
NILU - Norwegian Institute of Air Research, PO Box 100, N-2007 Kjeller, Norway
Tel: +47 63 89 8155
Fax: +47 63 89 80 50
Email: [email protected]
Panagiota Dilara
Emissions and Health Unit, Institute for Environment and Sustainability (IES), European
Commission, Joint Research Centre, I-21020 Ispra (VA), Italy
Tel: +39 0332 789207
Fax: +39 0332 785869
Email: [email protected]
Pieter van der Most
HIMH-MI-Netherlands, Inspectorate for the Environment, Dept for Monitoring and
Information Management, PO Box 30945, 2500 GX Den Haag, The Netherlands
Tel: +31 70 339 4606
Fax: +31 70 339 1988
Email: [email protected]

EXTRACTION AND FIRST TREATMENT OF SOLID FOSSIL FUELS
ed050101 Activities 050101-050103
Emission Inventory Guidebook December, 2006 B511-1
SNAP CODE: 050101
050102
050103
SOURCE ACTIVITY TITLE: EXTRACTION AND FIRST TREATMENT OF
SOLID FOSSIL FUELS
Open Cast Mining
Underground Mining
Storage of Solid Fuel
NOSE CODE : 106.01.01
106.01.02
106.01.03
NFR CODE: 1 B 1 a
1 ACTIVITIES INCLUDED
This section covers only coal, not peat or other solid fuels. Subsequent treatment of coal, such
as fuel conversion, coking, gasification or liquefaction are not treated in this chapter, but are
included in related chapters of the guidebook.
2 CONTRIBUTION TO TOTAL EMISSIONS
The extraction and first treatment of solid fuels results in emissions of methane from mining
operations. This sector was estimated to be responsible for 22% of national emissions of
methane in the UK in 1991 (Gilham 1994). Limited reliable data is available for the other
pollutants.
These activities are not believed to be a significant source of PM2.5 (as of December 2006).
3 GENERAL
3.1 Description
Coalfields contain a proportion of highly volatile material which is released during the
working, extraction and storage of coal. The volatile material is known as firedamp, made up
primarily of methane, although other compounds are also present in minor amounts.
The release of firedamp often results in an emission to air as it not always economical to
contain the gas, for flaring or use as a fuel.
During coal extraction, the following processes connected with methane emission can be
identified:
a) developing access to the coal deposit and its preparation for extraction;
b) coal extraction and transport on the surface;
c) coal processing, disposal, transport and crushing before final use;
d) deposit de-methaning before, during and after its excavation;

EXTRACTION AND FIRST TREATMENT OF SOLID FOSSIL FUELS
Activities 050101-050103 ed050101
B511-2 December, 2006 Emission Inventory Guidebook
e) disposal of spoils from the coal extraction system.
Air containing methane is emitted usually to the atmosphere because its use as fuel or for
combustion purposes is not economically viable, mainly due to the high dilution.
3.2 Definitions
Fire-damp - inflammable gas released during the working of coal mines. In general, methane
is considered a safety hazard.
3.3 Techniques
Two types of mining operations are considered in this chapter - deep mines and open cast
mines. In addition, it is important to note that coal varies considerably from one field to
another, depending on its age and geological location. The proportion of fire-damp
associated with the different types of mining and the different types of coal have shown
considerable variation. Attempts to model the relationship between the proportion of fire-
damp and factors such as depth of coal seam, nature of coal and local geology have shown
some correlations although the associated uncertainty is very large.
Once coal is extracted, it may be stored, transported internally or exported, or a combination
of all three. Associated gaseous emissions continue to occur and it is thought that these will
be related to the coal type, the size of the coal pieces, the mechanical disturbance during
handling etc.
3.4 Emissions/Controls
In technological processes performed in underground workings, methane is released which,
unless taken in by the de-methaning systems, is discharged to the atmosphere by the
ventilation systems of the mines. The ventilation systems are the primary and main methane
emission source from coal mines. Emission from the ventilation systems is described as
ventilation emission. Methane, in this case called “residual gas”, is also contained in the coal
extracted to the surface and released during the extraction processes. Emission related to
these processes is called emission from extraction processes. This emission constitutes the
second methane emission source in coal mining.
Some methane is also contained in the bed rock extracted to the surface with coal and gets
released during bed rock disposal. This is the third source of methane emission. The fourth
source is the de-methaning systems. The methane collected by these systems is not totally
utilised or combusted in flames and some or all of the volume is emitted as “whistler” to the
atmosphere.
In open casting coal extraction, there are two main sources of ventilation emission:
• emission from the extracted coal;
• emission from the deposits coating the working.
The primary emission of fire-damp is believed to occur during the extraction of deep mine
coal. Open cast mining, since it involves the extraction of coal seams close to the surface, and
the handling and storage of coal, are not considered to be as important.

EXTRACTION AND FIRST TREATMENT OF SOLID FOSSIL FUELS
ed050101 Activities 050101-050103
Emission Inventory Guidebook December, 2006 B511-3
In many cases, firedamp is actively removed from the coalfield, by various methods, normally
described collectively as methane drainage. This is primarily for reasons of safety. As an
example, in the UK, in 1988, 16% of the fire-damp released by deep mining was vented from
methane drainage systems, 11% was captured and used as fuel, 61% was emitted with
ventilation air and about 12% was removed in the mined coal.
Data from Russia (Tsibulski 1995) indicates that the balance of methane emissions from coal
seams and enclosing rocks is distributed as follows:
60% emitted to atmosphere from mines together with ventilation air
12% captured in mines and if not utilised then also emitted
15% emitted to atmosphere from coal extracted to the surface
13% remains in the seam and surrounding rock
Firedamp may be removed before the mining of a coal seam (pre-drainage) or as a
consequence of mining (post-drainage). The latter approach is likely to be the most common.
3.4.1 Post-drainage Technologies
Cross-measures Methane Drainage
Boreholes are drilled at an angle above, and sometimes below, the mined out area, which
collapses as the coal is removed. The boreholes are drilled close to the coalface and linked to
a common pipe range. Suction is applied to the pipe range to draw the gas to a discharge
point. Depending on circumstances and geology, 35% to 75% of the total gas released in an
underground district can be captured at purities ranging from 30% to 70%. Higher purity gas
is generally not available.
Surface ‘Gob’ Well Post-drainage
This technology is well established in the US. Gas is drained via surface boreholes from the
de-stressed zone above a caving ‘long-wall’ face. The gas produced is generally of high
purity. The principle disadvantage is high drilling costs and surface environmental planning
restrictions.
Other methods of post drainage include Super-Adjacent Drainage Heading (Sewer Road) and
Super Adjacent Guided Long-hole. Both methods involve driving long boreholes or roadways
adjacent to the worked coalface (typically with 30m to 40m). The applicability is very much
dependent on local geology.
3.4.2 Pre-drainage Technologies
In-seam Boreholes
This requires drilling boreholes parallel to the undisturbed coalface. The success of this
technique depends on the permeability of the coal and the gas pressure. The higher the
permeability and gas pressure, the greater the efficiency.
Hydrofracced Surface Boreholes

EXTRACTION AND FIRST TREATMENT OF SOLID FOSSIL FUELS
Activities 050101-050103 ed050101
B511-4 December, 2006 Emission Inventory Guidebook
This technique involves hydraulically fracturing a sequence of productive horizons, injecting
sand into the fractures and connecting the fractures to a well head assembly. Gas and other
fluids occupy the sand-filled fractures and enter the well head assembly without encountering
excessive resistance. The technique has been applied in the US, but is also very dependent on
geology.
3.4.3 Extracting Pollutants from the Ventilation Air
Besides active drainage of gas, removal also occurs as a result of the ventilation of the mine.
Using the ventilation air as feed air for boilers or engines may control organic compounds
associated with ventilation air. Liquefaction of gases, catalytic or biological oxidation are
generally inappropriate for low concentrations of organic compounds found in ventilation air.
3.4.4 Utilisation of Firedamp
Reducing Emissions by Flaring
Flaring is not a common method for controlling firedamp, since to practice this safely is often
prohibitively expensive.
Reducing Emissions by Using Gas as a Fuel
This is not a new concept. Since recovering combustible material from ventilation air is
expensive, the technique applies primarily to actively drained firedamp. Whether or not
firedamp is used as a fuel depends primarily on financial considerations, particularly if
ensuring a continuous supply requires backup fuels such as Liquid Petroleum Gas, and if
competitor fuels are readily available.
4 SIMPLER METHODOLOGY
The simpler methodology involves the application of a general emission factor to an
appropriate activity statistic for each of three categories:
• underground coal mine
• open coal mine
• post mining treatment and storage.
5 DETAILED METHODOLOGY
This requires data to be collected for each major coalfield. Specific emission factors for each
field are obtained primarily by measurement or inferred from related data from similar fields.
The field specific emission factors are used to derive field specific emissions.
Within the detailed methodology data on emissions from individual mines needs to be
obtained. Emission determination can be performed using specific emission factors and data
on the extraction volume, emission measurements, data on methane intake in the degassing
units and the volume of the “whistler” from the de-methaning systems.
EXTRACTION AND FIRST TREATMENT OF SOLID FOSSIL FUELS
ed050101 Activities 050101-050103
Emission Inventory Guidebook December, 2006 B511-5
6 RELEVANT ACTIVITY STATISTICS
For the simpler methodology the relevant activity statistic is total mass of coal produced by
underground mining and the total tonnage of coal produced by opencast mining.
For the more detailed approach, the activity statistic is the tonnage of coal produced from
regions or coalfields where each available emission factor can be applied.
7 POINT SOURCE CRITERIA
The underground coalmines can be considered as point sources if the relevant site-specific data
are available. It can be necessary in the case the modelling of pollutants dispersion in local or
regional scale.
The open-cast mining should be considered as area sources due to large area covered by coal
extraction activities.
8 EMISSION FACTORS, QUALITY CODES AND REFERENCES
8.1 Simpler Methodology
The IPCC Guidelines for National Greenhouse Gas Inventories give a comprehensive review
of emission factors derived from measurements and modelling studies.
The default Emission Factors, to be used when no better data is available, are as follows:
Mining Activities
Deep-mine coal - low methane 10 m3/Mg coal produced
Deep-mine coal - high methane 25 m3/Mg coal produced
Opencast-mine - low methane 0.3 m3/Mg coal produced
Opencast-mine - high methane 2.0 m3/Mg coal produced
Post mining activities
Underground coal mine - low methane 0.9 m3/Mg coal produced
Underground coal mine - high methane 4.0 m3/Mg coal produced
Opencast-mine - low methane 0.0 m3/Mg coal produced
Opencast-mine - high methane 0.2 m3/Mg coal produced
Emission factors relate to methane only. No data quality is given, although the default
emission factor is based on a number of measurements, the variation is large. Use of the
default emission factors would result in an estimate of data quality D.
Selection of high or low methane emission factor depends on the results of measurement data
carried out at selected coalfields. If no data are available then the higher emission factor
should be used.
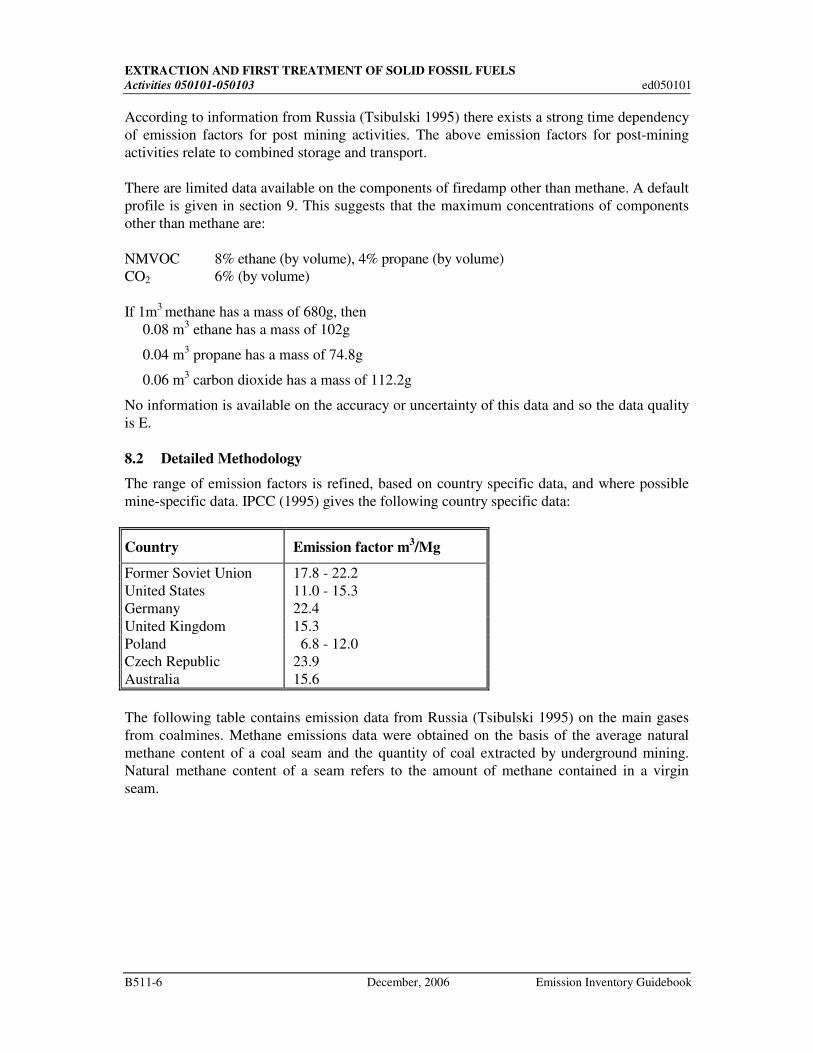
EXTRACTION AND FIRST TREATMENT OF SOLID FOSSIL FUELS
Activities 050101-050103 ed050101
B511-6 December, 2006 Emission Inventory Guidebook
According to information from Russia (Tsibulski 1995) there exists a strong time dependency
of emission factors for post mining activities. The above emission factors for post-mining
activities relate to combined storage and transport.
There are limited data available on the components of firedamp other than methane. A default
profile is given in section 9. This suggests that the maximum concentrations of components
other than methane are:
NMVOC 8% ethane (by volume), 4% propane (by volume)
CO2 6% (by volume)
If 1m3
methane has a mass of 680g, then
0.08 m3 ethane has a mass of 102g
0.04 m3 propane has a mass of 74.8g
0.06 m3 carbon dioxide has a mass of 112.2g
No information is available on the accuracy or uncertainty of this data and so the data quality
is E.
8.2 Detailed Methodology
The range of emission factors is refined, based on country specific data, and where possible
mine-specific data. IPCC (1995) gives the following country specific data:
Country Emission factor m3/Mg
Former Soviet Union 17.8 - 22.2
United States 11.0 - 15.3
Germany 22.4
United Kingdom 15.3
Poland 6.8 - 12.0
Czech Republic 23.9
Australia 15.6
The following table contains emission data from Russia (Tsibulski 1995) on the main gases
from coalmines. Methane emissions data were obtained on the basis of the average natural
methane content of a coal seam and the quantity of coal extracted by underground mining.
Natural methane content of a seam refers to the amount of methane contained in a virgin
seam.
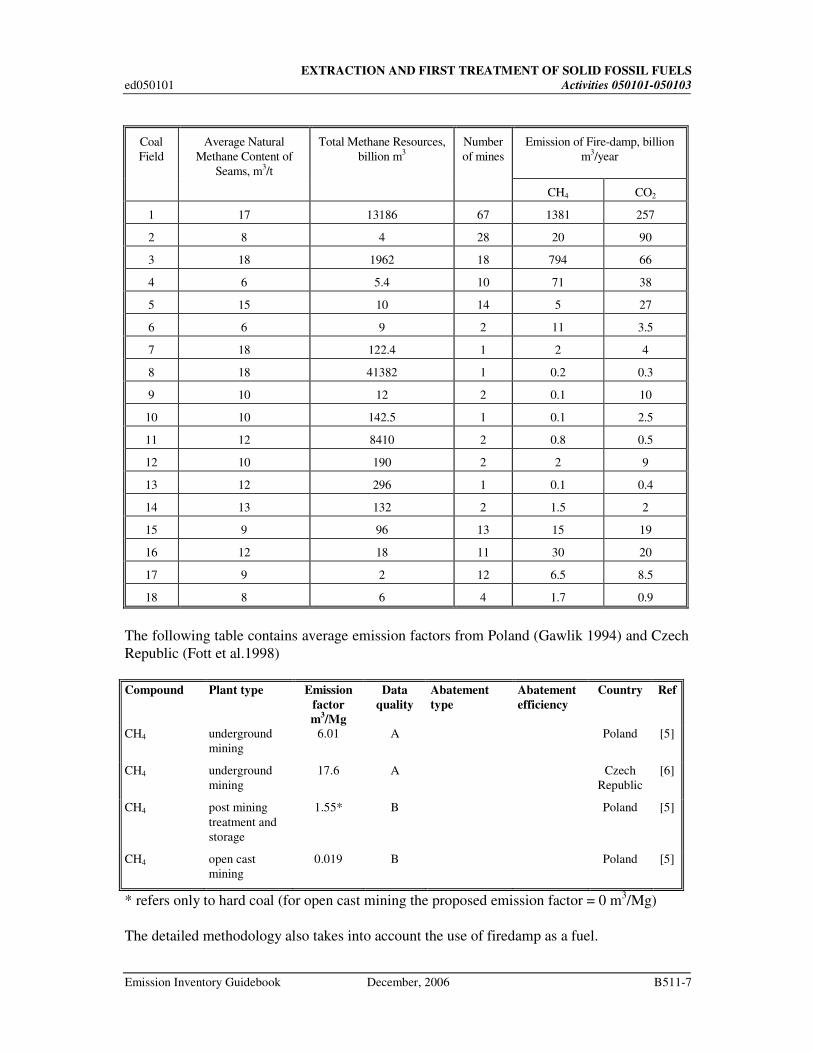
EXTRACTION AND FIRST TREATMENT OF SOLID FOSSIL FUELS
ed050101 Activities 050101-050103
Emission Inventory Guidebook December, 2006 B511-7
Coal
Field
Average Natural
Methane Content of
Seams, m3/t
Total Methane Resources,
billion m3
Number
of mines
Emission of Fire-damp, billion
m3/year
CH4 CO2
1 17 13186 67 1381 257
2 8 4 28 20 90
3 18 1962 18 794 66
4 6 5.4 10 71 38
5 15 10 14 5 27
6 6 9 2 11 3.5
7 18 122.4 1 2 4
8 18 41382 1 0.2 0.3
9 10 12 2 0.1 10
10 10 142.5 1 0.1 2.5
11 12 8410 2 0.8 0.5
12 10 190 2 2 9
13 12 296 1 0.1 0.4
14 13 132 2 1.5 2
15 9 96 13 15 19
16 12 18 11 30 20
17 9 2 12 6.5 8.5
18 8 6 4 1.7 0.9
The following table contains average emission factors from Poland (Gawlik 1994) and Czech
Republic (Fott et al.1998)
Compound Plant type Emission
factor
m3/Mg
Data
quality
Abatement
type
Abatement
efficiency
Country Ref
CH4 underground
mining
6.01 A Poland [5]
CH4 underground
mining
17.6 A Czech
Republic
[6]
CH4 post mining
treatment and
storage
1.55* B Poland [5]
CH4 open cast
mining
0.019 B Poland [5]
* refers only to hard coal (for open cast mining the proposed emission factor = 0 m3/Mg)
The detailed methodology also takes into account the use of firedamp as a fuel.
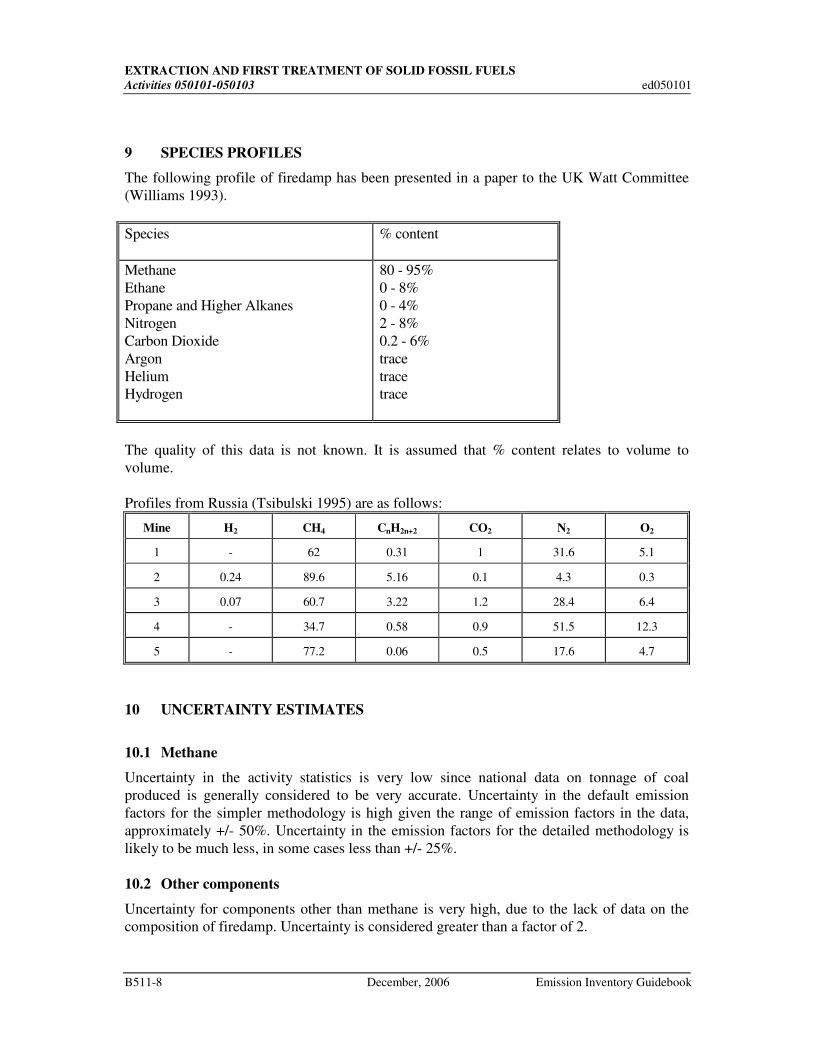
EXTRACTION AND FIRST TREATMENT OF SOLID FOSSIL FUELS
Activities 050101-050103 ed050101
B511-8 December, 2006 Emission Inventory Guidebook
9 SPECIES PROFILES
The following profile of firedamp has been presented in a paper to the UK Watt Committee
(Williams 1993).
Species % content
Methane
Ethane
Propane and Higher Alkanes
Nitrogen
Carbon Dioxide
Argon
Helium
Hydrogen
80 - 95%
0 - 8%
0 - 4%
2 - 8%
0.2 - 6%
trace
trace
trace
The quality of this data is not known. It is assumed that % content relates to volume to
volume.
Profiles from Russia (Tsibulski 1995) are as follows:
Mine H2 CH4 CnH2n+2 CO2 N2 O2
1 - 62 0.31 1 31.6 5.1
2 0.24 89.6 5.16 0.1 4.3 0.3
3 0.07 60.7 3.22 1.2 28.4 6.4
4 - 34.7 0.58 0.9 51.5 12.3
5 - 77.2 0.06 0.5 17.6 4.7
10 UNCERTAINTY ESTIMATES
10.1 Methane
Uncertainty in the activity statistics is very low since national data on tonnage of coal
produced is generally considered to be very accurate. Uncertainty in the default emission
factors for the simpler methodology is high given the range of emission factors in the data,
approximately +/- 50%. Uncertainty in the emission factors for the detailed methodology is
likely to be much less, in some cases less than +/- 25%.
10.2 Other components
Uncertainty for components other than methane is very high, due to the lack of data on the
composition of firedamp. Uncertainty is considered greater than a factor of 2.
EXTRACTION AND FIRST TREATMENT OF SOLID FOSSIL FUELS
ed050101 Activities 050101-050103
Emission Inventory Guidebook December, 2006 B511-9
11 WEAKEST ASPECTS/PRIORITY AREAS FOR IMPROVEMENT IN
CURRENT METHODOLOGY
The priority area for improvement is to provide accurate information on the composition of
firedamp, particularly the light hydrocarbon content. This is likely to vary considerably
between coalfields.
12 SPATIAL DISAGGREGATION CRITERIA FOR AREA SOURCES
Desegregation should be based on the information about territorial units in which the
processes occur, and on the production of coal per given territorial unit.
13 TEMPORAL DISAGGREGATION CRITERIA
It may be assumed that emissions occur over 24 hours and consistently throughout the year.
14 ADDITIONAL COMMENTS
No additional comments.
15 SUPPLEMENTARY DOCUMENTS
The IPCC Guidelines for National Greenhouse Gas Inventories should be referred to when
estimating emissions.
16 VERIFICATION PROCEDURES
Verification is primarily through provision of national measurement data at representative
coalfields. In addition, the validity of measurements can be gauged through comparison with
results form other countries.
17 REFERENCES
[1] IPCC (1995) Guidelines for National Greenhouse Gas Inventories. Greenhouse Gas
Inventory Reference Manual.
[2] Williams (1993) Methane Emissions - Paper Presented at the 29 Consultative Conference
of the Watt Committee on Energy, Edited by Professor Alan Williams, Department of Fuel
and Energy, University of Leeds, UK.
[3] Gilham C.A., Couling S., Leech P.K., Eggleston H.S., Irwin J.G. (1994) ‘UK Emissions
of Air Pollutants 1970-1991 (Including Methodology Update) LR961, Originally Published
by Warren Spring Laboratory, Available from NETCEN Library, AEA Technology
Environment, Culham, Abingdon, Oxfordshire, OX14 3DB, UK.

EXTRACTION AND FIRST TREATMENT OF SOLID FOSSIL FUELS
Activities 050101-050103 ed050101
B511-10 December, 2006 Emission Inventory Guidebook
[4] Tsibulski V. (1995), Scientific Research Institute of Atmospheric Air Protection SRI
Atmosphere, St. Petersburg, Russia, Personal Communication, January 1998.
[5] Gawlik L. (1992r), Greenhouse Gas Emissions from hard and brown coal extraction in
Poland, Expertise under National Greenhouse Gases Emission Inventory, Institute of
Environmental Protection, Warsaw, 1992;
[6] Fott P., Pretel J., Neuzil V. and Blaha B., Final Report of Project PPZP-310/2/98 for
Czech Ministry of Environment (Czech National Inventory of GHG in 1997), Czech
Hydrometeorological Institute, Praha 1998
[7] Takla G., Novacek P., Emission of Mine Gases in the Ostrava-Karvina district, In:
Proceedings of conference “Emissions of Natural Gas”, CPNS Praha, May 1997
18 BIBLIOGRAPHY
No additional documents.
19 RELEASE VERSION, DATE AND SOURCE
Version : 2.2
Date : February 1999
Updated by : Janina Fudala, Marian Cenowski
Institute for Ecology of Industrial Areas (IETU)
Poland
Original author : Stephen Richardson.
AEA Technology Environment
UK
Updated with particulate matter details by:
Mike Woodfield
AEA Technology
UK
December 2006
20 POINT OF ENQUIRY
Any comments on this chapter or enquiries should be directed to:
Janina Fudala
Institute for Ecology of Industrial Areas (IETU)
6 Kossutha Street
PL-40832 Katowice
Poland

EXTRACTION AND FIRST TREATMENT OF SOLID FOSSIL FUELS
ed050101 Activities 050101-050103
Emission Inventory Guidebook December, 2006 B511-11
Tel: +48 32 25 40 381
Fax: +48 32 25 41 717
Email: [email protected]

EXTRACTION, FIRST TREATMENT AND LOADING OF LIQUID & GASEOUS FOSSIL FUELS
ed050201 Activities 050201 - 050303
Emission Inventory Guidebook December, 2006 B521-1
SNAP CODE: 050200
050201
050202
050301
050302
050303
SOURCE ACTIVITY TITLE: EXTRACTION, 1ST TREATMENT AND LOADING OF
LIQUID FOSSIL FUELS
Land-based Activities
Off-shore Activities
EXTRACTION, 1ST TREATMENT AND LOADING OF
GASEOUS FOSSIL FUELS
Land-based Desulfuration
Land-based Activities (other than Desulfuration)
Off-shore Activities
NOSE CODE: 106.02.01
106.02.02
106.03.01
106.03.02
106.03.03
NFR CODE: 1 B 2 a i
1 B 2 b
1 ACTIVITIES INCLUDED
These SNAP codes cover the emissions from sources in connection with the extraction and
preliminary treatment of liquid and gaseous fossil fuels. This includes extraction, first
treatment and loading of gaseous and liquid fossil fuels from on-shore and offshore facilities.
Flaring and combustion of fossil fuels are not included in this section (see SNAP code
090206 and SNAP sectors 1 - 3).
The fugitive losses from production facilities, first loading of crude fuels, and gas processing
plants prior to the national or international gas distribution systems are also included.
Subsequent loading and distribution of fuels are considered under SNAP codes 050400 and
050600. Note that production and transport facilities may not be associated with the same
countries as the first treatment facilities. For example a gas production platform may be in a
Norwegian field, but the gas received at a terminal in Germany.
The current section covers the following activities which may take place on land or offshore:
• cold venting,
• fugitive emissions from production platforms,
• crude oil stabilisation
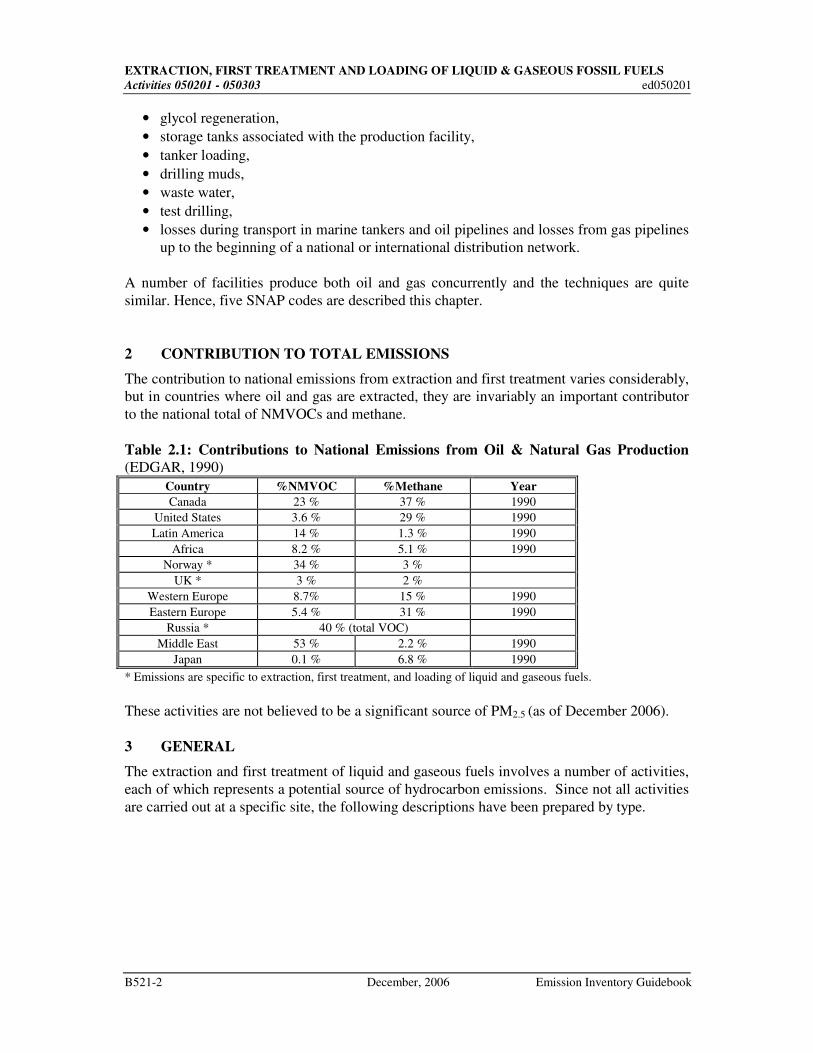
EXTRACTION, FIRST TREATMENT AND LOADING OF LIQUID & GASEOUS FOSSIL FUELS
Activities 050201 - 050303 ed050201
B521-2 December, 2006 Emission Inventory Guidebook
• glycol regeneration,
• storage tanks associated with the production facility,
• tanker loading,
• drilling muds,
• waste water,
• test drilling,
• losses during transport in marine tankers and oil pipelines and losses from gas pipelines
up to the beginning of a national or international distribution network.
A number of facilities produce both oil and gas concurrently and the techniques are quite
similar. Hence, five SNAP codes are described this chapter.
2 CONTRIBUTION TO TOTAL EMISSIONS
The contribution to national emissions from extraction and first treatment varies considerably,
but in countries where oil and gas are extracted, they are invariably an important contributor
to the national total of NMVOCs and methane.
Table 2.1: Contributions to National Emissions from Oil & Natural Gas Production
(EDGAR, 1990)
Country %NMVOC %Methane Year Canada 23 % 37 % 1990
United States 3.6 % 29 % 1990
Latin America 14 % 1.3 % 1990
Africa 8.2 % 5.1 % 1990
Norway * 34 % 3 %
UK * 3 % 2 %
Western Europe 8.7% 15 % 1990
Eastern Europe 5.4 % 31 % 1990
Russia * 40 % (total VOC)
Middle East 53 % 2.2 % 1990
Japan 0.1 % 6.8 % 1990
* Emissions are specific to extraction, first treatment, and loading of liquid and gaseous fuels.
These activities are not believed to be a significant source of PM2.5 (as of December 2006).
3 GENERAL
The extraction and first treatment of liquid and gaseous fuels involves a number of activities,
each of which represents a potential source of hydrocarbon emissions. Since not all activities
are carried out at a specific site, the following descriptions have been prepared by type.
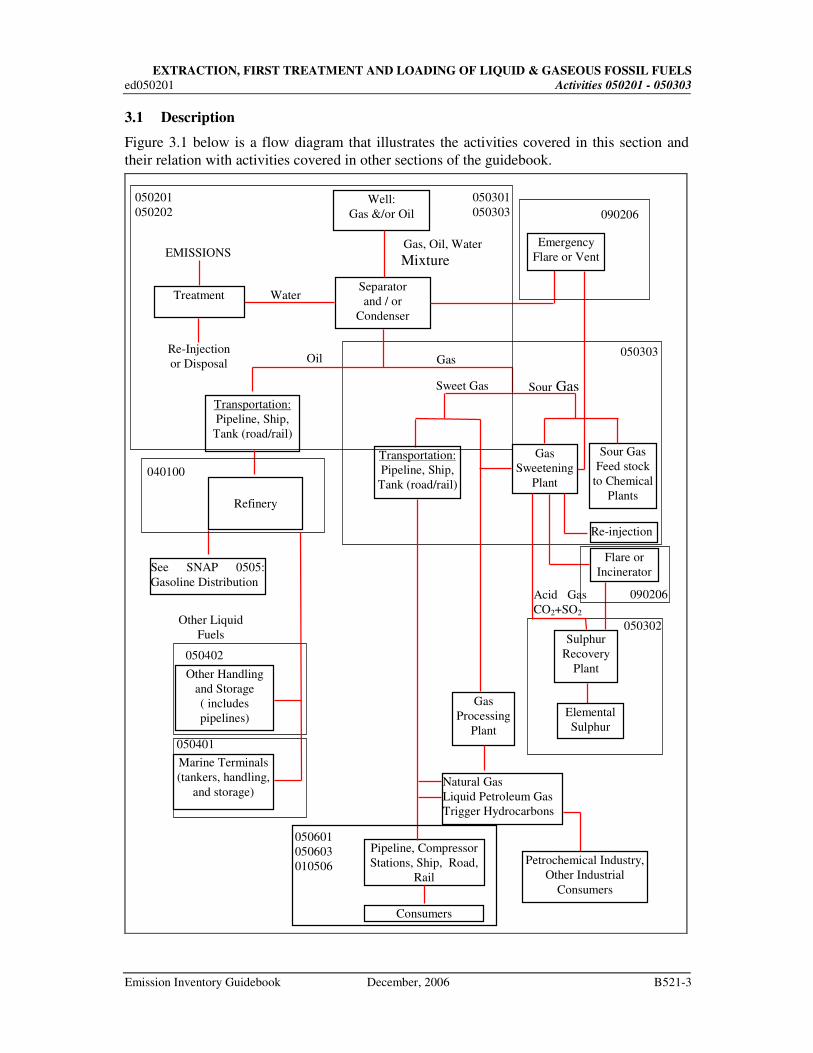
EXTRACTION, FIRST TREATMENT AND LOADING OF LIQUID & GASEOUS FOSSIL FUELS
ed050201 Activities 050201 - 050303
Emission Inventory Guidebook December, 2006 B521-3
3.1 Description
Figure 3.1 below is a flow diagram that illustrates the activities covered in this section and
their relation with activities covered in other sections of the guidebook.
Well:
Gas &/or Oil
Separator
and / or
Condenser
Gas, Oil, Water
Mixture
Water Treatment
EMISSIONS Emergency
Flare or Vent
Oil Gas Re-Injection
or Disposal
Sweet Gas Sour Gas
Transportation:
Pipeline, Ship,
Tank (road/rail)
Sour Gas
Feed stock
to Chemical
Plants
Gas
Sweetening
Plant
Gas
Processing
Plant
Flare or
Incinerator
Re-injection
Acid Gas
CO2+SO2
Sulphur
Recovery
Plant
Elemental
Sulphur
Natural Gas
Liquid Petroleum Gas
Trigger Hydrocarbons
050303
Transportation:
Pipeline, Ship,
Tank (road/rail)
Refinery
050302
090206
090206
See SNAP 0505:
Gasoline Distribution
050201
050202 050301
050303
Pipeline, Compressor
Stations, Ship, Road,
Rail
Consumers
Petrochemical Industry,
Other Industrial
Consumers
050601
050603
010506
040100
Other Handling
and Storage
( includes
pipelines)
Other Liquid
Fuels
Marine Terminals
(tankers, handling,
and storage)
050401
050402
EXTRACTION, FIRST TREATMENT AND LOADING OF LIQUID & GASEOUS FOSSIL FUELS
Activities 050201 - 050303 ed050201
B521-4 December, 2006 Emission Inventory Guidebook
3.1.1 Combined oil and gas facilities
Production platforms handle the reception, treatment and export of well fluids. Crude oil is
usually de-watered and gas is processed for platform use, re-injection, or export as required.
The process system on production platforms consists of :
Separation of crude oil, gas and water and subsequent export
Gas treatment and export
Produced water handling
Pressure relief and blow down
Utilities (energy supply etc.)
Injection systems for gas and oil
Crude oil stabilisation
Desulphurisation of gaseous fuels (usually land based)
3.1.2 Facilities producing gas only
These facilities do not have crude oil separation and export. The produced water handling
systems are not present or partially present.
3.1.3 Facilities producing oil only
These facilities do not have gas treatment and export process systems. However there are few
examples of facilities with absolutely no gas production.
3.1.4 Gas terminals
The typical gas terminal facility receives gas by pipelines, and conditions the gas ready for
export to the national or international distribution network. Gas conditioning includes:
separation, CO2 and hydrogen sulphide removal, hydrogen sulphide incineration, pressure
relief and blowdown systems.
3.1.5 Oil loading and transport
This source includes the transfer of oil or liquefied gas from storage tanks or directly from the
well into a ship or another container specifically for transport away from the production site.
This activity also includes losses during transport.
3.1.6 Pipelines
Oil and gas is commonly transported from oil and gas facilities to terminals by pipelines.
These may cross national boundaries.
3.1.7 Drilling
Drilling of wells involves the use of specially formulated drilling muds which may contain
organic solvents. When the drilling breaks through small oil/gas reservoirs emissions may
result.

EXTRACTION, FIRST TREATMENT AND LOADING OF LIQUID & GASEOUS FOSSIL FUELS
ed050201 Activities 050201 - 050303
Emission Inventory Guidebook December, 2006 B521-5
3.2 Definitions
Flaring: Open combustion of gases from a “flare stack” without utilising
the energy
Facility: Oil and natural gas platforms, terminals, etc.
Fugitive losses: Emission of hydrocarbon vapours from process equipment and
evaporation of hydrocarbons from open areas, rather than
through a stack or vent. Includes emissions from valves,
connectors, flanges, seals, process drains, oil/water separators,
storage, transfer operations, etc.
Glycol regeneration: A process that reduces the water content in glycol by heating
and gas stripping.
Sm3(Standard cubic meter): 1 m
3 of gas at 15
oC and 1 atm pressure (1.01325 bar).
Venting: Direct, controlled, release of gas to the atmosphere.
Stripping gas: Gas used to promote reduction of an unwanted component in a
fluid (e.g. remove water in glycol regeneration and oxygen from
water injection system).
3.3 Techniques
The technology for the extraction and first treatment of liquid and gaseous fossil fuels are
described in sections 3.1. and 3.4.
3.4 Emissions/Controls
3.4.1 Combined oil and gas facilities
The emissions from combined oil and gas facilities may be categorised as direct venting of
gas into the atmosphere, fugitive losses and evaporation from contaminated waste water.
Venting is a deliberate, direct release of gas from the various processes and is usually related
to pressure relief and blow down systems to ensure safe operations. The operations which
result in direct venting also include stripping gas from glycol regeneration, water treatment,
relieved gas in seal oil systems, equipment depressurisation and other activities leading to
venting.
Venting emissions may be reduced by flaring (incinerating) the gas. This is desired from a
environmental point of view as methane is a more potent greenhouse gas per molecule than
CO2. Installation of recovery systems for atmospheric vents is also a possibility. The
recovered gas may be exported, used on platforms or re-injected. Nitrogen may be used as
purge gas instead of hydrocarbons.
Crude oil stabilisation involves the removal of the most volatile components of the crude oil.
Stabilisation of crude oil occurs either on offshore platforms, or less usually, at terminals.
Although the process has the potential to cause emissions of VOC, the United Kingdom
EXTRACTION, FIRST TREATMENT AND LOADING OF LIQUID & GASEOUS FOSSIL FUELS
Activities 050201 - 050303 ed050201
B521-6 December, 2006 Emission Inventory Guidebook
Offshore Operators Association (UKOOA) claim that emissions are in fact small since the
volatiles are generally either used as fuel or are sent to flare rather than being vented directly
to the atmosphere.
Desulphurisation of gaseous fossil fuels is the removal of hydrogen sulphide (H2S) from the
gas. See SNAP 040103 for description and emissions calculations
Fugitive emissions arise from several sources, in particular gas leakage through compressor
seals, valves and flanges. These emissions may be reduced by implementing procedures for
detecting leaks from the process systems, minimising leaks and spills through equipment
changes, procedure changes, improved monitoring, house keeping, and maintenance
practices.
Waste water separated from the oil/gas mixture is first cleaned before disposal. The cleaned
water inevitably contains some organic compounds which may evaporate later. The organic
compounds removed during cleaning may also evaporate.
3.4.2 Facilities producing gas only
These facilities are designed to sell the gas produced. Therefore, generally, there is less direct
venting and flaring of gas. These facilities also produce less waste water. Control options are
the same as those mentioned for the combined facilities described in 3.4.1.
3.4.3 Facilities producing oil only
All gas produced will either be flared, vented, used as fuels or re-injected into the reservoirs.
Generally, at oil only facilities the crude oil/gas mixture reaching the surface will contain less
gas than the mixture at combined or gas facilities. In general the methane content of vented
gas is less than that found in gas producing facilities. Control options are the same as those
mentioned for the combined facilities described in 3.4.1.
3.4.4 Gas terminals
The main emission sources are the flare at the pressure relief system associated with the
compression unit, the vent from the gas drying operation and the stack from the H2S-
incinerator. There are also several fugitive sources, leakages through compressor seals, valves
and flanges. The technologies and potential for reductions in emissions will be very similar to
a gas production platform. An acid gas scrubber may be applied to the H2S incinerator.
Control options are the same as those mentioned for the combined facilities described in
3.4.1.
3.4.5 Oil loading and transport
Crude oil is transported from production operations to a refinery by tankers, barges, rail tank
cars, tank trucks, and pipelines (next section). When oil is loaded, hydrocarbon vapour will be
displaced by oil and new vapour will be formed, both leading to emissions. The mass emitted
will depend on:
• the movement of the vessel - the greater the movement the greater the emissions
EXTRACTION, FIRST TREATMENT AND LOADING OF LIQUID & GASEOUS FOSSIL FUELS
ed050201 Activities 050201 - 050303
Emission Inventory Guidebook December, 2006 B521-7
• the vapour pressure of the crude
• temperature of the crude - temperature should be as low as possible
• loading rate into each tank - the greater the loading rate the lower the emissions
• method of loading - splash, submerged, or bottom loading
• geometry of the tanks - the higher the surface area to volume the higher the emissions
• tank atmosphere, and
• crude oil washing procedures.
Although unloading in itself is a minor source compared to loading, procedures for unloading
may influence the emissions while loading. Recovery systems will be available in the near
future that will reduce the NMVOC emissions from off shore loading by about 70%.
Technologies to reduce emissions from on shore loading are available. The efficiency is about
85%.(Methane emissions will not be reduced considerably).
Ballasting of marine vessels is another potential source of emissions. Ballasting losses are a
major source of emissions from unloading at marine terminals. Ballasting does not occur
with all vessels as many (and the new vessels) have segregated tanks where ballasting is not
necessary and is even not in use in some countries (e.g. Norway).
Ballasting is the partial loading of cargo tanks after cargo is unloaded to improve stability of
the vessel. Cargo tanks are typically ballasted to about 80 % of their capacity, resulting in 15
to 40 % of the vessel capacity. Emissions occur when the vapours present are displaced by
the ballast water. The ballast water is then pumped out prior to loading thereby reducing the
subsequent loading emissions. Emissions may be reduced by containing the vapours through
displacing the ballasting vapours into a cargo tank that is simultaneously being unloaded. (US
EPA, 1996)
3.4.6 Pipelines
Emissions may originate from connection points, valves and damaged sections. Emissions
may be controlled by inspection procedures followed by repair and upgrading (further
described in 3.4.1 under fugitive emissions).
3.4.7 Drilling
The main emission sources during drilling are penetration of shallow gas pockets, migration
of reservoir fluid through the circulated drilling fluid, gas migration through poor casing and
cement work, the use of oil or solvent based drilling muds, and the wash of oil contaminated
cuttings. The main control options are gas removal during drilling and recovery of
hydrocarbons from oil based muds and cuttings.
4 SIMPLER METHODOLOGY
Emissions may be estimated using general emission factors multiplied by the level of activity
as described in section 6. Emissions from the various sub-sources mentioned in section 3.4
and 6 are estimated independently and added. Countries need to know the important features
of their production systems to estimate the main sources of emissions.

EXTRACTION, FIRST TREATMENT AND LOADING OF LIQUID & GASEOUS FOSSIL FUELS
Activities 050201 - 050303 ed050201
B521-8 December, 2006 Emission Inventory Guidebook
5 DETAILED METHODOLOGY
The detailed methodology involves quantification of emissions by source using field specific
activity statistics and emission factors or direct measurements/engineering calculations. Field
studies in collaboration with industry will be required to more accurately quantify the
emissions at specific sites. Many of the calculations are detailed within the simpler
methodology. Emission factors exist for many of the emission sources such as: venting,
fugitive sources, drilling, and transportation of fuels. Several calculation methods are
available and are described in the subsections 8.1 and 8.2.
6 RELEVANT ACTIVITY STATISTICS
The material in the following sections for the simple and detailed methodology has been
organised in a hierarchical manner, beginning with the easiest information to obtain going to
the more detailed methods as the list progresses. It is recommended to obtain all of the
information possible per facility or per m3 of gas produced by facility type, then calculate the
emission using the requisite methodology.
6.1 Simple Methodology
For the simpler methodology the following activity statistics are required:
The number of facilities (platforms) - age and type.
Oil and gas production, preferably by field. These data are available from national
statistical offices in each country and from various international sources such as the
OECD and CASPER (see section 15).
The heat content of the oil and gas and density of the oil.
The volume of gas processed through a gas terminal - will be available from national
sources.
The mass of crude oil loaded into tankers (ships or trucks). This mass will in many
cases be equal to the oil production at a specific field.
The frequency of drilling operations (the number of wells drilled per year or the total
number of days drilled per year).
The volume of gas or oil transported through a given pipeline - this volume is
measured for economical reasons or it might in many cases be equal to the combined
production from a number of fields.
The mass and composition of drilling muds
6.2 Detailed Methodology
For the detailed methodology the following field specific activity statistics are required in
addition to the above information described in the simple methodology:
EXTRACTION, FIRST TREATMENT AND LOADING OF LIQUID & GASEOUS FOSSIL FUELS
ed050201 Activities 050201 - 050303
Emission Inventory Guidebook December, 2006 B521-9
The volume of gas vented.
The composition of the gas vented and its average molecular weight.
The component count of the gas handling system (e.g. number of valves, flanges and
seals, etc.).
The volume of H2S gas incinerated or the sulphur content of the gas.
Average true vapour pressure of liquid loaded onto ships, Reid Vapour Pressure
(RPV), average molecular weight of vapours, density of condensed vapours, and
average temperature of vapours for oil being transported from each field.
7 POINT SOURCE CRITERIA
The location of oil and gas production facilities are associated with specific oil and gas fields.
Where practical individual fields and production facilities should be considered as point
sources.
All pipelines, ships and trucks in movement should be considered as line sources.
All gas terminals should be considered as point sources.
8 EMISSION FACTORS, QUALITY CODES AND REFERENCES
8.1 Simpler Methodology
The following sections detail the simpler methodology for the calculation of emissions.
Though this is the simple method some of the calculations for emission sources are quite
detailed. The calculations have been arranged from the simpler to the more detailed.
Methods used to calculate the emissions should be based on the available information.
For some of the calculations other sections of the Atmospheric Emissions Inventory
Guidebook will be required. These sections are, but, not limited to the following:
• Desulphurisation SNAP 040103
• Flaring SNAP 090206
• Combustion of fuels SNAP sectors 1 - 3
• Loading of storage tanks and trucks SNAP 040104
• Liquid Fuel Distribution SNAP 050400
• Gas distribution networks SNAP 050600
Care must be taken when using the emission factors listed in the following sub-sections. They
contain a high degree of uncertainty, and are only provided to indicate the relative differences
that exist between the countries. Further investigation of the emission rates is required to
determine the type of facilities they represent, and the extend of possible double counting.
These emission factors should be used if no other sources of information are available.

EXTRACTION, FIRST TREATMENT AND LOADING OF LIQUID & GASEOUS FOSSIL FUELS
Activities 050201 - 050303 ed050201
B521-10 December, 2006 Emission Inventory Guidebook
8.1.1 Combined oil and gas facilities
The following tables list the emission factors for venting per facility and per Smillion m3 of
gas produced.
Table 8.1: Suggested Emission Factors for Venting (kg/Smillion m3
gas produced) (OLF,
1993)
NMVOC CH4 CO2 Quality codes
Norway 76 98 0 C
Table 8.2: Suggested emission factors for venting (Mg per facility) (OLF, 1993; UKOOA
1995)
NMVOC CH4 CO2 Quality codes
Norway 30 20 0 C
UK 550 660 70 C
Generally, the venting will be higher on older platforms than on newer platforms. The main
reasons for the difference are: recent platforms have employed the use of low pressure
systems, more recovery of hydrocarbon gases, use of electric start turbines rather than gas
driven and moving away from the practice of venting. If better data is not available, the
highest suggested emission factor should be applied.
Suggested emission factors for fugitive losses:
The following equation has been suggested for installations in USA (Countess et al, 1993),
which seems to be in reasonable agreement with estimates for Norway and UK.
Total VOC (Mg/year) = 40.2 * N + 1.1 * 10-2
* X + 8.5 * 10-6
* Y (1)
Where: N is the number of facilities (e.g. platforms)
X is the gas production (million Sm3/year)
Y is the oil production (mill Mg/year)
Of the total VOC, a composition of 75 % methane and 25 % NMVOC may be assumed if
better data is not available.
If the technology is old, emissions may be higher than estimated by this equation.
8.1.2 Facilities producing gas only
The tables below list emission factors for entire facilities for the extraction, first treatment,
and loading of gaseous fuels. The Emission Factors are of 3 types: general (SNAP 050300),
onshore (SNAP 050302), and offshore (SNAP 050303) activities. Care must be taken when
using these emission factors due to the high degree of uncertainty. It is recommended to use
the detailed procedure in section 8.2.2.
For desulphurisation see SNAP 040103.
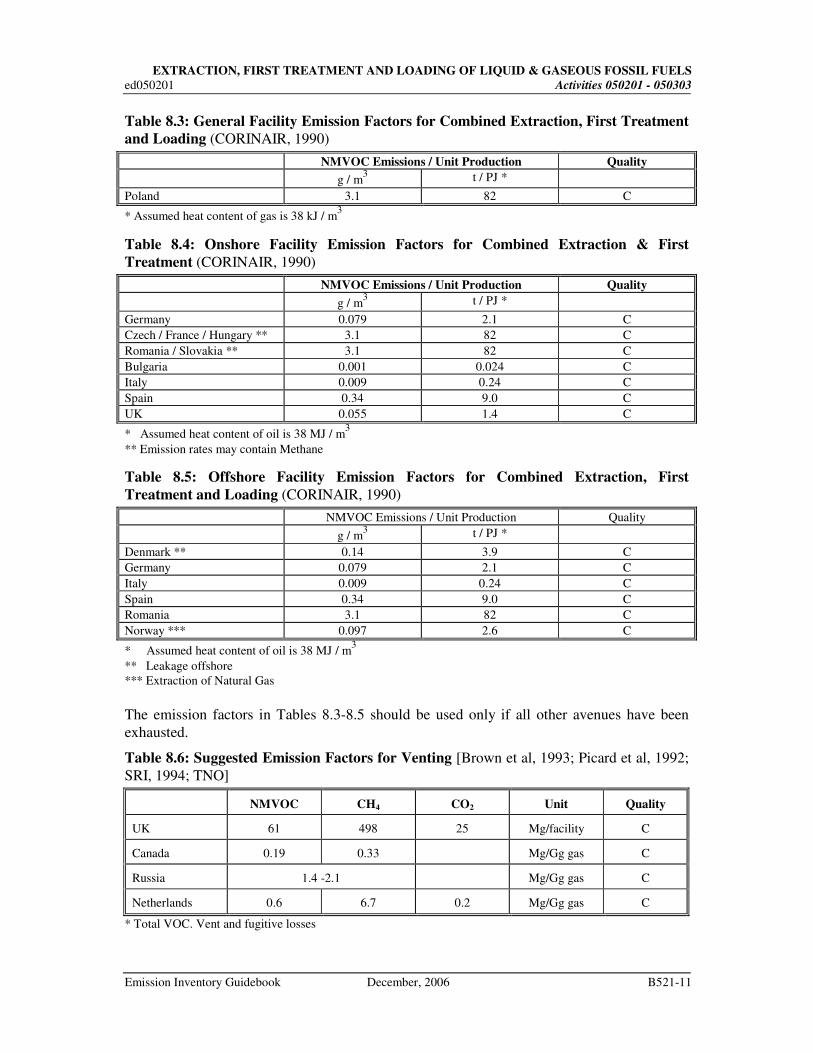
EXTRACTION, FIRST TREATMENT AND LOADING OF LIQUID & GASEOUS FOSSIL FUELS
ed050201 Activities 050201 - 050303
Emission Inventory Guidebook December, 2006 B521-11
Table 8.3: General Facility Emission Factors for Combined Extraction, First Treatment
and Loading (CORINAIR, 1990)
NMVOC Emissions / Unit Production Quality
g / m3 t / PJ *
Poland 3.1 82 C
* Assumed heat content of gas is 38 kJ / m3
Table 8.4: Onshore Facility Emission Factors for Combined Extraction & First
Treatment (CORINAIR, 1990)
NMVOC Emissions / Unit Production Quality
g / m3 t / PJ *
Germany 0.079 2.1 C
Czech / France / Hungary ** 3.1 82 C
Romania / Slovakia ** 3.1 82 C
Bulgaria 0.001 0.024 C
Italy 0.009 0.24 C
Spain 0.34 9.0 C
UK 0.055 1.4 C
* Assumed heat content of oil is 38 MJ / m3
** Emission rates may contain Methane
Table 8.5: Offshore Facility Emission Factors for Combined Extraction, First
Treatment and Loading (CORINAIR, 1990)
NMVOC Emissions / Unit Production Quality
g / m3 t / PJ *
Denmark ** 0.14 3.9 C
Germany 0.079 2.1 C
Italy 0.009 0.24 C
Spain 0.34 9.0 C
Romania 3.1 82 C
Norway *** 0.097 2.6 C
* Assumed heat content of oil is 38 MJ / m3
** Leakage offshore
*** Extraction of Natural Gas
The emission factors in Tables 8.3-8.5 should be used only if all other avenues have been
exhausted.
Table 8.6: Suggested Emission Factors for Venting [Brown et al, 1993; Picard et al, 1992;
SRI, 1994; TNO]
NMVOC CH4 CO2 Unit Quality
UK 61 498 25 Mg/facility C
Canada 0.19 0.33 Mg/Gg gas C
Russia 1.4 -2.1 Mg/Gg gas C
Netherlands 0.6 6.7 0.2 Mg/Gg gas C
* Total VOC. Vent and fugitive losses

EXTRACTION, FIRST TREATMENT AND LOADING OF LIQUID & GASEOUS FOSSIL FUELS
Activities 050201 - 050303 ed050201
B521-12 December, 2006 Emission Inventory Guidebook
For fugitive losses Equation 1 (Section 8.1.1) will be relevant.
Table 8.7: Canadian Fugitive Emission Factors for Facilities. (Countess et al, 1993)
NMVOC CH4 Unit Quality
Canada 0.9 1.5 Mg/Gg gas C
8.1.3 Facilities producing oil only
The tables below list emission factors for entire facilities for the extraction, first treatment,
and loading of oil from onshore (SNAP 050201) and offshore (SNAP 050202) activities.
Table 8.8: Onshore Facility Emission Factors for Combined Extraction & First
Treatment (CORINAIR, 1990)
NMVOC Emissions / Unit Production Quality
kg / t t / PJ *
France / Bulgaria /Italy 0.10 2.4 C
Greece / Spain / Slovak 0.090 2.1 C
* Assumed heat content of oil is 42 GJ / t
Table 8.9: Offshore Facility Emission Factors for Combined Extraction, First
Treatment and Loading (CORINAIR, 1990)
NMVOC Emissions / Unit Production Quality
kg / t t / PJ *
Italy 0.10 2.4 C
Romania 0.10 2.4 C
Norway (1) ** 0.58 14 C
Norway (2) ** 2.0 47 C
UK 3.2 75 C
Spain 0.091 2.2 C
* Assumed heat content of oil is 42 GJ / t
** Norway (1) and (2) assumed to be 2 different facilities
The emission factors in Tables 8.8-8.9 should be used only if all other avenues have been
exhausted.
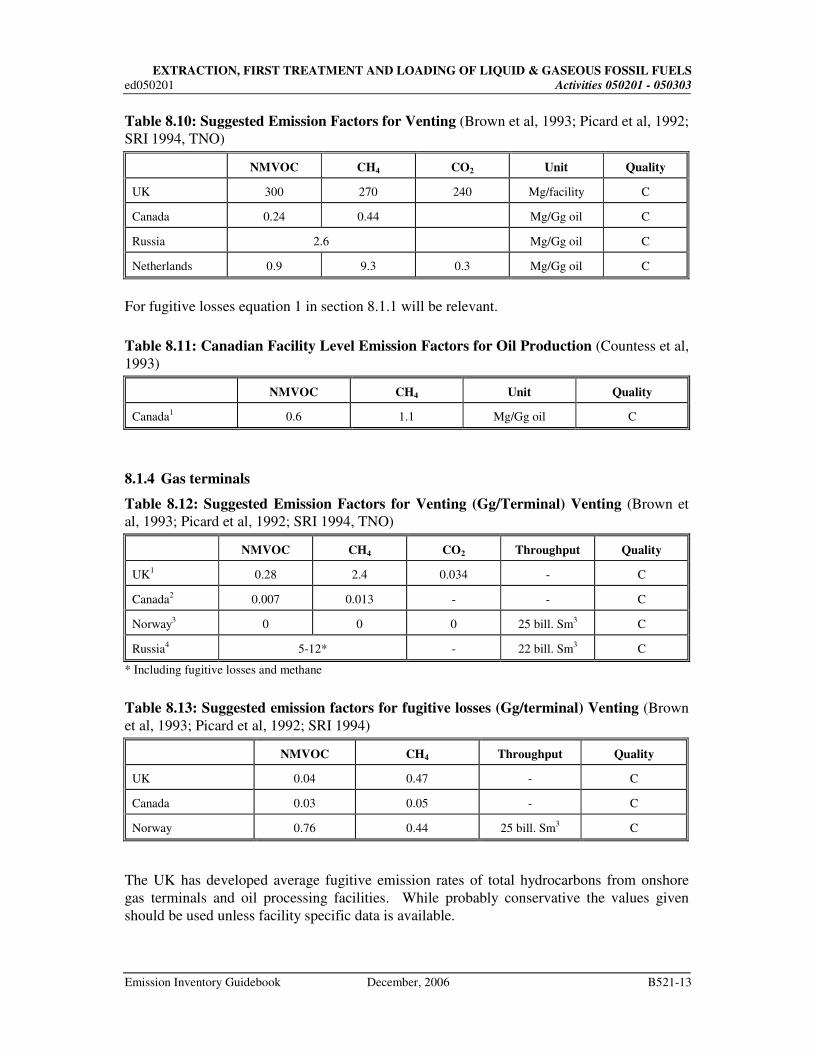
EXTRACTION, FIRST TREATMENT AND LOADING OF LIQUID & GASEOUS FOSSIL FUELS
ed050201 Activities 050201 - 050303
Emission Inventory Guidebook December, 2006 B521-13
Table 8.10: Suggested Emission Factors for Venting (Brown et al, 1993; Picard et al, 1992;
SRI 1994, TNO)
NMVOC CH4 CO2 Unit Quality
UK 300 270 240 Mg/facility C
Canada 0.24 0.44 Mg/Gg oil C
Russia 2.6 Mg/Gg oil C
Netherlands 0.9 9.3 0.3 Mg/Gg oil C
For fugitive losses equation 1 in section 8.1.1 will be relevant.
Table 8.11: Canadian Facility Level Emission Factors for Oil Production (Countess et al,
1993)
NMVOC CH4 Unit Quality
Canada1 0.6 1.1 Mg/Gg oil C
8.1.4 Gas terminals
Table 8.12: Suggested Emission Factors for Venting (Gg/Terminal) Venting (Brown et
al, 1993; Picard et al, 1992; SRI 1994, TNO)
NMVOC CH4 CO2 Throughput Quality
UK1 0.28 2.4 0.034 - C
Canada2 0.007 0.013 - - C
Norway3 0 0 0 25 bill. Sm
3 C
Russia4 5-12* - 22 bill. Sm
3 C
* Including fugitive losses and methane
Table 8.13: Suggested emission factors for fugitive losses (Gg/terminal) Venting (Brown
et al, 1993; Picard et al, 1992; SRI 1994)
NMVOC CH4 Throughput Quality
UK 0.04 0.47 - C
Canada 0.03 0.05 - C
Norway 0.76 0.44 25 bill. Sm3 C
The UK has developed average fugitive emission rates of total hydrocarbons from onshore
gas terminals and oil processing facilities. While probably conservative the values given
should be used unless facility specific data is available.
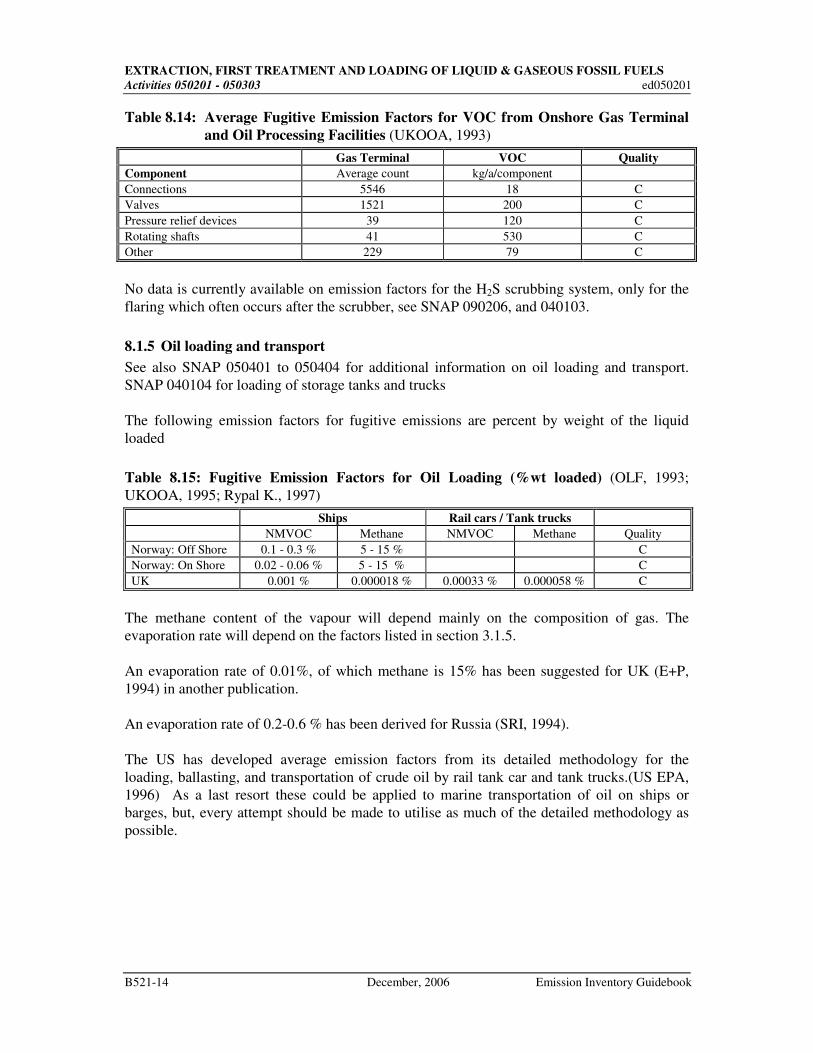
EXTRACTION, FIRST TREATMENT AND LOADING OF LIQUID & GASEOUS FOSSIL FUELS
Activities 050201 - 050303 ed050201
B521-14 December, 2006 Emission Inventory Guidebook
Table 8.14: Average Fugitive Emission Factors for VOC from Onshore Gas Terminal
and Oil Processing Facilities (UKOOA, 1993)
Gas Terminal VOC Quality
Component Average count kg/a/component
Connections 5546 18 C
Valves 1521 200 C
Pressure relief devices 39 120 C
Rotating shafts 41 530 C
Other 229 79 C
No data is currently available on emission factors for the H2S scrubbing system, only for the
flaring which often occurs after the scrubber, see SNAP 090206, and 040103.
8.1.5 Oil loading and transport
See also SNAP 050401 to 050404 for additional information on oil loading and transport.
SNAP 040104 for loading of storage tanks and trucks
The following emission factors for fugitive emissions are percent by weight of the liquid
loaded
Table 8.15: Fugitive Emission Factors for Oil Loading (%wt loaded) (OLF, 1993;
UKOOA, 1995; Rypal K., 1997)
Ships Rail cars / Tank trucks
NMVOC Methane NMVOC Methane Quality
Norway: Off Shore 0.1 - 0.3 % 5 - 15 % C
Norway: On Shore 0.02 - 0.06 % 5 - 15 % C
UK 0.001 % 0.000018 % 0.00033 % 0.000058 % C
The methane content of the vapour will depend mainly on the composition of gas. The
evaporation rate will depend on the factors listed in section 3.1.5.
An evaporation rate of 0.01%, of which methane is 15% has been suggested for UK (E+P,
1994) in another publication.
An evaporation rate of 0.2-0.6 % has been derived for Russia (SRI, 1994).
The US has developed average emission factors from its detailed methodology for the
loading, ballasting, and transportation of crude oil by rail tank car and tank trucks.(US EPA,
1996) As a last resort these could be applied to marine transportation of oil on ships or
barges, but, every attempt should be made to utilise as much of the detailed methodology as
possible.
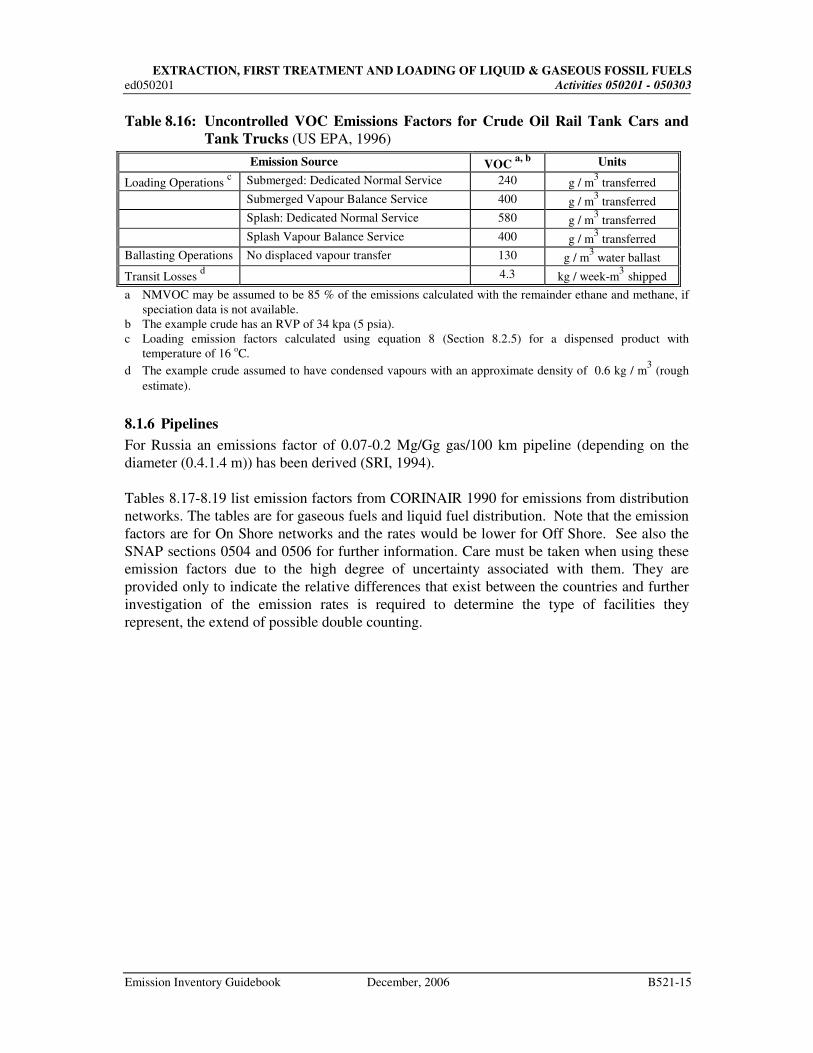
EXTRACTION, FIRST TREATMENT AND LOADING OF LIQUID & GASEOUS FOSSIL FUELS
ed050201 Activities 050201 - 050303
Emission Inventory Guidebook December, 2006 B521-15
Table 8.16: Uncontrolled VOC Emissions Factors for Crude Oil Rail Tank Cars and
Tank Trucks (US EPA, 1996)
Emission Source VOC a, b
Units
Loading Operations c Submerged: Dedicated Normal Service 240 g / m
3 transferred
Submerged Vapour Balance Service 400 g / m3 transferred
Splash: Dedicated Normal Service 580 g / m3 transferred
Splash Vapour Balance Service 400 g / m3 transferred
Ballasting Operations No displaced vapour transfer 130 g / m3 water ballast
Transit Losses d 4.3 kg / week-m
3 shipped
a NMVOC may be assumed to be 85 % of the emissions calculated with the remainder ethane and methane, if
speciation data is not available. b The example crude has an RVP of 34 kpa (5 psia). c Loading emission factors calculated using equation 8 (Section 8.2.5) for a dispensed product with
temperature of 16 oC.
d The example crude assumed to have condensed vapours with an approximate density of 0.6 kg / m3 (rough
estimate).
8.1.6 Pipelines
For Russia an emissions factor of 0.07-0.2 Mg/Gg gas/100 km pipeline (depending on the
diameter (0.4.1.4 m)) has been derived (SRI, 1994).
Tables 8.17-8.19 list emission factors from CORINAIR 1990 for emissions from distribution
networks. The tables are for gaseous fuels and liquid fuel distribution. Note that the emission
factors are for On Shore networks and the rates would be lower for Off Shore. See also the
SNAP sections 0504 and 0506 for further information. Care must be taken when using these
emission factors due to the high degree of uncertainty associated with them. They are
provided only to indicate the relative differences that exist between the countries and further
investigation of the emission rates is required to determine the type of facilities they
represent, the extend of possible double counting.
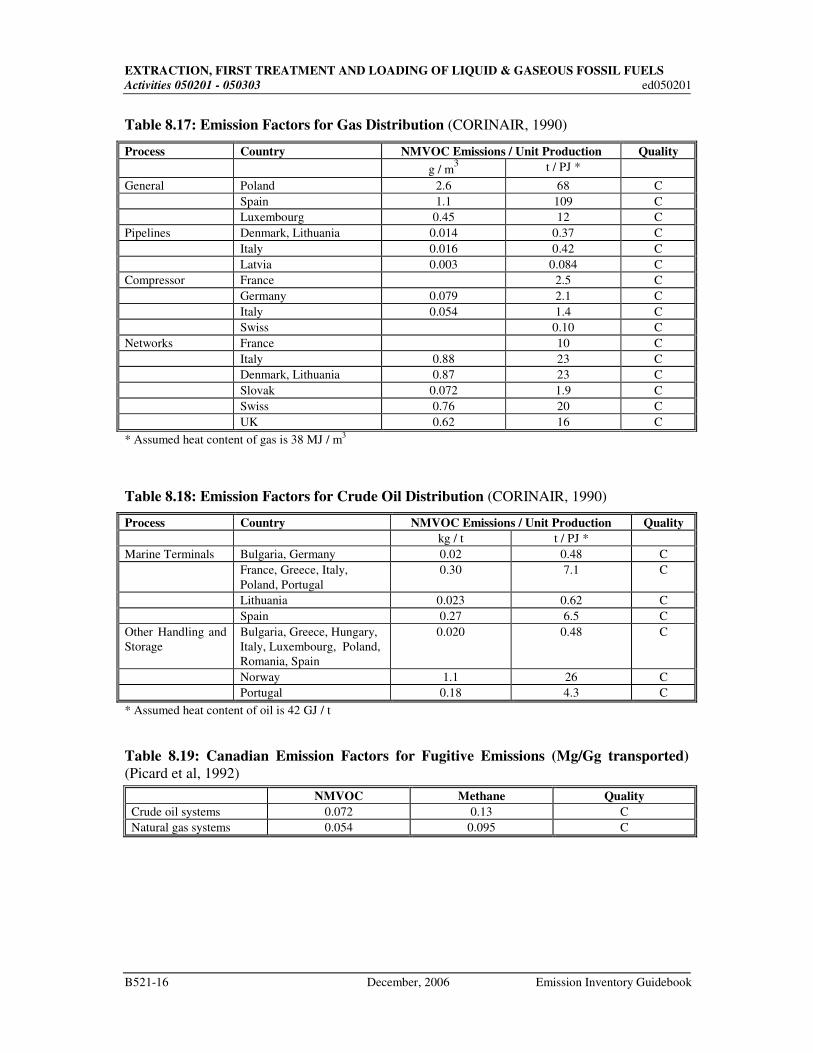
EXTRACTION, FIRST TREATMENT AND LOADING OF LIQUID & GASEOUS FOSSIL FUELS
Activities 050201 - 050303 ed050201
B521-16 December, 2006 Emission Inventory Guidebook
Table 8.17: Emission Factors for Gas Distribution (CORINAIR, 1990)
Process Country NMVOC Emissions / Unit Production Quality
g / m3 t / PJ *
General Poland 2.6 68 C
Spain 1.1 109 C
Luxembourg 0.45 12 C
Pipelines Denmark, Lithuania 0.014 0.37 C
Italy 0.016 0.42 C
Latvia 0.003 0.084 C
Compressor France 2.5 C
Germany 0.079 2.1 C
Italy 0.054 1.4 C
Swiss 0.10 C
Networks France 10 C
Italy 0.88 23 C
Denmark, Lithuania 0.87 23 C
Slovak 0.072 1.9 C
Swiss 0.76 20 C
UK 0.62 16 C
* Assumed heat content of gas is 38 MJ / m3
Table 8.18: Emission Factors for Crude Oil Distribution (CORINAIR, 1990)
Process Country NMVOC Emissions / Unit Production Quality
kg / t t / PJ *
Marine Terminals Bulgaria, Germany 0.02 0.48 C
France, Greece, Italy,
Poland, Portugal
0.30 7.1 C
Lithuania 0.023 0.62 C
Spain 0.27 6.5 C
Other Handling and
Storage
Bulgaria, Greece, Hungary,
Italy, Luxembourg, Poland,
Romania, Spain
0.020 0.48 C
Norway 1.1 26 C
Portugal 0.18 4.3 C
* Assumed heat content of oil is 42 GJ / t
Table 8.19: Canadian Emission Factors for Fugitive Emissions (Mg/Gg transported)
(Picard et al, 1992)
NMVOC Methane Quality
Crude oil systems 0.072 0.13 C
Natural gas systems 0.054 0.095 C
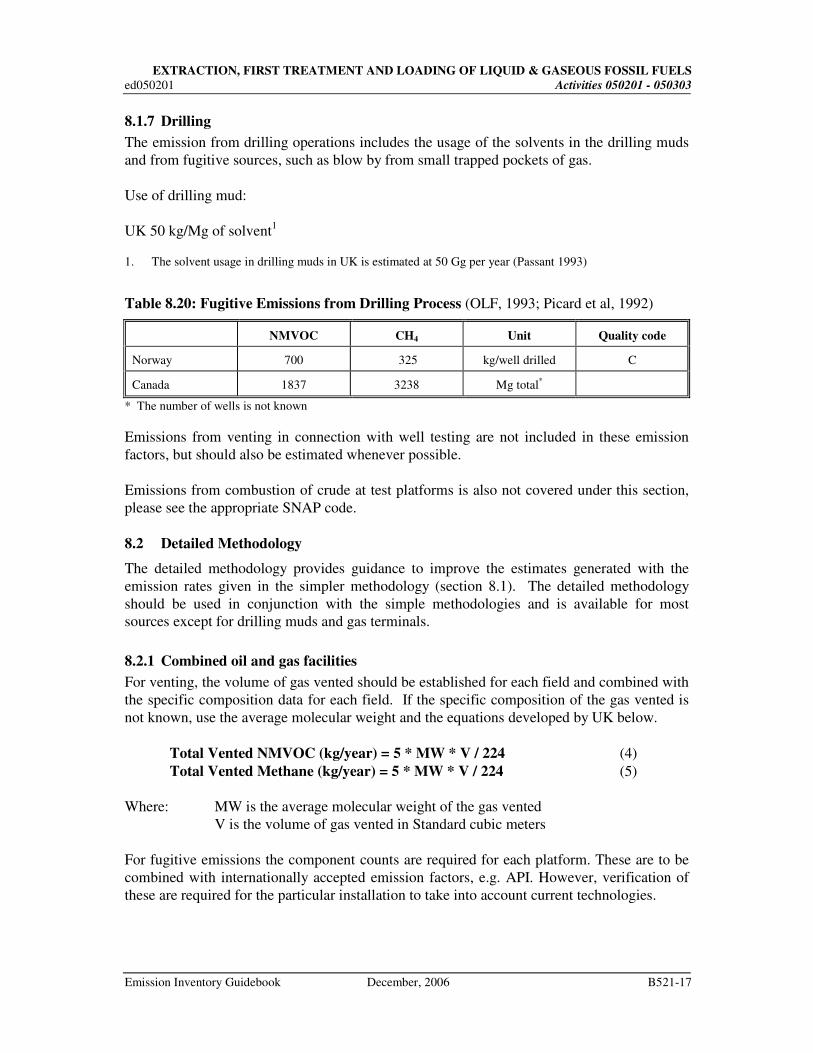
EXTRACTION, FIRST TREATMENT AND LOADING OF LIQUID & GASEOUS FOSSIL FUELS
ed050201 Activities 050201 - 050303
Emission Inventory Guidebook December, 2006 B521-17
8.1.7 Drilling
The emission from drilling operations includes the usage of the solvents in the drilling muds
and from fugitive sources, such as blow by from small trapped pockets of gas.
Use of drilling mud:
UK 50 kg/Mg of solvent1
1. The solvent usage in drilling muds in UK is estimated at 50 Gg per year (Passant 1993)
Table 8.20: Fugitive Emissions from Drilling Process (OLF, 1993; Picard et al, 1992)
NMVOC CH4 Unit Quality code
Norway 700 325 kg/well drilled C
Canada 1837 3238 Mg total*
* The number of wells is not known
Emissions from venting in connection with well testing are not included in these emission
factors, but should also be estimated whenever possible.
Emissions from combustion of crude at test platforms is also not covered under this section,
please see the appropriate SNAP code.
8.2 Detailed Methodology
The detailed methodology provides guidance to improve the estimates generated with the
emission rates given in the simpler methodology (section 8.1). The detailed methodology
should be used in conjunction with the simple methodologies and is available for most
sources except for drilling muds and gas terminals.
8.2.1 Combined oil and gas facilities
For venting, the volume of gas vented should be established for each field and combined with
the specific composition data for each field. If the specific composition of the gas vented is
not known, use the average molecular weight and the equations developed by UK below.
Total Vented NMVOC (kg/year) = 5 * MW * V / 224 (4)
Total Vented Methane (kg/year) = 5 * MW * V / 224 (5)
Where: MW is the average molecular weight of the gas vented
V is the volume of gas vented in Standard cubic meters
For fugitive emissions the component counts are required for each platform. These are to be
combined with internationally accepted emission factors, e.g. API. However, verification of
these are required for the particular installation to take into account current technologies.

EXTRACTION, FIRST TREATMENT AND LOADING OF LIQUID & GASEOUS FOSSIL FUELS
Activities 050201 - 050303 ed050201
B521-18 December, 2006 Emission Inventory Guidebook
The following emission factors have been suggested by the UK for average fugitive emissions
of total hydrocarbons for facilities with state of the art leak detection and control
programmes. The emission factors are kilograms of emissions per component per year with
VOC and Methane factors derived from gas composition data.
Table 8.21: Average Fugitive Emissions of Total Hydrocarbons for Facilities With State
of The Art Leak Detection and Control Programmes (UKOOA, 1995)
Connection Valves Open-Ended Lines Others
kg/a/component
Offshore oil and gas 0.099 3.5 1.6 17
Fugitive emissions may also be estimated by tracer measurements techniques.
The estimation of emissions from water treatment will require an exact knowledge of the
volume of water treated, treatment method, the oil content of the discharged water, and the
actual mass of water emitted to the atmosphere.
8.2.2 Facilities producing gas only
See section 8.1.2 except for gas venting if the specific composition of the gas is not known.
The following has been developed by the UK for facilities producing gas, venting gas:
Total Vented NMVOC (kg/year) = 9 * MW * V / 224 (6)
Total Vented Methane (kg/year) = 1 * MW * V / 224 (7)
Where: MW is the average molecular weight of the gas vented
V is the volume of gas vented in Standard cubic meters
The following emission factors have been suggested by the UK for average fugitive emissions
of total hydrocarbons. The emission factors are in kilograms of emissions per component per
year with VOC and Methane factors derived from gas composition data.
Table 8.22: Facilities With State-Of-The-Art Leak Detection and Control [11]
Connection Valves Open-Ended Lines Others
kg/a/component
Offshore gas 0.63 18 1.8 48
Table 8.23: Offshore Facilities With Conventional Leak Detection and Control
(UKOOA, 1995)
Connection Valves Pressure relief
devices
Rotating
shafts
Others Quality
kg/a/component
Gas production 11 29 24 200 65 C

EXTRACTION, FIRST TREATMENT AND LOADING OF LIQUID & GASEOUS FOSSIL FUELS
ed050201 Activities 050201 - 050303
Emission Inventory Guidebook December, 2006 B521-19
For the facilities with conventional leak detection use may be made of the following table of
component counts in hydrocarbon service on the generic platforms, estimated from CAD
designs by the UK
Table 8.24: Generic Platform Component Counts for Conventional Leak Control
(UKOOA, 1995)
Facility type A B C D E Quality
Connections 1114 2363 2792 3483 8289 C
Valves 514 1348 1036 1572 3002 C
Pressure relief devices 3 32 27 43 65 C
Other 110 357 311 270 557 C
Notes: Generic A Well head gas platform 150 MMSCFD
Generic B Gas treatment/compression platform 330 MMSCFD
Generic C Small simple oil platform 40000 BPD & 10 MMSCFD
Generic D Medium complexity oil platform 75000 BPD & 16 MMSCFD
Generic E Large oil/ condensate platform 80000BPD & 540 MMSCFD
8.2.3 Facilities producing oil only
See section 8.1.3 also for additional information
The following emission factors have been suggested by the UK for average fugitive emissions
of total hydrocarbons. The emission factors are in kilograms of emissions per component per
year with VOC and Methane factors derived from gas composition data.
Table 8.25: Facilities With State-of-The-Art Leak Detection and Control [11]
Connection Valves Open-Ended Others Quality
kg/a/component
Offshore light crude 0.68 3.3 5.8 16 C
Offshore heavy crude 0.017 0.033 0.17 0.17 C
Table 8.26: Offshore Facilities With Conventional Leak Detection and Control [11]
Connection Valves Pressure relief
devices
Rotating
shafts
Others Quality
kg/a/component
Oil Production 7.1 36 1.5 130 14 C
Component counts from table 8.24 section 8.2.2 maybe used as estimates with the
conventional leak detection and control emission factors
8.2.4 Gas terminals
Emissions from individual gas terminals should be determined separately through
measurements, if possible, and engineering calculations as described in sections 8.2.1.

EXTRACTION, FIRST TREATMENT AND LOADING OF LIQUID & GASEOUS FOSSIL FUELS
Activities 050201 - 050303 ed050201
B521-20 December, 2006 Emission Inventory Guidebook
8.2.5 Oil loading and transport
Individual emission factors should be developed to reflect the variations mentioned in section
3.4.
It may be noted that Norwegian studies (OLF, 1993) have concluded the following:
An amplitude of +2 degrees of the vessel while loading increases the mass of released
gas by 50 % compared to calm conditions.
An increase in the loading rate of 40 % decreases the mass of released gas by 14%.
An increase in the temperature to 30 C to 34 C increases the mass of released gas by
10 %.
The US - EPA has developed an equation for the emissions from loading petroleum liquid
into different transportation vessels (US EPA, 1996). For further information it is
recommended to see the US-EPA AP-42 Sections 5.2 Transportation and marketing of
petroleum Liquids, and 7.1 Organic Liquid Storage Tanks which contain further explanations
as well as look-up tables for hydrocarbons. The Internet World Wide Web Site for the US-
EPA emission factor information is http://www.epa.gov/ttn/chief/
LL = 0.82947 * S * P * M (8)
T Note: The constant has been converted for metric use
Where LL is the emission factor in kg / m3 ( ± 30 %).
S is the Saturation Factor from table 8.29 below.
P is the true vapour pressure of the liquid loaded in pounds per square inch (1 psi =
6.89476 Pascal).
M is the molecular weight of the vapours (kg/kg-mole)
T is the temperature in Kelvin (oC + 273)
P & M can be calculated using weighted averages of the molar ratios of the constituent
components of the liquid loaded.
Table 8.27: Saturation Factors for Calculating Petroleum Liquid Loading Losses (US
EPA, 1996)
Cargo Carrier Mode of Operation S Factor
Tank trucks and rail tank cars Submerged loading: of a clean cargo tank 0.50
Submerged loading: dedicated normal service 0.60
Submerged loading: dedicated vapour balance service 1.0
Splash loading: of a clean cargo tank 1.45
Splash loading: dedicated normal service 1.45
Splash loading: dedicated vapour balance service 1.00
Marine vessels * Submerged loading: ships 0.2
Submerged loading: barges 0.5
* For products other than crude oil. For marine loading of crude oil use equations 10 & 11 and table 8.30
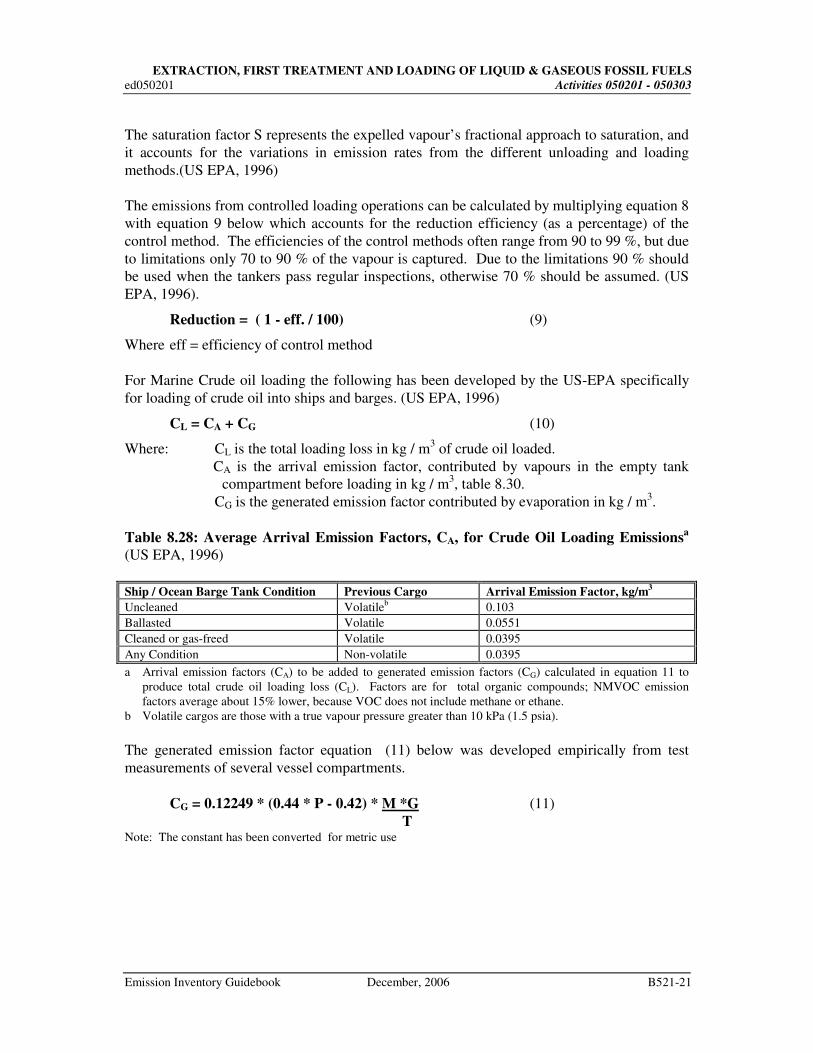
EXTRACTION, FIRST TREATMENT AND LOADING OF LIQUID & GASEOUS FOSSIL FUELS
ed050201 Activities 050201 - 050303
Emission Inventory Guidebook December, 2006 B521-21
The saturation factor S represents the expelled vapour’s fractional approach to saturation, and
it accounts for the variations in emission rates from the different unloading and loading
methods.(US EPA, 1996)
The emissions from controlled loading operations can be calculated by multiplying equation 8
with equation 9 below which accounts for the reduction efficiency (as a percentage) of the
control method. The efficiencies of the control methods often range from 90 to 99 %, but due
to limitations only 70 to 90 % of the vapour is captured. Due to the limitations 90 % should
be used when the tankers pass regular inspections, otherwise 70 % should be assumed. (US
EPA, 1996).
Reduction = ( 1 - eff. / 100) (9)
Where eff = efficiency of control method
For Marine Crude oil loading the following has been developed by the US-EPA specifically
for loading of crude oil into ships and barges. (US EPA, 1996)
CL = CA + CG (10)
Where: CL is the total loading loss in kg / m3 of crude oil loaded.
CA is the arrival emission factor, contributed by vapours in the empty tank
compartment before loading in kg / m3, table 8.30.
CG is the generated emission factor contributed by evaporation in kg / m3.
Table 8.28: Average Arrival Emission Factors, CA, for Crude Oil Loading Emissionsa
(US EPA, 1996)
Ship / Ocean Barge Tank Condition Previous Cargo Arrival Emission Factor, kg/m3
Uncleaned Volatileb 0.103
Ballasted Volatile 0.0551
Cleaned or gas-freed Volatile 0.0395
Any Condition Non-volatile 0.0395
a Arrival emission factors (CA) to be added to generated emission factors (CG) calculated in equation 11 to
produce total crude oil loading loss (CL). Factors are for total organic compounds; NMVOC emission
factors average about 15% lower, because VOC does not include methane or ethane. b Volatile cargos are those with a true vapour pressure greater than 10 kPa (1.5 psia).
The generated emission factor equation (11) below was developed empirically from test
measurements of several vessel compartments.
CG = 0.12249 * (0.44 * P - 0.42) * M *G (11)
T Note: The constant has been converted for metric use

EXTRACTION, FIRST TREATMENT AND LOADING OF LIQUID & GASEOUS FOSSIL FUELS
Activities 050201 - 050303 ed050201
B521-22 December, 2006 Emission Inventory Guidebook
Where P is the true vapour pressure of loaded crude oil in psia (pounds per square
inch absolute)
M is the molecular weight of the vapours
G is the vapour growth factor = 1.02 (dimensionless)
T is the temperature of the vapours in Kelvin (oC + 273)
Emission factors (CG) derived from equation 11 is for total organic compounds. NMVOC has
been found to be 55 to 100 weight percent of the vapours from crude oil in the US. If specific
vapour composition is unavailable 85 % of the emission factor may be used for NMVOC.
(US EPA, 1996)
Ballasting losses may be estimated from the following equation from the US-EPA. (US EPA,
1996)
LB = 0.0371 + 0.0240 * P + 0.00120 * P * UA (12) Note: The constant has been converted for metric use
Where LB is the ballasting emission factor kg / m3 of ballast water
P is the true vapour pressure of discharged oil in psia.
UA is the arrival cargo true ullage, before dockside discharge, measured from
the deck in feet, (ullage here refers to the distance between the cargo surface
and the deck level, 1 foot = 0.3048 m).
Average VOC emission factors are give in Table 8.29 below for ballasting into uncleaned
crude oil compartments. The fully loaded category applies when the crude oil true ullage just
before unloading is less than 1.5 metres. The lightered or previously short loaded category
applies to compartments with an arrival ullage of greater than 1.5 metres. These values
should only be used when the information for equation 12 is unknown.
Table 8.29: Total Organic Emission Factors for Crude Oil Ballasting. (US EPA, 1996)
Average Emission Factors
Compartment Condition By Category Typical Overall b
Before Cargo Discharge g/m3 Ballast Water
Fully Loaded c 111
129
Lightered or Previously Short Loaded d 171
a Assumes crude oil temperature is 16 oC and RVP of 34 kPa (5 psia). NMVOC emission factors average
about 85% of emission factors listed as NMVOC does not include methane or ethane.
b Based on observation that 70% of tested compartments had been fully loaded before ballasting. May not be
represent average vessel practices.
c Assumed typical arrival ullage of 0.6 m.
d Assumed typical arrival ullage of 6.1 m.
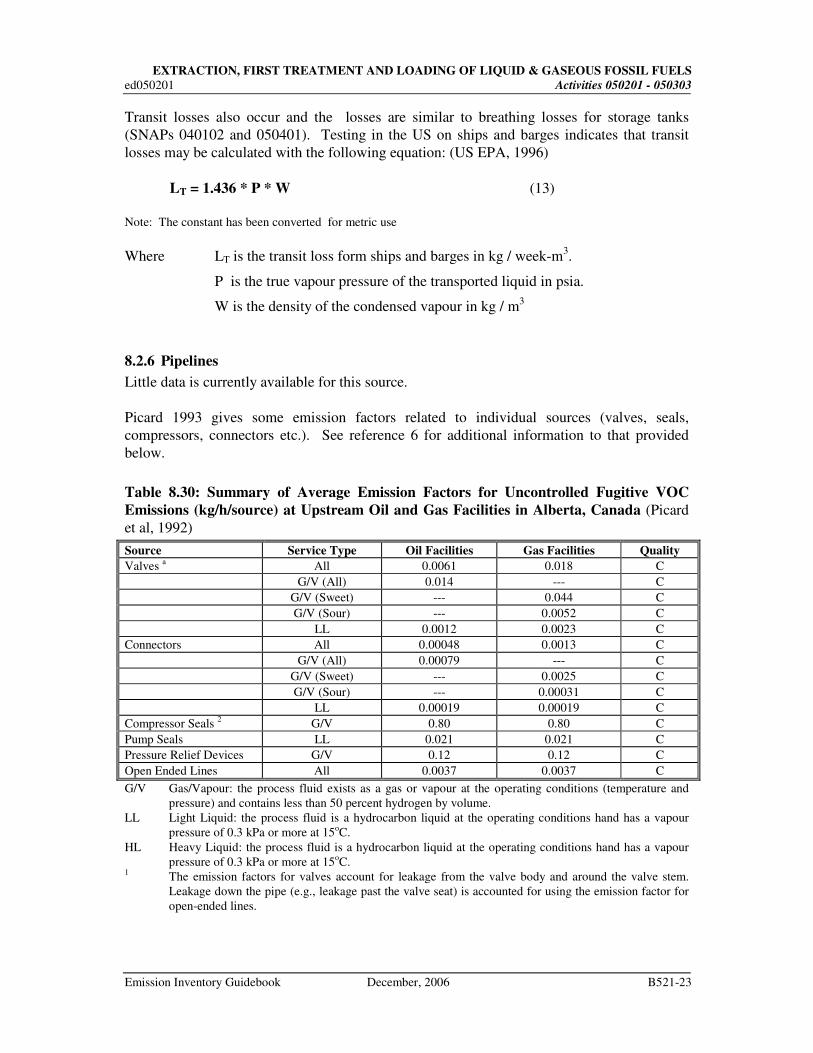
EXTRACTION, FIRST TREATMENT AND LOADING OF LIQUID & GASEOUS FOSSIL FUELS
ed050201 Activities 050201 - 050303
Emission Inventory Guidebook December, 2006 B521-23
Transit losses also occur and the losses are similar to breathing losses for storage tanks
(SNAPs 040102 and 050401). Testing in the US on ships and barges indicates that transit
losses may be calculated with the following equation: (US EPA, 1996)
LT = 1.436 * P * W (13)
Note: The constant has been converted for metric use
Where LT is the transit loss form ships and barges in kg / week-m3.
P is the true vapour pressure of the transported liquid in psia.
W is the density of the condensed vapour in kg / m3
8.2.6 Pipelines
Little data is currently available for this source.
Picard 1993 gives some emission factors related to individual sources (valves, seals,
compressors, connectors etc.). See reference 6 for additional information to that provided
below.
Table 8.30: Summary of Average Emission Factors for Uncontrolled Fugitive VOC
Emissions (kg/h/source) at Upstream Oil and Gas Facilities in Alberta, Canada (Picard
et al, 1992)
Source Service Type Oil Facilities Gas Facilities Quality
Valves a All 0.0061 0.018 C
G/V (All) 0.014 --- C
G/V (Sweet) --- 0.044 C
G/V (Sour) --- 0.0052 C
LL 0.0012 0.0023 C
Connectors All 0.00048 0.0013 C
G/V (All) 0.00079 --- C
G/V (Sweet) --- 0.0025 C
G/V (Sour) --- 0.00031 C
LL 0.00019 0.00019 C
Compressor Seals 2 G/V 0.80 0.80 C
Pump Seals LL 0.021 0.021 C
Pressure Relief Devices G/V 0.12 0.12 C
Open Ended Lines All 0.0037 0.0037 C
G/V Gas/Vapour: the process fluid exists as a gas or vapour at the operating conditions (temperature and
pressure) and contains less than 50 percent hydrogen by volume.
LL Light Liquid: the process fluid is a hydrocarbon liquid at the operating conditions hand has a vapour
pressure of 0.3 kPa or more at 15oC.
HL Heavy Liquid: the process fluid is a hydrocarbon liquid at the operating conditions hand has a vapour
pressure of 0.3 kPa or more at 15oC.
1 The emission factors for valves account for leakage from the valve body and around the valve stem.
Leakage down the pipe (e.g., leakage past the valve seat) is accounted for using the emission factor for
open-ended lines.
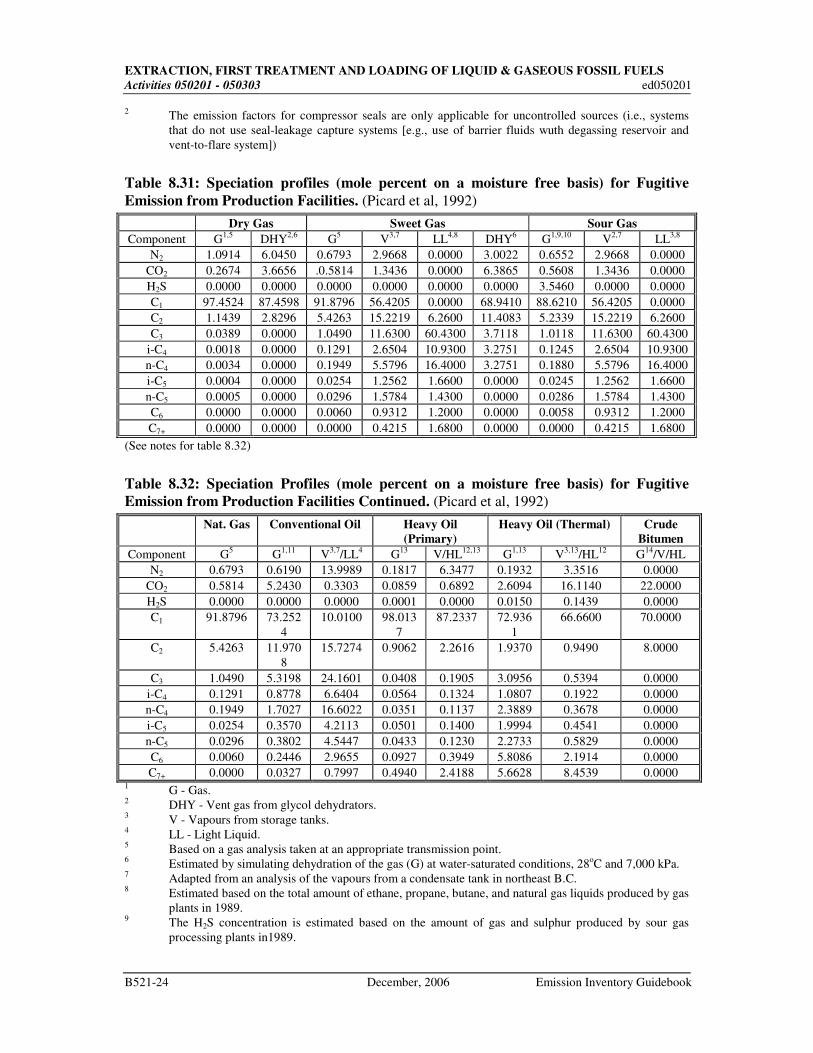
EXTRACTION, FIRST TREATMENT AND LOADING OF LIQUID & GASEOUS FOSSIL FUELS
Activities 050201 - 050303 ed050201
B521-24 December, 2006 Emission Inventory Guidebook
2 The emission factors for compressor seals are only applicable for uncontrolled sources (i.e., systems
that do not use seal-leakage capture systems [e.g., use of barrier fluids wuth degassing reservoir and
vent-to-flare system])
Table 8.31: Speciation profiles (mole percent on a moisture free basis) for Fugitive
Emission from Production Facilities. (Picard et al, 1992)
Dry Gas Sweet Gas Sour Gas
Component G1,5
DHY2,6
G5 V
3,7 LL
4,8 DHY
6 G
1,9,10 V
2,7 LL
3,8
N2 1.0914 6.0450 0.6793 2.9668 0.0000 3.0022 0.6552 2.9668 0.0000
CO2 0.2674 3.6656 .0.5814 1.3436 0.0000 6.3865 0.5608 1.3436 0.0000
H2S 0.0000 0.0000 0.0000 0.0000 0.0000 0.0000 3.5460 0.0000 0.0000
C1 97.4524 87.4598 91.8796 56.4205 0.0000 68.9410 88.6210 56.4205 0.0000
C2 1.1439 2.8296 5.4263 15.2219 6.2600 11.4083 5.2339 15.2219 6.2600
C3 0.0389 0.0000 1.0490 11.6300 60.4300 3.7118 1.0118 11.6300 60.4300
i-C4 0.0018 0.0000 0.1291 2.6504 10.9300 3.2751 0.1245 2.6504 10.9300
n-C4 0.0034 0.0000 0.1949 5.5796 16.4000 3.2751 0.1880 5.5796 16.4000
i-C5 0.0004 0.0000 0.0254 1.2562 1.6600 0.0000 0.0245 1.2562 1.6600
n-C5 0.0005 0.0000 0.0296 1.5784 1.4300 0.0000 0.0286 1.5784 1.4300
C6 0.0000 0.0000 0.0060 0.9312 1.2000 0.0000 0.0058 0.9312 1.2000
C7+ 0.0000 0.0000 0.0000 0.4215 1.6800 0.0000 0.0000 0.4215 1.6800
(See notes for table 8.32)
Table 8.32: Speciation Profiles (mole percent on a moisture free basis) for Fugitive
Emission from Production Facilities Continued. (Picard et al, 1992)
Nat. Gas Conventional Oil Heavy Oil
(Primary)
Heavy Oil (Thermal) Crude
Bitumen
Component G5 G
1,11 V
3,7/LL
4 G
13 V/HL
12,13 G
1,13 V
3,13/HL
12 G
14/V/HL
N2 0.6793 0.6190 13.9989 0.1817 6.3477 0.1932 3.3516 0.0000
CO2 0.5814 5.2430 0.3303 0.0859 0.6892 2.6094 16.1140 22.0000
H2S 0.0000 0.0000 0.0000 0.0001 0.0000 0.0150 0.1439 0.0000
C1 91.8796 73.252
4
10.0100 98.013
7
87.2337 72.936
1
66.6600 70.0000
C2 5.4263 11.970
8
15.7274 0.9062 2.2616 1.9370 0.9490 8.0000
C3 1.0490 5.3198 24.1601 0.0408 0.1905 3.0956 0.5394 0.0000
i-C4 0.1291 0.8778 6.6404 0.0564 0.1324 1.0807 0.1922 0.0000
n-C4 0.1949 1.7027 16.6022 0.0351 0.1137 2.3889 0.3678 0.0000
i-C5 0.0254 0.3570 4.2113 0.0501 0.1400 1.9994 0.4541 0.0000
n-C5 0.0296 0.3802 4.5447 0.0433 0.1230 2.2733 0.5829 0.0000
C6 0.0060 0.2446 2.9655 0.0927 0.3949 5.8086 2.1914 0.0000
C7+ 0.0000 0.0327 0.7997 0.4940 2.4188 5.6628 8.4539 0.0000 1 G - Gas. 2 DHY - Vent gas from glycol dehydrators. 3 V - Vapours from storage tanks.
4 LL - Light Liquid.
5 Based on a gas analysis taken at an appropriate transmission point.
6 Estimated by simulating dehydration of the gas (G) at water-saturated conditions, 28
oC and 7,000 kPa.
7 Adapted from an analysis of the vapours from a condensate tank in northeast B.C.
8 Estimated based on the total amount of ethane, propane, butane, and natural gas liquids produced by gas
plants in 1989. 9 The H2S concentration is estimated based on the amount of gas and sulphur produced by sour gas
processing plants in1989.

EXTRACTION, FIRST TREATMENT AND LOADING OF LIQUID & GASEOUS FOSSIL FUELS
ed050201 Activities 050201 - 050303
Emission Inventory Guidebook December, 2006 B521-25
10 The H2S-free composition is based on an analysis taken at an appropriate transmission point.
11 Based on an analysis of the gas from a large solution-gas gathering system in central Alberta. 12 HL - Heavy Liquid. 13
Adapted from results presented by Ullman et al. (1987) 14
Provided by an operator of a major crude bitumen facility
8.2.7 Drilling
Specific emission factors for representative drilling wells should be developed taking into
account the sources listed in section 3.4.7 and other possible sources.
9 SPECIES PROFILES
Speciation profiles for Crude Oil Production (US EPA, 1988) and natural gas venting (TNO)
are listed in the profiles below. See also tables 8.33 and 8.34 given in section 8.2.6.
Table 9.1: Speciation Profiles
Species wt%
USEPA TNO
Ethane 6 72
Propane 19 14
Butanes 30 7
Pentanes 17 2
Hexanes 8 4
Heptanes 10 0
Octanes 7 0
Cycloparaffins 2 0
Benzene 0 0
The composition of the NMVOC fraction of emissions from oil and gas production can be
expected to vary considerably between fields and between different emissions sources.
Therefore, the above generalised species profiles should only be used if better information is
not available.
10 UNCERTAINTY ESTIMATES
The quality of the emission rates provided in section 8 provides some indication of the
uncertainty of the estimates that can be generated. Additional uncertainty guidance by
activity is provided below.
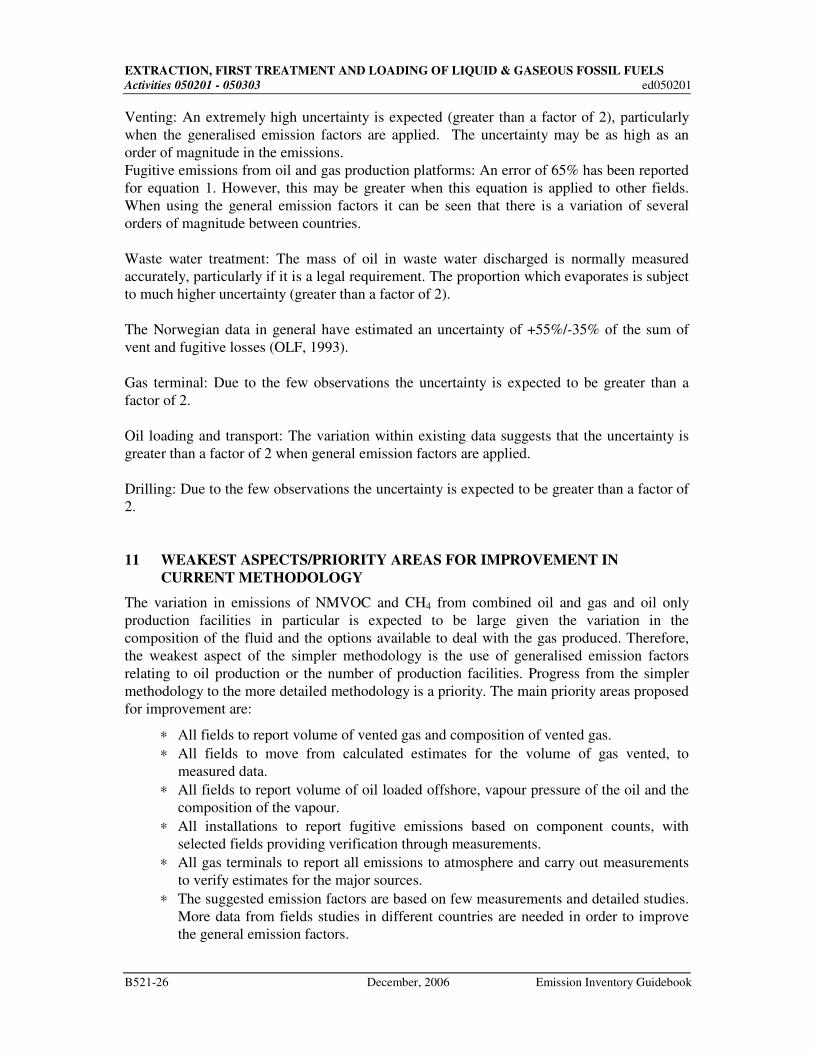
EXTRACTION, FIRST TREATMENT AND LOADING OF LIQUID & GASEOUS FOSSIL FUELS
Activities 050201 - 050303 ed050201
B521-26 December, 2006 Emission Inventory Guidebook
Venting: An extremely high uncertainty is expected (greater than a factor of 2), particularly
when the generalised emission factors are applied. The uncertainty may be as high as an
order of magnitude in the emissions.
Fugitive emissions from oil and gas production platforms: An error of 65% has been reported
for equation 1. However, this may be greater when this equation is applied to other fields.
When using the general emission factors it can be seen that there is a variation of several
orders of magnitude between countries.
Waste water treatment: The mass of oil in waste water discharged is normally measured
accurately, particularly if it is a legal requirement. The proportion which evaporates is subject
to much higher uncertainty (greater than a factor of 2).
The Norwegian data in general have estimated an uncertainty of +55%/-35% of the sum of
vent and fugitive losses (OLF, 1993).
Gas terminal: Due to the few observations the uncertainty is expected to be greater than a
factor of 2.
Oil loading and transport: The variation within existing data suggests that the uncertainty is
greater than a factor of 2 when general emission factors are applied.
Drilling: Due to the few observations the uncertainty is expected to be greater than a factor of
2.
11 WEAKEST ASPECTS/PRIORITY AREAS FOR IMPROVEMENT IN
CURRENT METHODOLOGY
The variation in emissions of NMVOC and CH4 from combined oil and gas and oil only
production facilities in particular is expected to be large given the variation in the
composition of the fluid and the options available to deal with the gas produced. Therefore,
the weakest aspect of the simpler methodology is the use of generalised emission factors
relating to oil production or the number of production facilities. Progress from the simpler
methodology to the more detailed methodology is a priority. The main priority areas proposed
for improvement are:
∗ All fields to report volume of vented gas and composition of vented gas.
∗ All fields to move from calculated estimates for the volume of gas vented, to
measured data.
∗ All fields to report volume of oil loaded offshore, vapour pressure of the oil and the
composition of the vapour.
∗ All installations to report fugitive emissions based on component counts, with
selected fields providing verification through measurements.
∗ All gas terminals to report all emissions to atmosphere and carry out measurements
to verify estimates for the major sources.
∗ The suggested emission factors are based on few measurements and detailed studies.
More data from fields studies in different countries are needed in order to improve
the general emission factors.
EXTRACTION, FIRST TREATMENT AND LOADING OF LIQUID & GASEOUS FOSSIL FUELS
ed050201 Activities 050201 - 050303
Emission Inventory Guidebook December, 2006 B521-27
12 SPATIAL DISAGGREGATION CRITERIA FOR AREA SOURCES
Currently “sea” is the only relevant NUTS code for offshore activities. If a higher spatial
resolution is required or emissions are generated on-shore, production by field will be
available in most countries.
Oil loading and gas terminal: These sources will generally be few, and the relevant activity
statistics may easily be allocated to the correct territorial unit.
For pipelines, emissions may be assumed equally distributed along the pipe, if better
information is unavailable.
13 TEMPORAL DISAGGREGATION CRITERIA
Monthly production data is available in major oil and gas exporting countries. If this
information is not available, emissions may be assumed equally temporally distributed. Equal
diurnal (night/day) may generally be assumed.
Oil loading can be expected to occur during the day only.
14 ADDITIONAL COMMENTS
There are a number of developments in emission estimate methodologies in this area e.g.
IPCC, OLF (Norway) and OOA (UK).
This draft will have to be revised in the coming years in light of these developments.
Responsibility for emissions originating from fields shared between two countries: emissions
are allocated from the economic shares of the countries in the current field.
15 SUPPLEMENTARY DOCUMENTS
Amstel, A.R. (ed.), Methane and Nitrous oxide. Methods in national emission inventories and
options for control. Proceedings. RIVM 1993.
CASPER
IPCC and OECD, Greenhouse Gas Inventory Reference Manual.IPCC Draft Guidelines for
National Greenhouse Gas Inventories. First Draft. 1994.
International Energy Agency, Energy Statistics and Balances, OECD Publications, Paris,
1995
Storemark, G., S. Lange, S. Knutsen and R.R. Christensen, Direct hydrocarbon emissions
from Production and Riserplatforms, OLF Environmental Program Project C05, 1993.
EXTRACTION, FIRST TREATMENT AND LOADING OF LIQUID & GASEOUS FOSSIL FUELS
Activities 050201 - 050303 ed050201
B521-28 December, 2006 Emission Inventory Guidebook
Tobiassen, O., Reduction in Emissions from Offshore Loading, OLF Environmental Program
Project B06, 1993.
United Kingdom Offshore Operators Association Limited, Guidelines on Atmospheric
Emissions Inventory. Issue No. 1, July 1995.
United States Environmental Protection Agency (US EPA), AP-42, 5th
Edition, Compilation
of Air Pollutant Emission Factors, Volume 1, Office of Air Quality Planning and Standards,
Research Triangle Park, NC, January 1995.
16 VERIFICATION PROCEDURES
Covered in Section 11.
17 REFERENCES
1. Brown and Root, Environmental atmospheric emissions from UK oil and gas
exploration and Production facilities in the continental shelf area. United Kingdom
Offshore Association Limited. 1993
2. Countess, R.J. and Browne, D., Fugitive Hydrocarbon Emissions from Pacific Offshore
Oil Platforms: Models, Emission Factors and Platform Emissions, J. of Air and Waste
Management Assoc., 43, pp.1455-1460. 1993.
3. E+P Forum, Methods for Estimating Atmospheric Emissions from E+P Operations,
Report No 2.59/197. September 1994.
4. The Norwegian Oil industry Association (OLF), OLF environmental program. Phase II.
Summary report. 1993.
5. The Norwegian Oil industry Association (OLF), Recommendations for reporting of
Emissions, Ref 044, OLF 1994.
6. Picard, D.J., Ross, B.D., Koon, D.W.H., A Detailed Inventory of CH4 and VOC
Emissions from Upstream Oil and Gas Operations in Alberta, Clearstone Engineering
Ltd. 1992.
7. SRI (Scientific Research Institute of Atmospheric Air Protection), Emissions of
hydrocarbons in gas industry, oil production industry, gas- and oil refining industries of
Russia. SRI Atmosphere, Report, 1994. St. Petersburg.
8. Statistics Norway. Natural Resources and the Environment. Statistical analysis no 3.
1994.
9. Passant N.R., Emissions of Volatile Organic Compounds from Stationary Sources in
the UK. Warren Spring. ISBN 0 85624 850 9. 1993.
10. United States Protection Agency, Air Emissions Species Manual. Volume One Volatile
Organic Compound Species Profiles. North Carolina: USEPA Report EPA-450/2-88-
003a, 1988.

EXTRACTION, FIRST TREATMENT AND LOADING OF LIQUID & GASEOUS FOSSIL FUELS
ed050201 Activities 050201 - 050303
Emission Inventory Guidebook December, 2006 B521-29
11. United Kingdom Offshore Operators Association Limited, Guidelines on Atmospheric
Emissions Inventory. Issue No. 1, July 1995
12. United States Environmental Protection Agency (US EPA), AP-42, 5th
Edition,
Compilation of Air Pollutant Emission Factors, Volume 1, Supplement A, Office of Air
Quality Planning and Standards, Research Triangle Park, NC, May 1996
(http://www.epa.gov/ttn/chief/)
13. T. Holtmann et al., Development of a Methodology and a Computer Model for
Forecasting Atmospheric Emissions from Relevant Mobile and Stationary Sources
Volume III: Description of Methodologies to Calculate Emissions from Individual Sub-
Sectors, Part 2, SNAP 050201, 050202, 050301, 050302, & 050303, IFARE, November
1995.
14. EDGAR v2.0(Emission Database for Global Atmospheric Research), TNO, RIVM.
15. CORINAIR 1990 Database, European Environmental Agency (EEA).
16. Rypal, Kristin. E-mail communication. Statistics Norway. Oslo, Norway. April 1997
18 BIBLIOGRAPHY
DeLuchi, Emissions from the Production, Storage and Transport of Crude oil and Gasoline, J.
of Air and Waste Management Assoc., 43, pp.1486-1495. 1993.
19 RELEASE VERSION, DATE AND SOURCE
Version: 3.1
Date: 1 February 1999
Updated by: Mr. Marc Deslauriers, Mr David R. Niemi
Environment Canada
Canada
Original author: Kristin Rypdal
Statistics Norway
Norway
Updated with particulate matter details by:
Mike Woodfield
AEA Technology
UK
December 2006

EXTRACTION, FIRST TREATMENT AND LOADING OF LIQUID & GASEOUS FOSSIL FUELS
Activities 050201 - 050303 ed050201
B521-30 December, 2006 Emission Inventory Guidebook
20 POINT OF ENQUIRY
Any comments on this chapter or enquiries should be directed to:
Marc Deslauriers
Environment Canada
Criteria Air Contaminants Division
Pollution Data Branch
351 St Joseph Boulevard, 9th Floor
Hull, Quebec, K1A 0H3
Canada
Tel: +1 819 994 3069
Fax: +1 819 953 9542
Email: [email protected]

LIQUID FUEL DISTRIBUTION (EXCEPT GASOLINES)
pr050401 Activities 050401 - 050402
Emission Inventory Guidebook December, 2006 B541-1
SNAP CODE: 050401
050402
SOURCE ACTIVITY TITLE: LIQUID FUEL DISTRIBUTION (EXCEPT GASOLINES)
Marine Terminals (Tankers, Handling and Storage)
Other Pipeline and Storage (Including Pipelines)
NOSE CODE: 106.04.01
106.04.02
NFR CODE: 1 B 2 a i
A specific methodology for these activities has not been prepared because the contribution to
total national emissions is thought to be currently insignificant, i.e. less than 1% of national
emissions of any pollutant.
The CONCAWE Air Quality Management Group (Concawe, 2006) has identified a lot of
issues with regard to the data submissions for both European Pollutant Emission Register
(EPER) mandated by European Directive 96/61/EC on integrated pollution prevention and
control (IPPC) and UNECE Kiev Protocol on Pollutant Release and Transfer Registers
(PRTR),
In particular CONCAWE initiated a review of the published emission factors for those air
pollutants which may be emitted in excess of the EPER threshold values from sources found
at the majority of European refineries. CONCAWE, therefore, has drawn up a compendium
of emission factors, with associated references, for the uncontrolled release of air pollutants
(Concawe, 2006). The compendium can not be fully comprehensive as emission factors are
not available in the public domain for all sources and/or pollutants. CONCAWE, however,
considers this to be the most appropriate set of emissions factors for the refining sector.
The CONCAWE report provides the air pollutant emission estimation algorithms,
incorporating those factors, which CONCAWE recommends for EPER and PRTR reporting
purposes. The emission factors provided are for uncontrolled releases. Reported emissions
must take account of any abatement equipment installed e.g. wet gas scrubbers, electrostatic
precipitators, etc. Where emission factors are available, algorithms are provided for sources
found in the majority of European refineries.
The Concawe report suggests the use the methodology for loading of mobile containers
described in B551 for gasoline. The same methodology can be used, with the appropriate true
vapour pressure of products, to the other liquid fuels.
(These activities are not believed to be a significant source of PM2.5 (as of December 2006)).1
1 Updated with particulate matter details by: Mike Woodfield, AEA Technology, UK, December 2006
LIQUID FUEL DISTRIBUTION (EXCEPT GASOLINES)
Activities 050401 - 050402 pr050401
B541-2 December, 2006 Emission Inventory Guidebook
REFERENCES
Concawe (2006) Air pollutant emission estimation methods for EPER and PRTR reporting by
refineries (revised), Prepared by the CONCAWE Air Quality Management Group’s Special
Task Force on Emission Reporting Methodologies (STF-64), P. Goodsell (Technical
Coordinator), Report no. 9/05R, Brussels April 2006
Any comments or enquiries should be directed to:
Carlo Trozzi
Techne Consulting
Via G. Ricci Curbastro, 34
Roma, Italy
Tel: +39 065580993
Fax: +39 065581848
Email: [email protected]
Fax: +31 70 339 1988
Email: [email protected]
Related Documents