The Magazine for ENERGY EFFICIENCY in Compressed Air Systems Snack Food & Beverage October 2016 36 NEW CSA C837-16 COMPRESSED AIR EFFICIENCY STANDARD 10 The Advantages of Onsite Nitrogen Generation for Brewers 18 Heatless Compressed Air Desiccant Dryer Calculation Principles 26 Selecting Optimum Purity Levels with Onsite Nitrogen Generators

Welcome message from author
This document is posted to help you gain knowledge. Please leave a comment to let me know what you think about it! Share it to your friends and learn new things together.
Transcript

The Magazine for ENERGY EFFICIENCY in Compressed Air Systems
Snack Food & Beverage
Octo
ber
2016
36 NEW
CSA C8
37-1
6 COMPR
ESSE
D
AIR EFFIC
IENCY
STANDARD
10 The Advantages of Onsite Nitrogen Generation for Brewers
18 Heatless Compressed Air Desiccant Dryer Calculation Principles
26 Selecting Optimum Purity Levels with Onsite Nitrogen Generators

COMPRESSED AIR WITH A VAST PORTFOLIOPowering You With Extraordinary Solutions
Whether the compressed air you need is for machining, fabrication, material handling or finishing, we can help you save money while increasing your productivity. That’s a promise.
www.atlascopco.us – 866-688-9611
Atlas Ad 8.375 x 10.875 - CABP.indd 1Atlas Ad 8.375 x 10.875 - CABP.indd 1Atlas Ad 8.375 x 10.875 - CABP.indd 1Atlas Ad 8.375 x 10.875 - CABP.indd 1Atlas Ad 8.375 x 10.875 - CABP.indd 1Atlas Ad 8.375 x 10.875 - CABP.indd 1Atlas Ad 8.375 x 10.875 - CABP.indd 1Atlas Ad 8.375 x 10.875 - CABP.indd 1Atlas Ad 8.375 x 10.875 - CABP.indd 1Atlas Ad 8.375 x 10.875 - CABP.indd 1Atlas Ad 8.375 x 10.875 - CABP.indd 1Atlas Ad 8.375 x 10.875 - CABP.indd 1Atlas Ad 8.375 x 10.875 - CABP.indd 1Atlas Ad 8.375 x 10.875 - CABP.indd 1Atlas Ad 8.375 x 10.875 - CABP.indd 1Atlas Ad 8.375 x 10.875 - CABP.indd 1Atlas Ad 8.375 x 10.875 - CABP.indd 1Atlas Ad 8.375 x 10.875 - CABP.indd 1Atlas Ad 8.375 x 10.875 - CABP.indd 1Atlas Ad 8.375 x 10.875 - CABP.indd 1Atlas Ad 8.375 x 10.875 - CABP.indd 1Atlas Ad 8.375 x 10.875 - CABP.indd 1Atlas Ad 8.375 x 10.875 - CABP.indd 1Atlas Ad 8.375 x 10.875 - CABP.indd 1Atlas Ad 8.375 x 10.875 - CABP.indd 1Atlas Ad 8.375 x 10.875 - CABP.indd 1Atlas Ad 8.375 x 10.875 - CABP.indd 1Atlas Ad 8.375 x 10.875 - CABP.indd 1Atlas Ad 8.375 x 10.875 - CABP.indd 1Atlas Ad 8.375 x 10.875 - CABP.indd 1Atlas Ad 8.375 x 10.875 - CABP.indd 1 9/1/15 11:20 AM9/1/15 11:20 AM9/1/15 11:20 AM9/1/15 11:20 AM9/1/15 11:20 AM9/1/15 11:20 AM9/1/15 11:20 AM9/1/15 11:20 AM9/1/15 11:20 AM9/1/15 11:20 AM9/1/15 11:20 AM9/1/15 11:20 AM9/1/15 11:20 AM9/1/15 11:20 AM

18
10
26
COLUMNS
4 From the Editor
6 Industry News
43 Resources for Energy Engineers Technology Picks
47 Advertiser Index
48 The Marketplace Jobs and Technology
10 The Advantages of Onsite Nitrogen Generation for Brewers By Mike Robinson, Atlas Copco Compressors
18 Heatless Compressed Air Desiccant Dryer Calculation Principles By Donald White, Aircel
26 Selecting Optimum Purity Levels with Onsite Nitrogen Generators By David Connaughton, Parker Hannifin
32 Energy Management Considerations with Today’s Drive Systems By Michael Perlman, Siemens Industry
36 New CSA C837-16 Compressed Air Efficiency Standard By Ron Marshall, Compressed Air Challenge®
SUSTAINABLE MANUFACTURING FEATURES
3 airbestpractices.com
COLUMNS O C T O B E R 2 0 1 6 | V O L U M E 1 1 , N O . 9 |
Onsite nitrogen generation continues to gather momentum. The benefits
of onsite (vs. commercially supplied nitrogen) to the environment and
to profitability are well established. Mike Robinson, from Atlas Copco
Compressors, kicks off the issue writing about brewery applications.
“Producing nitrogen onsite offers microbrewers three key benefits over
ordering bulk nitrogen: less production time is lost, no gas waste and lower costs.”
David Connaughton, from Parker’s Gas Separation and Filtration Division, provides another
article focusing on nitrogen purity specifications by application. “Although onsite nitrogen
generation can produce N2 purities of up to 99.999%, users can realize significant financial
and energy savings if they match the purity of the nitrogen to the purity required by the
application. Indeed, for many applications, a purity of 99.9% or above is not required.”
His article provides a very useful review of typical N2 purities by application.
Compressed air purity is critical to the snack food industry. Pressure dew points of -40
°F (-40 °C) are often required. Heatless desiccant compressed air dryers are often the
technology of choice to get the job done. Donald White, from Aircel, provides us with a
very interesting article which is both a history and an engineering lesson - on how and
where the calculations came from to properly design a heatless desiccant air dryer.
Our Canadian neighbors up north have come up with a new standard for compressed
air efficiency, CSA C837-16. Ron Marshall provides us with an overview of the standard
he helped create!
Thank you for investing your time and efforts into Compressed Air Best Practices®.
ROD SMITH Editor tel: 412-980-9901 [email protected]
FROM THE EDITOR Snack Food & Beverage
COMPRESSED AIR BEST PRACTICES®
EDITORIAL ADVISORY BOARD
Indus
trial
Ener
gy M
anag
ers
Doug Barndt Manager, Demand Side Energy-Sustainability Ball Corporation
Richard Feustel Senior Energy Advisor Leidos
William Jerald Energy Manager CalPortland
Jennifer MeierGlobal EH&S/ Plant Engineering Manager
Varroc Lighting Systems
Thomas Mort Senior Auditor Thomas Mort Consulting
Brad Reed Corporate Energy Team Leader Toyota
Brad Runda Global Director, Energy Koch Industries
Uli Schild Energy Engineer Darigold
Thomas Sullivan Energy Performance Manager
Michelin North America
Bryan Whitfield Paint & Powder Booth Specialist
Fiat Chrysler Automotive
Com
pres
sed
Air S
yste
m A
sses
smen
ts
David Andrews Director Marketing Communications Sullair
Paul Edwards President Compressed Air Consultants
Jay Francis National Sales Manager, IPG
SPX Flow Industrial
Tilo Fruth President Beko USA
Chris Gordon President Blackhawk Equipment
Erik Arfalk Vice President Communications Atlas Copco
Kurt Kondas President Universal Air & Gas Products
Frank Langro Director Marketing Festo
Pierre Noack President Aerzen USA
Hank Van Ormer Technical Director Air Power USA
Wayne Perry Technical Director Kaeser
Andy Poplin Sales Manager Atlas Machine & Supply
Kenny Reekie Director, Blower& Vacuum Products Gardner Denver
Compressed Air & Gas Institute, Compressed Air Challenge
2016 MEDIA PARTNERS
2016 Expert Webinar SeriesJoin Keynote Speaker Tom Jenkins and Blower & Vacuum Best Practices Magazine to review aeration blower systems, designed to use four blowers at 50%, 50%, 25% and 25% of design load – by signing up for our free October 27th Webinar titled, “Designing for 8 to 1 Aeration Blower Turndown” at www.airbestpractices.com/magazine/webinars.
| 1 0 / 1 6
4 airbestpractices.com
COLUMNS


INDUSTRY NEWS
“As we spoke to CTA about our experience, customer service, philosophy, we found they operated CTA with similar principles
and didn’t simply treat customer service as a buzz phrase.”— David Peters, Purification Solutions Managing Member
Nano-purification Solutions Establishes Joint Venture for Refrigeration Products
Purification Solutions LLC (nano) of Charlotte,
NC USA and CTA SAS of Chaponost, France
have announced a joint venture for the North
American market. The JV will be owned by
both CTA and Purification Solutions and the
new business will be managed locally by the
nano team. Don Joyce, Director of Sales &
Marketing for CTA-North America will be a key
member of the management team and remain
focused on building the CTA-NA process
cooling business established in April 2016.
David Peters, Purification Solutions Managing
Member commented, “We are extremely
pleased to have reached this agreement
with CTA. We considered several options
prior to making this commitment since we
wanted to ensure it was the right decision
for our business as well as our customers.
After visiting CTA, we quickly realized their
commitment to quality products and excellent
customer service was critical to their success
and, that really stood out for us. Customers
come to nano for several reasons and, of
course, quality products and features are
important to them. However, we believe the key
to our success is the service and support we
provide before, during and after the sale. As we
spoke to CTA about our experience, customer
service, philosophy, we found they operated
CTA with similar principles and didn’t simply
treat customer service as a buzz phrase. We
knew from that meeting we found someone we
wanted to partner with and it was only down to
crafting an agreement that met both our needs.
The joint venture approach works perfectly
for us both. A JV not only meets the needs of
our existing customer base but, it protects our
business and the value we create. Additionally,
it positions CTA in the market directly rather
David Peters, Celine Perez, Emmanuel Perez, Adrien Perez and Don Joyce (left to right).
| 1 0 / 1 6
6 airbestpractices.com
COLUMNS

“I wa
s im
pres
sed
by yo
ur p
rodu
ction
fac
ilities
and
prod
ucts
!”- A
dist
ribut
or in
Dub
ai, U
AE
C
M
Y
CM
MY
CY
CMY
K
QOTM 12.pdf 1 8/3/2016 1:34:42 PM
than through an importer or wholesale
distribution outlet which is important to CTA
as they continue to build their brand globally.”
The CTA brand will be reserved for the core
process chiller product offering and the
CTA-NA team will predominately target OEM
opportunities. nano will continue to focus on
the air compressor distribution network with
an improved (NXC) thermal mass and new
(NDX) direct expansion refrigeration dryer
line to round out nano’s complete range of
compressed air treatment and air separation
products. The CTA chillers will also be
branded for nano’s distributors (NCS)
since the chiller market presents a large
growth opportunity for nano’s existing
customers. Both entities will operate out
of the same facility and share many internal
technical and customer service resources.
CTA’s product offering includes a 24-model
standard range of completely packaged
process chillers through 105 Ton capacity and
Don Joyce’s experience allows the group to
provide process cooling solutions to meet our
customers’ engineered project requirements.
nano’s refrigerated dryer product offering
will continue to include true energy-saving,
thermal mass cycling refrigerated dryers from
20 scfm to 2000 scfm and adds non-cycling
refrigerated dryers from 15 scfm to 4,750 scfm
to the lineup, as well. nano continue to provide
engineered products for larger flow and higher
pressure applications.
Purification Solutions is also proud to
announce, starting in October 2016, our
businesses will operate and ship directly from
a new, larger office and warehouse facility in
Charlotte, NC.
For further information, contact Purification Solutions LLC, tel: 704.897.2182, email: [email protected]
Bristol-Myers Squibb Recognized as a ENERGY STAR® Partner of the Year-Energy Management
Bristol-Myers Squibb is a global BioPharma
company focused on discovering, developing,
and delivering innovative medicines that
help patients prevail over serious diseases.
The company has built a robust energy
management program by utilizing ENERGY
STAR® energy management tools and actively
participates in the ENERGY STAR partnership.
Bristol-Myers Squibb
is receiving ENERGY
STAR Partner of the
Year recognition
for furthering its
commitment to the
environment and its
energy management program over the past
year. Key 2015 accomplishments include:
pp Achieving an absolute energy use reduction of 14 percent and greenhouse gas emissions reduction of 17 percent from a baseline year of 2009.
pp Implementing 50 new major energy projects in 2015, bringing the total number of projects implemented since 2009 to 275. These projects generate an annual average savings of $14.5 million from an investment of $35.1 million.
pp Earning ENERGY STAR certification for three buildings.
pp Engaging over 200 employees, vendors and industry peers through Energy Treasure Hunts that identified plant-wide energy savings opportunities averaging 15 percent with total cost savings potential of over $7.5 million.
pp Actively participating in the ENERGY STAR Focus on Energy Efficiency in Pharmaceutical Manufacturing and Industrial Partnership.
1 0 / 1 6 |
7 airbestpractices.com
COLUMNS

INDUSTRY NEWS
pp Promoting energy efficiency and building capacity for better energy management among employees through numerous energy fairs, lighting fairs, and Earth Day observances.
Building a culture of continuous improvement through employee
engagement using ENERGY STAR resources as the keystone of the
energy program.
For more information, visit www.bms.com/sustainability or www.energystar.gov
MCAA Publishes 2016 Process Instrumentation Market Forecast
The Measurement, Control & Automation Association (MCAA) has
published its Annual Market Forecast for 2016. The report focuses on
the Process Instrumentation and Automation (PI&A) markets in both
the United States and Canada. Twelve industry segments and product
categories are examined in-depth, with a forecast timeline extending
to the year 2020.
The PI&A market in the United States did experience growth in 2015,
however that growth was minimal. At $11.6 billion, the increase was
0.3 percent above the 2014 level of $11.1 billion.
Lack of growth was attributed to a decline in oil prices as well as a
downturn in mining and mineral spending due to falling commodity
prices. Another factor is surplus capacity in the metals, cement, and pulp
& paper sectors that is suppressing demand for those products. A strong
dollar and weaker economies in China, Russia, and Brazil have also
reduced U.S. domestic demand for PI&A products and services.
Five industries within the U.S. are expected to experience above average
growth for the period 2015- 2020: electric utilities, pharmaceuticals,
chemicals, refining, and food & beverage. These industries will account
for $7.8 billion in 2015, expanding to $9.4 billion in 2020.
| 1 0 / 1 6
8 airbestpractices.com
COLUMNS

In Canada, process industries will grow slightly slower than in the United
States. Mining and oil production comprise nearly 20 percent of the
Canadian economy. The drop in oil & gas and mining & minerals spending
resulted in a 4 percentage- point drop in the PI&A growth rate for 2015.
Canadian process industries are positioned for growth over the
forecast period. Metals, cement, water/wastewater, and chemicals
are all expected to profit from increased government spending
on infrastructure.
MCAA exists to help the management teams of process and factory
automation product and solution providers run and grow successful
businesses by offering timely, unique and highly specialized resources
acquired from shared management benchmarks where proprietary
company information is secure.
This report is included in annual membership but can be purchased by non- members for a fee. Please contact MCAA for purchase details at tel: (757) 258- 3100, [email protected], www.measure.org
+
All BEKO Technologies dryers are designed and tested to meet the strict quality guidelines of our company.There are no compromises to quality and reliability of any of our dryers.
Our promise
FEATURES AND BENEFITS
The operation of compressed air systems with conventional heatless and heated desiccant dryers can suffer from high, system-related air loss. This deficiency needs to be compensated via an increase in compressor performance, thus requiring a higher energy input.
EFFICIENT LOWDEW POINT
HEATLESSDESSICANT
DRYING
The DRYPOINT® Principle
Truth in Compressed Air
INNOVATIVE, RELIABLE DESIGN: • high quality components are used in
construction and combined with high
level engineering
• simplifies maintenance and reduces PM costs
WIDE STANDARD RANGE: • DRYPOINT® XC: up to 2,800 scfm from 60 to 7,250 psig
• DRYPOINT® XF: up to 6,000 scfm
BOTH FULLY CUSTOMIZED ENGINEERING
SOLUTIONS AVAILABLE
INTELLIGENT OPERATION: • each dryer includes a feature rich
controller with energy saving modes
DRYPOINT® XFi : depoint demand
standard (XFi) and autonomous
selection method of regeneration and
cooling for optimized energy savings
DRYPOINT® XC and DRYPOINT® XF desiccant dryers offer a convincing,economic solution to the problem: Energy savings of up to 80% can be realized when compared to conventional designs.
EFFICIENT LOWDEW POINT
HEATLESSDESSICANT
DRYING
• DRYPOINT® XC: up to 2,800 scfm from 60 to 7,250 psig
BOTH FULLY CUSTOMIZED ENGINEERING
selection method of regeneration and
cooling for optimized energy savings
XF desiccant dryers offer a convincing,
HYPER-INTELLIGENT
HEATED DESICCANT
DRYING
1 0 / 1 6 |
9 airbestpractices.com
COLUMNS
The Advantages of ONSITE NITROGEN GENERATION for BrewersBy Mike Robinson, Atlas Copco Compressors, LLC
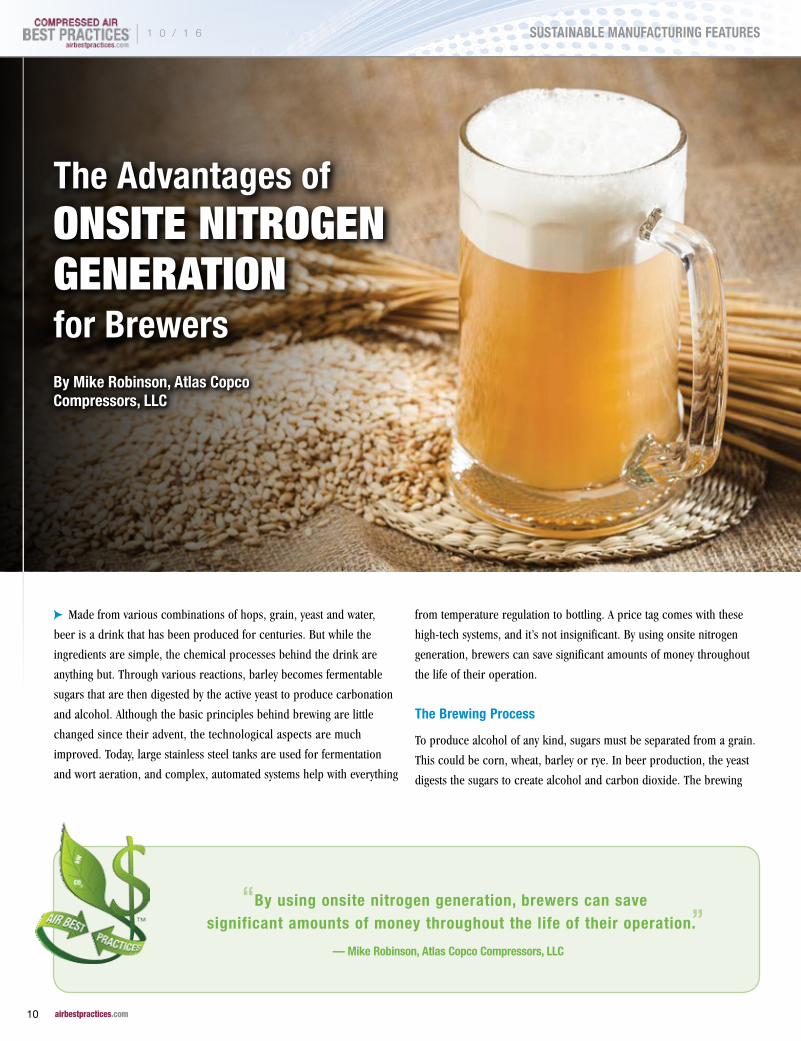
cpMade from various combinations of hops, grain, yeast and water,
beer is a drink that has been produced for centuries. But while the
ingredients are simple, the chemical processes behind the drink are
anything but. Through various reactions, barley becomes fermentable
sugars that are then digested by the active yeast to produce carbonation
and alcohol. Although the basic principles behind brewing are little
changed since their advent, the technological aspects are much
improved. Today, large stainless steel tanks are used for fermentation
and wort aeration, and complex, automated systems help with everything
from temperature regulation to bottling. A price tag comes with these
high-tech systems, and it’s not insignificant. By using onsite nitrogen
generation, brewers can save significant amounts of money throughout
the life of their operation.
The Brewing Process
To produce alcohol of any kind, sugars must be separated from a grain.
This could be corn, wheat, barley or rye. In beer production, the yeast
digests the sugars to create alcohol and carbon dioxide. The brewing
“By using onsite nitrogen generation, brewers can save significant amounts of money throughout the life of their operation.”
— Mike Robinson, Atlas Copco Compressors, LLC
| 1 0 / 1 6
10 airbestpractices.com
SUSTAINABLE MANUFACTURING FEATURES

process is broken down into four discrete steps: malting, mashing,
boiling and fermentation.
First, the grain must be malted, or heated, dried and cracked to make
certain necessary enzymes available. During mashing, the grain is
steeped in hot water to break down the enzymes released by malting.
The mash is then strained to remove leftover particulate. The resulting
sugary liquid is called wort. In the boiling phase, bitter hops are
added to mitigate the overly-sweet taste of the wort. Hops also act as
a preservative. At this stage, other flavors can also be added. The wort
is boiled, cooled and strained again. The wort can also be aerated,
or injected with small air bubbles. This assists in the last step in the
process, fermentation. Yeast is added to the wort. Fueled by oxygen,
the yeast digests the sugars and release alcohol and carbon dioxide. The
duration and temperature of fermentation depends on the type of beer
being made. Each of these steps takes place in large tanks dedicated
to different phases of the brewing process.
*A 250 hp compressor can produce 40,515 gallons of oily condensate per year.
JORC Zero Air-Loss Condensate Drains and Oil/Water Separators provide
SUSTAINABLE CONDENSATE MANAGEMENT
COMPRESSED AIR ALSO PRODUCES OILY CONDENSATE*Zero Air-Loss Condensate Drains
Compressed Air Saving Products
Electronic No Electricity Required
Smart Guard Ultra
Smart Guard
Help ensure it doesn’t impact ourENVIRONMENT.
A 250 hp compressor can produce 40,515 gallons of oily condensate per year.
Drains and Oil/Water Separators provideSUSTAINABLE CONDENSATE
Sepremium Oil/Water Separator
JORC Industrial LLC. • 1146 River Road • New Castle, DE 19720 Phone: 302-395-0310 • Fax: 302-395-0312 • [email protected] • www.jorc.com
Mini Mag Filter Applications
Mini Mag SP Filter Applications
POD-TD Receiver Applications
Air-Saver G2Air Leak Lock-Down
Stainless steel tanks are used to store mash, aerate wort and ferment beer.
1 0 / 1 6 |
11 airbestpractices.com
SUSTAINABLE MANUFACTURING FEATURES

THE ADVANTAGES OF ONSITE NITROGEN GENERATION FOR BREWERS
Nitrogen uses in brewery applications
Nitrogen or other compressed gases are used
in various phases of the brewing process.
Brewers use nitrogen to purge tanks between
uses, ensuring residual mash, wort or beer
doesn’t oxidize and pollute the next batch
with harsh or sour flavors. It can be used to
displace oxygen and carbon dioxide in tanks
and to push beer from one tank to another.
Nitrogen is also injected into kegs to pressurize
them prior to shipment, storage and use.
Benefits of onsite nitrogen generation
Producing nitrogen onsite offers microbrewers
three key benefits beyond ordering bulk
nitrogen: less production time is lost, no gas
waste and lower costs.
1. Less time lost
When brewers produce nitrogen onsite, their operations aren’t at the mercy of a supplier’s delivery schedule. Even if it’s just for a few days, production may have to be
BUILT FOR TODAYC O M M I T T E D T O T O M O R R O W
AW
ARD WINN
ING
More than 160 years ago, the FS-Curtis way of doing business was established through two key commitments: a dedication to building quality products and a
dedication to responsive customer service. Over the decades, the company and its products have evolved through innovation and new technologies. But those commitments to quality and service remain unchanged. Today, just as in 1854, FS-Curtis customers can depend on our products for reliable, long-term service. Equally as important, they can depend on
getting the same from our people.
Brewery equipment using nitrogen generated onsite from the compressed air system.
| 1 0 / 1 6
12 airbestpractices.com
SUSTAINABLE MANUFACTURING FEATURES

Discover More www.sullivan-palatek.com \ 219.874.2497»
MAXWELL INDUSTRIES TEAMS UP WITH SULLIVAN-PALATEKThe C-10, a unit used in Maxwell Industries shop for the development of Speed Demon, is a 10 hp industrial electric air compressor that is part of a growing line of models off ered in the C-Series package. Now available from 10-30 hp, these tri-voltage units are currently being off ered with optional integral dryer packages. For more information, call or visit our website for details.
PROUDLY PART OF A TRADITION
WINNING
Speed Week 2016 FASTEST Single Flying Mile: 429 mph
MAXWELL INDUSTRIES TEAMS UP WITH SULLIVAN-PALATEKThe C-10, a unit used in Maxwell Industries shop for the development of electric air compressor that is part of a growing line of models off ered in the C-Series package. Now available from 10-30 hp, these tri-voltage units are currently being off ered with optional integral dryer packages. For more information,details.
Speed Week 2016
halted, leading to less uptime and potential product losses. Once the compressed gas does arrive, it needs to be brought in, attached to the current system, and the old canisters need to be removed. Having nitrogen on hand reduces time lost waiting for these steps to occur and removes some of the work on the operators end, freeing up more time for other functional tasks.
How does a nitrogen generator work?
The air around us is composed of about 78
percent nitrogen and 21 percent oxygen.
Nitrogen generators remove the oxygen
molecules. This is accomplished through
two methods: pressure swing adsorption
and membrane nitrogen generation.
Pressure swing adsorption (PSA) separates
molecules with a carbon molecular sieve
(CMS). The media has pores the same
size as oxygen molecules across its surface,
allowing the passing oxygen molecules to
adsorb to the sieve. Nitrogen molecules
are larger than oxygen, so they bypass
the CMS and continue on to the tank. PSA
generators have two chambers: one that is
adsorbing oxygen and another that swings
to a low pressure for desorption. These
generators can produce nitrogen with a 10
parts per million remaining oxygen content
or a purity level of 99.999%.
Membrane nitrogen generation operates
differently than PSA nitrogen generation.
Instead of adsorption, this process utilizes
a bundle of small, hollow polymer fibers
to remove oxygen from the gas stream.
The fibers have small surface holes large
enough for oxygen to pass through, but
nitrogen is too large to fit. This method
can produce up to 99.5 percent purity
level nitrogen.
1 0 / 1 6 |
13 airbestpractices.com
SUSTAINABLE MANUFACTURING FEATURES

2. No gas waste
Typically, breweries do not
measure compressed gas usage.
However, you don’t need exact
measurements to know gas gets
wasted. When bulk liquid nitrogen
is purchased, it’s not used all at
once. While it sits idle in tanks, the
ambient heat causes it to expand.
If this pressure isn’t released, the
tanks can explode. To prevent this
from happening, the tanks must be
opened and the gas released back
into the atmosphere. While this
is certainly a good safety practice,
it wastes product – and money.
Onsite nitrogen generation allows
brewers to use only what they
need, when they need it, reducing
the costs associated with wasted
or unused pressurized gas.
THE ADVANTAGES OF ONSITE NITROGEN GENERATION FOR BREWERS
Over 10,000 compressor rooms have become EPA compliant using CRP Oil/Water Separators
Clean Resources • www.cleanresources.com • 800-566-0402
No Maintenance
Guaranteed to reduce effluent to less than 10 ppm
Nitrogen is used to push contents from one tank to another.
| 1 0 / 1 6
14 airbestpractices.com
SUSTAINABLE MANUFACTURING FEATURES

3. Lower costs
In addition to costs incurred from lost production time
and wasted compressed gas, onsite nitrogen generation
is cheaper than purchasing carbon dioxide or nitrogen.
Most brewers do not have a clear market awareness of
how much compressed carbon dioxide and nitrogen should
cost, which is understandable; prices can differ depending
on how near or far the brewery is to the gas generation
site. For example, while one brewery may be paying $0.25
per cubic foot, another brewer in the same city could be
paying three times more.
On average, purchasing nitrogen costs between $0.25 and $0.40 per
cubic foot, and carbon dioxide is typically slightly more expensive.
Generating nitrogen is much cheaper than either option, costing about
$0.10 to $0.15 per cubic foot. Depending on purchase and delivery
costs in an area, brewers can realize savings of 40 to 75 percent
by choosing to use onsite nitrogen generation.
Initial purchase and life cycle costs
The upfront cost of a nitrogen generator may be a deterrent for some
brewers, but looking past the initial purchase price reveals the true
value. Using the above data, it’s easy to understand the daily savings an
onsite nitrogen generator provides. These savings quickly compound and,
depending on usage, many brewers break even within the first two years
of installation.
Nitrogen generators use either pressure-swing adsorption (PSA) or membrane technology.
1 0 / 1 6 |
15 airbestpractices.com
SUSTAINABLE MANUFACTURING FEATURES

Subscribe at airbestpractices.com
Learn How To Save Energy & Improve Productivity In YOUR Industry!
F R E E S U B S C R I P T I O NDIGITAL EDITION FREE WORLDWIDE | PRINT EDITION FREE TO U.S. SUBSCRIBERS
THE ADVANTAGES OF ONSITE NITROGEN GENERATION FOR BREWERS
Nitrogen generation and oil-free air
To generate nitrogen you first need a source
of compressed air. While some small nitrogen
generation systems include an internal
compressor, these would not generate the
capacity needed to support a brewery. Oil-
free compressors are well-suited to this task.
Breweries that use oil-free compressors
alongside nitrogen generators can use the
same compressor to power other functions
throughout the facility such as control air for
valves and filling equipment. This can help
breweries lower their energy costs associated
with compressed air, potentially offsetting the
initial price of the nitrogen generator.
Oil-free compressors are the best choice
when selecting a compressor to power a
brewery with an onsite nitrogen generator.
Since they are not lubricated by oil, there is
no risk of contaminating the beer at any stage
during production. This also reduces the cost
of maintaining and replacing filters in the
nitrogen generator.
Conclusion
The various benefits of onsite nitrogen
generation all boil down to one common
theme: savings. From lower gas expenses to
less gas waste to no delivery and installation
wait time, nitrogen generators are a clear
boon to brewers. Brewers can gain further
savings by pairing nitrogen generation with
oil-free VSD compressors, mitigating costs
to bolster their bottom line.
For more information, please contact Mike Robinson, Atlas Copco Compressors, LLC, tel: (803) 817-7340, email: [email protected], www.atlascopco.us
IS EVERYTHINGGerald “Gerry” Bauer President, EccoFab - Rockford, IL
Sullair.com/GerrysStory
It doesn’t quit. It doesn’t even think about quitting. In fact, it doesn’t think of anything but the job at hand.
Sound familiar?Our compressors are a lot like the people who use them.
Discover the complete line of Sullair stationary air compressors, featuring the legendary Sullair air end.
To learn more about our complete line, including air treatment products, contact your local distributor or visit our website.
IS EVERYTHINGReliability
To read more Nitrogen Generation Technology articles, please visit http://www.airbestpractices.com/
technology/air-treatmentSubscribe at airbestpractices.com
Learn How To Save Energy & Improve Productivity In YOUR Industry!
F R E E S U B S C R I P T I O NDIGITAL EDITION FREE WORLDWIDE | PRINT EDITION FREE TO U.S. SUBSCRIBERS
1 0 / 1 6 |
17 airbestpractices.com
SUSTAINABLE MANUFACTURING FEATURES

Heatless Compressed Air Desiccant DRYER CALCULATION PRINCIPLES
By Donald White, Chief Engineer, Aircel
cpCompressed air is provided to power
pneumatic valve actuators, drive air motors,
convey raw material and products, activate
analytical instrumentation, and for cooling
services. To be effective, compressed air
must be dried to remove moisture, and other
contaminants, which contaminate and corrode
critical components. Purity levels recommended
for various services are given in Fig. 1.
Adsorption devices are commonly installed
in compressed air systems to remove
moisture. Heatless compressed air dyers
are the most common type furnished to
meet the requirement for -40˚F dew point
“commercially dry” air, especially in systems
of less than 1,000 standard cubic feet per
minute (scfm). Heatless air dryers are
pressure swing adsorbers designed to retain
“With diligence and attention to design principles, the heatless dryer can be constructed to fulfill very stringent service specifications.”
— Donald White, Chief Engineer, Aircel
| 1 0 / 1 6
18 airbestpractices.com
SUSTAINABLE MANUFACTURING FEATURES

the heat of adsorption within the desiccant
beds during the drying process.
The stored heat of adsorption is consumed
during the regeneration process to remove
moisture from the desiccant to provide
continuous service. If the heat is lost
prematurely, such as by excessive flow
rates, the heatless dryer cannot regenerate
and the system fails requiring priming at
minimal flow for an extended period of time
before continuing. The dryer is heater-less,
but it relies on the retention of the heat of
adsorption evolved during the drying process
to provide continuous service.
The Inventor: Dr. Charles W. Skarstrom
The heatless dryer process was born out
of necessity by Dr. Charles W. Skarstrom in
1956 at the Esso refinery in Bayway, New
Jersey1. Dr. Skarstrom, who had worked on
the Manhattan Project during World War II,
Dr. Charles W. Skarstrom, Inventor
DEW POINT AT PRESSURE
ISO 8573.1 PURITY CLASS
Air Motors -20˚F / -29˚C 2.3.2
Pneumatic Actuators -20˚F / -29˚C 2.3.2
Manufacturing Services -20˚F / -29˚C 2.3.2
Spray Painting -20˚F / -29˚C 2.3.2
Sand Blasting -20˚F / -29˚C 2.3.2
Breathing Air -40˚F / -40˚C 2.2.2
Drying Processes -40˚F / -40˚C 2.2.2
Wind Tunnels -40˚F / -40˚C 2.2.2
Pneumatic Controls -40˚F / -40˚C 1.2.1
Electronics -40˚F / -40˚C 1.2.1
Pneumatic Conveyors -40˚F / -40˚C 1.2.1
Plastic Mold Blowing -40˚F / -40˚C 1.2.1
Cryogenic Services -100˚F / -74˚C 1.1.1
Optical Lenses -100˚F / -74˚C 1.1.1
Instrumentation -100˚F / -74˚C 1.1.1
Fig. 1 – Recommended Compressed Air Dryness Levels
1 0 / 1 6 |
19 airbestpractices.com
SUSTAINABLE MANUFACTURING FEATURES
was developing an automatic gas analyzer for
his laboratory when the plant’s desiccant air
dryer failed. The dryer’s regeneration heater
burned out. Acting on the theory of heater-
less regeneration, Dr. Skarstrom solicited
the assistance of Virgil Mannion and Robert
C. Axt, adsorption system engineers, and
together they shortened the dryer cycle time
sufficiently to conserve the heat of adsorption
and continue the drying process without an
external heat source. Based on the successful
operation, the process was patented2. Dr.
Skarstrom’s laboratory observations are
preserved in his patent issued in 1960,
and in the 1972 CRC Press publication3.
He discovered that to dry compressed air,
the following principles must be applied for
the process to continue.
pp Principle #1: Short cycles and low throughput per cycle are required to conserve the heat of adsorption
pp Principle #2: Regeneration at low pressure using some of the purified product for countercurrent purge
pp Principle #3: Actual purge flow rate (acfm) must equal or exceed the throughput flow rate (acfm). The third principle can be restated in terms of standard cubic feet per minute (scfm): Purge (scfm) ≥ Feed (scfm) x (Regeneration Pressure, psig + 14.7) / (Inlet Pressure, psig + 14.7)
Microporous Desiccant Material
The desiccant in a heatless air dryer is a
microporous mineral rather than a chemical
reagent, and moisture is removed from the
air by adsorption, a physical phenomenon,
rather than by chemical reaction. Desiccants
are rigid, nanoporous, sponge-like granules
that provide a large active internal surface
in angstrom size channels for attracting and
retaining fluid molecules.
The physical attraction is the result of
van der Waal forces and electrostatic
interactions. These forces, explored by
Johann Dietrich van der Waal (1838-
1923) and Linus Carl Pauling (1901-1994)
include polar attraction, London forces,
and gravitational dispersion among other
forces. The adsorption phenomenon was
studied extensively by many researchers
including Stephen Brunauer and Paul
Emmett, who later developed the method for
separating U-235 from U-238, and Edward
Teller who led in the development of the
hydrogen bomb. They devised the B.E.T.
method of measuring the internal surface
area of adsorbent granules4. Recently
research has shown that adsorbed water
molecules are retained in a state differing
from either a vapor or a liquid. Upon entry
into the nanocavities, the atoms of the water
molecules delocalize and adhere to the solid
surfaces in a “quantum tunneling state”. The
discovery was made by neutron scattering
and ab initio simulations at the Department
of Energy’s Oak Ridge National Laboratory
(ORNL) in 20165.
Knowledge Developments in Heat of Adsorption and Adsorption Isotherms
Experimentation revealed that the heat
released during the adsorption process is
exothermic in accordance with J.W. Gibbs’
law. The atoms from the water molecules lose
HEATLESS COMPRESSED AIR DESICCANT DRYER CALCULATION PRINCIPLES
| 1 0 / 1 6
20 airbestpractices.com
SUSTAINABLE MANUFACTURING FEATURES

WARNING!If your job depends on frequent compressor
breakdowns and oil changes...This Lubricant could put your job at risk!
Summit Ultima is a high performance lubricant formulated tooutperform other synthetic compressor lubricants in today’smarket. Summit Ultima’s unique formulation allows for bettercompressor performance, and it is compatible with existingO.E.M. lubricants. Summit Ultima Series synthetic rotaryscrew air compressor lubricant benefits include:
• Better thermal conductivity for lower operating temps• Superior protection against mechanical stress• Reduces power consumption through reduced friction• Eliminates varnish, sludge and carbon deposits• Protects against shear & viscosity loss under heavy loads• Product consolidation by application
Up to 12,000 hours of Dependable Service
Summit
Ultima®
SeriesExtended Life Rotary Screw
SyntheticCompressor Oil
800.749.5823
SummitQuality • Service • Expertise
ASK ABOUT FREE OIL ANALYSISLubricants: www.klsummit.com - Chemicals: www.sublimedescaler.com
Summit Ultima_Layout 1 4/12/2016 1:17 PM Page 1
Calculation Notations
co = influent concentration of water
vapor, lbm of water vapor per lb
m
of dry air
cp = specific heat of air at constant
pressure, btu/lbm-˚F
G = Gibbs Free Energy, btu/lbm
H = enthalpy, btu/lbm
M = adsorbent equivalent capacity, lb
m water vapor/lb
m of adsorbent
N = number of mass transfer units, dimensionless
p2 = effluent system pressure, psia
p3 = purge exhaust pressure, psia
P = influent system pressure, psig
Pr = excess purge ratio, actual purge /
minimum purge
S = entropy, btu/lbm-°R
t = parametric time constant, (1.8 minutes)
ta = drying time, minutes
T = absolute temperature, ˚R
T = throughput parameter, dimensionless
V = volume of water vapor adsorbed, cu.ft./lbm of adsorbent
W = humidity ratio, mass of water vapor per mass of dry air
Wd = mass of desiccant, lb
m
X = effluent concentration of water vapor, lb
m water vapor per lb
m air
ρ0 = standard density of air, lb
m per cubic
foot (0.075 lbm/cu. ft.)
1 0 / 1 6 |
21 airbestpractices.com
SUSTAINABLE MANUFACTURING FEATURES

HEATLESS COMPRESSED AIR DESICCANT DRYER CALCULATION PRINCIPLES
a degree of freedom during the adsorption
process and the adsorption process is
accompanied by a reduction in entropy (S)
and Gibbs free energy (G):
∆H = ∆G + T ∆S
This phenomenon is observed when liquid
water is added to a flask of dry desiccant. The
heat released is sufficient to produce steam
shown rising from a beaker of molecular
sieve desiccant.
The released heat is absorbed into the
compressed air stream by convection resulting
in an elevation of the air temperature, ∆Ta.
The temperature rise is directly proportional
to the heat of adsorption and to the change in
specific humidity in the air, ∆W, divided by the
specific heat of air, cp
6.
∆Ta = ∆H x ∆W / c
p
The three common industrial desiccants are
activated alumina commercialized by Pechiney
in France in the 1950’s based on the Bayer
process7, synthetic silica gel developed by
Walter Albert Patrick in 1918 (Grace Davison),
and synthetic molecular sieve invented by R.M.
Milton of Union Carbide (Linde) in 19598. The
B.E.T. surface area of commercial activated
alumina is about 350 square meters per
gram, silica gel has a B.E.T. internal surface
area of about 650 square meters per gram,
and molecular sieves have an internal B.E.T.
surface area of approximately 800 square
meters per gram.
At partial pressures below saturation, the
adsorption capacity for water vapor decreases,
but not linearly. Stephen Brunauer, Lola S.
Deming, W. Edwards Deming and Edward
Teller studied the various isothermal
adsorption capacity curves and published
the five characteristic forms:9
Dual Chambers and Fluidization
Desiccant is installed inside two chambers
and the compressed air is directed into one
chamber while the other is being regenerated.
As recommended by Dr. Skarstrom, the
flow through the regenerating chamber
is countercurrent to the direction of flow
through the chamber that is drying the
compressed air3. The wet air can be admitted
into either the top or the bottom of the drying
chamber. Depressurization of the chamber
at the start of regeneration must be opposite
to the direction of the drying flow. It is most
practical to flow upward during drying so that
the chamber will be depressurized downward
to initiate regeneration. This causes the least
disturbance in the desiccant bed and minimal
adsorbent abrasion.
The compressed air is subject to energy losses
and pressure reduction as it flows through
This heatless regenerative desiccant dryer from SKF typically uses less than 8% purge air, yet delivers superior dew points now with Bluetooth LE technology.
• Synchronous compressor control matches dryer to compressor run times
• Smart cycle selection to lower energy consumption & dew points
Simple to service
• Time-to-Service email notifications
• Track all service activities Track all service activities Twithin the Smart Valve AppSmart Valve App
• Simply spin off the high temperature desiccant cartridgestemperature desiccant cartridges
SKF’s SFD just got SmarterIntroducing the SKF separator filter dryer (SFD) with Smart Valve
NEW!!
Please contact SKF for questions and ordering, 1-888-753-3477
® SKF is a registered trademark of the SKF Group. | © SKF Group 2016
Fig. 2 - The Five Types of van der Waals Adsorption Isotherms
| 1 0 / 1 6
22 airbestpractices.com
SUSTAINABLE MANUFACTURING FEATURES

a chamber filled with desiccant. This loss
should never be so severe as to fluidize the
desiccant granules or cause them to oscillate
violently resulting in granular attrition.
The energy losses in a fluid stream passing
through a granule bed are expressed by Daniel
Bernoulli’s law of hydrodynamic pressure, and
more recently by Sabri Ergun10. The vessel
flow area must be sufficiently large to prevent
the fluid velocity from reaching fluidization.
To protect the desiccant granules, the upward
flow rate is limited to approximately 70% of
fluidization. The down flow fluidization limit
is twice the up flow limit as the granules tend
to nestle and retain stable positions as the flow
presses downward. The catastrophic effects
of excessive velocities through packed beds
have been reported by Theodore von Kármán,
Frederick A. Zenz, and Edward Ledoux.
As the flow passes through the bed of
desiccant granules, hydraulic energy is
reduced, and mass transfer and heat transfer
waves are established. Water vapor is not
adsorbed evenly throughout the bed, but
rather starts at the inlet end and quickly
forms a mass transfer wave that permeates
gradually through the bed. As the water vapor
is adsorbed, heat of adsorption is liberated
forming a thermal front that advances through
the bed at a much faster rate than the mass
transfer front. The shape of the heat and mass
transfer fronts and their rates of propagation
have been defined mathematically by A.
Anzelius11 in 1926, and by Albert Einstein12 in
1937. The solution was simplified for linear-
equilibrium isotherms by an approximation
offered by Adrian Klinkenberg13 in 1948 as
given by the following equation:
X = ½ [ 1 – erf ( √N_
- √NT__
) ]
For Type I Langmuir type adsorption isotherms
such as for molecular sieve desiccants, the
following solution offers improved accuracy14.
X = ½ [ 1 – erf ( √N__
- __
NT___
) ]
The effluent water vapor concentration is
determined from an analysis of the mass
transfer front which is distorted by the
short cycle time required to contain the
heat of adsorption. The NEMA cycle time is
normally 10 minutes, 5 minutes per desiccant
chamber, to provide a -40˚F pressure dew
point. The time is shortened to lower the
effluent dew point or to reduce the size of
the dryer chambers. To provide a -100˚F
pressure dew point, the cycle time is typically
shortened to 5 minutes, 2.5 minutes per
desiccant chamber. Cycle times as short
as 24 seconds have been used to reduce
the size of a desiccant heatless dryer to a
fraction of the standard size. The effluent
water vapor concentration from a heatless
dryer is determined from the following
equation6.
X = (ta3/t2) (c
o)2 (scfm x ρ
0) / {M N W
d (P
r)2
[1 – (p3/p
2)] } lb
m water vapor per lb
m air
A lower effluent concentration can be
achieved by decreasing the cycle time, τa3,
decreasing the inlet moisture content, co 2,
increasing the excess purge flow ratio, Pr-2,
or by increasing the desiccant mass, Wd
-2
(Note: Wd is also included in “N”).
InterestedinBecomingaDistributor?
1 0 / 1 6 |
23 airbestpractices.com
SUSTAINABLE MANUFACTURING FEATURES
HEATLESS COMPRESSED AIR DESICCANT DRYER CALCULATION PRINCIPLES
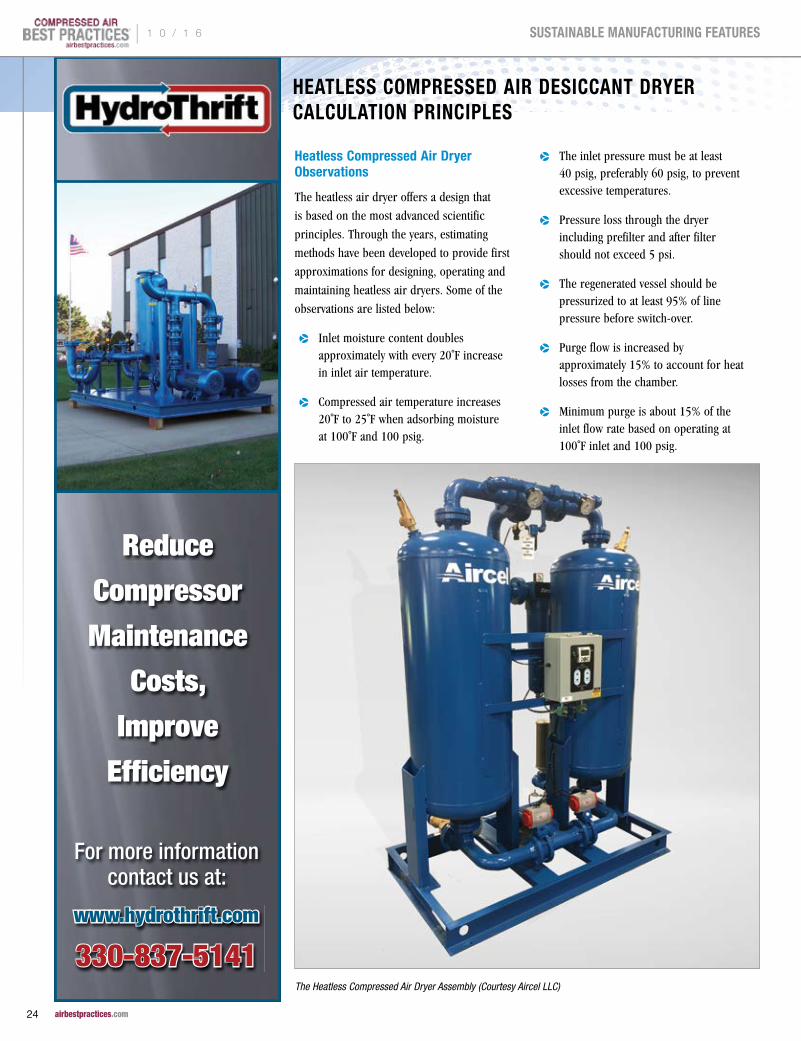
Heatless Compressed Air Dryer Observations
The heatless air dryer offers a design that
is based on the most advanced scientific
principles. Through the years, estimating
methods have been developed to provide first
approximations for designing, operating and
maintaining heatless air dryers. Some of the
observations are listed below:
pp Inlet moisture content doubles approximately with every 20˚F increase in inlet air temperature.
pp Compressed air temperature increases 20˚F to 25˚F when adsorbing moisture at 100˚F and 100 psig.
pp The inlet pressure must be at least 40 psig, preferably 60 psig, to prevent excessive temperatures.
pp Pressure loss through the dryer including prefilter and after filter should not exceed 5 psi.
pp The regenerated vessel should be pressurized to at least 95% of line pressure before switch-over.
pp Purge flow is increased by approximately 15% to account for heat losses from the chamber.
pp Minimum purge is about 15% of the inlet flow rate based on operating at 100˚F inlet and 100 psig.
The Heatless Compressed Air Dryer Assembly (Courtesy Aircel LLC)
Reduce Compressor Maintenance
Costs, Improve
Efficiency
For more information contact us at:
www.hydrothrift.com
330-837-5141
| 1 0 / 1 6
24 airbestpractices.com
SUSTAINABLE MANUFACTURING FEATURES
Literature Cited
1. White, D. H., “Regenerable Pressure-Swing Adsorption Systems,” Pall Corporation, Presentation at US Naval Research Laboratory, Wash., DC, April 23 (1986).
2. Skarstrom, C. W., “Method and Apparatus for Fractionating Gaseous Mixtures by Adsorption,” US Patent 2,944,627 (1960).
3. Skarstrom, C. W., “Heatless Fractionation of Gases Over Solid Adsorbents,” Recent Developments in Separation Science, Vol. II, p. 95, N. N. Li (Ed.), CRC Press, Cleveland, OH (1972).
4. Brunauer, S., P. H. Emmett, and E. Teller, J. Amer. Chem. Soc., Vol. 60, p. 309, (1938).
5. Kolesnikov, A.I., G.F. Reiter, N. Choudhury, T.R. Prisk, E. Mamontov, A. Podlesnyak, G. Ehlers, A.G. Seel, D.J. Wesolowski, and L.M. Anovitz, “Quantum Tunneling of Water in Beryl: A New State of the Water Molecule”, Physical Review Letters 116, 167802 (2016), Pub. April 22, (2016).
6. White, D. H., and P. G. Barkley, “The Design of Pressure Swing Adsorption Systems,” Chemical Engineering Progress, pp. 25-33, (1989).
7. Bayer, K. J., “Studium ϋber die Gewinnung reiner Tonerdi, Chem. Zeitung, 12, p. 1209. Ibid, 14, p. 736, (1890).
8. Breck, D. W., “Zeolite Molecular Sieves,” John Wiley & Sons, (1974).
9. Brunauer, S., L. S. Deming, W. E. Deming, and E. Teller, “On a Theory of the van der Waals Adsorption of Gases,” J. Amer. Chem. Soc., Vol. 62, pp. 1723-1732, (1940).
10. Ergun, S., “Fluid Flow through Packed Columns,” Chem. Eng. Progress, 48 (2), p. 89, (1952).
11. Anzelius, A., “Über Erwärmung vermittels durchstrӧmender Medien,” Zeitschrift fϋr Angewandte Mathematik und Mechanik, Band 6, Heft 4, pp. 291-294, (1926).
12. Einstein, A., Ph.D. Dissertation, “Eidgenӧssische Technische Hochschule,” Zurich, (1937).
13. Klinkenberg, A., Ind. Eng. Chem, 40, (10) 1992-94, (1948)
14. White, D. H., “An Analysis of an Adsorption Wave,” AIChE Spring National Meeting, 86, (1988).
Global manufacturer of process control and factory automation solutions
For more information:Call: 1-800-Go-Festo 1-800-463-3786
www.festo.com/us/airquality
The right compressed air
increases the service life of components and systems – as well as the process and product reliability.
Short delivery times!
To read more Compressed Air Dryer Technology articles, please visit http://www.airbestpractices.com/
technology/air-treatment
pp Rob Thomson’s rule: outlet dew point changes about 1˚F with each 1˚F change in inlet temperature.
pp Depressurization air loss is approximately 10% of the purge loss, and the two losses are additive.
pp Harry Cordes equation: Minimum contact time (10 Min. NEMA) = 0.75 + [0.0345 x (P, psig) ] seconds.
pp Required mass of desiccant to retain the heat of adsorption is approximately 600 pounds of adsorbent per 1,000 scfm of air at 100˚F and 100 psig operating on a 10 minute NEMA cycle.
pp Desiccants: activated alumina (Type II isotherm) is standard, silica gel (Type IV) is used for lower dew points, and molecular sieve (Type I) for the lowest dew points and for inlet temperatures over 100˚F.
pp The chambers are filled with desiccant to the knuckle in the top head creating a distribution plenum.
pp Upflow drying and downflow depressurization result in minimum desiccant abrasion and attrition.
pp Moisture and temperature switch-over spikes, prevalent in heat regenerated dryers, are not present.
pp Desiccant chamber safety valves, one per chamber, should be set approximately 10% over the maximum system operating pressure to prevent valve plug simmering or chattering.
pp Thermal safety valves on the desiccant chambers are sized to relieve excess pressure resulting from the expansion of trapped air in a closed vessel caused by an external conflagration.
pp Pneumatic control air tubing can be stainless steel, Teflon®, copper, and for indoor service, nylon.
With diligence and attention to design
principles, the heatless dryer can be
constructed to fulfill very stringent service
specifications. Testing of the finished product
at the design operating conditions before
shipment is advisable to confirm expected
performance. A properly designed, fabricated,
and tested heatless desiccant compressed
air dryer is assured to satisfy the application
requirements.
By Donald White, Chief Engineer, Aircel, email: [email protected], tel: 865-268-1011, www.Airceldryers.com
1 0 / 1 6 |
25 airbestpractices.com
SUSTAINABLE MANUFACTURING FEATURES
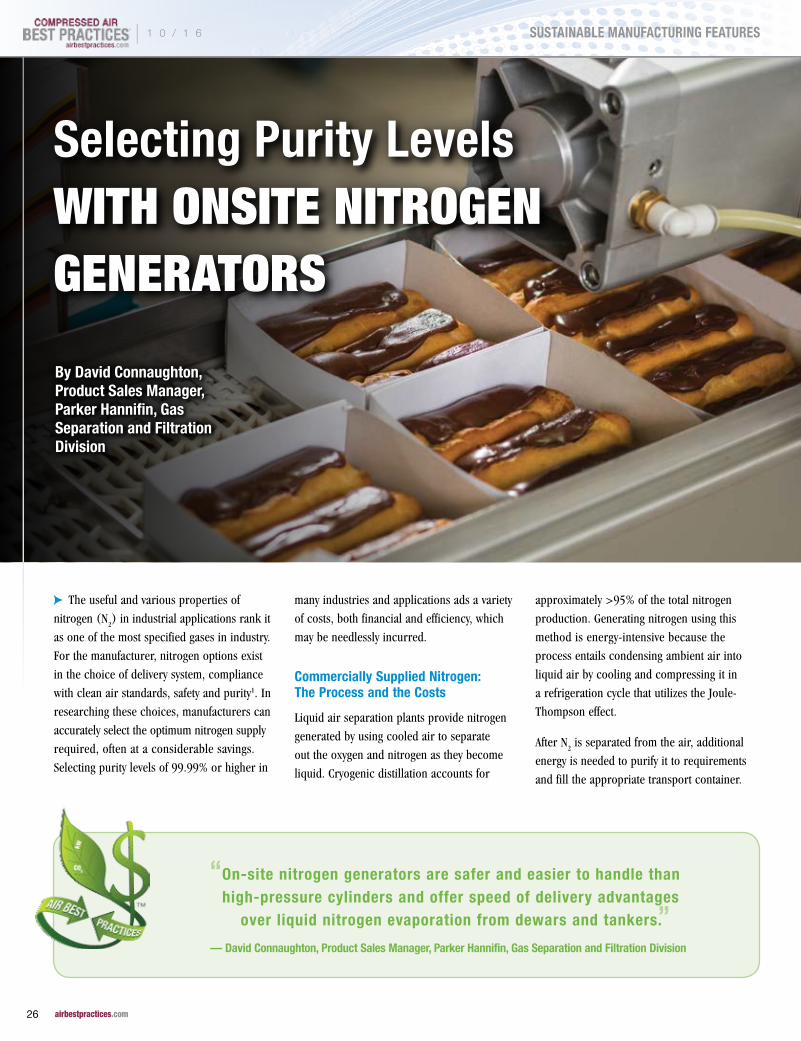
Selecting Purity Levels WITH ONSITE NITROGEN GENERATORS
By David Connaughton, Product Sales Manager, Parker Hannifin, Gas Separation and Filtration Division
cpThe useful and various properties of
nitrogen (N2) in industrial applications rank it
as one of the most specified gases in industry.
For the manufacturer, nitrogen options exist
in the choice of delivery system, compliance
with clean air standards, safety and purity1. In
researching these choices, manufacturers can
accurately select the optimum nitrogen supply
required, often at a considerable savings.
Selecting purity levels of 99.99% or higher in
many industries and applications ads a variety
of costs, both financial and efficiency, which
may be needlessly incurred.
Commercially Supplied Nitrogen: The Process and the Costs
Liquid air separation plants provide nitrogen
generated by using cooled air to separate
out the oxygen and nitrogen as they become
liquid. Cryogenic distillation accounts for
approximately >95% of the total nitrogen
production. Generating nitrogen using this
method is energy-intensive because the
process entails condensing ambient air into
liquid air by cooling and compressing it in
a refrigeration cycle that utilizes the Joule-
Thompson effect.
After N2 is separated from the air, additional
energy is needed to purify it to requirements
and fill the appropriate transport container.
“On-site nitrogen generators are safer and easier to handle than high-pressure cylinders and offer speed of delivery advantages
over liquid nitrogen evaporation from dewars and tankers.”— David Connaughton, Product Sales Manager, Parker Hannifin, Gas Separation and Filtration Division
| 1 0 / 1 6
26 airbestpractices.com
SUSTAINABLE MANUFACTURING FEATURES
Since this process is performed continuously
on a large scale, its power usage generates
hundreds or thousands of tons of greenhouse
gases every day.
Nitrogen produced through this process can
attain a purity of 99.99% or higher. This process
is completed at a higher cost for a purity level
offering no added benefit for most applications.
Purchased nitrogen from a commercial gas
company is the most expensive option. Costs
are slightly lower for liquid nitrogen in a Dewar
or bulk tank. In cylinders, the cost rises.
The cost of transport of nitrogen via delivery
tankers from a fractional distillery facility to
and from an end users plant is factored into
the price. Delivery of nitrogen uses a lot of
energy and significantly contributes to the
amount of CO2 generated in the process of
delivering nitrogen to end users. Obviously,
the amount of energy required to transport
the nitrogen depends on the distance between
the facility and the end user’s plant, but the
environmental impact of trucking nitrogen
is significant. For example, a tractor trailer
traveling around 100,000 miles per year
generates about 360,000 pounds of carbon
dioxide during that time period. The highly
pressurized and heavy cylinders require proper
handling and can lead to back injuries or
catastrophic damage and injuries if the valve
were to shear off.
On-site Nitrogen Generators: The Process and Benefits
On-site nitrogen generators are safer and
easier to handle than high-pressure cylinders
and offer speed of delivery advantages over
liquid nitrogen evaporation from dewars
and tankers. On-demand gaseous nitrogen
generation uses one of two alternative
methods. They include Pressure Swing
Absorption (PSA) and membrane system
technologies. The choice of generator largely
depends on the purity of nitrogen needed. In
both cases, the level of O2 can be controlled
to just the required purity level.
Applications that need nitrogen of 95 to 98
percent purity (5% to 2% oxygen), such
as fire and explosion prevention, can use
membrane generators. Applications such as
the blanketing of oxygen sensitive compounds,
specialty chemicals and pharmaceutical
processing need a high purity stream and
require the use of PSA generators.
PSA systems take compressed air and filter
the air using high quality coalescing filters
to remove 99.99% of 0.01 micron particles.
The system then separates nitrogen from
oxygen based on the preferential adsorption
and desorption of oxygen, water vapor and
other contaminants on a Carbon Molecular
Sieve (CMS) bed. PSA nitrogen generators
have two bed columns: one with fresh CMS for
the current adsorption process and another
that swings to low pressure to desorb oxygen
from saturated CMS. One column provides
nitrogen while the other column is being
regenerated. These column beds are cycled
back and forth to generate and regenerate the
beds. The resulting high purity nitrogen then
feeds a buffer tank to allow for a continuous
high-pressure output. The high purity nitrogen
stream passes through a final filter to ensure
the delivery of pure, sterile nitrogen.
The hollow fiber membrane system uses
compressed air that is directed through the
bore of a membrane tube. The smaller and
more soluble oxygen and water molecules
pass through the wall of the polymeric
membrane tube thus enriching the nitrogen in
the air stream. Membranes produce nitrogen
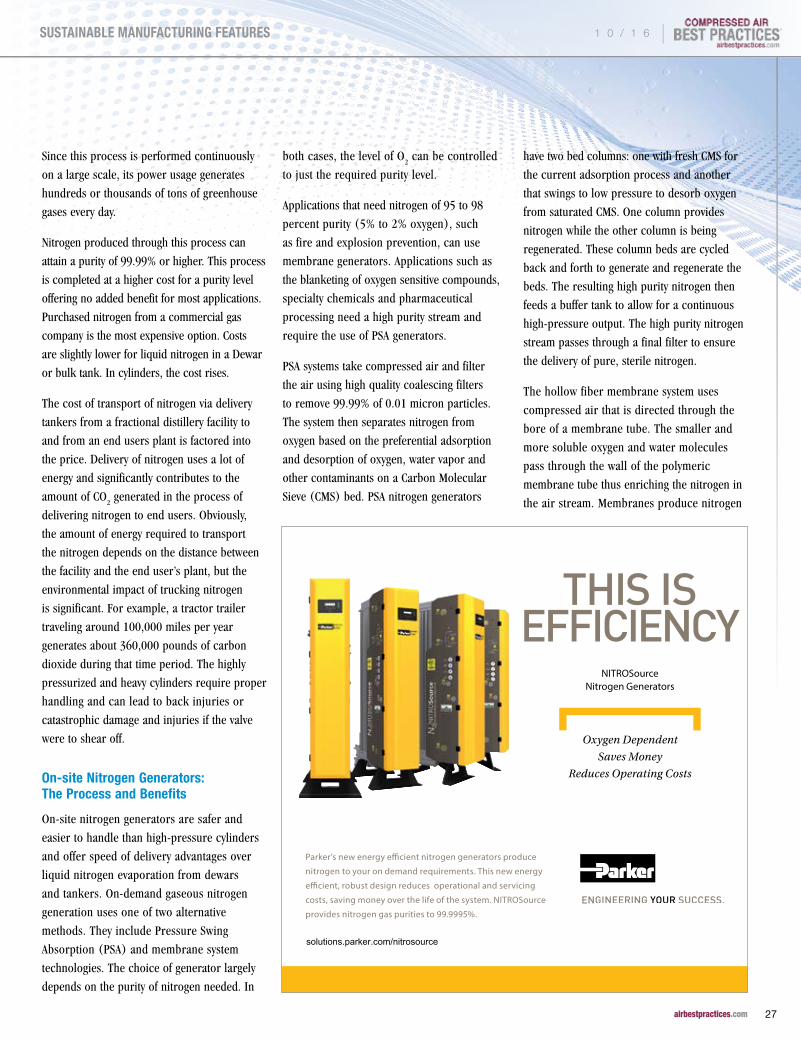
THIS IS EFFICIENCY
Parker’s new energy e�cient nitrogen generators produce
nitrogen to your on demand requirements. This new energy
e�cient, robust design reduces operational and servicing
costs, saving money over the life of the system. NITROSource
provides nitrogen gas purities to 99.9995%.
Oxygen Dependent
Saves Money
Reduces Operating Costs
NITROSourceNitrogen Generators
solutions.parker.com/nitrosource
1 0 / 1 6 |
27 airbestpractices.com
SUSTAINABLE MANUFACTURING FEATURES

SELECTING PURITY LEVELS WITH ONSITE NITROGEN GENERATORS
in a continuous process assuring constant
downstream purity. Like the PSA system, the
nitrogen-enriched gas stream passes through
a final filter to ensure the delivery of pure,
sterile nitrogen.
Purity Specified in Industrial Applications
Although on site nitrogen generation can
produce N2 purities of up to 99.999%,
users can realize significant financial and
energy savings if they match the purity of
the nitrogen to the purity required by the
application. Indeed, for many applications,
a purity of 99.9% or above is not required.
Nitrogen serves to extend shelf life and
preserve flavor, color and aroma in food and beverage products ranging from snack food
packaging, coffee packaging and wine bottling.
A purity level between 98-99.5% is specified
for most products. Packaging of many products
is filled with nitrogen, an odorless and tasteless
addition. Products can undergo longer
shipping distances without a loss of flavor
when the oxygen is replaced with nitrogen in
the packaging. Nitrogen is occasionally mixed
with CO2 or small amounts of O
2 to create
a modified atmosphere packaging to inhibit
specific bacterial growth in meats, fish or
poultry. Other products, such as edible oils
are blanketed with nitrogen to prevent oxygen
from inducing rancidity. In wine production,
nitrogen is used both in the blanketing of the
fermenting stock and in bottling. Bottles are
purged with nitrogen, filled with wine and
topped with more nitrogen before corked.
The metals industry values nitrogen for a wide
variety of purposes. In aluminum degassing,
the molten metal is sparged with nitrogen,
pushing out hydrogen which can cause gaseous
occlusions. In aluminum extrusion, the inert
nitrogen prevents the formation of oxides.
Laser cutting employs nitrogen to blow off
dross and minimize oxidation at the cut, while
Parker dh Multibank Nitrogen Generators at a Coffee Packager
| 1 0 / 1 6
28 airbestpractices.com
SUSTAINABLE MANUFACTURING FEATURES
a laser bellow is purged so the dust is removed
from the mirrors and H2O and CO
2 is cleared,
preventing the absorption of laser energy and
blurring the cut. Heat treating metal needs an
inert atmosphere such as nitrogen. Purities
range from 97% for aluminum degassing
to 99.5% or higher for heat treating and
aluminum extrusion. For laser cutting,
purities of nitrogen can be as low as 99.95%
or lower depending on the material and
thickness being cut.
Oil and gas and the petrochemical industries face safety concerns, well served by
the inert properties of nitrogen. Levels of purity
in these industries are usually between 95-99%.
Fire prevention and explosion blanketing
successfully removes the oxygen with the
introduction of nitrogen. Chemical tanks are
often blanketed with nitrogen to prevent fire or
explosion. In upstream and midstream areas of
the oil and gas industry there are multiple uses,
from the cleaning and inspection of pipes to
the pressurization of riser tensioners, used to
maintain stability in a floating or tethered rig.
Within a pipeline, gas seal turbines are often
sealed using a cushion of nitrogen. The nitrogen
prevents natural gas leakage and suppresses the
risk of fire should any slight leak occur.
The pharmaceutical industry relies on the
inert properties of nitrogen to assure safety
and sterility in the chemicals and packaging,
with an average purity level of 97-99.99%.
In product transfer, nitrogen is used to
purge receptacles to eliminate contamination.
Chemical blanketing, with nitrogen, assists with
the stability of the final pharmaceutical product.
Sealed packaging is infused with nitrogen
to maintain freshness of the drugs. Deionized
water, used throughout pharmaceutical
processes, is blanketed to assure a constant pH
by preventing exposure to CO2.
The development of plastics requires both the
low dewpoint drying and inert properties of
nitrogen for molding and extrusion processes.
Nitrogen purities range from 95-99.5% in
this industry. In injection molding, purging
of the pellet hoppers and the prevention of
carburization on the screw is achieved with
nitrogen introduction. In gas-assist injection
molding, pressurized nitrogen assists in
packing out the part and eliminates shrinkage.
Blown film extrusion uses nitrogen for both
purging and spray drying products.
The Power generation industry is highly
safety and maintenance conscious. Nitrogen
assists in removing oxygen and preventing
corrosion. During boiler cycling, the proper
layup of the Heat Recovery Steam Generator
(HRSG) includes nitrogen to avoid corrosion
and pitting of the boiler, following ASME
guidelines. A boiler that has been powered
down is both blanketed and sparged with
nitrogen to prevent corrosion. Nitrogen is often
used to blanket and sparge demineralized
water tanks to prevent CO2 contamination
of demineralized water. Purging natural gas
lines with nitrogen allows repairs or valve
installations without fire concerns. Across the
field of power generation, nitrogen purity is
usually between 95-98%, with up to 99.6%
in boiler layup.
In the Electronics Assembly industry,
nitrogen is used to keep solder clean and soot
free especially in the selective solder and wave
solder processes. Purities in this industry can
be as high as 99.999%
Other applications for nitrogen use are
in diverse fields where its inert properties
and purging of oxygen is needed. Coal or
other mines can be partitioned off and filled
with nitrogen to purge oxygen and prevent
explosions. Automotive paint blanketing
PUSHING THE ENVELOPE OF COMPRESSOR PERFORMANCE
• Innovative and Patented Technology• Customized On-Site Lubricant Training• Expert Lab Service
®
Join Us. Become a Distributor.Learn more • www.compresyn.com/distributor
®
INDUSTRIAL SYNTHETICHD
1 0 / 1 6 |
29 airbestpractices.com
SUSTAINABLE MANUFACTURING FEATURES
SELECTING PURITY LEVELS WITH ONSITE NITROGEN GENERATORS
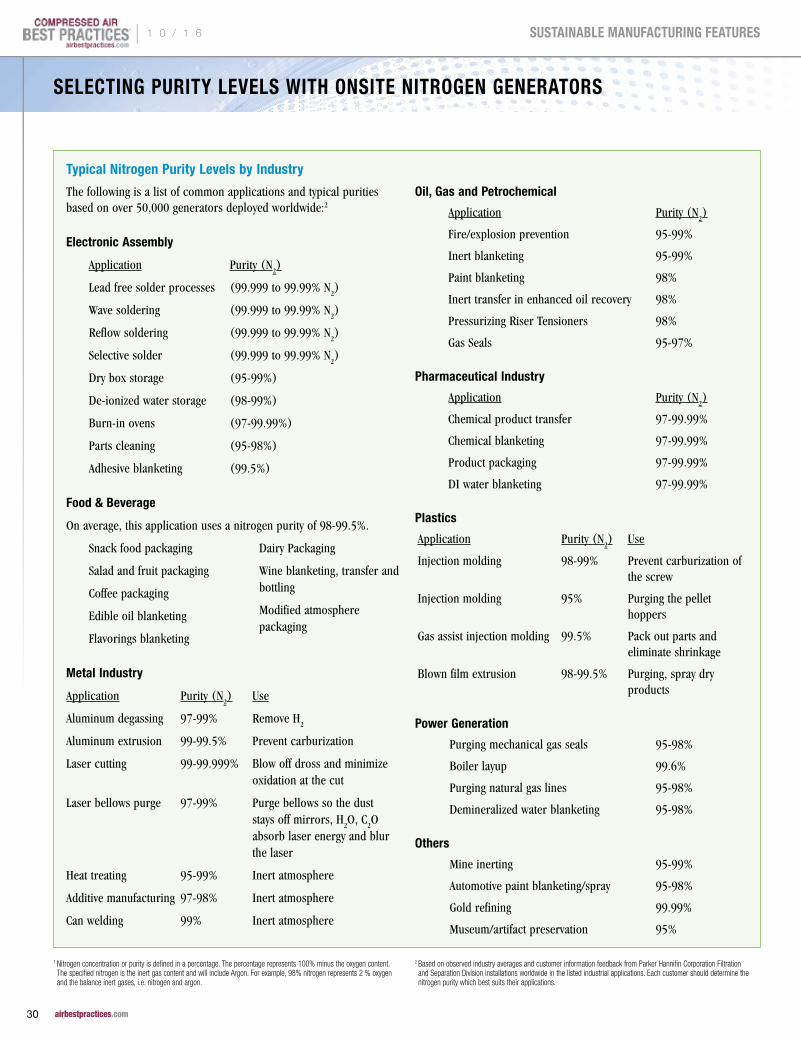
Typical Nitrogen Purity Levels by Industry
The following is a list of common applications and typical purities based on over 50,000 generators deployed worldwide:2
Electronic Assembly
Application Purity (N2)
Lead free solder processes (99.999 to 99.99% N2)
Wave soldering (99.999 to 99.99% N2)
Reflow soldering (99.999 to 99.99% N2)
Selective solder (99.999 to 99.99% N2)
Dry box storage (95-99%)
De-ionized water storage (98-99%)
Burn-in ovens (97-99.99%)
Parts cleaning (95-98%)
Adhesive blanketing (99.5%)
Food & Beverage
On average, this application uses a nitrogen purity of 98-99.5%.
Snack food packaging
Salad and fruit packaging
Coffee packaging
Edible oil blanketing
Flavorings blanketing
Dairy Packaging
Wine blanketing, transfer and bottling
Modified atmosphere packaging
Metal Industry
Application Purity (N2) Use
Aluminum degassing 97-99% Remove H2
Aluminum extrusion 99-99.5% Prevent carburization
Laser cutting 99-99.999% Blow off dross and minimize oxidation at the cut
Laser bellows purge 97-99% Purge bellows so the dust stays off mirrors, H
2O, C
2O
absorb laser energy and blur the laser
Heat treating 95-99% Inert atmosphere
Additive manufacturing 97-98% Inert atmosphere
Can welding 99% Inert atmosphere
Oil, Gas and Petrochemical
Application Purity (N2)
Fire/explosion prevention 95-99%
Inert blanketing 95-99%
Paint blanketing 98%
Inert transfer in enhanced oil recovery 98%
Pressurizing Riser Tensioners 98%
Gas Seals 95-97%
Pharmaceutical Industry
Application Purity (N2)
Chemical product transfer 97-99.99%
Chemical blanketing 97-99.99%
Product packaging 97-99.99%
DI water blanketing 97-99.99%
Plastics
Application Purity (N2) Use
Injection molding 98-99% Prevent carburization of the screw
Injection molding 95% Purging the pellet hoppers
Gas assist injection molding 99.5% Pack out parts and eliminate shrinkage
Blown film extrusion 98-99.5% Purging, spray dry products
Power Generation
Purging mechanical gas seals 95-98%
Boiler layup 99.6%
Purging natural gas lines 95-98%
Demineralized water blanketing 95-98%
Others
Mine inerting 95-99%
Automotive paint blanketing/spray 95-98%
Gold refining 99.99%
Museum/artifact preservation 95%
1 Nitrogen concentration or purity is defined in a percentage. The percentage represents 100% minus the oxygen content. The specified nitrogen is the inert gas content and will include Argon. For example, 98% nitrogen represents 2 % oxygen and the balance inert gases, i.e. nitrogen and argon.
2 Based on observed industry averages and customer information feedback from Parker Hannifin Corporation Filtration and Separation Division installations worldwide in the listed industrial applications. Each customer should determine the nitrogen purity which best suits their applications.
| 1 0 / 1 6
30 airbestpractices.com
SUSTAINABLE MANUFACTURING FEATURES

and paint spraying with nitrogen speeds
drying and improves product finish. Museum
artifacts and antiquities are often stored in a
nitrogen atmosphere to preserve and protect
their surfaces.
Conclusion
In the majority of industrial applications,
a nitrogen purity of 99.9% or above is not
needed to achieve the benefits nitrogen
provides. Specifying a purity of that level may
unnecessarily add to the cost of production,
and the amount of energy needed to create
and transport the nitrogen which impacts
CO2 emissions. In the purchase of bulk
nitrogen, manufacturers must consider
safety in handling cylinders, the potential of
delivery delays, additional truck traffic to and
from the manufacturing site, as well as the
environmental impact.
On-site PSA and membrane systems are energy
efficient and cost effective, requiring only
enough energy to power the air compressor
that supplies air to the system. Gas industry
sources indicate that an air separation plant
uses 1976 kJ of electricity per kilogram of
nitrogen at 99.9% purities. At a purity of 98
percent, the energy required for in-house
nitrogen consumes 62 percent less energy. Even
for those applications requiring 99.9% purity,
generating nitrogen in-house on-demand with a
PSA system will use 28 percent less electrically
compared to third-party supplied bulk nitrogen.
The elevated and constant use of electricity
in air separation plants and trucking to end
user customers adds more greenhouse gases
to the atmosphere than on-demand nitrogen
generation. By eliminating the need for a
third party facility to generate nitrogen, and
transport it to a user’s site, the entire carbon
footprint required to supply nitrogen to the
plant is reduced.
For more information contact David Connaughton, Product Sales Manager, Parker Hannifin, Gas Separation and Filtration Division, email: [email protected], tel: 978-478-2760
To read more Nitrogen Generation Technology articles, please visit http://www.airbestpractices.com/
technology/air-treatment
Parker NITROSource nitrogen generators
FREESUBSCRIPTIONDIGITAL EDITION FREE WORLDWIDE PRINT EDITION FREE TO U.S. SUBSCRIBERS
Subscribe at blowervacuumbestpractices.com
EVERY ISSUE CONTAINS BEST PRACTICES FOR:
Industrial Vacuum
Vacuum Generation
Industrial & Aeration Blowers
Blow-Off Air
1 0 / 1 6 |
31 airbestpractices.com
SUSTAINABLE MANUFACTURING FEATURES

Energy Management CONSIDERATIONS WITH
TODAY’S DRIVE SYSTEMSBy Michael Perlman, Marketing Programs Manager, Siemens Industry
cpIntroduction
While it is valid to state that energy efficiency is defined as the same
level of production being achieved at an overall lower energy cost,
it is equally important for today’s machine builders and automation
engineers alike to remember than an energy-efficient system can
actually translate into higher productivity. This is achievable through
a comprehensive approach to energy management.
It is a fact that most of the energy loss in a system occurs in three
areas, namely, the generation, distribution and conversion of energy
into useful work, the last being accomplished through heat exchangers,
“An energy-efficient system can actually translate into higher productivity. This is achievable through a comprehensive approach to energy management.”
— Michael Perlman, Marketing Programs Manager, Siemens Industry
| 1 0 / 1 6
32 airbestpractices.com
SUSTAINABLE MANUFACTURING FEATURES
pumps, motors and drives. This paper will concentrate on the last
product group.
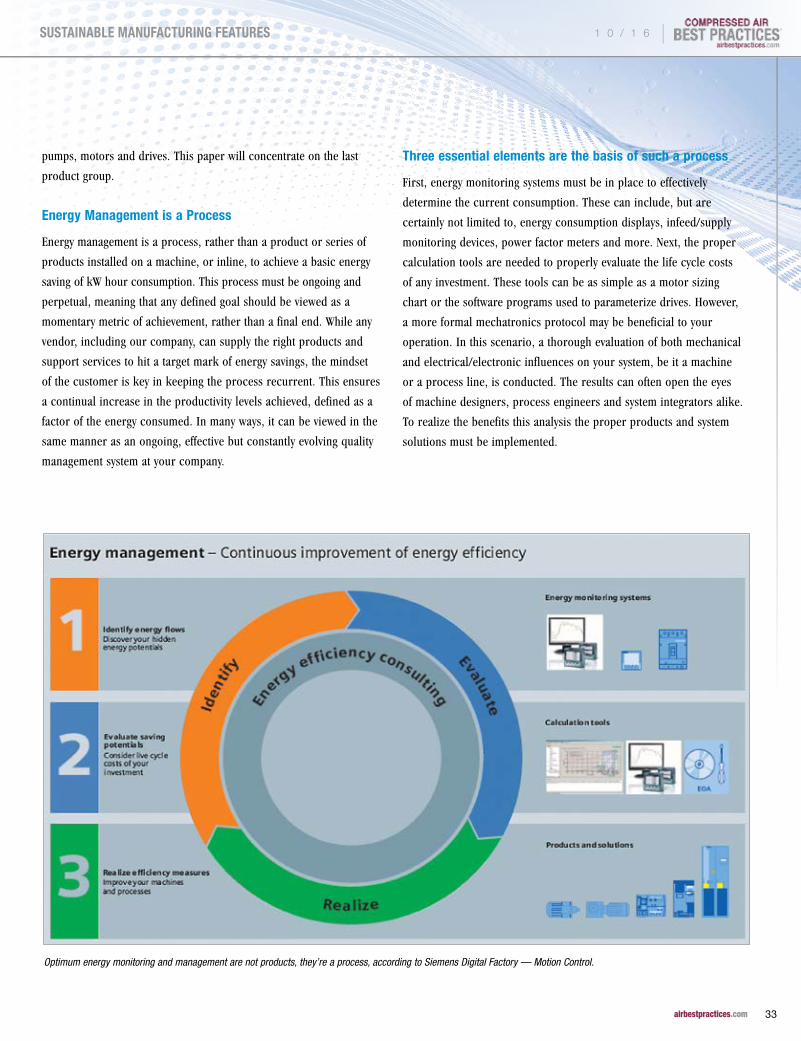
Energy Management is a Process
Energy management is a process, rather than a product or series of
products installed on a machine, or inline, to achieve a basic energy
saving of kW hour consumption. This process must be ongoing and
perpetual, meaning that any defined goal should be viewed as a
momentary metric of achievement, rather than a final end. While any
vendor, including our company, can supply the right products and
support services to hit a target mark of energy savings, the mindset
of the customer is key in keeping the process recurrent. This ensures
a continual increase in the productivity levels achieved, defined as a
factor of the energy consumed. In many ways, it can be viewed in the
same manner as an ongoing, effective but constantly evolving quality
management system at your company.
Three essential elements are the basis of such a process
First, energy monitoring systems must be in place to effectively
determine the current consumption. These can include, but are
certainly not limited to, energy consumption displays, infeed/supply
monitoring devices, power factor meters and more. Next, the proper
calculation tools are needed to properly evaluate the life cycle costs
of any investment. These tools can be as simple as a motor sizing
chart or the software programs used to parameterize drives. However,
a more formal mechatronics protocol may be beneficial to your
operation. In this scenario, a thorough evaluation of both mechanical
and electrical/electronic influences on your system, be it a machine
or a process line, is conducted. The results can often open the eyes
of machine designers, process engineers and system integrators alike.
To realize the benefits this analysis the proper products and system
solutions must be implemented.
Optimum energy monitoring and management are not products, they’re a process, according to Siemens Digital Factory — Motion Control.
1 0 / 1 6 |
33 airbestpractices.com
SUSTAINABLE MANUFACTURING FEATURES

ENERGY MANAGEMENT CONSIDERATIONS WITH TODAY’S DRIVE SYSTEMS
This is where a competent supplier can be an effective partner for
your operation. For example, the solution you need might involve a
vector drive that utilizes an energy optimization function to enhance
the efficiency of the motor during partial load operations. In a system
with multiple motors, energy savings might be realized to a substantial
degree by the use of a drive unit with a common DC bus. The designer
can also select the most appropriate infeed solution for the machine,
pump or process operation, given the particulars of performance
and required output. This may include an appropriately sized infeed
unit with regenerative capability, the ability to put unused or braking
energy back on the incoming power line.
Some applications may allow the use of high efficiency standard
induction motors and, in the process, realize a potential savings
of 1-3%. The use of frequency converters (VFD) for speed control
might raise this to an 8-10% savings.
Optimizing your entire system through mechatronic analysis of the
machine or process design, can result in a potential savings of 15-
20% by the avoidance of over dimensioning of motors, plus partial
load optimization by means of energy-related flow control. This
analysis may also point to the ability to use controlled energy infeed
and recovery.
In order to determine the true efficiency of any drive system, it is
necessary to demonstrate the amount of energy required by its power
components and a corresponding examination of how the system uses
energy. How different drive concepts used on the same system under
identical power load must also be considered. This latter exercise
| 1 0 / 1 6
34 airbestpractices.com
SUSTAINABLE MANUFACTURING FEATURES

might look into partial load efficiencies with various motor and drive
combinations, straight comparisons between synchronous servo vs.
asynchronous induction motors or direct drive vs. motor/gearbox
combinations, drives with braking components vs. regenerative drive
technology, as well as solutions with single vs. multi-drive, common
DC bus solutions.
A corollary to this discussion should also include a review of potential
hydraulic/pneumatic component change outs in certain applications
where replacement with an integrated package of motion control
and PLC technology might better resolve closed loop pressure control
of axes, for example. Fewer components and their related power
consumption can lead to overall system productivity improvements, as
well as ongoing enhanced energy efficiencies. Reduced programming,
diagnostic and commissioning times can also flow from such an
approach, providing even more opportunities for overall machine
or process improvements. Tracking the energy efficiency of such
a system may seem problematic at first, but here again today’s
sophisticated mechatronic and virtual production protocols can be
utilized to validate the real-world performance characteristics of such
designs, far in advance of their implementation.
As the emergence of new technologies has impacted many of the
products used in energy-efficient systems, it is equally important to
take a more holistic look at operational sequences and the overall
integration scheme when designing, retrofitting or rebuilding for
improved energy utilization.
For more information contact Michael Perlman, Marketing Programs Manager, Motion Control Business, Siemens Industry, Inc., Email: [email protected]
Website: http://www.usa.siemens.com/motioncontrol
Michael Perlman – Bio Michael Perlman is the Marketing Programs Manager for the Motion Control business of Siemens Industry, Inc. In this role, he oversees the technical marketing for products including SINAMICS intelligent drives and SIMOTION motion controllers. Michael has over 20 years of experience in plant and corporate automation engineering at a number of Fortune 100 manufacturers including Kraft Foods, General Mills and Masterfoods (Mars). He received a Bachelors of Electrical Engineering from the Georgia Institute of Technology and an MBA from SUNY Buffalo.
To read similar Energy Management articles, please visit http://www.airbestpractices.com/energy-manager
Designing for 8 to 1 Aeration
Blower Turndown
Join Keynote Speaker, Tom Jenkins, President of JenTech Inc., to review aeration blower systems, designed around the goal of achieving 8 to 1 turndown, using four blowers at 50%, 50%, 25% and 25% of design load.
According to the U.S. Environmental Protection Agency (EPA), wastewater treatment plants consume 56 billion kWh totaling nearly $3 billion per year -equal to almost 3 percent of total power usage in the United States. Aeration blowers, in a typical biological wastewater treatment plant, can account for 50 to 70 percent of the facility’s energy use. This webinar will explain the rationale behind the 8 to 1 turndown design target and provide aeration blower system design calculation examples.
Our Sponsor Speaker is Stephen Horne, Blower Product Manager from Kaeser Compressors, whose presentation is titled, Evaluating Blower Flow and Specific Power Performance. This presentation will cover how total package data is needed to understand a blower’s true efficiency and review testing standards for evaluating blower performance.
Register for Free Today at blowervacuumbestpractices.com/magazine/webinars
October 27, 2016 – 2:00 PM EST
Proudly Presenting the 2016 Expert Webinar Series
SPONSORED BY:
Tom Jenkins has over 30 years of experience with aeration blowers and blower controls.
Stephen Horne is the Blower Product Manager for Kaeser Compressors.
1 0 / 1 6 |
35 airbestpractices.com
SUSTAINABLE MANUFACTURING FEATURES

NEW CSA C837-16 COMPRESSED AIR
EFFICIENCY STANDARD
By Ron Marshall for the Compressed Air Challenge®
cpIntroduction
After almost three and a half years of
development work the Canadian Standards
Association C837-16 document “Monitoring
and Energy Performance of Compressed Air
Systems” has finally been published and is
available for download. The work in writing
the document was done by a CSA Technical
Subcommittee made up of personnel from
power utilities and government organizations,
compressed air manufacturers and end
users from both USA and Canada, with
the committee activities facilitated and
coordinated by the CSA Group (see list of
committee members).
The project was started and championed
by Quebec Hydro, a Canadian power utility
as a result of challenges being faced in the
compressed air industry with regard to
performance measurement. Problems were
being encountered with inconsistency of
reporting of system energy readings. The
utility requested CSA Technical Committee
T402 (Technical Committee on Industrial
Equipment) to initiate work to solve these
challenges. Therefore, a new subcommittee
was created to work on a standard starting
in the Fall of 2012.
What is the standard all about?
The introduction of the standard defines the
reason it was developed and its subject matter
(used with permission):
“Historically, there has been a lack of consistency in the methods used to determine the energy performance of compressed air systems. This often makes it difficult for stakeholders to make informed decisions concerning
energy efficiency. This lack of consistent information complicates the task of ensuring any existing, new, or optimized system is operating efficiently.
This Standard specifies which information is to be gathered and how system parameters like power, energy, flow, pressure, and production output are to be measured or calculated using transparent, uniform, validated, repeatable, and consistent methods of measurement.
This standard provides guidance in defining methodologies for establishing energy performance indicators (EnPIs) and energy baselines (EnBs) to be used as part of an overall energy management system (EnMS) or other related purposes. For compressed air systems, specific requirements outlining a consistent methodology for measuring, estimating, and reporting the energy performance are provided.
The intent of this Standard is to align with the requirements of ISO 50006, Energy management systems — Measuring energy performance using energy baselines (EnB) and energy
| 1 0 / 1 6
36 airbestpractices.com
SUSTAINABLE MANUFACTURING FEATURES

Join Compressed Air Challenge for the next session of
Fundamentals of Compressed Air Systems WE
(web-edition) coming soon. Led by our experienced
instructors, this web-based version of the popular
Fundamentals of Compressed Air Systems training uses
an interactive format that enables the instructor to diagram
examples, give pop quizzes and answer student questions
in real time. Participation is limited to 25 students. Please
visit www.compressedairchallenge.org, to access online
registration and for more information about the training.
If you have additional questions about the new web-based
training or other CAC training opportunities, please contact
the CAC at [email protected]
Fundamentals of Compressed Air Systems WE (web-edition)
performance indicators (EnPI) — General principles and guidance, adapted for compressed air system.
This Standard is not intended as a replacement for a compressed air system energy efficiency assessment (audit) as defined by other Standards, such as ISO 11011, nor does it specify measures that can be used to improve the energy efficiency of a compressed air system.
Scope 1.1 Inclusions This Standard is intended to be used for compressed air systems with the following characteristics:
a) electrically driven three-phase air compressors equal to or greater than 5 horsepower;
b) positive displacement stationary air compressors and associated equipment;
c) operating pressures between 2.5 and 17 bar(g) (36 and 250 psi(g)); and
d) industrial and commercial applications of compressed air.
1.2 Exclusions The Standard is not intended to be used for the following purposes or systems:
a) electrically driven single phase compressors;
b) bench testing, measurement, or certification of the performance of an air compressor;
c) measurement of heat recovery;”
Figure 1: The standard defines a number of Energy Performance Indicators (EnPI’s) and guides the reader how to compare a specified baseline period with any reporting period (Source CSA C837-16).
1 0 / 1 6 |
37 airbestpractices.com
SUSTAINABLE MANUFACTURING FEATURES

NEW CSA C837-16 COMPRESSED AIR EFFICIENCY STANDARD
form knowledge
finish strong
weld relationships
fabricate solutions
CONNECT WITH US!
November 16–18, 2016Las Vegas, NVfabtechexpo.com
FABTECH 2016 will provide the strategies and insight needed to hone your competitive edge for improved quality, productivity and profitability. Come to broaden your perspective and experience the future of manufacturing through live product demonstrations, top-notch education programs and networking opportunities. You’ll discover the tools for solving today’s challenges and sharpen your skills to take on tomorrow.
Visit fabtechexpo.com for complete details. Register now!
Content of the Standard
The standard has a list of reference
publications for the guidance of the reader and
provides definitions used to clarify important
terms and phrases mentioned in the body
of the work. General explanation of how to
measure and quantify Energy Performance
by defining Indicators (EnPIs) and Energy
Baselines (EnBs) pertaining to compressed air
systems are described (Figure 1). A process
flow is defined (Figure 2) to guide the reader
in the general steps to take to perform the
required measurements, calculations and
comparisons. Key to the process is creating
an energy baseline as a starting point to be
used to compare subsequent measurement
periods in which the system may have changed.
Changes to the energy performance indicators
can, for example, show changes to the
system as a result of energy efficiency projects.
These measurements can be used by the user,
perhaps a power utility energy program or a
plant manager, to quantify the improvement
to the energy performance of the system.
This might feed into the overall performance
totals of an energy program. Important to this
process is the ongoing continuous consistent
measurement and comparison of the system
to ensure energy savings are sustained and that
the system is operating normally.
With any measurement there must be a
defined measurement boundary so the energy
baseline and additional measurement periods
can be apples-to-apples comparisons. In
any complex system there are a number of
choices for measurement, often these are
dictated by what is physically possible or
economical to undertake. Once the boundary
is defined all the energy inputs are identified
for measurement, as well as the compressed
air outputs.
Some static factors are identified that are
important to the measurement process but
do not routinely change over time. These could
be product type in an industrial plant, the
number of shifts per day, the floor area of the
plant, the typical system pressure and other
factors. Some conditions are identified that
might change these static factors into relevant
variables, such as changing the operating
hours of a plant.
Guidance is given to the reader in determining
a suitable baseline and reporting periods for
the comparison process. General discussion
is included about the data collection,
such as how to measure, data collection
frequency, data quality, and the calculation
and comparison of energy baselines. Some
discussion is given to normalizing the data,
this would be necessary if something has
changed between the time the baseline has
been captured and the recent measurements
are done. For example, a factory might change
their production process and/or start a third
shift. In this case the energy performance
indicators might need to be normalized
(adjusted) for a fair comparison.
The standard recognizes the fact that the size
of the system and the comparison of the total
system energy consumption to the total facility
consumption might determine the complexity
of the methods used to measure and calculate
EnPIs. Thus simple and inexpensive Level
1 measurement methods might be used
for small systems that make up a small
percentage of the total load. If a system is
large and consumes a significant portion of
the total load then it may be worthwhile to
Figure 2: The standard provides definitions and recommended actions on how to determine an energy baseline. (Source CSA C837-16)
Learn more about optimizing compressed air systems
This 325 page manual begins with the considerations for analyzing existing systems or designing new ones, and continues through the compressor supply to the auxiliary equipment and distribution system to the end uses. Learn more about air quality, air dryers and the maintenance aspects of compressed air systems. Learn how to use measurements to audit your own system, calculate the cost of compressed air and even how to interpret utility electric bills. Best practice recommendations for selection, installation, maintenance and operation of all the equipment and components within the compressed air system are in bold font and are easily selected from each section.
Best Practices for Compressed Air Systems Second
Edition
| 1 0 / 1 6
38 airbestpractices.com
SUSTAINABLE MANUFACTURING FEATURES

form knowledge
finish strong
weld relationships
fabricate solutions
CONNECT WITH US!
November 16–18, 2016Las Vegas, NVfabtechexpo.com
FABTECH 2016 will provide the strategies and insight needed to hone your competitive edge for improved quality, productivity and profitability. Come to broaden your perspective and experience the future of manufacturing through live product demonstrations, top-notch education programs and networking opportunities. You’ll discover the tools for solving today’s challenges and sharpen your skills to take on tomorrow.
Visit fabtechexpo.com for complete details. Register now!

NEW CSA C837-16 COMPRESSED AIR EFFICIENCY STANDARD
fully instrument the system and continuously
monitor the EnPIs with Level 3 accuracy.
Energy Performance Indicators
The standard defines two EnPIs as mandatory
in development of any baseline. These are
system specific power (SSP) and total energy
consumption (TEC). Optional indicators are
specific energy consumption (SEC) and portion
of non-productive usage (PNPU). These are
defined as follows:
pp SSP – Average kW sent into the measurement boundary divided by average flow coming out x 100, during the measurement period. An output of this might be average kW per 100 cfm. This is an indicator of how efficiently the compressed air is being produced.
pp TEC – Total kWh consumed within the measurement boundary in the specific measurement period. This can be an indicator of compressor efficiency and also how much air is being produced.
pp SEC – Total kWh consumed divided by a user defined and specified production unit. Often this is could be the number of product units produced or the weight of a product. This tracks how the system energy consumption varies with product output.
pp PNPU – An estimate of the percentage of non-productive compressed air flow crossing the measurement boundary compared to the average flow measured within the measurement period. In some plants this might be readily measured during regular production downtime during weekends. In others some special testing might be required. In the majority of the plants this would be an indicator of leakage and system waste.
These energy performance indicators are
dependent on system pressure, therefore the
standard dictates pressure should always be
measured at the same time.
Parameters to be Measured
The standard identifies five parameters
to be measured or estimated in various
specified ways as inputs to the EnPIs.
These measurements would be taken on all
equipment inside the measurement boundary:
pp Power
pp Flow
pp Pressure
pp Energy
pp Production output
The standard recognizes that measuring
these parameters is sometimes costly and
impractical, especially if the system is a
small part of the total plant load, so three
different measurement levels are identified.
Level 1 might be the simplest spot check
measurements, Level 2 more complex
estimates based on defined more complicated
measurement and calculation methods, or
Level 3 more complex and expensive direct
measurements of the parameters using
accurate meters designed for that purpose. The
standard discusses various ways of determining
these parameters for guidance of the user,
depending on the characteristics of their
system and what is possible. Some examples
might be calculating flow using a stopwatch
test of a load/unload compressor at various
intervals throughout the day, this might be at
level 1 accuracy. The parameters might also be
estimated based on the output of each system
controller and the rated power and flow of
the compressors, such as done when using
runtime hour meters. Or actual flow meters
and kWh meters might be installed either on a
temporary basis or permanently to measure the
parameters at Level 3.
A discussion of various methods of
measurement and calculation is provided in
the standard. These include calculating three Figure 3: For this sample system a number of system boundaries could be selected depending on the needs of the user (Source CSA C837-16).
| 1 0 / 1 6
40 airbestpractices.com
SUSTAINABLE MANUFACTURING FEATURES
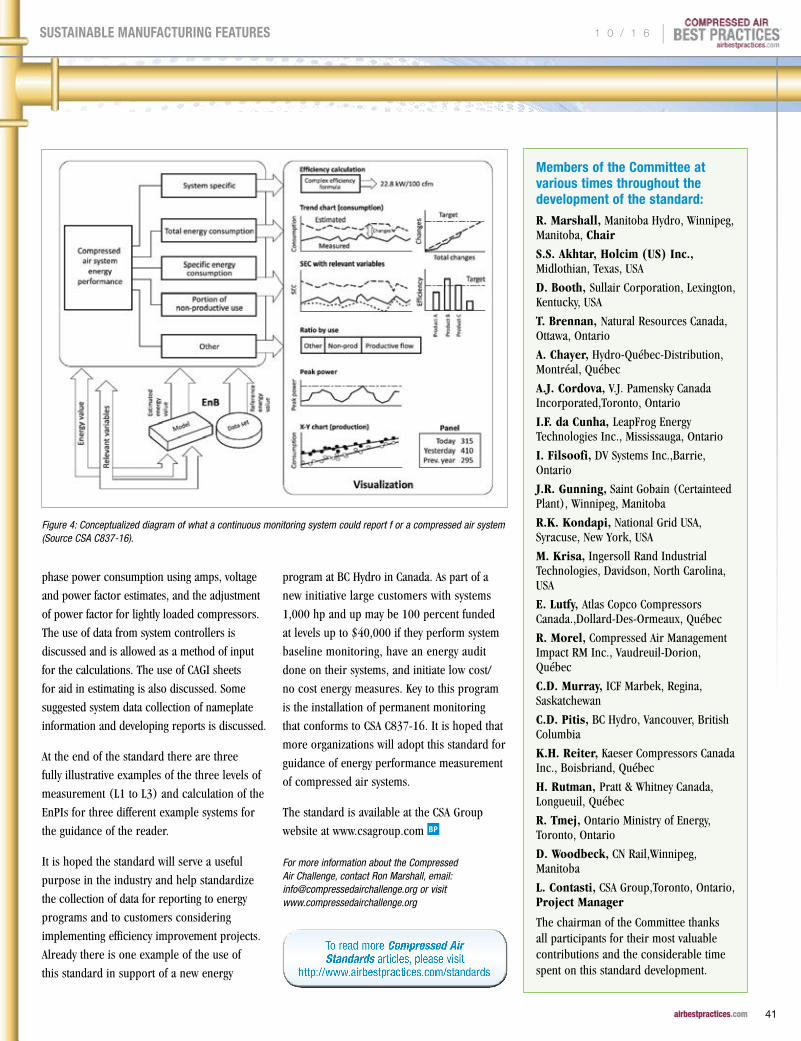
NEW CSA C837-16 COMPRESSED AIR EFFICIENCY STANDARD
phase power consumption using amps, voltage
and power factor estimates, and the adjustment
of power factor for lightly loaded compressors.
The use of data from system controllers is
discussed and is allowed as a method of input
for the calculations. The use of CAGI sheets
for aid in estimating is also discussed. Some
suggested system data collection of nameplate
information and developing reports is discussed.
At the end of the standard there are three
fully illustrative examples of the three levels of
measurement (L1 to L3) and calculation of the
EnPIs for three different example systems for
the guidance of the reader.
It is hoped the standard will serve a useful
purpose in the industry and help standardize
the collection of data for reporting to energy
programs and to customers considering
implementing efficiency improvement projects.
Already there is one example of the use of
this standard in support of a new energy
program at BC Hydro in Canada. As part of a
new initiative large customers with systems
1,000 hp and up may be 100 percent funded
at levels up to $40,000 if they perform system
baseline monitoring, have an energy audit
done on their systems, and initiate low cost/
no cost energy measures. Key to this program
is the installation of permanent monitoring
that conforms to CSA C837-16. It is hoped that
more organizations will adopt this standard for
guidance of energy performance measurement
of compressed air systems.
The standard is available at the CSA Group
website at www.csagroup.com
For more information about the Compressed Air Challenge, contact Ron Marshall, email: [email protected] or visit www.compressedairchallenge.org
Figure 4: Conceptualized diagram of what a continuous monitoring system could report f or a compressed air system (Source CSA C837-16).
To read more Compressed Air Standards articles, please visit
http://www.airbestpractices.com/standards
Members of the Committee at various times throughout the development of the standard:R. Marshall, Manitoba Hydro, Winnipeg, Manitoba, Chair
S.S. Akhtar, Holcim (US) Inc., Midlothian, Texas, USA
D. Booth, Sullair Corporation, Lexington, Kentucky, USA
T. Brennan, Natural Resources Canada, Ottawa, Ontario
A. Chayer, Hydro-Québec-Distribution, Montréal, Québec
A.J. Cordova, V.J. Pamensky Canada Incorporated,Toronto, Ontario
I.F. da Cunha, LeapFrog Energy Technologies Inc., Mississauga, Ontario
I. Filsoofi, DV Systems Inc.,Barrie, Ontario
J.R. Gunning, Saint Gobain (Certainteed Plant), Winnipeg, Manitoba
R.K. Kondapi, National Grid USA, Syracuse, New York, USA
M. Krisa, Ingersoll Rand Industrial Technologies, Davidson, North Carolina, USA
E. Lutfy, Atlas Copco Compressors Canada.,Dollard-Des-Ormeaux, Québec
R. Morel, Compressed Air Management Impact RM Inc., Vaudreuil-Dorion, Québec
C.D. Murray, ICF Marbek, Regina, Saskatchewan
C.D. Pitis, BC Hydro, Vancouver, British Columbia
K.H. Reiter, Kaeser Compressors Canada Inc., Boisbriand, Québec
H. Rutman, Pratt & Whitney Canada, Longueuil, Québec
R. Tmej, Ontario Ministry of Energy, Toronto, Ontario
D. Woodbeck, CN Rail,Winnipeg, Manitoba
L. Contasti, CSA Group,Toronto, Ontario, Project Manager
The chairman of the Committee thanks all participants for their most valuable contributions and the considerable time spent on this standard development.
1 0 / 1 6 |
41 airbestpractices.com
SUSTAINABLE MANUFACTURING FEATURES

Compressed Air Best Practices® is a technical magazine dedicated to discovering Energy Savings in compressed air systems — estimated by the U.S. Department of Energy to represent 30% of industrial energy use. Each edition outlines Best Practice System Assessments for industrial compressed air users — particularly those managing energy costs in multi-factory companies.
“ We’re in 75 to 80 locations. We’ve done literally hundreds of compressed air modifications, changes, upgrades and audits.”
– William Gerald, CEM, Chief Energy Engineer, CalPortland (feature article in August 2015 Issue)
“Compressed air is essential to any manufacturing process, particularly in the automotive industry, and it accounts for about 23 percent of total energy costs at our powertrain facility.”
– Mike Clemmer, Director/Plant Manager-Paint & Plastics, Nissan North America (feature article in October 2015 Issue)
“Demand Side” and “Supply Side” information on compressed air technologies and system assessments is delivered to readers to help them save energy. For this reason, we feature Best Practice articles on when/how to correctly apply air compressor, air treatment, piping, storage, measurement and pneumatic control technology.
Industrial energy managers, utility incentive program managers, and technology/system assessment providers are the three stakeholders in creating energy efficiency projects. Representatives of these readership groups guide our editorial content.
“Each of our 10 production plants has an Energy Coordinator who is part of the corporate energy team.”
– Michael Jones, Corporate Energy Team Leader, Intertape Polymer Group (feature article in July 2014 Issue)
F R E E S U B S C R I P T I O NDIGITAL EDITION FREE WORLDWIDE | PRINT EDITION FREE TO U.S. SUBSCRIBERS
2016 FOCUS INDUSTRIES!Poultry & Meat Packaging • Plastic Extrusion & Molding • Food Processing & Conveying • Chemical Plants & Refineries • Energy-Efficiency System Assessments
Woodworking • Compressed Air Measurement • Wastewater Aeration • Commercial Bakeries, Snack Foods, Breads • Metal Fabrication & Machining • Air Compressor Controls
Sustainable Energy Savings with Compressed Air Best Practices®
To subscribe visit airbestpractices.com

R E S O U R C E S F O R E N E R G Y E N G I N E E R STECHNOLOGY PICKS
Sullair Introduces New OFS Series Oil Free Air Compressor Line
Sullair has launched a new line of OFS Series Oil Free Air
Compressors, which consists of models in two frame sizes: 100-
200 hp and 250-350 hp. All Sullair OFS Series compressors are
ISO 8573-1 Class 0 certified to ensure oil-free operation and all
are available with Integrated Variable Speed Drive. A variable speed
drive can offer up to 60% turn down from full load to improve
operating efficiency in the right application.
The new OFS Series Oil Free Compressors’ air ends feature rotors
with a high-efficiency asymmetrical profile that are coated with an
FDA-approved food grade PTFE corrosion resistant coating, offering
100% oil free air. The air end design features anti-friction bearings
with an L10 design life of more than 100,000 hours.
The new OFS line also incorporates a robust controller, featuring
a Sullair WS Input/Output module paired with a new user interface
panel. The controller accurately monitors and controls the
compressor; offers built-in sequencing capabilities for automatic
load sharing; and constantly displays essential functions and
applicable alarms on a large back-lit LCD screen. All of these
features and improvements come with a smaller footprint compared
to previous Sullair oil free units.
About Sullair
Since 1965, Sullair has developed and manufactured air compressors
with proven reliability and wear-free durability. Sullair is globally
recognized as a leading manufacturer of portable air compressors,
contractors’ air tools, stationary air compressors, compressed air
treatment equipment and vacuum systems. Additionally, Sullair
provides customers with a full line of aftermarket parts, fluids and
services. Sullair has manufacturing capabilities in Michigan City,
Indiana; Shenzhen and Suzhou, China; Mahindra World City, India;
as well as a JV (IHI-Sullair) based in Suzhou. For more information,
visit www.sullair.com.
About Accudyne
Accudyne Industries is the parent company of Sullair, and a global
provider of precision-engineered, process-critical and technologically
advanced flow control systems and industrial compressors that
deliver consistently high performance and give confidence to the
mission of its customers in the most important industries and
harshest environments around the world. Today, Accudyne is powered
by ~3,000 employees at 15 manufacturing facilities, supporting a
broad range of industries in more than 150 countries. For more
information, visit www.accudyneindustries.com.
The new Sullair OFS Series Oil Free Air Compressor range has models from 100 to 350 hp
1 0 / 1 6 |
43 airbestpractices.com
COLUMNS

Atlas Copco Improves Three GA Series Rotary Screw Air Compressor Models
Atlas Copco has enhanced three air compressors in its popular GA
series. The improved GA 30+, 37 and 45 compressors offer better
performance, lower noise and a smaller footprint. The updated oil-
injected rotary screw compressors are now available worldwide.
The free air delivery (FAD) and specific energy requirement (SER) of
the GA 30+, 37 and 45 have both been improved by 1 percent. Each
model now offers low noise levels down to 65 dB(a) for extremely
quiet operation. The new GA 30+, 37 and 45 provide 30 percent
smaller footprints than previous editions; the 60 hp version has a
footprint as small as 52 inches long and 35 inches wide. The low
noise levels and reduced size make it possible to install units on the
work floor, sharply reducing the energy consumption of transporting
compressed air to the point of use.
“At Atlas Copco, we are always finding new ways to further advance
our world-class products,” said Alfred Piccolo, vice president of sales
and marketing with Atlas Copco Compressors. “The updated GA 30+,
37 and 45 represent our commitment to bringing customers the best
technology to support their applications.”
The GA30+, 37, and 45 are integrated packages with built-in
refrigerant dryers. Each comes with an Elektronikon® controller
and SMARTLINK® technology for remote monitoring. Due to their
strong performance and durability, these compressors can be used
in a variety of industrial applications, and in harsh environmental
conditions and high ambient temperatures.
For more information, please visit http://www.atlascopco.us/usus/products/air-and-gas-compressors/product/1512842/
Atlas Copco is a world-leading provider of sustainable productivity
solutions. The Group serves customers with innovative compressors,
vacuum solutions and air treatment systems, construction and mining
equipment, power tools and assembly systems. Atlas Copco develops
products and services
focused on productivity,
energy efficiency, safety and
ergonomics. The company
was founded in 1873,
is based in Stockholm,
Sweden, and has a global
reach spanning more than
180 countries. In 2015,
Atlas Copco had revenues
of BSEK 102 (BEUR 11)
and more than 43,000
employees. Learn more at
www.atlascopco.com
Atlas Copco Compressors LLC is part of the
Compressor Technique Business Area, and its headquarters are
located in Rock Hill, S.C. The company manufactures, markets,
and services oil-free and oil-injected stationary air compressors,
air treatment equipment, and air management systems, including
The improved GA 30+, 37 and 45 air compressors offer better performance, lower noise and a smaller footprint.
RESOURCES FOR ENERGY ENGINEERS
TECHNOLOGY PICKS
| 1 0 / 1 6
44 airbestpractices.com
COLUMNS

local manufacturing of select products. The Atlas Copco Group,
which celebrated its 140th anniversary in 2013, is among the Top
100 sustainable companies in the world and a member of the
Dow Jones World Sustainability Index. Atlas Copco has also been
recognized by Forbes, Thomson-Reuters and Newsweek, among
others, for its commitment to innovation and sustainability. Atlas
Copco Compressors has major sales, manufacturing, production, and
distribution facilities located in California, Illinois, Massachusetts,
North Carolina, South Carolina, and Texas. www.atlascopco.us
ELGI Introduces Airmate Refrigerated Dryers
ELGI Compressors USA, Inc. has introduced their new EGRD Series
Airmate refrigerated dryer line with models from 10 to 2500 cfm.
Dryer units, up to 1100 cfm, are in stock for immediate deliveries
from ELGI’S distribution center in Charlotte, NC. All units are
supported by ELGI’s UPTIME ASSURANCE warranty program.
The EGRD refrigerated dryer product line is built for reliability using
UPTIME components like the unique ALU Module heat exchanger,
a single cast body with cross flow technology and an integrated
moisture separator to maximize efficiency package robustness. The
microprocessor-based
controls are on a visual
LED display providing
online monitoring of dryer
operating conditions,
including pressure dew
point. Other UPTIME
components include high
quality integrated automatic
condensate drains.
EGRD600 and above units
use zero air-loss drains
while EGRD10-500 models
use electronic drain valves
controlled by the dryer’s
microprocessor.
All models use environmentally-friendly refrigerants. EGRD600 and
above models use R-407C with hermetically sealed rotary scroll
refrigeration compressors while EGRD10 - 500 cfm units use R134a.
ELGI Product Manager Grayson Biggins said, “All units feature a
robust and reliable hot gas bypass valve cycle controller designed
to ensure stable pressure dew points by providing quick responses
to changing inlet air temperature conditions.”
To learn more about the new ELGI Airmate EGRD Series refrigerated dryers visit www.ELGI.us
New Ingersoll Rand® R-Series Rotary Screw Air Compressor Models
Ingersoll Rand®, a global leader in compression technologies and
services, has introduced new models to its revolutionary line of
Next Generation R-Series compressors, which incorporate the latest
advancements in variable speed drive (VSD) technology to increase
air flow output by up to 15 percent, reduce energy costs by up to
35 percent and increase system reliability. With the launch of the
RS30n and RS37n VSD models, Ingersoll Rand engineers designed a
streamlined system that maximizes the latest advancements in rotor
dynamics coupled with Totally Enclosed, Fan-Cooled (TEFC) high-
performance motors.
“Faced with high energy costs and an increasing focus on
sustainability goals, plant managers and facility owners are under
extraordinary pressure to reduce costs while improving productivity
and energy efficiency,” says Eric Seidel, vice president of product
management for compression technologies and services at Ingersoll
Rand. “Our Next-Generation R-Series line reduces customers’ energy
footprint. In these models, we’ve combined our state-of-the-art airend
with a VSD to provide exemplary compressor efficiency and durability
to keep plants running optimally.”
At the heart of every Next Generation R-Series compressor is the
airend Ingersoll Rand engineers designed to significantly improve
overall system efficiency by ensuring low pressure drops. It delivers
specific energy output and premier airflow capacity for each
compressor application.
The compressors are designed to withstand harsh plant conditions
and can run continuously in ambient temperatures of up to 115
degrees Fahrenheit. The starter panel meets NEMA 12/IP55 protection
ratings to provide protection against circulating dust, falling dirt and
dripping or splashing liquids.
In addition to matching output based on the demand, the RS30n
and RS37n compressors also decrease energy use during start-up,
A new ELGI Airmate EGRD Series refrigerated dryer for 1100 cfm.
TECHNOLOGY PICKS
1 0 / 1 6 |
45 airbestpractices.com
COLUMNS

RESOURCES FOR ENERGY ENGINEERS
TECHNOLOGY PICKS
Compressed Air Best Practices® (USPS# 17130) is published monthly except January-February combined by Smith Onandia Communications LLC, 37 McMurray Rd., Suite 106, Pittsburgh, PA 15241. Periodicals postage paid at Pittsburgh, PA and additional mailing offices. POSTMASTER: Send address changes to: Compressed Air Best Practices®, 37 McMurray Rd, Suite 106, Pittsburgh, PA 15241.
Compressed Air Best Practices® is a trademark of Smith Onandia Communications, LLC. Publisher cannot be held liable for non-delivery due to circumstances beyond its control. No refunds. SUBSCRIPTIONS: Qualified reader subscriptions are accepted from compressed air professionals, plant managers, plant engineers, service and maintenance managers, operations managers, auditors, and energy engineers in manufacturing plants and engineering/consulting firms in the U.S. Contact Patricia Smith for subscription information at tel: 412-980-9902 or email: [email protected]. REPRINTS: Reprints are available on a custom basis, contact Patricia Smith for a price quotation at Tel: 412-980-9902 or email: [email protected]. All rights are reserved. The contents of this publication may not be reproduced in whole or in part without consent of Smith Onandia Communications LLC. Smith Onandia Communications LLC. does not assume and hereby disclaims any liability to any person for any loss or damage caused by errors or omissions in the material contained herein, regardless of whether such errors result from negligence, accident, or any other cause whatsoever. Printed in the U.S.A.
COMPRESSED AIR BEST PRACTICES® w w w . a i r b e s t p r a c t i c e s . c o m
Advertising & : Editorial
Rod Smith [email protected] Tel: 412-980-9901
Subscriptions & : Administration
Patricia Smith [email protected] Tel: 412-980-9902
A Publication of : Smith Onandia Communications LLC 37 McMurray Rd. Suite 106 Pittsburgh, PA 15241
Contact Rod Smith for ad rates: [email protected], Tel: 412-980-9901
which can draw up to 800 percent of the full load current. RS30n
and RS37n limit the in-rush current during start-up, minimizing peak
power charges and lowering energy usage.
The new compressor models also come equipped with updated
standard features to enhance reliability and durability. The following
design enhancements translate to thousands of dollars in savings over
the competition within the first five years of operation:
pp braided PTFE hoses that increase the lifetime of the compressor and mitigate downtime;
pp an integrated dryer that is ISO 1.5.1 classified, which provides higher air purity and reduces the likelihood of damage to tools powered by the compressor;
pp a NEMA 12 rated enclosure and standard pre-filter allow these compressors to operate in harsh application environments;
pp enhanced separators and coolers, and standard coolant that lasts twice as long as comparable models, thereby significantly reducing maintenance costs; and
pp less energy required to operate, reducing energy costs over fixed speed.
“The Next Generation R-Series compressors with VSD provide
customers with greater value than other products in the category,”
The new RS30n and RS37n models include new VSD technology and TEFC motors.
| 1 0 / 1 6
46 airbestpractices.com
COLUMNS

TECHNOLOGY PICKS
ADVERTISER INDEX
Company Page Web Site
Kaeser Compressors Outside Back Cover
www.us.kaeser.com/cabp
Atlas Copco Inside Front Cover
www.atlascopco.us
DV Systems Inside Back Cover
www.dvcompressors.com
ELGI Compressors 5 www.elgi.us
Nano Purification Solutions 7 www.n-psi.com
Relevant Solutions 8 www.relevantsolutions.com
BEKO Technologies 9 www.bekousa.com
JORC Industrial 11 www.jorc.com
FS Curtis 12 us.fscurtis.com
Sullivan-Palatek 13 www.sullivan-palatek.com
Clean Resources 14 www.cleanresources.com
CDI Meters 15 www.cdimeters.com
Sullair 17 www.sullair.com
VP Instruments 19 www.vpinstruments.com
ISEL Lubricants 20 www.iselinc.com/solutions
Summit 21 www.klsummit.com
SKF 22 www.skfusa.com
Anest Iwata 23 www.anestiwata.com
Hydrothrift 24 www.hydrothrift.com
Festo 25 www.festo.com/us/airquality
Parker Hannifin GSF Division
27 solutions.parker.com/nitrosource
Compresyn Lubricants 29 www.compresyn.com/distributor
FABTECH 2016 39 www.fabtechexpo.com
Seidel adds. “Ingersoll Rand is continuing to improve and expand
this product line to meet the ever-increasing performance needs
of customers and the sustainability goals they face.”
All Next Generation R-Series air compressors are equipped
with Xe-series controllers, which allow easy access to and
control of the compressed air system. The Xe70 controller has
customizable units of measure and built-in sequencing for up
to four compressors and communicates directly to the inverter
drive to determine the appropriate running speed of the airend.
Backed by extensive leading global service offerings, Ingersoll
Rand is dedicated to proactively maintaining customers’
equipment, allowing them to do what they do best – focus on
their production.
For more information on the Ingersoll Rand Next Generation R-Series VSD air compressors, visit www.IngersollRandProducts.com/NextGenRSeries or contact your local service representative.
1Savings vary by application, use and energy costs at point-of-use,
see your local service representative for more details.
About Ingersoll Rand
Ingersoll Rand (NYSE:IR) advances the quality of life by
creating comfortable, sustainable and efficient environments.
Our people and our family of brands — including Club Car®,
Ingersoll Rand®, Thermo King® and Trane® — work together to
enhance the quality and comfort of air in homes and buildings;
transport and protect food and perishables; and increase
industrial productivity and efficiency. We are a $13 billion global
business committed to a world of sustainable progress and
enduring results. Ingersoll Rand products range from complete
compressed air and gas systems and services, to power tools,
material handling and fluid management systems. The diverse
and innovative products, services and solutions enhance our
customers' energy efficiency, productivity and operations.
For more information, visit www.ingersollrand.com or www.
ingersollrandproducts.com.
1 0 / 1 6 |
47 airbestpractices.com
COLUMNS
T H E M A R K E T P L A C E
REGIONAL SALES MANAGER
Coaire, Inc. is looking for a highly experienced professional Air Compressor & Air Dryer Regional Sales Manager for the Western Part of North America.
We are seeking individuals with a strong mechanical, refrigeration and electrical background.
Our competitive benefit package includes, Health Insurance and 401K with company contributions.
Will provide relocation assistance if required (certain conditions apply).
Please contact Sang W. Lee at [email protected].
JOBS
SR. FIELD SERVICE TECHNICIAN
Times and days of week may fluctuate. Lemoyne, Pennsylvania. The Field Service Technician serves customers by installing, trouble shooting, repairing and maintaining all makes of reciprocating, rotary screw and rotary vane compressors - along with additional compressed air system components in accordance with manufacturer’s recommendations. 5+ Years of Experience required. Please contact Laura in HR at 717-793-2102 x1008, email: [email protected] for more information.
SALES MANAGER &INSIDE COMPRESSOR/BLOWER
APPLICATIONS SPECIALIST
Pye-Barker Supply Co Inc is an 80 year old distributor located in the Atlanta, Ga area and seeks to fill above positions due to retirement of long term employees. Our major lines are Gardner Denver Compressors and Blowers as well as Viking and ARO pumps.
We offer competitive benefits package to include Health Insurance and 401k
Please send resume and salary requirements to: [email protected]
www.pyebarker.com
Job & Product Marketplace Advertising InformationReach 13,000+ readers of Compressed Air Best Practices® Magazine with Marketplace Ads every month! Job Marketplace ads are also placed for one month on www.airbestpractices.com and promoted in our three monthly e-newsletters.
Ad dimensions are 2.36" wide x 3.91" tall. We can help you design the ads. Send us your logo, product photo, and text to [email protected]. We recommend 20-50 total words of text.
Prices are $300.00 per Job Marketplace Ad and $350.00 per Product Marketplace Ad ($300 if 6 or more ads are placed). Contact Rod Smith at [email protected] to schedule your Marketplace Ads.
| 1 0 / 1 6
48 airbestpractices.com
COLUMNS
TECHNOLOGY
AirCheckLab.com 800-247-1024 x 4
SQF & ISO 8573 CompressedAir Testing Experts
Contact Us Today!
INTELLIGENTFLOW CONTROL• Reduces Artificial Air Demand• Saves energy consumed by Air Compressors• Maintains stable air pressure within 1 psig• Works with all types of compressors• Downstream & Upstream Pressure Control• Colour Graphic HMI touch screen• Real Time & Historical Trends• Remote PC Monitoring & Control
Godrej & Boyce Mfg.Co.LtdTel.: +91-22-67962251 to 2255 E-mail: [email protected];
www.godrej-airsolutions.com
SEEKING DISTRIBUTORS
• Maintains stable air pressure within 1 psig+• Maintains stable air pressure within 1 psig• Maintains stable air pressure within 1 psig
Air, Gas, & Steam ApplicationsSizes up to 3”D-J Orifice Available
Safety Relief Valves
UV
Engineering reliable pressure & flow control solutions since 1908.KINGSTON
Est.1908
K
www.KingstonValves.com
Contact Us!Toll: 800.210.2525 / Ph: 310.326.8287Email: [email protected]
Est.1908
KEst.1908
KKKKEst.1908
K
1 0 / 1 6 |
49 airbestpractices.com
COLUMNS

T H E M A R K E T P L A C ETECHNOLOGY
Heavy-Duty 100%aluminum pipe& fi ttings
Seeking master distributors in uncovered regions in the Americas
Contact Paolo [email protected]
Aluminum modular piping forcompressed air, nitrogen and
vacuum (¾ “- 4 ½”)
www.Coalescing.comAllied Group, Inc. 5 Coldhill Rd., Bldg 19 Mendham NJ 07945800-728-8311 - 973-543-4994 – [email protected]
1-800-728-8311
YES, we manufacture filters forall compressor applications:
• Coalescing Filters• Oil Mist Elimination• Intake• Exhaust• Silencing
Custom and Standard Sizes
High Efficiency Compressor ControllersControl Rotary Screw, Vane, Scroll or Recip Compressors
Save Energy controlling up to FOUR compressors and qualify for Utility Rebates.
• Automatic Lead/Lag Control-up to FOUR Compressors
• Accurate Pressure Control with Pressure Transducers
• Compressors and Vacuum Pumps from 1 to 250 hp
Thousands of Installations Worldwide. Call for Application Engineering.
Standard Pneumatic Products, Inc. Tel: 203-270-1400 • Toll free: 800-979-9156 Email: [email protected]
www.stdpneumatics.com
CHILLED MIRRORINDUSTRIAL DUTYHYGROMETER
• Precise, Drift-Free DewPoint Measurement• Local Horn, Alarm Relays, Analog Outputs• For Compressed Air Systems and Process Monitoring
TEL: [email protected]
MADE IN THE USA
www.Edgetechinstruments.com
| 1 0 / 1 6
50 airbestpractices.com
COLUMNS

BU
ILT
BE
TT
ER
With over 125 years of manufacturing excellence it’s not only our products that are built to last, we strive to build lasting relationships. Contact us to learn more.
DV Systems Ltd. 128-B Talbert Rd., Mooresville, NC 28117
1-877-687-1982dvcompressors.com
JOIN US, BECOME A DISTRIBUTOR
IT'S NOT ONLY THE PRODUCTS, BUT PEOPLE AT DV SYSTEMS THAT MAKE THE DIFFERENCE FOR MY BUSINESS.
DENNIS BERMANI, OAK STREET CLASSICS, MOORESVILLE, NC
AIR COMPRESSORS 5 TO 200 HP
CABP -2016feb6.indd 1 2016-03-08 10:50 AM

COMPRESSORSk
ae
ser.
co
m
Kaeser Compressors, Inc. • 866-516-6888 • us.kaeser.com/CABPBuilt for a lifetime is a trademark of Kaeser Compressors, Inc. ©2016 Kaeser Compressors, Inc. [email protected]
KAESER SUCCESS STORY
Let us help you measure and manage your compressed air costs!
PROBLEM:At a plant manufacturing turbines for hydro-electric power plants, excess capacity had been a source of comfort for many years despite recommendations for system updates. Four modulating, twenty-year old compressors, two 75 hp, two 25 hp, supplied the system—without central controls—causing excessively high energy costs. When a new plant engineer came on board, he took a closer look at the energy efficiency. Having attended a Kaeser Compressed Air Seminar, he knew a systems approach could unlock significant savings.
SOLUTION:Kaeser ran a KESS (Kaeser Energy Saving Simulation) using supply side audit data and designed a complete system solution that would dramatically reduce the specific power from 62.0 kW/100 cfm to 17.5 kW/100 cfm. New energy efficient compressors, an air receiver, as well as a system master controller were installed. The new system has the same number of compressors and total horsepower as before, but it provides even more flow.
RESULT:The Sigma Air Manager (SAM) master controller monitors the four new compressors and selects the most efficient combination of units to meet the plant demand. With its built-in SAC Plus software, SAM continually tracks energy consumption so the plant benefits from having an ongoing com-pressed air energy audit. As a matter of fact, the specific power has been reduced more than anticipated—all the way down to 16.7 kW/100 cfm.
Annual Energy Costs of Previous System: $59,780 per year
Reduction in Specific Power: 45.3 kW/100 cfm
Annual Energy Cost Savings: $22,680 per year
Additional Savings in Maintenance Costs: $7,240 per year
TOTAL ANNUAL SAVINGS: $29,920
Simple Payback Period: 14 months
Seize the Savings!A fresh approach yields sweeping savings for a quick ROI
Related Documents