SMS Tutorials Working with Rasters © Aquaveo.com 2014 Page 1 of 12 SMS 12.1 Tutorial Working with Rasters Objectives This tutorial teaches how to import a Raster, view elevations at individual points, change display options for multiple views of the data, show the 2D profile plots, and interpolate data to a mesh. Prerequisites • Overview Tutorial Requirements • Raster Module • Map Module • Mesh Module Time • 20-30 minutes v. 12.1

Welcome message from author
This document is posted to help you gain knowledge. Please leave a comment to let me know what you think about it! Share it to your friends and learn new things together.
Transcript
SMS Tutorials Working with Rasters
© Aquaveo.com 2014
Page 1 of 12
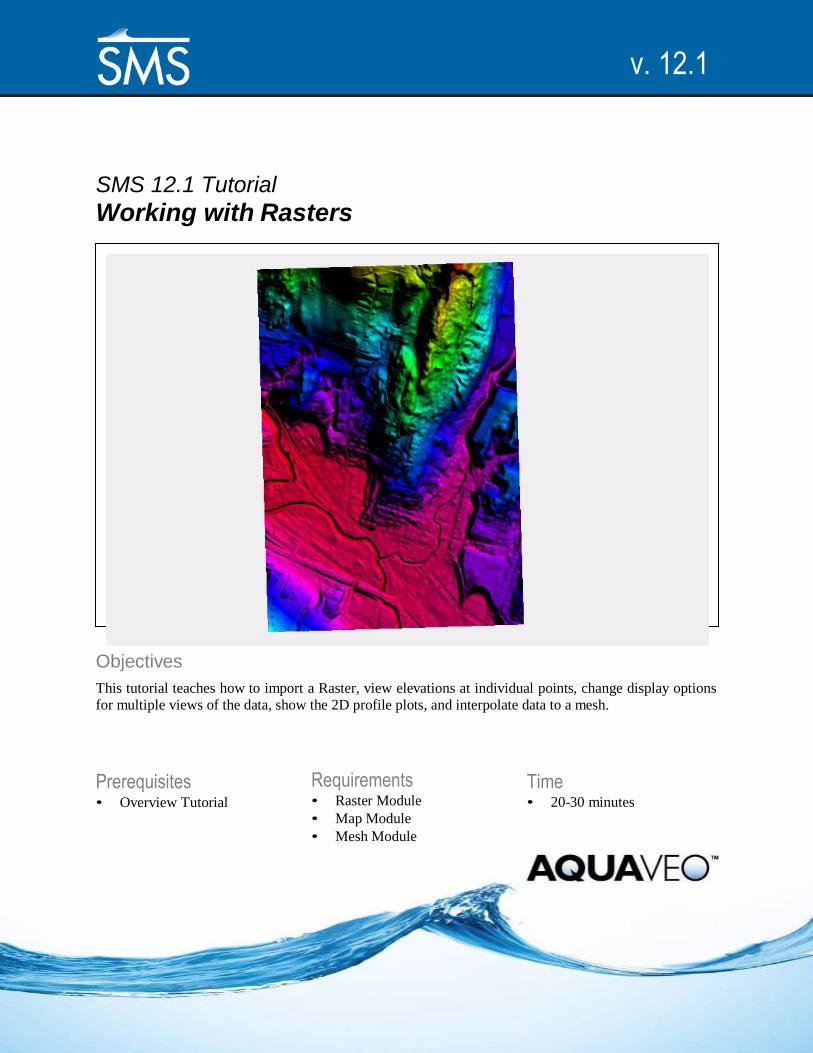
SMS 12.1 Tutorial
Working with Rasters
Objectives
This tutorial teaches how to import a Raster, view elevations at individual points, change display options
for multiple views of the data, show the 2D profile plots, and interpolate data to a mesh.
Prerequisites • Overview Tutorial
Requirements • Raster Module
• Map Module
• Mesh Module
Time • 20-30 minutes
v. 12.1

SMS Tutorials Working with Rasters
© Aquaveo.com 2014
Page 2 of 12
1 Introduction ........................................................................................................................... 2 2 Loading the Raster ................................................................................................................ 2 3 Setting the Projection ............................................................................................................ 3 4 Changing the Display ............................................................................................................ 4 5 2D Profile Plot ........................................................................................................................ 5 6 Raster to Mesh Interpolation ................................................................................................ 7
6.1 Reading a Mesh ............................................................................................................... 7 6.2 Interpolating Raster elevations to Mesh .......................................................................... 9
7 Operating on a Raster ........................................................................................................... 9 7.1 Trimming a Raster ......................................................................................................... 10 7.2 Merging Rasters ............................................................................................................ 11 7.3 Converting a Raster to Feature Contours....................................................................... 12
8 Conclusion ............................................................................................................................ 12
1 Introduction
A raster consists of a matrix of pixels or cells stored and displayed in a grid formation
(rows and columns). Each cell contains a value representing a type of information such as
elevation or land use. Rasters can be digital aerial photographs, images from satellites,
scanned digitized pictures or even scanned maps.
In this example, the raster that will be used is a surface map containing elevation data.
However, rasters can also be used as base maps (usually scanned maps and images or
satellite imagery) and thematic maps (usually containing information such as land use or
vegetation).
2 Loading the Raster
To start, load a Digital Elevation Model (DEM) file into SMS. SMS creates a raster object
is the GIS module to represent this DEM.
To open a raster in SMS,
1. Select File | Open. The Open dialog should appear.
2. In the Open dialog, browse to the folder directory Rasters\Data Files. This folder
will be in the same location as all the other SMS tutorial folders that were
downloaded when installing SMS.
3. Select the raster file named “GunnersBrook.tif” and click Open. Once the file is
open, the data should look like Figure 1.

SMS Tutorials Working with Rasters
© Aquaveo.com 2014
Page 3 of 12
Figure 1 Raster
3 Setting the Projection
Like all objects in SMS, rasters should be referenced to a projection to locate the data in the
physical world. The projection may come from the raster file or from an associated file.
In this case (a geotif file) the projection is included in the file and has been set to State
Plane Coordinates, with the zone set to Vermont. The units are set to feet. To verify
this:
1. Click Display | Projection…. The Display Projections dialog will appear.
2. Click on the Set Projection… button to specify the display projection. The Select
Projections dialog appears.

SMS Tutorials Working with Rasters
© Aquaveo.com 2014
Page 4 of 12
3. Make sure the Projection is set to “State Plane Coordinate System”, Zone is set to
“Vermont (FIPS 4400)”, Datum to “NAD83”, and set the Planar Units to “FEET
(U.S. SURVEY)”. Click OK to close the Select Projection dialog.
4. Back in the Display Projection dialog, verify that the Units in the Vertical section
are also “Feet (U.S. SURVEY)” and click OK.
4 Changing the Display
SMS offers two methods for displaying the data in the raster (in this case elevations). These
include an image of the shaded surface (this is a 2D display visible only in plan view) and a
display of a sampling of the points that make up the surface. The default is a 2D image as
shown in Figure 1.
The shading method employed to generate the image can be controlled by the user. SMS
allows the user to choose between Atlas, Color Ramp, Global and HSV shaders. To change
the shader:
1. Select Display | Display Options or select the Display Options icon. This will
open the Display Options dialog.
2. In the dialog, if it is not already selected, click on GIS in the menu bar on the left
side of the dialog.
3. At the bottom of the dialog, in the Shader combo box, select the “Color Ramp
Shader” option and click OK.
SMS updates the display of the image to use a different set of colors.
The 2D image display of the raster is only visible in plan view. In order to view the data in
3 dimensions, and display the raster data as point cloud:
1. Select Display | Display Options or select the Display Options icon.
2. Click on GIS in the menu bar on the left side of the dialog.
3. Select the Display as 3D points option.
4. Click on General in the menu bar on the left side of the dialog.
5. Turn off the Auto z-mag toggle box and enter “10.0” as the Z magnification factor.
6. Click OK to close the Display Options dialog.
7. Select the Rotate tool then click and drag in the graphics window. Notice how
the elevation can now be seen.
8. Click on the Plan View macro to return to the original view.

SMS Tutorials Working with Rasters
© Aquaveo.com 2014
Page 5 of 12
9. For the rest of the tutorial, use the 2D image of the raster. Select the Display
Options icon to bring up the Display Options dialog.
10. In the GIS tab of the dialog, toggle on the Display as 2D image option and choose
the “HSV Shader” option then click OK.
5 2D Profile Plot
SMS can show 2D profile plots using an observation coverage. This is done by doing the
following:
1. In the Project Explorer, right-click on the “Map Data” tree entry and select New
Coverage from the menu. This opens the New Coverage dialog.
2. In the dialog, select “Observation” from the list of coverage types, enter
“Observation” as the Coverage Name, and click OK to close the dialog and created
a new coverage in the Project Explorer.
3. Click on the “Observation” coverage to make sure it is the active coverage.
Figure 2 Observation Arc
4. Using the Create Feature Arc tool, create two arcs as shown in Figure 2.
Normally create the arcs by clicking from left to right across a channel (when
looking downstream). In this case, that means the arcs are created from right to

SMS Tutorials Working with Rasters
© Aquaveo.com 2014
Page 6 of 12
left. The order controls how the data will be displayed in a plot. SMS will display
arrows pointing away from the arc which correspond to the view direction (into the
board) when the plot is created.
5. After creating the arcs, select Display | Plot Wizard. This will open up the Plot
Wizard.
6. Choose “Observation Profile” as the Plot Type. Click on the Next button to
proceed to step 2 of the wizard.
7. Under the section Coverage, select which observation arcs to display in the plot. In
this case, leave both arcs turned on.
8. Under the Dataset(s) section, select the Specified option. Select the
“GunnersBrook.tif” dataset to make it active. Leave the Plot tolerance to “0.0” m.
The plot tolerance allows for points to become clearer in the plot as it puts a
tolerance on how many points can be displayed.
9. Click Finish to display the profile plots.
Notice the two different plots one for each arc. The plots window will be displayed at the
top and the graphics window on the bottom. If desired, maximize one window and
minimize another one to better view either window.
Figure 3 Profile plot for arcs
10. Using the Select Feature Point tool, select one of the nodes of either arc.

SMS Tutorials Working with Rasters
© Aquaveo.com 2014
Page 7 of 12
11. Drag the node around over the raster data. Notice how the plot will change while
moving and releasing the nodes.
12. Right-clicking in the plot window and selecting Plot Data from the menu. This
opens the Data Options dialog at Plot Wizard– Step 2 of 2.
13. Change the Plot tolerance to “1.0” m and Click OK. Notice how the points
displayed on the plots are now coarser (spaced further apart) because the tolerance
was increased.
14. Close the Plot 1 window by clicking on the button and maximize the graphics
window by clicking the button.
15. Click on the Frame macro to frame the data.
6 Raster to Mesh Interpolation
The Raster data can also be interpolated to other geometric objects in an SMS project such
as a mesh.
6.1 Reading a Mesh
Refer to other tutorials to create a mesh. For this tutorial, to read in a previously created
mesh:
1. Select File | Open. The Open dialog should appear.
2. In the Open dialog, select the file named “GunnersBrook_mesh.h5” and click
Open. Once the file is open, the data should like Figure 4.

SMS Tutorials Working with Rasters
© Aquaveo.com 2014
Page 8 of 12
Figure 4 Mesh over the raster
1. Click on the “GunnersBrook” item under Mesh Data to make it active and switch
to the Mesh Module.
2. Use the Zoom tool to zoom in on any area of the mesh.
3. Use the Select Mesh Node tool and select a mesh. Note that the elevation for the
node is “0.0”.
4. Select several other mesh nodes. Note that the elevation is “0.0” for all the points
in the mesh.

SMS Tutorials Working with Rasters
© Aquaveo.com 2014
Page 9 of 12
6.2 Interpolating Raster elevations to Mesh
Now that a mesh exists, the can interpolate elevations to that mesh using the elevations
stored as raster data.
1. Right-click on “GunnersBrook.tif” item under the “GIS Data” folder and select
Interpolate | 2D Mesh from the menu.
Notice that a new dataset name “GunnersBrook.tif” has been created under the
“GunnersBrook” mesh item.
2. Click on the GunnersBrook mesh object to make the Mesh module active.
3. Select the Data | Map Elevation… command. The Select Dataset dialog will
appear.
4. In the Select Dataset dialog, select the dataset named “GunnersBrook.tif” and click
Select. The New Function dialog should appear.
5. In the dialog, accept the dataset name of “new_elevation” and click OK.
The raster elevations have now been assigned to the mesh. There are multiple ways to
view the elevation in the mesh.
1. Use the Select Mesh Point tool to select individual nodes to see the assigned
elevation.
2. Click on the Display Option macro to bring up the Display Options dialog.
3. In the dialog, select the “2D Mesh” option from the list on the left if not already
active.
4. Toggle on the Contours option then click on the Contours tab.
5. Change the Contour Method to “Color Fill” and click OK to close the Display
Options dialog.
6. Use the Rotate tool to view how the elevations were mapped to the mesh.
7 Operating on a Raster
SMS contains options to perform other operations using a raster object. To experiment with
these get started by first completing the following:
1. Toggle off Mesh Data in the Project Explorer.
2. Click on the Plan View macro to return to plan view.

SMS Tutorials Working with Rasters
© Aquaveo.com 2014
Page 10 of 12
7.1 Trimming a Raster
The available raster may be larger than what is needed for a project. Such is the case in
this exercise. Trimming a raster results in a smaller region to work with an can improve
efficiency. To trim the raster, complete the following:
1. Make the “Area Property” coverage active.
2. Using the Create Feature Arc tool, click out a simple polygon as in Figure 5
below.
Figure 5 Simple polygon for trimming a raster
3. Use the Feature Objects | Build Polygons command.
4. Using the Select Feature Polygon tool, select the polygon.
5. Right-click on “GunnersBrook.tif” in the project explorer and select the Convert
To | Trimmed Raster command.
6. In the SaveAs dialog, name the trimmed raster as “GunnersBrook_trim.tif” and
click Save.

SMS Tutorials Working with Rasters
© Aquaveo.com 2014
Page 11 of 12
7. In the Project Explorer, turn off the “Area Property” and “GunnersBrook.tif”
items. Notice the trimmed raster in the main graphics window.
7.2 Merging Rasters
SMS allows rasters to be merged together. Do this by:
1. Select File | Open to bring up the Open dialog.
2. In the Open dialog, select the raster file named “StevensBranch.tif” and click Open.
This will load a second raster file. The graphics window should appear similar to
Figure 6.
Figure 6 Raster objects to be merged
3. Select the “GunnersBrook.tif” item to make it active then press the Ctrl key and
select the “StevensBranch.tif” item.
4. Right-click on either selected item and use the Convert To | Merged Raster
command.
5. In the Save As dialog, name the merge raster “Barre.tif” and click Save.
6. In the Project Explorer, toggle off all GIS items except for Barre.tif to see the
merged raster.

SMS Tutorials Working with Rasters
© Aquaveo.com 2014
Page 12 of 12
7.3 Converting a Raster to Feature Contours
There are two options for converting raster contours to feature arcs. For this tutorial, use
the option to create an arc at a specified contour value (elevation). Do this by:
1. Right-click on the “Barre.tif” item and select the Convert To | Feature Contours
at Given Elevation command. The Create Contour Arc dialog will appear.
2. Enter “615” in the Create Contour Arcs dialog and click OK.
A new map coverage will appear with an arc along the 615 foot contour elevation as seen
in Figure 7.
Figure 7 Contours generated from a raster
8 Conclusion
This concludes the Raster tutorial. Users may wish to experiment some more of the
features in SMS or may close SMS at this point.
Related Documents