Acta Sci. Pol. Zootechnica 20(1) 2021, 15–26 www.asp.zut.edu.pl pISSN 1644-0714 eISSN 2300-6145 DOI:10.21005/asp.2021.20.1.02 ORIGINAL PAPER Received: 15.11.2020 Accepted: 18.01.2021 SMOKED AND FRESH FISH MARKETING IN TOTO LOCAL GOVERNMENT AREA OF NASARAWA STATE, NIGERIA: A COMPARATIVE ANALYSIS Abdulhameed Abana Girei 1 , Muhammad Attahiru Ndanitsa 2 , Ernest Ogezi 1 , Muhammad Ibrahim Imam 1 1 Department of Agricultural Economics & Extension, Faculty of Agriculture, Nasarawa State University, Keffi, Nigeria 2 Department of Agricultural Economics & Farm Management, School of Agriculture & Agricultural Technology, Federal University of Technology, Minna, Niger State, Nigeria ABSTRACT Fish marketing is gaining prominence especially in the rural communities as an all year-round poverty alleviation micro-enterprise requiring low capital base. This study examined the marketing performance of smoked and fresh fish in the study area. Primary data were obtained from 80 respondents selected through a two-stage sampling tech- nique. Data were analysed using descriptive and inferential statistics. The objectives of the study were to: describe and compare the market structure and performance, determine the profitability, identify marketing intermediaries, and constraints to smoked and fresh fish marketing in the study area. The results showed that that both sexes in- volved in fish marketing with the female (58.7%) dominating. Majority (67.5%) of the marketers were within the age group of 15–44 years. The mean age was 33 years. Also, 73.7% of the respondents were married and most (58.7%) of the respondents had household size of between 1 and 5 persons and the mean household size was 6 persons. About 65% of the respondents had one form of education or the other. The mean fish marketing experience was estimated at 15 years. The benefit cost ratio for fresh fish marketing was 0.26. This implies that 0.26 was made for every 1 invested in the fresh fish business and the marketing efficiency for fresh fish marketing was calculated at 2.93 (293%), while the net benefit cost ratio of smoked fish was calculated at 1.57. This implies that 0.57 was made on every 1 invested into the smoked fish enterprise. The results further indicated significant revenue differential between smoked fish ( 380,500.00) and fresh fish ( 179,640.00) of 200,860.00. This ac- counted for about 111.82% indicating that smoked fish marketing yields higher revenue than fresh fish, in the study area. The Gini-coefficient (GC) for both fresh and smoked fish marketers were calculated at 0.5857 and 0.4801 respectively. Decentralized routes of marketing channels were observed with retailers having the highest percent- age of 32.5 for the traded smoked fish, while consumers had the highest (30.0%) of the traded fresh fish. Some of the identified constraints include; seasonality, inadequate credit, poor storage facilities and poor road networks. It was recommended that the marketers organize themselves into cooperative organizations and set up strong market networks and linkages in order to benefit from available markets outside their immediate vicinities. Key words: comparative analysis, marketing, fish INTRODUCTION Fish is one of the most important sources of food and in- come to many people in developing countries. The de- mand for fish globally and particularly in Nigeria has been on the increase with supplies not meeting up the demand [FAO 2012]. Nigeria’s annual fish demand is 2.7 million tonnes with local production standing at 0.8 million metric tonnes and a 1.9 million metric tonnes deficit supplied through imports and worth about $1.2 billion [Ewepu 2019]. Fisheries production is essential to the economic well-being of millions of rural peo- ple in the developing world. Aquaculture provides direct employment for some 200 million people, the vast ma- [email protected] © Copyright by Wydawnictwo Uczelniane Zachodniopomorskiego Uniwersytetu Technologicznego w Szczecinie, Szczecin 2021

Welcome message from author
This document is posted to help you gain knowledge. Please leave a comment to let me know what you think about it! Share it to your friends and learn new things together.
Transcript
Acta Sci. Pol. Zootechnica 20(1) 2021, 15–26www.asp.zut.edu.pl pISSN 1644-0714 eISSN 2300-6145 DOI:10.21005/asp.2021.20.1.02
ORIGINAL PAPERReceived: 15.11.2020Accepted: 18.01.2021
SMOKED AND FRESH FISH MARKETING IN TOTO LOCALGOVERNMENT AREA OF NASARAWA STATE, NIGERIA:A COMPARATIVE ANALYSIS
Abdulhameed Abana Girei 1Q, Muhammad Attahiru Ndanitsa2, Ernest Ogezi1,Muhammad Ibrahim Imam1
1Department of Agricultural Economics & Extension, Faculty of Agriculture, Nasarawa State University, Keffi, Nigeria2Department of Agricultural Economics & Farm Management, School of Agriculture & Agricultural Technology,
Federal University of Technology, Minna, Niger State, Nigeria
ABSTRACTFish marketing is gaining prominence especially in the rural communities as an all year-round poverty alleviationmicro-enterprise requiring low capital base. This study examined the marketing performance of smoked and freshfish in the study area. Primary data were obtained from 80 respondents selected through a two-stage sampling tech-nique. Data were analysed using descriptive and inferential statistics. The objectives of the study were to: describeand compare the market structure and performance, determine the profitability, identify marketing intermediaries,and constraints to smoked and fresh fish marketing in the study area. The results showed that that both sexes in-volved in fish marketing with the female (58.7%) dominating. Majority (67.5%) of the marketers were within theage group of 15–44 years. The mean age was 33 years. Also, 73.7% of the respondents were married and most(58.7%) of the respondents had household size of between 1 and 5 persons and the mean household size was 6persons. About 65% of the respondents had one form of education or the other. The mean fish marketing experiencewas estimated at 15 years. The benefit cost ratio for fresh fish marketing was �0.26. This implies that �0.26 wasmade for every �1 invested in the fresh fish business and the marketing efficiency for fresh fish marketing wascalculated at 2.93 (293%), while the net benefit cost ratio of smoked fish was calculated at �1.57. This impliesthat �0.57 was made on every �1 invested into the smoked fish enterprise. The results further indicated significantrevenue differential between smoked fish (�380,500.00) and fresh fish (�179,640.00) of �200,860.00. This ac-counted for about 111.82% indicating that smoked fish marketing yields higher revenue than fresh fish, in the studyarea. The Gini-coefficient (GC) for both fresh and smoked fish marketers were calculated at 0.5857 and 0.4801respectively. Decentralized routes of marketing channels were observed with retailers having the highest percent-age of 32.5 for the traded smoked fish, while consumers had the highest (30.0%) of the traded fresh fish. Some ofthe identified constraints include; seasonality, inadequate credit, poor storage facilities and poor road networks. Itwas recommended that the marketers organize themselves into cooperative organizations and set up strong marketnetworks and linkages in order to benefit from available markets outside their immediate vicinities.
Key words: comparative analysis, marketing, fish
INTRODUCTION
Fish is one of the most important sources of food and in-come to many people in developing countries. The de-mand for fish globally and particularly in Nigeria hasbeen on the increase with supplies not meeting up thedemand [FAO 2012]. Nigeria’s annual fish demand is
2.7 million tonnes with local production standing at 0.8million metric tonnes and a 1.9 million metric tonnesdeficit supplied through imports and worth about $1.2billion [Ewepu 2019]. Fisheries production is essentialto the economic well-being of millions of rural peo-ple in the developing world. Aquaculture provides directemployment for some 200 million people, the vast ma-
© Copyright by Wydawnictwo Uczelniane ZachodniopomorskiegoUniwersytetu Technologicznego w Szczecinie, Szczecin 2021
Girei, A.A., Ndanitsa, M.A., Ogezi, E. (2021). Smoked and fresh fish marketing in Toto Local Government Area of Nasarawa State,Nigeria: a comparative analysis. Acta Sci. Pol. Zootechnica, 20(1), 15–26. DOI: 10.21005/asp.2021.20.1.02
jority of whom work in the traditional small-scale sec-tor, which account for about 70% of fisheries production[FAO 2008]. Despite the popularity of farming in Nigeria,the fish farming industry can be described as being atthe infant stage when compared to the large market po-tential for its production and market [Nwiro 2012]. Fishis also one of the important animal protein foods avail-able in Nigeria. About a decade ago fish constituted 40%of animal protein intake [Atanda 2009]. The demand forsuch protein is rising exponentially with the rapidly ac-celerating increases in human population. Fish is avail-able in the market in different forms like fresh, frozen,canned, smoked, dried, fried, and cooked form [Msheliaet al. 2007]. The fisheries sub-sector represents a majorfood source due majorly for the protein they provide andthe industrial products they produce. As a prime sourceof protein, fish is culturally, economically and sociallyimportant as a global dietary aspects sustainable food se-curity. Economically, fish serves as an im-portant sourceof food and income for both men and women and fishingas a trade has an important social and cultural positionin not only riverine communities but in most of the so-ciety. Therefore, availability of fish to the consumers atthe right time, form, and place and at the lowest possiblecost generally requires an effective and efficient market-ing system [Polycarp et al. 2015].
The term fish is a diverse group of animals that liveand breathe in water by means of gills. Fish is one ofthe most diverse groups of animals known to man withover two thousand five hundred species. There are morespecies of fish than all other vertebrate [Eyo 2001]. Thefishery sector is estimated to contribute about 3.5% toNigeria’s Gross Domestic Product (GDP), and also pro-vides direct and indirect employment to over six millionpeople [Kwara State Government 2010]. The employ-ment opportunities come from different fishing activitiessuch as production, processing, preservation and trans-portation [Ali et al. 2008]. The Central Bank of Nigeria[CBN 2005] report shows that the contribution of the fish-ery sector to the GDP of Nigeria rose from �76.76 bil-lion in 2001 to �162.61 billion in 2005 indicating an in-creased by �85.85 billion and this accounted for 111.84percent.
In West Africa fish accounts for 30% of animal pro-tein intake, and this number would be larger if the poorcould afford to buy more. Often referred to as “rich foodfor poor people,” fish provides essential nourishment, es-pecially quality proteins and fats (macronutrients), vita-mins and minerals (micronutrients). Second, for those in-volved in fisheries, aquaculture and fish trade, fish is asource of income which can be used to purchase otheradditional food items. Though this brief emphasizes theformer, fish contributes to food security as an importantprotein accompanied to rice based diets in Asia, maizeand cassava-based diets in Africa, though the consump-
tion there is decreasing. Fish supply in Africa has beendeclining for a number of reasons while the demand hasincreased due to the rise in population, decrease in live-stock production due to desertification, disease [Olaoye etal. 2007], and drought. Strategies to increase fish supplyare being promoted globally.
According to Idowu et al. [2012] fish abundance isonly experienced in the rainy season; however, their con-sumption is year-round. Time utility is created in theprocess of making fish available to consumers all theyear. Time utility is created through processing and stor-age activities. Through marketing activities, fish may bestored and processed by drying, smoking or boiling. Thishelps to preserve the fish and make it fit for consumptionthroughout the year.
Marketing of food in Nigeria is generally character-ized by multitudes of deficiencies and problems. Fishmarketing is no different. These problems cut across pro-cessing, preservation, packaging, distribution and trans-portation. In fish marketing, problems of shortage of sup-ply, price fluctuations due to drying up of sources of wa-ter, and spoilage on transit, have been identified in thecountry [Ali et al. 2008]. Also, inadequate processingskills produce deterioration and lack of storage facilitieshas been pointed out as the major constraints perceivedby marketers. Much attention was given to physical fishproduction technology while a little interest was shownon the marketing aspect to complete the production cy-cle. It is obvious that increased production without cor-responding increase in marketing activities may leads towastage of resources [Awonyinka 2009].
The importance of the fishery subsector cannot beoveremphasized. Fish, many times has been describedas rich food for poor people. It provides excellent high-quality proteins and has a concentration of calcium andphosphorus in the bones [USAID 2010]. Fish oil low-ers blood pressure and fin fish has been shown to reducethe risk of blood cancer and reduces insulin resistancein skeletal muscle. According to Adebayo and Anyanwu[2013], ‘fish supplies as much as 80% of animal proteinin coastal areas,’ it supplies micronutrients such as irons,iodine, calcium, vitamin A, and Vitamin B in the dietsof people in these areas. Fish is also available in differ-ent forms as fresh, dried, smoked, canned, frozen, etc.Fish consumption cuts across religion for it is free fromany religious taboo. Fish is the best food for human con-sumption according to USAID [2010] as it is low in fat,calories, and cholesterol.
In view of the above, the study seeks to comparativelyaddress the following questions:− what are the socioeconomics characteristics of
smoked and fresh fish marketers?− what is the market structure and performance of
smoked and fresh fish market?− are smoked and fresh fish marketing profitable?
16 www.asp.zut.edu.pl
Girei, A.A., Ndanitsa, M.A., Ogezi, E. (2021). Smoked and fresh fish marketing in Toto Local Government Area of Nasarawa State,Nigeria: a comparative analysis. Acta Sci. Pol. Zootechnica, 20(1), 15–26. DOI: 10.21005/asp.2021.20.1.02
− what are the different market actors involved insmoked and fresh fish marketing?
− what are the constraints to smoked and fresh fish mar-keting?
Objectives of the Study
The objectives are to comparatively:1. describe the socio-economic characteristics of the
smoked and fresh fish marketers;
2. examine the structure and performance of smokedand fresh fish marketing;
3. determine and compare the profitability of smokedand fresh fish marketing;
4. identify marketing channels for smoked and fresh fishmarketing; and
5. identify constraints to smoked and fresh fish marke-ting.
Theoretical perspective
According to Panda [2011], marketing is “the perfor-mance of all business activities involved in the flow ofgoods and services from the point of production until theyare in the hands of the ultimate consumer”. Agriculturalmarketing in Nigeria is such important aspect of the coun-try’s agriculture that the agriculture sector is backwardpartly due to poor marketing linkages and the absence ofa specialized transport and logistics system for the waresproduced at farm gate. Adesanya [2000] stipulated thatrural transportation in Nigeria is characterized by a num-ber of difficulties and deplorable conditions of road andvehicles. This is still while facing low productivity andrural poverty.
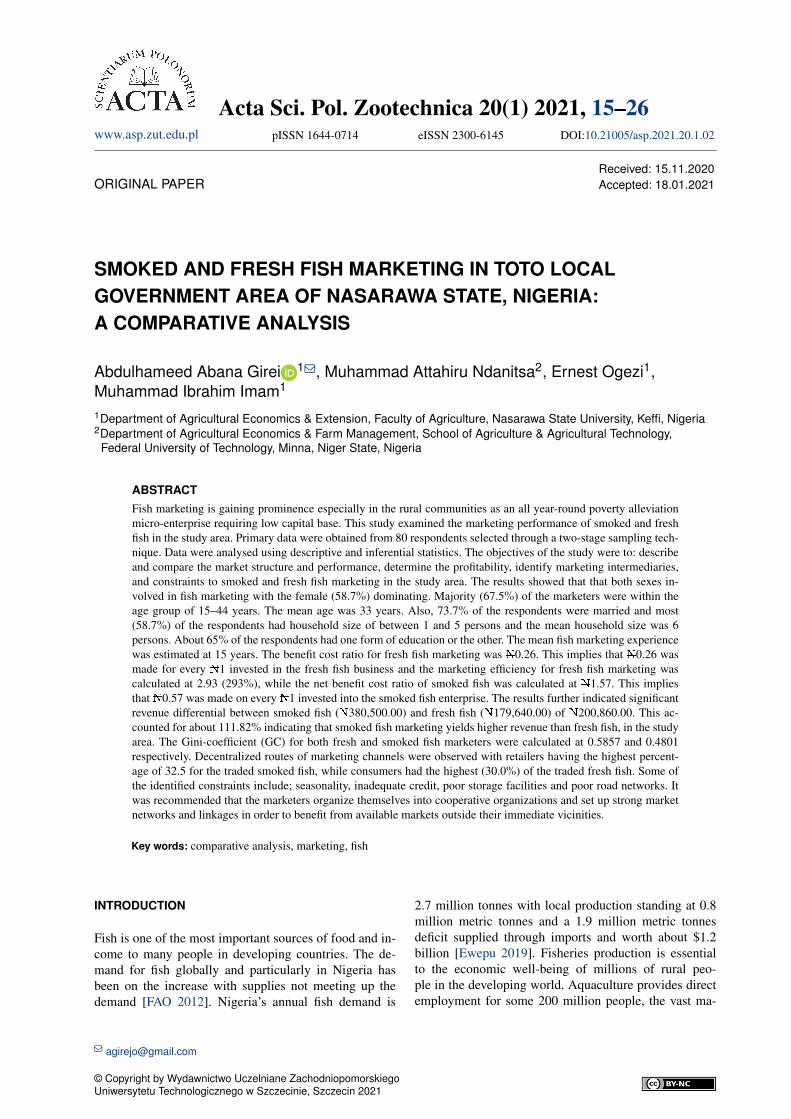
Fig. 1. Map of Nasarawa State showing the study area, TotoLGA
Generally, an efficient marketing system is one inwhich there is greater share of producers’ sharing the con-sumers purchasing power and also where the marketingcost has been so decreased that it leads to the producers’
and consumers’ surplus [Kumar et al. 2019]. Market per-formance is a broad term detailing the economic resultsthat flow from the industry as each fir, pursues its partic-ular line of conduct. Market performance encompassesgross margin, marketing margin and marketing efficiencyas it relates to individual market actors such as produc-ers, wholesalers and retailers [Acharya 2004]. Fish mar-keting is especially difficult given that the fish are frag-ile and require extra care and attention to transport. Agrowing body of works (including Bukenya et al. [2012],Nsikan et al. [2015], Adedeji et al. [2019]) have indicatedsome of the constraints to fish marketing in Nigeria to in-clude low prices, absence of linkages between the areasof mass production to the areas of high demand, poor cap-ital, dearth in storage facilities, transportation constraints,immaturity of fish and poor size of fish and high taxes andlevies.
Bassey et al. [2013] stipulated that fish marketing is avery delicate business requiring skills and manoeuvres toavoid losses. Dry fish marketing is particularly critical inthe sense of the extra storage constraint and the level ofinadequacy of the storage technology and/or facilities aswell as poor timing in storage [Kallon et al. 2017]. Dryfish is a low-cost source of vital food protein. The grow-ing relevance of dry fish is indubitable but aspects of tra-ditional dry fish production methods have been identifiedto be problematic [Payra et al. 2016]. Although Agbebi[2010] has described fish marketing as a primordial activ-ity, new challenges of fish marketing and the question ofprofitability have recently arisen. There is empirical evi-dence as to the profitability of fish marketing in differentparts of the country [Bukenya et al. 2012, Onyemauwa2012, Osundare and Adedeji 2018]. Irhivben et al. [2015]have posited that marketing fish in Nigeria is influence bymechanisms of seasonality, bargain power of consumersas well as the effect of demand and supply. Nonetheless,sustainability of fish production will be determined by thestructure and performance in balancing demand with sup-ply.
MATERIAL AND METHODS
Study area
The study was conducted in Toto Local Government Area(LGA) of Nasarawa State, Nigeria. The study area islocated in the Western Agricultural Zone of the State(Fig. 1). The LGA is located on latitudes 7°, 25′ N andlongitude 8°, 20′ E is located on latitudes 5°–14° N andlongitudes 5°–18° E. It is bordered to Kuje Area Councilof Federal Capital Territory to the North: Koton-KarfeLGA of Kogi State to the South, while to the West,Abaji Area Council of the F.C.T and Nasarawa LGA ofNasarawa State to the East. It has annual average rainfall of between 1100 and 2000 mm (Bureau of LandSurvey Lafia 2005). Rainfall varies from 131.73 cm in
www.asp.zut.edu.pl 17
Girei, A.A., Ndanitsa, M.A., Ogezi, E. (2021). Smoked and fresh fish marketing in Toto Local Government Area of Nasarawa State,Nigeria: a comparative analysis. Acta Sci. Pol. Zootechnica, 20(1), 15–26. DOI: 10.21005/asp.2021.20.1.02
some place to 145 cm in other, maximum temperatureof 35°C and minimum temperature of 10°C. It has anarea of 2,903 km and had a population of 119,077 as at2006 [NPC 2006]. At 2.8% growth rate as provided forby NPC [2006] the population is projected to be 160,700in 2017. The dominant occupation of the inhabitants isagriculture; crops grown include maize, cassava, yam,sorghum, millet, rice, cowpea, sesame, cocoyam, sweetpotato among others. Livestock rearing is also practiced.
Sampling techniques and sample size
A two-stage sampling technique involving purposive andrandom sampling was adopted for the selection of eighty(80) fish traders for the study. The first stage was the pur-posive selection of four markets out of the seven (7) mar-kets (Agyeneze, Dausu, Katakpa, Shege, Toto, Ugya andUmaisha) in the area on the basis of the magnitude ofsales recorded by these markets. These are markets wheresmoked and fresh fish were predominantly traded. Thesefour markets are: Dausu, Toto, Shege and Umaisha. Thesecond stage was random selection of twenty fish mar-keters per market (ten each of smoked and fresh fish mar-keters per market) after a pre-survey carried out to ob-tain the list of fish traders in each market to serve as asampling frame. Data for the study were finally obtainedusing primary sources through structured questionnaireswhich were administered to the selected fish sellers.
Analytical techniques
The following tools were employed and used in thestudy. Descriptive statistics was used to measure frequen-cies, percentages, ranking (objectives 1, 4 and 5), GiniCoefficient (G.C) (objective 2). Farm budgetary tech-nique: Gross margin analysis was employed to ascertainthe profitability of both smoked and fish marketing, (ob-jective 3) of the study.
Gini coefficient and Lorenz curve
The G.C was use together with Lorenz curve to measurethe level of m marketer’s concentration. This will helpin determining the degree of competition or monopoly inthe fish market.
The Gini coefficient (GC) is presented as follows;
GC = 1−∑ XY (i)
where:
∑− summation signX − proportion of fresh/dried fish sellersY − cumulative percentage of the sales
The G.C has the possibly of values ranging between0 and 1 expressing the extent to which the market is con-centrated. A perfect equality in concentration (low) of
sellers is expected if the value of the gini coefficient tendstowards zero, while perfect inequality in concentration(high) of sellers is expected if the GC value tends towardsone. On the other hand, if GC = 1, the market is said tobe imperfect, and if GC = 0, the market is perfect andcompetitive.
Market performance
Marketing margin, costs and returns and marketing effi-ciency were used to examine market performance in freshand dried fish marketing in the study area. Marketing ef-ficiency is defined as the maximization of the ratio of out-put to input in marketing [Olukosi et al. 2005]. Marketingefficiency is the ratio of market output to market input andis the degree of marketing performance. Increasing ratiorepresents improved efficiency and decrease denotes re-duced efficiency [Acharya and Agarwal 2004].
Marketing efficiency =
=Gross revenue (GR)
Total marketing cost (TMC)× 100
(ii)
According to Olukosi and Erhabor [1988], Grossmargin is used as a tool for planning where fixed costsis a negligible portion of the enterprise.
Gross margin = TR (P*Q)− TVC (iii)
Percentage marketing margin =
=Margin of sales
Selling price× 100
(iv)
Net benefit cost ratio =Net revenueTotal cost
(v)
Benefit cost ratio =Total revenue
Total cost(vi)
RESULTS AND DISCUSSION
The socio-economic characteristics of respondents suchas age, gender, marital status, educational level, house-hold size, sources of capital, years of marketing experi-ence, membership of marketer association were analysedusing simple descriptive statistics as presented in Table 1.The results showed that majority of the marketers werefemale (58.7%) while 41.3% of the respondents weremale. This implies that fish market consists of both maleand female and there is no bias based on sex in fish mar-keting. This finding is similar to that of Offor et al. [2016]who stated that female’s role was more in the market-ing of smoked fish than the males. This is also in con-sonance with the findings of Thilsted et al. [2015] whoreported that women are actively involved in fish market-ing and processing. Result also reveals that 40.0% of therespondents were within the age group of 15–25 years,32.5% were within the age group of 45 and above, 20.0%
18 www.asp.zut.edu.pl
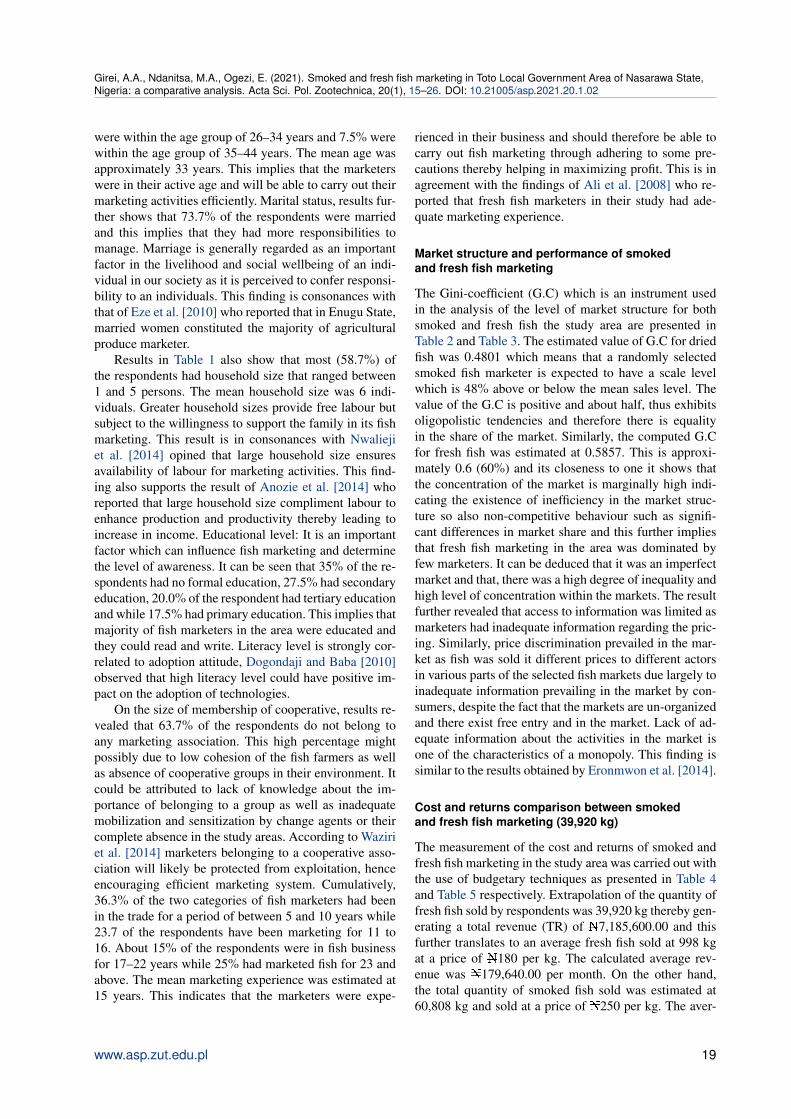
Girei, A.A., Ndanitsa, M.A., Ogezi, E. (2021). Smoked and fresh fish marketing in Toto Local Government Area of Nasarawa State,Nigeria: a comparative analysis. Acta Sci. Pol. Zootechnica, 20(1), 15–26. DOI: 10.21005/asp.2021.20.1.02
were within the age group of 26–34 years and 7.5% werewithin the age group of 35–44 years. The mean age wasapproximately 33 years. This implies that the marketerswere in their active age and will be able to carry out theirmarketing activities efficiently. Marital status, results fur-ther shows that 73.7% of the respondents were marriedand this implies that they had more responsibilities tomanage. Marriage is generally regarded as an importantfactor in the livelihood and social wellbeing of an indi-vidual in our society as it is perceived to confer responsi-bility to an individuals. This finding is consonances withthat of Eze et al. [2010] who reported that in Enugu State,married women constituted the majority of agriculturalproduce marketer.
Results in Table 1 also show that most (58.7%) ofthe respondents had household size that ranged between1 and 5 persons. The mean household size was 6 indi-viduals. Greater household sizes provide free labour butsubject to the willingness to support the family in its fishmarketing. This result is in consonances with Nwaliejiet al. [2014] opined that large household size ensuresavailability of labour for marketing activities. This find-ing also supports the result of Anozie et al. [2014] whoreported that large household size compliment labour toenhance production and productivity thereby leading toincrease in income. Educational level: It is an importantfactor which can influence fish marketing and determinethe level of awareness. It can be seen that 35% of the re-spondents had no formal education, 27.5% had secondaryeducation, 20.0% of the respondent had tertiary educationand while 17.5% had primary education. This implies thatmajority of fish marketers in the area were educated andthey could read and write. Literacy level is strongly cor-related to adoption attitude, Dogondaji and Baba [2010]observed that high literacy level could have positive im-pact on the adoption of technologies.
On the size of membership of cooperative, results re-vealed that 63.7% of the respondents do not belong toany marketing association. This high percentage mightpossibly due to low cohesion of the fish farmers as wellas absence of cooperative groups in their environment. Itcould be attributed to lack of knowledge about the im-portance of belonging to a group as well as inadequatemobilization and sensitization by change agents or theircomplete absence in the study areas. According to Waziriet al. [2014] marketers belonging to a cooperative asso-ciation will likely be protected from exploitation, henceencouraging efficient marketing system. Cumulatively,36.3% of the two categories of fish marketers had beenin the trade for a period of between 5 and 10 years while23.7 of the respondents have been marketing for 11 to16. About 15% of the respondents were in fish businessfor 17–22 years while 25% had marketed fish for 23 andabove. The mean marketing experience was estimated at15 years. This indicates that the marketers were expe-
rienced in their business and should therefore be able tocarry out fish marketing through adhering to some pre-cautions thereby helping in maximizing profit. This is inagreement with the findings of Ali et al. [2008] who re-ported that fresh fish marketers in their study had ade-quate marketing experience.
Market structure and performance of smokedand fresh fish marketing
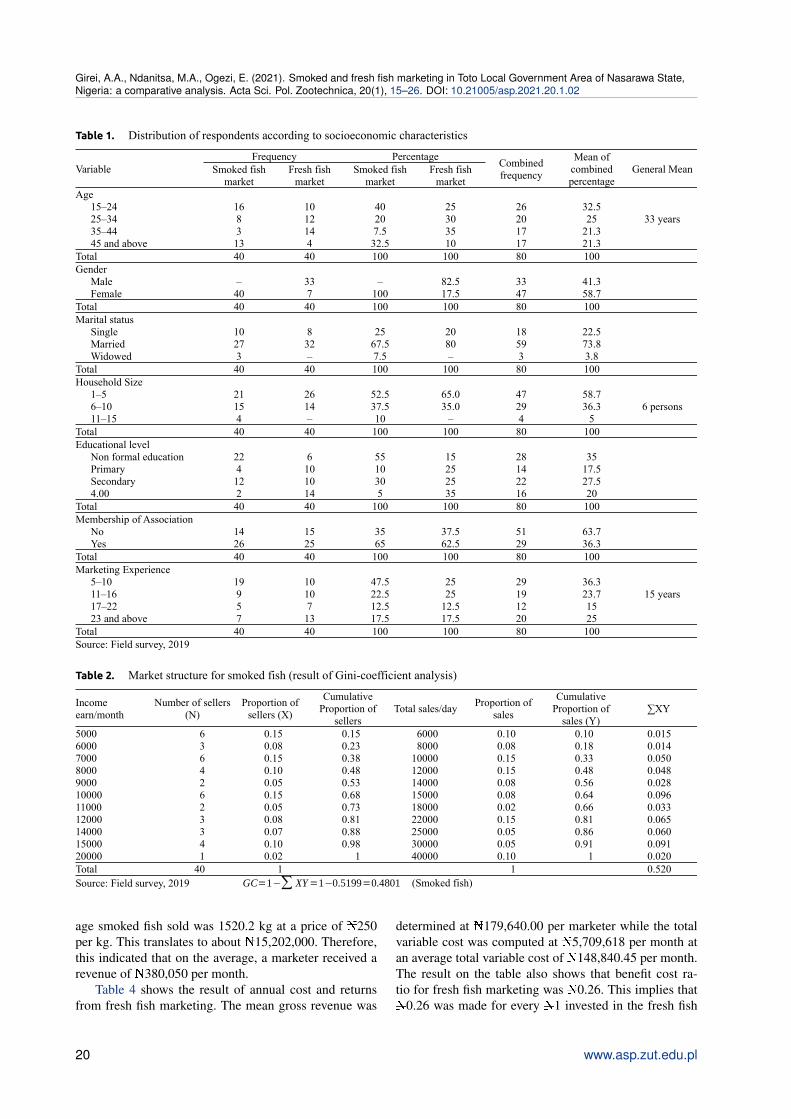
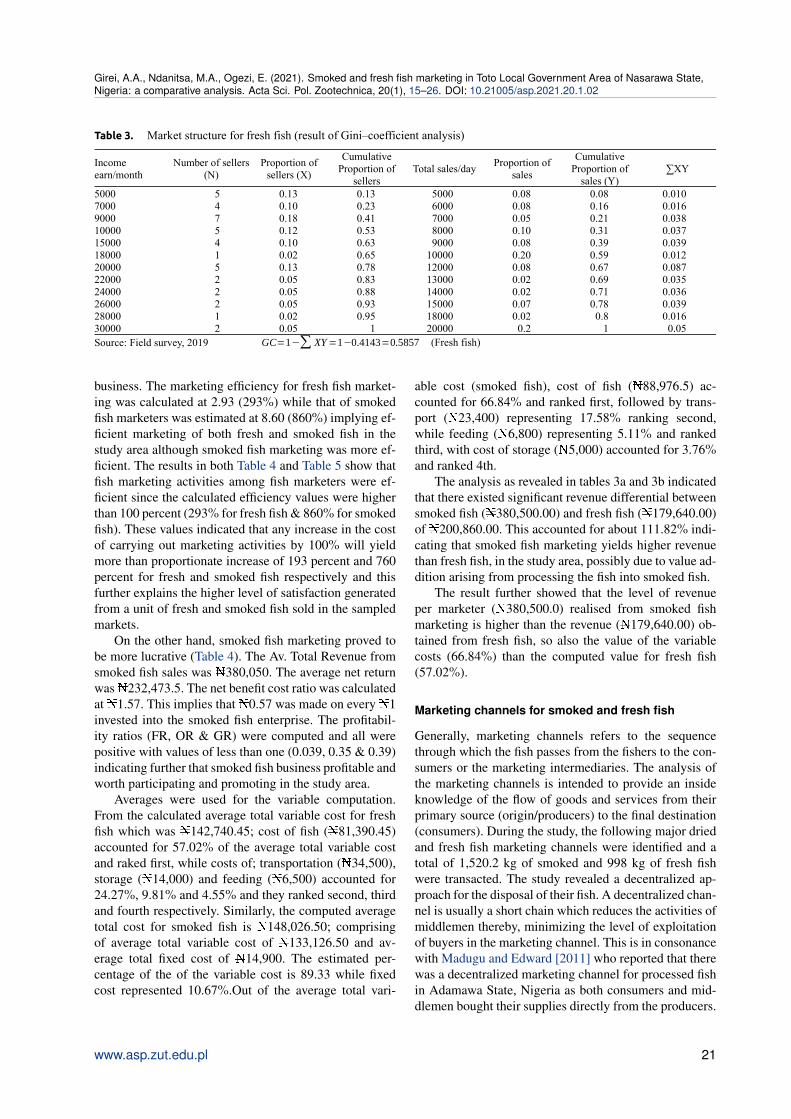
The Gini-coefficient (G.C) which is an instrument usedin the analysis of the level of market structure for bothsmoked and fresh fish the study area are presented inTable 2 and Table 3. The estimated value of G.C for driedfish was 0.4801 which means that a randomly selectedsmoked fish marketer is expected to have a scale levelwhich is 48% above or below the mean sales level. Thevalue of the G.C is positive and about half, thus exhibitsoligopolistic tendencies and therefore there is equalityin the share of the market. Similarly, the computed G.Cfor fresh fish was estimated at 0.5857. This is approxi-mately 0.6 (60%) and its closeness to one it shows thatthe concentration of the market is marginally high indi-cating the existence of inefficiency in the market struc-ture so also non-competitive behaviour such as signifi-cant differences in market share and this further impliesthat fresh fish marketing in the area was dominated byfew marketers. It can be deduced that it was an imperfectmarket and that, there was a high degree of inequality andhigh level of concentration within the markets. The resultfurther revealed that access to information was limited asmarketers had inadequate information regarding the pric-ing. Similarly, price discrimination prevailed in the mar-ket as fish was sold it different prices to different actorsin various parts of the selected fish markets due largely toinadequate information prevailing in the market by con-sumers, despite the fact that the markets are un-organizedand there exist free entry and in the market. Lack of ad-equate information about the activities in the market isone of the characteristics of a monopoly. This finding issimilar to the results obtained by Eronmwon et al. [2014].
Cost and returns comparison between smokedand fresh fish marketing (39,920 kg)
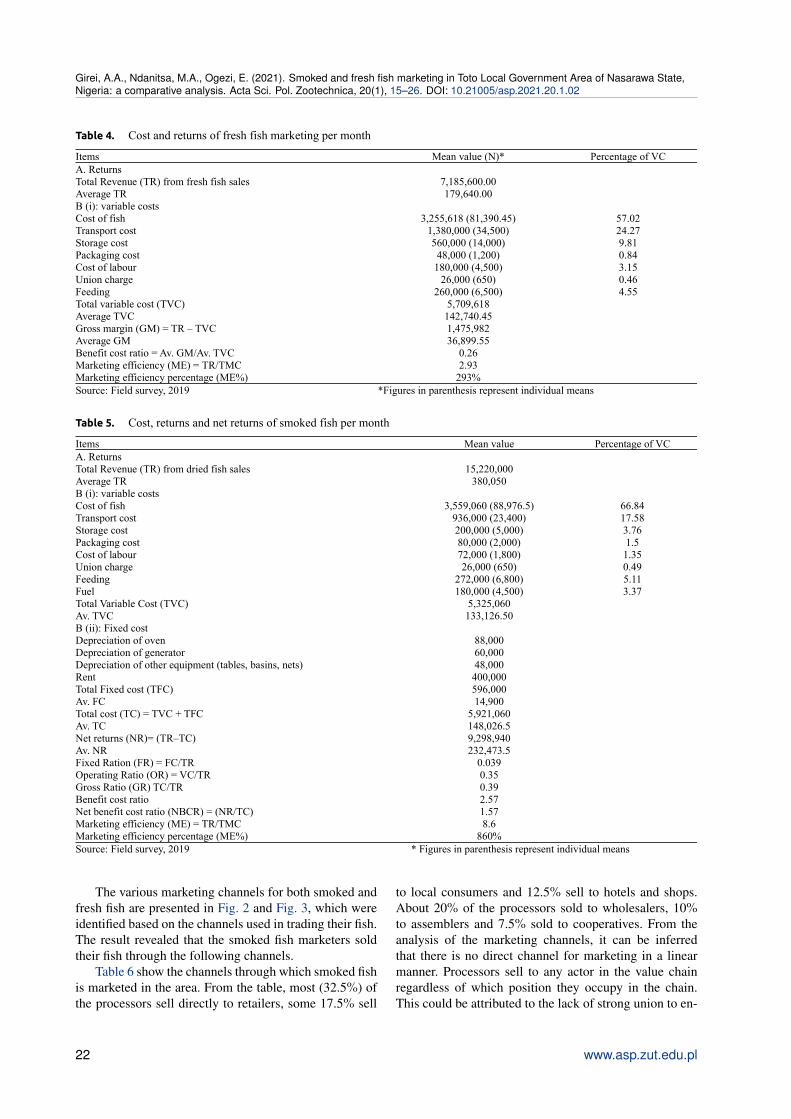
The measurement of the cost and returns of smoked andfresh fish marketing in the study area was carried out withthe use of budgetary techniques as presented in Table 4and Table 5 respectively. Extrapolation of the quantity offresh fish sold by respondents was 39,920 kg thereby gen-erating a total revenue (TR) of �7,185,600.00 and thisfurther translates to an average fresh fish sold at 998 kgat a price of �180 per kg. The calculated average rev-enue was �179,640.00 per month. On the other hand,the total quantity of smoked fish sold was estimated at60,808 kg and sold at a price of �250 per kg. The aver-
www.asp.zut.edu.pl 19
Girei, A.A., Ndanitsa, M.A., Ogezi, E. (2021). Smoked and fresh fish marketing in Toto Local Government Area of Nasarawa State,Nigeria: a comparative analysis. Acta Sci. Pol. Zootechnica, 20(1), 15–26. DOI: 10.21005/asp.2021.20.1.02
Table 1. Distribution of respondents according to socioeconomic characteristics
VariableFrequency Percentage
Combinedfrequency
Mean ofcombinedpercentage
General MeanSmoked fishmarket
Fresh fishmarket
Smoked fishmarket
Fresh fishmarket
Age15–24 16 10 40 25 26 32.525–34 8 12 20 30 20 25 33 years35–44 3 14 7.5 35 17 21.345 and above 13 4 32.5 10 17 21.3
Total 40 40 100 100 80 100Gender
Male – 33 – 82.5 33 41.3Female 40 7 100 17.5 47 58.7
Total 40 40 100 100 80 100Marital status
Single 10 8 25 20 18 22.5Married 27 32 67.5 80 59 73.8Widowed 3 – 7.5 – 3 3.8
Total 40 40 100 100 80 100Household Size
1–5 21 26 52.5 65.0 47 58.76–10 15 14 37.5 35.0 29 36.3 6 persons11–15 4 – 10 – 4 5
Total 40 40 100 100 80 100Educational level
Non formal education 22 6 55 15 28 35Primary 4 10 10 25 14 17.5Secondary 12 10 30 25 22 27.54.00 2 14 5 35 16 20
Total 40 40 100 100 80 100Membership of Association
No 14 15 35 37.5 51 63.7Yes 26 25 65 62.5 29 36.3
Total 40 40 100 100 80 100Marketing Experience
5–10 19 10 47.5 25 29 36.311–16 9 10 22.5 25 19 23.7 15 years17–22 5 7 12.5 12.5 12 1523 and above 7 13 17.5 17.5 20 25
Total 40 40 100 100 80 100Source: Field survey, 2019
Table 2. Market structure for smoked fish (result of Gini-coefficient analysis)
Income earn/month
Number of sellers(N)
Proportion ofsellers (X)
CumulativeProportion of
sellersTotal sales/day
Proportion ofsales
CumulativeProportion of
sales (Y)∑XY
5000 6 0.15 0.15 6000 0.10 0.10 0.0156000 3 0.08 0.23 8000 0.08 0.18 0.0147000 6 0.15 0.38 10000 0.15 0.33 0.0508000 4 0.10 0.48 12000 0.15 0.48 0.0489000 2 0.05 0.53 14000 0.08 0.56 0.02810000 6 0.15 0.68 15000 0.08 0.64 0.09611000 2 0.05 0.73 18000 0.02 0.66 0.03312000 3 0.08 0.81 22000 0.15 0.81 0.06514000 3 0.07 0.88 25000 0.05 0.86 0.06015000 4 0.10 0.98 30000 0.05 0.91 0.09120000 1 0.02 1 40000 0.10 1 0.020Total 40 1 1 0.520Source: Field survey, 2019 GC=1−∑ XY=1−0.5199=0.4801 (Smoked fish)
age smoked fish sold was 1520.2 kg at a price of �250per kg. This translates to about �15,202,000. Therefore,this indicated that on the average, a marketer received arevenue of �380,050 per month.
Table 4 shows the result of annual cost and returnsfrom fresh fish marketing. The mean gross revenue was
determined at �179,640.00 per marketer while the totalvariable cost was computed at �5,709,618 per month atan average total variable cost of �148,840.45 per month.The result on the table also shows that benefit cost ra-tio for fresh fish marketing was �0.26. This implies that�0.26 was made for every �1 invested in the fresh fish
20 www.asp.zut.edu.pl
Girei, A.A., Ndanitsa, M.A., Ogezi, E. (2021). Smoked and fresh fish marketing in Toto Local Government Area of Nasarawa State,Nigeria: a comparative analysis. Acta Sci. Pol. Zootechnica, 20(1), 15–26. DOI: 10.21005/asp.2021.20.1.02
Table 3. Market structure for fresh fish (result of Gini–coefficient analysis)
Income earn/month
Number of sellers(N)
Proportion ofsellers (X)
CumulativeProportion of
sellersTotal sales/day
Proportion ofsales
CumulativeProportion of
sales (Y)∑XY
5000 5 0.13 0.13 5000 0.08 0.08 0.0107000 4 0.10 0.23 6000 0.08 0.16 0.0169000 7 0.18 0.41 7000 0.05 0.21 0.03810000 5 0.12 0.53 8000 0.10 0.31 0.03715000 4 0.10 0.63 9000 0.08 0.39 0.03918000 1 0.02 0.65 10000 0.20 0.59 0.01220000 5 0.13 0.78 12000 0.08 0.67 0.08722000 2 0.05 0.83 13000 0.02 0.69 0.03524000 2 0.05 0.88 14000 0.02 0.71 0.03626000 2 0.05 0.93 15000 0.07 0.78 0.03928000 1 0.02 0.95 18000 0.02 0.8 0.01630000 2 0.05 1 20000 0.2 1 0.05Source: Field survey, 2019 GC=1−∑ XY=1−0.4143=0.5857 (Fresh fish)
business. The marketing efficiency for fresh fish market-ing was calculated at 2.93 (293%) while that of smokedfish marketers was estimated at 8.60 (860%) implying ef-ficient marketing of both fresh and smoked fish in thestudy area although smoked fish marketing was more ef-ficient. The results in both Table 4 and Table 5 show thatfish marketing activities among fish marketers were ef-ficient since the calculated efficiency values were higherthan 100 percent (293% for fresh fish & 860% for smokedfish). These values indicated that any increase in the costof carrying out marketing activities by 100% will yieldmore than proportionate increase of 193 percent and 760percent for fresh and smoked fish respectively and thisfurther explains the higher level of satisfaction generatedfrom a unit of fresh and smoked fish sold in the sampledmarkets.
On the other hand, smoked fish marketing proved tobe more lucrative (Table 4). The Av. Total Revenue fromsmoked fish sales was �380,050. The average net returnwas�232,473.5. The net benefit cost ratio was calculatedat �1.57. This implies that �0.57 was made on every �1invested into the smoked fish enterprise. The profitabil-ity ratios (FR, OR & GR) were computed and all werepositive with values of less than one (0.039, 0.35 & 0.39)indicating further that smoked fish business profitable andworth participating and promoting in the study area.
Averages were used for the variable computation.From the calculated average total variable cost for freshfish which was �142,740.45; cost of fish (�81,390.45)accounted for 57.02% of the average total variable costand raked first, while costs of; transportation (�34,500),storage (�14,000) and feeding (�6,500) accounted for24.27%, 9.81% and 4.55% and they ranked second, thirdand fourth respectively. Similarly, the computed averagetotal cost for smoked fish is �148,026.50; comprisingof average total variable cost of �133,126.50 and av-erage total fixed cost of �14,900. The estimated per-centage of the of the variable cost is 89.33 while fixedcost represented 10.67%.Out of the average total vari-
able cost (smoked fish), cost of fish (�88,976.5) ac-counted for 66.84% and ranked first, followed by trans-port (�23,400) representing 17.58% ranking second,while feeding (�6,800) representing 5.11% and rankedthird, with cost of storage (�5,000) accounted for 3.76%and ranked 4th.
The analysis as revealed in tables 3a and 3b indicatedthat there existed significant revenue differential betweensmoked fish (�380,500.00) and fresh fish (�179,640.00)of �200,860.00. This accounted for about 111.82% indi-cating that smoked fish marketing yields higher revenuethan fresh fish, in the study area, possibly due to value ad-dition arising from processing the fish into smoked fish.
The result further showed that the level of revenueper marketer (�380,500.0) realised from smoked fishmarketing is higher than the revenue (�179,640.00) ob-tained from fresh fish, so also the value of the variablecosts (66.84%) than the computed value for fresh fish(57.02%).
Marketing channels for smoked and fresh fish
Generally, marketing channels refers to the sequencethrough which the fish passes from the fishers to the con-sumers or the marketing intermediaries. The analysis ofthe marketing channels is intended to provide an insideknowledge of the flow of goods and services from theirprimary source (origin/producers) to the final destination(consumers). During the study, the following major driedand fresh fish marketing channels were identified and atotal of 1,520.2 kg of smoked and 998 kg of fresh fishwere transacted. The study revealed a decentralized ap-proach for the disposal of their fish. A decentralized chan-nel is usually a short chain which reduces the activities ofmiddlemen thereby, minimizing the level of exploitationof buyers in the marketing channel. This is in consonancewith Madugu and Edward [2011] who reported that therewas a decentralized marketing channel for processed fishin Adamawa State, Nigeria as both consumers and mid-dlemen bought their supplies directly from the producers.
www.asp.zut.edu.pl 21
Girei, A.A., Ndanitsa, M.A., Ogezi, E. (2021). Smoked and fresh fish marketing in Toto Local Government Area of Nasarawa State,Nigeria: a comparative analysis. Acta Sci. Pol. Zootechnica, 20(1), 15–26. DOI: 10.21005/asp.2021.20.1.02
Table 4. Cost and returns of fresh fish marketing per month
Items Mean value (N)* Percentage of VCA. ReturnsTotal Revenue (TR) from fresh fish sales 7,185,600.00Average TRB (i): variable costs
179,640.00
Cost of fish 3,255,618 (81,390.45) 57.02Transport cost 1,380,000 (34,500) 24.27Storage cost 560,000 (14,000) 9.81Packaging cost 48,000 (1,200) 0.84Cost of labour 180,000 (4,500) 3.15Union charge 26,000 (650) 0.46Feeding 260,000 (6,500) 4.55Total variable cost (TVC) 5,709,618Average TVC 142,740.45Gross margin (GM) = TR – TVC 1,475,982Average GM 36,899.55Benefit cost ratio = Av. GM/Av. TVC 0.26Marketing efficiency (ME) = TR/TMC 2.93Marketing efficiency percentage (ME%) 293%Source: Field survey, 2019 *Figures in parenthesis represent individual means
Table 5. Cost, returns and net returns of smoked fish per month
Items Mean value Percentage of VCA. ReturnsTotal Revenue (TR) from dried fish salesAverage TR
15,220,000380,050
B (i): variable costsCost of fish 3,559,060 (88,976.5) 66.84Transport cost 936,000 (23,400) 17.58Storage cost 200,000 (5,000) 3.76Packaging cost 80,000 (2,000) 1.5Cost of labour 72,000 (1,800) 1.35Union charge 26,000 (650) 0.49Feeding 272,000 (6,800) 5.11Fuel Total Variable Cost (TVC)
180,000 (4,500)5,325,060
3.37
Av. TVC 133,126.50B (ii): Fixed costDepreciation of oven 88,000Depreciation of generator 60,000Depreciation of other equipment (tables, basins, nets) 48,000Rent 400,000Total Fixed cost (TFC) Av. FC
596,00014,900
Total cost (TC) = TVC + TFCAv. TC
5,921,060148,026.5
Net returns (NR)= (TR–TC)Av. NRFixed Ration (FR) = FC/TROperating Ratio (OR) = VC/TRGross Ratio (GR) TC/TR
9,298,940232,473.5
0.0390.350.39
Benefit cost ratio 2.57Net benefit cost ratio (NBCR) = (NR/TC) 1.57Marketing efficiency (ME) = TR/TMCMarketing efficiency percentage (ME%)
8.6860%
Source: Field survey, 2019 * Figures in parenthesis represent individual means
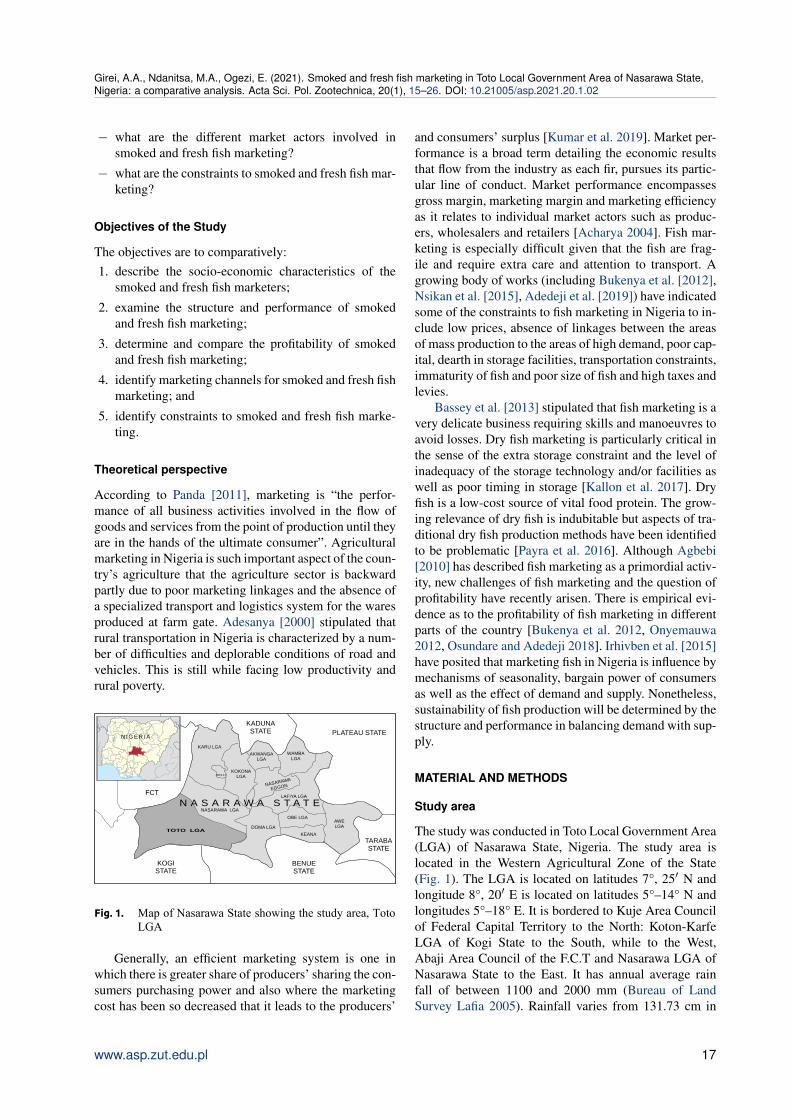
The various marketing channels for both smoked andfresh fish are presented in Fig. 2 and Fig. 3, which wereidentified based on the channels used in trading their fish.The result revealed that the smoked fish marketers soldtheir fish through the following channels.
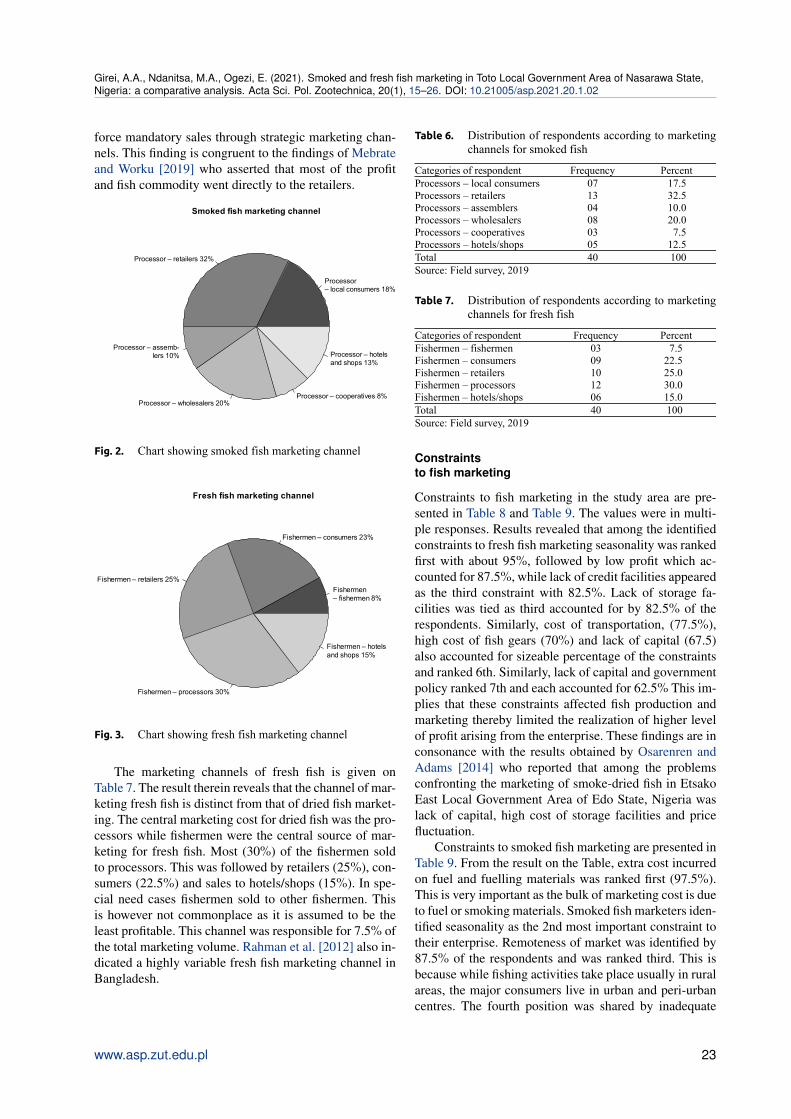
Table 6 show the channels through which smoked fishis marketed in the area. From the table, most (32.5%) ofthe processors sell directly to retailers, some 17.5% sell
to local consumers and 12.5% sell to hotels and shops.About 20% of the processors sold to wholesalers, 10%to assemblers and 7.5% sold to cooperatives. From theanalysis of the marketing channels, it can be inferredthat there is no direct channel for marketing in a linearmanner. Processors sell to any actor in the value chainregardless of which position they occupy in the chain.This could be attributed to the lack of strong union to en-
22 www.asp.zut.edu.pl
Girei, A.A., Ndanitsa, M.A., Ogezi, E. (2021). Smoked and fresh fish marketing in Toto Local Government Area of Nasarawa State,Nigeria: a comparative analysis. Acta Sci. Pol. Zootechnica, 20(1), 15–26. DOI: 10.21005/asp.2021.20.1.02
force mandatory sales through strategic marketing chan-nels. This finding is congruent to the findings of Mebrateand Worku [2019] who asserted that most of the profitand fish commodity went directly to the retailers.
Fig. 2. Chart showing smoked fish marketing channel
Processor – local consumers 18%
Processor – retailers 32%
Processor – assemb-lers 10%
Processor – wholesalers 20%Processor – cooperatives 8%
Processor – hotels and shops 13%
Smoked fish marketing channel
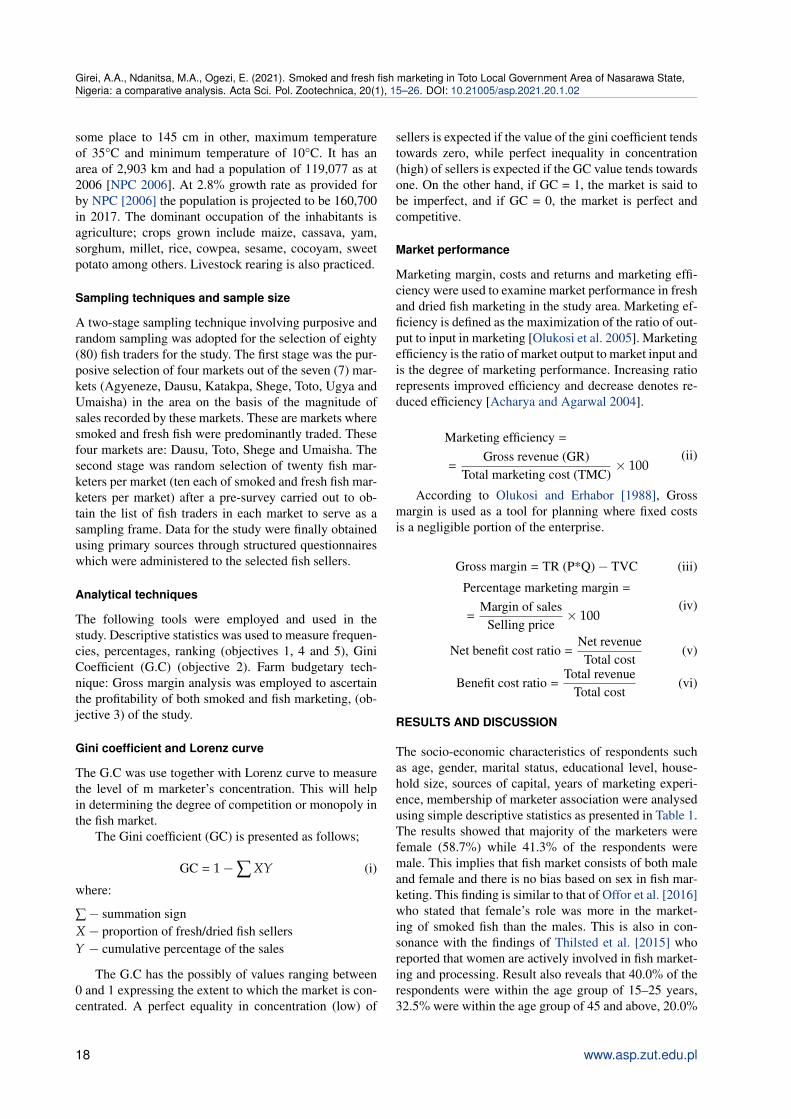
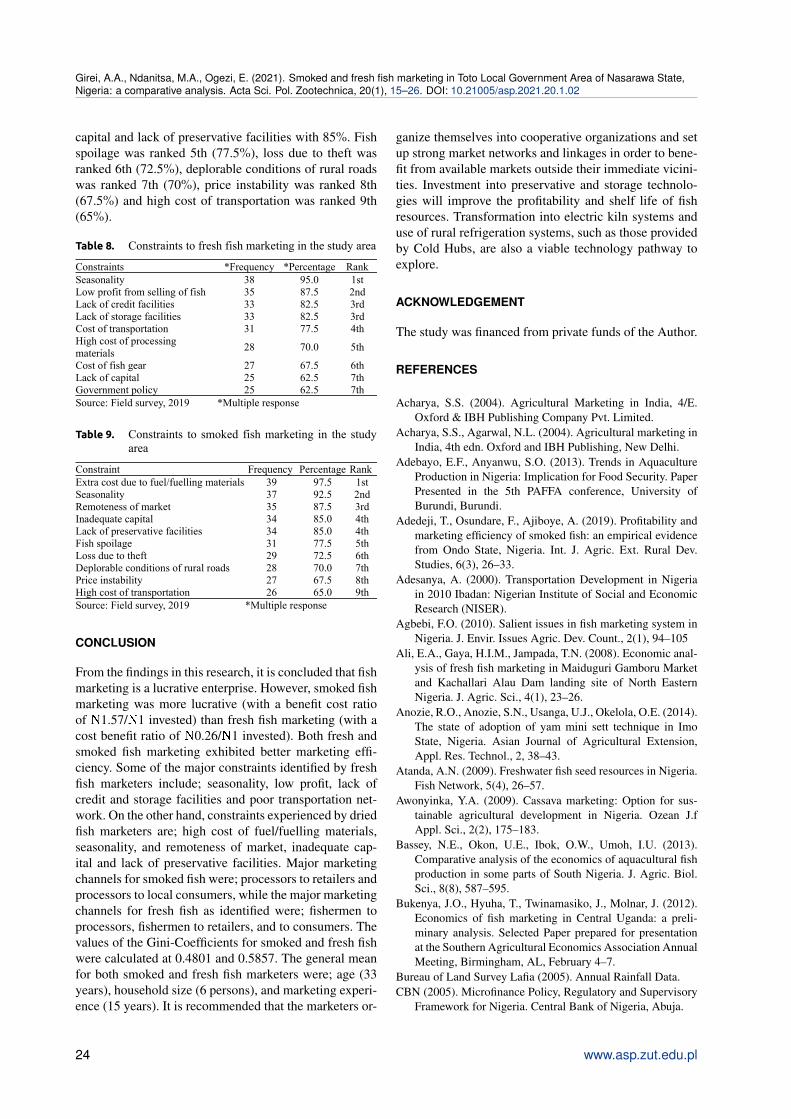
Fig. 3. Chart showing fresh fish marketing channel
Fishermen – fishermen 8%
Fishermen – consumers 23%
Fishermen – retailers 25%
Fishermen – processors 30%
Fishermen – hotels and shops 15%
Fresh fish marketing channel
The marketing channels of fresh fish is given onTable 7. The result therein reveals that the channel of mar-keting fresh fish is distinct from that of dried fish market-ing. The central marketing cost for dried fish was the pro-cessors while fishermen were the central source of mar-keting for fresh fish. Most (30%) of the fishermen soldto processors. This was followed by retailers (25%), con-sumers (22.5%) and sales to hotels/shops (15%). In spe-cial need cases fishermen sold to other fishermen. Thisis however not commonplace as it is assumed to be theleast profitable. This channel was responsible for 7.5% ofthe total marketing volume. Rahman et al. [2012] also in-dicated a highly variable fresh fish marketing channel inBangladesh.
Table 6. Distribution of respondents according to marketingchannels for smoked fish
Categories of respondent Frequency PercentProcessors – local consumers 07 17.5Processors – retailers 13 32.5Processors – assemblers 04 10.0Processors – wholesalers 08 20.0Processors – cooperatives 03 7.5Processors – hotels/shops 05 12.5Total 40 100Source: Field survey, 2019
Table 7. Distribution of respondents according to marketingchannels for fresh fish
Categories of respondent Frequency PercentFishermen – fishermen 03 7.5Fishermen – consumers 09 22.5Fishermen – retailers 10 25.0Fishermen – processors 12 30.0Fishermen – hotels/shops 06 15.0Total 40 100Source: Field survey, 2019
Constraintsto fish marketing
Constraints to fish marketing in the study area are pre-sented in Table 8 and Table 9. The values were in multi-ple responses. Results revealed that among the identifiedconstraints to fresh fish marketing seasonality was rankedfirst with about 95%, followed by low profit which ac-counted for 87.5%, while lack of credit facilities appearedas the third constraint with 82.5%. Lack of storage fa-cilities was tied as third accounted for by 82.5% of therespondents. Similarly, cost of transportation, (77.5%),high cost of fish gears (70%) and lack of capital (67.5)also accounted for sizeable percentage of the constraintsand ranked 6th. Similarly, lack of capital and governmentpolicy ranked 7th and each accounted for 62.5% This im-plies that these constraints affected fish production andmarketing thereby limited the realization of higher levelof profit arising from the enterprise. These findings are inconsonance with the results obtained by Osarenren andAdams [2014] who reported that among the problemsconfronting the marketing of smoke-dried fish in EtsakoEast Local Government Area of Edo State, Nigeria waslack of capital, high cost of storage facilities and pricefluctuation.
Constraints to smoked fish marketing are presented inTable 9. From the result on the Table, extra cost incurredon fuel and fuelling materials was ranked first (97.5%).This is very important as the bulk of marketing cost is dueto fuel or smoking materials. Smoked fish marketers iden-tified seasonality as the 2nd most important constraint totheir enterprise. Remoteness of market was identified by87.5% of the respondents and was ranked third. This isbecause while fishing activities take place usually in ruralareas, the major consumers live in urban and peri-urbancentres. The fourth position was shared by inadequate
www.asp.zut.edu.pl 23
Girei, A.A., Ndanitsa, M.A., Ogezi, E. (2021). Smoked and fresh fish marketing in Toto Local Government Area of Nasarawa State,Nigeria: a comparative analysis. Acta Sci. Pol. Zootechnica, 20(1), 15–26. DOI: 10.21005/asp.2021.20.1.02
capital and lack of preservative facilities with 85%. Fishspoilage was ranked 5th (77.5%), loss due to theft wasranked 6th (72.5%), deplorable conditions of rural roadswas ranked 7th (70%), price instability was ranked 8th(67.5%) and high cost of transportation was ranked 9th(65%).
Table 8. Constraints to fresh fish marketing in the study area
Constraints *Frequency *Percentage RankSeasonality 38 95.0 1stLow profit from selling of fish 35 87.5 2ndLack of credit facilities 33 82.5 3rdLack of storage facilities 33 82.5 3rdCost of transportation 31 77.5 4thHigh cost of processing materials
28 70.0 5th
Cost of fish gear 27 67.5 6thLack of capital 25 62.5 7thGovernment policy 25 62.5 7thSource: Field survey, 2019 *Multiple response
Table 9. Constraints to smoked fish marketing in the studyarea
Constraint Frequency Percentage Rank Extra cost due to fuel/fuelling materials 39 97.5 1stSeasonality 37 92.5 2ndRemoteness of market 35 87.5 3rdInadequate capital 34 85.0 4thLack of preservative facilities 34 85.0 4thFish spoilage 31 77.5 5thLoss due to theft 29 72.5 6thDeplorable conditions of rural roads 28 70.0 7thPrice instability 27 67.5 8thHigh cost of transportation 26 65.0 9thSource: Field survey, 2019 *Multiple response
CONCLUSION
From the findings in this research, it is concluded that fishmarketing is a lucrative enterprise. However, smoked fishmarketing was more lucrative (with a benefit cost ratioof �1.57/�1 invested) than fresh fish marketing (with acost benefit ratio of �0.26/�1 invested). Both fresh andsmoked fish marketing exhibited better marketing effi-ciency. Some of the major constraints identified by freshfish marketers include; seasonality, low profit, lack ofcredit and storage facilities and poor transportation net-work. On the other hand, constraints experienced by driedfish marketers are; high cost of fuel/fuelling materials,seasonality, and remoteness of market, inadequate cap-ital and lack of preservative facilities. Major marketingchannels for smoked fish were; processors to retailers andprocessors to local consumers, while the major marketingchannels for fresh fish as identified were; fishermen toprocessors, fishermen to retailers, and to consumers. Thevalues of the Gini-Coefficients for smoked and fresh fishwere calculated at 0.4801 and 0.5857. The general meanfor both smoked and fresh fish marketers were; age (33years), household size (6 persons), and marketing experi-ence (15 years). It is recommended that the marketers or-
ganize themselves into cooperative organizations and setup strong market networks and linkages in order to bene-fit from available markets outside their immediate vicini-ties. Investment into preservative and storage technolo-gies will improve the profitability and shelf life of fishresources. Transformation into electric kiln systems anduse of rural refrigeration systems, such as those providedby Cold Hubs, are also a viable technology pathway toexplore.
ACKNOWLEDGEMENT
The study was financed from private funds of the Author.
REFERENCES
Acharya, S.S. (2004). Agricultural Marketing in India, 4/E.Oxford & IBH Publishing Company Pvt. Limited.
Acharya, S.S., Agarwal, N.L. (2004). Agricultural marketing inIndia, 4th edn. Oxford and IBH Publishing, New Delhi.
Adebayo, E.F., Anyanwu, S.O. (2013). Trends in AquacultureProduction in Nigeria: Implication for Food Security. PaperPresented in the 5th PAFFA conference, University ofBurundi, Burundi.
Adedeji, T., Osundare, F., Ajiboye, A. (2019). Profitability andmarketing efficiency of smoked fish: an empirical evidencefrom Ondo State, Nigeria. Int. J. Agric. Ext. Rural Dev.Studies, 6(3), 26–33.
Adesanya, A. (2000). Transportation Development in Nigeriain 2010 Ibadan: Nigerian Institute of Social and EconomicResearch (NISER).
Agbebi, F.O. (2010). Salient issues in fish marketing system inNigeria. J. Envir. Issues Agric. Dev. Count., 2(1), 94–105
Ali, E.A., Gaya, H.I.M., Jampada, T.N. (2008). Economic anal-ysis of fresh fish marketing in Maiduguri Gamboru Marketand Kachallari Alau Dam landing site of North EasternNigeria. J. Agric. Sci., 4(1), 23–26.
Anozie, R.O., Anozie, S.N., Usanga, U.J., Okelola, O.E. (2014).The state of adoption of yam mini sett technique in ImoState, Nigeria. Asian Journal of Agricultural Extension,Appl. Res. Technol., 2, 38–43.
Atanda, A.N. (2009). Freshwater fish seed resources in Nigeria.Fish Network, 5(4), 26–57.
Awonyinka, Y.A. (2009). Cassava marketing: Option for sus-tainable agricultural development in Nigeria. Ozean J.fAppl. Sci., 2(2), 175–183.
Bassey, N.E., Okon, U.E., Ibok, O.W., Umoh, I.U. (2013).Comparative analysis of the economics of aquacultural fishproduction in some parts of South Nigeria. J. Agric. Biol.Sci., 8(8), 587–595.
Bukenya, J.O., Hyuha, T., Twinamasiko, J., Molnar, J. (2012).Economics of fish marketing in Central Uganda: a preli-minary analysis. Selected Paper prepared for presentationat the Southern Agricultural Economics Association AnnualMeeting, Birmingham, AL, February 4–7.
Bureau of Land Survey Lafia (2005). Annual Rainfall Data.CBN (2005). Microfinance Policy, Regulatory and Supervisory
Framework for Nigeria. Central Bank of Nigeria, Abuja.
24 www.asp.zut.edu.pl

Girei, A.A., Ndanitsa, M.A., Ogezi, E. (2021). Smoked and fresh fish marketing in Toto Local Government Area of Nasarawa State,Nigeria: a comparative analysis. Acta Sci. Pol. Zootechnica, 20(1), 15–26. DOI: 10.21005/asp.2021.20.1.02
Dogondaji, S.D., Baba, K.M. (2010). Income distribution inlarge scale irrigation projects: A case study of dry sea-son rice farmers at the Bakolori irrigation project, Zamfarastate, Nigeria. Proceedings of the 24th Annual NationalConference of the Farm Management of Nigeria held at theAdamawa State University, Mubi, 11th–14th October, 2010.
Eronmwon, I., Alufohai, G.O., Ada-Okungbowa, C.I (2014).Structure, conduct and performance of plantain marketingin Edo State, Nigeria. J. Appl. Sci. Environ. Manage, 18(3),437–440.
Ewepu, G. (2019). Nigeria needs no fish importation – Fishfarmers. www.vanguardngr.com.
Eyo, A.A. (2001). Fish processing technology in the tropics,University of Ilorin Press, Ilorin, Kwara State, Nigeria.
Eze, S.O., Ezeh, A.N., Onwubuya, E.A (2010). Women mar-keters’ perceived constraints on elected agricultural producemarketing in Enugu South Local Government Area: chal-lenges of extension training for women groups in EnuguState, Nigeria. Agro-Sci. J. Trop. Agric., Food, Env. Exten,9(3), 215–222. DOI: 10.4314/as.v9i3.65762.
FAO (2008). Fisheries: gender discrimination is perpetuatedin women’s limited access to credit, Storage facilities andTraining.
FAO (2012). Production, accessibility, marketing and consump-tion patterns of freshwater aquaculture products in Asia:a cross-country comparison. www.fao.org.
Idowu, A.A., Olaoye, O.J., Ifebesan, A., Abdul, W.O.,Oluwale, O.B. (2012). Evaluation of fishermen and fishtraders in transactional sex for fish marketing in coastal ar-eas of Ogun Waterside Local Government Areas of OgunState, Nigeria. Global J. Sci. Front. Res., Agric. Biol., 12(1),43–54.
Irhivben, B.O., Enyioko, O., Oluwafemi, Z., Yusuf, S.A. (2015).Structure and performance of Catfish Market in IbadanMetropolis, Oyo State, Nigeria, Int. J. Social Sci. Human.Res., 3(3), 428–433.
Kallon, A., Lebbie, A., Sturm, B., Garnett, T., Wadsworth, R.(2017). Comparative studies of fish smoking and solar dry-ing in the Sierra Leone artisanal fishing industry. J. StoredProd. Postharvest Res., 8(3), 40–48.
Kumar, R.S., Kumar, D.K., Hoilenting, Prakash, S. (2019).Structure, conduct and performance of fish markets ofKhagaria District, India. Int. J. Res. Busin., Econ. Manag.,3(4), 1–13.
Kwara State Government (2010). Fish Farming Opportunitiesin Nigeria. A publication of Kwara State Government,Nigeria.
Madugu, A.J., Edward, A (2011). Marketing and distributionchannels of processed fish in Adamawa State, Nigeria.Global J. Manag. Busin. Res., 11(4), 21–26.
Mebrate, Y., Worku, A. (2019). Structure, conduct and per-formance of fish market in Central Ethiopia. ManagementStudies and Economic Systems (MSES), 4(4), 295–303.
Mshelia, Y.B., Bankole, N.O., Omorinkoba, W.S., Musa, Y.M.,Tafida, A.A. Richard, L.M. Ago, N.D., Adedeji, R.B.(2007). The marketing and distribution of fish in New Bussafish market area of Niger State. In: 22nd annual Conferenceof the Fisheries Society of Nigeria (FISON), 12–16 Nov.2007, Kebbi, Nigeria, 172–178.
NPC (2006). Nigeria National Population Census. NationalPopulation Council.
Nsikan, E.B., Okon, E.U., Umoh, I.U., Nyong, E.E. (2015).Analysis of the determinants of fresh fish marketing andprofitability among captured fish traders in South Nigeria:The case of AkwaIbom State. Brit. J. Econ., Manag. Trade,5(1), 35–45. DOI: 10.9734/BJEMT/2015/10744.
Nwalieji, H.U., Madukwe, M.C., Agwu, A.E., Umerah, M.I.(2014). Adoption of rice technologies introduced by theUnited State Agency for international development inAnambra and Ebonyi States, Nigeria. J. Agric. Ext., 18(1),143–154. DOI: 10.4314/jae.v18i1.13.
Nwiro, E. (2012). Fish farming: a lucrative business. Accessedon line 20th October 2012. www.thisdaylive.com.
Offor, E.I., Ibeagwa, O.B., Ikemefuna, C.S. (2016).Performance of fresh fish marketing in Port HarcourtMunicipal, Rivers State, Nigeria. Niger. J. Agric., 12,133–136.
Olaoye, O.J., Ashley-Dejo, S.S., Fakoya, E.O., Ikewe-inwe, N.B., Alegbeleye, W.O., Olukosi, J.O., lsitor, S.U.(2007). Introduction to Agricultural Marketing and PricesPrinciples and applications, Living Book Series Abuja.
Olukosi, J.O., Erhabor, P.O. (1988). Introduction to farm man-agement economics: principles and application. AGITABPublishers Limited. Zaria, 9.
Olukosi, J.O., Isitor, S.U., Ode, M.O. (2005). Introductionto agricultural marketing and prices. Principles andApplications. G. U. Publication Abuja, Nigeria.
Onyemauwa, C.S. (2012). Analysis of fresh and dried fish mar-keting in Southeast Nigeria. J. Biol., Agric. Health., 2(4),74–84.
Osarenren, C.O., Adams, O.O. (2014). Marketing analysis ofsmoke-dried fish in Etsako East Local Government Area ofEdo State, Nigeria.
Osundare, F., Adedeji, T. (2018). Economic analysis of mar-ket performance of fresh fish in Lagos State, Nigeria.Int. J. Environ., Agric. Biotech., 3(2), 595–599. DOI:10.22161/ijeab/3.2.38.
Panda, S.C. (2011). Farm Management and Agricultural Marke-ting. Kalyani Publishers, New Delhi, India, 263–300.
Payra, P., Maity, R., Maity, S., Mandal, B. (2016). Productionand marketing of dry fish through the traditional practicesin West Bengal coast: Problems and prospects. Int. J. Fish.Aquat., 4(6), 118–123.
Polycarp, M., Adebayo, E.F., Tafida, A.A., Amurtiya, M.(2015). Comparative analysis of processed and fresh fishmarketing Yola North and Girei Local Government Areasof Adamawa State, Nigeria. Int. J. Sci. Technol., 3(7),187–191.
Rahman, M.M., Hossain, M.A., Fatematuzzhura., Tasnoova, S.,Ahamed, F., Hossain, M.Y., Ohtomi, J. (2012). Freshfish marketing status in the Northwestern Bangladesh:Recommendations for sustainable management. OurNature, 10, 128–136. DOI: 10.3126/on.v10i1.7773.
Thilsted, S.H., James, D., Jopper, J., Subas, R., Nghe, E.,Karunsagar, M. (2015). Nutrition better lives; Maximizingthe contribution of fish to human nutrition. FAO 2ndInternational Conference, Rome, 65–76.
www.asp.zut.edu.pl 25
Girei, A.A., Ndanitsa, M.A., Ogezi, E. (2021). Smoked and fresh fish marketing in Toto Local Government Area of Nasarawa State,Nigeria: a comparative analysis. Acta Sci. Pol. Zootechnica, 20(1), 15–26. DOI: 10.21005/asp.2021.20.1.02
USAID (2010). Best Management Practices for Fish FarmingPackage of Practices (POP) for Fish Farming. USAIDMarkets Programme, Nigeria.
Waziri, A., Tsado, E.K., Likita, T., Gana, A.S. (2014). Socio-economic factors influencing adoption of maize seedTechnology in Niger State of Nigeria. J. Biol., Agric.Health., 4(5), 98–105.
RYNEK RYB WEDZONYCH I SWIEZYCH NA OBSZARZE SAMORZADOWYM TOTO W STANIENASARAWA W NIGERII: ANALIZA PORÓWNAWCZA
STRESZCZENIERynek rybny zyskuje na znaczeniu, zwłaszcza w społecznosciach wiejskich, jako całoroczne mikroprzedsiebiorstwodziałajace na rzecz zwalczania ubóstwa, niewymagajace znacznej bazy kapitałowej. W pracy zbadano skutecznoscmarketingowa wedzonych i swiezych ryb na badanym obszarze. Dane pierwotne uzyskano od 80 respondentówwybranych metoda dwuetapowego doboru próby. Dane analizowano za pomoca statystyk opisowych i wnioskowa-nych. Celem badania było opisanie i porównanie struktury i wyników rynku, okreslenie opłacalnosci, identyfikacjaposredników oraz ograniczen w sprzedazy ryb wedzonych i swiezych na badanym obszarze. Wyniki pokazały, zeludzie obojga płci angazuja sie w marketing ryb, z dominacja kobiet (58,7%). Wiekszosc (67,5%) handlowcównalezała do grupy wiekowej 15–44 lata. Srednia wieku wynosiła 33 lata. Równiez 73,7% badanych było w zwiaz-kach małzenskich, a wiekszosc (58,7%) badanych deklarowała wielkosc gospodarstwa domowego w zakresie od1 do 5 osób, a srednia wielkosc gospodarstwa wynosiła 6 osób. Około 65% respondentów osiagneło taka lub innaforme edukacji. Srednie doswiadczenie w sprzedazy ryb deklarowano na 15 lat. Stosunek zysku do kosztów dlamarketingu swiezych ryb wyniósł 0,26 �. Oznacza to, ze 0,26 � przypada na kazdy 1 �zainwestowany w działal-nosc zwiazana z handlem swiezymi rybami, a efektywnosc w zakresie marketingu swiezych ryb została obliczonana 2,93 (293%), podczas gdy stosunek zysku netto do kosztów ryb wedzonych obliczono na 1,57 �. Oznacza to,ze na kazde 1 N zainwestowane w przedsiebiorstwo zajmujace sie handlem wedzona ryba wytworzono 0,57 �.Wyniki wykazały ponadto znaczna róznice przychodów miedzy rybami wedzonymi (380 500,00 �) a rybamiswiezymi (179 640,00 �) w wysokosci 200 860,00 �. Stanowiło to około 111,82%, co wskazuje, ze marketingryb wedzonych przynosi wyzsze dochody niz ryby swieze na badanym obszarze. Współczynnik Giniego (GC)dla sprzedawców swiezych i wedzonych ryb obliczono odpowiednio na 0,5857 i 0,4801. Zaobserwowano zdecen-tralizowane trasy kanałów marketingowych, z detalistami o najwyzszym udziale sprzedawanych ryb wedzonych,32,5%, i konsumentami o najwyzszym udziale w sprzedawanych rybach swiezych, 30,0%. Niektóre ze zidenty-fikowanych ograniczen obejmuja; sezonowosc, niewystarczajacy poziom kredytu, słaba baza magazynowa i słabasiec dróg. Zalecono, aby handlowcy zorganizowali sie w organizacje spółdzielcze i stworzyli silne sieci rynkowei powiazania w celu czerpania korzysci z dostepnych rynków poza ich bezposrednim otoczeniem.
Słowa kluczowe: analiza porównawcza, marketing, ryby
Abdulhameed Abana Girei https://orcid.org/0000-0002-9628-8875
26 www.asp.zut.edu.pl
Related Documents


