2013: Issue 396, Week: 11th - 14th November A Weekly Update from SMC (For private circulation only) Brand smc 219

SMC Global Weekly News Letter (Wisemoney)
Jan 20, 2015
It is a weekly newsletter, which is an epigrammatic on investment opportunities escorted by sound technical and fundamental analysis of existing and forthcoming stocks that keep investors updated about the market developments. It includes all the segments say Equity, Commodity, Mutual Fund, Currency and Fixed Deposits. It is a complete handy guide, which helps all the investors to multiply their wealth.
Welcome message from author
This document is posted to help you gain knowledge. Please leave a comment to let me know what you think about it! Share it to your friends and learn new things together.
Transcript

2013: Issue 396, Week: 11th - 14th NovemberA Weekly Update from SMC(For private circulation only)
Bra
nd
sm
c 2
19

(Saurabh Jain)
Contents
Equity 4-7
Derivatives 8-9
Commodity 10-13
Currency 14
IPO 15
Fixed Deposit 16
Mutual Fund 17-18
EDITORIAL STAFF
Editor Saurabh Jain
Executive Editor Jagannadham Thunuguntla
+Editorial Team
Dr. R.P. Singh Nitin Murarka
Vandana Bharti Tejas Seth
Sandeep Joon Dinesh Joshi
Vineet Sood Shitij Gandhi
Dhirender Singh Bisht Subhranil Dey
Parminder Chauhan Ajay Lakra
Mudit Goyal
Content Editor Kamla Devi
Graphic Designer Pramod Chhimwal
Research Executive Sonia Bamba
REGISTERED OFFICES:
11 / 6B, Shanti Chamber, Pusa Road, New Delhi 110005.
Tel: 91-11-30111000, Fax: 91-11-25754365
MUMBAI OFFICE:
Dheeraj Sagar, 1st Floor, Opp. Goregaon sports Club, Link Road
Malad (West), Mumbai 400064
Tel: 91-22-67341600, Fax: 91-22-28805606
KOLKATA OFFICE:
18,Rabindra Sarani, Poddar Court, Gate No-4, 4th & 5th Floor,
Kolkata-700001
Tel : 91-33-39847000/39801300, Fax No : 91-33-39847004
AHMEDABAD OFFICE :
10/A, 4th Floor, Kalapurnam Building, Near Municipal Market,
C G Road, Ahmedabad-380009, Gujarat
Tel : 91-79-26424801 - 05, 40049801 - 03
CHENNAI OFFICE:
Salzburg Square, Flat No.1, III rd Floor, Door No.107, Harrington Road,
Chetpet, Chennai - 600031.
Tel: 044-39109100, Fax -044- 39109111
SECUNDERABAD OFFICE:
206, 3rd Floor, above CMR Exclusive, Bhuvana Towers, S.D.Road,
Secunderabad - 500003
Tel: 91-40-30780298/99, 39109536
DUBAI OFFICE:
312, Belshalat Building, Al Karama, Dubai, P.O. Box 117210, U.A.E.
Tel: 97143963120, Mobile : 971502612483
Fax : 9714 3963122
Email ID : [email protected]
Printed and Published on behalf of
Mr. Saurabh Jain @ Publication Address
11/6B, Shanti Chamber, Pusa Road, New Delhi-110005
Website: www.smcindiaonline.com
Investor Grievance : [email protected]
Printed at: S&S MARKETING
102, Mahavirji Complex LSC-3, Rishabh Vihar, New Delhi - 110092 (India)
Ph.: +91-11- 43035012, 43035014, Email: [email protected]
lobal stock markets continue to enjoy the liquidity provided by the world
largest central bank i.e. U.S. Federal Reserve. With global monetary Gconditions remaining conducive risk assets are moving up, however any
hints of any early withdrawal of stimulus program by FED may again give birth to
weakness in risky assets. Recently, better than expected economic growth of 2.8%
in the third quarter in U.S. once again given birth to expectations of early start of
monetary stimulus withdrawal. European markets faced pressure as European
Union lowered its forecast for the area to 1.1% in 2014 from earlier projections of
1.2% made in May. While the lower growth economic growth is a concerning factor
but at the same it means extended period of accommodative stance. In the
monetary policy review meeting on 7th November, European Central Bank slashed
interest rate by 25 bps to 25 bps citing low inflation expectation for medium to long
term. The accommodative stance would help in assisting the fragile economic
recovery in the region.
Back at home, Indian stock markets are seeing continuous support from foreign
institutional investors that are on buying spree. Indices have gained nearly 18%
from the lows of 5300 levels (Nifty) seen towards to the end of august this year and
now are looking in a consolidation phase. The gains in the markets that were earlier
limited to few large cap stocks and sectors namely; IT, Banks, Healthcare, etc are
now getting more broad based in the last few sessions. The gains recorded in the
recent days are primarily attributed to the global liquidity factor and secondly to
some positives at home, including better merchandise trade numbers, current
account deficit and expectations that India would stick to budgeted fiscal deficit.
India's biggest lender State Bank of India has raised base rate and prime lending rate
by 20 bps adjusting to the higher cost of short term capital. It is a bit negative in the
sense that higher cost of capital is one of the major concerns of India Inc. and is
acting hindrance to the capital expenditure cycle. Overall one should keep a close
vigil on the global liquidity situation and on the economic data points while playing
the optimism in the domestic markets.
Bullion counter are expected to trade in range on mixed fundamentals. Movement
of Dollar index and ETF demand will be watched closely to get hint about further
direction. The Federal Reserve should scale back its asset purchases only when the
U.S. economy shows clearer signs of improvement and even then it should act
slowly. Base metals complex may remain on positive note. London Metal Exchange's
proposals to cut queues to get metal out of the warehouses could increase price
volatility and reduce transparency as more metal moves off the exchange. The U.S.
manufacturing sector expanded at its fastest pace in 2-1/2 years last month. Crude
oil which has been under grip of bears may get some support and witness lower level
buying. In agri pack strong spot market demand and firm overseas markets may
continue to support the oilseeds complex. Given adequate carryover stock, arrival
of new crops in the global market and continuous flow of imported chana in the
domestic market, prices may tend to remain subdued. Amid expectations of a
record rabi crop due to good monsoon rains, adequate soil moisture and a rise in the
groundwater table, India is set to record self sufficiency in pulses this year.
From The Desk Of Editor
4
NOTES:
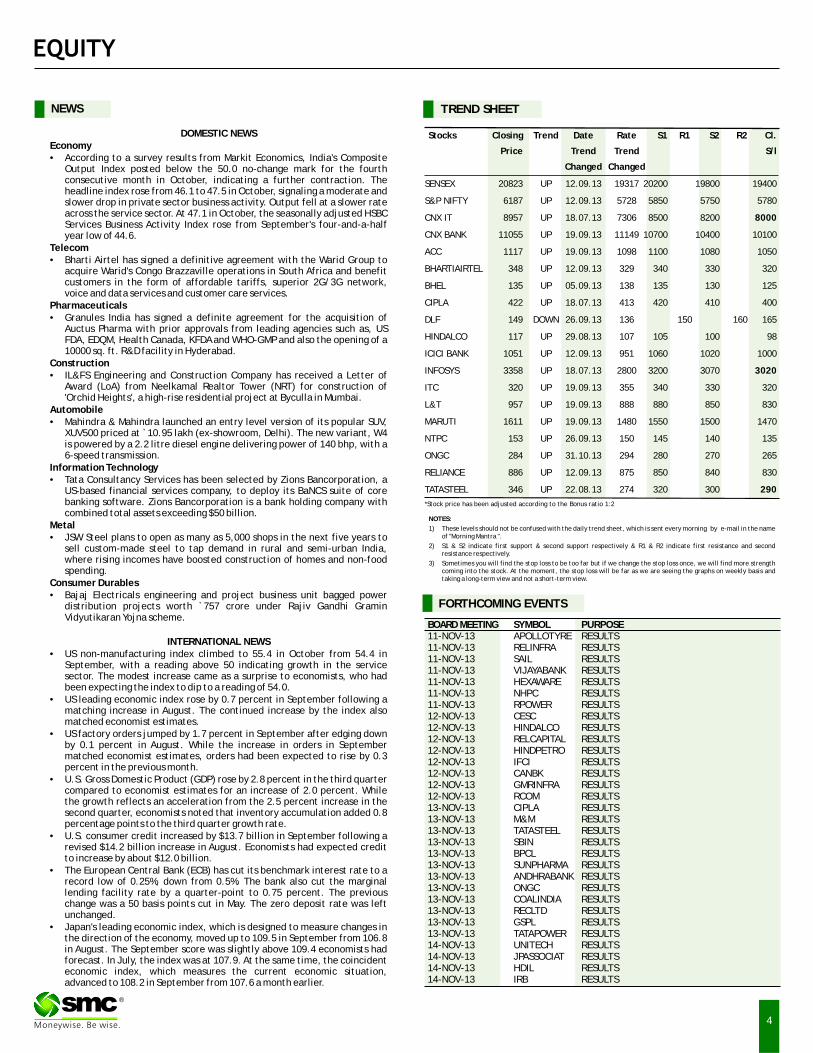
1) These levels should not be confused with the daily trend sheet, which is sent every morning by e-mail in the name of "Morning Mantra ".
2) S1 & S2 indicate first support & second support respectively & R1 & R2 indicate first resistance and second resistance respectively.
3) Sometimes you will find the stop loss to be too far but if we change the stop loss once, we will find more strength coming into the stock. At the moment, the stop loss will be far as we are seeing the graphs on weekly basis and taking a long-term view and not a short-term view.
TREND SHEET
Stocks Closing Trend Date Rate S1 R1 S2 R2 Cl.
Price Trend Trend S/l
Changed Changed
SENSEX 20823 UP 12.09.13 19317 20200 19800 19400
S&P NIFTY 6187 UP 12.09.13 5728 5850 5750 5780
CNX IT 8957 UP 18.07.13 7306 8500 8200 8000
CNX BANK 11055 UP 19.09.13 11149 10700 10400 10100
ACC 1117 UP 19.09.13 1098 1100 1080 1050
BHARTIAIRTEL 348 UP 12.09.13 329 340 330 320
BHEL 135 UP 05.09.13 138 135 130 125
CIPLA 422 UP 18.07.13 413 420 410 400
DLF 149 DOWN 26.09.13 136 150 160 165
HINDALCO 117 UP 29.08.13 107 105 100 98
ICICI BANK 1051 UP 12.09.13 951 1060 1020 1000
INFOSYS 3358 UP 18.07.13 2800 3200 3070 3020
ITC 320 UP 19.09.13 355 340 330 320
L&T 957 UP 19.09.13 888 880 850 830
MARUTI 1611 UP 19.09.13 1480 1550 1500 1470
NTPC 153 UP 26.09.13 150 145 140 135
ONGC 284 UP 31.10.13 294 280 270 265
RELIANCE 886 UP 12.09.13 875 850 840 830
TATASTEEL 346 UP 22.08.13 274 320 300 290
NEWS
BOARD MEETING SYMBOL PURPOSE11-NOV-13 APOLLOTYRE RESULTS11-NOV-13 RELINFRA RESULTS11-NOV-13 SAIL RESULTS11-NOV-13 VIJAYABANK RESULTS11-NOV-13 HEXAWARE RESULTS11-NOV-13 NHPC RESULTS11-NOV-13 RPOWER RESULTS12-NOV-13 CESC RESULTS12-NOV-13 HINDALCO RESULTS12-NOV-13 RELCAPITAL RESULTS12-NOV-13 HINDPETRO RESULTS12-NOV-13 IFCI RESULTS12-NOV-13 CANBK RESULTS12-NOV-13 GMRINFRA RESULTS12-NOV-13 RCOM RESULTS13-NOV-13 CIPLA RESULTS13-NOV-13 M&M RESULTS13-NOV-13 TATASTEEL RESULTS13-NOV-13 SBIN RESULTS13-NOV-13 BPCL RESULTS13-NOV-13 SUNPHARMA RESULTS13-NOV-13 ANDHRABANK RESULTS13-NOV-13 ONGC RESULTS13-NOV-13 COALINDIA RESULTS13-NOV-13 RECLTD RESULTS13-NOV-13 GSPL RESULTS13-NOV-13 TATAPOWER RESULTS14-NOV-13 UNITECH RESULTS14-NOV-13 JPASSOCIAT RESULTS14-NOV-13 HDIL RESULTS14-NOV-13 IRB RESULTS
FORTHCOMING EVENTS
DOMESTIC NEWSEconomy• According to a survey results from Markit Economics, India's Composite
Output Index posted below the 50.0 no-change mark for the fourth consecutive month in October, indicating a further contraction. The headline index rose from 46.1 to 47.5 in October, signaling a moderate and slower drop in private sector business activity. Output fell at a slower rate across the service sector. At 47.1 in October, the seasonally adjusted HSBC Services Business Activity Index rose from September's four-and-a-half year low of 44.6.
Telecom• Bharti Airtel has signed a definitive agreement with the Warid Group to
acquire Warid's Congo Brazzaville operations in South Africa and benefit customers in the form of affordable tariffs, superior 2G/3G network, voice and data services and customer care services.
Pharmaceuticals• Granules India has signed a definite agreement for the acquisition of
Auctus Pharma with prior approvals from leading agencies such as, US FDA, EDQM, Health Canada, KFDA and WHO-GMP and also the opening of a 10000 sq. ft. R&D facility in Hyderabad.
Construction• IL&FS Engineering and Construction Company has received a Letter of
Award (LoA) from Neelkamal Realtor Tower (NRT) for construction of 'Orchid Heights', a high-rise residential project at Byculla in Mumbai.
Automobile• Mahindra & Mahindra launched an entry level version of its popular SUV,
XUV500 priced at ̀ 10.95 lakh (ex-showroom, Delhi). The new variant, W4 is powered by a 2.2 litre diesel engine delivering power of 140 bhp, with a 6-speed transmission.
Information Technology• Tata Consultancy Services has been selected by Zions Bancorporation, a
US-based financial services company, to deploy its BaNCS suite of core banking software. Zions Bancorporation is a bank holding company with combined total assets exceeding $50 billion.
Metal• JSW Steel plans to open as many as 5,000 shops in the next five years to
sell custom-made steel to tap demand in rural and semi-urban India, where rising incomes have boosted construction of homes and non-food spending.
Consumer Durables• Bajaj Electricals engineering and project business unit bagged power
distribution projects worth `757 crore under Rajiv Gandhi Gramin Vidyutikaran Yojna scheme.
INTERNATIONAL NEWS• US non-manufacturing index climbed to 55.4 in October from 54.4 in
September, with a reading above 50 indicating growth in the service sector. The modest increase came as a surprise to economists, who had been expecting the index to dip to a reading of 54.0.
• US leading economic index rose by 0.7 percent in September following a matching increase in August. The continued increase by the index also matched economist estimates.
• US factory orders jumped by 1.7 percent in September after edging down by 0.1 percent in August. While the increase in orders in September matched economist estimates, orders had been expected to rise by 0.3 percent in the previous month.
• U.S. Gross Domestic Product (GDP) rose by 2.8 percent in the third quarter compared to economist estimates for an increase of 2.0 percent. While the growth reflects an acceleration from the 2.5 percent increase in the second quarter, economists noted that inventory accumulation added 0.8 percentage points to the third quarter growth rate.
• U.S. consumer credit increased by $13.7 billion in September following a revised $14.2 billion increase in August. Economists had expected credit to increase by about $12.0 billion.
• The European Central Bank (ECB) has cut its benchmark interest rate to a record low of 0.25%, down from 0.5%. The bank also cut the marginal lending facility rate by a quarter-point to 0.75 percent. The previous change was a 50 basis points cut in May. The zero deposit rate was left unchanged.
• Japan's leading economic index, which is designed to measure changes in the direction of the economy, moved up to 109.5 in September from 106.8 in August. The September score was slightly above 109.4 economists had forecast. In July, the index was at 107.9. At the same time, the coincident economic index, which measures the current economic situation, advanced to 108.2 in September from 107.6 a month earlier.
*Stock price has been adjusted according to the Bonus ratio 1:2
®
5
BSE SENSEX GAINERS & LOSERS TOP (% Change) NSE NIFTY GAINERS TOP & LOSERS (% Change)
SECTORAL INDICES (% Change)
SMC Trend
SMC Trend
FMCGHealthcare
FTSE 100CAC 40
Auto BankRealty
Cap GoodsCons Durable
Oil & GasPower
NasdaqDow jonesS&P 500
NikkeiStrait times
Hang SengShanghai
INSTITUTIONAL ACTIVITY (Equity) (` Crore)
ITMetal
Down SidewaysUp
SMC Trend
Nifty BSE Midcap Nifty JuniorSensex BSE Smallcap S&P CNX 500
GLOBAL INDICES (% Change)
INDIAN INDICES (% Change)
®
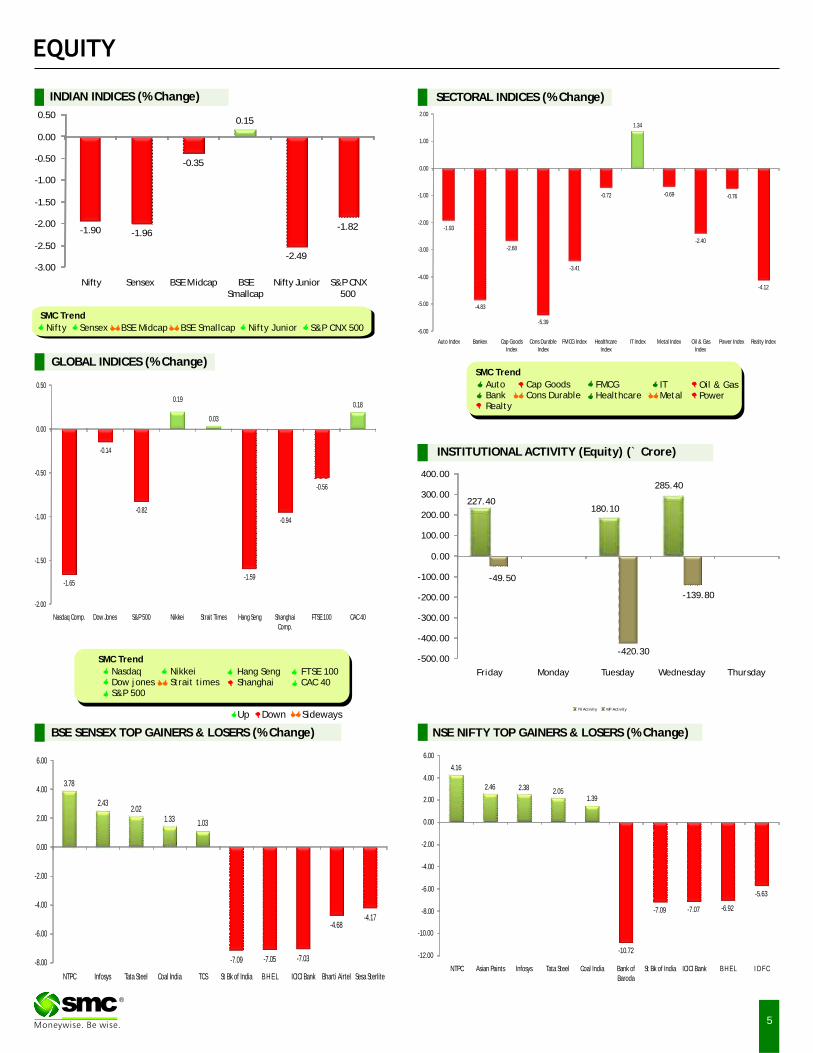
227.40180.10
285.40
-49.50
-420.30
-139.80
-500.00
-400.00
-300.00
-200.00
-100.00
0.00
100.00
200.00
300.00
400.00
Friday Monday Tuesday Wednesday Thursday
FII Activity MF Activity
4.16
2.46 2.38 2.051.39
-10.72
-7.09 -7.07 -6.92
-5.63
-12.00
-10.00
-8.00
-6.00
-4.00
-2.00
0.00
2.00
4.00
6.00
NTPC Asian Paints Infosys Tata Steel Coal India Bank of Baroda
St Bk of India ICICI Bank B H E L I D F C
3.78
2.432.02
1.33 1.03
-7.09 -7.05 -7.03
-4.68-4.17
-8.00
-6.00
-4.00
-2.00
0.00
2.00
4.00
6.00
NTPC Infosys Tata Steel Coal India TCS St Bk of India B H E L ICICI Bank Bharti Airtel Sesa Sterlite
-1.90 -1.96
-0.35
0.15
-2.49
-1.82
-3.00
-2.50
-2.00
-1.50
-1.00
-0.50
0.00
0.50
Nifty Sensex BSE Midcap BSE Smallcap
Nifty Junior S&P CNX 500
-1.93
-4.83
-2.68
-5.39
-3.41
-0.72
1.34
-0.69
-2.40
-0.76
-4.12
-6.00
-5.00
-4.00
-3.00
-2.00
-1.00
0.00
1.00
2.00
Auto Index Bankex Cap Goods Index
Cons Durable Index
FMCG Index Healthcare Index
IT Index Metal Index Oil & Gas Index
Power Index Realty Index
-1.65
-0.14
-0.82
-1.59
-0.94
-0.56
0.19
0.03
0.18
-2.00
-1.50
-1.00
-0.50
0.00
0.50
Nasdaq Comp. Dow Jones S&P 500 Nikkei Strait Times Hang Seng Shanghai Comp.
FTSE 100 CAC 40

Beat the street - Fundamental Analysis
6
® Above calls are recommended with a time horizon of 1 year. Source: Company Website Reuters Capitaline
12.274.66
7.34
41.97
33.75
Foreign
Institutions
Non Promoter Corporate Holding
Promoters
Public & Others
ESCORTS LIMITED CMP: 110.50 Upside: 41%Target Price: 156
Face Value (`) 10.00
52 Week High/Low 118.75/48.35
M.Cap (` Cr.) 1354.51
EPS (`) 5.75
P/E Ratio (times) 19.22
P/B Ratio (times) 0.85
Dividend Yield (%) 1.09
Stock Exchange BSE
VALUE PARAMETERS
% OF SHARE HOLDING
Investment Rationale •Company had incurred a capex of about `80 crore in 12 months ending Sep'13 and will incur another •For full year ended Sep'13, the company's Tractor capex of about ̀ 50 crore in next 12 months.volume grew by about 9.5% to 66230 with about
10.5% of market share in India. Overall, management •Small changes at the management level have expects the Tractor industry to clock a growth of started yielding results in terms of improvement in around 13-15% in FY'14. Company continued to focus utilization rates, continuous introduction of new on price and no discounts were offered as compared products, improved gross margins, cost to discount offers by its competitors. efficiencies, along with decrease in member of
staff cost and company's performance in the last •Escorts have more than 725 dealers including 176 two-three quarters.dealers additionin 12 months ending Sep'13. As per
the management the focus will be to continuously Valuationintroduce high margin and high power specialized The company will continue to remain focused on tractors and further improve the margins from current execution to further improve the operating around 11% to around 13% in next couple of years. performance in the months ahead. Consistently
•Key markets that supported the growth were strong results over the past few quarters is an Andhra Pradesh, Madhya Pradesh, Rajasthan and outcome of introducting high power and specialized Chhattisgarh. Some of these markets grew by more tractors which are improving volumes and than 30% YoY. All macroeconomic factors such as strengthening margins. On the estimated September crop prices, productivity, soil moisture, FY14E EPS of `16.9 and two year average P/Ex of government focus on rural spending etc are 9.25x, we expect the stock to see a price target of favoring the farm equipment business. 156 in one year time frame.
•On Tractor exports front, where Escorts has very negligible presence, the company is all out to launch its products in EU markets particularly in Germany. The Indian market ends in between 25HP to 110 HP, whereas the export markets starts from 125 HP and above. Thus, the new category of tractors has already been made and company will go all out for exports in next few months.
•The company has entered into a strategic alliance with Rajkot-based auto component maker Adico Group, which is a major supplier to automotive original equipment makers, to manufacture the Steeltrac tractor.
` in cr
Actual Estimate
FY Sep-12 FY Sep-13 FY Sep-14
Revenue 4002.50 4135.99 4968.70
EBITDA 189.50 318.16 303.90
EBIT 139.30 236.49 244.50
Pre-tax Profit 90.58 183.03 268.70
Net Income 72.45 167.55 226.50
EPS 6.08 14.05 16.90
BVPS 134.08 170.46 180.00
P/BV Chart
Face Value (`) 10.00
52 Week High/Low 296.90 / 180.90
M.Cap (` Cr.) 1250.34
EPS (`) 50.22
P/E Ratio (times) 5.70
P/B Ratio (times) 1.72
Dividend Yield (%) 2.79
Stock Exchange BSE
` in cr
Actual Estimate
FY Mar-13 FY Mar-14 FY Mar-15
Revenue 2114.50 2390.30 2683.30
EBITDA 303.10 375.50 413.60
EBIT 269.90 286.20 324.30
Pre-tax Profit 260.60 339.40 362.20
Net Income 174.50 215.70 273.90
EPS 39.34 52.84 62.66
BVPS 167.26 225.39 264.16
% OF SHARE HOLDING
Investment Rationale end of the NASSCOM growth guidance for the FY'14. The tax rate expected to be in the range of •The Company's expansion into new age 30-32% for the FY'14. technologies, Social Media, Mobility, Analytics
and Cloud Computing are expected to provide •The Net Sales grew by 11% QoQ to `589.77 crore significant avenues for growth. The Capex is at for the quarter ended September 2013 and net `19 crore for the H1'FY14. profit grew by 16% QoQ to `70.63 crore for the
same period. •The company is currently sitting on a fairly significant order pipeline, which at this point of Valuationtime is over ̀ 1,000 crore. Company has performed significantly well and has
•The company expects double digit growth in the received awards from various forums in the Industry. Enterprise Services business for the FY15 on the Company's key growth driver traditionally has been back of healthy pipeline. Also, it anticipates good the manufacturing vertical in the US and the growth growth from the Infrastructure Management trend continues with significant large contracts in Services (IMS) for the FY'15. this space. Key wins include multi-million dollar deals
with a market leading innovator in semiconductors •The company has entered into an agreement with and a leading manufacturer of engineering solutions with “Kapela Fund 1 (Kapela)” and “The in data and power sectors. On the estimated FY15E Tomorrow Trust” to set up a new Broad Based EPS of ̀ 62.66 and three year average P/Ex of 5.6x, we Black Economic Empowerment company in South expect the stock to see a price target of 351 in one Africa wherein Zensar will be the majority year time frame. shareholder of the company expanding Zensar's
presence in South Africa with services in many areas to new customer segments.
•Company operates in the US, Europe, Africa, Middle East, Singapore and Australia regions and has delivery centres in India (Pune, Hyderabad and Bangalore), China, Japan, UK, Amsterdam and US (Westborough).
•The Company has been able to deliver continuous value to customers through its unique customer-centric approach. This approach has been further strengthened by enhancing the organisation design; focus on deeper verticalisation and enriching the Company's capability to deliver and manage high-end complex engagements.
•The company expects revenues to grow at higher
P/E Chart
ZENSAR TECHNOLOGIES LTD. CMP: 286.25 Upside: 23%Target Price: 351VALUE PARAMETERS
36.22
0.95
1.82
48.27
12.74
Foreign
Institutions
Non Promoter Corporate Holding
Promoters
Public & Others
Charts by Spider Software India Ltd
7
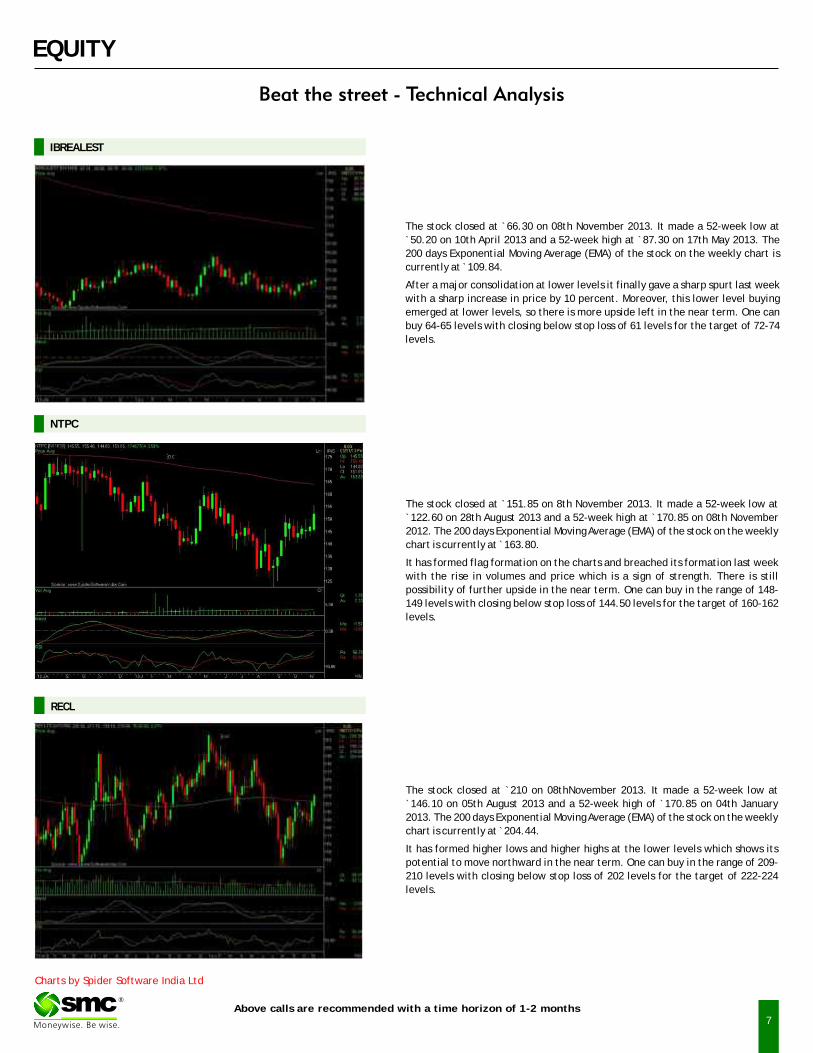
The stock closed at 66.30 on 08th November 2013. It made a 52-week low at
`50.20 on 10th April 2013 and a 52-week high at `87.30 on 17th May 2013. The
200 days Exponential Moving Average (EMA) of the stock on the weekly chart is
currently at ̀ 109.84.
After a major consolidation at lower levels it finally gave a sharp spurt last week
with a sharp increase in price by 10 percent. Moreover, this lower level buying
emerged at lower levels, so there is more upside left in the near term. One can
buy 64-65 levels with closing below stop loss of 61 levels for the target of 72-74
levels.
`
EQUITY
Above calls are recommended with a time horizon of 1-2 months
The stock closed at 151.85 on 8th November 2013. It made a 52-week low at
`122.60 on 28th August 2013 and a 52-week high at `170.85 on 08th November
2012. The 200 days Exponential Moving Average (EMA) of the stock on the weekly
chart is currently at ̀ 163.80.
It has formed flag formation on the charts and breached its formation last week
with the rise in volumes and price which is a sign of strength. There is still
possibility of further upside in the near term. One can buy in the range of 148-
149 levels with closing below stop loss of 144.50 levels for the target of 160-162
levels.
`
The stock closed at 210 on 08thNovember 2013. It made a 52-week low at
`146.10 on 05th August 2013 and a 52-week high of `170.85 on 04th January
2013. The 200 days Exponential Moving Average (EMA) of the stock on the weekly
chart is currently at ̀ 204.44.
It has formed higher lows and higher highs at the lower levels which shows its
potential to move northward in the near term. One can buy in the range of 209-
210 levels with closing below stop loss of 202 levels for the target of 222-224
levels.
`
IBREALEST
RECL
NTPC
®
DERIVATIVES
BASIS GAP IN NIFTY
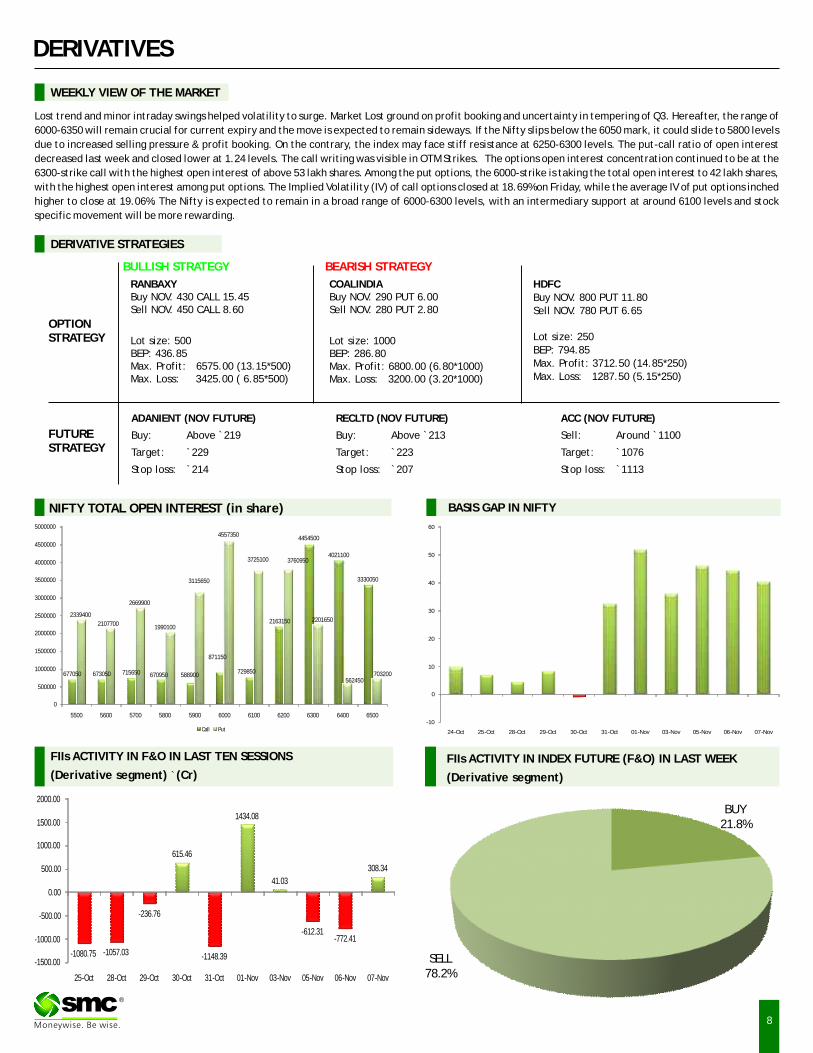
Lost trend and minor intraday swings helped volatility to surge. Market Lost ground on profit booking and uncertainty in tempering of Q3. Hereafter, the range of
6000-6350 will remain crucial for current expiry and the move is expected to remain sideways. If the Nifty slips below the 6050 mark, it could slide to 5800 levels
due to increased selling pressure & profit booking. On the contrary, the index may face stiff resistance at 6250-6300 levels. The put-call ratio of open interest
decreased last week and closed lower at 1.24 levels. The call writing was visible in OTM Strikes. The options open interest concentration continued to be at the
6300-strike call with the highest open interest of above 53 lakh shares. Among the put options, the 6000-strike is taking the total open interest to 42 lakh shares,
with the highest open interest among put options. The Implied Volatility (IV) of call options closed at 18.69% on Friday, while the average IV of put options inched
higher to close at 19.06%. The Nifty is expected to remain in a broad range of 6000-6300 levels, with an intermediary support at around 6100 levels and stock
specific movement will be more rewarding.
WEEKLY VIEW OF THE MARKET
NIFTY TOTAL OPEN INTEREST (in share)
FIIs ACTIVITY IN INDEX FUTURE (F&O) IN LAST WEEK
(Derivative segment)
®
FIIs ACTIVITY IN F&O IN LAST TEN SESSIONS
(Derivative segment) `(Cr)
ADANIENT (NOV FUTURE)
Buy: Above `219
Target: `229
Stop loss: `214
HDFCBuy NOV. 800 PUT 11.80Sell NOV. 780 PUT 6.65
Lot size: 250BEP: 794.85Max. Profit: 3712.50 (14.85*250)Max. Loss: 1287.50 (5.15*250)
OPTIONSTRATEGY
FUTURESTRATEGY
RANBAXYBuy NOV. 430 CALL 15.45Sell NOV. 450 CALL 8.60
Lot size: 500BEP: 436.85Max. Profit: 6575.00 (13.15*500)Max. Loss: 3425.00 ( 6.85*500)
ACC (NOV FUTURE)
Sell: `1100
Target: `
Stop loss: `
Around
1076
1113
COALINDIABuy NOV. 290 PUT 6.00Sell NOV. 280 PUT 2.80
Lot size: 1000BEP: 286.80Max. Profit: 6800.00 (6.80*1000)Max. Loss: 3200.00 (3.20*1000)
BULLISH STRATEGY
DERIVATIVE STRATEGIES
RECLTD (NOV FUTURE)
Buy: Above `213
Target: `223
Stop loss: `207
BEARISH STRATEGY
BUY21.8%
SELL78.2%
-10
0
10
20
30
40
50
60
24-Oct 25-Oct 28-Oct 29-Oct 30-Oct 31-Oct 01-Nov 03-Nov 05-Nov 06-Nov 07-Nov
677050 673050 715650 670950 588900
871150
729850
2163150
4454500
4021100
3330050
2339400
2107700
2669900
1990100
3115650
4557350
3725100 3760950
2201650
562450703200
0
500000
1000000
1500000
2000000
2500000
3000000
3500000
4000000
4500000
5000000
5500 5600 5700 5800 5900 6000 6100 6200 6300 6400 6500
Call Put
-1080.75 -1057.03
-236.76
-1148.39
-612.31-772.41
615.46
1434.08
41.03
308.34
-1500.00
-1000.00
-500.00
0.00
500.00
1000.00
1500.00
2000.00
25-Oct 28-Oct 29-Oct 30-Oct 31-Oct 01-Nov 03-Nov 05-Nov 06-Nov 07-Nov
8

9
BHARTIARTL 7713000 7571000 -1.84 1.24 0.74 -0.50 35.19 35.25 0.06
DLF 24678000 27068000 9.68 0.42 0.34 -0.08 56.18 63.89 7.71
HINDALCO 21558000 20256000 -6.04 1.03 0.77 -0.26 42.66 43.40 0.74
HINDUNILVR 4733500 4737500 0.08 0.97 0.77 -0.20 24.70 24.33 -0.37
ICICIBANK 6888500 8373250 21.55 0.61 0.36 -0.25 35.19 38.31 3.12
IDEA 10266000 11774000 14.69 0.52 0.37 -0.15 39.37 38.17 -1.20
INFY 2361500 2685375 13.71 0.89 1.11 0.22 20.26 21.37 1.11
ITC 20634000 21464000 4.02 0.71 0.46 -0.25 25.37 28.70 3.33
JPASSOCIAT 48928000 46064000 -5.85 0.53 0.56 0.03 62.76 66.61 3.85
NTPC 10480000 10144000 -3.21 0.30 0.32 0.02 25.66 29.10 3.44
ONGC 9925000 9712000 -2.15 0.43 0.41 -0.02 29.05 29.56 0.51
RANBAXY 9267500 10092500 8.90 0.42 0.49 0.07 46.97 55.92 8.95
RCOM 33380000 36016000 7.90 0.51 0.45 -0.06 48.47 54.82 6.35
RELIANCE 8627500 8777750 1.74 0.47 0.40 -0.07 22.95 24.35 1.40
NIFTY 23093600 20838200 -9.77 1.32 1.24 -0.08 17.26 18.69 1.43
SAIL 16788000 18312000 9.08 0.59 0.48 -0.11 44.39 45.22 0.83
SBIN 5958000 6233250 4.62 0.80 0.57 -0.23 39.49 44.78 5.29
TATASTEEL 17215000 18548000 7.74 0.56 0.69 0.13 39.94 45.92 5.98
UNITECH 85488000 85600000 0.13 0.26 0.30 0.04 67.04 67.86 0.82
IMPORTANT INDICATORS OF NIFTY AND OTHER ACTIVE FUTURE CONTRACTS
OPEN INTEREST PCR RATIO IMPLIED VOLATILITY
SCRIPTS PREV. CURRENT % PREV. CURRENT PREV. CURRENT WEEK WEEK CHANGE WEEK WEEK CHANGE WEEK WEEK CHANGE
DERIVATIVES
Put Call Ratio Analysis : The Put-Call open interest ratio of Nifty has decreased
to 1.24 from 1.32. At the end of the week, the maximum stocks had a negative of
change in put call open interest ratio.
Implied Volatility Analysis : The Implied Volatility (IV) for Nifty futures this week
has increased to 18.69% from 17.26%. The IV of the stock futures has changed this
week ranging from -1.20% to 8.95%.
Open Interest Analysis : The open interest for the index at the end of this week
has decreased by 9.77% as compared to the previous week. All future stocks saw
changes in their open interest ranging from -9.77% to 21.55%. ICICIBANK has the
maximum increase in open interest as compared to other stocks.
Statistical Analysis·
Open 6315.05 High 6383.00
Low 6221.35 Close 6227.30
NIFTY & IV CHART NIFTY ANALYSIS
®
17
18
19
20
21
6000
6100
6200
6300
6400
01-Nov 03-Nov 05-Nov 06-Nov 07-Nov
Nifty Close IV
10
®
Bullion counter is expected to remain sideways amid mixed fundamentals. On domestic bourses movement in local currency rupee will give further direction which can weaken towards 63.5 in near term. Gold may trade in range of $1280-1360 in COMEX and 29000-30800 in MCX. White metal silver can hover in range of 46000-50000. Recovery in US as shown by good GDP numbers reignites the feeling of fed tapering. US gross domestic product rose at a 2.8 percent annualized rate in the third quarter after a 2.5 percent gain the prior three months. Meanwhile ECB President Mario Draghi pledged to keep borrowing costs low for an “extended period” in comments in Frankfurt. Recently weak market sentiments along with concerns of QE tapering by the Federal Reserve may exert downside pressure on prices. However, recovery in SPDR gold holdings will cushion sharp downside movement in the yellow metal. Gold buying in India, the world's biggest buyer of the metal, tapered off further after the festival week, even as domestic users started getting small import lots, weighing on premiums. India celebrated Diwali and Dhanteras this year the biggest gold buying festival but scarce supplies and higher prices of yellow metal deterred consumers. India imported 23.5 tonnes in October compared with a record 162 tonnes in May. Demand in the rest of Asia was also subdued, with premiums remaining unchanged from last week.
BULLIONS
Crude oil prices may remain subdued with some lower level buying can be seen as prices have fallen very sharply in recent months. Ease in Middle East tensions and increase in stockpiles has kept the prices on backfoot. Both Brent and WTI are in contango, a situation in which front-month futures are cheaper than the second month. Price drops in the recent weeks reflect “growing pains” as the market adjusts to higher U.S. shale production. Overall crude oil can move in range of 5800-6200 in MCX and $92-98 in NYMEX. According to the country's Energy Information Administration “U.S. crude output surged to 7.9 million barrels a day as of Oct. 18, the most since 1989” .The Organization of Petroleum Exporting Countries underestimated the significance of the North American energy boom as it tripled forecasts for shale oil produced there and predicted a decline in demand for its own crude through to 2018. OPEC could lose almost 8 percent of its oil market share in the next five years due to shale energy boom. Iran is offering free delivery of crude to major client India, signaling that tough Western sanctions which have slashed its exports in half are driving Tehran to increasingly desperate measures to keep oil flowing. Natural gas may remain sideways in range of 210-235. Last week according to US Energy Information Administration (EIA) US natural gas inventory increased less than expectations by 35 billion cubic feet (bcf) which stood at 3.814 trillion cubic feet for the week ending on 1st November 2013.
ENERGY COMPLEX
Base metals complex may trade in range as increase in cancelled warrants are supporting the prices while fear of tapering by fed is capping the upside. Better china manufacturing data and PMI figures recently supported the base metals complex. Chinese manufacturing rose to an 18-month high in October and refined copper imports jumped to the most since February 2012 in September. Red metal copper can trade in range of 440-475. Global stockpiles of Copper tracked by bourses in London, New York and Shanghai are the smallest in almost nine months, at a time when Europe is recovering from recession and the Federal Reserve is delaying a cut in stimulus to bolster economic growth. Inventories in warehouses monitored by the three bourses dropped 28 percent since June to 668,356 tons, the lowest since February. Orders to withdraw copper from LME-tracked warehouses, known as canceled warrants, rose 15 percent since Oct. 18. Zinc prices can hover in range of 116-123 in MCX. China's trade balance jumped to 31.1 billion Yuan in October from 15.2 billion Yuan in September. Exports rose 5.6 per cent to $185.4 billion, while imports were up 7.6 per cent at $154.3 billion. Nickel prices can trade in the range of 865-915 in MCX. LME nickel stocks reached an all time record high of 240,408 tonnes last week and at the same time, the LME's three-month nickel contract declined to $14,060 per tonne, a 4.6% decrease from the two-month high of $14,745 per tonne reached on October. Battery metal lead can move in range of 131-139.
BASE METALS
Turmeric futures may remain downside as prices can move in the range of 4450-4700 due to the absence of sufficient buyers available in the spot market. Huge carryover stocks, sluggish overseas demand and expectations of better crop amid favorable weather conditions are expected to mount downside pressure on the prices. The downside bias may persist in Jeera futures due to higher than-expected arrivals as well as prospects of better sowing this year. There are hopes that favourable weather conditions will encourage sowing of Jeera crop. However expectations of some improvement in export demand may limit sharp downside and support prices at lower levels. The prices may trade in the range of 12100-12700. Chilli futures may trade in the range of 6200-6650 with positive bias as good domestic demand amid reports of lesser acreage in A.P is supporting the prices. Reports of crop damage due to the heavy rains witnessed in the past few days in the major growing regions of Andhra Pradesh and signs of a delay in the chilli crop harvesting in Madhya Pradesh may add some buying sentiments in the Chilli market. But profit booking at elevated levels cannot be denied. Cardamom futures are expected to trade lower due to its bearish fundamentals. Weak export demand along with rising arrivals at auction centre is likely to keep cardamom prices under pressure. The prices may trade in the range of 675-720.
SPICES
OTHER COMMODITIES
Chana futures are expected to trade in the range of 3000-3200. Higher arrivals in the physical markets and expectation of record crop for second year in row in 2013-14 coupled with increasing imports of dollar chana may pressurize the prices at higher levels. However, prices are ruling near their MSP levels and thus demand is seen emerging at lower levels. Sugar futures may remain trapped in bearish zone of 2750-2900 due to lack of any fresh cues of demand against higher supplies. The sweetener is reeling under heavy carryover stocks & estimates of higher output for fourth consecutive year in row in the upcoming crushing season 2013-14. According to the latest estimates by ISMA, production is estimated 25million tonnes for 2013-14 seasons, at the same levels in 2012-13 despite of lower acreage under cane. Wheat futures are expected to trade with an upside bias due to competitive Indian wheat in the world market, after the government's decision to lower the floor price for exports of wheat to $260 a tonne. According trade sources, India is likely to sell up to 2 million tonnes of wheat in the first quarter of 2014, mainly to buyers in the Middle East and Southeast Asia. Wheat prices may reach towards 1680. Menthe oil futures may witness short covering at lower level and prices may test the level of 950. Lower arrivals in physical markets as farmers are holding of their produce may support the prices. But lack of bulk-buying activity from exporters and domestic Mentha oil consumers may shed its gains. Guar seed and guar gum futures may witness short covering while new-season arrivals and expectations of higher production are weighing on sentiment.
Oilseeds complex are likely to maintain the upside on fear of heavy crop damage in Maharashtra, Madhya Pradesh and Gujarat coupled with high moisture in the new crop. However, profit booking from higher levels, cannot be denied. Soybean futures are expected to trade higher in the range of 3850-4100 on lower arrivals. Arrivals in the spot markets of Madhya Pradesh were almost 50 percent lower compared to last week. However, prices sustaining at such higher without the back of strong demand for meal is questioning the sustainability of prices. Thin export demand and improving weather may cap upside. Mustard futures are expected to trade with positive note tracking higher edible oilseeds and delayed sowing of the mustard crop. In current season sowing of mustard seed is reported at 7,000 hectares as against 670,000 hectares during the same period last year. However, expectations of a pickup in the sowing in the coming days may cap upside and pressurize prices at higher levels. Ref soy oil futures are expected to trade higher due to festive and upcoming wedding season as well as higher soybean prices. However stockpiles of edible oil at ports on Oct 1 stood at 515,000 tonnes higher than 505,000 tonnes on Sept 1 may encourage profit booking at higher levels. CPO futures are likely to trade in the range of 555-600 with positive bias. Robust domestic demand and concern of decline of palm oil production in Malaysia as the seasonally higher yield period has come to an end, may support the prices.
OIL AND OILSEEDS
Closing as on 07.11.2013
11
NOTES : 1) Buy / Sell 25% of Commodity at S1/R1 respectively & rest 75% at S2/R2 respectively.2) S1 & S2 indicate first support & second support & R1 & R 2 indicate first resistance & second resistance. 3) Sometimes you will find the stop loss to be too far but if we change the stop loss once, we will find more strength coming into the commodity. At the moment, the stop loss will be far as we are seeing the graphs on weekly
basis and taking a long-term view and not a short-term view.4) These levels should not be confused with the daily trend sheet, which is sent every morning by e-mail in the name of Daily report- commodities.
TECHNICAL RECOMMENDATIONS
EXCHANGE CONTRACT CLOSING DATE TREND
PRICE CHANGED CHANGED STOP/LOSS
NCDEX SOYABEAN (NOV) 3970.50 10.10.13 UP 3681.00 3550.00 - 3250.00 - 3050.00
NCDEX JEERA (NOV) 12355.00 03.10.13 DOWN 12607.00 - 13800.00 14300.00 14800.00
NCDEX RED CHILLI (NOV) 6400.00 10.10.13 UP 6074.00 5800.00 - 5600.00 - 5300.00
NCDEX RM SEEDS (NOV) 3806.00 10.10.13 SIDEWAYS
MCX MENTHA OIL (NOV) 870.60 10.10.13 DOWN 841.50 - 900.00 945.00 1000.00
MCX CARDAMOM (DEC) 732.10 28.02.13 DOWN 965.00 - 800.00 830.00 860.00
MCX SILVER (DEC) 48440.00 26.09.13 DOWN 48639.00 - 52000.00 55000.00 58000.00
MCX GOLD (DEC ) 29920.00 26.09.13 DOWN 29865.00 - 30700.00 31500.00 32000.00
MCX COPPER (NOV) 451.75 12.09.13 DOWN 459.25 - 460.00 - 480.00 490.00
MCX LEAD (NOV ) 134.35 24.10.13 SIDEWAYS
MCX ZINC (NOV ) 118.70 31.10.13 SIDEWAYS
MCX NICKEL(NOV ) 882.50 12.09.13 DOWN 879.20 - 920.00 - 950.00 980.00
MCX ALUMINUM (NOV ) 112.75 26.09.13 DOWN 111.65 - 115.00 - 120.00 125.00
MCX CRUDE OIL (NOV) 5940.00 26.09.13 DOWN 6415.00 - 6300.00 - 6500.00 6650.00
MCX NATURAL GAS (NOV ) 221.90 17.10.13 SIDEWAYS
TREND RATE TREND S1 R1 S2 R2 CLOSING
*
TREND SHEET
COMMODITY
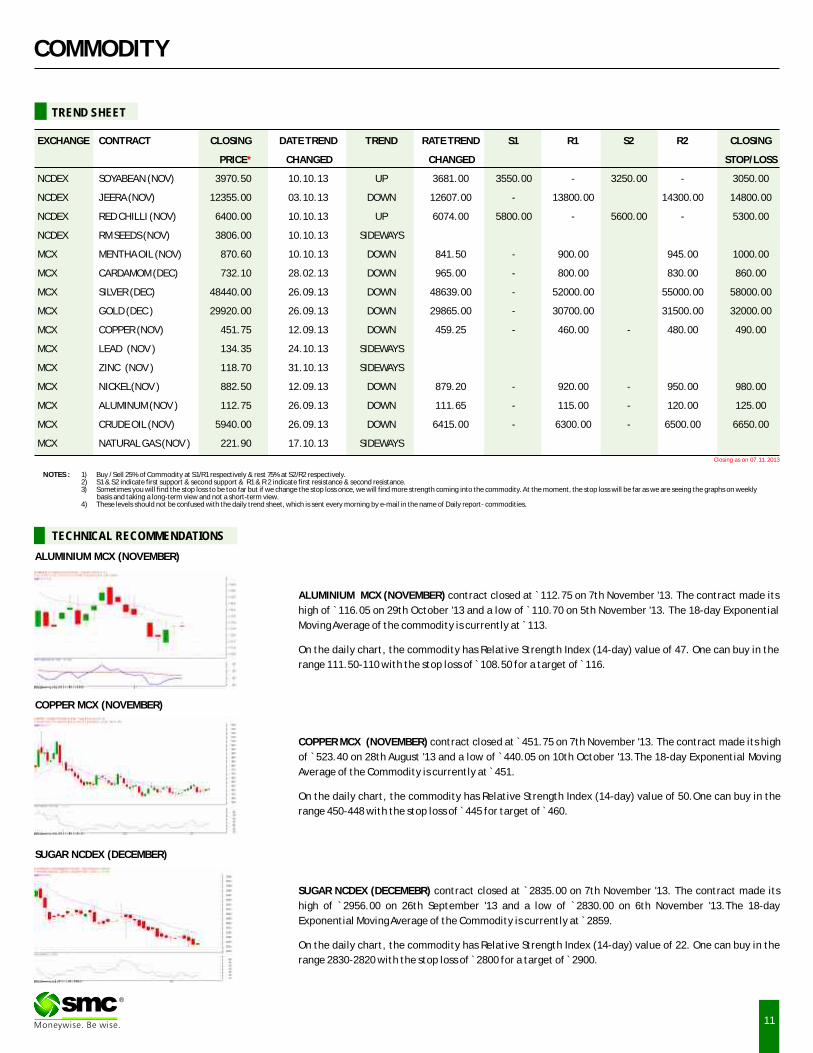
ALUMINIUM MCX (NOVEMBER) contract closed at 112.75 on 7th November '13. The contract made its
high of ̀ 116.05 on 29th October '13 and a low of ̀ 110.70 on 5th November '13. The 18-day Exponential
Moving Average of the commodity is currently at ̀ 113. On the daily chart, the commodity has Relative Strength Index (14-day) value of 47. One can buy in the
range 111.50-110 with the stop loss of ̀ 108.50 for a target of ̀ 116.
`
COPPER MCX (NOVEMBER) contract closed at 451.75 on 7th November '13. The contract made its high
of ̀ 523.40 on 28th August '13 and a low of ̀ 440.05 on 10th October '13.The 18-day Exponential Moving
Average of the Commodity is currently at ̀ 451.
On the daily chart, the commodity has Relative Strength Index (14-day) value of 50.One can buy in the
range 450-448 with the stop loss of ̀ 445 for target of ̀ 460.
`
SUGAR NCDEX (DECEMEBR) contract closed at 2835.00 on 7th November '13. The contract made its
high of `2956.00 on 26th September '13 and a low of `2830.00 on 6th November '13.The 18-day
Exponential Moving Average of the Commodity is currently at ̀ 2859.
On the daily chart, the commodity has Relative Strength Index (14-day) value of 22. One can buy in the
range 2830-2820 with the stop loss of ̀ 2800 for a target of ̀ 2900.
`
®
ALUMINIUM MCX (NOVEMBER)
COPPER MCX (NOVEMBER)
SUGAR NCDEX (DECEMBER)
COMMODITY
NEWS DIGEST
In the bullion counter last week mix trend continued as weaker local currency supported the
prices but fear of tapering by Federal Reserve capped the upside. COMEX Gold dropped 21
percent this year, set for its first annual loss since 2000, amid speculation the Federal Reserve
would curb stimulus as economic growth picked up. Some short covering was seen in the crude
last week as weaker local currency and drop in stockpiles prompted lower level buying. U.S.
gasoline stockpiles shrank for a fourth week to 210 million barrels in the seven days ended Nov.
1.Natural gas took some support near 212 levels. Nickel prices traded in thin range last week
along with zinc and lead. Stockpiles tracked by the London Metal Exchange, which have surged 71
percent this year, reached an all-time high of 239,958 metric tonnes last week. Supply of Nickel
will exceed demand this year by 120,000 tons, up from a 92,000 tonnes surplus in 2012.Bullish
momentum continued in oilseed complex. Brazil may raise the biodiesel blend required in diesel
fuel as early as January, a change that could result in up to 10 percent more of an expected record
soybean crop getting crushed into meal and oil. Rise in mustard oil demand amid reduced output
concerns provided underlying support to prices. The onset of the Rabi season lead to a drop in
soybean arrivals as farmers will be busy with the sowing process of the winter crop. Selling
pressure persisted in Cardamom futures due to heavy arrivals at auctions. Subdued demand and
prospects of better production pressurized the prices. Average daily arrivals at the auction
centers of Kerala were seen higher than last year's arrivals during the same period. Jeera traded
sideways on good carryover stocks and expectation of better sowing in upcoming season while the
extent of downside was limited on rise in overseas demand. Chana traded sideways in range on
expectation of lesser buying due to slack in festive demand, good inflow of imports while the
extent of downside was limited on buying support at lower levels. Guar seed traded sideways with
some lower level buying seen as Chinese, American and European buyers have renewed their
interest in Indian guar gum with prices having crashed by more than 50% on the back of a good
crop this year.
WEEKLY COMMENTARY
WEEKLY STOCK POSITIONS IN WAREHOUSE (NCDEX)
COMMODITY UNIT 30.10.13 06.11.13 DIFFERENCEQTY.
BARLEY MT 10326 4329 -5997
CASTOR SEED MT 72820 63927 -8893
CHANA MT 61106 38002 -23104
CHILLI MT 369 289 -80
COTTONSEED OILCAKE MT 0 0 0
JEERA MT 2116 1792 -324
MAIZE MT 1704 1704 0
RAPE MUSTARD SEED MT 21414 13294 -8120
SOYA BEAN SEEDS MT 40 40 0
SUGAR M MT 1379 1379 0
WHEAT MT 2969 0 -2969
COMMODITY UNIT 31.10.13 07.11.13 DIFFERENCE
QTY. QTY.
CARDAMOM MT 76.90 65.00 -11.90
KAPASIA KHALLI BALES 0.00 0.00 0.00
GOLD KGS 152.00 152.00 0.00
GOLD MINI KGS 16.60 16.20 -0.40
GOLD GUINEA KGS 10.70 7.22 -3.48
MENTHA OIL KGS 2599717.05 2595396.10 -4320.95
MILD STEEL MT 504.85 504.85 0.00
SILVER (30 KG Bar) KGS 13509.80 13509.80 0.00
•FMC abolished additional margin from gold, silver
crude oil, brent crude oil, natural gas, aluminium,
copper, lead, nickel and zinc.
•Crisis-ridden bourse NSEL defaulted for the 12th
straight time last week as it could pay only ̀ 11 crore
to investors against a scheduled payment amount of
`174.72 crore.
•The volume of crude oil futures traded on the
National Commodities and Derivatives Exchange
more than doubled to 6.20 lakh barrels in October.
•China's importers of refined copper have been asked
by Codelco to cut term shipments in the first half of
2014.
•London Bullion Market Association is considering
whether to partner with an exchange to produce its
gold-lending reference rate to ensure it can meet
tighter rules coming on financial benchmarks.
•US Institute for Supply Management services index
rose a point to 55.4 last month.
•Lead market moved into a deficit of 16,000 in the
January-to-March period in 2013.
•U.S. gross domestic product rose at a 2.8 percent
annualized rate in the third quarter after a 2.5
percent gain the prior three months.
WEEKLY STOCK POSITIONS IN WAREHOUSE (MCX)
12
®
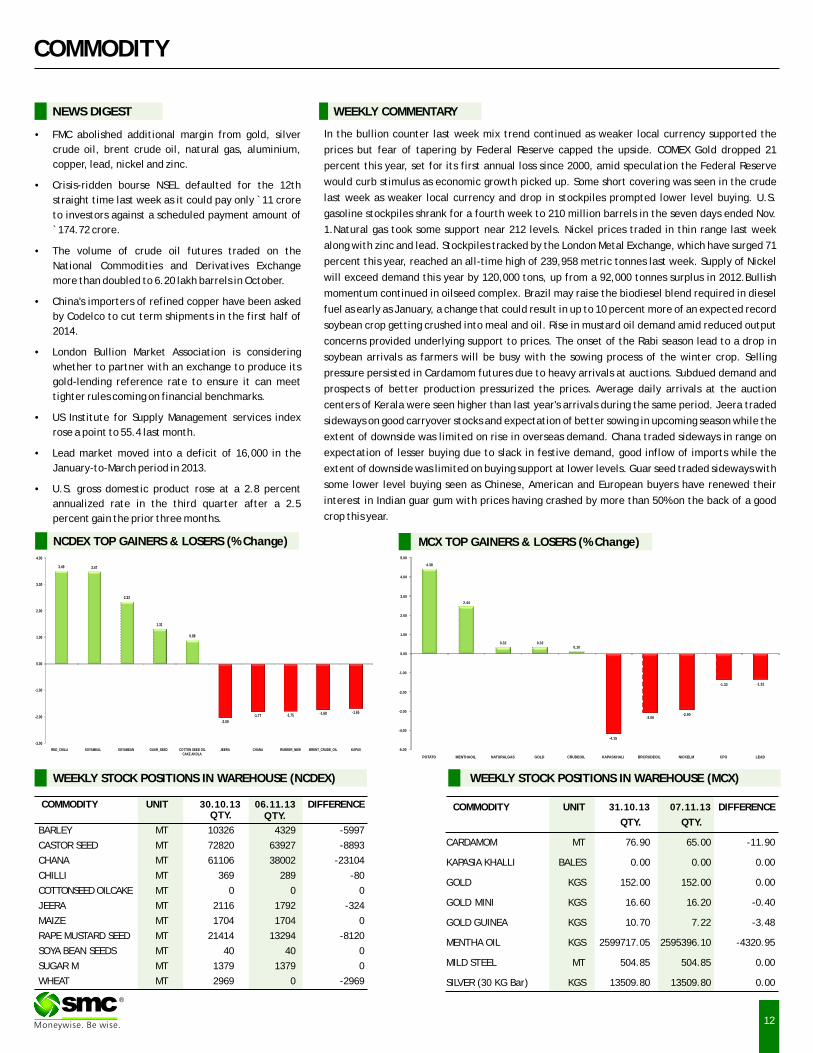
NCDEX TOP GAINERS & LOSERS (% Change) MCX TOP GAINERS & LOSERS (% Change)
QTY.
4.38
2.44
0.32 0.320.10
-4.15
-3.06-2.90
-1.33 -1.32
-5.00
-4.00
-3.00
-2.00
-1.00
0.00
1.00
2.00
3.00
4.00
5.00
POTATO MENTHAOIL NATURALGAS GOLD CRUDEOIL KAPASKHALI BRCRUDEOIL NICKELM CPO LEAD
3.49 3.47
2.33
1.31
0.88
-2.00
-1.77 -1.75 -1.69 -1.65
-3.00
-2.00
-1.00
0.00
1.00
2.00
3.00
4.00
RED_CHILLI SOYAMEAL SOYABEAN GUAR_SEED COTTON SEED OIL CAKE AKOLA
JEERA CHANA RUBBER_NEW BRENT_CRUDE_OIL KAPAS
Maize
13
SPOT PRICES (% change)
COMMODITY
COMMODITY EXCHANGE CONTRACT 31.10.13 07.11.13 CHANGE%
ALUMINIUM LME 3 MONTHS 1978.00 1820.50 -7.96
COPPER LME 3 MONTHS 7280.00 7118.00 -2.23
LEAD LME 3 MONTHS 2233.00 2138.00 -4.25
NICKEL LME 3 MONTHS 14830.00 14060.00 -5.19
ZINC LME 3 MONTHS 2033.00 1904.00 -6.35
GOLD COMEX DEC 1323.70 1308.50 -1.15
SILVER COMEX DEC 21.87 21.65 -0.99
LIGHT CRUDE OIL NYMEX DEC 96.38 94.20 -2.26
NATURAL GAS NYMEX DEC 3.58 3.52 -1.70
PRICES OF METALS IN LME/ COMEX/ NYMEX (in US $)
Maize or corn is important for its wide variety of applications, ranging from food and feed to industrial products, and more recently, as an alternate fuel. In India, maize is the third most important food crop after rice and wheat.
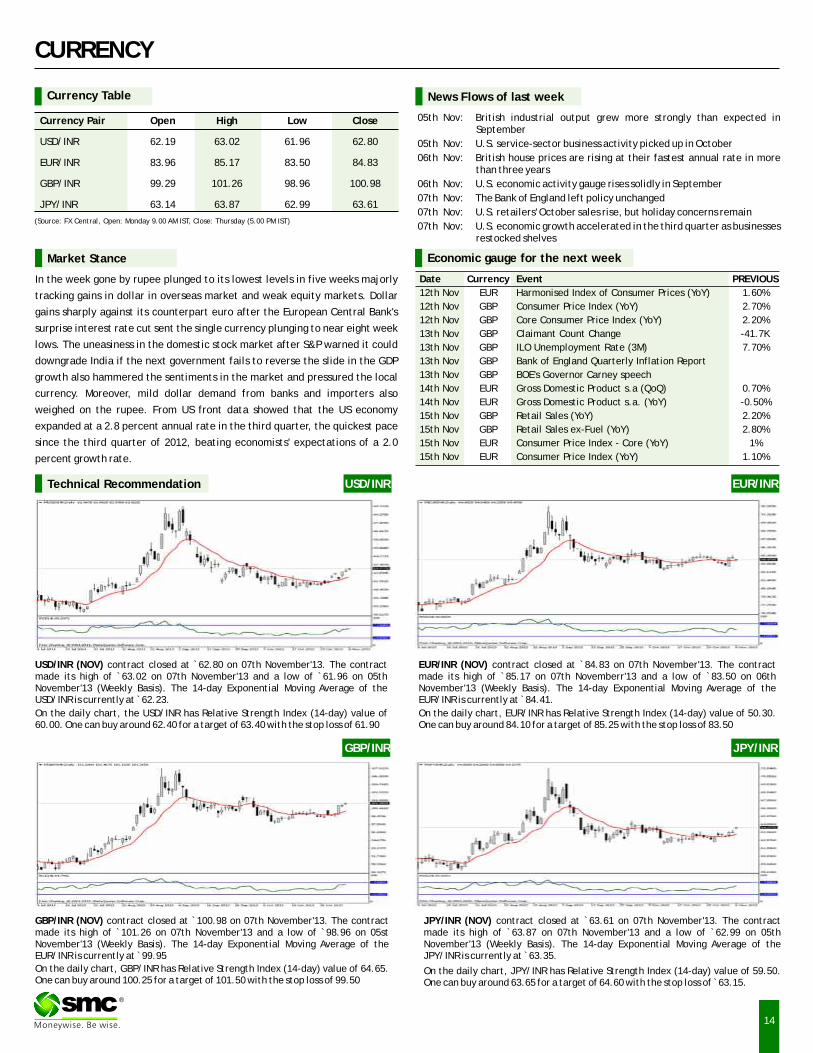
Global corn production & consumption
US, China, France, Indonesia, India and South Africa are major maize producing countries. As per the latest IGC report, the 2013-14 world corn production is forecasted at record 948 million tons, up by 5 million tons from the previous month forecast and higher by 85 million tons from the last year. IGC report said that Carryover stocks are seen recovering to a 13-year high at 152 million tons. According to USDA, Global corn consumption was projected at 927.84 million tonnes in 2013-14, up 58.53 million tonnes, or 10 percent, from 869.31 million tonnes in 2012-13. World corn exports were projected at 102.72 million tonnes, up 8.37 million tonnes, or 9 percent, from 94.35 million tonnes in 2012-13. Global corn ending stocks for 2013/14 are projected 1.3 million tonnes higher with larger stocks in Brazil and the United States.
®
WEEKLY STOCK POSITIONS IN LME (IN TONNES)
COMMODITY STOCK POSITION STOCK POSITION DIFFERENCE
31.10.13 07.11.13
ALUMINIUM 5383625 5358325 -25300
COPPER 476025 468925 -7100
NICKEL 236958 239850 2892
LEAD 232925 233150 225
ZINC 1035650 1020675 -14975
INTERNATIONAL COMMODITY PRICES
COMMODITY EXCHANGE CONTRACT UNIT 31.10.13 07.11.13 CHANGE(%)
Soya CBOT JAN Cent per Bushel 1266.20 1266.40 0.02
Maize CBOT DEC Cent per Bushel 428.20 420.40 -1.82
CPO BMD JAN MYR per MT 2534.00 2544.00 0.39
Sugar LIFFE DEC 10 cents per MT 483.30 475.10 -1.70
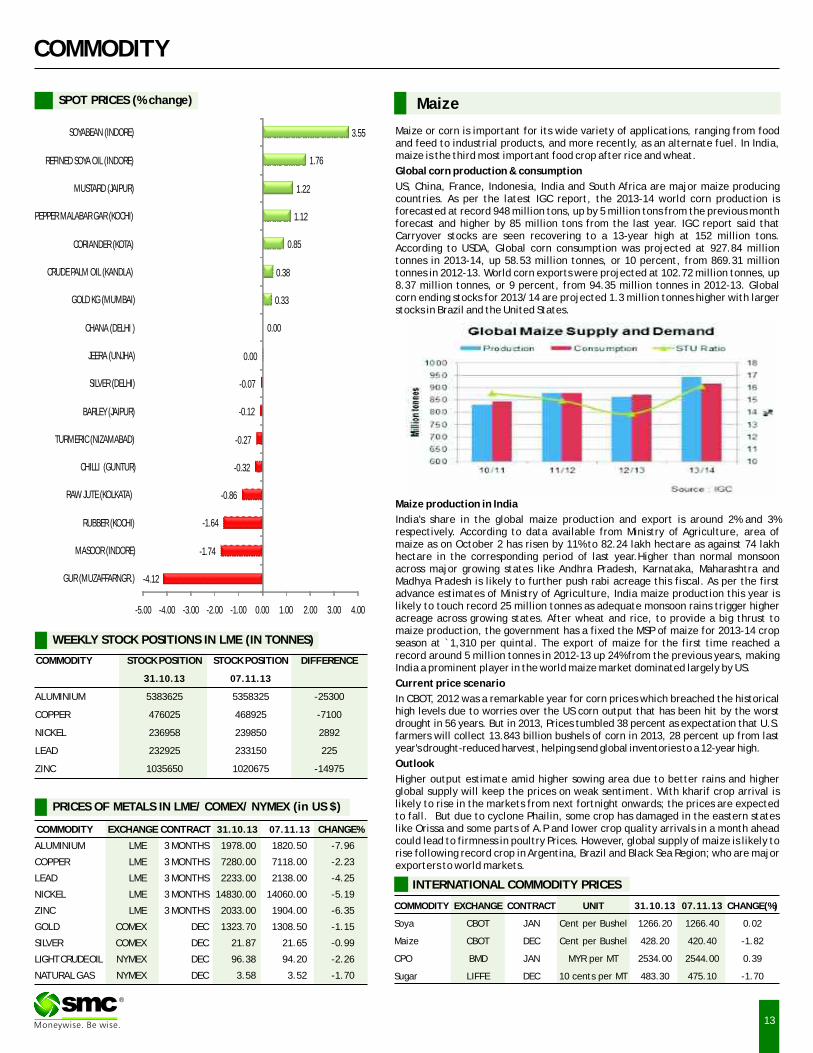
-4.12
-1.74
-1.64
-0.86
-0.32
-0.27
-0.12
-0.07
0.00
0.00
0.33
0.38
0.85
1.12
1.22
1.76
3.55
-5.00 -4.00 -3.00 -2.00 -1.00 0.00 1.00 2.00 3.00 4.00
GUR (MUZAFFARNGR.)
MASOOR (INDORE)
RUBBER (KOCHI)
RAW JUTE (KOLKATA)
CHILLI (GUNTUR)
TURMERIC (NIZAMABAD)
BARLEY (JAIPUR)
SILVER (DELHI)
JEERA (UNJHA)
CHANA (DELHI )
GOLD KG (MUMBAI)
CRUDE PALM OIL (KANDLA)
CORIANDER (KOTA)
PEPPER MALABAR GAR (KOCHI)
MUSTARD (JAIPUR)
REFINED SOYA OIL (INDORE)
SOYABEAN (INDORE)
Maize production in India
India's share in the global maize production and export is around 2% and 3% respectively. According to data available from Ministry of Agriculture, area of maize as on October 2 has risen by 11% to 82.24 lakh hectare as against 74 lakh hectare in the corresponding period of last year.Higher than normal monsoon across major growing states like Andhra Pradesh, Karnataka, Maharashtra and Madhya Pradesh is likely to further push rabi acreage this fiscal. As per the first advance estimates of Ministry of Agriculture, India maize production this year is likely to touch record 25 million tonnes as adequate monsoon rains trigger higher acreage across growing states. After wheat and rice, to provide a big thrust to maize production, the government has a fixed the MSP of maize for 2013-14 crop season at `1,310 per quintal. The export of maize for the first time reached a record around 5 million tonnes in 2012-13 up 24% from the previous years, making India a prominent player in the world maize market dominated largely by US.
Current price scenario
In CBOT, 2012 was a remarkable year for corn prices which breached the historical high levels due to worries over the US corn output that has been hit by the worst drought in 56 years. But in 2013, Prices tumbled 38 percent as expectation that U.S. farmers will collect 13.843 billion bushels of corn in 2013, 28 percent up from last year's drought-reduced harvest, helping send global inventories to a 12-year high.
Outlook
Higher output estimate amid higher sowing area due to better rains and higher global supply will keep the prices on weak sentiment. With kharif crop arrival is likely to rise in the markets from next fortnight onwards; the prices are expected to fall. But due to cyclone Phailin, some crop has damaged in the eastern states like Orissa and some parts of A.P and lower crop quality arrivals in a month ahead could lead to firmness in poultry Prices. However, global supply of maize is likely to rise following record crop in Argentina, Brazil and Black Sea Region; who are major exporters to world markets.
CURRENCY
Currency Table
Currency Pair Open High Low Close
USD/INR 62.19 63.02 61.96 62.80
EUR/INR 83.96 85.17 83.50 84.83
GBP/INR 99.29 101.26 98.96 100.98
JPY/INR 63.14 63.87 62.99 63.61
(Source: FX Central, Open: Monday 9.00 AM IST, Close: Thursday (5.00 PM IST)
News Flows of last week
05th Nov: British industrial output grew more strongly than expected in September
05th Nov: U.S. service-sector business activity picked up in October
06th Nov: British house prices are rising at their fastest annual rate in more than three years
06th Nov: U.S. economic activity gauge rises solidly in September
07th Nov: The Bank of England left policy unchanged
07th Nov: U.S. retailers' October sales rise, but holiday concerns remain
07th Nov: U.S. economic growth accelerated in the third quarter as businesses restocked shelves
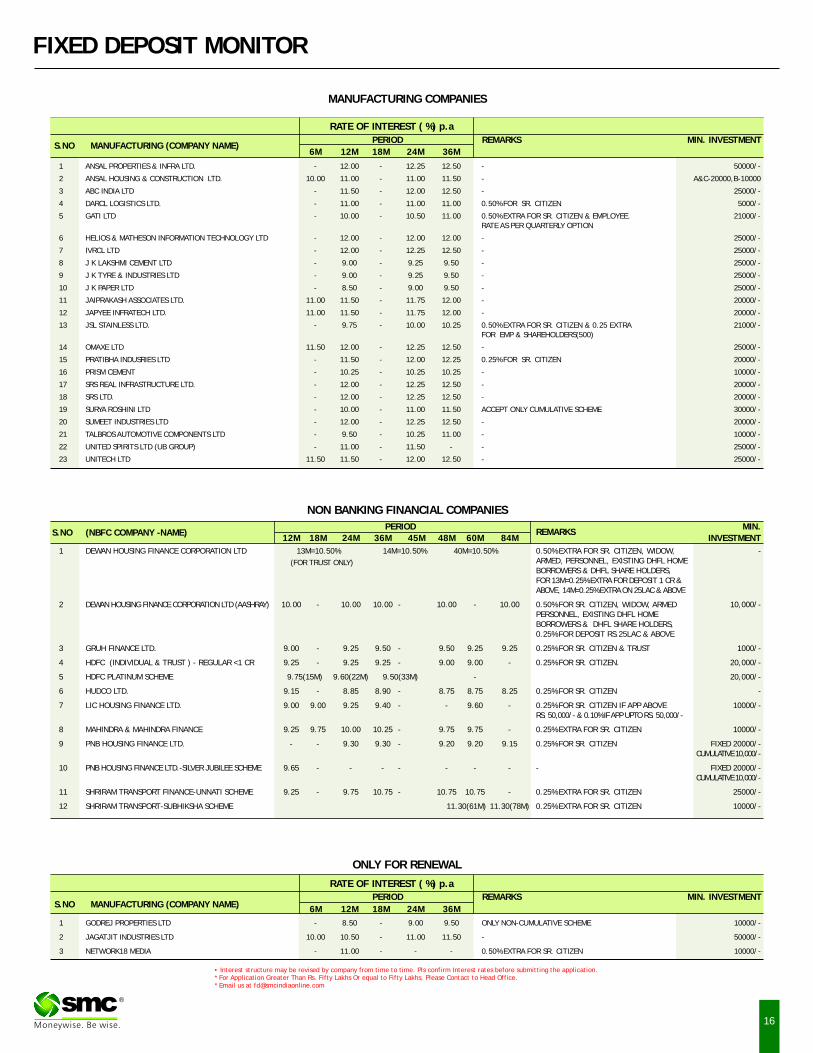
EUR/INR (NOV) contract closed at 84.83 on 07th November'13. The contract made its high of `85.17 on 07th Novemberr'13 and a low of `83.50 on 06th November'13 (Weekly Basis). The 14-day Exponential Moving Average of the EUR/INR is currently at ̀ 84.41.
On the daily chart, EUR/INR has Relative Strength Index (14-day) value of 50.30. One can buy around 84.10 for a target of 85.25 with the stop loss of 83.50
`
JPY/INR (NOV) contract closed at 63.61 on 07th November'13. The contract made its high of `63.87 on 07th November'13 and a low of `62.99 on 05th November'13 (Weekly Basis). The 14-day Exponential Moving Average of the JPY/INR is currently at ̀ 63.35.
On the daily chart, JPY/INR has Relative Strength Index (14-day) value of 59.50. One can buy around 63.65 for a target of 64.60 with the stop loss of ̀ 63.15.
`
Market Stance
In the week gone by rupee plunged to its lowest levels in five weeks majorly
tracking gains in dollar in overseas market and weak equity markets. Dollar
gains sharply against its counterpart euro after the European Central Bank's
surprise interest rate cut sent the single currency plunging to near eight week
lows. The uneasiness in the domestic stock market after S&P warned it could
downgrade India if the next government fails to reverse the slide in the GDP
growth also hammered the sentiments in the market and pressured the local
currency. Moreover, mild dollar demand from banks and importers also
weighed on the rupee. From US front data showed that the US economy
expanded at a 2.8 percent annual rate in the third quarter, the quickest pace
since the third quarter of 2012, beating economists' expectations of a 2.0
percent growth rate.
EUR/INR
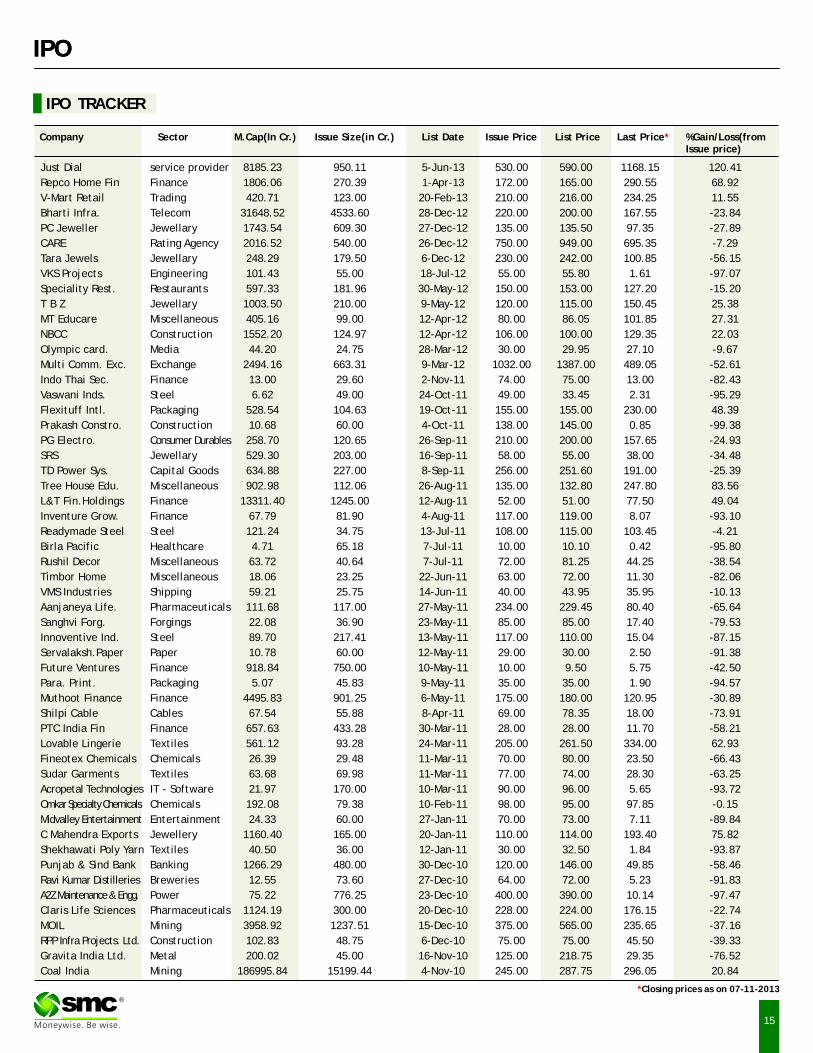
USD/INR (NOV) contract closed at 62.80 on 07th November'13. The contract made its high of `63.02 on 07th November'13 and a low of `61.96 on 05th November'13 (Weekly Basis). The 14-day Exponential Moving Average of the USD/INR is currently at ̀ 62.23.
On the daily chart, the USD/INR has Relative Strength Index (14-day) value of 60.00. One can buy around 62.40 for a target of 63.40 with the stop loss of 61.90
`
GBP/INR (NOV) contract closed at 100.98 on 07th November'13. The contract made its high of `101.26 on 07th November'13 and a low of `98.96 on 05st November'13 (Weekly Basis). The 14-day Exponential Moving Average of the EUR/INR is currently at ̀ 99.95
On the daily chart, GBP/INR has Relative Strength Index (14-day) value of 64.65. One can buy around 100.25 for a target of 101.50 with the stop loss of 99.50
`
USD/INRTechnical Recommendation
GBP/INR JPY/INR
14
®
Economic gauge for the next week
Date Currency Event PREVIOUS
12th Nov EUR Harmonised Index of Consumer Prices (YoY) 1.60%
12th Nov GBP Consumer Price Index (YoY) 2.70%
12th Nov GBP Core Consumer Price Index (YoY) 2.20%
13th Nov GBP Claimant Count Change -41.7K
13th Nov GBP ILO Unemployment Rate (3M) 7.70%
13th Nov GBP Bank of England Quarterly Inflation Report
13th Nov GBP BOE's Governor Carney speech
14th Nov EUR Gross Domestic Product s.a (QoQ) 0.70%
14th Nov EUR Gross Domestic Product s.a. (YoY) -0.50%
15th Nov GBP Retail Sales (YoY) 2.20%
15th Nov GBP Retail Sales ex-Fuel (YoY) 2.80%
15th Nov EUR Consumer Price Index - Core (YoY) 1%
15th Nov EUR Consumer Price Index (YoY) 1.10%
IPOIPO
IPO TRACKER
Company Sector M.Cap(In Cr.) Issue Size(in Cr.) List Date Issue Price List Price Last Price %Gain/Loss(from Issue price)
*
Just Dial service provider 8185.23 950.11 5-Jun-13 530.00 590.00 1168.15 120.41
Repco Home Fin Finance 1806.06 270.39 1-Apr-13 172.00 165.00 290.55 68.92
V-Mart Retail Trading 420.71 123.00 20-Feb-13 210.00 216.00 234.25 11.55
Bharti Infra. Telecom 31648.52 4533.60 28-Dec-12 220.00 200.00 167.55 -23.84
PC Jeweller Jewellary 1743.54 609.30 27-Dec-12 135.00 135.50 97.35 -27.89
CARE Rating Agency 2016.52 540.00 26-Dec-12 750.00 949.00 695.35 -7.29
Tara Jewels Jewellary 248.29 179.50 6-Dec-12 230.00 242.00 100.85 -56.15
VKS Projects Engineering 101.43 55.00 18-Jul-12 55.00 55.80 1.61 -97.07
Speciality Rest. Restaurants 597.33 181.96 30-May-12 150.00 153.00 127.20 -15.20
T B Z Jewellary 1003.50 210.00 9-May-12 120.00 115.00 150.45 25.38
MT Educare Miscellaneous 405.16 99.00 12-Apr-12 80.00 86.05 101.85 27.31
NBCC Construction 1552.20 124.97 12-Apr-12 106.00 100.00 129.35 22.03
Olympic card. Media 44.20 24.75 28-Mar-12 30.00 29.95 27.10 -9.67
Multi Comm. Exc. Exchange 2494.16 663.31 9-Mar-12 1032.00 1387.00 489.05 -52.61
Indo Thai Sec. Finance 13.00 29.60 2-Nov-11 74.00 75.00 13.00 -82.43
Vaswani Inds. Steel 6.62 49.00 24-Oct-11 49.00 33.45 2.31 -95.29
Flexituff Intl. Packaging 528.54 104.63 19-Oct-11 155.00 155.00 230.00 48.39
Prakash Constro. Construction 10.68 60.00 4-Oct-11 138.00 145.00 0.85 -99.38
PG Electro. Consumer Durables 258.70 120.65 26-Sep-11 210.00 200.00 157.65 -24.93
SRS Jewellary 529.30 203.00 16-Sep-11 58.00 55.00 38.00 -34.48
TD Power Sys. Capital Goods 634.88 227.00 8-Sep-11 256.00 251.60 191.00 -25.39
Tree House Edu. Miscellaneous 902.98 112.06 26-Aug-11 135.00 132.80 247.80 83.56
L&T Fin.Holdings Finance 13311.40 1245.00 12-Aug-11 52.00 51.00 77.50 49.04
Inventure Grow. Finance 67.79 81.90 4-Aug-11 117.00 119.00 8.07 -93.10
Readymade Steel Steel 121.24 34.75 13-Jul-11 108.00 115.00 103.45 -4.21
Birla Pacific Healthcare 4.71 65.18 7-Jul-11 10.00 10.10 0.42 -95.80
Rushil Decor Miscellaneous 63.72 40.64 7-Jul-11 72.00 81.25 44.25 -38.54
Timbor Home Miscellaneous 18.06 23.25 22-Jun-11 63.00 72.00 11.30 -82.06
VMS Industries Shipping 59.21 25.75 14-Jun-11 40.00 43.95 35.95 -10.13
Aanjaneya Life. Pharmaceuticals 111.68 117.00 27-May-11 234.00 229.45 80.40 -65.64
Sanghvi Forg. Forgings 22.08 36.90 23-May-11 85.00 85.00 17.40 -79.53
Innoventive Ind. Steel 89.70 217.41 13-May-11 117.00 110.00 15.04 -87.15
Servalaksh.Paper Paper 10.78 60.00 12-May-11 29.00 30.00 2.50 -91.38
Future Ventures Finance 918.84 750.00 10-May-11 10.00 9.50 5.75 -42.50
Para. Print. Packaging 5.07 45.83 9-May-11 35.00 35.00 1.90 -94.57
Muthoot Finance Finance 4495.83 901.25 6-May-11 175.00 180.00 120.95 -30.89
Shilpi Cable Cables 67.54 55.88 8-Apr-11 69.00 78.35 18.00 -73.91
PTC India Fin Finance 657.63 433.28 30-Mar-11 28.00 28.00 11.70 -58.21
Lovable Lingerie Textiles 561.12 93.28 24-Mar-11 205.00 261.50 334.00 62.93
Fineotex Chemicals Chemicals 26.39 29.48 11-Mar-11 70.00 80.00 23.50 -66.43
Sudar Garments Textiles 63.68 69.98 11-Mar-11 77.00 74.00 28.30 -63.25
Acropetal Technologies IT - Software 21.97 170.00 10-Mar-11 90.00 96.00 5.65 -93.72
Omkar Specialty Chemicals Chemicals 192.08 79.38 10-Feb-11 98.00 95.00 97.85 -0.15
Midvalley Entertainment Entertainment 24.33 60.00 27-Jan-11 70.00 73.00 7.11 -89.84
C Mahendra Exports Jewellery 1160.40 165.00 20-Jan-11 110.00 114.00 193.40 75.82
Shekhawati Poly Yarn Textiles 40.50 36.00 12-Jan-11 30.00 32.50 1.84 -93.87
Punjab & Sind Bank Banking 1266.29 480.00 30-Dec-10 120.00 146.00 49.85 -58.46
Ravi Kumar Distilleries Breweries 12.55 73.60 27-Dec-10 64.00 72.00 5.23 -91.83
A2Z Maintenance & Engg. Power 75.22 776.25 23-Dec-10 400.00 390.00 10.14 -97.47
Claris Life Sciences Pharmaceuticals 1124.19 300.00 20-Dec-10 228.00 224.00 176.15 -22.74
MOIL Mining 3958.92 1237.51 15-Dec-10 375.00 565.00 235.65 -37.16
RPP Infra Projects. Ltd. Construction 102.83 48.75 6-Dec-10 75.00 75.00 45.50 -39.33
Gravita India Ltd. Metal 200.02 45.00 16-Nov-10 125.00 218.75 29.35 -76.52
Coal India Mining 186995.84 15199.44 4-Nov-10 245.00 287.75 296.05 20.84
®
*Closing prices as on 07-11-2013
15
FIXED DEPOSIT MONITOR
16
• Interest structure may be revised by company from time to time. Pls confirm Interest rates before submitting the application. * For Application Greater Than Rs. Fifty Lakhs Or equal to Fifty Lakhs, Please Contact to Head Office.* Email us at [email protected]
ONLY FOR RENEWAL
PERIOD REMARKS MIN. INVESTMENTS.NO MANUFACTURING (COMPANY NAME)
6M 12M 18M 24M 36M
1 GODREJ PROPERTIES LTD - 8.50 - 9.00 9.50 ONLY NON-CUMULATIVE SCHEME 10000/-
2 JAGATJIT INDUSTRIES LTD 10.00 10.50 - 11.00 11.50 - 50000/-
3 NETWORK18 MEDIA - 11.00 - - - 0.50% EXTRA FOR SR. CITIZEN 10000/-
RATE OF INTEREST ( %) p.a
PERIOD REMARKS MIN. INVESTMENTS.NO MANUFACTURING (COMPANY NAME)
6M 12M 18M 24M 36M
1 ANSAL PROPERTIES & INFRA LTD. - 12.00 - 12.25 12.50 - 50000/-
2 ANSAL HOUSING & CONSTRUCTION LTD. 10.00 11.00 - 11.00 11.50 - A&C-20000,B-10000
3 ABC INDIA LTD - 11.50 - 12.00 12.50 - 25000/-
4 DARCL LOGISTICS LTD. - 11.00 - 11.00 11.00 0.50% FOR SR. CITIZEN 5000/-
5 GATI LTD - 10.00 - 10.50 11.00 0.50% EXTRA FOR SR. CITIZEN & EMPLOYEE. 21000/-RATE AS PER QUARTERLY OPTION
6 HELIOS & MATHESON INFORMATION TECHNOLOGY LTD - 12.00 - 12.00 12.00 - 25000/-
7 IVRCL LTD - 12.00 - 12.25 12.50 - 25000/-
8 J K LAKSHMI CEMENT LTD - 9.00 - 9.25 9.50 - 25000/-
9 J K TYRE & INDUSTRIES LTD - 9.00 - 9.25 9.50 - 25000/-
10 J K PAPER LTD - 8.50 - 9.00 9.50 - 25000/-
11 JAIPRAKASH ASSOCIATES LTD. 11.00 11.50 - 11.75 12.00 - 20000/-
12 JAPYEE INFRATECH LTD. 11.00 11.50 - 11.75 12.00 - 20000/-
13 JSL STAINLESS LTD. - 9.75 - 10.00 10.25 0.50% EXTRA FOR SR. CITIZEN & 0.25 EXTRA 21000/-FOR EMP & SHAREHOLDERS(500)
14 OMAXE LTD 11.50 12.00 - 12.25 12.50 - 25000/-
15 PRATIBHA INDUSRIES LTD - 11.50 - 12.00 12.25 0.25% FOR SR. CITIZEN 20000/-
16 PRISM CEMENT - 10.25 - 10.25 10.25 - 10000/-
17 SRS REAL INFRASTRUCTURE LTD. - 12.00 - 12.25 12.50 - 20000/-
18 SRS LTD. - 12.00 - 12.25 12.50 - 20000/-
19 SURYA ROSHINI LTD - 10.00 - 11.00 11.50 ACCEPT ONLY CUMULATIVE SCHEME 30000/-
20 SUMEET INDUSTRIES LTD - 12.00 - 12.25 12.50 - 20000/-
21 TALBROS AUTOMOTIVE COMPONENTS LTD - 9.50 - 10.25 11.00 - 10000/-
22 UNITED SPIRITS LTD (UB GROUP) - 11.00 - 11.50 - - 25000/-
23 UNITECH LTD 11.50 11.50 - 12.00 12.50 - 25000/-
RATE OF INTEREST ( %) p.a
MANUFACTURING COMPANIES
NON BANKING FINANCIAL COMPANIES
PERIOD MIN.REMARKSS.NO (NBFC COMPANY -NAME)
12M 18M 24M 36M 45M 48M 60M 84M INVESTMENT
1 DEWAN HOUSING FINANCE CORPORATION LTD 13M=10.50% 14M=10.50% 40M=10.50% 0.50% EXTRA FOR SR. CITIZEN, WIDOW, -ARMED, PERSONNEL, EXISTING DHFL HOME BORROWERS & DHFL SHARE HOLDERS, FOR 13M=0.25% EXTRA FOR DEPOSIT 1 CR & ABOVE, 14M=0.25% EXTRA ON 25LAC & ABOVE
2 DEWAN HOUSING FINANCE CORPORATION LTD (AASHRAY) 10.00 - 10.00 10.00 - 10.00 - 10.00 0.50% FOR SR. CITIZEN, WIDOW, ARMED 10,000/-PERSONNEL, EXISTING DHFL HOME BORROWERS & DHFL SHARE HOLDERS, 0.25% FOR DEPOSIT RS.25LAC & ABOVE
3 GRUH FINANCE LTD. 9.00 - 9.25 9.50 - 9.50 9.25 9.25 0.25% FOR SR. CITIZEN & TRUST 1000/-
4 HDFC (INDIVIDUAL & TRUST ) - REGULAR <1 CR 9.25 - 9.25 9.25 - 9.00 9.00 - 0.25% FOR SR. CITIZEN. 20,000/-
5 HDFC PLATINUM SCHEME 9.75(15M) 9.60(22M) 9.50(33M) - 20,000/-
6 HUDCO LTD. 9.15 - 8.85 8.90 - 8.75 8.75 8.25 0.25% FOR SR. CITIZEN -
7 LIC HOUSING FINANCE LTD. 9.00 9.00 9.25 9.40 - - 9.60 - 0.25% FOR SR. CITIZEN IF APP ABOVE 10000/-RS. 50,000/- & 0.10% IF APP UPTO RS. 50,000/-
8 MAHINDRA & MAHINDRA FINANCE 9.25 9.75 10.00 10.25 - 9.75 9.75 - 0.25% EXTRA FOR SR. CITIZEN 10000/-
9 PNB HOUSING FINANCE LTD. - - 9.30 9.30 - 9.20 9.20 9.15 0.25% FOR SR. CITIZEN FIXED 20000/- CUMULATIVE 10,000/-
10 PNB HOUSING FINANCE LTD.-SILVER JUBILEE SCHEME 9.65 - - - - - - - - FIXED 20000/- CUMULATIVE 10,000/-
11 SHRIRAM TRANSPORT FINANCE-UNNATI SCHEME 9.25 - 9.75 10.75 - 10.75 10.75 - 0.25% EXTRA FOR SR. CITIZEN 25000/-
12 SHRIRAM TRANSPORT-SUBHIKSHA SCHEME 11.30(61M) 11.30(78M) 0.25% EXTRA FOR SR. CITIZEN 10000/-
(FOR TRUST ONLY)
®
MUTUAL FUND
NEWS
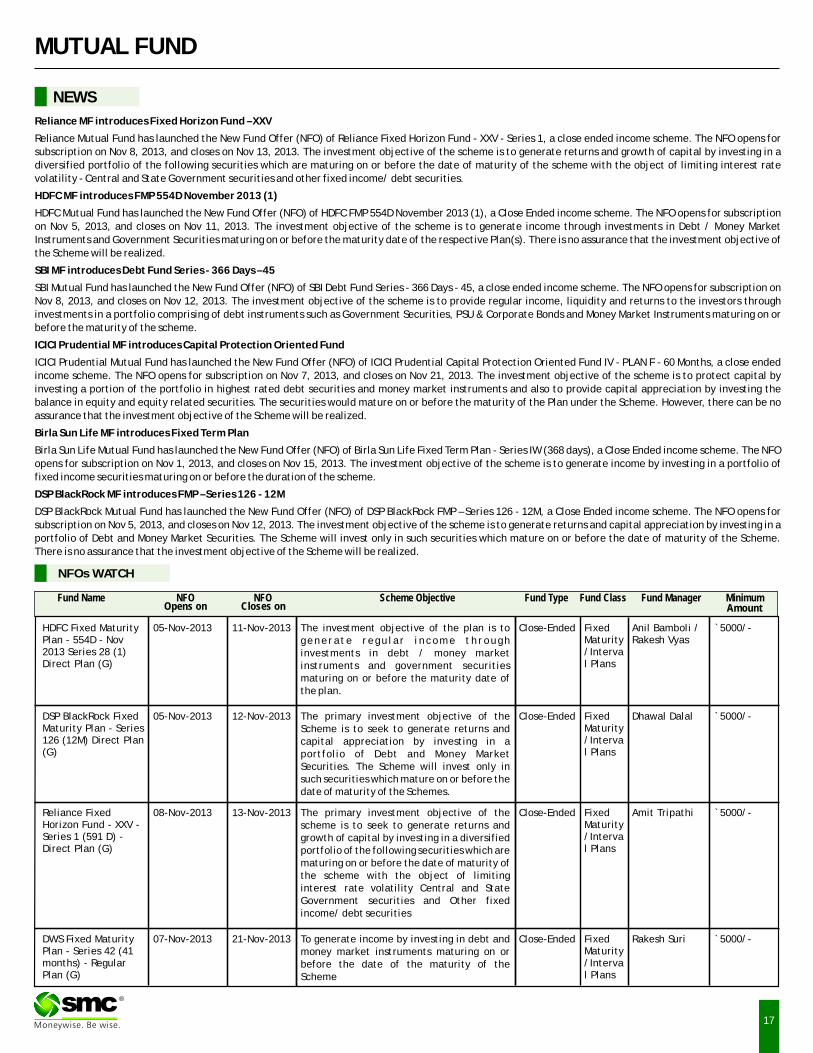
Reliance MF introduces Fixed Horizon Fund – XXV
Reliance Mutual Fund has launched the New Fund Offer (NFO) of Reliance Fixed Horizon Fund - XXV - Series 1, a close ended income scheme. The NFO opens for
subscription on Nov 8, 2013, and closes on Nov 13, 2013. The investment objective of the scheme is to generate returns and growth of capital by investing in a
diversified portfolio of the following securities which are maturing on or before the date of maturity of the scheme with the object of limiting interest rate
volatility - Central and State Government securities and other fixed income/ debt securities.
HDFC MF introduces FMP 554D November 2013 (1)
HDFC Mutual Fund has launched the New Fund Offer (NFO) of HDFC FMP 554D November 2013 (1), a Close Ended income scheme. The NFO opens for subscription
on Nov 5, 2013, and closes on Nov 11, 2013. The investment objective of the scheme is to generate income through investments in Debt / Money Market
Instruments and Government Securities maturing on or before the maturity date of the respective Plan(s). There is no assurance that the investment objective of
the Scheme will be realized.
SBI MF introduces Debt Fund Series - 366 Days – 45
SBI Mutual Fund has launched the New Fund Offer (NFO) of SBI Debt Fund Series - 366 Days - 45, a close ended income scheme. The NFO opens for subscription on
Nov 8, 2013, and closes on Nov 12, 2013. The investment objective of the scheme is to provide regular income, liquidity and returns to the investors through
investments in a portfolio comprising of debt instruments such as Government Securities, PSU & Corporate Bonds and Money Market Instruments maturing on or
before the maturity of the scheme.
ICICI Prudential MF introduces Capital Protection Oriented Fund
ICICI Prudential Mutual Fund has launched the New Fund Offer (NFO) of ICICI Prudential Capital Protection Oriented Fund IV - PLAN F - 60 Months, a close ended
income scheme. The NFO opens for subscription on Nov 7, 2013, and closes on Nov 21, 2013. The investment objective of the scheme is to protect capital by
investing a portion of the portfolio in highest rated debt securities and money market instruments and also to provide capital appreciation by investing the
balance in equity and equity related securities. The securities would mature on or before the maturity of the Plan under the Scheme. However, there can be no
assurance that the investment objective of the Scheme will be realized.
Birla Sun Life MF introduces Fixed Term Plan
Birla Sun Life Mutual Fund has launched the New Fund Offer (NFO) of Birla Sun Life Fixed Term Plan - Series IW (368 days), a Close Ended income scheme. The NFO
opens for subscription on Nov 1, 2013, and closes on Nov 15, 2013. The investment objective of the scheme is to generate income by investing in a portfolio of
fixed income securities maturing on or before the duration of the scheme.
DSP BlackRock MF introduces FMP – Series 126 - 12M
DSP BlackRock Mutual Fund has launched the New Fund Offer (NFO) of DSP BlackRock FMP – Series 126 - 12M, a Close Ended income scheme. The NFO opens for
subscription on Nov 5, 2013, and closes on Nov 12, 2013. The investment objective of the scheme is to generate returns and capital appreciation by investing in a
portfolio of Debt and Money Market Securities. The Scheme will invest only in such securities which mature on or before the date of maturity of the Scheme.
There is no assurance that the investment objective of the Scheme will be realized.
17
NFOs WATCH
Fund Name NFO NFO Scheme Objective Fund Type Fund Class Fund Manager MinimumOpens on Closes on Amount
05-Nov-2013 11-Nov-2013 Close-Ended Fixed Maturity /Interval Plans
`5000/-HDFC Fixed Maturity Plan - 554D - Nov 2013 Series 28 (1) Direct Plan (G)
Anil Bamboli / Rakesh Vyas
The investment objective of the plan is to gene ra te regu la r i ncome th rough investments in debt / money market instruments and government securities maturing on or before the maturity date of the plan.
08-Nov-2013 13-Nov-2013 Close-Ended Fixed Maturity /Interval Plans
`5000/-Reliance Fixed Horizon Fund - XXV - Series 1 (591 D) - Direct Plan (G)
Amit TripathiThe primary investment objective of the scheme is to seek to generate returns and growth of capital by investing in a diversified portfolio of the following securities which are maturing on or before the date of maturity of the scheme with the object of limiting interest rate volatility Central and State Government securities and Other fixed income/ debt securities
®
05-Nov-2013 12-Nov-2013 Close-Ended Fixed Maturity /Interval Plans
`5000/-DSP BlackRock Fixed Maturity Plan - Series 126 (12M) Direct Plan (G)
Dhawal DalalThe primary investment objective of the Scheme is to seek to generate returns and capital appreciation by investing in a portfolio of Debt and Money Market Securities. The Scheme will invest only in such securities which mature on or before the date of maturity of the Schemes.
07-Nov-2013 21-Nov-2013 Close-Ended Fixed Maturity /Interval Plans
`5000/-DWS Fixed Maturity Plan - Series 42 (41 months) - Regular Plan (G)
Rakesh SuriTo generate income by investing in debt and money market instruments maturing on or before the date of the maturity of the Scheme

18
MUTUAL FUND Performance Charts
Returns (%) Risk Market Cap (%)
Scheme Name NAV Launch AUM 3M 6M 1Y 3Y Since Std.Dev Beta Jenson LARGE MID SMALL DEBT &
(`) Date (` Cr.) Launch CAP CAP CAP OTHER
ICICI Pru. Exports and Other Services Fund - G 25.46 30-Nov-2005 168.8 18.31 30.5 39.35 9.92 12.49 1.61 N. A. N. A. 63.16 28.03 1.65 7.16
ICICI Prudential Dynamic Plan - Growth 128.49 31-Oct-2002 3442.54 19.06 11.55 14.72 4.54 26.05 1.63 N. A. N. A. 61.95 19.73 2.88 15.45
Axis Equity Fund - Growth 13.34 05-Jan-2010 567.59 11.07 3.49 14.51 2.66 7.79 1.75 N. A. N. A. 73.66 12.15 1.97 12.22
BNP Paribas Equity Fund - Growth 42.45 23-Sep-2004 131.99 11.62 6.15 13.87 4.28 17.16 1.71 N. A. N. A. 79.40 12.21 N. A. 8.38
ICICI Prudential Top 100 Fund - Growth 165.2 09-Jul-1998 385.81 16.51 8.02 12.66 4.14 20.06 1.90 N. A. N. A. 83.43 5.19 N. A. 11.38
Franklin India Smaller Companies Fund - G 17.81 13-Jan-2006 282.11 18.00 7.85 12.41 2.63 7.66 2.04 N. A. N. A. 13.25 66.90 10.53 9.31
ICICI Pru. Focused Bluechip Equity Fund - Ret - G 19.87 23-May-2008 4437.61 14.52 6.60 11.88 3.74 13.39 1.86 N. A. N. A. 89.33 3.34 2.71 4.62
EQUITY (Diversified)
BALANCED
INCOME FUND
Note: Indicative corpus are including Growth & Dividend option. The above mentioned data is on the basis of 07/11/2013Beta, Sharpe and Standard Deviation are calculated on the basis of period: 1 year, frequency: Weekly Friday, RF: 7%
ULTRA SHORT TERM
SHORT TERM FUND
Due to their inherent long term nature, the following 3 categories have been sorted on the basis of 1 year returns
Due to their inherent short term nature, the following 2 categories have been sorted on the basis of 6month returns
Returns (%) Risk Market Cap (%)
Scheme Name NAV Launch AUM 3M 6M 1Y 3Y Since Std.Dev Jenson LARGE MID SMALL DEBT &
(`) Date (` Cr.) Launch CAP CAP CAP OTHER
ICICI Prudential Balanced - Growth 59.22 03-Nov-1999 537.17 11.82 4.70 10.75 6.90 13.52 1.37 0.06 50.32 15.74 2.67 31.27
SBI Magnum Balanced Fund - Growth 59.54 09-Oct-1995 398.27 9.83 4.30 10.32 2.44 15.54 1.37 0.04 29.34 30.84 8.98 30.85
FT India Balanced Fund - Growth 56.71 10-Dec-1999 190.46 9.27 2.29 8.10 3.27 13.28 1.56 0.01 52.11 18.01 N. A. 29.88
Birla Sun Life 95 - Growth 355.79 10-Feb-1995 586.31 10.93 1.49 6.91 2.40 20.98 1.51 -0.01 55.26 13.40 0.91 30.43
Tata Balanced Fund - Plan A - Growth 101.51 08-Oct-1995 603.57 11.54 3.07 6.22 4.53 15.62 1.54 -0.02 52.81 18.96 1.14 27.10
UTI Balanced Fund - Growth 89.32 20-Jan-1995 928.72 10.72 2.10 5.46 0.53 15.93 1.39 -0.04 56.03 14.75 2.51 26.71
HDFC Balanced Fund - Growth 65.48 11-Sep-2000 1090.64 13.19 4.75 5.37 4.06 15.34 1.45 -0.06 26.28 41.15 3.78 28.79
Returns (%) RiskAverage Yield till
Scheme Name NAV Launch AUM Since Std. SharpeMaturity (Days) Maturity
1W 2W 1M 6M 1Y 3Y(`) Date (`Cr.) Launch Dev.
Tata Dynamic Bond Fund - Plan A - G 18.3 03-Sep-2003 322.93 -16.19 -2.35 4.5 5.78 11.38 8.38 6.11 42.33 0.11 N. A. 8.99
Kotak Banking and PSU Debt Fund - G 27.41 29-Dec-1998 229 8.63 8.93 10.24 9.42 9.55 8.12 7.02 15.73 0.14 26 9.75
Morgan Stanley Active Bond Fund - Reg - G 12.63 03-Jun-2009 542.59 -39.09 -13.41 3.96 1.57 8.93 7.31 5.41 29.16 0.09 2176 7.95
BNP Paribas Flexi Debt Fund - Growth 20.45 23-Sep-2004 515.92 -25.12 -7.44 3.01 4.08 8.93 7.82 8.15 36.83 0.07 2924 9.12
Templeton India Income Opp. Fund - G 13.89 11-Dec-2009 3758.13 2.59 11.92 13.03 5.48 8.79 8.93 8.77 17.89 0.09 800 11.31
Tata Income Plus Fund - Plan A - Growth 18.91 11-Nov-2002 187.17 -17.64 -3.39 6.71 2.03 8.69 7.89 5.97 34.43 0.06 N. A. 9.60
Templeton India Corporate Bond Opp. Fund - G 12.12 07-Dec-2011 5046.44 4.87 9.76 12.86 5.35 8.60 N. A. 10.52 18.65 0.08 932 11.56
Annualised
Returns (%) Risk Average Yield tillScheme Name NAV Launch AUM Since Std. Sharpe Maturity (Days) Maturity
1W 2W 1M 6M 1Y 3Y(`) Date (`Cr.) Launch Dev.
Birla Sun Life Medium Term Plan - Reg - G 14.64 25-Mar-2009 1482.33 6.96 13.30 13.83 8.86 10.23 10.13 8.59 15.86 0.19 668 12.05
Birla Sun Life Short Term Opp. Fund - Reg - G 19.77 24-Apr-2003 1178.72 10.15 10.94 12.41 8.86 10.12 10.09 6.68 14.86 0.19 329 11.04
Sundaram Select Debt - S T A P - Reg - Appreciation 21.2 04-Sep-2002 1426.82 2.93 6.09 8.98 7.64 10.22 10.94 6.95 14.42 0.21 372 10.14
JPMorgan India Short Term Income Fund - G 13.41 25-Mar-2010 705.93 4.09 6.69 15.79 7.15 8.33 9.00 8.43 10.56 0.11 969 9.90
Morgan Stanley Short Term Bond Fund - Reg - G 13.97 26-May-2009 460.88 -0.82 4.97 9.37 7.09 9.08 9.18 7.88 13.63 0.15 449 9.21
Tata Short Term Bond Fund - Plan A - G 22.77 08-Aug-2002 396.15 0.64 6.31 10.05 7.06 9.14 8.82 7.58 13.11 0.15 N. A. 9.81
Sundaram Flexible Fund - ST - Growth 18.27 30-Dec-2004 782 4.91 8.03 9.11 6.87 7.69 8.16 7.03 8.96 0.05 164 9.79
Annualised
Returns (%) Risk Average Yield tillScheme Name NAV Launch AUM Since Std. Sharpe Maturity (Days) Maturity
1W 2W 1M 6M 1Y 3Y(`) Date (`Cr.) Launch Dev.
DSP BlackRock Money Manager Fund - Reg - G 1680.17 31-Jul-2006 1747.5 6.15 8.78 10.11 9.43 9.03 8.73 7.39 5.13 0.33 128 N. A.
DWS Ultra Short-Term Fund - Growth 20.03 21-Oct-2003 1376.15 8.08 9.33 9.95 9.25 9.05 9.04 7.15 4.60 0.36 91 10.24
Templeton India Ultra Short Bond Fund - Retail - G 15.82 18-Dec-2007 3254.84 8.32 9.71 10.09 9.18 9.30 9.24 8.09 3.87 0.49 64 10.32
Tata Floater Fund - Plan A - Growth 1856.17 06-Sep-2005 1983.86 7.73 9.27 10.24 9.08 9.26 9.30 7.86 4.55 0.41 N. A. 9.77
IDFC Ultra Short Term Fund - Reg - G 17.22 17-Jan-2006 1141.55 7.76 9.25 10.24 9.04 9.30 9.62 7.21 5.08 0.38 93 10.03
UTI Treasury Advantage Fund - Reg - G 3119.91 12-Jul-1999 6295.77 7.14 8.56 9.07 8.93 9.07 8.95 8.26 3.34 0.52 N. A. N. A.
Birla Sun Life Savings Fund - Ret - G 229.26 27-Nov-2001 3701.28 7.64 9.60 10.37 8.92 9.11 9.09 7.19 5.33 0.32 153 10.43
Annualised
®

DIWALI CELEBRATIONS HELD AT SMC'S VARIOUS OFFICES

Related Documents