i Physical Profiling of Rugby Union Players: Implications for Talent Development Daniel J. Smart – MSc 2011 Primary Supervisor – Dr. Nicholas Gill A thesis submitted to Auckland University of Technology in fulfilment of the requirements for the degree of Doctor of Philosophy Auckland University of Technology Faculty of Health and Environmental Sciences

Welcome message from author
This document is posted to help you gain knowledge. Please leave a comment to let me know what you think about it! Share it to your friends and learn new things together.
Transcript

i
Physical Profiling of Rugby Union Players:
Implications for Talent Development
Daniel J. Smart – MSc
2011
Primary Supervisor – Dr. Nicholas Gill
A thesis submitted to Auckland University of Technology in fulfilment of the
requirements for the degree of
Doctor of Philosophy
Auckland University of Technology
Faculty of Health and Environmental Sciences

ii
TABLE OF CONTENTS
TABLE OF CONTENTS ......................................................................................................................... ii
LIST OF FIGURES ................................................................................................................................ iv
LIST OF TABLES ................................................................................................................................... v
ATTESTATION OF AUTHORSHIP .................................................................................................... vii
ACKNOWLEDGMENTS .................................................................................................................... viii
ETHICAL APPROVAL ......................................................................................................................... ix
CO-AUTHORED WORKS ..................................................................................................................... x
PREFACE ............................................................................................................................................... xi
ABSTRACT .......................................................................................................................................... xii
CHAPTER ONE: INTRODUCTION .......................................................................................................... 1
CHAPTER TWO: LITERATURE REVIEW .............................................................................................. 6
Introduction ......................................................................................................................................... 7
Physical Characteristics ....................................................................................................................... 8
Competition Performance .................................................................................................................. 18
Physical Characteristics and Talent Development ............................................................................. 23
Conclusions ....................................................................................................................................... 29
CHAPTER THREE: VALIDITY AND RELIABILITY ........................................................................... 32
Abstract ............................................................................................................................................. 33
Introduction ....................................................................................................................................... 34
Methods ............................................................................................................................................. 35
Results ............................................................................................................................................... 42
Discussion ......................................................................................................................................... 45
CHAPTER FOUR: PHYSICAL CHARACTERISTICS ........................................................................... 49
Abstract ............................................................................................................................................. 50
Introduction ....................................................................................................................................... 51
Methods ............................................................................................................................................. 53
Results ............................................................................................................................................... 61
Discussion ......................................................................................................................................... 67
Practical Applications ........................................................................................................................ 72
CHAPTER FIVE: GAME BEHAVIOURS & PHYSICAL CHARACTERISTICS .................................. 74
Abstract ............................................................................................................................................. 75
Introduction ....................................................................................................................................... 76
iii
Methods ............................................................................................................................................. 77
Results ............................................................................................................................................... 85
Discussion ......................................................................................................................................... 91
Conclusion ......................................................................................................................................... 96
CHAPTER SIX: ADOLESCENT PHYSICAL DEVELOPMENT ........................................................... 97
Abstract ............................................................................................................................................. 98
Introduction ....................................................................................................................................... 99
Methods ........................................................................................................................................... 101
Results ............................................................................................................................................. 110
Discussion ....................................................................................................................................... 117
Practical Applications ...................................................................................................................... 122
CHAPTER SEVEN: CONCLUSIONS .................................................................................................... 123
Primary Findings and Conclusions .................................................................................................. 124
Limitations....................................................................................................................................... 127
Future Research Areas ..................................................................................................................... 130
Practical Applications ...................................................................................................................... 131
CHAPTER EIGHT: REFERENCES........................................................................................................ 133
CHAPTER NINE: APPENDICIES.......................................................................................................... 146
Appendix One: Ethics Approval .......................................................................................................... 147
Appendix Two: Information Sheets ..................................................................................................... 150
Appendix Three: Inform Consent ........................................................................................................ 159
Appendix Four: Papers Presented at Conferences ............................................................................... 167

iv
LIST OF FIGURES
Figure 1: The study design for the validity and reliability testing of the Metabolic Index for Team Sports
(MFITS) and the Rugby-Specific Repeated-Speed (RS2) test. ................................................................... 37
Figure 2: The repeated sprint component of the Rugby-Specific Repeated-Speed (RS2) test (a). Three sets
of repeated sprinting, jogging and walking 20 m for the forwards and half backs (b) are performed at set
time intervals and interspersed with PowerBagTM
shuttles using a 30 kg weighted PowerBagTM
, also
performed at set time intervals (c). ............................................................................................................. 41
Figure 3: The repeated sprint component of the Rugby-Specific Repeated-Speed (RS2) test (a). Three sets
of repeated sprinting, jogging and walking 20 m for the forwards (b) and 30 m for the backs (c) are
performed at set time intervals and interspersed with PowerBagTM
shuttles using a 30-kg weighted
PowerBagTM
, also performed at set time intervals (d). ............................................................................... 58
Figure 4: The timeline of the 15-week off-season conditioning programme (combined resistance, speed
and anaerobic/aerobic conditioning) preceded by a 4-week preparation and followed by a 6-month follow
up in provincial representative adolescent rugby union players (n = 44; age, mean ± SD, 15.3 ± 1.3 years).
Body composition, speed, strength, vertical jump and anaerobic and aerobic running performance was
measured prior to the preparation phase (Pre), post conditioning phase (Post1) and 6-months following
Post1 after an in-season competition phase (Post2). ................................................................................ 102
Figure 5: Mean ± SD (expressed as a coefficient of variation (%)) of box-squat estimated 1RM for
provincial representative adolescent rugby union players (age, mean ± SD, 15.3 ± 1.3 years) after a 15-
week off-season conditioning programme (Post1) and 6-months post intervention after an in-season
competition period (Post2). * = large difference between the within-group changes. The overall difference
between the changes from Pre–Post2 was small (15.9%; 90% confidence limits ±13.2%). .................... 115

v
LIST OF TABLES
Table 1: Intraclass correlation coefficients (ICC), coefficient of variation (CV) and 95% confidence
limits (95% CL) for the reliability of the performance measures in the Metabolic Fitness Index for Team
Sports (MFITS) and Rugby-Specific Repeated-Speed (RS2) test. ............................................................. 43
Table 2: Pearson correlation coefficients for the relationship between variables from the Metabolic
Fitness Index for Team Sports (MFITS) and the Rugby-Specific Repeated-Speed (RS2) test. ................. 44
Table 3: Mean ± coefficient of variation (%) of physical performance and anthropometric tests in rugby
union players, calculated with equal contribution from level of player (amateur, semi-professional and
professional) and year of test (2004 to 2007), separated into positional groups. ....................................... 62
Table 4: Mean differences (%); ±99% confidence limits in physical performance and anthropometry
between rugby union players of different playing levels in the 2007 year within forwards and backs
positional groups. ....................................................................................................................................... 63
Table 5: Average annual changes (%); ±99% confidence limits in physical performance or anthropometry
in rugby union players between 2004 and 2007, within different playing levels for forwards and backs.. 64
Table 6: Mean within-athlete changes (%); ±99% confidence limits in physical performance and
anthropometry in rugby union players as they move from one competition period to another competition
period within the same year. ...................................................................................................................... 65
Table 7: Operational definitions of game statistics used in determining the relationship between game
statistics and physical characteristics in rugby union players. ................................................................... 84
Table 8: Between-player means ± standard deviations of game statistics (n = 296 games) for national
provincial, professional and international level rugby union players over the 2007 and 2008 seasons. .... 87
Table 9: Between-player means ± standard deviations (SD) and within-player standard deviations (within
SD) of physical characteristics for national provincial, professional and international level rugby union
players over the 2007 and 2008 seasons. ................................................................................................... 88
Table 10: Correlation coefficients between physical characteristics and game statistics exponentially
weighted with a time constant of 20-weeks for rugby union forwards in games at all levels. ................... 89
Table 11: Correlation coefficients between physical characteristics and game statistics exponentially
weighted with a time constant of 20-weeks for rugby union backs in games at all levels. ........................ 90
Table 12: The 15-week off-season conditioning programme performed by provincial representative
adolescent rugby union players (age, mean ± SD, 15.3 ± 1.3 years). The programme was either performed
supervised (n = 27) by an experienced strength and conditioning coach at a central location, or
unsupervised (n =17) in the players own time and at a facility of their choosing. ................................... 105

vi
Table 13: Mean ± SD (expressed as coefficient of variation (%)) anthropometric measures for supervised
(SUP) and unsupervised (UNSUP) adolescent rugby union players (age, mean ± SD, 15.3 ± 1.3 years) Pre
and post (Post1) 15-week off-season conditioning programme, and 6-months post-training (Post2) after an
unsupervised competition period.............................................................................................................. 112
Table 14: Mean ± SD (expressed as coefficient of variation (%)) performance test measures for
supervised (SUP) and unsupervised (UNSUP) adolescent rugby union players (age, mean ± SD, 15.3 ±
1.3 years) Pre and post (Post1) 15-week off-season conditioning programme, and 6-months post-training
(Post2) after an unsupervised competition period. ................................................................................... 113
Table 15: Mean ± SD (expressed as coefficient of variation (%)) training volume (min), training load
(AU) and training frequency, for supervised (SUP) and unsupervised (UNSUP) adolescent rugby union
players (age, mean ± SD, 15.3 ± 1.3 years) during a 15-week off-season conditioning programme
(conditioning phase) and a 6-month in-season maintenance programme (competition phase). ............... 114

vii
ATTESTATION OF AUTHORSHIP
I hereby declare that this submission is my own work and that, to the best of my
knowledge and belief, it contains no material previously published or written by another
person (except where explicitly defined in the acknowledgements), nor material which
to a substantial extent has been submitted for the award of any other degree or diploma
of a university or other institution of higher learning.
Daniel J. Smart
31 January 2011

viii
ACKNOWLEDGMENTS
Firstly I would like to thank my supervisors Dr Nicholas Gill and Prof. Will Hopkins.
Will, this thesis would not have been possible without your statistical expertise; and
your excitement and patience towards my work has been greatly appreciated. Nick, you
provided me with the inspiration and motivation all this time to keep at it. Your belief in
me as a researcher, sport scientist and person has been humbling. I know I did all the
things you told me not to while doing this PhD, but I wouldn’t have had it any other
way. I look forward to working together in the future to keep this research beast alive.
I would like to thank the New Zealand Rugby Union for the financial support in
conjunction with the Tertiary Education Commission through an Enterprise Scholarship.
Ken Quarrie, Mike Anthony and Andrew Hore, thanks for putting faith in me to perform
this research for you; it’s taken a while, but we’ve finally got there. Thank you also to
Joe Cole from the Profiler Corporation for your help with the Performance Profiler
Database.
Thank you to the Waikato Rugby Union, the participants who took part in the training
study and their parents. Without your belief and excitement in the project, I would not
have been able to achieve what I did.
To my family; Mum, Dad, Katie and of course Shaun. I think you thought that I’d never
get this finished. Thank you for your ongoing love and support. No longer a student, I
can go out and get a real job! Love ya’s heaps.
Finally, to my beautiful girls. Chelsea, Dad’s finished now, time to party! Alicia my
amazing wife, your support for me though this long journey has been unprecedented.
You have been extremely tolerant of my procrastination and ongoing change of focus.
You stuck by me and believed in me. I honestly don’t know how I would have done it
without you. I love you so much.
“To give anything less than your best is to sacrifice the gift”

ix
ETHICAL APPROVAL
Ethical approval for all studies was obtained from the Auckland University of
Technology Ethics Committee (AUTEC):
Study One and Two: Ethics Application Number 06/226 (pg. 147)
Study Three: Ethics Application Number 07/155 (pg. 148)
Validity and Reliability Pilot Study: Ethics Application Number 08/163 (pg. 149)

x
CO-AUTHORED WORKS
Manuscripts in Preparation
Smart, D., Hopkins, W., & Gill, N. Differences and changes in the physical
characteristics of professional and amateur rugby union players. Journal of
Strength and Conditioning Research. Manuscript in review.
(Smart 80%, Hopkins 15%, Gill 5%)
Smart, D., Hopkins, W., Quarrie, K., & Gill, N. The relationship between physical
fitness and game behaviours in rugby union players. European Journal of
Sport Sciences. Manuscript in review.
(Smart 75%, Hopkins 10%, Quarrie 10%, Gill, 5%)
Smart, D., & Gill, N. Effects of an off-season conditioning program on the physical
characteristics of adolescent rugby union players. Journal of Strength and
Conditioning Research. Manuscript in review.
(Smart 95%, Gill 5%)
Conference Podium Presentation
Smart, D., Hopkins, W., & Gill, N. (2007). Trends and differences in the fitness of
professional and amateur rugby union players. New Zealand Sports
Medicine and Science Conference, Hamilton, November, pg 81.
Conference Poster Presentation
Smart, D., Hopkins, W., Quarrie, K., & Gill, N. (2010). The relationship between
physical fitness and game behaviours in rugby union players. Sport
Performance Research Institute of New Zealand Strength and Conditioning
Conference, Auckland, November.

xi
PREFACE
This thesis is presented as five main sections. The first section is a review of the
literature (chapter two) on physical characterisation of contact based team sport athletes
and the physical development of adolescent athletes. The second section (chapter three)
addresses the validity and reliability of field based fitness tests used in the following
chapters. The three subsequent experimental sections (chapters four to six) have been
written specifically for publication in peer reviewed journals. Thus, the experimental
chapters have been formatted taking into account word limits and publication guidelines
for the respective journals for which they have been submitted. Furthermore, some of
the information in this thesis may appear repetitive due to this format. Regardless, this
thesis still fulfils the Auckland University of Technology’s guidelines for PhD thesis
based on publications.

xii
ABSTRACT
Rugby union is high-intensity contact based team sport that requires players to possess a
diverse range of physical attributes. Numerous studies have highlighted differences in
physical characteristics between playing levels and positions; however few studies have
investigated longitudinal progressions of body composition and physical performance.
Furthermore, the degree to which each component of fitness is relied upon in
competition is unknown. Information gathered from studies of this nature will allow
adolescent development programmes to be formulated to improve physical
characteristics important for elite performance.
Therefore the aims of this thesis were firstly, determine the differences and changes in
physical characteristics in rugby union players; secondly, establish the relationship
between physical characteristics and on-field performance; and thirdly, establish the
effectiveness of an off-season physical conditioning programme in adolescent rugby
union players.
In the first study, a mixed modelling procedure was used to estimate the between-player
differences and within-player changes in physical characteristics in 1161 rugby union
players from 2004-2007. Differences between positions and playing level were
consistent with those from previous research. However, 20-m sprint time was the only
clear difference between Super Rugby (professional) and international players (backs
and forwards, ~2.0%), indicating international players may be selected due to greater
skill, tactical ability and experience. Small increases in strength (~6.5%) and small
decreases in speed time (~1.6%) occurred as players moved from Super Rugby to either
the provincial or mid-year international competitions. These changes may be a result of
reduced training loads due to regular high-intensity matches and greater travel involved
in the Super Rugby competition.
Study two established the relationships between physical characteristics and on-field
game behaviours. Sprint times (10 m, 20 m and 30 m) had small to moderate
correlations (range r = -0.12 to -0.32) with game behaviours associated with high-
intensity running (e.g. line breaks and tries scored). Repeated sprint ability and percent
body fat had small to moderate correlations with activity rate (range r = -0.17 to -0.38).
Although the low correlations indicate other factors may be associated with on-field

xiii
performance, the relationships reflect the importance of optimal levels of speed,
repeated sprint ability and body composition in order to effectively perform tasks within
competition.
The final study determined the efficacy of a 15-week supervised off-season
conditioning programme compared to an identical unsupervised programme in 44
adolescent rugby union players. The short-term changes were assessed immediately
post-conditioning, while the persistence of the effects were established after a 6-month
unsupervised competition phase. Supervised training enhanced the gains in strength
with small to large (range 9.1% to 50%) differences between the groups’ increases in
one repetition maximum (1RM) following the conditioning programme. Strength
declined in the supervised group during the unsupervised competition phase, resulting in
only a small clear difference between the groups’ long-term change in box-squat 1RM
(15.9%). Most other differences between the groups’ changes in body composition,
speed and anaerobic and aerobic running performance as a result of training were trivial
or unclear. There were unclear effects of age as a covariate on the changes in physical
characteristics as a result of training. The greater gains made in the supervised training
group during the conditioning phase may have been a result of greater adherence and
overall training load. The lack of clear differences after the competition phase illustrates
the importance of supervision if the aims of development programmes are to improve
physical attributes.
Speed, body composition and repeated sprint ability appear to be important physical
characteristics in rugby union players due to superior performances by higher playing
levels and their relationship with game behaviours. Substantial improvements in
physical performance can be achieved in adolescent players after a structured, organised
and supervised training programme. Therefore physical characteristics should be
developed from an early age to ensure the player is physically ready for the demanding
nature of professional rugby.

1
CHAPTER ONE: INTRODUCTION

2
Rugby union is a high-intensity field based contact team sport, considered to be New
Zealand’s national game (Quarrie et al., 1995). Since becoming a full professional sport
in 1996, pressure from the public and media for the success of teams and individual
players has increased. Not only is this pressure felt by the players, but coaches and team
management (trainers, managers, and physiotherapists) are also prone to the “cut-throat”
nature of professional game. Therefore, to match the increased demand for optimal
performance and a competitive advantage over opposing teams, research into various
aspects of rugby union has increased (Smart, 2005).
One area of research that has received a large amount of attention is the profiling of the
physical characteristics of players. The measurement of players’ physical characteristics
has highlighted position specific attributes, with forwards typically the strongest,
heaviest and tallest in order to be competitive within rucks, mauls and lineouts
(Casagrande & Viviani, 1993; Duthie, Hooper, Hopkins, Livingstone, & Pyne, 2006b).
Conversely, the backs role in beating the opposition in open play necessitates speed,
acceleration and agility (Duthie, Pyne, & Hooper, 2003; Holway & Garavaglia, 2009;
Quarrie, Handcock, Toomey, & Waller, 1996; Quarrie et al., 1995). Comparatively few
recent studies exist with regards to differences between playing levels in rugby union.
Nonetheless, differences show higher level players are heavier, faster, and more
aerobically fit than their sub-elite counterparts (Quarrie et al., 1995).
While numerous studies have quantified the physical characteristics of players, there is
a limited amount of research that has longitudinally monitored players and the changes
in physical characteristics over one or multiple seasons. Indeed, studies have used
historical data to illustrate greater increases in mass and stature than the rest of the
population (Olds, 2001; Quarrie & Hopkins, 2007); however, studies of this nature do

3
not account for individual player changes and progression. One study by Duthie and
colleagues (2006b) investigated individual changes in anthropometry of Super 12
players over a period of four years, showing players had a decrease in the proportion of
fat free mass during the club competition phase compared to the Super 12 competition
phase. The results suggest specific competition phases at different times of the year may
affect body composition. However the effect of this factor on physical performance
characteristics, such as strength, power and speed, is still to be examined.
The importance of the physical characteristics of a player is reduced if the desired
physical attributes do not transfer to improved playing performance (Gabbett, King, &
Jenkins, 2008d). Specifically, the physical characteristics required to be successful will
be primarily dictated by the role of the particular position within competition. For
example, outside backs need to be able to beat the opposition in open play, thus are
required to be fast and agile (Holway & Garavaglia, 2009; Quarrie et al., 1996).
Nonetheless, within literature the association between the competition performance and
physical characteristics is typically theorised; with no studies directly quantifying the
relationship between physical characteristics and specific tasks performed in
competition.
One study has compared the physical characteristics of Australian Rules football players
to the high or low attainment of key performance indicators within competition. It was
found players with more possessions, which is an indicator of an effective player, were
significantly shorter, lighter, faster and had a higher aerobic capacity compared to those
with a lower number of possessions (Young & Pryor, 2007). The results show players
with higher levels of physical fitness may have an advantage in the performance of tasks
in competition. These particular findings provide scope for the investigation into the

4
direct relationship between game behaviours and physical characteristics, ensuring the
physical preparation of players reflects the degree to which each component of fitness is
relied upon in competition.
Since the inception of professionalism in rugby, the demand for bigger, stronger, faster
and more skilful athletes has led to the introduction of younger players into the
professional environment. The promotion of younger players presents issues
surrounding the development of a training history while participating in high level
competition, highlighting the increasing importance of physical development in
adolescents. By beginning structured training at a younger age, players will have a
greater foundation on which elite performance can be achieved and may potentially
elongate their careers.
The physical characteristics of elite players should form the basis of development
programmes for adolescents. Furthermore, differences in maturation occur during
adolescence, which tempered versions of adult training programmes do not
accommodate (Smith, 2003). Numerous studies have highlighted the effectiveness of
structured resistance training on physical characteristics within adolescents (Christou et
al., 2006; Coutts, Murphy, & Dascombe, 2004; Gorostiaga, Izquierdo, Iturralde, Ruesta,
& Ibanez, 1999; Wong, Chamari, & Wisloff, 2010). An inherent issue with these studies
is the short-term duration of the training programme and lack of long-term follow up,
which is of primary concern during long-term athletic development. Furthermore,
studies have shown increased gains in strength after training programmes supervised by
a strength and conditioning coach, questioning the more common unsupervised training
programmes within adolescent rugby players (Coutts et al., 2004; Mazzetti et al., 2000).

5
This thesis is therefore divided into three experimental chapters each with specific aims:
1. To analyse performance test data of New Zealand rugby union players from
2004 to 2007, to determine differences between playing positions, playing level
and year of fitness test; and changes within players as they moved between
different competitions played during the year.
2. To establish relationships between physical characteristics derived from field-
based fitness tests and game behaviours identified through game statistics.
3. To determine if a supervised off-season conditioning programme enhances gains
in physical characteristics compared to an identical unsupervised programme; to
establish the persistence of the physical changes during an unsupervised six
month post-intervention training period; and, to determine the effect of age upon
the changes in physical performance as a result of the physical conditioning
programme.

6
CHAPTER TWO: LITERATURE
REVIEW

7
Introduction
Field based contact team sports, such as rugby union and rugby league, are
characterised by frequent high-intensity sprints and a high degree of physical contact.
Due to the diverse nature of competition, the required physical characteristics of players
are complex and highly specific to the varying roles they play (Duthie et al., 2003;
Nicholas, 1997). Since the inception of professionalism, the evolution of the
competitive environment has increased rapidly; thus the requirements for bigger, faster
and stronger players has meant changes in physical and anthropometrical characteristics
have mirrored this rapid increase.
The comprehensive studies of physical characteristics of players, fitness requirements
and movement patterns, have contributed to the development of more effective
conditioning (Duthie et al., 2003). The increased knowledge has also contributed to
talent development programmes, with the aims of enhancing the physical and
anthropometric characteristics of young players. The efficacy of training in youth and
adolescents has been widely researched; showing significant improvements can be made
with various forms of structured physical conditioning. However, comparatively small
amounts of literature focus upon performance gains in talented adolescent athletes and
the long-term adaptations to training.
While the primary focus of this review is within the sport of rugby union, due to limited
literature in aspects of physical characterisation, other related sports, such as rugby
league and Australian Rules football, have been included to further substantiate
conclusions. Therefore the purpose of this review is to; firstly, establish the differences
in physical characteristics between players of differing playing position and levels in
contact based team sports; secondly, discuss the relationship between physical

8
characteristics and on-field performance; and thirdly, establish the effectiveness of
various physical training programmes in adolescent athletes, and the implications for
athletic development within contact based team sports.
Physical Characteristics
Anthropometry
With the evolution of professionalism, factors such as full-time training, greater access
to sport science and full-time training staff, and coaches’ desire for more physical
players, has led to greater athletic development and a marked increase in player size
(Holway & Garavaglia, 2009). A study by Olds (2001) highlighted the progression of
the size of rugby players over a period of 95 years. It was found there were major shifts
in the physique of players, with body mass index, mass and mesomorphy increasing at a
rate twice the average increase over the century, and up to five times greater than the
source population. These findings have since been reinforced by another study, showing
rapid increases (~10%) in player mass subsequent to the introduction of professionalism
(Quarrie & Hopkins, 2007).
The anthropometrical differences between forwards and backs in rugby union and rugby
league have been well documented. Forwards are generally taller, heavier and have
higher body fat than the backs with differences of ~5%, ~15% and ~25% respectively
(Bell, 1979; Bell, 1980; Brewer, Davis, & Kear, 1994; Casagrande & Viviani, 1993;
Duthie et al., 2006b; Gabbett, 2000; Gabbett, 2005b; Maud & Shultz, 1984; Meir, 1993;
Quarrie et al., 1996; Quarrie et al., 1995; Scott, Roe, Coats, & Piepoli, 2003). Early
studies proposed that higher body fat in forwards was to aid protection in the contact
and collision situations (Bell, 1973). However, it is now accepted that excess body fat
has a detrimental effect upon performance by increasing metabolic demands and

9
reducing heat dissipating ability (Meir, Newton, Curtis, Fardell, & Butler, 2001).
Alternatively, it is suggested higher mass be carried as fat free mass, which will also
contribute to the expression of strength and power on the field of play (Duthie et al.,
2006b; Gabbett et al., 2008d). Interestingly, with an importance placed upon fat free
mass, there are still a large number of studies that haven’t reported this variable. It is
therefore recommended future research consider fat free mass when expressing
differences between forwards and backs, not only when determining differences in
anthropometry, but also to explain relative differences in strength and power.
The differences between specific positions in anthropometrical measures, such as
height, mass and fat free mass, illustrates the heterogeneous nature of contact team sport
players. A high degree of variation in the size of players exists due to each positions
unique role and requirements within competition (Holway & Garavaglia, 2009; Reilly,
1997). For instance, half backs are typically the shortest and lightest players, which aid
their agility requirements; while outside backs are generally leaner due to their
increased requirements for maximum speed (Holway & Garavaglia, 2009).
The somatotype of players has received little attention in comparison to the standardised
body composition measures. Somatotype provides useful information on the shape and
form of individuals; however the difficulty in quantifying body composition changes to
units of mass, may limit its application (Holway & Garavaglia, 2009). Players have
been described as endomorphic mesomorphs, who are predominantly muscular and tend
towards adiposity (Lundy, O'Connor, Pelly, & Caterson, 2006). Average somatotypes of
3.3/6.8/1.1 have been reported for Argentine rugby union players, which is comparable
with studies of other codes (Carlson et al., 1994; Gabbett, 2009; Holway & Garavaglia,
2009; Lundy et al., 2006). Forwards tend to have higher endomorphy and lower

10
ectomorphy than backs, which is probably due to the strength demands placed upon
them at the contact situation (Lundy et al., 2006; Quarrie et al., 1996).
As playing level increases, mass, height and fat free mass increases and percentage
body fat decreases (Burke, Read, & Gollan, 1985; Quarrie et al., 1995). Indeed,
numerous studies have reported no significant difference between levels (Bell, 1973;
Gabbett, Kelly, & Pezet, 2007; Gabbett, Kelly, Ralph, & Driscoll, 2009; Nicholas &
Baker, 1995); however the direction of these differences still illustrate greater values in
higher playing levels. The results of these studies indicate that selection to higher level
teams in contact teams sports may be partially based on player size and physique (Olds,
2001). Nonetheless, it is unknown when the differences in player size occurs. Players
who are selected to higher levels may increase their mass due to a higher and more
specific training load; or, alternatively larger players from the lower playing level may
be those that are promoted.
Speed
The ability to move quickly over various distances, starting from a variety of positions
and speeds, is a key component in a player’s performance (Duthie et al., 2003; Nicholas,
1997). Studies have reported 10-m and 40-m sprint time for players to range between
1.60 s – 2.19 s and 5.13 s – 7.50 s respectively, which is dependent upon the age, level
and position of players (Baker & Newton, 2008; Gabbett, 2002b). Within rugby league,
differences between backs and forwards appear to be more pronounced at greater
distances, with studies establishing no differences in 10-m sprint time but significant
differences in 40-m sprint time (Gabbett, 2000; Gabbett, 2002a; Gabbett, 2005b;
Gabbett, Kelly, & Pezet, 2008b). Within rugby union however, a lack of research
investigating both the acceleration (10 m) and maximal speed (40 m) phases of sprinting
11
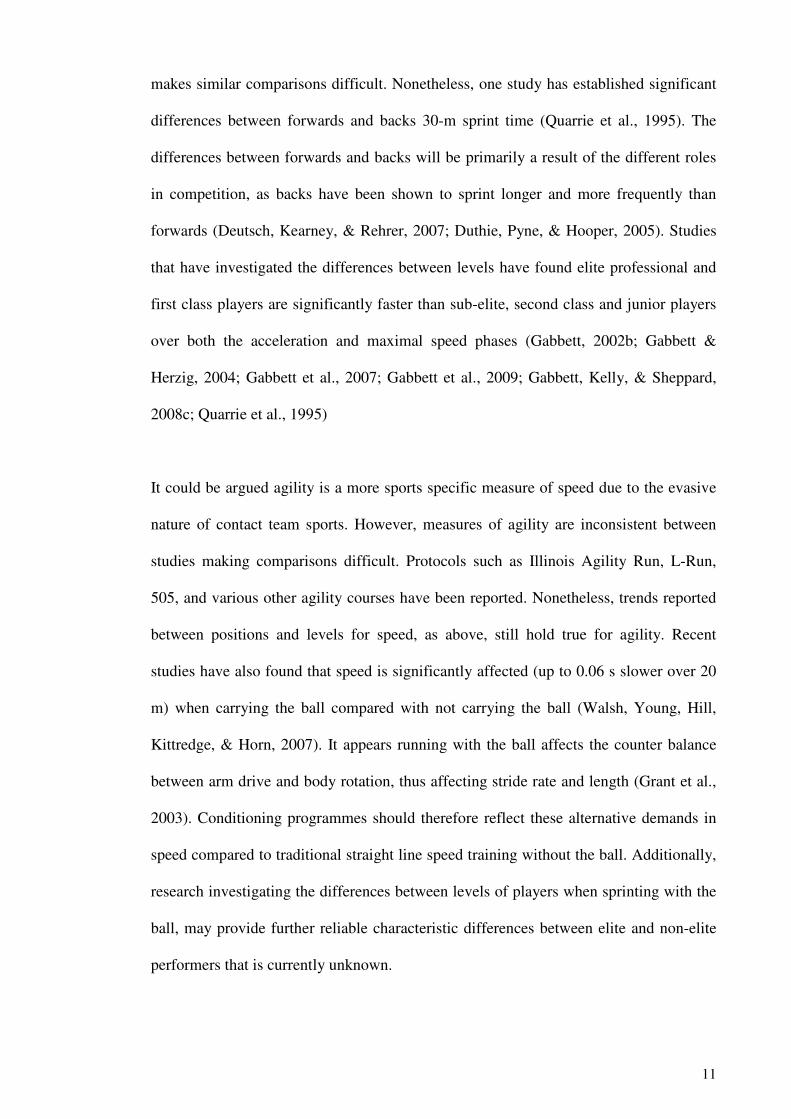
makes similar comparisons difficult. Nonetheless, one study has established significant
differences between forwards and backs 30-m sprint time (Quarrie et al., 1995). The
differences between forwards and backs will be primarily a result of the different roles
in competition, as backs have been shown to sprint longer and more frequently than
forwards (Deutsch, Kearney, & Rehrer, 2007; Duthie, Pyne, & Hooper, 2005). Studies
that have investigated the differences between levels have found elite professional and
first class players are significantly faster than sub-elite, second class and junior players
over both the acceleration and maximal speed phases (Gabbett, 2002b; Gabbett &
Herzig, 2004; Gabbett et al., 2007; Gabbett et al., 2009; Gabbett, Kelly, & Sheppard,
2008c; Quarrie et al., 1995)
It could be argued agility is a more sports specific measure of speed due to the evasive
nature of contact team sports. However, measures of agility are inconsistent between
studies making comparisons difficult. Protocols such as Illinois Agility Run, L-Run,
505, and various other agility courses have been reported. Nonetheless, trends reported
between positions and levels for speed, as above, still hold true for agility. Recent
studies have also found that speed is significantly affected (up to 0.06 s slower over 20
m) when carrying the ball compared with not carrying the ball (Walsh, Young, Hill,
Kittredge, & Horn, 2007). It appears running with the ball affects the counter balance
between arm drive and body rotation, thus affecting stride rate and length (Grant et al.,
2003). Conditioning programmes should therefore reflect these alternative demands in
speed compared to traditional straight line speed training without the ball. Additionally,
research investigating the differences between levels of players when sprinting with the
ball, may provide further reliable characteristic differences between elite and non-elite
performers that is currently unknown.

12
Strength and Power
High levels of strength and power are required in order to effectively perform tackling,
lifting, pushing and pulling tasks, and to tolerate the heavy tackles and collisions that
occur during a match (Gabbett, 2002b; Gabbett, 2005b). A common test for strength
within literature is the use of one repetition-maximum (RM); specifically squats and
bench-press exercises to assess lower and upper body strength respectively. Upper body
strength of professional players appear to be comparable between sports, with 1RM
bench-press (~140 kg) similar in both rugby union and rugby league players (Argus,
Gill, Keogh, Hopkins, & Beaven, 2009; Baker, 2002; Crewther, Gill, Weatherby, &
Lowe, 2009). However, studies have shown greater lower body strength in rugby union
players (~190 kg 1RM squat) compared to rugby league (~175 kg 1RM squat) players
(Baker, 2002; Crewther et al., 2009).
Forwards are generally stronger than backs in both upper and lower body strength due
to requirements of strength in scrums and the higher frequency in which the forwards
are involved in tackles and ruck situations (Quarrie et al., 1996). Additionally, as
playing level increases, strength also increases. For example, significant differences in
1RM bench-press have been reported between professional (~144 kg), college (~111
kg), high school (~98 kg) and junior (~85 kg) rugby league players (Baker, 2002); with
similar findings for lower body strength (Baker & Newton, 2008). Recently, allometric
scaling has been used to allow a more effective comparison of strength between bigger
forwards and smaller backs (Crewther et al., 2009). However, only two studies have
reported scaled strength values in contact team sport players; illustrating no differences
between forwards and backs but greater strength in first team players compared to
academy players when body size is accounted for as a confounding variable (Atkins,
2004; Crewther et al., 2009). Further work is therefore required to compliment these

13
findings and to establish trends and differences in relative strength within higher level
players.
The most common technique for assessing lower body power has been the vertical jump
(VJ) test. Jump heights have been reported to vary from approximately 28 cm – 63 cm,
with the large variance due to the differing age, level and positions between studies
(Gabbett, 2002b; Young et al., 2005). Trends show higher VJ in backs compared to
forwards (Gabbett, 2002a; Quarrie et al., 1995), although not all studies show
significant differences (Gabbett, 2000; Gabbett, 2005b; Gabbett et al., 2008b; Maud &
Shultz, 1984; O'Connor, 1996). Differences between levels appear to be clearer, with
significant differences between elite professional players and sub-elite junior players
(Gabbett, 2002a; Gabbett, 2002b; Gabbett & Herzig, 2004; Gabbett et al., 2009). Other
measures of power have included the use of jump squats and bench throws, however
variations in protocols (e.g. incline bench throws and flat bench throws) and loads (e.g.
55% 1RM, 40% - 80% 1RM, no load, 20 - 80 kg) make comparisons between studies
difficult (Argus et al., 2009; Baker, 2001a; Baker & Nance, 1999b; Young et al., 2005).
Nonetheless, trends follow similar patterns with significantly greater maximum power
and mean power in higher level athletes.
Aerobic and Anaerobic Characteristics
Due to the multiple sprint nature of contact based team sports, anaerobic testing may be
considered to be a specific indicator of the physical capacity for competition. However,
there is a dearth of literature that has used repeated sprint tests to measure anaerobic
performance in contact team sport players. The lack of research may be due to the time
consuming and resource dependent nature of repeated sprint testing, which is not
favourable for larger sample sizes and the difficulty in exercise programming from the

14
test results (Duthie et al., 2003). Nonetheless, the few studies that have reported results
from repeated sprint testing indicate varying differences between positions and higher
level players have significantly lower fatigue than lower level players (Quarrie et al.,
1996; Quarrie et al., 1995). Further work is therefore required in the area of repeated
sprint testing, utilising protocols that are specific to the distances and work to rest ratios
experienced in competition.
In comparison, the prediction of maximal oxygen uptake (VO2 Max) from the
multistage shuttle run test has been well documented. The shuttle run test has been used
extensively due to its relative ease of use, the specificity in the continual change of
direction and fatigue which is developed during the test (Duthie et al., 2003). More
recently however, the Yo-Yo Intermittent Recovery test has been developed, which
indicates an athlete’s ability to recover from repeated aerobic shuttles. While the Yo-Yo
test is significantly correlated with VO2 Max (r = 0.70), the estimation of VO2 Max
from the Yo-Yo is inherently inaccurate. Furthermore, the primary performance
measure in the Yo-Yo is the total distance run, creating difficulties in the comparison to
other aerobic tests (Bangsbo, Iaia, & Krustrup, 2008).
Elite professional rugby union and rugby league players have a moderate VO2 Max
(~50 ml.kg-1
.min-1
), which is dramatically lower than endurance athletes (Brewer et al.,
1994; Deutsch, Kearney, & Rehrer, 1998a; O'Connor, 1996). Indeed, a high aerobic
capacity (indicated by a high VO2 Max) facilitates the recovery from repeated high-
intensity efforts (Glaister, 2005). However, it has been suggested the attainment of a
high VO2 Max in both rugby codes may not be a priority compared to other sports such
as Australian Rules football (~60 ml.kg-1
.min-1
), in which athletes cover greater

15
distances during competition (Duthie et al., 2003; Pyne, Gardner, Sheehan, & Hopkins,
2005; Young et al., 2005; Young & Pryor, 2007).
Differences between positions and levels are similar to those for other physical
characteristics. Multiple studies have found significantly greater VO2 max or shuttle run
performance in elite or senior players compared to sub-elite or junior players (Gabbett,
2002b; Gabbett & Herzig, 2004; Gabbett et al., 2009; Quarrie et al., 1995). It is thought
the lower fitness is representative of a lower relative training and playing frequency and
intensity of the lower playing levels (Gabbett, 2000). The backs also show greater
relative VO2 Max (~5 ml.kg-1
.min-1
difference) than forwards. However when expressed
as absolute values, forwards are superior to backs (~0.6 l.min-1
difference) (Maud &
Shultz, 1984; Nicholas & Baker, 1995; Tong & Mayes, 1995).
Longitudinal Monitoring
In contrast to the large amount of studies on the physical and anthropometrical
differences between positions and levels, a comparatively small amount of literature
exists with regard to the longitudinal monitoring of players and the changes in physical
characteristics over one or multiple seasons. Studies that have investigated changes in
strength and power over a competitive season has shown variable changes, with upper
body and lower body strength and power increasing, being maintained or decreasing
(Argus et al., 2009; Baker, 2001b; Gabbett, 2005a; Gabbett, 2005c). A study by Argus
et al. (2009) reported trivial changes in bench-press 1RM (-1.2%) and bench-throw peak
power (-3.4%) in professional rugby union players over a 13-week competition period.
Additionally, Baker (2001b) found no significant changes in bench-press 1RM (-1.2%)
and bench-throw maximum power (-1.3%) in professional rugby league players over a
29-week in-season period. More studies however are required to support these findings,

16
especially due to the large differences in the subjects monitored and the differing
demands of rugby union and rugby league competitions there were participating in.
Few studies have reported changes in aerobic fitness over the period of a competitive
season. Two studies of junior and amateur rugby league players show significantly
greater increases in estimated VO2 Max during the competitive season compared to the
off-season. However, changes within the competition period (excluding off-season),
show negligible changes pre to post season (~2.6%). It was thought the higher training
loads associated with the general preparation phase facilitated the attainment of higher
fitness levels; while more frequent matches and a reduced emphasis on physical
conditioning limited the scope for aerobic changes to occur in-season (Gabbett, 2005a;
Gabbett, 2005c). In addition to the limited research on changes in aerobic performance,
changes associated with repeated sprint performance over a season have not been
examined and thus warrants further investigation.
Longitudinal analysis of the physique of rugby union players has been performed using
various sources of historical records (Olds, 2001; Quarrie & Hopkins, 2007). These
studies have established the rates at which the size and mass of players is increasing
with the evolution of the game, but have not illustrated individual changes in players’
body composition. Conversely, short-term monitoring has shown decreases in mass,
sum of skinfolds and fat mass during an intensive pre-season training period and in-
season maintenance period (Argus, Gill, Keogh, Hopkins, & Beaven, 2010; Meir, 1993;
Slater, Duthie, Pyne, & Hopkins, 2006). Duthie and colleagues (2006b) monitored the
fat free mass of professional Super 12 players over a four year period, which included
the Super 12 and club competitions at different times of the year. It was reported that
there was a decrease in the proportion of fat free mass of players during the club

17
competition phase of the year. These results suggest unfavourable changes in body
composition occur at specific times of the year, highlighting a specific issue with sports
that play multiple competitions over a year, in which not only body composition may be
affected, but other physical characteristics as well.
The ease at which testing, such as a 1RM test or speed test, can be implemented as part
of regular training sessions, assists the collection of longitudinal data (Duthie et al.,
2003). Such data would provide coaching staff with specific information on a player’s
response to normal competition and specific situational factors they may experience
(e.g. injury, non-selection, long haul overseas travel, altitude). Strategies may then be
developed in order to mitigate any negative changes which may have an effect upon
playing performance. More research is therefore required to further understand the
changes within a competitive season and if there are any specific differences in the
physical changes between playing levels and positions.
In summary, there is large amount of research that has investigated the physical
characteristics of contact based team sport athletes. Nevertheless, there are inherent
issues when comparing studies of this nature due to the diverse range of protocols used
and variables reported. Future research should consider maintaining consistency in
testing protocols, allowing the establishment of sound normative profiles and providing
further playing level and position specific physical characteristics. In addition, more
studies involving longitudinal monitoring may also allow further insight into how some
of the measured physical characteristics change throughout different periods of the
calendar year.

18
Competition Performance
Motion Analysis
The demands of competition have been primarily reported with the use of time-motion
analysis and more recently global positioning systems. Motion analysis provides an
objective non-invasive method for quantifying work rate, and provides information that
can be used in the design of physical conditioning programmes and testing protocols
(Deutsch et al., 1998a). Contact based team sports are characterised by the performance
of repeated high-intensity sprints. A study by Duthie and colleagues (2006) specifically
examined the sprint patterns in rugby union competition found backs sprint significantly
more often and for longer duration than the forwards (2.5 s in forwards compared to 3.1
s in the backs). In addition, the forwards start 41% of sprints from a standing start,
whereas the number of backs sprints is started evenly from standing, walking and
jogging. The quantification of a high number of short duration sprints reinforces the
game structure from which rugby union is based and suggests acceleration is an
important quality for players.
The distances, frequencies and times spent at various intensities within contact based
team sports have been well documented. Recent research has shown the total distances
covered during a rugby union match to range from 5408 m to 7227 m (Cunniffe,
Proctor, Baker, & Davies, 2009; Roberts, Trewartha, Higgitt, El-Abd, & Stokes, 2008).
Backs travel further than forwards, which can be attributed to significantly greater
distances walking and performing high-intensity running (Duthie et al., 2005; Roberts et
al., 2008). The differences may be due to the inside backs and centres continually
realigning into defensive and offensive positions within the backline, and the outside
backs involved in cover defence. The forwards however are involved in a greater
amount of static exertion, indicated by a significantly greater time and frequency of

19
scrums, tackles and rucks than the backs; resulting in a significantly higher work to rest
ratio (Deutsch et al., 2007; Duthie et al., 2005; Roberts et al., 2008). Combined with the
shorter duration sprints performed by forwards (outlined above), these data reinforce the
forwards primary role in ball retention close to the ruck and opposition (Duthie et al.,
2005).
Physiological Responses to Competition
Physiological variables such as heart rate and blood lactate concentration have been
measured to indicate the overall physiological strain associated with competition
(Coutts, Reaburn, & Abt, 2003). Semi-professional rugby league players and
professional rugby union players have recorded average heart rates of 166 and 172
beats.min-1
respectively, with the majority of the time spent above 80% maximum heart
rate (Coutts et al., 2003; Cunniffe et al., 2009). Forwards have been shown to spend
more time in the high-intensity heart rate zone (85-95% maximum heart rate) than
backs, which is likely due to the more frequent bouts of static exertion (Deutsch, Maw,
Jenkins, & Reaburn, 1998b). Higher exertion in the forwards is reinforced with the
measurement of blood lactate concentration. Although not significantly different, higher
mean and peak blood lactate concentrations (1.5 and 2 mmol.L-1
respectively) in the
forwards have been reported (Deutsch et al., 1998b). Heart rate and blood lactate data
confirm the large contribution of the anaerobic energy pathway to performance, with the
aerobic system utilised during low-intensity activity to recover from the repeated high-
intensity work periods (Glaister, 2005).
The physical contact associated with tackles and rucks induces a unique physiological
response compared to other team sports. Creatine kinase, a biochemical indicator of
muscle damage, has been shown to increase significantly pre to post rugby union match

20
(Smart, Gill, Beaven, Cook, & Blazevich, 2008; Takarada, 2003). It is thought the blunt
trauma experienced by the players was the primary cause for this increase, as boxing
and American football has shown similar responses (Ehlers, Ball, & Liston, 2002;
Zuliani et al., 1985). Indeed, Smart et al. (2008) have shown significant correlations
between the change in creatine kinase concentration pre to post match and impact
related game statistics of hit ups (r ≈ 0.74), game time (r ≈ 0.75) and time defending (r ≈
0.73). Studies of this nature highlight the use of notational analysis in conjunction with
physiological responses and provide scope for further research into the effect of specific
tasks within competition on physiological variables.
Notational Analysis
Notational analysis provides objective feedback of games and players’ actions through
the frequencies of key performance indicators (Eaves & Hughes, 2003; Jones,
Mellalieu, & James, 2004). The information gathered from notation analysis provides
the foundation for the development of individual performance profiles, which are
suggested to be a description of a pattern of playing performance (Jones, James, &
Mellalieu, 2008). Within literature, notational analysis has been used to determine
differences in playing patterns (Eaves & Hughes, 2003; Eaves, Hughes, & Lamb, 2005;
Prim, van Rooyen, & Lambert, 2006), changes in form of teams (Jones et al., 2008) and
the basis for successful performance (Jones et al., 2004).
The scoring of tries is deemed to be crucial in the determination of game outcome
(Sayers & Washington-King, 2005). The number of tries scored has moderately
increased with the introduction of professionalism in rugby union (Quarrie & Hopkins,
2007). Additionally, more successful teams have been shown to score more tries than
less successful teams over a season, and score a greater percentage of tries in individual

21
matches (Jones et al., 2004; Prim et al., 2006). More specific detail around how tries are
scored show that more successful teams and a greater number of tries are scored from
tackle turnovers in the opponents third of the field (Sasaki et al., 2007). In addition, an
inverse relationship between tackles and passes in the phases leading up to tries scored
suggests these events increase the chance of a period of play failing to result in a try
(Laird & Lorimer, 2004).
The ability to advance over the game line through line breaks or tackle breaks are key
determinants of successful ball carries. A greater number of line breaks and tackle
breaks are achieved through more evasive events and greater speed into contact, as this
creates more decisions for the defender to make and greater momentum into contact
which can lead to a greater propensity for skill breakdown (Sayers & Washington-King,
2005). Furthermore, going into contact with a low body position and strong leg drive
increases the chance of achieving tackle breaks (Wheeler & Sayers, 2009). Similarly,
success in defensive tackles depends on body position and leg drive, as a significant
relationship (r = -0.74) has been determined between subjective measures of tackle skill
and number of tackles missed in competition (Gabbett & Ryan, 2009).
Relationship between On-field Performance and Physical Characteristics
The importance of specific physical characteristics of a player is reduced if the physical
attributes do not transfer to on-field playing performance (Gabbett et al., 2008d).
Physical characteristics possessed by players are generally hypothesised to match the
role of the particular playing position within the team. While it is logical that forwards
should be heavier and stronger due to the increased reliance upon strength, power and
momentum in the ruck and maul (Duthie et al., 2005; Quarrie et al., 1996; Quarrie &

22
Hopkins, 2007); no studies have quantified the direct relationship between physical
characteristics and specific tasks performed in competition.
Indeed, studies have examined the relationship between physical characteristics and
subjective measures of playing ability. For example, significant correlations have been
reported between VJ and the ability to beat a player (r = 0.44) and between sprint time
(10, 20 and 40 m) and offensive skills, such as the ability to hit and spin or pass out of a
tackle (r = -0.35 to -0.45) (Gabbett et al., 2007). Furthermore, better tacklers, as
indicated by a standardised tackling drill, are heavier, leaner, slower and have a higher
VJ than worse tacklers (Gabbett, 2009). However, an inherent issue with these studies
is the measurement and rating of the skill in a controlled training environment, which
will have limited application when applied in a competitive setting (Gabbett, 2009;
Gabbett et al., 2007).
A recent study by Young and Pryor (2007) compared the physical characteristics of
Australian Rules football players that were grouped according to a high or low
attainment of key performance indicators within competition. Players with a higher
number of possessions (the number of effective kicks or hand passes, indicative of an
effective player), were significantly faster over 5 and 20 m and had a higher estimated
VO2 Max than players with lower possessions. The results show players with higher
levels of fitness may have an advantage in the performance of tasks in competition.
Further research is therefore required to quantify the direct relationships between
physical characteristics and game statistics; providing coaches with the specific
attributes that contribute to the desired performance of key performance indicators on
the field of play.

23
Physical Characteristics and Talent Development
Talent Development Programmes
Talent development programmes are typically a result of talent identification systems,
used to enhance the physical characteristics of young athletes for later success.
However, there are inherent issues with the identification of talent through physical
assessments alone; especially within team sports, in which physical assessments ignore
team interaction, decision making, specific ball skills and tactical awareness (Burgess &
Naughton, 2010; Vaeyens, Lenoir, Williams, & Philippaerts, 2008). Indeed, recent
literature has emphasised these issues and has suggested research and practice move
away from talent identification systems with low predictive ability, and progress
towards talent development and guidance (Vaeyens et al., 2008).
Traditionally, sports such as rugby union and rugby league informally identify
adolescent players on playing ability to play in representative age group teams. The
selection of players in this manner eliminates some of the issues surrounding selection
through physical ability alone. However, in such physically demanding sports, the
attainment of success will not be solely determined by skill. The development of
physical characteristics is therefore crucial to ensure the physical potential is achieved
and to ensure the young athlete is physically prepared for professionalism.
Physical Characteristics Training in Adolescent Athletes
Despite a lack of research evidence, it was commonly suggested resistance training in
adolescents was detrimental for growth and maturation. However, research has found
structured physical training programmes to be safe and effective (Faigenbaum & Myer,
2010; Tsolakis, Vagenas, & Dessypris, 2004). Injury rates in children and adolescents
have been shown to be lower in resistance training compared to rugby (~0.09 and 0.80

24
injuries per 100 participant hours respectively) (Faigenbaum & Myer, 2010).
Furthermore, injuries as a result of resistance training only appear to occur as a result of
poor technique, lack of supervision or incorrect load selection (Faigenbaum & Myer,
2010; Hamill, 1994).
Resistance training results in significant increases in muscular strength in adolescent
athletes. For example, Christou and colleagues (2006) reported increases of 52.3% and
58.8% in 1RM bench-press and leg press respectively for 13-year old soccer players
after a 16-week resistance training programme. In rugby league players of greater age
(16.7-years), smaller but still significant increases were reported in 1RM bench-press
(29%) and 1RM squat (40%) after a 12-week resistance training programme (Coutts et
al., 2004). All of these increases were significantly greater than age matched controls.
The measure of lower body muscular power however, as indicated by VJ height, has
produced varied changes to training in adolescents. Significantly greater increases were
reported in under-14 soccer players VJ height post 12-week training programme
compared with age and soccer training matched controls (Wong et al., 2010). In
contrast, 15-year old handball players have shown non-significant increases in VJ height
compared to significant increases in a non-training control group (Gorostiaga et al.,
1999). The lack of consistent changes within studies has been primarily linked to a lack
of specificity in the programming, with heavy slow resistance exercise and a lack of
plyometrics providing insufficient training stimulus (Gabbett et al., 2006; Gorostiaga et
al., 1999).
As a result of the young age of athletes within the studies, subjects are typically
inexperienced in resistance training, thus training age is not considered as a
confounding variable. A study by Hetzler et al. (1997) however, separated baseball

25
players that were experienced (8-months resistance training experience) and
inexperienced with resistance training within a 12-week strength training programme.
Novice strength trained athletes had significantly larger increases in VJ height than
experienced athletes (4.1 ± 3.6 cm and 1.5 ± 4.8 cm respectively). These data illustrate a
potentially limited scope for increases in strength and power in more experienced
adolescent athletes, and acknowledges the greatest improvements occur when initial
fitness levels are lower (Gabbett, 2006).
The improvements in strength and power in adolescents are primarily due to neural
adaptations. Increases in firing frequency, motor unit recruitment, synchronisation and
co-ordination are all thought to be responsible (Blimkie, 1992; Ramsay et al., 1990;
Reilly & Stratton, 1995). Indeed, studies have shown increases in testosterone
concentration as a result of training, which may contribute to the anabolic growth spurt
during puberty (Tsolakis, Messinis, Stergioulas, & Dessypris, 2000; Tsolakis et al.,
2004). However, non-significant correlations between strength changes and anabolic
hormones; and strength changes independent of changes in muscle size, demonstrate a
lack of potential role of testosterone in strength acquisition of adolescents (Blimkie,
1992; Tsolakis et al., 2004).
Changes in body composition are thought to be due to the normal changes associated
with puberty, as increases in mass and decreases in percent body fat post-training have
been reported in both experimental and control groups (Christou et al., 2006; Coutts et
al., 2004; Diallo, Dore, Duche, & van Praagh, 2001; Gabbett, Johns, & Riemann,
2008a; Gorostiaga et al., 1999; Hetzler et al., 1997). During maturation, an increase in
fat mass coincides with peak height velocity (approximately 14 years of age for boys
and 12 years of age for girls); however, a resultant higher percentage body fat is

26
typically offset by more substantial increases in fat free mass (Baxter-Jones, Eisenmann,
& Sherar, 2005; Beunen & Malina, 1988). Therefore, the increase in testosterone
concentration associated with training may not be of large enough magnitude to elicit
greater increases over and above normal growth (Tsolakis et al., 2004). The lack of
changes may also be due to the low training experience of the subjects, as initial gains
in strength in inexperienced individuals are typically neural and not a result of increased
muscle mass (Behm, 1995; Moritani & DeVries, 1979).
A large amount of research has examined the efficacy of resistance training in
adolescent athletes and the associated physiological changes. In comparison, a small
amount of literature has investigated changes in speed and aerobic capacity in the same
population. Significant and non-significant increases in VO2 Max, multistage shuttle run
performance and distance covered in the Yo-Yo intermittent recovery test have been
observed in athletes after mixed skills and field based conditioning programmes
compared to age and sport matched controls (Gabbett, 2006; Gabbett et al., 2006;
Gabbett et al., 2008a; Wong et al., 2010). Maximal oxygen uptake is at its greatest rate
of increase during maturation at the time of peak height velocity, and is thought to be
more sensitive to aerobic training once peak height velocity is reached (Baxter-Jones et
al., 2005; Beunen & Malina, 1988; Reilly & Stratton, 1995). Therefore, it appears that
an appropriate training stimulus during puberty may supersede the normal development
of aerobic capacity (Ekblom, 1969).
Significant decreases in sprint time have been found post-training in young athletes. For
example, a short-term speed and agility training programme has resulted in large
decreases in 10-m sprint time (~2.7%) in 16 year old handball players (Buchheit,
Mendez-Villanueva, Quod, Quesnel, & Ahmaidi, 2010); while greater decreases have
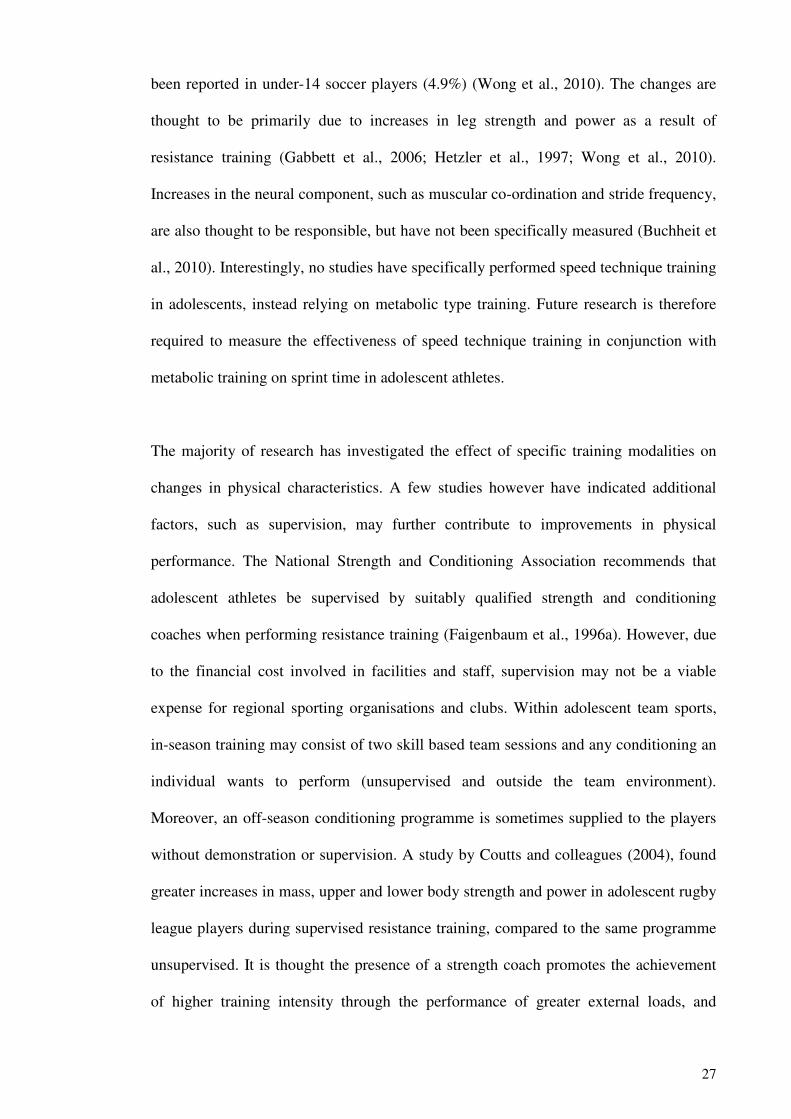
27
been reported in under-14 soccer players (4.9%) (Wong et al., 2010). The changes are
thought to be primarily due to increases in leg strength and power as a result of
resistance training (Gabbett et al., 2006; Hetzler et al., 1997; Wong et al., 2010).
Increases in the neural component, such as muscular co-ordination and stride frequency,
are also thought to be responsible, but have not been specifically measured (Buchheit et
al., 2010). Interestingly, no studies have specifically performed speed technique training
in adolescents, instead relying on metabolic type training. Future research is therefore
required to measure the effectiveness of speed technique training in conjunction with
metabolic training on sprint time in adolescent athletes.
The majority of research has investigated the effect of specific training modalities on
changes in physical characteristics. A few studies however have indicated additional
factors, such as supervision, may further contribute to improvements in physical
performance. The National Strength and Conditioning Association recommends that
adolescent athletes be supervised by suitably qualified strength and conditioning
coaches when performing resistance training (Faigenbaum et al., 1996a). However, due
to the financial cost involved in facilities and staff, supervision may not be a viable
expense for regional sporting organisations and clubs. Within adolescent team sports,
in-season training may consist of two skill based team sessions and any conditioning an
individual wants to perform (unsupervised and outside the team environment).
Moreover, an off-season conditioning programme is sometimes supplied to the players
without demonstration or supervision. A study by Coutts and colleagues (2004), found
greater increases in mass, upper and lower body strength and power in adolescent rugby
league players during supervised resistance training, compared to the same programme
unsupervised. It is thought the presence of a strength coach promotes the achievement
of higher training intensity through the performance of greater external loads, and

28
increases external motivation and competition when the training is performed in the
team environment (Coutts et al., 2004; Mazzetti et al., 2000). While the lack of
supervision is primarily a safety issue, it also appears that resistance training
performance can also be affected by supervision. Therefore, future talent development
systems need to consider the importance of supervised training when prescribing
training programmes.
Future Development in Adolescent Athletes
The results from the training studies of adolescent athletes illustrate the effectiveness of
physical training during maturation and support the notion of supervised talent
development programmes. Increases in physical characteristics may assist in the short-
term success of an athlete; however talent development programmes must have long-
term aims to assist in the optimal athletic progression of individuals (Burgess &
Naughton, 2010; Vaeyens et al., 2008). Nonetheless, long-term monitoring of
adolescent athletes post-training or long-term training interventions are lacking within
research. Short-term periods post-training have shown expected decrements in physical
characteristics as a result of reduced or a cessation of training (Diallo et al., 2001;
Faigenbaum et al., 1996b; Tsolakis et al., 2004). Research specifically investigating the
long-term changes in the physical characteristics to systematic and supervised training
in adolescent athletes is therefore required to further understand the physical
development process that may lead to elite performance.
High level team sport athletes are required to concurrently train multiple components
using multiple forms of training stimulus in order to improve desired physical attributes
(Argus et al., 2010). However, most studies that have investigated the effects of training
on adolescents have typically utilised one training modality or included supplementary

29
resistance training to players’ team training schedule. Further research is required with
the aim of concurrently increasing speed, strength, power, anaerobic and aerobic fitness,
and improve body composition using specific training modalities in adolescents.
Research of this nature will not only replicate the structure of training at higher levels,
but also help to understand the potentially conflicting adaptations associated with
concurrent training, that may be specific to this age group (Kraemer et al., 1995).
Another area that is lacking within literature is differences in the changes of physical
characteristics between athletes of different ages. A study by Gabbett et al. (2008a),
showed significantly greater increases in mass and VO2 Max in under-15 rugby league
players compared to under-18 players after the same 10-week strength and conditioning
programme. The differences were thought to be due to the training stimulus being
insufficient to increase physical characteristics in the older players. Further knowledge
such as this would provide sporting organisations with justification for the
implementation of talent development programmes at particular ages, so that they may
achieve greater gains with their financial investment.
Conclusions
The aims of this review were to; establish the differences in physical characteristics
between players of differing playing position and levels in contact based team sports;
discuss the relationship between physical characteristics and on-field performance; and,
establish the effectiveness of physical training programmes in adolescent athletes. The
amount of research specifically investigating the physical characteristics of modern
rugby union players and the differences between positions and playing levels is
somewhat limited. Nonetheless, from the literature reviewed of similar contact based
team sports, it clear that differences in physical characteristics occur between positions,

30
illustrating the heterogeneous nature of the positions and the roles they play within
teams. Consistent differences also exist between playing levels with some indication
that selection into higher level teams may be partially based on physique and physical
performance factors. However, the long-term changes of individuals and teams
associated with different playing levels and time of year is still to be examined.
The physical demands of competition have been investigated through the use of time-
motion analysis, global positioning systems and the measurement of various
physiological variables (e.g. heart rate, blood lactate). The development of notational
analysis and the identification of key performance indicators have provided further
information into specific playing profiles of successful teams and individuals. The
physical preparation should therefore reflect the degree to which each component of
fitness is relied upon in competition. Nonetheless, no research has examined the direct
relationship between physical characteristics and key performance indicators in
competition.
The knowledge of physical characteristics of elite contact based team sport players
should underpin physical development programmes for adolescent athletes. The
information will allow the preparation of specific attributes required for the rigors of
professional competition to be developed earlier. Specific changes in physical
characteristics have been reported as a result of training in adolescents, supporting the
efficacy of structured and supervised physical training during maturation. However,
there is an inherent lack of research investigating dedicated physical development
programmes in contact based team sport players with long-term follow ups.
Furthermore, specific factors that may influence training induced changes, such as
concurrent training and the effects of age, are still relatively unknown. Future research

31
should therefore employ programmes that encompass concurrent strength and
conditioning and skill based training; which will provide insight into the long-term
developmental changes in the attributes associated with elite performance.

32
CHAPTER THREE: VALIDITY
AND RELIABILITY

33
The validity and reliability of the Rugby-Specific Repeated-Speed (RS
2) test and
Metabolic Fitness Index for Team Sports (MFITS)
Abstract
The aim of this pilot study was to measure the validity and reliability of the Metabolic
Fitness Index for Team Sports (MFITS) and the Rugby-Specific Repeated-Speed (RS2)
test. Twenty elite development and semi-professional rugby union forwards and half
backs performed the MFITS and RS2 test four days apart, and then repeated the testing
protocols a further 9 and 13 days later respectively. The most reliable outcome measure
for the MFITS was the 60-m sprint (Intraclass correlation coefficients - ICC = 0.966;
coefficient of variation - CV = 1.1%), which may be attributed to the short test duration.
The average sprint time was the most reliable outcome measure in the RS2 test (ICC =
0.953; CV = 0.8%), which may be due to the reduction in variation associated with
averaging measures. The relationship between the sprint and aerobic measures of the
respective tests showed higher correlations (range r = 0.59 – 0.79) than the anaerobic
measures (r ≈ 0.15), illustrating the 400-m run within the MFITS is not indicative of
repeated sprint ability in the RS2 test. The low sample size creates greater uncertainty
with the correlations, thus further work with a greater sample size is required to be clear
about the validity and reliability of these tests.

34
Introduction
The majority of team sports are characterised by a highly intermittent nature, requiring
repeated maximal sprints, interspersed with low-intensity jogging or walking.
Numerous field based tests have been developed to evaluate aerobic and anaerobic
capacity, which are used to determine the fitness of players and their ability to withstand
high-intensity competition. The most common of these tests is the 20 m Multistage
shuttle run, and has been shown to be both valid in estimating maximal oxygen uptake
(VO2 max) and reliable (Leger & Lambert, 1982; Ramsbottom, Brewer, & Williams,
1988).
Two testing protocols are used by the New Zealand Rugby Union to measure aerobic
and anaerobic performance. At academy level and below the Metabolic Fitness Index
for Team Sports (MFITS) is used. The MFITS is made up of three components, each
designed to indicate the capacity of the three metabolic systems. The test consists of a
60-m sprint to test the phosphate energy system, a 400-m sprint to test the lactate
(glycolytic) energy system, and a 1500-m run as an indicator of aerobic capacity (Jones
& Climstein, 2002). The test is used due to the ease of administration and ability to test
a large group within a short period of time; however no investigation into the reliability
of this test has been performed.
The test used at national provincial level and above is the Rugby-Specific Repeated-
Speed (RS2) test. The RS
2 test consists of a maximal sprint, the performance of a
repeated sprint component specific to the distances and work to rest ratios experienced
in competition, and the performance of the Yo-Yo Intermittent Recovery test. Indeed,
Smart (2005) found the RS2 test to be reliable (coefficient of variation – CV, of 0.8% -
3.8% for the various measures), however recent adjustments to the repeated sprint

35
protocol and the inclusion of the Yo-Yo test warrants a further investigation.
Furthermore, the reliability of the Yo-Yo test following an anaerobic repeated sprint test
is unknown. Due to the use of two different tests, the relationship between the two
protocols and whether the MFITS is an indicator of repeated sprint performance at a
higher playing level is not known. Therefore the aim of this brief pilot investigation was
to measure the validity and reliability of the MFITS and RS2 tests.
Methods
Participants
Twenty rugby union players at regional academy (elite development) and national
provincial (semi-professional) level (mean ± SD; age 21.9 ± 1.5 years; mass 97.2 ±
10.1kg; percent body fat 11.5 ± 2.7%) participated in the study. Participants were in the
pre-season phase of their training plan where the aim was to improve aspects of
muscular strength, power, speed and aerobic and anaerobic conditioning. Due to a small
sample size of backs, the pilot study is restricted to analysis of the forwards and half
backs. Ethical approval was provided by the Auckland University of Technology Ethics
Committee (AUTEC).
Design
The study was a repeated measures design. Each participant performed a total of four
fitness tests (two of each test). The testing was performed in two blocks separated by a
period of nine days. During each testing block participants performed the MFITS and
then the RS2
test separated by four days (Figure 1). As participants were familiar with
the tests and had performed them on previous occasions, no familiarity tests were
performed.
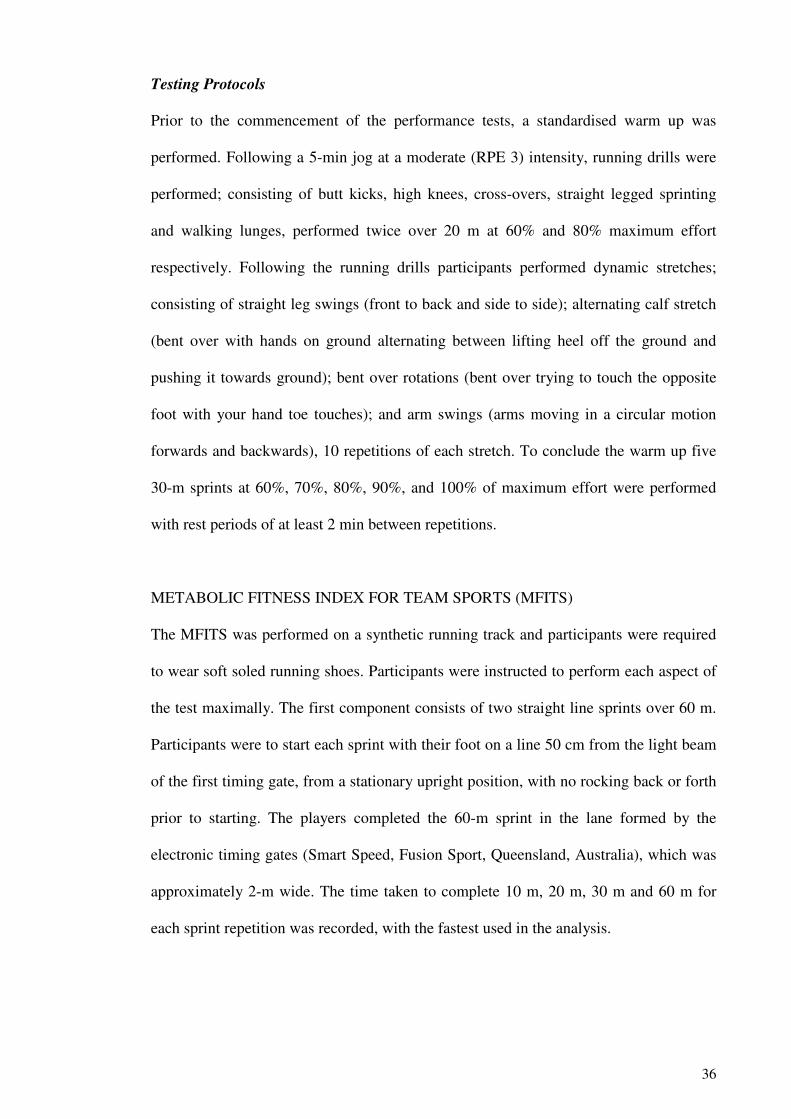
36
Testing Protocols
Prior to the commencement of the performance tests, a standardised warm up was
performed. Following a 5-min jog at a moderate (RPE 3) intensity, running drills were
performed; consisting of butt kicks, high knees, cross-overs, straight legged sprinting
and walking lunges, performed twice over 20 m at 60% and 80% maximum effort
respectively. Following the running drills participants performed dynamic stretches;
consisting of straight leg swings (front to back and side to side); alternating calf stretch
(bent over with hands on ground alternating between lifting heel off the ground and
pushing it towards ground); bent over rotations (bent over trying to touch the opposite
foot with your hand toe touches); and arm swings (arms moving in a circular motion
forwards and backwards), 10 repetitions of each stretch. To conclude the warm up five
30-m sprints at 60%, 70%, 80%, 90%, and 100% of maximum effort were performed
with rest periods of at least 2 min between repetitions.
METABOLIC FITNESS INDEX FOR TEAM SPORTS (MFITS)
The MFITS was performed on a synthetic running track and participants were required
to wear soft soled running shoes. Participants were instructed to perform each aspect of
the test maximally. The first component consists of two straight line sprints over 60 m.
Participants were to start each sprint with their foot on a line 50 cm from the light beam
of the first timing gate, from a stationary upright position, with no rocking back or forth
prior to starting. The players completed the 60-m sprint in the lane formed by the
electronic timing gates (Smart Speed, Fusion Sport, Queensland, Australia), which was
approximately 2-m wide. The time taken to complete 10 m, 20 m, 30 m and 60 m for
each sprint repetition was recorded, with the fastest used in the analysis.

37
Figure 1: The study design for the validity and reliability testing of the Metabolic Index for Team Sports
(MFITS) and the Rugby-Specific Repeated-Speed (RS2) test.
TEST BLOCK ONE TEST BLOCK TWO
Test 1 (MFITS)
Test 2 (RS2)
Test 3 (MFITS)
Test 4 (RS2)
4 days 9 days 4 days

38
After a 15-min recovery; in which during the last 5 min players were required to
complete a one lap jog of the 400-m track with two 40-m stride outs; participants
completed a 400-m sprint. Participants were required to sprint maximally for the entire
lap of the track while staying in their allocated lane. Groups of eight participants (one
per running lane) were started on the command ‘Set, Go’. Simultaneously, allocated
timers to each participant started a stopwatch. The timers stopped the stopwatch when
the participant completed the 400-m run at the finish line. The time to complete the 400
m (to the nearest tenth of a second) was recorded.
After a 15-min recovery; in which during the last 5 min participants were required to
complete a one lap jog of the 400-m track; players completed a 1500-m run. All
participants commenced the run together starting at the 300-m mark on the track and
completed three and three quarter laps. The time to complete the 1500 m was verbalised
to the participant as they crossed the finish line, which was then recorded to the nearest
second.
RUGBY-SPECIFIC REPEATED-SPEED (RS2) TEST
All sprints (both speed and repeated sprint) were performed on grass; however a
synthetic grass mat covering 1.5 m behind and 3.5 m in front of the first timing gate
(securely pegged at each corner) was laid to assist with traction. All sprints were
performed in footwear that was appropriate for the conditions and those used during
rugby competition (moulded soles for firm and hard ground, football boots for softer
ground). The players were instructed to sprint maximally for every repetition within the
lane formed by the electronic timing gates, which was approximately 2-m wide. Players
started each sprint with their foot on a line 50 cm from the light beam of the first timing
gate, in a stationary upright position, with no rocking back or forth prior to starting.

39
Speed Component
Each player performed two repetitions over 20 m. For each repetition the time to
complete 20 m and the time to cover the first 10 m of each sprint was recorded, with the
fastest overall time used in the analysis. Each of the two efforts was performed after at
least 2-min rest from the previous repetition.
Repeated Sprint Component
Fifteen minutes after the speed component, the repeated sprint component was
performed. The test consists of three sets of four individual sprints performed
maximally at set time intervals. Each set of sprints is separated by periods of
standardised work where the players jog with a weighted bag (PowerBagTM
, SPSS,
Christchurch, New Zealand) over their shoulders and perform down and ups (get down
off feet into a prone position on the ground - chest and chin was required to touch the
ground - and then return to feet), also at set time intervals (Figure 2). Players repeated
sprints were measured using electronic timing gates over the same 20 m distance as
speed; however, only the time to complete the total distance was recorded.
Two groups of three forwards (6 total) were able to perform the test at one time. The
master timer started a stopwatch and sent individual players off at 10 s intervals. The
master timer started the players by counting down the time left before the start of the
next repetition of work from 5 s (i.e. 5; 4; 3; 2; 1; GO!). During the periods of
standardised work, the master timer was required to countdown for all the players as in
some instances all subjects were performing some form of work at the same time.
The forwards and half backs were required to sprint four times over 20 m, sprinting
through the timing gates, decelerating to a cone a further 10 m away. They then jogged

40
back towards the timing gates (total distance decelerating/jogging = 20 m) and upon
reaching the gates walked back to the start line outside the running lane (total distance
walking = 20 m). Each sprint repetition was performed on a 30-s turnaround. After
completing four sprints (at master time 2 min) the player moved to the side of the
running lane and performed the standardised work. The player was required to pick up
the 30-kg PowerBagTM
and place it on their shoulder or behind their neck. On the GO
command they had 10 s to carry it 20 m and drop the PowerBagTM
at the end. On a 10-s
turnaround the player performed a down and up (get down off feet into a prone position
on the ground - chest must touch the PowerBagTM
- and then return to feet) before
picking up the PowerBagTM
and jogging with it for 20 m back to the start line. The
players were to keep the bag on their shoulders before repeating the up and back shuttle.
The standardised work sequence was performed a total of five times. After a 20-s rest
(at master time 4 min) the player repeated the previous sprint and standardised work
protocol. Upon completion of the second period of standardised work, the players
completed the final set of four sprints. A total of 12 sprints was therefore performed
over a period of 9 min 30 s.
Measures of performance derived from the RS2 test were: the mean time to cover the 12
sprints and fatigue (calculated as a percent change in sprint time predicted from the
linearised change derived from all sprints performed).
Multistage Shuttle Component (Yo-Yo Test)
Fifteen minutes after completing the repeated-sprint component; in which during that
time participants were required to jog two lengths of a rugby field (200 m); participants
performed the Yo-Yo Intermittent Recovery test level 1. The test is performed over 20-
m shuttles with a 5-m recovery zone behind the start line. During the test, participants

41
b)
10-m
10-m
10-m
= Timing Light Gates = Cones
KEY:
= Sprint = Jog = Walk
20-m PowerBagTM
Jog @ 10-s
Down & Up &
20-m PowerBagTM
Jog @ 10-s
c)
Forwards
5 x PowerBagTM
Sets
Forwards
4 x 20-m Sprints @ 30-s
Forwards
4 x 20-m Sprints @ 30-s
Forwards
4 x 20-m Sprints @ 30-s
Forwards
5 x PowerBagTM
Sets
a)
Figure 2: The repeated sprint component of the Rugby-Specific Repeated-Speed (RS2) test (a). Three sets
of repeated sprinting, jogging and walking 20 m for the forwards and half backs (b) are performed at set
time intervals and interspersed with PowerBagTM
shuttles using a 30 kg weighted PowerBagTM
, also
performed at set time intervals (c).

42
were required to complete two 20-m shuttles at predetermined speeds, as indicated by
beeps on an audio CD. In between each pair of shuttles there was a 10-s active recovery
period, during which time the participants completed two 5-m shuttles. The test began at
level one (at a speed of 10 km.h-1
) with increments in speed as the test progressed
(Atkins, 2006). The conclusion of the test was determined by voluntary exhaustion or if
the participant failed to reach the finish line on two consecutive occasions. Performance
was indicated by distance covered by the participant, as determined by the number of
shuttles completed, at the conclusion of the test (Bangsbo et al., 2008).
Statistical Analysis
To determine the reliability of the MFITS and RS2
tests, data was analysed using the
reliability from consecutive pairs of trials Excel spreadsheet (Hopkins, 2000b). The log
of the data was used in the calculation of reliability to reduce the effect of
nonuniformity of error. Retest correlations were calculated as intraclass correlation
coefficients (ICC) and within subject variation calculated as a coefficient of variation
(CV) for all variables. Validity data was analysed using the analysis of validity by linear
regression Excel spreadsheet (Hopkins, 2000a). Pearson correlation coefficients were
used to assess the relationship between the respective variables from the MFITS and the
RS2 test. Confidence limits for both analyses were calculated to indicate the 95% likely
range of the true value.
Results
The ICC and CV for the various outcome measures for both the MFITS and RS2 test are
shown in table 1. In the MFITS the most reliable outcome measure was the 60-m sprint
(ICC = 0.966; CV = 1.1%), while in the RS2 test the most reliable outcome measure was
the average sprint time (ICC = 0.953; CV = 0.8%). The relationship between the MFITS

43
Table 1: Intraclass correlation coefficients (ICC), coefficient of variation (CV) and 95%
confidence limits (95% CL) for the reliability of the performance measures in the Metabolic
Fitness Index for Team Sports (MFITS) and Rugby-Specific Repeated-Speed (RS2) test.
ICC 95% CL CV 95% CL
MFITS 10m 0.82 0.54 – 0.93 2.0% 1.5% – 3.1%
MFITS 20m 0.96 0.88 – 0.99 1.0% 0.7% – 1.5%
MFITS 60m 0.97 0.90 – 0.99 1.1% 0.8% – 1.7%
MFITS 400m 0.80 0.51 – 0.92 2.7% 2.0% – 4.1%
MFITS 1500m 0.53 0.05 – 0.81 3.6% 2.6% – 5.6%
RS2 10m 0.79 0.49 – 0.93 2.0% 1.5% – 3.1%
RS2 20m 0.69 0.19 – 0.90 2.2% 1.5% – 3.7%
RS2 average sprint time 0.95 0.84 – 0.99 0.8% 0.6% – 1.4%
RS2 fatigue 0.22 -0.41 – 0.70 1.9% 1.3% – 3.2%
Yo-Yo testa 0.43 0.34 – 0.90 16.8% 7.5% – 16.8%
a Yo-Yo Intermittent Recovery test (level one)
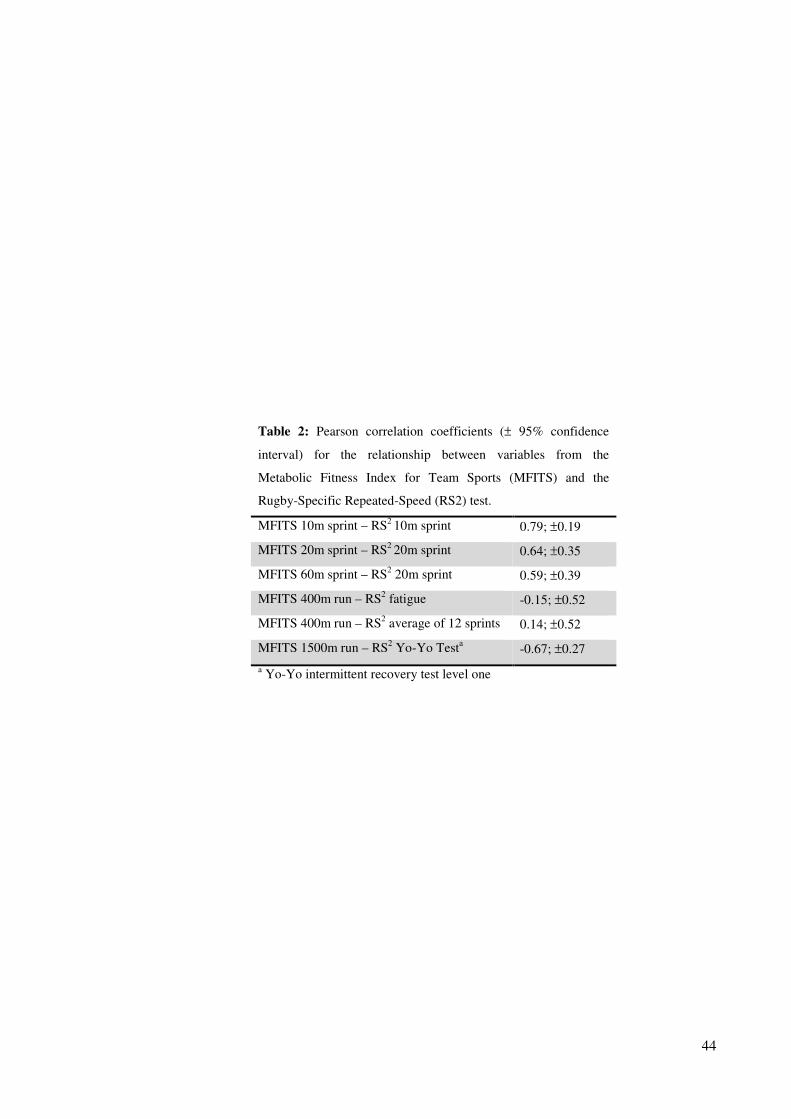
44
Table 2: Pearson correlation coefficients (± 95% confidence
interval) for the relationship between variables from the
Metabolic Fitness Index for Team Sports (MFITS) and the
Rugby-Specific Repeated-Speed (RS2) test.
MFITS 10m sprint – RS2 10m sprint 0.79; ±0.19
MFITS 20m sprint – RS2 20m sprint 0.64; ±0.35
MFITS 60m sprint – RS2 20m sprint 0.59; ±0.39
MFITS 400m run – RS2 fatigue -0.15; ±0.52
MFITS 400m run – RS2 average of 12 sprints 0.14; ±0.52
MFITS 1500m run – RS2 Yo-Yo Test
a -0.67; ±0.27
a Yo-Yo intermittent recovery test level one

45
variables and the RS2 test variables is shown in table 2. The sprint and aerobic measures showed
higher correlations (range r = 0.59 – 0.79) than the anaerobic measures (r ≈ 0.15).
Discussion
The sprint variables (10 m, 20 m and 60 m) were the most reliable variables in the
MFITS. In addition, trends showed a decreasing reliability as the distances of the tests
increased. The lower reliability of the longer tests may be due to variations in pacing
strategies; which may be more pronounced in rugby players who typically don’t
perform running time trials in training. Furthermore, tests lasting more than a few
minutes are thought to be affected more by nutrition and the training performed leading
up to the test, which may be the case in the present study, as participants were in an
intense pre-season training phase (Hopkins, Schabort, & Hawley, 2001).
The most reliable variable in the RS2 test was the average sprint time. By calculating an
average, the variation associated with a one off sprint is reduced, producing greater
repeatability (Hopkins et al., 2001). The variable with the poorest reliability, as
indicated by a low ICC, was fatigue; however it also possessed a low CV. A low ICC
suggests the rank order of subjects from test to test is not constant, whereas a low CV
indicates the typical within-athlete variation from test to test is low (Hopkins, 2000c).
The Yo-Yo Intermittent Recovery test showed poor reliability compared to research that
has reported a 1 week test-retest CV of 4.9% (Krustrup et al., 2003). When one outlier is
removed from the reliability analysis in the current study, the test-retest ICC for the Yo-
Yo increases to 0.73 (CV = 10.4%). However, pre-loads prior to tests, such as the
repeated sprint component prior to the Yo-Yo, has been shown to decreases the

46
reliability of tests; thus may have an adverse affect upon the reliability in the current
study (Hopkins et al., 2001).
The poor reliability of some variables within the current study might be due to the
heterogeneous nature of the forwards positions. Many different body compositions are
represented due to the specific roles each position is required to perform. The
heterogeneity is further confounded by the half backs, who are included as part of the
forwards for the RS2
test, as they are often the shortest and lightest players within the
rugby union team (Duthie et al., 2003). Therefore, due to the different body
compositions and roles within competition, the variability associated with a
heterogeneous group like the forwards is greater and may be consequently less reliable.
The relationship between the MFITS and the RS2 test indicates the sprint and aerobic
components of each test have a stronger relationship than the anaerobic components of
the testing batteries. The sprint tests for both protocols are performed in exactly the
same manner, with the only difference the surface on which they are performed and the
footwear used. Indeed, the MFITS sprint tests had greater reliability than the RS2 sprint
test which may be due to a more consistent running surface on the synthetic running
track. Therefore, the unexplained proportion of the relationship may be due to the
variation experienced between the surfaces. Similarly, the relationship between the Yo-
Yo test and the 1500-m run produced a large correlation. Both the Yo-Yo and 1500 m
tests are primarily aerobic, thus the differences would be due to the specifics of the test
protocols (intermittent change of direction vs. continuous running). The 400 m and
repeated sprint component of the RS2
showed low correlations. Although both tests are
anaerobic (lactate glycolytic) in nature, it appears the 400-m sprint is a poor indicator of
repeated sprint ability. This may be due to the inherent differences in the protocols. The

47
MFITS is a continuous test of approximately 60-s duration, requiring pacing and a
tolerance to high concentrations of lactate (Hanon, Lepretre, Bishop, & Thomas, 2010).
In comparison, the RS2
repeated sprint component has 12 sprints of approximately 3.20
s (approximately 40 s total) that requires multiple maximal efforts and the ability to
recover from these (Meckel, Machnai, & Ellakim, 2009).
The RS2 test has high logical validity, due to its basis of distances and work to rest
ratios experienced during competition. Consequently, the rationale for the use of the
400-m component of the MFITS could be questioned if it is not indicative of repeated
sprint ability. Due to the logistical ease at which a sprint test and the Yo-Yo test are
administered within large groups, it is therefore recommended that academy level
players perform these tests under the same guidelines as elite players. The consistency
in protocols will allow more direct comparison between levels and indications of
progressions of individuals without changing test protocols as players are promoted.
Further work must be performed to develop a simple repeated sprint test that can be
administered in large groups to measure the anaerobic component not measured within
the sprint and Yo-Yo tests.
An inherent issue with this investigation is the low sample size, which creates greater
uncertainty with the correlations. This pilot study has formed the basis for further work
with a greater number of subjects, to allow clearer conclusions about the test-retest
reliability and the relationship of these measures. Moreover, only the forwards protocols
were assessed in the current study, thus future research should also re-establish the
reliability and validity of the backs protocol.

48
In conclusion, measures of sprint performance in the MFITS and the average sprint time
in the repeated sprint component of the RS2 test are highly reliable, which may be due
to the duration of the test and the nature of averaging measures. The relationships
between the MFITS and RS2 test batteries indicate the sprint and aerobic components
are highly related while the 400-m sprint does not appear to be an indicator of anaerobic
repeated sprint ability. Nonetheless, further work is required with a greater sample size
to be more definitive of the validity and reliability of these tests.

49
CHAPTER FOUR: PHYSICAL
CHARACTERISTICS

50
Study One – Differences and changes in the physical characteristics of professional
and amateur rugby union players
Abstract
Numerous studies have highlighted differences between playing levels and positions in
rugby union; however few studies have investigated longitudinal progressions of body
composition and physical performance. Between-player differences and within-player
changes in body composition, strength, power, speed, and repeated sprint ability, from
1161 New Zealand rugby union players from 2004-2007, were estimated using a mixed
modelling procedure. Magnitudes of effects were assessed by standardisation. Props had
the highest mass, percent body fat, strength and slowest speed times compared to the
outside backs, who had the fastest speed time and lowest percent body fat. For most
measures there were small to moderate differences (range 1.1% - 14%) between players
selected and not selected for provincial teams, and small to large differences (range
1.8% - 15%) between provincial and Super Rugby (professional) players. The faster 20-
m sprint times in international compared to Super Rugby players was small in
magnitude for both the forwards (1.9%) and backs (2.2%). The average annual
improvements were small to moderate for strength (range 2.1% - 15%) and small for
repeated sprint ability within the lower playing levels (~1.5%). Small increases occurred
in lower body strength (~7.0%) as players moved from Super Rugby to provincial
competition. Small decreases in sprint time (~1.6%) and small increases in strength
(~6.3%) occurred as players moved from Super Rugby to mid-year international
competition. The differences between levels in performance provide level-specific
characteristics from Super Rugby and below, but international players may be selected
due to greater skill and experience. Changes in physical performance between
competitions may be a result of reduced training loads due to regular high-intensity
matches and greater travel involved in the Super Rugby competition.

51
Introduction
Rugby union is a field based team sport that requires a diverse range of physical
attributes to tolerate a large amount of physical contact and numerous maximal sprints
(Duthie et al., 2003). Since the introduction of professionalism in 1995, the
characteristics of speed, strength, power and body composition of players has evolved
rapidly, and as a consequence the speed and physicality of matches has increased
(Duthie et al., 2003; van Rooyen, Rock, Prim, & Lambert, 2008). The measurement of
players’ physical characteristics has highlighted position specific attributes. Forwards
are involved in more rucks, mauls, lineouts and scrums, which requires greater mass,
height, strength and power in order to be successful (Casagrande & Viviani, 1993;
Duthie et al., 2006b). In contrast, the backs primary role in beating the opposition in
open play requires a combination of speed, acceleration and agility (Duthie et al., 2003;
Quarrie et al., 1996; Quarrie et al., 1995). Differences between playing levels have also
been reported. For example, senior club players possess greater height, mass, speed,
strength and aerobic fitness compared to their lower level age group counterparts
(Quarrie et al., 1995)
Few longitudinal studies exist exploring the progression of individual’s and teams’
physical characteristics. Olds (2001) used historical data to track the evolution of
physique in male rugby union players from 1905 to 1999. It was shown that the body
mass index had increased at a rate three to four times faster in rugby union players
during the last 25-years compared to the rest of the century. In addition, a more recent
study showed rapid increases in mass (~10%) since the inception of the professional era
(Quarrie & Hopkins, 2007).

52
To track more specific individual player changes, Duthie et al. (2006b), modelled the fat
free mass of professional Super 12 players over a period of five years; which included
the Super 12 and club competitions at different times of the year. It was reported that
there was a decrease in the proportion of the fat free mass of players which occurred
primarily during the club competition. More recently, Argus and colleagues (2009)
tracked the changes in strength and power over the period of a Super 14 season,
reporting small increases (8.5%) in box-squat 1RM and small decreases (3.4%) in jump
squat peak power.
Traditionally athletes undergo fitness assessments that are used to determine the current
level of fitness, motivate individuals and to assist in future programme prescription.
Typically this test data is used for the short-term to evaluate the success of a pre-season
programme or a current phase of conditioning. Previous longitudinal studies have
shown progressions of physique and the effect different phases of a year have upon
measures of body composition. However, the long-term monitoring of individual
players physical performance, such as strength, power and speed, has received less
attention and requires further investigation. Due to a lack of knowledge in the area of
long-term athletic development in rugby union there is a need to understand the
between-player differences and within-player changes over long periods of time.
Therefore, the primary purpose of this study was to analyse performance test data of
New Zealand rugby union players from 2004 to 2007, to determine differences between
playing positions, playing level and year of fitness test; and changes within players as
they moved between different competitions played during the year.

53
Methods
Experimental Approach to the Problem
A large battery of fitness tests that are deemed important for the physical preparation of
rugby union players are performed on all registered players in New Zealand at
provincial level and above. Test data that have been determined through these fitness
tests, performed under standardised testing protocols, are entered onto a national
database. With this large amount of data available, the New Zealand Rugby Union was
able to commission research into the progressions and differences between annual
means, playing level and competition phases. In order to deal with the large amount of
repeated measures on players, the differences between and changes within players were
determined through appropriate statistical modelling.
Data Source
Performance test data for 1161 players was downloaded from the Performance Profiler
Database (NZRU Version 7, Profiler Corporation, New Zealand). The Performance
Profiler Database contains results from performance tests, conducted by various people,
on all regional representative and professional players in New Zealand. Data were only
entered into the database if the test was performed under the stipulated New Zealand
Rugby Union testing procedures (see below). Data on body composition, strength,
power, speed, and repeated sprint ability from the beginning of the Super 12 pre-season
2004 (1 December 2003) through to the conclusion of the international end of year tour
(World Cup) 2007 (25 November 2007) was downloaded from the database. Each of the
four years included in the analysis were divided into specific phases of the year, which
included the pre-season training periods and the competition phases of the respective
competitions. The professional Super Rugby season running from the beginning of
December the previous year through to May; the mid-year international competition

54
from May to August; the semi-professional national provincial competition from July to
October; and, the international end of year competition from October to the end of
November.
Informed consent for each player was obtained through the player registration form each
player must sign at the beginning of each rugby season. The form stipulates that any
data collected from the player may be used at the discretion of the New Zealand Rugby
Union for research or data analysis purposes. The study was approved by the Auckland
University of Technology Ethics Committee.
Procedure
BODY COMPOSITION
Anthropometric measurements included body mass and sum of eight skinfolds (bicep,
triceps, subscapular, abdominal, supraspinale, iliac crest, front thigh and medial calf).
Body mass was measured on calibrated scales and each skinfold site was located and
measured as per the International Society for the Advancement of Kinanthropometry
(ISAK) guidelines (Norton et al., 2004). Percentage body fat was calculated from
estimated body density (Withers, Laforgia, Heymsfield, Wang, & Pillans, 2004) using
the equation derived from Siri (1961). Fat free mass was calculated from the player’s
body mass and calculated body fat (Fat free mass = body mass – (body mass *
percentage body fat/100)) (Slater et al., 2006).
STRENGTH AND POWER
One repetition maximum was calculated for a series of resistance training exercises
from a two to six repetition maximum lift using the formula derived by Landers (1985).
The strength exercises included bench-press, box-squat, back-squat and chin-ups; while

55
the power-clean was used to indicate full body power. Each exercise was assessed for
correct technique by a trained strength coach and only repetitions performed unassisted
with correct technique were recorded.
When performing the bench-press the feet were to remain in contact with the floor and
the buttocks and lower back had to remain in contact with the bench throughout the lift.
During the lift the bar was to be lowered to the chest (with elbows at approximately 90°
and not bouncing off the chest) and returned to the start position where elbows were to
be fully extended, but not locked. Each player used a self-selected hand position. The
back-squat required the player to descend in a controlled manner until the top of the
thighs were parallel with the floor before returning to the standing position. The box-
squat was performed in a similar manner however the player was instructed to pause
briefly in the seated position on a box where the thighs were parallel with the floor.
Players used a self selected foot position and powerlifting belts were not used during the
lifts. When performing the chin-ups a reverse underhand grip (palms facing towards
face) was used. Players were instructed to start from a stationary position with arms
fully extended and complete a repetition with the chin moving over the bar (Argus et al.,
2009; Beaven, Gill, Ingram, & Hopkins, 2011). The power-clean required the player to
set up in a crotched position over the bar on the floor with fully extended arms. From
this position, the player was instructed to thrust upwards in a triple extension
movement, pulling the barbell upwards into the catch position on the front of the
shoulders with elbows forward (Baker & Nance, 1999b). Between repetitions the player
must have stayed connected with the bar.

56
SPEED
All sprints (both speed and repeated sprint) were performed on grass; however a
synthetic grass mat covering 1.5-m behind and 3.5-m in front of the first timing gate
(securely pegged at each corner) was laid to assist with traction. All sprints were
performed in footwear that was appropriate for the conditions and those used during
rugby matches (moulded soles for firm and hard ground, football boots for softer
ground). The players were instructed to sprint maximally for every repetition within the
lane formed by the Swift (Swift Performance Equipment, NSW, Australia) or Smart
Speed (Fusion Sport, Queensland, Australia) electronic timing gates, which was
approximately 2-m wide. Players started each sprint with their foot on a line 50 cm from
the light beam of the first timing gate, in a stationary upright position, with no rocking
back or forth prior to starting.
Each player performed two repetitions over 20 m for forwards and half backs and 30 m
for backs. For each repetition the time to complete the total distance (20 m or 30 m) and
the time to cover the first 10 m of each sprint was recorded, with the fastest overall time
recorded. Each of the two efforts was performed after at least 2-min rest from the
previous repetition.
REPEATED SPRINT ABILITY
Repeated sprint ability was tested using the Rugby-Specific Repeated-Speed (RS2) Test.
The first component of the test is a measure of speed and is performed as described
above. The speed component allows a comparison of effort to be made between the
sprints performed during the repeated sprint component of the RS2 test. Five minutes
after completing the speed component, the repeated sprint component was performed.
The repeated sprint component consists of three sets of three or four individual sprints

57
performed maximally at set time intervals. Each set of sprints is separated by periods of
standardised work where the players jog with a weighted bag (PowerBagTM
, SPSS,
Christchurch, New Zealand) over their shoulders and perform down and ups (get down
off feet into a prone position on the ground – chest and chin was required to touch the
ground – and then return to feet), also at set time intervals (Figure 3). Players repeated
sprints were measured using electronic timing gates over the same distance as speed (30
m for backs and 20 m for forwards and half backs); however, only the time to complete
the total distance was recorded.
Two groups of three forwards (6 total) or four backs (8 total) were able to perform the
repeated sprint component at one time. The master timer started a stopwatch and sent
individual players off at 10-s intervals. The master timer started the players by counting
down the time left before the start of the next repetition of work from 5-s (i.e. 5; 4; 3; 2;
1; GO!). During the periods of standardised work, the master timer was required to
countdown for all the players as in some instances all subjects were performing some
form of work at the same time.
Forwards
The forwards (including the half backs) were required to sprint four times over 20 m,
sprinting through the timing gates, decelerating to a cone a further 10 m away. They
then jogged back towards the timing gates (total distance decelerating/jogging = 20 m)
and upon reaching the gates walked back to the start line outside the running lane (total
distance walking = 20 m). Each sprint repetition was performed on a 30-s turnaround.
After completing four sprints (at master time 2 min) the player moved to the side of the
running lane and performed the standardised work. The player was required to pick up
the 30-kg PowerBagTM
and place it on their shoulder or behind their neck. On the GO

58
Figure 3: The repeated sprint component of the Rugby-Specific Repeated-Speed (RS2) test (a). Three sets
of repeated sprinting, jogging and walking 20 m for the forwards (b) and 30 m for the backs (c) are
performed at set time intervals and interspersed with PowerBagTM
shuttles using a 30-kg weighted
PowerBagTM
, also performed at set time intervals (d).
b)
10 m
10 m
10 m
= Timing Light Gates = Cones
KEY:
= Sprint = Jog = Walk
10 m
15 m
20 m
c)
Forwards
4 x 20-m Sprints @ 30 s
Backs
3 x 30-m Sprints @ 40 s
Forwards
5 x PowerBagTM
Sets
Backs
4 x PowerBagTM
Sets
Forwards
4 x 20-m Sprints @ 30 s
Backs
3 x 30-m Sprints @ 40 s
Forwards
4 x 20-m Sprints @ 30 s
Backs
3 x 30-m Sprints @ 40 s
Forwards
5 x PowerBagTM
Sets
Backs
4 x PowerBagTM
Sets a)
20-m PowerBagTM
Jog @ 10 s
Down & Up &
20-m PowerBagTM
Jog @ 10 s
d)

59
command they had 10 s to carry it 20 m and drop the PowerBagTM
at the end. On a 10-s
turnaround the player performed a down and up (get down off feet into a prone position
on the ground - chest must touch the PowerBagTM
– and then return to feet) before
picking up the PowerBagTM
and jogging with it for 20 m back to the start line. The
players were to keep the bag on their shoulders before repeating the up and back shuttle.
The standardised work sequence was performed a total of five times. After a 20-s rest
(at master time 4 min) the player repeated the previous sprint and standardised work
protocol. Upon completion of the second period of standardised work, the players
completed the final set of four sprints. A total of 12 sprints was therefore performed
over a period of 9 min 30 s.
Backs
The backs (not including the half backs) were required to sprint three times over 30 m,
sprinting through the timing gates decelerating to a cone a further 15 m away. They then
jogged back towards the timing gates (total distance decelerating/jogging = 30 m) and
upon reaching the gates walked back to the start line outside the running lane (total
distance walking = 30 m). Each sprint repetition was performed on a 40-s turnaround.
Upon completing three sprints (at master time 2 min) the player moved to the side of the
running lane and performed the standardised work shuttles. The PowerBagTM
sequence
explained in the forwards protocol was performed four times. After a 30-s rest (at
master time 4 min) the player repeated the previous sprint and standardised work
protocol. After completing the second period of standardised work, the player
completed the final set of three sprints. A total of nine sprints were therefore performed
over a period of 9 min 20 s.

60
Performance Variables for the RS2test
Measures of performance derived from the RS2 test were: the mean time per sprint;
fatigue (calculated as a percent change in sprint time predicted from the linearised
change derived from all sprints performed), and; mean of 12 vs 20-m for forwards and
mean of 9 vs 30-m for backs (the percent difference between the mean time per sprint
and the corresponding sprint time performed during the first component of the RS2 test).
Statistical Analysis
Players were identified and grouped according to their playing position (props, hookers,
locks, loose forwards, inside backs, centres, outside backs) and competitive level at time
of test (international, Super Rugby, provincial, and players not selected for provincial).
The mixed modelling procedure (Proc Mixed) in the Statistical Analysis System
(Version 9.2, SAS Institute, Cary, NC) was used to determine the differences between
positions, playing level and year of fitness test. The differences between levels were
adjusted to 2007, the last year of the data and year with the most data. The fixed effects
were the highest playing level achieved in each year and the interaction of this variable
with the year of test (as a linear numeric variable, to estimate a different progression
within each level). The random effects were the identity of the player (to estimate
consistent differences between players), the interaction of player identity and year (to
estimate within-player variation between years), and the residual (representing variation
within-player for any tests repeated within a year). A similar model was used in the
analysis of the changes within players between different competition periods during the
same year. The fixed effects were the year of competition (as a nominal variable, to
adjust for any consistent changes between years) and the level of competition at the time
of the test (to estimate consistent changes as players move between competition periods
within the same year). The random effects were the same as the previous model.

61
Mechanistic inferences about magnitudes of effects were based on acceptable
uncertainty in the effect estimates (Hopkins, Marshall, Batterham, & Hanin, 2009).
Uncertainty was defined by confidence intervals, with a 99% level chosen to reduce the
error rate for clear outcomes. Differences between and changes within players were
standardised and assessed for magnitude using a modified Cohen scale: <0.2 = trivial,
0.2 - 0.59 = small, 0.6 - 1.19 = moderate, 1.2 – 1.99 = large, >2.0 = very large (Hopkins
et al., 2009).
Results
Differences between Positions
The mean performance and anthropometrical outcomes for each positional group are
summarised in table 3. Mean performance in speed, body composition, strength and
power showed the expected differences between positional groups. Outside backs had
the fastest 10 m, 20 m and 30 m sprint time and their differences between other
positions ranged from small (0.02 s with centres over 10 m) to very large (0.32 s with
props over 20 m). Trends showed a linear decrease in speed time as the positional
number increased (props jersey number 1, through to fullback (outside back) jersey
number 15). Props were the heaviest, and had the largest skinfold thickness, percent
body fat, and fat free mass. In a similar trend to speed, skinfold thickness and percent
body fat linearly decreased as positional number increased. Differences between
positions in strength and power were highly varied and dependent upon the exercise
performed. Trivial to small differences in bench-press (9 kg), box-squat (0 kg), and
back-squat (9 kg) 1RM were found between the front row positions (props and
hookers). However, when the front row positions were compared to other positions
differences were small to large. Differences between the inside backs (half backs) and

62
Table 3: Mean ± coefficient of variation (%) of physical performance and anthropometric tests in rugby union players, calculated with equal
contribution from level of player (amateur, semi-professional and professional) and year of test (2004 to 2007), separated into positional groups.
Props
n = 143
Hookers
n = 85
Locks
n = 121
Loose
Forwards
n = 207
Insides
n = 212
Centres
n = 58
Outside Backs
n = 172
10-m sprint (s) 1.85 ± 4.7 1.81 ± 4.1 1.79 ± 4.7 1.76 ± 4.5 1.72 ± 4.0 1.70 ± 4.0 1.68 ± 4.4
20-m sprint (s) 3.21 ± 4.4 3.14 ± 3.7 3.13 ± 4.2 3.06 ± 4.4 2.96 ± 3.5 2.95 ± 4.6 2.89 ± 3.3
30-m sprint (s) 4.14 ± 4.1 4.12 ± 4.2 4.11 ± 3.9
Body mass (kg) 113.5 ± 8.1 104.9 ± 6.4 109.4 ± 7.6 101.6 ± 7.9 88.8 ± 9.2 94.1 ± 6.3 89.2 ± 9.0
Skinfold thicknessb (mm) 114 ± 26 102 ± 26 88 ± 29 84 ± 30 74 ± 35 74 ± 26 65 ± 25
Percent body fat (%) 16.1 ± 26 14.5 ± 25 12.7 ± 29 12.1 ± 28 10.7 ± 32 10.6 ± 24 9.4 ± 23
Fat free mass (kg) 94.4 ± 7.9 88.5 ± 6.2 95.0 ± 6.4 88.9 ± 7.0 78.8 ± 8.2 83.9 ± 6.3 80.8 ± 8.6
Bench-press 1RM (kg) 133 ± 18 124 ± 17 121 ± 17 119 ± 16 111 ± 16 113 ± 15 109 ± 16
Box-squat 1RM (kg) 185 ± 19 185 ± 25 157 ± 21 169 ± 26 155 ± 20 163 ± 23 157 ± 20
Back-squat 1RM (kg) 184 ± 19 175 ± 20 141 ± 21 161 ± 21 141 ± 20 151 ± 17 145 ± 24
Chin-ups 1RM (kg) 140 ± 10 137 ± 9 139 ± 11 132 ± 11 123 ± 11 127 ± 9 123 ± 11
Power-clean 1RM (kg) 102 ± 14 101 ± 14 103 ± 17 98 ± 18 91 ± 16 93 ± 15 91 ± 20
Mean of 12 sprintsc (s) 3.44 ± 5.5 3.35 ± 4.0 3.31 ± 4.5 3.23 ± 4.6 3.11 ± 3.7
a
Mean of 9 sprintsc (s) 4.30 ± 4.0 4.33 ± 4.9 4.25 ± 4.0
Forwards fatiguedf
(%) 3.9 ± 5.1 4.6 ± 3.9 3.0 ± 4.1 3.8 ± 4.7 2.3 ± 3.6a
Backs fatiguedf
(%) 3.1 ± 3.7 4.9 ± 5.1 4.1 ± 4.6
Mean of 12 vs 20-mef
(%) 7.4 ± 4.1 7.0 ± 3.1 6.4 ± 2.9 5.9 ± 3.3 4.8 ± 3.1a
Mean of 9 vs 30-mef
(%) 4.8 ± 2.8 5.9 ± 3.8 5.9 ± 3.4
aHalf backs performed forwards protocol.
bSum of 8 skinfolds.
cMean time for sprints performed in Rugby-Specific Repeated-Speed test.
dFatigue for the Rugby-Specific Repeated-Speed test.
eThe percent difference in time between the mean time and sprint time in the Rugby-Specific Repeated-Speed test.
fData expressed as mean ± SD.

63
Table 4: Mean differences (%); ±99% confidence limits in physical performance and anthropometry between rugby union players of different playing levels in the
2007 year within forwards and backs positional groups.
Forwards Backs
Provincial –
Not selected
Super Rugby
– Provincial
International –
Super Rugby
International –
Provincial
Provincial –
Not selected
Super Rugby –
Provincial
International –
Super Rugby
International –
Provincial
10-m sprint 0.8; ±1.2O -0.7; ±1.4
O -0.6; ±2.3 -2.1; ±2.3* -2.2; ±1.2* -3.7; ±1.4** -1.9; ±2.0* -3.4; ±2.0**
20-m sprint 1.1; ±1.2* 0.1; ±1.4O -1.9; ±2.1* -2.1; ±2.2* -2.4; ±1.7** -4.5; ±1.7** -2.2; ±2.2* -4.3; ±2.2**
30-m sprint -2.1; ±1.4* -1.9; ±1.5* -2.8; ±2.1** -2.6; ±2.2**
Body mass 2.3; ±1.6* 3.6; ±1.9* 0.2; ±2.0 1.4; ±2.4O 2.3; ±1.6* 2.9; ±1.9* -0.5; ±2.0
O 0.1; ±2.4
Skinfold thickness -2.7; ±5.9O -7.7; ±6.4 -0.9; ±8.2 -5.9; ±8.7* -9.7; ±5.5* -11.3; ±6.2* -6.5; ±7.7* -8.2; ±8.7*
Percent body fat -3.6; ±5.6O -8.8; ±6.1* -1.2; ±7.8 -6.6; ±8.3* -9.6; ±5.3* -12.6; ±5.8* -6.1; ±7.4* -9.1; ±8.1*
Fat free mass 3.1; ±1.4* 5.2; ±1.7** 0.0; ±1.8O 2.1; ±2.1* 3.1; ±1.5* 4.1; ±1.7 0.0; ±1.7
O 1.0; ±2.1
O
Bench-press 1RM 8.5; ±3.9* 13.3; ±4.8** 0.4; ±6.6 4.9; ±7.4* 11.3; ±4.4** 13.0; ±5.3** -0.4; ±7.2 1.2; ±7.7
Box-squat 1RM 6.2; ±9.6* 10.5; ±10.6* 7.5; ±18.0 11.8; ±19.4 8.9; ±9.9* 1.0; ±9.2 -1.8; ±15.4 -8.9; ±14.6
Back-squat 1RM 11.1; ±7.4* 7.7; ±8.2* 1.4; ±12.5 -1.7; ±12.1 14.0; ±7.9** 6.7; ±8.9* -0.2; ±16.1 -6.6; ±14.5
Chin-ups 1RM 8.2; ±3.1** 10.3; ±3.5** 6.3; ±7.7** 8.3; ±7.9** 4.9; ±3.4* 5.6; ±4.0* 0.7; ±6.8 1.4; ±7.0
Power-clean 1RM 7.2; ±5.9* 12.0; ±6.5** 7.7; ±9.6* 12.5; ±10.3** 9.9; ±7.7* 15.2; ±8.6** 1.5; ±11.2 6.4; ±11.9
Mean of 12 sprints 0.2; ±1.8 -0.7; ±2.0 -1.6; ±2.8 -2.6; ±2.8* -3.5; ±4.1** -7.0; ±4.3*** -3.1; ±6.0 -6.7; ±5.9***
Mean of 9 sprints -1.7; ±1.1* -1.8; ±1.9* -3.2; ±2.5** -3.3; ±2.6**
Forwards fatigue -1.8; ±1.5* -2.0; ±1.6* 1.1; ±2.3 0.9; ±2.3 -3.2; ±3.1** -4.2; ±3.3** -0.8; ±4.8 -1.8; ±4.7
Backs fatigue -0.1; ±1.9 -0.4; ±2.0 2.4; ±3.1* 2.0; ±3.0
Mean of 12 vs 20-m -0.4; ±1.2 -0.7; ±1.3O 0.0; ±1.9 -0.2; ±1.9 -3.0; ±2.6** -4.4; ±2.8*** 0.6; ±4.1 -0.8; ±4.0
Mean of 9 vs 30-m 0.7; ±1.4 0.2; ±1.6 0.4; ±2.2 -0.1; ±2.2
O trivial difference; * small difference; ** moderate difference; *** large difference; all other differences were unclear.
A negative value indicates a greater value for the lower playing level (stated second).

64
Table 5: Average annual changes (%); ±99% confidence limits in physical performance or anthropometry in rugby union players between 2004 and 2007,
within different playing levels for forwards and backs.
Forwards Backs
Not
selected
Provincial Super Rugby International Not selected Provincial Super Rugby International
10-m sprinta -0.1; ±1.0
O 1.4; ±1.1* -0.6; ±1.1
O -0.9; ±1.9 1.0; ±1.1* 1.4; ±1.1* 0.4; ±1.0
O -1.4; ±1.6*
20-m sprinta -0.6; ±1.1
O 1.5; ±1.1* 0.1; ±1.0
O -0.9; ±1.8
O 1.5; ±1.9* 1.3; ±2.0* 0.4; ±1.5 -1.0; ±1.8
30-m sprinta 1.1; ±1.5* 0.8; ±1.1* 1.2; ±1.0* -1.9; ±1.6*
Body mass 1.1; ±0.8O 1.0; ±0.7
O 0.7; ±0.6
O 0.5; ±0.8
O 0.2; ±0.7
O 0.9; ±0.8
O 0.9; ±0.6
O 0.4; ±0.7
O
Skinfold thickness 2.2; ±3.0O 3.2; ±3.1
O 0.4; ±2.2
O -0.2; ±3.3
O 0.8; ±3.0
O 1.5; ±3.3
O 1.2; ±2.5
O -1.2; ±2.9
O
Percent body fat 2.5; ±2.9O 3.5; ±3.0
O 1.0; ±2.1
O 0.1; ±3.1
O 1.3; ±2.9
O 2.0; ±3.1
O 1.2; ±2.4
O -0.8; ±2.8
O
Fat free mass 0.9; ±0.7O 0.6; ±0.7
O 0.6; ±0.5
O 0.4; ±0.7
O 0.4; ±0.6
O 0.8; ±0.7
O 0.7; ±0.5
O 0.4; ±0.6
O
Bench-press 1RM 4.6; ±2.8* 5.0; ±2.3* 4.6; ±2.4* 3.5; ±5.0* 4.7; ±2.9* 8.4; ±3.2* 5.7; ±3.1* 5.3; ±5.3*
Box-squat 1RM 2.8; ±10.5 1.4; ±7.1 12.5; ±5.3* 15.3; ±20.1** 0.4; ±11.0 6.9; ±8.4* 8.8; ±7.4* 8.4; ±18.4
Back-squat 1RM 1.7; ±6.1 5.3; ±5.0* 5.2; ±6.3* 3.4; ±8.8 0.1; ±6.3 5.0; ±7.0* 10.3; ±7.9* 9.3; ±13.2*
Chin-ups 1RM 2.1; ±2.2* 2.4; ±2.1* 0.4; ±2.3O 5.5; ±6.6* 3.7; ±2.6* 3.9; ±2.9* 2.9; ±2.7* 4.0; ±5.7*
Power-clean 1RM 3.5; ±5.1* -1.5; ±4.5O
2.5; ±4.5 3.6; ±9.1 -3.7; ±6.9 2.1; ±5.9 1.8; ±4.7O 1.1; ±8.5
Mean of 12 sprint -1.9; ±1.7* 0.5; ±1.4O -0.2; ±1.3
O -0.6; ±2.5 1.7; ±4.1 1.0; ±4.0 -0.4; ±4.2 -0.2; ±5.8
Mean of 9 sprints 0.4; ±1.9 0.4; ±1.4 1.1; ±1.2* -1.5; ±2.2*
Forwards fatigueb -1.3; ±1.6* -1.3; ±1.3* 0.1; ±1.1 0.1; ±2.1 2.0; ±3.3 0.0; ±3.2 -1.6; ±3.5 -0.2; ±4.9
Backs fatigueb -1.5; ±2.2* -1.5; ±1.7* 0.5; ±1.7 2.8; ±3.2**
Mean of 12 vs 20-mc -1.5; ±1.2* -0.7; ±1.0
O 0.3; ±0.9
O 0.4; ±1.7 1.3; ±2.7 -0.8; ±2.6 -1.3; ±2.9 1.2; ±4.1
Mean of 9 vs 30-mc -1.9; ±1.6* -1.0; ±1.2 -0.4; ±1.1 1.0; ±2.1
O trivial change; *small change; **moderate change; all other changes were unclear.
aNegative value indicates a decrease in speed time (got faster).
bNegative value indicates a reduction in RS
2 fatigue (greater repeated sprint ability).
cNegative value indicates a mean time closer to sprint time (greater repeated sprint ability).
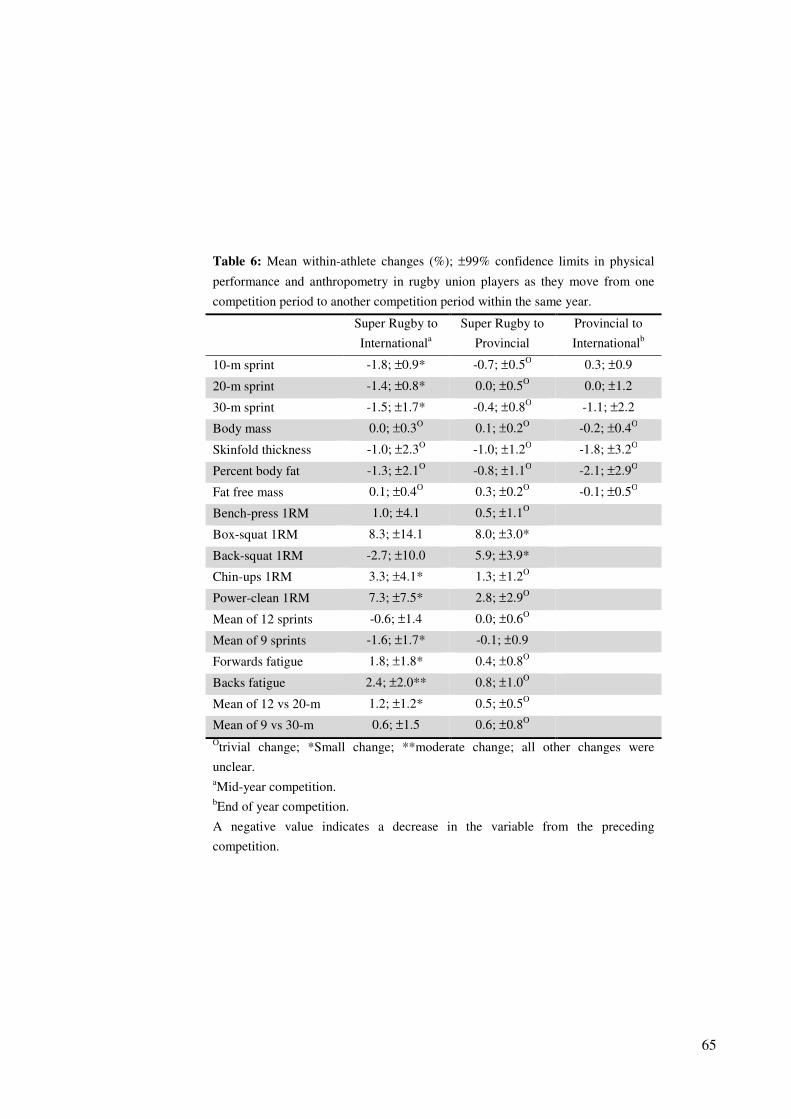
65
Table 6: Mean within-athlete changes (%); ±99% confidence limits in physical
performance and anthropometry in rugby union players as they move from one
competition period to another competition period within the same year.
Super Rugby to
Internationala
Super Rugby to
Provincial
Provincial to
Internationalb
10-m sprint -1.8; ±0.9* -0.7; ±0.5O 0.3; ±0.9
20-m sprint -1.4; ±0.8* 0.0; ±0.5O 0.0; ±1.2
30-m sprint -1.5; ±1.7* -0.4; ±0.8O -1.1; ±2.2
Body mass 0.0; ±0.3O 0.1; ±0.2
O -0.2; ±0.4
O
Skinfold thickness -1.0; ±2.3O -1.0; ±1.2
O -1.8; ±3.2
O
Percent body fat -1.3; ±2.1O -0.8; ±1.1
O -2.1; ±2.9
O
Fat free mass 0.1; ±0.4O 0.3; ±0.2
O -0.1; ±0.5
O
Bench-press 1RM 1.0; ±4.1 0.5; ±1.1O
Box-squat 1RM 8.3; ±14.1 8.0; ±3.0*
Back-squat 1RM -2.7; ±10.0 5.9; ±3.9*
Chin-ups 1RM 3.3; ±4.1* 1.3; ±1.2O
Power-clean 1RM 7.3; ±7.5* 2.8; ±2.9O
Mean of 12 sprints -0.6; ±1.4 0.0; ±0.6O
Mean of 9 sprints -1.6; ±1.7* -0.1; ±0.9
Forwards fatigue 1.8; ±1.8* 0.4; ±0.8O
Backs fatigue 2.4; ±2.0** 0.8; ±1.0O
Mean of 12 vs 20-m 1.2; ±1.2* 0.5; ±0.5O
Mean of 9 vs 30-m 0.6; ±1.5 0.6; ±0.8O
Otrivial change; *Small change; **moderate change; all other changes were
unclear. aMid-year competition.
bEnd of year competition.
A negative value indicates a decrease in the variable from the preceding
competition.

66
the forwards in the forwards RS2 test ranged from small (0.9% with loose forwards for
mean of 12 vs. fastest) to very large (0.33 s with props for mean of 12 sprints). Small
differences in the backs RS2 test occurred between the inside backs and outside backs
(all three RS2 test performance variables), centres and inside backs (backs fatigue) and
centres and outside backs (mean of 9 sprints).
Differences between Playing Levels
The percent differences between playing levels for forwards and backs are shown in
table 4. The differences between Super Rugby and provincial players were dependent
upon the positional group. The forwards had small (7.7%; 99% confidence limits ±8.2%
for back-squat 1RM) to moderate (13.3%; ±4.8% for bench-press 1RM) differences in
all strength and power measures; whereas the backs had small (1.9% ±1.5% for 30-m
sprint) to moderate (4.5%; ±1.7% for 20-m sprint) differences in all speed measures.
Few performance variables showed clear differences between Super Rugby and
international players. The only difference of substantial magnitude within both the
forwards and backs between international and Super Rugby players was the small
difference in 20-m sprint (1.9%; ±2.1% for forwards and 2.2%; ±2.2% for backs).
Differences between Years
The mean annual changes in performance within each level for forwards and backs, is
shown in table 5. All anthropometrical measures showed trivial changes across all levels
in both forwards and backs. All levels and positions showed small increases in bench-
press 1RM, and all except Super rugby forwards showed small increases in chin-ups
1RM. Similarly all levels, except the players not selected, showed small to moderate
increases in lower body strength (either back-squat 1RM, box-squat 1RM, or both). The
lower level players (not selected and provincial) appeared to improve more in the RS2
67
test (both forwards and backs) compared to the higher level players. Specifically, small
decreases were observed in both forwards and backs fatigue (range 1.3% - 1.5%) and
small decreases were observed in mean of 12 vs 20-m and mean of 9 vs 30-m (range
0.7% - 1.9%), indicating a better maintenance of maximal sprint performance.
Changes within Players
Mean changes within player’s performance as they moved from one competition period
to another during the year is displayed in table 6. Small increases occurred in box-squat
(8.0%; ±3.0%) and back-squat (5.9%; ±3.9%) 1RM as players moved from Super
Rugby to the provincial competition. Small decreases in all the speed times (range 1.4%
- 1.8%) and small increases in chin-ups (3.3%; ±2.6%) and power-clean (7.3%; ±4.8%)
1RM occurred as players moved from Super Rugby to the international mid-year
competition.
Discussion
Previous studies of the physical characteristics of players, not only in rugby union but
also rugby league, have typically had small sample sizes which are tested on one or two
occasions (Casagrande & Viviani, 1993; Duthie et al., 2006b; Gabbett, 2002b; Gabbett,
2005b; Holway & Garavaglia, 2009; Maud, 1983; Maud & Shultz, 1984; Quarrie et al.,
1996; Quarrie et al., 1995). The present study is the first to utilise a sample size of such
a large magnitude (over 1100) with numerous repeated measurements in a wide variety
of physical characteristics over a long period of time. The statistical power the large
number of observations has provided, enabled the use of narrow confidence intervals
(99%), increasing the certainty of the clear outcomes reported.

68
Differences between Positions
Forwards were generally heavier, had greater skinfold thickness, percentage body fat
and fat free mass than backs; with props the heaviest and the strongest. The outside
backs were the fastest over all measured sprint distances, and the half backs and first
five eights showed the lowest fatigue in both the forwards and backs RS2 tests
respectively. The findings are consistent with those studies that have previously
investigated the anthropometrical characteristics in rugby players (Bell, 1979; Bell,
1980; Carlson et al., 1994; Casagrande & Viviani, 1993; Duthie et al., 2006b; Holway
& Garavaglia, 2009; Maud, 1983; Maud & Shultz, 1984; Quarrie et al., 1996; Quarrie et
al., 1995; Quarrie & Hopkins, 2007). Props are generally the largest of the positions in
order to contest the ruck, maul and scrum situations to win or maintain possession of the
ball. The inside backs are generally the smallest in order to be mobile around the field
and agile around the scrum, ruck and maul (Duthie et al., 2003; Holway & Garavaglia,
2009; Quarrie et al., 1996). Interestingly, the players in the current study were more
than 10-kg heavier than Senior A players (Quarrie et al., 1995) and up to 15-kg heavier
than players in early studies on the United States national team (Maud & Shultz, 1984).
The mass of players are more comparable to recent studies published on professional
Super 12 players (Argus et al., 2009; Duthie et al., 2006b). The large difference
highlights the rate at which the physique of rugby players is increasing, which may be a
result of greater training loads and enhanced nutritional and recovery strategies that has
accompanied professionalism.
Speed characteristics of the players in the present study are similar to those previously
reported in rugby union. Indeed, backs have been shown to be faster over distances
greater than 30 m than forwards, with outside backs the fastest (Carlson et al., 1994;
Quarrie et al., 1996; Quarrie et al., 1995). Differences in strength assessments on rugby

69
players however, make direct comparisons with other studies difficult. Nonetheless,
when compared to a small sample of Super 14 players and professional rugby league
players, the players in the present study have lower power-clean 1RM; props are the
only comparable position in bench-press 1RM; and, the hookers, props and loose
forwards have greater back-squat and box-squat 1RM (Argus et al., 2010; Baker, 2001a;
Baker & Nance, 1999b).
Few studies have specifically investigated the repeated sprint ability of rugby players.
Furthermore, the novel protocol utilised in the current study makes it difficult to
compare to studies of other team sports. Due to the importance of the anaerobic energy
supply for the repeated sprints performed during matches, further research is required
specifically utilising tests similar in nature to the RS2 test employed in the present study
(Duthie et al., 2003). The RS2 test replicates the distances and work to rest ratios of
matches, and although is more time consuming to implement than a multistage shuttle
test, can be used to assesses specific qualities of rugby union performance (Duthie et al.,
2003).
Differences between Playing Levels
It appears that as playing level increases, players are faster, heavier, have greater fat free
mass, lower skinfold thickness and percent body fat; and have greater strength and
power. These results reinforce findings from previous studies illustrating level-specific
fitness and physique characteristics that can distinguish between semi-professional and
professional players in rugby and rugby league (Baker, 2001a; Quarrie et al., 1995). The
differences between playing levels could be due to a greater training history and an
increased requirement of strength and size within the professional game (Baker, 2001a;
Duthie et al., 2003).

70
The increased physical capacity as playing level increases only appears to occur up to a
certain level. A large number of trivial differences occurred between Super Rugby and
international players in mass, and strength in both the forwards and backs. The lack of
consistent differences indicates that selection into the higher international level squad
may not be determined by physical attributes as much as lower levels. Alternatively,
international players may be selected due to greater skill and experience compared to
Super Rugby players (Gabbett, 2002a). The international players also compete within
the Super Rugby competition, and the time between the conclusion of the Super Rugby
competition and the beginning of the international mid-year competition is negligible.
Therefore, a combination of inadequate preparation time and a greater number of high-
intensity matches may minimise the international players’ ability to train in order make
increased physical gains over other Super Rugby players.
Differences between Years
There were trivial increases in the average annual change of all anthropometrical
variables over the period in which data was obtained. Similarly, Duthie et al. (2006b)
reported trivial changes in mass over three years and small increases in sum of skinfolds
in the third year of being involved in a Super 12 squad. The data from the current study
indicate minimal year to year changes in body composition, but does not discount
substantial longitudinal changes from 2004 to 2007; following previous trends of
players becoming heavier with greater fat free mass (Olds, 2001; Quarrie & Hopkins,
2007).
There were small to moderate annual increases in both upper and lower body strength.
Interestingly, the Super Rugby and international players (all professional players) were
able to increase strength up to 15% per year, indicating changes can still be made at

71
higher playing levels. The moderate increases may be due to the improving
professionalism of the players. Increased emphasis on physical enhancement strategies
such as specific training techniques, nutrition and recovery, may have allowed the
attainment of greater resistance training volumes and decreased injury rates, allowing
players to train more regularly (Gabbett, 2005a; Gabbett, 2005c)
The greater improvement in the RS2 test by the lower level players may be due to their
lower physical capacity as a result of a younger training age (Gabbett, 2005c). Indeed,
there were small to large differences between Super Rugby and provincial players, and
between international and provincial players in all three RS2 test variables. The law of
diminishing returns suggests that the rate of improvement in a player’s fitness is
inversely proportional to their initial level of fitness (Duthie, 2006). Therefore, higher
level players in this study with greater repeated sprint ability have limited scope for
improvements in performance compared to provincial players and those not selected.
Changes within Players
Rugby in New Zealand is unique in that a player may play up to four different
competitions during four distinct periods within a year. Due to this unique situation,
very little research has investigated the players change in physical performance between
respective competitions. The current study is the first that has specifically investigated
the changes in physical performance as players moved from different competitions.
As the players moved from the Super Rugby to provincial competition, they had small
increases in lower body strength. Furthermore, as players moved from Super Rugby to
the international mid-year competition, they had small increases in chin-ups and power-
clean 1RM, as well as small decreases in sprint time over all distances. The results show

72
that the Super Rugby competition does not allow a player to achieve optimal
performance in aspects of strength, power and speed compared to other competition
periods during the year. The Super Rugby competition has potentially higher match
intensity than the provincial competition and is performed over three continents (New
Zealand, Australia and South Africa), requiring a large amount of travel between the
weekly matches. Furthermore, conditioning strategies employed by team management
will be specific to the requirements of their own team and their schedule exclusively
within the Super Rugby competition. A combination of these factors may contribute to
the decrease in training load that has been shown from pre-season to in-season in Super
Rugby players (Argus et al., 2009). The reduction in training load may therefore not
provide adequate stimulus for the achievement of high levels of physical performance
during the competition compared to other competition periods. However, increasing
training load in-season in order to achieve higher levels of physical performance may
not be appropriate. Increased training loads have been related to higher injury rates in
rugby league players (Gabbett & Domrow, 2007), while it is unknown whether
increases in training load, in conjunction with high game loads, will allow the players to
recover effectively for optimal performance during matches (Argus et al., 2009).
Practical Applications
The present study is the first to use longitudinal data to describe the between-player
differences and within-player changes in physical performance in rugby union players.
The data has provided normative profiles for different positions, multiple playing levels,
as well as the expected long-term improvements in physical performance. Data such as
these will inform coaches, so that they have better understanding of what should be
expected and what could be achieved with a rugby player over a long period of time.
The novel aspect of the study was the physical changes within players from one

73
competition to another. The information should help coaches develop strategies, such as
more specific periodisation and recovery, to improve the decrements in performance
during specific times of the year.

74
CHAPTER FIVE: GAME
BEHAVIOURS & PHYSICAL
CHARACTERISTICS

75
Study Two – The relationship between physical fitness and game behaviours in
rugby union players
Abstract
The physical preparation of team sport athletes should reflect the degree to which each
component of fitness is relied upon in competition. The aim of the study was therefore
to establish the relationship between fitness-test data and game behaviours known or
thought to be important for successful play in rugby union matches. Fitness-test
measures from 510 players were analysed with game statistics, from 296 games within
the 2007 and 2008 calendar years. Sprint times over 10, 20 and 30 m had moderate to
small negative correlations with line breaks (~0.26), metres advanced (~0.22), tackle
breaks (~0.16) and tries scored (~0.15). The average time of 12 repeated sprints and
percentage body fat in the forwards, and repeated sprint fatigue in the backs had
moderate to small correlations with a measure of activity rate on and around the ball
(-0.38, -0.17 and -0.17 respectively). These low correlations are partly due to uniformly
high physical fitness as a result of selection pressures at the elite level and leave room
for the identification of other key predictors. Nonetheless, physical conditioning
programmes should be adapted to reflect the importance of speed, repeated sprint ability
and body composition in the performance of key game behaviours during competition.

76
Introduction
The physical characteristics of rugby union players and the differences between
positions and playing levels are well documented. Forwards are typically heavier and
stronger than backs; while backs are faster and more agile than forwards (Quarrie et al.,
1996). The differences between positions are typically related to the differences in
certain tasks and roles performed during competition. Indeed, time motion analysis and
the use of global positioning systems have shown backs travel further, sprint longer and
more frequently and have lower work to rest ratios than the forwards (Cunniffe et al.,
2009; Deutsch et al., 2007; Duthie et al., 2005; Duthie et al., 2006; Roberts et al., 2008).
In conjunction with time-motion analysis, a parallel stream of research within rugby
union has been the use of notational analysis to quantify the physical and skill
requirements of competition. Notational analysis provides objective feedback of games
and players actions through the frequencies of key performance indicators (Eaves &
Hughes, 2003; Jones et al., 2004). Specifically, notational analysis has been used to
determine differences in playing patterns between teams and individuals (Eaves &
Hughes, 2003; Eaves et al., 2005; James, Mellalieu, & Jones, 2005; Prim et al., 2006),
changes in form of teams (Jones et al., 2008) and the basis for successful performance
(Jones et al., 2004). However, no studies have directly quantified the relationship
between physical characteristics and specific tasks performed in rugby union
competition.
The relationships between physical characteristics and playing experience, subjective
measures of playing ability and skill execution in drills simulating games have been
examined in rugby league and American football (Gabbett, 2009; Gabbett et al., 2007;
Gabbett & Ryan, 2009; Sawyer, Ostarello, Suess, & Dempsey, 2002). However, the

77
relevance of skill assessment in such simulations to game performance is uncertain
(Gabbett et al., 2007; Gabbett & Ryan, 2009). In contrast, a study by Young and Pryor
(2007) compared the physical characteristics of Australian Rules football players that
were grouped according to a high or low attainment of key performance indicators
within competition. It was found those players with more possessions, which is thought
to be an indicator of an effective player and not necessarily success, were significantly
shorter, lighter, faster and had a higher aerobic capacity compared to those with a lower
number of possessions.
Given the demands upon the professional athlete, the specificity of the physical
preparation should reflect the degree to which each component of fitness is relied upon
in competition. The New Zealand Rugby Union were in a position to commission an
investigation addressing this question due to the large quantity of physical characteristic
and game data available to them. Therefore, the primary aim of the current study was to
establish relationships between physical characteristics derived from field-based fitness
tests and game behaviours identified through game statistics.
Methods
Data Sources
Data for 510 players from the beginning of the Super 14 pre-season 2007 (December
2007) through to the conclusion of the 2008 All Blacks end of year international tour
(November 2008) were downloaded from the Performance Profiler Database (NZRU
Version 7, Profiler Corporation, New Zealand) and the TryMaker Pro computer
software package (Verusco Ltd, Palmerston North, NZ). The Performance Profiler
Database contains results from performance tests, conducted by various people, on all
regional representative and professional players in New Zealand. Data were only

78
entered into the database if the test was performed under the stipulated New Zealand
Rugby Union testing procedures (see below). Verusco provides a notational analysis of
each individual player for each game played at national championship level and higher.
Approximately 4000 activities ‘on and around the ball’ are coded per match. The
information is entered into a hierarchical database matrix, and includes the time of the
event, the location on the field, the player(s) involved, and various descriptors of the
event. All game statistics (from 296 games) and the physical characteristics of body
composition, strength, power, speed and repeated sprint ability were drawn from the
databases. All New Zealand registered players that played a game during this time at
national provincial, professional Super 14 and international level were included.
Informed consent for each player was obtained through the player registration form each
player must sign at the beginning of each rugby season. The form stipulates that any
data collected from the player may be used at the discretion of the New Zealand Rugby
Union for research or data analysis purposes. The study was approved by the Auckland
University of Technology Ethics Committee.
Physical Characteristics
BODY COMPOSITION
Anthropometric measurements included percentage body fat and fat free mass, which
were derived from body mass and sum of eight skinfold measurements (bicep, triceps,
subscapular, abdominal, supraspinale, iliac crest, front thigh and medial calf). Body
mass was measured on calibrated scales and each skinfold site was located and
measured as per the ISAK guidelines (Norton et al., 2004). Percentage body fat was
calculated from estimated body density (Withers et al., 2004) using the equation derived
from Siri (1961). Fat free mass was calculated from the player’s body mass and

79
calculated body fat (Fat free mass = body mass – (body mass * percentage body
fat/100)) (Slater et al., 2006).
STRENGTH AND POWER
One repetition maximum was calculated for a series of resistance training exercises
from a two to six repetition maximum lift using the formula derived by Landers (1985).
The strength exercises included bench-press, box-squat and chin-ups; while the power-
clean was used to indicate full body power. Each exercise was assessed for correct
technique by a trained strength coach and only repetitions performed unassisted with
correct technique were recorded.
When performing the bench-press the feet were to remain in contact with the floor and
the buttocks and lower back had to remain in contact with the bench throughout the lift.
During the lift the bar was to be lowered to the chest (with elbows at approximately 90°
and not bouncing off the chest) and returned to the start position where elbows were to
be fully extended, but not locked. Each player used a self-selected hand position. The
box-squat required the player to descend in a controlled manner onto a box and pause
briefly in the seated position before returning to the standing position. The box height
was adjusted so that when in the seated position the player’s thighs were parallel with
the floor. Players used a self selected foot position and powerlifting belts were not used
during the lifts. When performing the chin-ups a reverse underhand grip (palms facing
towards face) was used. Players were instructed to start from a stationary position with
arms fully extended and complete a repetition with the chin moving over the bar (Argus
et al., 2009; Beaven et al., 2011). The power-clean required the player to set up in a
crotched position over the bar on the floor with fully extended arms. From this position,
the player was instructed to thrust upwards in a triple extension movement, pulling the

80
barbell upwards into the catch position on the front of the shoulders with elbows
forward (Baker & Nance, 1999b). Between repetitions the player must have stayed
connected with the bar.
SPEED
All sprints (both speed and repeated sprint) were performed on grass; however a
synthetic grass mat covering 1.5 m behind and 3.5 m in front of the first timing gate
(securely pegged at each corner) was laid to assist with traction. All sprints were
performed in footwear that was appropriate for the conditions and those used during
rugby matches (moulded soles for firm and hard ground, football boots for softer
ground). The players were instructed to sprint maximally for every repetition within the
lane formed by the Swift (Swift Performance Equipment, NSW, Australia) or Smart
Speed (Fusion Sport, Queensland, Australia) electronic timing gates, which was
approximately 2-m wide. Players started each sprint with their foot on a line 50 cm from
the light beam of the first timing gate, in a stationary upright position, with no rocking
back or forth prior to starting.
Each player performed two repetitions over 20 m for forwards and half backs and 30 m
for backs. For each repetition the time to complete the total distance (20 m or 30 m) and
the time to cover the first 10 m of each sprint was recorded, with the fastest overall time
used in the analysis. Each of the two efforts was performed after at least 2-min rest from
the previous repetition.
REPEATED SPRINT ABILITY
Repeated sprint ability was tested using the Rugby-Specific Repeated-Speed (RS2) test.
The test consists of three sets of three or four individual sprints performed maximally at

81
set time intervals. Each set of sprints is separated by periods of standardised work where
the players jog with a weighted bag (PowerBagTM
, SPSS, Christchurch, New Zealand)
over their shoulders and perform down and ups (get down off feet into a prone position
on the ground - chest and chin was required to touch the ground - and then return to
feet), also at set time intervals (Figure 3). Players repeated sprints were measured using
electronic timing gates over the same distance as speed (30 m for backs and 20 m for
forwards and half backs); however, only the time to complete the total distance was
recorded.
Two groups of three forwards (6 total) or four backs (8 total) were able to perform the
test at one time. The master timer started a stopwatch and sent individual players off at
10-s intervals. The master timer started the players by counting down the time left
before the start of the next repetition of work from 5 s (i.e. 5; 4; 3; 2; 1; GO!). During
the periods of standardised work, the master timer was required to countdown for all the
players as in some instances all subjects were performing some form of work at the
same time.
Forwards
The forwards (including the half backs) were required to sprint four times over 20 m,
sprinting through the timing gates, decelerating to a cone a further 10 m away. They
then jogged back towards the timing gates (total distance decelerating/jogging = 20 m)
and upon reaching the gates walked back to the start line outside the running lane (total
distance walking = 20 m). Each sprint repetition was performed on a 30-s turnaround.
After completing four sprints (at master time 2 min) the player moved to the side of the
running lane and performed the standardised work. The player was required to pick up
the 30-kg PowerBagTM
and place it on their shoulder or behind their neck. On the GO

82
command they had 10 s to carry it 20 m and drop the PowerBagTM
at the end. On a 10-s
turnaround the player performed a down and up (get down off feet into a prone position
on the ground - chest must touch the PowerBagTM
- and then return to feet) before
picking up the PowerBagTM
and jogging with it for 20 m back to the start line. The
players were to keep the bag on their shoulders before repeating the up and back shuttle.
The standardised work sequence was performed a total of five times. After a 20-s rest
(at master time 4 min) the player repeated the previous sprint and standardised work
protocol. Upon completion of the second period of standardised work, the players
completed the final set of four sprints. A total of 12 sprints was therefore performed
over a period of 9 min 30 s.
Backs
The backs (not including the half backs) were required to sprint three times over 30 m,
sprinting through the timing gates decelerating to a cone a further 15 m away. They then
jogged back towards the timing gates (total distance decelerating/jogging = 30 m) and
upon reaching the gates walked back to the start line outside the running lane (total
distance walking = 30 m). Each sprint repetition was performed on a 40-s turnaround.
Upon completing three sprints (at master time 2 min) the player moved to the side of the
running lane and performed the standardised work shuttles. The PowerBagTM
sequence
explained in the forwards protocol was performed four times. After a 30-s rest (at
master time 4 min) the player repeated the previous sprint and standardised work
protocol. After completing the second period of standardised work, the player
completed the final set of three sprints. A total of nine sprints were therefore performed
over a period of 9 min 20 s.

83
Performance Variables for the RS2test
The mean time for the total number of sprints (expressed as mean of 12 sprints for the
forwards protocol and mean of 9 sprints for the backs protocol) was calculated.
Repeated sprint fatigue was calculated as the percent change in sprint time predicted
from the linearised change derived from all sprints performed (expressed as forwards
fatigue and backs fatigue).
Game Statistics
The operational definitions of the game statistics used for the analysis are included in
Table 7. The specific game statistics were deemed to be important for successful phase
play in competition (Jones et al., 2004; McKenzie, Holmyard, & Docherty, 1989; Prim
et al., 2006). Each of the selected game statistics were calculated for each individual
player and normalised to game time (Reported value = 80*(observed value/minutes
played). Game statistics data was only included in the analysis if the player had
respective physical characteristic data. In addition, to reduce the high random variation
in game statistics from players that come off the bench during the latter stages of the
game, only players with game time greater or equal to 10 minutes were included in the
analysis (James et al., 2005). This resulted in the sample being reduced to a minimum of
273 players for certain relationships.
Statistical Analysis
Players were grouped according to position (either back or forward). The half backs
were included in the backs group except when analysing speed and repeated sprint
ability, as they performed the forwards protocol. Between-player means and standard
deviations (SD) were determined for each physical characteristic and game statistic, and
within-player SD also calculated for the physical characteristics.

84
Table 7: Operational definitions of game statistics used in determining the relationship between game
statistics and physical characteristics in rugby union players.
Variable Definition
Line breaks Count of times a player running with ball breaks the line of defence.
Tackle breaks Count of occasions a tackle was made against them and was unsuccessful.
Advantage line made Count of times the player made advantage line (an imaginary line that runs
through the middle of previous breakdown).
Metres advanced (m) The total displacement travelled by the player with ball in hand. Half backs
excluded due to the large amount of backwards travelling with ball in hand.
Tries scored Number of tries scored by the individual.
Evasion Count of all running evasion events a player performs with the ball in hand.
Activity rate (tasks.min-1
) Count of any action that was performed by the player and coded, divided by
game time.
Attack 1st three Count of the player being in the first three support players to the ruck while
their team is attacking.
Defence 1st three Count of the player being in the first three support players to the ruck while
their team is defending.
Successful tackles (%) Percent of tackles made relative to total tackles attempted by a player.
Successful jackals (%) Percent of tackles made where the player is in a position to contest the ruck
immediately after the tackle, relative to the total number of tackles
attempted.
Turn overs Count of times a player turns over the ball to an offensive situation from a
defensive tackle.
Successful passes (%) Percent of passes made that successfully went to hand, relative to the total
number of passes attempted by the player.
Handling errors Count of handling errors incurred by the players - includes knock-ons,
forward passes and balls dropped behind which does not result in a penalty.

85
Correlation coefficients were calculated for selected combinations of game statistics and
physical characteristics using the Statistical Analysis System (Version 9.2, SAS
Institute, Cary NC). The combinations were specifically selected for fitness tests that
could have a plausible association with game behaviours. The correlations were
calculated using an approach that gave exponentially less weighting to games that were
played at later times after each performance test, as follows. For each player, an
observation was generated consisting of the player's value in the fitness test and a value
of the game statistic calculated from all subsequent games. The value of the game
statistic was a weighted mean derived with a weighting factor e-t/τ
, where t was the time
in weeks between the fitness test and the game, and τ (a time constant) was assigned a
chosen value (1, 4, 12 and 20 wk). The mean value of the weighting factor for all the
games in the given observation was then used as a weighting factor in the calculation of
the correlation for all the observations, so that the correlation were properly weighted
towards games closer to the tests. The entire analysis was repeated for each value of τ,
and the correlations are presented for the value of τ that gave the highest correlations.
The analysis was repeated for specific combinations of game statistics and physical
characteristics within selected positional groups and all playing levels. The magnitudes
of the correlation coefficients were interpreted with Cohen's scale: <0.1 = trivial, 0.1 -
0.3 = small, 0.3 – 0.5 = moderate, >0.5 = large (Cohen, 1988). Uncertainty in the
correlations was expressed as 90% confidence limits, estimated for the worst-case
scenario of a zero correlation (Hopkins, 2007).
Results
Means and between and within-player SD for physical characteristics and game
statistics are shown in tables 8 and 9; and the correlation coefficients are shown in
tables 10 and 11 for forwards and backs respectively. The correlations shown are those

86
from the 20-week time constant, as this tended to produce the strongest correlations and
allowed a fair representation of a players form; with 4.3 ± 3.0 (mean ± SD) games
associated with each fitness test. In comparison an average of 0.2 ± 0.3, 0.9 ± 1.1, and
2.8 ± 2.2 games were associated with each fitness test for the 1-week, 4-week and 12-
week time constants respectively.
Both the forwards and backs had small correlations between 10-m sprint time and line
breaks (-0.26 and -0.25 respectively), tackle breaks (-0.17 and -0.15 respectively),
metres advanced (-0.26 and -0.13 respectively) and tries scored (-0.14 and -0.12
respectively). The evasion game statistic showed moderate correlations with forwards
10-m and 20-m sprint times (-0.33 and -0.39 respectively) and small correlations with
the backs 10-m and 30-m sprint times (-0.20 and -0.25 respectively). Percent body fat
had small correlations with activity rate in both forwards (-0.17) and backs (0.10).
However, small correlations between percent body fat and successful tackles (-0.13),
successful jackals (-0.22), and handling errors (-0.28), were found only in the forwards.
The chin-ups 1RM had small correlations with turnovers for both the forwards and
backs (0.10 for both groups). Lower body strength however had little consistency
between forwards and backs in the pattern of the relationships. Measures of repeated
sprint ability had small to moderate correlations with activity rate (-0.17 with fatigue in
the backs and -0.38 with the mean of 12 sprints) and small correlations with tries scored
(-0.21 with fatigue in the backs and -0.24 with the mean of 12 sprints).
The loose forwards had small correlations between all three strength measures and
turnovers (0.15 for box-squat, 0.11 for bench-press, and 0.17 for chin-ups), and between
fatigue and first three on attack (-0.11) and defence (-0.15). The correlations were

87
Table 8: Between-player means ± standard deviations of
game statistics (n = 296 games) for national provincial,
professional and international level rugby union players over
the 2007 and 2008 seasons.
Forwards Backs
Line breaks 0.40 ± 0.93 1.61 ± 1.51
Tackle breaks 0.37 ± 0.95 0.61 ± 1.18
Advantage line made 2.3 ± 2.5 1.9 ± 2.0
Metres advanced (m) 34 ± 34 87 ± 52
Tries scored 0.13 ± 0.52 0.29 ± 0.70
Evasion 3.0 ± 3.5 7.4 ± 5.5
Activity rate (tasks.min-1
) 1.24 ± 0.46 1.48 ± 0.90
Attack 1st three 13.8 ± 8.5 6.0 ± 4.4
Defence 1st three 6.3 ± 5.3 2.4 ± 2.6
Successful tackles (%) 88 ± 14 80 ± 20
Successful jackals (%) 1.8 ± 5.9 1.3 ± 5.0
Turn overs 0.5 ± 1.1 0.5 ± 1.1
Successful passes (%) 80 ± 27 86 ± 19
Handling errors 1.5 ± 1.9 2.6 ± 2.7
For variables other than those expressed as percents, each
player’s value was scaled to 80 minutes of game time.

88
Table 9: Between-player means ± standard deviations (SD) and within-player standard
deviations (within SD) of physical characteristics for national provincial, professional
and international level rugby union players over the 2007 and 2008 seasons.
Forwards (n = 279) Backs (n = 231)
Mean ± SD Within SD Mean ± SD Within SD
10-m sprint (s) 1.78 ± 0.09a 0.05 1.69 ± 0.07 0.05
20-m sprint (s) 3.07 ± 0.14a 0.09
30-m sprint (s) 4.04 ± 0.14a 0.09
Mean sprint timeb (s) 4.27 ± 0.15
a
0.10
Mean sprint timec (s) 3.26 ± 0.20
a 0.09
Fatigued (%) 2.6 ± 4.2
a 3.4 2.8 ± 4.0 3.2
Power-clean 1RM (kg) 104 ± 14 9.6 95 ± 15 10.9
Box-squat 1RM (kg) 186 ± 35 24 168 ± 32 23
Bench-press 1RM (kg) 136 ± 19 10.5 125 ± 17 9.4
Chin-ups 1RM (kg) 144 ± 13 7.9 131 ± 13 7.8
Percent body fat (%) 14.0 ± 3.5 1.6 10.5 ± 2.5 1.2
Fat free mass (kg) 94.1 ± 6.2 2.0 83.1 ± 5.9 1.7
a Half backs included in forwards group due to participating in forwards specific
protocol. b Mean of 9 sprints in the Rugby-Specific Repeated-Speed test.
c Mean of 12 sprints in the Rugby-Specific Repeated-Speed test.
d Fatigue in the Rugby-Specific Repeated-Speed test.

89
Table 10: Correlation coefficients between physical characteristics and game statistics exponentially weighted with a time constant of 20-weeks for rugby
union forwards in games at all levels.
10-m
sprint
20-m
sprint
Mean of
12 sprints Fatigue
Power-
clean 1RM
Box-squat
1RM
Bench-
press 1RM
Chin-ups
1RM
Percent
body fat
Fat free
mass
Line breaks -0.26*
Tackle breaks -0.17* -0.12* 0.09
Advantage line made 0.00 0.02 0.05
Metres advanced -0.26* -0.32**
Tries scored -0.14* -0.17* -0.24* -0.02
Evasion -0.33** -0.39** -0.20* 0.05
Activity rate -0.38** -0.05 -0.17*
Attack 1st three -0.13* -0.05
Defence 1st three -0.04 -0.04
Successful tackles -0.13* -0.01 -0.11* -0.09 -0.13* -0.06
Successful jackals -0.21* 0.06 0.07 0.01 0.04 -0.22* -0.07
Turn overs -0.02 0.02 0.10*
Successful passes -0.10* 0.02 0.16*
Handling errors -0.07 -0.28**
Data shown are Pearson correlations derived from all tests on all 279 forwards; 90% confidence limits ± ≤0.10.
Correlations were calculated and are shown only for those game behaviours that could have any plausible association with fitness test performance.
*small correlation; **moderate correlation, all other correlations are trivial.

90
Table 11: Correlation coefficients between physical characteristics and game statistics exponentially weighted with a time constant of 20-weeks for rugby
union backs in games at all levels.
10-m
sprint
30-m
sprint
Mean of 9
sprints Fatigue
Power-
clean 1RM
Box-squat
1RM
Bench-
press 1RM
Chin-ups
1RM
Percent
body fat
Fat free
mass
Line breaks -0.25*
Tackle breaks -0.15* 0.01 -0.02
Advantage line made 0.03 -0.08 0.08
Metres advanced -0.13* -0.13*
Tries scored -0.12* -0.16* -0.09 0.21*
Evasion -0.20* -0.25* -0.02 -0.03
Activity rate -0.03 -0.17* 0.10*
Attack 1st three 0.10* -0.09
Defence 1st three 0.21* -0.09
Successful tackles -0.01 0.01 -0.08 -0.01 -0.04 0.00
Successful jackals -0.04 -0.02 0.04 0.04 0.07 0.00 -0.07
Turn overs 0.20* 0.15* 0.10*
Successful passes -0.05 -0.03 0.05
Handling errors -0.11* 0.04
Data shown are Pearson correlations derived from all tests on all 231 backs; 90% confidence limits ± ≤0.11.
Correlations were calculated and are shown only for those game behaviours that could have any plausible association with fitness test performance
*small correlation, all other correlations are trivial.

91
higher than those correlations when all forwards were analysed together as one group.
All other correlations were trivial or showed no greater correlation than that found in
either forwards or backs sub groups. Similarly, when players were analysed in separate
playing levels (provincial, professional Super rugby and international), correlations
showed magnitudes comparable to those when data were analysed irrespective of level.
Discussion
In the current study the aim to establish relationships between physical characteristics
derived from field-based fitness tests and game statistics deemed important for success
was achieved. Measures of speed were the most consistently correlated physical
characteristic with game statistics, specifically showing small to moderate correlations
with game statistics that involve periods of high-intensity running (e.g. metres
advanced, tries scored). Activity rate was correlated to percentage body fat and the
mean of 12 sprints in the forwards and fatigue in the backs; while measures of upper
body strength showed small correlations with turnovers in both forwards and backs.
The generally small correlations reported in the current study indicate that a large
proportion of the variance in game statistics is unexplained by differences in player
fitness or anthropometric characteristics. The low correlations however, do not
necessarily imply that these factors are unimportant for success in rugby. It is possible
that selection pressures have removed those players who do not have physical
characteristics that are close to the ideal by the time they reach provincial level. For
example, highly ectomorphic, slower or weaker players are probably less likely to be
selected for elite teams than their more mesomorphic, quicker or stronger counterparts.
Therefore much of the variability that exists in the characteristics of the playing
population as a whole would have already been removed, resulting in uniformly high

92
physical fitness at the elite level. The removal of this variation would be expected to
decrease the apparent size of the correlations observed between fitness test performance,
anthropometric characteristics, and game activities.
It is also possible that other predictors, which are yet to be identified, play a key role in
distinguishing the performance of one player from another at the elite level. A number
of game statistics used in the present investigation, such as tackles and turnovers are
reliant upon a high degree of technical and tactical proficiency. Factors such as
defensive alignment, body position, and point of contact are contributors to successful
tackles, which were not measured in the current fitness battery. Other factors such as
team dynamics, visual acuity, and reaction time are all thought to contribute to
individual playing performance during team ball sports and may further explain the on-
field game behaviours (Gabbett, 2009; Gabbett & Ryan, 2009; Hughes & Bartlett, 2002;
McKenzie et al., 1989; Sayers & Washington-King, 2005; Wheeler & Sayers, 2009).
Nonetheless, the numerous small to moderate correlations in such statistically powerful
data (n = 510 with numerous repeated measures), provide clear evidence that physical
characteristics play a critical part in the performance of behaviours related to successful
play.
The stability of the low to moderate correlations between the speed variables and game
behaviours verifies the importance of this attribute which coaches and trainers have
intuitively known. Indeed, backs rely on speed in order to beat the opposition and have
greater space at which to achieve higher speeds in both attack and defence (Quarrie et
al., 1996). The results of the present study demonstrate faster players break the line,
break tackles, evade opposing players and score tries more frequently. Faster players
will arrive at the defensive line quicker, potentially forcing the opposition players into
93
poor defensive decisions and positions; which has been shown to be essential in
dominating the contact and creating tackle breaks (Sayers & Washington-King, 2005;
Wheeler & Sayers, 2009). Players who are faster will also be able to travel at greater
speeds when receiving the ball, and in combination with an evasive event have a greater
chance of tackles being missed and creating a positive phase outcome (Sayers &
Washington-King, 2005).
The results show that higher levels of body fat, particularly within the forwards, may be
related to a decreased work rate and poor tackle ability. High levels of body fat
decreases the amount of fat free mass and increases the metabolic demands upon the
body and thereby reduces a player’s ability to repeatedly perform tasks (Duthie et al.,
2003). Moreover, with a decreased power to body mass ratio, players may not be able to
get into optimal defensive positions, thus missing more tackles and not being able to
contest the ball in the tackles that are successful (Gabbett, 2009; Wheeler & Sayers,
2009). Interestingly, the backs percentage body fat was positively correlated to activity
rate. This may be due to the confounding positional mix within the backs; as the
midfield backs anthropometrical requirements associated with the more physical nature
of these positions are in contrast to the lighter and leaner outside and inside backs.
Forwards who possessed a slower average time over 12 repeated sprints, and backs with
a high repeated sprint fatigue (indicators of poor repeated sprint ability) performed a
lower activity rate. Rugby union is a high-intensity intermittent sport that requires
players to repeatedly accelerate from ruck-to-ruck in order to maintain or gain
possession (Deutsch et al., 2007; Duthie et al., 2005; Quarrie et al., 1996). A decreased
ability to perform repeated sprints may reduce the involvement of the player in multiple
rucks and open play, thus decreasing the number of activities completed. In contrast,

94
greater repeated sprint ability may increase the player’s involvement in more rucks,
emphasised by the loose forwards small correlation between fatigue and first three on
attack and defence, increasing the chance to receive the ball and the subsequent
involvement in more tasks.
The small correlation between turnovers and upper body strength may be related to the
static exertion performed in the tackle and ruck. High upper body strength may assist in
the ‘ripping’ of the ball from the opposition in a tackle, or maintaining a strong position
in the ruck once the player has released the ball in order to turnover possession
(McKenzie et al., 1989). The relationship is further reinforced by the small correlations
between all three strength measures and turnovers in the loose forwards; whose primary
role is to gain and retain possession from the ruck within open play (Quarrie et al.,
1996). Other relationships between strength measures and game statistics are more
inconsistent in magnitude, which may be due to the reliance of strength upon other
aspects of performance. For instance scrums, mauls and other aspects of the contact
situation which would require large amounts of strength and power were not included in
the analysis (Duthie et al., 2003). Further research is therefore required, detailing the
specific areas of competition performance that are most influenced by strength.
The correlations presented in the current study are calculated with the 20-week time
period. The 20-week period allowed the inclusion of more games per fitness test, thus
reducing the noise in game statistics that vary substantially from game to game
(O'Donoghue, 2005). The weighting of the correlations meant the games played toward
the end of the 20-week period post fitness test had a small contribution to the overall
relationship. The weighting is important as physical characteristics are likely to change,

95
especially if the player is maintaining a volume and intensity of training aimed at
increasing aspects of their fitness (Young & Pryor, 2007).
The association between individual game statistics and team performance is not well
understood. Individual performance profiles of rugby union players have been
established (James et al., 2005); and substantial differences in team performance
indicators, such as percentage of tries scored out of total tries, and percentage of
lineouts won off opposition throw have been found between winning losing teams
(Jones et al., 2004). Indeed, Lim and colleagues (2009) successfully created a player
impact ranking matrix, using an individual’s positive and negative game actions to
determine team outcome and ranking. However, more detailed procedures are required
that factor the time at which actions occur, in order to reduce temporal confounding. In
addition, with the ongoing development of the professional game, changes in laws and
the interpretation of them have changed the way the game is played. Rugby has changed
from a maul dominated to a ruck dominated game in the post-professional era, as ball in
play time has increased (Eaves & Hughes, 2003). It could be expected that the
relationships between physical characteristics and game statistics reported in the present
study, will change as new rules come into effect and specific demands of competition
are modified.
In conjunction with findings from time motion and notational analyses related to on-
field requirements and successful outcomes, the data from the present study can further
enhance the specificity of the physical preparation of players. For instance, the
achievement of optimal body composition, with the focus on decreasing percentage
body fat, may improve work rate and the ability to repeatedly perform tasks.
Furthermore, greater emphasis may need to be applied to speed and acceleration

96
training, especially over 10 m, potentially increasing the number of line breaks, tackle
breaks and tries scored, which have been linked to successful phase and team outcomes
(Prim et al., 2006; Sayers & Washington-King, 2005; Wheeler & Sayers, 2009).
Conclusion
The current study is the first that has investigated the direct relationship between
physical characteristics and game statistics in rugby union. The low correlations indicate
a large proportion of the game statistics cannot be explained by physical characteristics;
however, the small to moderate magnitudes in such statistically powerful data do not
necessarily imply that these factors are unimportant for success of on-field behaviours.
Specifically, speed was moderately correlated to line breaks, tackle breaks and tries
scored which have been shown to be related to successful phase and team outcomes.
Furthermore, activity rate was negatively related to body fat and repeated sprint ability,
indicating a lower physical output may reduce the ability to repeatedly perform tasks
effectively in competition. Given the importance of these on-field events to success,
physical conditioning programmes can be specifically adapted to increase the capacity
of the related physical characteristics to enhance a players potential for success.

97
CHAPTER SIX: ADOLESCENT
PHYSICAL DEVELOPMENT

98
Study Three – Effects of an off-season conditioning programme on the physical
characteristics of adolescent rugby union players
Abstract
The aims of the study were to determine if a supervised off-season conditioning
programme enhanced gains in physical characteristics compared to the same programme
performed in an unsupervised manner, and to establish the persistence of the physical
changes after a six-month unsupervised competition period. Forty four provincial
representative adolescent rugby union players (age, mean ± SD, 15.3 ± 1.3 years)
participated in a 15-week off-season conditioning programme either under supervision
from an experienced strength and conditioning coach or unsupervised. Measures of
body composition, strength, vertical jump, speed and anaerobic and aerobic running
performance were taken, before, immediately after and six months following the
conditioning programme. Post conditioning programme the supervised group had
greater improvements in all strength measures than the unsupervised group, with small,
moderate and large differences between the groups’ changes for chin-ups (9.1%;
±11.6%), bench-press (16.9%; ±11.7%) and box-squat (50.4%; ±20.9%) estimated 1RM
respectively. Both groups showed trivial increases in mass; however increases in fat free
mass were small and trivial for supervised and unsupervised players respectively.
Strength declined in the supervised group while the unsupervised group had small
increases during the competition phase, resulting in only a small difference between the
long-term changes in box-squat 1RM (15.9%; ±13.2%). The supervised group had
further small increases in fat free mass resulting in a small difference (2.4%; ±2.7%) in
the long-term changes. The post conditioning differences between the two groups may
have been a result of increased adherence and the attainment of higher training loads
during supervised training. The lack of differences in strength after the competition
period, indicate supervision should be maintained in order to reduce substantial
decrements in performance.

99
Introduction
Rugby union is a high-intensity intermittent contact based team sport of 80-minutes
duration. During competition players have been shown to travel over 7 km, requiring
numerous maximal sprints, and experiencing large amounts of physical contact at the
tackle, ruck and scrum situations (Cunniffe et al., 2009; Deutsch et al., 1998b; Duthie et
al., 2005; Smart et al., 2008; Takarada, 2003). Due to the diverse physical demands
experienced during competition, the physical components required for success vary.
Training in rugby union players has to therefore accommodate these demands, and at
semi-professional level and above, structured resistance training for hypertrophy,
strength and power; aerobic and anaerobic conditioning; and speed training occur in
conjunction with the skill based team sessions (Duthie, 2006). However, in adolescent
rugby union players, in-season training commonly consists of two skill based team
sessions; while an off-season conditioning programme is sometimes supplied to the
players without demonstration or supervision.
Physical training in adolescents, in particular resistance training, is well documented
and is thought to be beneficial by increasing strength, decreasing injury rate and
improving sport performance (Kraemer, Fry, Frykman, Conroy, & Hoffman, 1989;
NSCA, 1985; Payne, Morrow, Johnson, & Dalton, 1997). Due to the potential
exclusions of future elite performers within talent identification programmes, research
has shifted focus to talent and long-term athletic development, highlighting the
importance of structured training in order to increase young athletes’ training age for
future elite performance (Smith, 2003; Vaeyens et al., 2008). Nonetheless, there is a
lack of research that specifically investigates the effect of training on talented
adolescent athletes. Furthermore, studies that have trained adolescents have usually

100
investigated the direct effects of a training intervention, without a long-term follow up
on the persistence of the physical changes or the difference in changes relative to age.
Supervision of adolescent athletes during resistance training by an experienced strength
and conditioning coach is recommended primarily for safety (Faigenbaum et al., 1996a).
In addition, direct supervision of resistance training sessions has also been shown to
increase adherence and enhance the increases made in strength. Adolescent rugby
league players have shown marked increases in 3RM bench-press and squat (29% and
37% respectively) after supervised training compared to the same resistance training
programme unsupervised (15% and 23% respectively) (Coutts et al., 2004). It was
thought the greater increases in strength were due to the greater training frequency and a
greater intensity performed during the session. The results from this study illustrate the
importance of supervision for strength development and therefore the role of
supervision in other areas of physical development should also be considered (Mazzetti
et al., 2000).
Physical training and conditioning within adolescent rugby union players is generally
unstructured and unsupervised, therefore this study had three aims: to determine if a
supervised off-season conditioning programme enhances gains in physical
characteristics compared to an identical unsupervised programme; to establish the
persistence of the physical changes during an unsupervised six month post-intervention
training period; and, to determine the effect of age upon the changes in physical
performance as a result of the physical conditioning programme.

101
Methods
Experimental Approach to the Problem
The present study examined the effect of a supervised off-season conditioning
programme in provincial representative adolescent rugby union players through a pre-
post measures experimental-control research design. Players were tested in body
composition, strength, vertical jump, speed, and anaerobic and aerobic running
performance. Players were then randomly allocated into training groups for the 15-week
intervention period. The supervised group trained four times a week (three resistance
training sessions and one speed and anaerobic/aerobic conditioning session) with an
experienced strength and conditioning coach, and the unsupervised group were left to
complete the same programme in their own time. Players were tested upon completion
of the 15-week training intervention to determine the effects of the programme, and
again six months post-intervention after an unsupervised competition period to establish
the persistence of the effects. Statistical analysis allowed the use of age as a covariate to
determine the effects of a change of age upon physical changes.
Participants
Eighty two provincial representative adolescent rugby union players volunteered to
participate in the study. All players meet the criteria for selection in the regional under-
14, under-16 or under-18 representative rugby union teams for the season preceding the
training period. Players were randomly selected into either a supervised training group
or an unsupervised training group. As a result of dropout due to varied reasons (e.g.
injury, illness, relocation), a total of 44 players completed the study (supervised n=27;
age (mean ± SD) 15.4 ± 1.4 years and unsupervised n=17; age 15.1 ± 1.3 years). Prior to
the commencement of the study players and their parents were briefed on the aims and

102
Figure 4: The timeline of the 15-week off-season conditioning programme (combined resistance, speed and anaerobic/aerobic conditioning) preceded by a 4-week preparation and
followed by a 6-month follow up in provincial representative adolescent rugby union players (n = 44; age, mean ± SD, 15.3 ± 1.3 years). Body composition, speed, strength, vertical
jump and anaerobic and aerobic running performance was measured prior to the preparation phase (Pre), post conditioning phase (Post1) and 6-months following Post1 after an in-
season competition phase (Post2).
Phase 2:
Conditioning Phase
(15 weeks)
Supervised and
unsupervised off-season
conditioning program
Phase 1:
Preparation
Phase
(4 weeks)
Unsupervised
active recovery
program
Post1
Phase 3:
Competition Phase
(6 months)
Unsupervised in-season maintenance program
Post2 Pre
103
procedures involved. Written inform consent was gained from all players, while
additional parental assent was gained from players under the age of 16. This study was
approved by the Auckland University of Technology Ethics Committee.
Experimental Procedures
STUDY DESIGN
The study consisted of three phases (Figure 4). Phase one (preparation) commenced
immediately after the pre-test (Pre) consisting of an unsupervised programme of low
volume aerobic running (3 sessions of 20-30 min at conversation pace) and 3 sessions of
light gym based exercises (bench-press, leg press, chin-ups, seated row and single leg
step ups – 3 sets of 10 repetitions) over a period of four weeks. This phase was used to
prepare the players for the intensive intervention period and act as a form of active
recovery post-rugby season. Upon completion of this phase players reported to have
completed approximately 50% of these sessions (an average of 3 sessions per week of
both types of training).
Phase two (conditioning) represented the 15-week training intervention and was
performed during the rugby off-season (summer). The phase was divided into three
four-week training blocks, with a three-week unsupervised period after week four, for
the observation of the summer holiday period. During this phase the supervised training
group trained four times a week for an hour, supervised by an experienced strength and
conditioning coach at a centralised location. The unsupervised group were posted the
same training programme at the beginning of each four week block and were asked to
carry out the training at any facility at any time of their choosing. All programmes
followed the same basic weekly structure with three resistance training sessions (full
body, upper body and lower body), one speed and anaerobic conditioning session and

104
one unsupervised aerobic run (Table 12). At the conclusion of this phase, players
repeated the same testing battery that was performed for the pre-test (Post1).
Phase three (competition) occurred immediately after the conditioning phase and
consisted of an unsupervised six month in-season training programme. During this
period, training recommendations for strength, speed, anaerobic and aerobic
conditioning was provided to maintain any improvements made over the intervention
period. The programme was lower in frequency and volume as players generally
participated in two rugby training sessions and one game a week (two resistance
training sessions a week, 4 sets of 6-10 repetitions; and, one session a week for speed
and aerobic recovery respectively, performing similar exercises and intensities as that
performed during the conditioning phase). At the conclusion of this phase, players
repeated the same testing battery for a third occasion (Post2).
TRAINING LOAD
During the study, training data was collected from all players. All structured training or
competition that players participated in was recorded; specifically, the volume
(duration) of exercise and a rating of perceived exertion (RPE) as indicated on a
modified 10-point Borg scale (Foster et al., 2001). Training data was recorded each
week during the training period and then once a month during the post-intervention
period. Training load was calculated by multiplying the duration of the training session
by the RPE (Foster et al., 2001).

105
Table 12: The 15-week off-season conditioning programme performed by provincial representative adolescent rugby union players (age, mean ± SD, 15.3 ± 1.3 years). The
programme was either performed supervised (n = 27) by an experienced strength and conditioning coach at a central location, or unsupervised (n =17) in the players own time
and at a facility of their choosing.
Week 1 2 3 4 8 9 10 11 12 13 14 15
Monday:
Full Body RTa
Box-squat, bench-press, chin-ups, seated
hammer row
4 sets of 10 repetitions (2-min rest)
Session concluded with performance of
multistage shuttle run test
Box-squat, bench-press, chin-ups, lat pull down
5 sets of 12,12,12,10,8 repetitions (2-min rest)
Core conditioning circuit: 3 sets of 20
repetitions of 5 core exercises
Box-squat, bench-press, chin-ups, calf raises
5 sets of 10,8,8,6,6 repetitions (2-min rest)
Anaerobic stationary bike intervals: 1x 1min
Easy (<80 rpm at low resistance): 30 s Hard
(>90 rpm at high resistance), 3x 1 min Easy: 1
min Hard, 1 min Easy: 30 s Hard
Tuesday:
Speed & Conditioningb
Speed:
2x 22 m, 2x 40 m, 2x 50 m
Each sprint performed at maximal intensity,
with a 3-min rest after each sprint
Conditioning:
12x 50-m jog (conversation pace) – 100-m
sprint (100% effort); 3-min rest after every 4
efforts.
22 m, 40 m, 50 m, 60 m, 50 m, 40 m, 22 m
sprints (100% effort); walk back to start, start
next effort immediately. Repeat 3x with 3-min
rest between each set.
Speed:
4x 22 m, 4x 40 m, 4x 50 m
Each sprint performed at maximal intensity,
with a 3-min rest after each sprint
Conditioning:
16x 50-m hill sprints (100% effort); walk back
to start, start next effort immediately. 2-min
rest after every 4 efforts.
10 m, 22 m, 40 m, 22 m, 10 m sprints (100%
effort); jog back to start, start next effort
immediately. Repeat 4x with 2-min rest
between each set.
Speed:
3x 15 m, 3x 25 m, 3x 40 m
Each sprint performed at maximal intensity,
with a 3-min rest after each sprint
Conditioning:
10 m, 22 m, 40 m, 50 m, 60 m, 50 m, 40 m,
22 m, 10 m sprints (100% effort); jog back to
start, start next effort immediately, every second
start from a lying position. Repeat 4x with 2-
min rest between each set.
16x 22-m sprints (100% effort) on 30s; jog back
to start. 2-min rest after every 4 sprints.
Wednesday:
Upper Body RTa
Bench-press, seated row, DB shoulder press, lat
pull down
4 sets of 10 repetitions (2-min rest)
Muscular endurance circuit: 2 sets of 20
repetitions of 7 bodyweight exercises
Bench-press, seated hammer row, chin-ups, DB
lateral raises
5 sets of 12,12,12,10,8 repetitions (2-min rest)
Core conditioning circuit: 3 sets of 20
repetitions of 5 core exercises
DB bench-press, lat pull down, upright row, SA
DB row
5 sets of 10,8,8,6,6 repetitions (2-min rest)
Core conditioning circuit: 3 sets of 25
repetitions of 5 core exercises

106
Table 12 cont:
Week 1 2 3 4 8 9 10 11 12 13 14 15
Friday:
Lower Body RTa
Low-intensity plyometrics: 2 sets of 8
repetitions of vertical jump, broad jump, clap
push up (1min rest)
Box-squat, leg-press, SL step ups, prone hip
extension
4 sets of 10 repetitions (2min rest)
Low-intensity plyometrics: 3 sets of 10
repetitions of vertical jump, broad jump, clap
push up (1min rest)
Box-squat, leg-press, calf raise, SL Bulgarian
squat
5 sets of 12,12,12,10,8 repetitions (2min rest)
Low-intensity plyometrics: 3 sets of 12
repetitions of vertical jump, SL broad jump,
clap push up (1min rest)
Deadlift, 1/3 squat, leg-press, SL Bulgarian
squat
5 sets of 10,8,8,6,6 repetitions (2min rest)
Saturday:
Aerobic Recovery Run
(unsupervised)
30 min continuous run at conversation pace 35 min continuous run at conversation pace
with 3x 30 s, 3x 60 s, 2x90 s very hard (RPE 8-
9) efforts performed at any time during the run.
35 min continuous run at conversation pace
with 4x 30 s, 4x 60 s, 3x90 s very hard (RPE 8-
9) efforts performed at any time during the run.
Weeks 5-7 were an unsupervised maintenance programme performed over the summer holiday period
RT= resistance training; DB = dumbbell; SL = single leg; SA = single arm a Before all resistance training (RT) sessions participants performed a standardised warm up of 10 min cycling at a self-selected intensity and ballistic stretches (straight leg
swings – front to back and side to side; alternating calf stretch – bent over with hands on ground alternating between lifting heel off the ground and pushing it towards ground;
bent over rotations – bent over trying to touch the opposite foot with your hand toe touches; arm swings – arms moving in a circular motion forwards and backwards, x10 each). b Before all speed and conditioning sessions participants performed a standardised warm up of 5 min jogging at conversation pace followed by ballistic stretches (as above).
Upon completion of the standardised warm up some dynamic exercises were performed and consisted of butt kicks, high knees, cross-overs, straight legged sprinting and walking
lunges (2x each over 20 m). The warm up concluded with three 22-m sprints of 70%, 80% and 95-100% of maximum effort with a walk back recovery between sprints.

107
Physical Performance Tests
BODY COMPOSITION
Anthropometrical measurements included body mass, stature and sum of eight skinfolds
(bicep, triceps, subscapular, abdominal, supraspinale, iliac crest, front thigh and medial
calf). Height was measured using a stadiometer, and body mass was measured on
calibrated electronic scales (Tanita HD-316, Tanita Corporation, Tokyo, Japan). Each
skinfold site was located and measured as per the ISAK guidelines (Norton et al., 2004)
using a Slim Guide calliper (Creative Health Products, Plymouth, USA). Percentage
body fat was calculated from estimated body density (Withers et al., 2004) using the
equation derived from Siri (1961). Fat free mass was calculated from the player’s body
mass and calculated body fat (Fat free mass = body mass – (body mass * percentage
body fat/100) (Slater et al., 2006).
STRENGTH
One repetition maximum was calculated for a series of resistance training exercises
from a six to ten repetition maximum lift using the formula derived by Landers (1985).
The strength exercises included bench-press, box-squat and chin-ups. Each exercise was
assessed for correct technique and only repetitions performed unassisted with correct
technique were recorded.
During the performance of the bench-press the feet were to remain in contact with the
floor and the buttocks and lower back had to remain in contact with the bench
throughout the lift. During the lift the bar was to be lowered to the chest (with elbows at
approximately 90° not bouncing off the chest) and returned to the start position where
elbows were to be fully extended, but not locked. Each player used a self-selected hand
position which remained consistent between tests. The box-squat was performed by

108
descending in a controlled manner to a seated position on a box where the player was
instructed to pause briefly before returning to the standing position. The box height was
adjusted to allow the top of the thighs to be parallel with the floor while in the seated
position. Players used a self-selected foot position, which remained constant throughout
all testing sessions. The chin-ups required a reverse underhand grip (palms facing
towards face) to be used. Players were instructed to start from a stationary position with
arms fully extended and complete a repetition with chin moving over the bar (Argus et
al., 2009; Beaven et al., 2011).
VERTICAL JUMP
Jump height was indicated by a countermovement vertical jump (VJ) using a yardstick
device (Swift Performance Equipment, NSW, Australia). Players were required to stand
at the side of the yardstick and with flat feet extend their arm and hand above their head
to mark the standing reach height. Players were then instructed to jump as high as they
could and knock away the fingers of the yardstick. Players used a self-selected speed
and depth for their countermovement and were able to use their arms and hands to assist
with jump height. Jump height was calculated as the distance from the highest point
reached during the jump and the standing reach height. Each player was allowed two
attempts with 20-s rest between efforts. The highest jump was recorded for analysis
(Beaven et al., 2011).
SPEED, ANAEROBIC AND AEROBIC RUNNING PERFORMANCE
Speed, anaerobic and aerobic running performance was tested using the Metabolic
Fitness Index for Team Sports (MFITS). The MFITS is made up of three components,
each designed to indicate the capacity of the three metabolic systems. The first
component consists of a 60-m sprint to test the phosphate energy system; the second

109
component is a 400-m sprint to test the lactate (glycolytic) energy system; and the 1500-
m run as an indicator of aerobic capacity (Jones & Climstein, 2002).
The MFITS was performed on a synthetic running track and players were required to
wear soft soled running shoes. Players were instructed to perform each aspect of the test
maximally. The first component consists of two straight line speed repetitions over 60
m. Players were to start each sprint with their foot on a line 50 cm from the light beam
of the first timing gate, from a stationary upright position, with no rocking back or forth
prior to starting. The players completed the 60-m sprint in the lane formed by the
electronic timing gates (Swift Performance Equipment, NSW, Australia), which was
approximately 2-m wide. The time taken to complete 10 m, 20 m, 30 m and 60 m for
each sprint repetition was recorded, with the fastest used in the analysis.
After a 15-min recovery; in which during the last 5 min players were required to
complete a one lap jog of the 400-m track with two 40-m stride outs; players completed
a 400-m sprint. Players were required to sprint maximally for the entire lap of the track
while staying in their allocated lane. Groups of eight players (one per running lane)
were started on the command ‘Set, Go’. Simultaneously, allocated timers to each player
started a stopwatch. The timers stopped the stopwatch when the player completed the
400-m run at the finish line. The time to complete the 400 m (to the nearest tenth of a
second) was recorded.
After a 15-min recovery; in which during the last 5 min players were required to
complete a one lap jog of the 400-m track; players completed a 1500-m run. All players
commenced the run together starting at the 300-m mark on the track and completed

110
three and three quarter laps. The time to complete the 1500 m was verbalised to the
player as they crossed the finish line, which was then recorded to the nearest second.
Data Analysis
All data were analysed using an Excel spreadsheet for analysis of pre-post controlled
trials, which was set at 90% confidence limits (Hopkins, 2006). All data were log-
transformed prior to analysis to reduce non-uniformity of error and adjusted for the age
of each player as at the beginning of the study period. Data were back transformed and
expressed as the parametric median, with errors expressed as coefficients of variation
for the change scores and 90% confidence limits for differences in the within-group
changes. The analysis was repeated using age as a covariate to determine the extent to
which the effect of the training was due to changes in age. Standardised mean changes
in performance and differences between the changes were used to assess magnitudes of
effects by dividing the appropriate between-player standard deviation. Standardised
effects were defined as using a modified Cohen scale: <0.2 = trivial, 0.2 - 0.59 = small,
0.6 - 1.19 = moderate, 1.2 – 1.99 = large, >2.0 = very large (Hopkins et al., 2009). The
effect was deemed unclear if its confidence interval overlapped the thresholds for small
positive and negative effects.
Results
Differences in the supervised and unsupervised groups’ pre-test values were small for
body mass, skinfold thickness, percent body fat and 400 m time, and moderate for
bench-press 1RM. All other differences in pre-test values were trivial or unclear.
111
Conditioning Phase
The supervised and unsupervised groups anthropometric and performance test results
are displayed in tables 13 and 14 respectively. At the conclusion of the conditioning
phase, the supervised group had greater changes in strength, VJ and acceleration than
the unsupervised group. The differences between the changes were small, moderate and
large for chin-ups 1RM (9.1%; 90% confidence limits ±6.9%), bench-press 1RM
(16.9%; ±7.0%) and box-squat 1RM (50.4%; ±12.2%) respectively; while there was a
small difference between the increases in VJ height (4.2%; ±6.5%). There was a
moderate difference in the change in 10-m sprint time (2.1%; ±2.5%); however the
differences were unclear at 20 m, 30 m and 60 m. Furthermore, the unsupervised group
had greater increases in skinfold thickness and percent body fat, resulting in small
differences (8.7%; ±8.3% and 8.7%; ±7.4% respectively) between the groups changes in
body composition. All other differences between groups’ changes in body composition
(e.g. mass) and running performance (e.g. 400-m sprint time) were trivial or unclear.
Competition Phase
Over the period of the competition phase, the supervised group’s strength tended to
decline, however the only clear change was a moderate decrease in box-squat 1RM
(17.9% ± 24.2%). The resultant differences between the supervised and unsupervised
groups’ changes during this phase were large for box-squat 1RM (28.6%; ±16.3%),
moderate for bench-press 1RM (14.1%; ±6.3%) and small for chin-ups 1RM (7.5%;
±5.3%). Fat free mass had small increases in the supervised group (2.7% ± 2.4%) and
trivial increases in the unsupervised group (2.2% ± 2.3%). Consequently, the
differences between the groups’ changes from Post1 to Post2 were trivial. The small to
moderate decreases (~2.8%) in speed time (10 m, 20 m and 30 m) in the unsupervised

112
Table 13: Mean ± SD (expressed as coefficient of variation (%)) anthropometric measures
for supervised (SUP) and unsupervised (UNSUP) adolescent rugby union players (age, mean
± SD, 15.3 ± 1.3 years) Pre and post (Post1) 15-week off-season conditioning programme,
and 6-months post-training (Post2) after an unsupervised competition period.
Pre Post1 Post2
Body mass (kg) SUP 79.7 ± 15.2 81.4 ± 14.1 83.9 ± 13.2*
UNSUP 73.9 ± 12.0 76.6 ± 10.8 79.8 ± 8.4*
Stature (cm) SUP 177.9 ± 3.9 178.0 ± 3.7 178.9 ± 3.8
UNSUP 178.8 ± 2.4 178.4 ± 2.3 179.7 ± 2.1
Skinfold thickness (mm) SUP 107.2 ± 47.8 105.4 ± 40.9 109.7 ± 37.9
UNSUP 86.3 ± 50.2 91.6 ± 39.6 96.8 ± 34.5
Percent body fat (%) SUP 15.9 ± 49.1 15.3 ± 40.8 15.8 ± 38.0
UNSUP 12.7 ± 46.1 13.2 ± 38.6 14.2 ± 33.3
Fat free mass (kg) SUP 65.8 ± 13.4 67.8 ± 11.6* 69.8 ± 11.7*
UNSUP 64.1 ± 9.3 65.8 ± 8.4 68.0 ± 7.3
Magnitudes indicate differences from preceding test; * = small

113
Table 14: Mean ± SD (expressed as coefficient of variation (%)) performance test measures for
supervised (SUP) and unsupervised (UNSUP) adolescent rugby union players (age, mean ± SD, 15.3 ±
1.3 years) Pre and post (Post1) 15-week off-season conditioning programme, and 6-months post-
training (Post2) after an unsupervised competition period.
Pre Post1 Post2
Fastest 10-m sprint (s) SUP 1.84 ± 5.4 1.79 ± 4.6 1.79 ± 4.7
UNSUP 1.83 ± 3.6 1.84 ± 6.1 1.78 ± 4.4**
Fastest 20-m sprint (s) SUP 3.14 ± 6.0 3.08 ± 3.8* 3.08 ± 4.6
UNSUP 3.15 ± 4.2 3.10 ± 5.3 3.07 ± 5.1*
Fastest 30-m sprint (s) SUP 4.38 ± 7.0 4.31 ± 5.1 4.30 ± 5.2
UNSUP 4.41 ± 4.8 4.37 ± 5.7 4.28 ± 5.7*
Fastest 60-m sprint (s) SUP 8.05 ± 8.4 7.91 ± 5.9 7.91 ± 6.2
UNSUP 8.05 ± 5.6 7.98 ± 7.1 7.88 ± 6.9*
400m time (s) SUP 69.4 ± 11.9 65.6 ± 18.4 70.6 ± 13.4
UNSUP 67.1 ± 8.7 67.0 ± 11.1 69.5 ± 7.7
1500m time (s) SUP 402.7 ± 14.3 388.1 ± 12.0 402.9 ± 15.5
UNSUP 396.1 ± 8.6 388.7 ± 15.5 402.2 ± 12.7
Bench-press 1RM (kg) SUP 77.6 ± 23.4 97.3 ± 18.4** 91.0 ± 18.2
UNSUP 68.9 ± 17.4 73.7 ± 16.9 79.7 ± 19.8*
Box-squat 1RM (kg) SUP 95.5 ± 27.1 164.7 ± 20.7**** 138.0 ± 19.5**
UNSUP 92.5 ± 30.1 108.0 ± 27.1* 109.0 ± 20.8
Chin-ups 1RM (kg) SUP 97.1 ± 17.6 108.4 ± 14.2** 108.5 ± 14.4
UNSUP 93.3 ± 13.9 96.2 ± 12.7 100.6 ± 9.7*
Vertical jump (cm) SUP 49.4 ± 19.9 53.3 ± 13.3* 53.5 ± 14.8
UNSUP 49.9 ± 9.6 51.1 ± 12.8 52.0 ± 12.1
Magnitudes indicate differences from preceding test; * = small; ** = moderate; **** = very large

114
Table 15: Mean ± SD (expressed as coefficient of variation (%)) training volume (min), training load (AU) and
training frequency, for supervised (SUP) and unsupervised (UNSUP) adolescent rugby union players (age, mean ± SD,
15.3 ± 1.3 years) during a 15-week off-season conditioning programme (conditioning phase) and a 6-month in-season
maintenance programme (competition phase).
Training Volume (min) Training Load (AU) Training Frequency
SUP UNSUP SUP UNSUP SUP UNSUP
Conditioning Phase 268 ± 34 169 ± 90 1752 ± 38 1192 ± 97 4.4 ± 26.1 3.4 ± 39.7
Competition Phase 349 ± 50 211 ± 62 2348 ± 52 1466 ± 63 4.9 ± 38.8 3.1 ± 62.3
Differences between SUP and UNSUP for all training variables for both phases were moderate

115
Figure 5: Mean ± SD (expressed as a coefficient of variation (%)) of box-squat estimated 1RM for
provincial representative adolescent rugby union players (age, mean ± SD, 15.3 ± 1.3 years) after a 15-
week off-season conditioning programme (Post1) and 6-months post intervention after an in-season
competition period (Post2). * = large difference between the within-group changes. The overall difference
between the changes from Pre–Post2 was small (15.9%; 90% confidence limits ±13.2%).
0
20
40
60
80
100
120
140
160
180
200
Pre Post1 Post2
Bo
x S
qu
at
est
ima
ted
1R
M (
kg
)
SUPERVISED (n = 27) UNSUPERVISED (n = 17)
Unsupervised Competition Phase
Conditioning
Phase
*
*

116
group from Post1 to Post2 resulted in differences between the groups changes for 10 m
(moderate; 4.3%; ±2.4%), 20 m (small; 1.5%; ±1.8%) and 30 m (small; 2.2%; ±1.9%).
All other differences between the changes over the period of the competition phase were
trivial or unclear.
Long-Term Changes
Although the supervised group showed decreases in strength over the competition
phase, the long-term changes (Pre to Post2) for bench-press 1RM (16.3% ± 15.0%) and
box-squat 1RM (41.8% ± 26.3%) were still moderate and large respectively. The
moderate change in box-squat 1RM resulted in a small difference between the
supervised and unsupervised groups’ long-term change (15.9%; ±13.2%). There was a
small difference (2.4%; ±1.6%) between the groups’ long-term changes in fat free mass.
All other differences between the long-term changes (Pre-Post2) were trivial or unclear.
The Effect of Age
In the secondary analysis to determine the extent to which a change in age effects the
changes due to training, there were no clear effects during both the conditioning and
competition phases. However, results indicated that the younger subjects tended to show
greater improvements.
Training Variables
The mean attendance for the supervised group during the conditioning phase was 66%.
The supervised group achieved moderately higher training volumes, loads and
frequencies for both the conditioning and competition phases than the unsupervised
group (Table 15).

117
Discussion
The effectiveness of a 15-week supervised off season conditioning programme was
compared to an unsupervised programme in provincial representative adolescent rugby
union players. Supervised players realised greater improvements in strength, body
composition and acceleration compared to the common unsupervised approach. In
addition, the persistence of the changes induced during the conditioning phase,
determined after a 6-month unsupervised competition period, showed the physical and
anthropometrical gains were reduced in the supervised group, resulting in only small
long-term differences between the changes in box-squat 1RM and fat free mass. Finally,
there were no clear effects of a change in age on the changes in physical characteristics
as a result of training
Conditioning Phase
During the 15-week conditioning phase the differences in strength gains are comparable
to those reported in other studies of similar subjects. For example, increases of 40% and
25.5% in 3RM squat and 29.8% and 15.3% in 1RM bench-press in supervised and
unsupervised junior rugby league players respectively have been reported after 12-
weeks of resistance training (Coutts et al., 2004). The unsupervised group in the present
study were provided with the same programme; nonetheless moderate differences
occurred with the supervised group in training frequency, load and volume. Thus it
seems supervision increased adherence to the programme through the organisation of a
structured training environment, by providing a specific time and place for a player to
attend. Furthermore, greater external motivation and competitiveness evident within
supervised group training may have resulted in increased training intensity. The lifting
of greater loads (expressed as kg lifted per set) has been shown within supervised
sessions compared to unsupervised sessions, potentially resulting in the stimulation of a

118
higher recruitment threshold of motor units (Mazzetti et al., 2000; Ploutz, Tesch, Biro,
& Dudley, 1994).
Neural factors are primarily thought to be responsible for strength changes in
adolescents (Faigenbaum et al., 1996a); however as an individual reaches post-
pubescence the influence of hormonal factors upon muscle growth and development
increases (Kraemer et al., 1989). The mean age of the subjects in the present study was
that typically associated with Tanner stage 5, indicating increases in the secretion of sex
hormones (Baxter-Jones et al., 2005). Furthermore, resistance training has shown to
increase resting testosterone concentration in pubertal males, and may contribute to the
anabolic process during the adolescent growth spurt (Tsolakis et al., 2000). Therefore,
the greater training loads performed by the supervised subjects may have been above
the threshold to elicit a subsequent testosterone response and provide an enhanced
milieu for the development of fat free mass (Kraemer et al., 1989; Viru, 1992); and in
combination with initial neural gains, are likely to be the key contributors to the
increases in strength in these players.
The trivial increase in mass over the period of the conditioning phase is in contrast to
other studies that have found significant increases in mass after resistance and mixed
conditioning training in similar subject populations (Coutts et al., 2004; Gabbett et al.,
2008a). Alternatively, the present study found small increases in the supervised group’s
fat free mass after the conditioning phase; which may be attributed to the combination
of the trivial increase in body mass and the substantially greater change in skinfold
thickness compared to the unsupervised group. It could therefore be postulated that the
greater training frequency, volume and load within the supervised group may have
119
contributed to a greater fat loss and thus a small increase in fat free mass (Mazzetti et
al., 2000).
A greater increase in VJ height occurred for the supervised group compared to the
unsupervised group over the period of the conditioning phase. The greater gains may be
due to the greater adherence to the specific programme, a lack of prior experience with
structure plyometric training, and a lower initial performance level, all allowing scope
for greater improvement. Moderate differences also occurred between the groups’
changes in 10-m sprint time. The acceleration phase of the sprint is highly related to
lower body power production (Baker & Nance, 1999a), thus in combination with the
speed training, the plyometric training may have contributed to an increase in
acceleration performance.
The differences between the changes in MFITS performance were inconsistent. During
the conditioning phase, speed, anaerobic and aerobic conditioning was only prescribed
once a week, as not all players were familiar with specific training techniques and
intensities. Therefore, the training may have been of insufficient frequency or volume to
override the rapid growth and maturation process for minimal adaptation (Mazzetti et
al., 2000; Tsolakis, Vagenas, & Dessypris, 2003).
Competition Phase
A novel aspect of this study was the long-term follow up of physical performance to
measure the longitudinal effects of the conditioning programme. The follow up was
performed after a six month competition phase in which all subjects were provided with
an unsupervised training programme that was prescribed to maintain the physical
performance levels achieved during the conditioning phase. However, during the

120
competition phase, strength tended to decline in the supervised group and continued to
show trivial increases in the unsupervised group. There was an increase in the
frequency, volume and load of training in the competition phase compared to the
conditioning phase in both groups, however the majority of time during this period is
typically spent on team based skill sessions and competition (Argus et al., 2009).
Therefore, the frequency and volume of resistance and mixed conditioning training in
the supervised group aimed at the maintenance of physical characteristics may have
been insufficient to preserve the short-term gains that resulted from the supervised
conditioning phase. To reduce the diminishing effects of the unsupervised competition
phase, it is recommended that supervision be maintained. This may provide stimulus for
increased adherence and the ability to perform intensities and loads required in order to
preserve the improvements in performance (Coutts et al., 2004; Mazzetti et al., 2000).
At the conclusion of the competition phase both groups showed small increases in mass,
indicating the increases may have partially been a result of maturation (Tsolakis et al.,
2004). However, greater increases in fat free mass occurred longitudinally (Pre to Post2)
in the supervised group compared to the unsupervised group. These longitudinal
changes suggest the development of fat free mass may be accelerated in adolescent
athletes with a greater training age (indicated by the differences in training frequency,
volume and load).
Previous studies into the detraining effect in adolescents have typically re-tested eight to
twelve weeks post-training (Diallo et al., 2001; Ingle, Sleap, & Tolfrey, 2006; Tsolakis
et al., 2004). The post-intervention period in the present study was therefore over twice
as long as those previously investigated. Furthermore, the provision of training
recommendations, as opposed to complete cessation of training, and the collection of

121
training data have provided insight into a follow up more representative of an applied
physical development programme. The current study has provided a framework for
future research into the long-term persistence (or detraining) effects in adolescents, with
even longer follow-ups over multiple years with multiple conditioning programmes
required to further understand the physical progression that may lead to elite
performance.
The Effect of Age
The third aim of the study was to determine the effect of a change in age upon the
changes in physical performance as a result of training. Although results showed
younger players tended to improve more, the differences were unclear. These trends
may be indicative of younger players of lower training age and initial physical
capacities, which create a greater propensity for improvement (Duthie, 2006; Gabbett,
2005c). Additionally, the training stimulus may have been insufficient to increase the
physical capacities in the older players with greater training experience (Gabbett et al.,
2008a). Further research is therefore required to establish the effectiveness of training
within specific adolescent age groups, to determine the age that elicits the greatest
improvements.
In summary, greater improvements in strength, anaerobic leg power (VJ and 10-m sprint
time) and body composition were made in adolescent rugby union players who were
supervised over a 15-week off-season physical conditioning programme compared to a
similar group that completed the same programme but were not supervised. The greater
increases may be attributed to greater training intensities achieved in a competitive
group training environment. A longitudinal follow up after an unsupervised 6-month
competition phase showed reductions in physical and anthropometrical characteristics;

122
however changes in lower body strength and fat free mass were still greater overall in
the players that were initially supervised. The effect of age upon the change in physical
performance was unclear and requires further research to establish the efficacy of
training within specific adolescent age groups. The results indicate the importance of a
supervised development programme, not only for safety within adolescent athletes, but
for enhancing improvements in physical attributes (Faigenbaum et al., 1996a).
Practical Applications
It is common for off-season conditioning programmes in adolescent rugby union players
to be supplied without appropriate explanation or supervision. Coaches and
administrators wanting to improve the physical performance of adolescent athletes
should consider organised, structured and supervised group training sessions to ensure
improvements are made. If such organisation does not occur, it is likely that changes in
physical attributes may closely match those associated with normal maturation.
Specifically, maintaining supervision during the competition phase may enable an
enhanced state for subsequent off-season physical conditioning programmes and greater
long-term athletic development.

123
CHAPTER SEVEN:
CONCLUSIONS

124
Primary Findings and Conclusions
The physical characteristics of elite players should form the basis of development
programmes for adolescents. Therefore, the present thesis intended to profile the
physical characteristics of contemporary rugby union players, establish the relationships
between physical characteristics and game behaviours, and determine the effectiveness
of a supervised off-season conditioning programme in adolescent rugby players to
provide implications for physical development.
The first study (chapter four) used a mixed modelling procedure to determine the
differences between playing level and year of fitness test (to ascertain progression); and
the changes within players as they moved from one competition phase to the next within
the same year. Results showed the same positional and level specific trends in physical
characteristics that have been previously reported within literature (Casagrande &
Viviani, 1993; Duthie et al., 2006b; Duthie et al., 2003; Holway & Garavaglia, 2009;
Quarrie et al., 1996; Quarrie et al., 1995). The differences between Super Rugby and
international players however was trivial; indicating other factors such as skill may be a
key determinant to selection into the highest level. The average annual changes in
physical characteristics showed higher level players are continuing to substantially
improve in aspects of strength and body composition, which may be due to the
increasing professionalism of modern players. Finally, the changes within players
between competition phases, indicates the importance of developing strategies to
continually improve or maintain physical attributes in players within and between
competitions.
The second study (chapter five) investigated the direct relationship between physical
characteristics and game behaviours identified through game statistics. Small to

125
moderate correlations were found between sprint time and game statistics that involve
periods of high-intensity running (e.g. metres advanced, tries scored); while activity rate
was negatively correlated with percent body fat and repeated sprint ability. This was the
first study to directly relate physical characteristics to on-field performance and
although consistently low correlations suggest other key predictors exist, they do
suggest that some physical characteristics are important for success in rugby. Given the
greater detail surrounding the effect physical characteristics have upon game
performance, a player’s physical preparation can be specifically adjusted to improve
attributes that will enhance the performance of their role within competition.
The final study (chapter six), investigated the effectiveness of a 15-week supervised off-
season conditioning programme in adolescent rugby players, compared to the same
programme performed in an unsupervised manner. Supervised players realised greater
improvements in strength, body composition and acceleration compared to the more
common unsupervised approach. A novel aspect of this study was the long-term follow
up to determine the persistence of the effects after a 6-month unsupervised competition
phase. The gains made by the supervised group were reduced, resulting in only small
differences between the within-group changes in box-squat 1RM and fat free mass. The
effect of age upon changes in physical characteristics as a result of training was unclear.
The results support the use of structured, organised and supervised group training
environments within adolescent athletes. It is likely the greater motivation and
competition involved with group training enhances the improvements in physical
performance through the attainment of greater training loads. If structured supervised
sessions do not occur, the potential for improvements may be reduced.

126
The present thesis has shown that rugby union players are a heterogeneous group of
individuals due to the highly varied roles of each position within competition. The
speed, body composition and repeated sprint ability of players appear to be important
physical characteristics due to superior performances by individuals at higher playing
levels and their relationship with aspects of game behaviours associated with success.
These findings have large implications for the development of identified talent in age-
group rugby union players. Due to professionalism, the demand for bigger, stronger and
faster players has increased, resulting in the introduction of younger players into the
professional environment. As speed, body composition and repeated sprint ability have
been associated with better on-field performance, it is therefore vital these
characteristics are developed from an early age. While the changes in strength were
more substantial as a result of the off-season conditioning programme in adolescent
players in the current investigation, the greater strength will provide a foundation on
which crucial attributes can be developed. For instance, greater relative squat strength
has been related to 40-m sprint time (Baker & Nance, 1999a); while long-term increased
levels of strength will be realised through proportional increases in fat free mass (Bell,
1980; Duthie et al., 2006b; Slater et al., 2006). Not only will changes such as these
ensure the player is physically ready for the demanding nature of professional rugby,
but also to ensure that the player will have every chance of being successful. In
addition, the development of physical characteristics within adolescent rugby union
players should be achieved through structured, organised and supervised training
environments, to ensure the greatest possible improvements in performance are
achieved.

127
Limitations
The primary limitation within study one and study two is the method of data collection.
The studies relied upon data entered into a national database by individual strength and
conditioning coaches from around the country. Although guidelines are provided to
standardise the testing, the interpretation of the protocols and test performance may be
different between individuals. Nonetheless, players were typically tested by the same
individual strength and conditioning coach, thus minimising the variation (between-
tester error) associated with multiple testers (Hopkins, 2000d). Conversely, the game
statistics included in study two are supplied to the New Zealand Rugby Union by an
external company. Each game is coded by a group of individuals, thus the reliability
between and within testers has not been addressed within the current investigation.
The first two studies do not report a measure of aerobic fitness. During the period in
which data was obtained, there was no standardised aerobic test that was performed. A
greater aerobic capacity facilitates the recovery from repeated high-intensity efforts in
which the game of rugby union is based (Cunniffe et al., 2009; Duthie et al., 2005;
Duthie et al., 2006; Glaister, 2005). Therefore, the monitoring and knowledge of a
player’s aerobic performance may be crucial in the physical preparation of individuals.
As a result of the inconsistency in the components of fitness tested, in 2008 the Yo-Yo
intermittent recovery test level one was added to the RS2
testing battery (chapter three).
The novel protocols utilised to test repeated sprint ability has eliminated the ability to
compare the results with other research. The RS2 test was created from time motion
analysis data to replicate the frequency and duration of efforts, distances covered, and
work to rest ratios performed by both the backs and forwards during competition

128
(Smart, 2005). Therefore tests of this nature have limited scope in the application to
other sports, further limiting its potential use within research.
The major limitation of the third study was the distribution of the sample. Due to a
higher drop out in the older subjects, a larger proportion of the final sample size was
younger subjects. This may have been the primary reason for a lack of clear effect of
age upon the training induced changes. In addition, the unsupervised group had greater
drop out compared to the supervised, resulting in a large discrepancy in the final sample
size (17 and 27 respectively). The greater drop out may have been due to a decreased
adherence, resulting in a lack of motivation from not being part of a team environment
in a centralised facility (Coutts et al., 2004; Mazzetti et al., 2000).
Another limitation of the third study was the lack of a measure for maturation, limiting
the ability to make evidence-based conclusions about the effects varied maturation may
have had upon the changes in physical characteristics. The use of a self reporting
Tanner scale was initially considered, however due to the logistical constraints of
testing 82 players in the initial fitness test, the procedure was not carried out.
Furthermore, non-invasive prediction methods, such as those described by Mirwald et
al. (2002) were discovered after the project had been completed. Nonetheless, the mean
age of the players (15.3 years) was that typically associated with Tanner stage 5,
indicating near full physical maturity (Baxter-Jones et al., 2005). Therefore, notable
pubertal changes may not have been evident in some players.
The programme performed by the players was a generic 15-week strength and
conditioning programme with three gym-based resistance training sessions, one speed
and conditioning session and one aerobic run per week. The larger volume of resistance

129
training may have been the primary cause for the substantial increase in strength
measures compared to the other components of fitness which have been associated with
high level rugby union performance. In addition, it has been suggested programmes for
adolescents are specific to the differences in maturation rather than modified versions of
adults programmes (Smith, 2003). While the programme wasn’t specifically adapted for
maturation it was modified to reflect the degree of training experience.
The testing of physical characteristics in the third study was only carried out on three
occasions. The number of tests performed was primarily due to the logistics of
organising scheduled testing sessions for the large number of participants. The
scheduling was especially difficult in the unsupervised players who were not part of a
structured group that were required to train at a specific time at a specific location.
Therefore, due to a lack of regular monitoring, conclusions surrounding the rates of
physical change in both groups, whether it was linear or parabolic in nature, cannot be
made.
Finally, the follow up to investigate the persistence of the effects was performed six
months post conditioning phase; thus the long-term effects can only be assumed for this
time period. The six month unsupervised competition period limits the ability to make
conclusions about the subsequent off-season. The conditioning programme may have
instilled improved training habits within individuals potentially increasing the
propensity for further improvements in physical characteristics. Furthermore, due to the
young age of the subjects and the relatively short time frame of the study, the concept of
long-term athletic development and changes through the specific stages has not been
addressed.

130
Future Research Areas
With the implementation of a standardised aerobic test in New Zealand rugby,
longitudinal monitoring is required to replicate similar analyses as the present studies.
Specifically, differences between levels and positions, as well as longitudinal
progression and within-athlete changes between competitions are unknown.
Furthermore, the relationship between Yo-Yo performance and on-field behaviours such
as activity rate, require investigation, and may further clarify the unexplained variance
in the correlations between some variables.
Study two is the first study to directly correlate physical characteristics with on-field
game behaviours. Further research is therefore required, not only within rugby union but
other team sports, to further quantify and understand the interaction between these
variables. From the creation of a single on-field measure of performance from a
combination of game statistics, future research should consider the use of multiple
linear regression to assist in the development of stronger predictions (Lim et al., 2009).
A combination of physical characteristics may then be used to predict on-field
performance, which may be more representative of on-field success than a single
component of fitness as used in the present study.
The effect of age as a covariate in the physical development of adolescents produced an
unclear effect. Trends indicated that younger subjects improved more, which may be
due to a lower training age. An inherent issue with using age as a covariate however, is
the potential variations of maturation in players of the same age. Further research into
the effect of age would provide the justification for financial investment into physical
development programmes within specific age groups. Nonetheless, future research of

131
this nature should also establish levels of maturation to provide further physiological
evidence behind the training induced changes in physical characteristics.
The relatively short duration of the training study and follow up (in relation to athletic
career) does not address the specific goals of long-term athletic development. Further
research into long-term follow up over multiple years with multiple off-season
conditioning programmes is therefore required. Studies of this nature will provide
insight into the subsequent changes in physical characteristics made as a result of
further training potentially increasing the likelihood of adult athletic success.
Practical Applications
• The physical characteristics of rugby union players provide normative profiles of
specific positions, playing levels, and yearly trends within New Zealand rugby.
Data such as these will provide coaches with a better understanding of what should
be expected within specific positions and playing levels, and what improvements
could be achieved over period of time.
• The reduction in training load during the Super Rugby competition due to regular
high-intensity matches and long haul travel, does not allow a player to achieve
optimal levels of physical performance compared to other phases of the year.
Coaches should therefore implement strategies, such as more specific periodisation,
or an increased emphasis on recovery, to mitigate any negative effects specific
times of the year have on physical performance.
• The relationships between physical characteristics and game behaviours highlight
the importance of these characteristics in the performance of specific aspects of
132
competition. Aspects of speed, body composition and repeated sprint ability can be
modified within strength and conditioning programmes to reflect the degree to
which each attribute is relied upon in competition.
• The physical development of adolescent athletes should be within organised,
structured and supervised group training environments. This will allow the
attainment of greater training loads and subsequently greater improvements in
physical characteristics compared to the more common unsupervised approach.

133
CHAPTER EIGHT: REFERENCES

134
Argus, C. K., Gill, N., Keogh, J., Hopkins, W. G., & Beaven, C. M. (2010). Effects of a short-term pre-
season training programme on the body composition and anaerobic performance of professional
rugby union players. Journal of Sports Sciences, 28(6), 679-686.
Argus, C. K., Gill, N. D., Keogh, J. W. L., Hopkins, W. G., & Beaven, C. M. (2009). Changes in strength,
power, and steroid hormones during a professional rugby union competition. Journal of Strength
& Conditioning Research, 23(5), 1583-1592.
Atkins, S. J. (2004). Normalizing expressions of strength in elite rugby league players. Journal of
Strength & Conditioning Research, 18(1), 53-58.
Atkins, S. J. (2006). Performance of the Yo-Yo intermittent recovery test by elite professional and
semiprofessional rugby league players. Journal of Strength & Conditioning Research, 20(1),
222-225.
Baker, D. G. (2001a). Comparison of upper-body strength and power between professional and college-
aged rugby league players. Journal of Strength & Conditioning Research, 15(1), 30-35.
Baker, D. G. (2001b). The effects of an in-season of concurrent training on the maintenance of maximal
strength and power in professional and college-aged rugby league football players. Journal of
Strength & Conditioning Research, 15(2), 172-177.
Baker, D. G. (2002). Differences in strength and power among junior-high, senior-high, college-aged, and
elite professional rugby league players. Journal of Strength & Conditioning Research, 16(4),
581-585.
Baker, D. G., & Nance, S. (1999a). The relation between running speed and measures of strength and
power in professional rugby league players. Journal of Strength & Conditioning Research,
13(3), 230-235.
Baker, D. G., & Nance, S. (1999b). The relation between strength and power in professional rugby league
players. Journal of Strength & Conditioning Research, 13(3), 224-229.
Baker, D. G., & Newton, R. U. (2008). Comparison of lower body strength, power, acceleration, speed,
agility, and sprint momentum to describe and compare playing rank among professional rugby
league players. Journal of Strength & Conditioning Research, 22(1), 153-158.
Bangsbo, J., Iaia, F. M., & Krustrup, P. (2008). The Yo-Yo intermittent recovery test: a useful tool for
evaluation of physical performance in intermittent sports. Sports Medicine, 38(1), 37-51.
Baxter-Jones, A. D. G., Eisenmann, J. C., & Sherar, L. B. (2005). Controlling for maturation in pediatric
exercise science. Pediatric Exercise Science 17(1), 18-30.
Beaven, C. M., Gill, N. D., Ingram, J. R., & Hopkins, W. G. (2011). Acute salivary hormone responses to
complex exercise bouts. Journal of Strength & Conditioning Research, 25(4), 1072-1078.

135
Behm, D. G. (1995). Neuromuscular implications and applications of resistance training. The Journal of
Strength & Conditioning Research, 9(4), 264-274.
Bell, W. (1973). Distribution of skinfolds and differences in body proportions in young adult rugby
players. Journal of Sports Medicine & Physical Fitness 13(2), 69-73.
Bell, W. (1979). Body composition of rugby union football players. British Journal of Sports Medicine,
13, 19-23.
Bell, W. (1980). Body composition and maximal aerobic power of rugby union forwards. Journal of
Sports Medicine & Physical Fitness, 20(4), 447-451.
Beunen, G., & Malina, R. M. (1988). Growth and physical performance relative to the timing of the
adolescent spurt. Exercise & Sport Sciences Reviews, 16, 503-540.
Blimkie, C. J. R. (1992). Resistance training during pre- and early puberty: efficacy, trainability,
mechanisms, and persistence. Canadian Journal of Sport Sciences, 17(4), 264-279.
Brewer, J., Davis, J. A., & Kear, J. (1994). A comparison of the physiological characteristics of rugby
league forwards and backs [Abstract]. Journal of Sports Sciences, 12(2), 158.
Buchheit, M., Mendez-Villanueva, A., Quod, M., Quesnel, T., & Ahmaidi, S. (2010). Improving
acceleration and repeated sprint ability in well-trained adolescent handball players: speed versus
sprint interval training. International Journal of Sports Physiology & Performance, 5(2), 152-
164.
Burgess, D. J., & Naughton, G. A. (2010). Talent development in adolescent team sports: a review.
International Journal of Sports Physiology & Performance, 5(1), 103-116.
Burke, L. M., Read, R. S. D., & Gollan, R. A. (1985). Australian Rules football: an anthropometric study
of participants. British Journal of Sports Medicine, 19(2), 100-102.
Carlson, B., Carter, J., Patterson, P., Petti, K., Orfanos, S., & Noffal, G. (1994). Physique and motor
performance characteristics of US national rugby players. Journal of Sports Sciences, 12, 403-
412.
Casagrande, G., & Viviani, F. (1993). Somatotype of Italian rugby players. Journal of Sports Medicine &
Physical Fitness, 33, 65-69.
Christou, M., Smilios, I., Sotiropoulos, K., Volaklis, K., Pilianidis, T., & Tokmakidis, S. P. (2006).
Effects of resistance training on the physical capacities of adolescent soccer players. Journal of
Strength & Conditioning Research, 20(4), 783-791.
Cohen, J. (1988). Statistical Power Analysis for the Behavioral Sciences (2nd ed.). Hillsdale, New Jersey:
Lawrence Erlbaum.

136
Coutts, A. J., Murphy, A. J., & Dascombe, B. J. (2004). Effect of direct supervision of a strength coach on
measures of muscular strength and power in young rugby league players. Journal of Strength &
Conditioning Research 18(2), 316-323.
Coutts, A. J., Reaburn, P., & Abt, G. (2003). Heart rate, blood lactate concentration and estimated energy
expenditure in a semi-professional rugby league team during a match: a case study. Journal of
Sports Sciences, 21(2), 97-103.
Crewther, B. T., Gill, N., Weatherby, R. P., & Lowe, T. (2009). A comparison of ratio and allometric
scaling methods for normalizing power and strength in elite rugby union players. Journal of
Sports Sciences, 27(14), 1575-1580.
Cunniffe, B., Proctor, W., Baker, J. S., & Davies, B. (2009). An evaluation of the physiological demands
of elite rugby union using global positioning system tracking software. Journal of Strength &
Conditioning Research, 23(4), 1195-1203.
Deutsch, M. U., Kearney, G. A., & Rehrer, N. J. (1998a). Lactate equilibrium and aerobic indices of elite
rugby union players [Abstract]. Medicine & Science in Sports & Exercise, 30, S239.
Deutsch, M. U., Kearney, G. A., & Rehrer, N. J. (2007). Time-motion analysis of professional rugby
union players during match-play. Journal of Sports Sciences, 25(4), 461-472.
Deutsch, M. U., Maw, G., Jenkins, D., & Reaburn, P. (1998b). Heart rate, blood lactate and kinematic
data of elite colts (under-19) rugby union players during competition. Journal of Sports Sciences,
16(6), 561-570.
Diallo, O., Dore, E., Duche, P., & van Praagh, E. (2001). Effects of plyometric training followed by a
reduced training programme on physical performance in prepubescent soccer players. Journal of
Sports Medicine & Physical Fitness, 41(3), 342-348.
Duthie, G. M. (2006). A framework for the physical development of elite rugby union players.
International Journal of Sports Physiology & Performance, 1(1), 2-13.
Duthie, G. M., Hooper, S. L., Hopkins, W. G., Livingstone, S., & Pyne, D. B. (2006b). Anthropometry
profiles of elite rugby players: quantifying changes in lean mass. British Journal of Sports
Medicine, 40(3), 202-207.
Duthie, G. M., Pyne, D. B., & Hooper, S. L. (2003). Applied physiology and game analysis of rugby
union. Sports Medicine, 33(13), 973-991.
Duthie, G. M., Pyne, D. B., & Hooper, S. L. (2005). Time motion analysis of 2001 and 2002 Super 12
rugby. Journal of Sports Sciences, 23(5), 523-530.
Duthie, G. M., Pyne, D. B., Marsh, D. J., & Hooper, S. L. (2006). Sprint patterns in rugby union players
during competition. Journal of Strength & Conditioning Research, 20(1), 208-214.

137
Eaves, S. J., & Hughes, M. D. (2003). Patterns of play of international rugby union teams before and after
the introduction of professional status. International Journal of Performance Analysis in Sport,
3(2), 103-111.
Eaves, S. J., Hughes, M. D., & Lamb, K. L. (2005). The consequences of the introduction of professional
playing status on game action variables in international Northern Hemisphere rugby union
football. International Journal of Performance Analysis in Sport, 5(2), 58-86.
Ehlers, G. G., Ball, T. E., & Liston, L. (2002). Creatine kinase levels are elevated during 2-a-day
practices in collegiate football players. Journal of Athletic Training, 37(2), 151-156.
Ekblom, B. (1969). Effects of physical training in adolescent boys. Journal of Applied Physiology, 27(3),
350-355.
Faigenbaum, A. D., Kraemer, W. J., Cahill, B., Chandler, J., Dziados, J., Elfrink, L. D., et al. (1996a).
Youth resistance training: position statement paper and literature review. Strength &
Conditioning Journal, 6, 62-75.
Faigenbaum, A. D., & Myer, G. D. (2010). Resistance training among young athletes: safety, efficacy and
injury prevention effects. British Journal of Sports Medicine, 44(1), 56-63.
Faigenbaum, A. D., Westcott, W. L., Micheli, L. J., Outerbridge, A. R., Long, C. J., LaRosa-Loud, R., et
al. (1996b). The effects of strength training and detraining on children. Journal of Strength &
Conditioning Research, 10(2), 109-114.
Foster, C., Florhaug, J. A., Franklin, J., Gottschall, L., Hrovatin, L. A., Parker, S., et al. (2001). A new
approach to monitoring exercise training. Journal of Strength & Conditioning Research, 15(1),
109-115.
Gabbett, T. J. (2000). Physiological and anthropometric characteristics of amateur rugby league players.
British Journal of Sports Medicine, 34(4), 303-307.
Gabbett, T. J. (2002a). Influence of physiological characteristics on selection in a semi-professional first
grade rugby league team: a case study. Journal of Sports Sciences, 20(5), 399-405.
Gabbett, T. J. (2002b). Physiological characteristics of junior and senior rugby league players. British
Journal of Sports Medicine, 36(5), 334-339.
Gabbett, T. J. (2005a). Changes in physiological and anthropometric characteristics of rugby league
players during a competitive season. Journal of Strength & Conditioning Research, 19(2), 400-
408.
Gabbett, T. J. (2005b). A comparison of physiological and anthropometric characteristics among playing
positions in junior rugby league players. British Journal of Sports Medicine, 39(9), 675-680.

138
Gabbett, T. J. (2005c). Physiological and anthropometric characteristics of junior rugby league players
over a competitive season. Journal of Strength & Conditioning Research, 19(4), 764-771.
Gabbett, T. J. (2006). Performance changes following a field conditioning program in junior and senior
rugby league players. Journal of Strength & Conditioning Research, 20(1), 215-221.
Gabbett, T. J. (2009). Physiological and anthropometric correlates of tackling ability in rugby league
players. Journal of Strength & Conditioning Research, 23(2), 540-548.
Gabbett, T. J., & Domrow, N. (2007). Relationships between training load, injury, and fitness in sub-elite
collision sport athletes. Journal of Sports Sciences, 25(13), 1507-1519.
Gabbett, T. J., Georgieff, B., Anderson, S., Cotton, B., Savovic, D., & Nicholson, L. (2006). Changes in
skill and physical fitness following training in talent-identified volleyball players. Journal of
Strength & Conditioning Research, 20(1), 29-35.
Gabbett, T. J., & Herzig, P. J. (2004). Physiological characteristics of junior elite and sub-elite rugby
league players. Strength & Conditioning Coach, 12(2), 19-24.
Gabbett, T. J., Johns, J., & Riemann, M. (2008a). Performance changes following training in junior rugby
league players. Journal of Strength & Conditioning Research, 22(3), 910-917.
Gabbett, T. J., Kelly, J. N., & Pezet, T. (2007). Relationship between physical fitness and playing ability
in rugby league players. Journal of Strength & Conditioning Research 21(4), 1126-1133.
Gabbett, T. J., Kelly, J. N., & Pezet, T. (2008b). A comparison of fitness and skill among playing
positions in sub-elite rugby league players. Journal of Science & Medicine in Sport, 11(6), 585-
592.
Gabbett, T. J., Kelly, J. N., Ralph, S., & Driscoll, D. (2009). Physiological and anthropometric
characteristics of junior elite and sub-elite rugby league players, with special reference to starters
and non-starters. Journal of Science & Medicine in Sport 12(1), 215-222.
Gabbett, T. J., Kelly, J. N., & Sheppard, J. M. (2008c). Speed, change of direction speed, and reactive
agility of rugby league players. Journal of Strength & Conditioning Research, 22(1), 174-181.
Gabbett, T. J., King, T., & Jenkins, D. (2008d). Applied physiology of rugby league. Sports Medicine,
38(2), 119-138.
Gabbett, T. J., & Ryan, P. (2009). Tackling technique, injury risk, and playing performance in high-
performance collision sport athletes. International Journal of Sports Science & Coaching, 4(4),
521-533.
Glaister, M. (2005). Multiple sprint work: physiological responses, mechanisms of fatigue and the
influence of aerobic fitness. Sports Medicine, 35(9), 757-777.

139
Gorostiaga, E. M., Izquierdo, M., Iturralde, P., Ruesta, M., & Ibanez, J. (1999). Effects of heavy
resistance training on maximal and explosive force production, endurance and serum hormones
in adolescent handball players. European Journal of Applied Physiology & Occupational
Physiology, 80, 485-493.
Grant, S. J., Oommen, G., McColl, G., Taylor, J., Watkins, L., Friel, N., et al. (2003). The effect of ball
carrying method on sprint speed in rugby union football players. Journal of Sports Sciences
21(12), 1009-1015.
Hamill, B. P. (1994). Relative safety of weightlifting and weight training. Journal of Strength &
Conditioning Research, 8(1), 53-57.
Hanon, C., Lepretre, P.-M., Bishop, D., & Thomas, C. (2010). Oxygen uptake and blood metabolic
responses to a 400-m run. European Journal of Applied Physiology, 109(2), 233-240.
Hetzler, R. K., DeRenne, C., Buxton, B. P., Ho, K. W., Chai, D. X., & Seichi, G. (1997). Effects of 12
weeks of strength training on anaerobic power in prepubescent male athletes. Journal of Strength
& Conditioning Research, 11(3), 174-181.
Holway, F. E., & Garavaglia, R. (2009). Kinanthropometry of Group I rugby players in Buenos Aires,
Argentina. Journal of Sports Sciences, 27(11), 1211-1220.
Hopkins, W. (2000a). Analysis of validity by linear regression (Excel spreadsheet). Retrieved from
sportsci.org/resource/stats/xvalid.xls
Hopkins, W. (2000b). Reliability from consecutive pairs of trials (Excel spreadsheet). Retrieved from
sportsci.org/recourse/stats/xrely.xls
Hopkins, W. (2000c). Summarizing data: precision of measurement. Retrieved from
sportsci.org/resource/stats/index.html
Hopkins, W. G. (2000d). Measures of reliability in sports medicine and science. Sports Medicine, 30(1),
1-15.
Hopkins, W. G. (2006). Spreadsheets for analysis of controlled trials, with adjustment for a subject
characteristic. Sportscience, 10, 46-50. Retrieved from
http://www.sportsci.org/2006/wghcontrial.pdf
Hopkins, W. G. (2007). A spreadsheet for deriving a confidence interval, mechanistic inference and
clinical inference from a p value. Sportscience, 11, 16-20.
Hopkins, W. G., Marshall, S. W., Batterham, A. M., & Hanin, J. (2009). Progressive statistics for studies
in sports medicine and exercise science. Medicine & Science in Sports & Exercise, 41(1), 3-12.
Hopkins, W. G., Schabort, E. J., & Hawley, J. A. (2001). Reliability of power in physical performance
tests. Sports Medicine, 31(3), 211-234.

140
Hughes, M. D., & Bartlett, R. M. (2002). The use of performance indicators in performance analysis.
Journal of Sports Sciences, 20(10), 739-754.
Ingle, L., Sleap, M., & Tolfrey, K. (2006). The effect of a complex training and detraining programme on
selected strength and power variables in early pubertal boys. Journal of Sports Sciences, 24(9),
987-997.
James, N., Mellalieu, S. D., & Jones, N. M. P. (2005). The development of position-specific performance
indicators in professional rugby union. Journal of Sports Sciences, 23(1), 63-72.
Jones, A., & Climstein, M. (2002). Metabolic fitness index for team sports: MFITS. Strength &
Conditioning Journal, 24(5), 35-37.
Jones, N. M. P., James, N., & Mellalieu, S. D. (2008). An objective method for depicting team
performance in elite professional rugby union. Journal of Sports Sciences 26(7), 691-700.
Jones, N. M. P., Mellalieu, S. D., & James, N. (2004). Team performance indicators as a function of
winning and losing in rugby union. International Journal of Performance Analysis in Sport,
4(1), 61-71.
Kraemer, W. J., Fry, A. C., Frykman, P. N., Conroy, B., & Hoffman, J. (1989). Resistance training and
youth. Pediatric Exercise Science, 1(4), 336-350.
Kraemer, W. J., Patton, J. F., Gordon, S. E., Harman, E. A., Deschenes, M. R., Reynolds, K., et al.
(1995). Compatibility of high-intensity strength and endurance training on hormonal and skeletal
muscle adaptations. Journal of Applied Physiology, 78(3), 976-989.
Krustrup, P., Mohr, M., Amstrup, T., Rysgaard, T., Johansen, J., Steensberg, A., et al. (2003). The Yo-Yo
intermittent recovery test: physiological response, reliability, and validity. Medicine & Science
in Sports & Exercise, 35(4), 697-705.
Laird, P., & Lorimer, R. (2004). An examination of try scoring in rugby union: a review of international
rugby statistics. International Journal of Performance Analysis in Sport, 4(1), 72-80.
Landers, J. (1985). Maximum based on reps. National Strength & Conditioning Association Journal 6,
60-61.
Leger, L. A., & Lambert, J. (1982). A maximal multistage 20-m shuttle run test to predict VO2 max.
European Journal of Applied Physiology, 49(1), 1-12.
Lim, E., Lay, B., Dawson, B., Wallman, K., & Aanderson, S. (2009). Development of a player impact
ranking matrix in Super 14 rugby union. International Journal of Performance Analysis in Sport,
9(3), 354-367.

141
Lundy, B., O'Connor, H., Pelly, F., & Caterson, I. (2006). Anthropometric characteristics and competition
dietary intakes of professional rugby league players. International Journal of Sport Nutrition &
Exercise Metabolism, 16(2), 199-213.
Maud, P. J. (1983). Physiological and anthropometric parameters that describe a rugby union team.
British Journal of Sports Medicine, 17(1), 16-23.
Maud, P. J., & Shultz, B. B. (1984). The US national rugby team: a physiological and anthropometric
assessment. Physician & Sportsmedicine, 12(9), 86-94;99.
Mazzetti, S. A., Kraemer, W. J., Volek, J. S., Duncan, N. D., Ratamess, N. A., Gomez, A. L., et al.
(2000). The influence of direct supervision of resistance training on strength performance.
Medicine & Science in Sports & Exercise, 32(6), 1175-1184.
McKenzie, A. D., Holmyard, D. J., & Docherty, D. (1989). Quantitative analysis of rugby: factors
associated with success in contact. Journal of Human Movement Studies, 17(3), 101-113.
Meckel, Y., Machnai, O., & Ellakim, A. (2009). Relationship among repeated sprint tests, aerobic fitness,
and anaerobic fitness in elite adolecent soccer players. Journal of Strength & Conditioning
Research, 23(1), 163-169.
Meir, R. (1993). Seasonal changes in estimates of body composition in professional rugby league players.
Sport Health 11(4), 27-31.
Meir, R., Newton, R., Curtis, E., Fardell, M., & Butler, B. (2001). Physical fitness qualities of
professional rugby league football players: determination of positional differences. Journal of
Strength & Conditioning Research, 15(4), 450-458.
Mirwald, R. L., Baxter-Jones, A. D. G., Bailey, D. A., & Beunen, G. P. (2002). An assessment of
maturity from anthropometric measurements. Medicine & Science in Sports & Exercise, 34(4),
689-694.
Moritani, T., & DeVries, H. A. (1979). Neural factors versus hypertrophy in the time course of muscle
strength gain. American Journal of Physical Medicine, 58(3), 115.
Nicholas, C., & Baker, J. (1995). Anthropometric and physiological characteristic of first- and second-
class rugby union players [Abstract]. Journal of Sports Sciences, 13, 15.
Nicholas, C. W. (1997). Anthropometric and physiological characteristics of rugby union football players.
Sports Medicine, 23(6), 375-396.
Norton, K., Whittingham, N., Carter, L., Kerr, D., Gore, C., & Marfell-Jones, M. (2004). Measurement
techniques in anthropometry. In K. Norton & T. Olds (Eds.), Anthropometrica (pp. 25-75).
Sydney, Australia: University of New South Wales Press Ltd.

142
NSCA. (1985). Position paper on prepubescent strength training. National Strength & Conditioning
Association Journal 7(4), 27-31.
O'Connor, D. (1996). Physiological characteristics of professional rugby league players. Strength &
Conditioning Coach, 4(1), 21-26.
O'Donoghue, P. (2005). Normative profiles of sports performance. International Journal of Performance
Analysis in Sport, 5, 104-119.
Olds, T. (2001). The evolution of physique in male rugby union players in the twentieth century. Journal
of Sports Sciences, 19(4), 253-262.
Payne, V. G., Morrow, J. R., Johnson, L., & Dalton, S. N. (1997). Resistance training in children and
youth: a meta-analysis. Research Quarterly for Exercise & Sport 68(1), 80-88.
Ploutz, L., Tesch, P., Biro, R., & Dudley, G. (1994). Effect of resistance training on muscle use during
exercise. Journal of Applied Physiology, 76, 1675-1681.
Prim, S., van Rooyen, M., & Lambert, M. (2006). A comparison of performance indicators between the
four South African teams and the winners of the 2005 Super 12 Rugby competition. What
separates top from bottom? International Journal of Performance Analysis in Sport, 6(2), 126-
133.
Pyne, D., Gardner, A., Sheehan, K., & Hopkins, W. (2005). Fitness testing and career progression in AFL
football. Journal of Science & Medicine in Sport, 8(3), 321-332.
Quarrie, K. L., Handcock, P., Toomey, M. J., & Waller, A. E. (1996). The New Zealand Rugby Injury
and Performance Project. IV. Anthropometric and physical performance comparisons between
positional categories of senior A rugby players. British Journal of Sports Medicine, 30(1), 53-56.
Quarrie, K. L., Handcock, P., Waller, A. E., Chalmers, D. J., Toomey, M. J., & Wilson, B. D. (1995). The
New Zealand Rugby Injury and Performance Project. III. Anthropometric and physical
performance characteristics of players. British Journal of Sports Medicine, 29(4), 263-270.
Quarrie, K. L., & Hopkins, W. G. (2007). Changes in player characteristics and match activities in
Bledisloe Cup rugby union from 1972 to 2004. Journal of Sports Sciences, 25, 895-903.
Ramsay, J. A., Blimkie, C. J., Smith, K., Garner, S., MacDougall, J. D., & Sale, D. G. (1990). Strength
training effects in prepubescent boys. Medicine & Science in Sports & Exercise, 22(5), 605-614.
Ramsbottom, R., Brewer, J., & Williams, C. (1988). A progressive shuttle run test to estimate maximal
oxygen uptake. British Journal of Sports Medicine, 22(4), 141-144.
Reilly, T. (1997). The physiology of rugby union football. Biology of Sport, 14(2), 83-101.

143
Reilly, T., & Stratton, G. (1995). Children and adolescents in sport: physiological considerations. Sports
Exercise & Injury, 1(4), 207-213.
Roberts, S. P., Trewartha, G., Higgitt, R. J., El-Abd, J., & Stokes, K. A. (2008). The physical demands of
elite English rugby union. Journal of Sports Sciences 26(8), 825.
Sasaki, K., Furukawa, T., Maurakami, J., Shimozono, H., Nagamatsu, M., Miyao, M., et al. (2007).
Scoring profiles and defense performance analysis in rugby union. International Journal of
Performance Analysis in Sport, 7(3), 46-53.
Sawyer, D. T., Ostarello, J. Z., Suess, E. A., & Dempsey, M. (2002). Relationship between football
playing ability and selected performance measures. Journal of Strength & Conditioning
Research, 16(4), 611-616.
Sayers, M. G. L., & Washington-King, J. (2005). Characteristics of effective ball carries in Super 12
rugby. International Journal of Performance Analysis in Sport, 5(3), 92-106.
Scott, A. C., Roe, N., Coats, A. J. S., & Piepoli, M. F. (2003). Aerobic exercise physiology in a
professional rugby union team. International Journal of Cardiology, 87(2-3), 173-177.
Siri, W. E. (1961). Body volume measurement by gas dilution. In J. Brozek & A. Henschel (Eds.),
Techniques for measuring body composition (pp. 108-117). Washington, DC: National Academy
of Sciences, National Research Council.
Slater, G. J., Duthie, G. M., Pyne, D. B., & Hopkins, W. G. (2006). Validation of a skinfold based index
for tracking proportional changes in lean mass. British Journal of Sports Medicine, 40(3), 208-
213.
Smart, D. J. (2005). The reliability of a rugby union specific test: with reference to the relationship
between performance and the concentration of testosterone and cortisol (Unpublished Masters
Thesis). WINTEC, Hamilton, New Zealand.
Smart, D. J., Gill, N. D., Beaven, C. M., Cook, C. J., & Blazevich, A. J. (2008). The relationship between
changes in interstitial creatine kinase and game-related impacts in rugby union. British Journal
of Sports Medicine, 42(3), 198-201.
Smith, D. J. (2003). A framework for understanding the training process leading to elite performance.
Sports Medicine, 33(15), 1103-1126.
Takarada, Y. (2003). Evaluation of muscle damage after a rugby match with special reference to tackle
plays. British Journal of Sports Medicine, 37(5), 416-419.
Tong, R. J., & Mayes, R. (1995). The effect of pre-season training on the physiological characteristics
rugby union players [Abstract]. Journal of Sports Sciences, 13(6), 507-507.

144
Tsolakis, C. K., Messinis, D., Stergioulas, A., & Dessypris, A. G. (2000). Hormonal responses after
strength training and detraining in prepubertal and pubertal boys. Journal of Strength &
Conditioning Research, 14(4), 399-404.
Tsolakis, C. K., Vagenas, G. K., & Dessypris, A. G. (2003). Growth and anabolic hormones, leptin, and
neuromuscular performance in moderately trained prepubescent athletes and untrained boys.
Journal of Strength & Conditioning Research 17(1), 40-46.
Tsolakis, C. K., Vagenas, G. K., & Dessypris, A. G. (2004). Strength adaptations and hormonal responses
to resistance training and detraining in preadolescent males. Journal of Strength & Conditioning
Research, 18(3), 625-629.
Vaeyens, R., Lenoir, M., Williams, A. M., & Philippaerts, R. M. (2008). Talent identification and
development programmes in sport: current models and future directions. Sports Medicine, 38(9),
703-714.
van Rooyen, M., Rock, K., Prim, S., & Lambert, M. (2008). The quantification of contacts with impact
during professional rugby matches. International Journal of Performance Analysis in Sport,
8(1), 113-126.
Viru, A. (1992). Plasma hormones and physical exercise. International Journal of Sports Medicine, 13,
201-209.
Walsh, M., Young, B., Hill, B., Kittredge, K., & Horn, T. (2007). The effect of ball-carrying technique
and experience on sprinting in rugby union. Journal of Sports Sciences, 25(2), 185-192.
Wheeler, K., & Sayers, M. (2009). Contact skills predicting tackle-breaks in rugby union. International
Journal of Sports Science & Coaching, 4(4), 535-544.
Withers, R. T., Laforgia, J., Heymsfield, S., Wang, Z., & Pillans, R. (2004). Two, three, and four-
compartment chemical models of body composition analysis. In K. Norton & T. Olds (Eds.),
Anthropometrica (pp. 199-231). Sydney, Australia: University of New South Wales Press Ltd.
Wong, P.-L., Chamari, K., & Wisloff, U. (2010). Effects of 12-week on-field combined strength and
power training on physical performance among U-14 young soccer players. Journal of Strength
& Conditioning Research, 24(3), 644-652.
Young, W., Newton, R., Doyle, T., Chapman, D., Cormack, S., Stewart, G., et al. (2005). Physiological
and anthropometric characteristics of starters and non-starters and playing positions in elite
Australian rules football : a case study. Journal of Science & Medicine in Sport 8(3), 333-345.
Young, W., & Pryor, L. (2007). Relationship between pre-season anthropometric and fitness measures
and indicators of playing performance in elite junior Australian rules football. Journal of Science
& Medicine in Sport, 10(2), 110-118.

145
Zuliani, U., Bonetti, A., Franchini, D., Serventi, G., Ugolotti, G., & Varacca, A. (1985). Effect of boxing
on some metabolic indices of muscular contraction. International Journal of Sports Medicine,
6(4), 234-236.

146
CHAPTER NINE: APPENDICIES

147
Appendix One: Ethics Approval
M E M O R A N D U M Auckland University of Technology Ethics Committee (AUTEC)
To: Will Hopkins From: Madeline Banda Executive Secretary, AUTEC Date: 4 April 2007 Subject: Ethics Application Number 06/226 Physical, training and injury characteristics of rugby
union players.
Dear Will
Thank you for providing written evidence as requested. I am pleased to advise that the Chair and I as the Executive Secretary of the Auckland University of Technology Ethics Committee (AUTEC) have approved the first stage of your ethics application on the clear understanding that the consent processes involved are approved for this research only. This is in recognition of the provision of Information Sheets to all participants and the focus and nature of the research. This approval will not be used as a precedent for other applications. AUTEC continues to have concerns about the informed and voluntary nature of consent given prior to receipt of information or as part of an employment agreement or financially related contract and is seeking further advice on this matter. This delegated approval is made in accordance with section 5.3.2.3 of AUTEC’s Applying for Ethics Approval: Guidelines and Procedures and is subject to endorsement at AUTEC’s meeting on 16 April 2007.
This research has been approved in stages and the research tools for the later stages are to be submitted to AUTEC for approval before the data collection for those stages commences.
Your ethics application is approved for a period of three years until 4 January 2010.
I advise that as part of the ethics approval process, you are required to submit to AUTEC the following:
• A brief annual progress report indicating compliance with the ethical approval given using form EA2, which is available online through http://www.aut.ac.nz/research/ethics, including when necessary a request for extension of the approval one month prior to its expiry on 4 January 2010;
• A brief report on the status of the project using form EA3, which is available online through http://www.aut.ac.nz/research/ethics. This report is to be submitted either when the approval expires on 4 January 2010 or on completion of the project, whichever comes sooner;
It is also a condition of approval that AUTEC is notified of any adverse events or if the research does not commence and that AUTEC approval is sought for any alteration to the research, including any alteration of or addition to the participant documents involved.
You are reminded that, as applicant, you are responsible for ensuring that any research undertaken under this approval is carried out within the parameters approved for your application. Any change to the research outside the parameters of this approval must be submitted to AUTEC for approval before that change is implemented.
Please note that AUTEC grants ethical approval only. If you require management approval from an institution or organisation for your research, then you will need to make the arrangements necessary to obtain this. Also, should your research be undertaken within a jurisdiction outside New Zealand, you will need to make the arrangements necessary to meet the legal and ethical requirements that apply within that jurisdiction.
To enable us to provide you with efficient service, we ask that you use the application number and study title in all written and verbal correspondence with us. Should you have any further enquiries regarding this matter, you are welcome to contact Charles Grinter, Ethics Coordinator, by email at [email protected] or by telephone on 921 9999 at extension 8860.
On behalf of the Committee and myself, I wish you success with your research and look forward to reading about it in your reports.
Yours sincerely
Madeline Banda Executive Secretary Auckland University of Technology Ethics Committee

148
MEMORANDUM Auckland University of Technology Ethics Committee (AUTEC)
To: Will Hopkins From: Madeline Banda Executive Secretary, AUTEC Date: 23 October 2007 Subject: Ethics Application Number 07/155 The effectiveness of an off-season physical
development programme in young rugby union players.
Dear Will
I am pleased to advise that the Chair and the Executive Secretary of Auckland University of Technology Ethics Committee (AUTEC), acting under delegated authority, approved your ethics application and that it is subject to endorsement at AUTEC's meeting on 12 November 2007.
Your application is now approved for a period of three years until 23 October 2010.
I advise that as part of the ethics approval process, you are required to submit to AUTEC the following:
• A brief annual progress report indicating compliance with the ethical approval given using form EA2, which is available online through http://www.aut.ac.nz/about/ethics, including when necessary a request for extension of the approval one month prior to its expiry on 23 October 2010;
• A brief report on the status of the project using form EA3, which is available online through http://www.aut.ac.nz/about/ethics. This report is to be submitted either when the approval expires on 23 October 2010 or on completion of the project, whichever comes sooner;
It is also a condition of approval that AUTEC is notified of any adverse events or if the research does not commence and that AUTEC approval is sought for any alteration to the research, including any alteration of or addition to the participant documents involved.
You are reminded that, as applicant, you are responsible for ensuring that any research undertaken under this approval is carried out within the parameters approved for your application. Any change to the research outside the parameters of this approval must be submitted to AUTEC for approval before that change is implemented.
Please note that AUTEC grants ethical approval only. If you require management approval from an institution or organisation for your research, then you will need to make the arrangements necessary to obtain this.
To enable us to provide you with efficient service, we ask that you use the application number and study title in all written and verbal correspondence with us. Should you have any further enquiries regarding this matter, you are welcome to contact Charles Grinter, Ethics Coordinator, by email at [email protected] or by telephone on 921 9999 at extension 8860.
On behalf of the Committee and myself, I wish you success with your research and look forward to reading about it in your reports.
Yours sincerely
Madeline Banda Executive Secretary Auckland University of Technology Ethics Committee

149
MEMORANDUM Auckland University of Technology Ethics Committee (AUTEC)
To: Will Hopkins From: Madeline Banda Executive Secretary, AUTEC Date: 22 September 2008 Subject: Ethics Application Number 08/163 The validity and reliability of field based fitness
assessments used in testing rugby union players.
Dear Will
Thank you for providing written evidence as requested. I am pleased to advise that it satisfies the points raised by the Auckland University of Technology Ethics Committee (AUTEC) at their meeting on 14 July 2008 and I have approved your ethics application. This delegated approval is made in accordance with section 5.3.2.3 of AUTEC’s Applying for Ethics Approval: Guidelines and Procedures and is subject to endorsement at AUTEC’s meeting on 13 October 2008.
Your ethics application is approved for a period of three years until 22 September 2011.
I advise that as part of the ethics approval process, you are required to submit the following to AUTEC:
• A brief annual progress report using form EA2, which is available online through http://www.aut.ac.nz/about/ethics. When necessary this form may also be used to request an extension of the approval at least one month prior to its expiry on 22 September 2011;
• A brief report on the status of the project using form EA3, which is available online through http://www.aut.ac.nz/about/ethics. This report is to be submitted either when the approval expires on 22 September 2011 or on completion of the project, whichever comes sooner;
It is a condition of approval that AUTEC is notified of any adverse events or if the research does not commence. AUTEC approval needs to be sought for any alteration to the research, including any alteration of or addition to any documents that are provided to participants. You are reminded that, as applicant, you are responsible for ensuring that research undertaken under this approval occurs within the parameters outlined in the approved application.
Please note that AUTEC grants ethical approval only. If you require management approval from an institution or organisation for your research, then you will need to make the arrangements necessary to obtain this.
When communicating with us about this application, we ask that you use the application number and study title to enable us to provide you with prompt service. Should you have any further enquiries regarding this matter, you are welcome to contact Charles Grinter, Ethics Coordinator, by email at [email protected] or by telephone on 921 9999 at extension 8860.
On behalf of the AUTEC and myself, I wish you success with your research and look forward to reading about it in your reports.
Yours sincerely
Madeline Banda Executive Secretary Auckland University of Technology Ethics Committee

150
Appendix Two: Information Sheets
Participant Information
Sheet
Date Information Sheet Produced:
8 February 2007
Project Title
Physical, training, and injury characteristics of rugby union players.
What is the purpose of this research?
The primary purpose of this project is to profile rugby union player’s physical characteristics, training load, competitive events, and injury incidence across various playing levels (from All Blacks to regional age group representatives) within New Zealand. The project is the first study of the primary researchers Doctoral thesis. The primary researcher is working closely with the New Zealand Rugby Union (NZRU). Therefore, the information gained from this research will also help develop nationally run programmes to improve aspects of physical development that have been found to be inefficient at preparing players to become elite professionals.
How was I chosen for this invitation?
The group of players from which you are part of, were selected as participants within the project by the NZRU. This is as your group will assist in providing the best cross section of the current physical state of rugby players within New Zealand.
What will happen in this research?
You will perform two fitness testing sessions per season (pre- and post-season) for a maximum of two seasons.
Elite Rugby Union Players (All Blacks, S14, NPC) National Age Group Representatives (Under 17, Under 19, Under 21)
If you are part of one of these teams you will be asked to perform a 20-m or 30-m speed test; agility test; a maximal repeated speed test based on rugby specific movements; strength and power assessments based on weights lifted in (one repetition maximum) gym based exercises (bench-press, squats etc.); and have body composition measurements taken from you (skin folds and body mass).
Regional Age Group Representatives (Under 14, Under 16, Under 18)
If you are part of one of these teams you will be asked to perform a 20-m or 30-m speed test; agility test; a maximal running test involving a 60-m, 400-m and 1500-m run; maximal vertical jump for height; estimated one repetition maximum from gym based exercises; and have body composition measurements taken from you (skin folds and body mass).
Over the course of the season, the primary researcher will also gain feedback on training (what the team did, how long it was and the intensity it was performed at) the team has done, any injuries that you may have had, and gather game statistics from AnalyRugy about all competitions participated in.

151
What are the discomforts and risks?
The only discomforts you will experience during fitness testing are shortness of breath and localised muscular soreness in the legs. This pain and discomfort will be no more than that experienced during regular training and rugby matches.
What compensation is available for injury or negligence?
Compensation is available through the Accident Compensation Corporation within its normal limitations.
How will my privacy be protected?
The consent forms and any other written information about you will have your name removed and replaced with a number to identify you and will be kept in a locked cabinet at the School of Sport and Exercise Science at WINTEC. Any electronic information (i.e. computer generated results) will also have your name removed and replaced with a subject number and be stored on a computer that requires a password to enter it.
What are the costs of participating in this research?
There are no financial costs involved in the project. Each pre- and post-season testing session will last approximately an hour and a half, thus only three hours of your time is required over a season (one year), and six hours over the period of two seasons if required.
What opportunity do I have to consider this invitation?
You will have up to a period of two weeks to consider participating in the project.
How do I agree to participate in this research?
If you are part of the elite rugby union team, you will not be required to sign an informed consent, as your player registration form at club level includes the clause stated below:
“Pursuant to the Privacy Act the following is brought to your attention. This form collects personal information for the purposes of (i) the general administration of the game of rugby football, including statistical analysis and injury insurance and research, and (ii) the promotion of the game of football, including the marketing to rugby football players by sponsors of the game of rugby football. The information will be held by the (club/organisation) that you play for and/or the Provincial Union that such (club/organisation) is affiliated to and/or the New Zealand Rugby Union (’NZRU’). The information may also be provided (in whole or part) to other persons for the furtherance of the purposes stated above. You have rights to access (and correct) such personal information as provided for in the Privacy Act. Please contact the NZRU in the first instance at PO Box 2172 Wellington. Your signing of this form constitutes authorisation of the use and disclosure of the personal information in accordance with the purposes set out above. Please cross out any of the following entities from which you do not wish to receive promotional or sponsors material: NZRU / PROVINCIAL UNION / CLUB. Failure to complete this form (or the provision of incorrect information) may result in your being ineligible for insurance cover arranged for players by the NZRU.”
For all other participants your participation in this project is purely voluntary and if you choose not to participate you will not be adversely affected in any way.
If you do decide to participate in this study, you will need to complete an informed consent which will be available from the researcher Daniel Smart after the group briefing about the project. If you are under the age of 16 years, your parents or legal guardian will also need to provide consent by signing a separate sheet. If you are under 16, please let the researcher know and he will provide you with the appropriate form for your parents to complete.

152
At any stage of the project that you do not want to continue, for what ever reason, you may withdraw without any adverse consequences.
Will I receive feedback on the results of this research?
Yes, you will receive instantaneous feedback about the results of the fitness tests you perform pre- and post- season. Results from pre-season testing will also be available at post-season testing to compare and see how you have improved over the course of the season.
What do I do if I have concerns about this research?
Any concerns regarding the nature of this project should be notified in the first instance to the Project Supervisor, Prof. Will Hopkins; Auckland University of Technology, Division of Sport and Recreation, Private Bag 920006, Auckland; (09) 921 9793.
Concerns regarding the conduct of the research should be notified to the Executive Secretary, AUTEC, Madeline Banda, [email protected] , 921 9999 ext 8044. Whom do I contact for further information about this research? Researcher Contact Details:
Daniel Smart School of Sport and Exercise Science WINTEC Private Bag 3036 Hamilton Phone Mobile: (027) 319 7255 Email: [email protected]
Research Supervisor Contact Details: Primary Supervisor Prof. Will Hopkins Auckland University of Technology Division of Sport and Recreation Private Bag 920006 Auckland Phone Work: (09) 921 9793 Email: [email protected]
Secondary Supervisor Dr. Nicholas Gill School of Sport and Exercise Science WINTEC Private Bag 3036 Hamilton Phone Work: (07) 834 8800 ext 8407 Email: [email protected]

153
Participant Information
Sheet
Date Information Sheet Produced:
6 August 2007
Project Title
The effectiveness of an off-season physical development programme in young rugby union players
What is the purpose of this research?
The primary purpose of this project are to determine the extent of changes in physical characteristics as a result of an off-season training programme and quantify the loss of training effects during the subsequent rugby union season within different age groups. The project is the second study of the primary researchers Doctoral thesis. The primary researcher is working closely with the New Zealand Rugby Union (NZRU). Therefore, the information gained from this research will also help develop nationally run programmes to improve aspects of physical development that have been found to be inefficient at preparing players to become elite professionals.
How was I chosen for this invitation?
The group of players from which you are part of, were selected as participants within the project by the NZRU. This is as your group is seen as important in the development of elite rugby union players of the future.
What will happen in this research?
You will either participate in an off-season physical development programme or be left to carry on with your summer with training recommendations.
Physical Development Programme
If you have been randomly selected to participate in the off-season physical development programme you will be required to attend up to five x 1 hour group training sessions per week. This will involve weight training and on-field speed or conditioning sessions. You may also be required to perform at least one session per week unsupervised in your own time. At the end of the 14 week programme, you will perform another group fitness testing session (the same tests as you have performed previously) before going back to your club or school team. At the end of the club or school season you will be tested a final two times (pre- and post-representative season) using the same fitness tests.
Control Group
If you have been randomly selected to be involved in the control group you will not be required to attend any training sessions over the summer period, except a testing session at the end of summer, before club or school rugby starts up again next year. This testing session will be the same as the previous fitness tests you performed pre- and post-representative season. After school and club rugby has finished you will be asked to perform another series of fitness tests (the same tests) pre- and post-representative season. Although not attending sessions, you will be given training recommendations for the summer period for which you can perform.

154
What are the discomforts and risks?
The only discomforts you will experience during fitness testing and training are shortness of breath and localised muscular soreness in the legs. This pain and discomfort will be no more than that experienced during regular training and rugby matches.
What compensation is available for injury or negligence?
Compensation is available through the Accident Compensation Corporation within its normal limitations.
How will my privacy be protected?
The consent forms and any other written information about you will have your name removed and replaced with a number to identify you and will be kept in a locked cabinet at the School of Sport and Exercise Science at WINTEC. Any electronic information (i.e. computer generated results) will also have your name removed and replaced with a subject number and be stored on a computer that requires a password to enter it.
What are the costs of participating in this research?
There are no financial costs involved in the project. The testing battery will take approximately an hour to perform, thus a total of seven and a half hours will be required of participants over the period of a year for testing. If you are involved in the physical development programme, prior to the intervention, participants will be given recommendations for physical preparation over a 6 week ‘recovery’ period leading into the training period. The intervention period will last for 14 weeks, which will be made up of three x 4 week phases from December to March with two weeks unsupervised training over the Christmas/New Year period. Participants will be required to attend up to five x 1 hour group train sessions per week for the duration of the programme and may be asked to perform additional sessions in their own time. Therefore over the 20 week period of the recovery and development programme, a maximum of 120 hours of your time will be required.
What opportunity do I have to consider this invitation?
You will have up to a period of two weeks to consider participating in the project.
How do I agree to participate in this research?
Your participation in this project is purely voluntary and if you choose not to participate you will not be adversely affected in any way.
If you do decide to participate in this study, you will need to complete an informed consent which will be available from the researcher Daniel Smart after the group briefing about the project. If you are under the age of 16 years, your parents or legal guardian will also need to provide consent by signing a separate sheet. If you are under 16, please let the researcher know and he will provide you with the appropriate form for your parents to complete.
At any stage of the project that you do not want to continue, for what ever reason, you may withdraw without any adverse consequences.
Will I receive feedback on the results of this research?
Yes, you will receive instantaneous feedback about the results of the fitness tests you perform. Results from previous testing will also be available at subsequent testing to compare and see how you have improved over the course of the season or year.
If you are involved in the intervention, regular checkpoints will be performed to monitor your progression and the effectiveness of the training programme.

155
What do I do if I have concerns about this research?
Any concerns regarding the nature of this project should be notified in the first instance to the Project Supervisor, Prof. Will Hopkins; Auckland University of Technology, Division of Sport and Recreation, Private Bag 920006, Auckland; (09) 921 9793.
Concerns regarding the conduct of the research should be notified to the Executive Secretary, AUTEC, Madeline Banda, [email protected] , 921 9999 ext 8044.
Whom do I contact for further information about this research? Researcher Contact Details Daniel Smart School of Sport and Exercise Science WINTEC Private Bag 3036 Hamilton Phone Mobile: (027) 319 7255 Email: [email protected] Primary Supervisor Contact Details: Primary Supervisor Prof. Will Hopkins Auckland University of Technology Division of Sport and Recreation Private Bag 920006 Auckland Phone Work: (09) 921 9793 Email: [email protected]
Secondary Supervisor Dr. Nicholas Gill School of Sport and Exercise Science WINTEC Private Bag 3036 Hamilton Phone Work: (07) 834 8800 ext 8407 Email: [email protected]

156
Participant Information
Sheet
Date Information Sheet Produced:
31 July 2008
Project Title
The validity and reliability of field based fitness assessments used in testing rugby union players.
An Invitation
My name is Daniel Smart and you are invited to participate in my research. This research is part of a larger project profiling rugby union player’s physical characteristics and what strategies we can use to make the young players better athletes. This project will also form part of my PhD. Your participation in this project is purely voluntary and if you choose not to participate you will not be adversely affected in any way.
What is the purpose of this research?
The primary aim of the project is to validate the Metabolic Fitness Index for Team Sports (MFITS) test against the Rugby Specific Repeated Speed (RS
2) test. This will provide us with
the ability to estimate your performance in a RS2 test if you did MFITS. A secondary aim is to
test the test-retest reliability of the same fitness tests. This means to measure how accurate the tests are when you perform them again, thus measuring its ability to detect changes in fitness and performance. The primary researcher is working closely with the New Zealand Rugby Union (NZRU). Therefore, the information gained from this research will also help instigate strategies within strength and conditioning.
How was I chosen for this invitation?
The group of players from which you are part of were selected as participants within the project by the NZRU. You are of elite level and have experience in the RS
2 thus no learning of the test
is required and your will results will be more consistent than a lower level player
What will happen in this research?
You will perform a total of four fitness tests (2x RS2 tests and 2x MFITS) over a four week
period. The order of tests will be randomly selected and integrated into your training schedule. Each test will be performed midweek to lessen the effect of the previous weekend’s club rugby game and reduce fatigue for the subsequent weekend’s club rugby game. It is expected that you will perform the tests at the best of your ability.
What are the discomforts and risks?
The only discomforts you will experience during the fitness testing are shortness of breath and localised muscular soreness in the legs. This pain and discomfort will be no more than that experienced during regular training and rugby matches.
157
What compensation is available for injury or negligence?
Compensation is available through the Accident Compensation Corporation within its normal limitations.
How will my privacy be protected?
The consent forms and any other written information about you will have your name removed and replaced with a number to identify you and will be kept in a locked cabinet at the School of Sport and Exercise Science at WINTEC. Any electronic information (i.e. computer generated results) will also have your name removed and replaced with a subject number and be stored on a computer that requires a password to enter it.
What are the costs of participating in this research?
There are no financial costs involved in the project. Each MFITS test will take approximately an hour to perform and the RS
2 test a total of 30-min thus a total three hours will be required over
the four week period which will be integrated into your training schedule.
What opportunity do I have to consider this invitation?
You will have up to a period of two weeks to consider participating in the project.
How do I agree to participate in this research?
Your participation in this project is purely voluntary and if you choose not to participate you will not be adversely affected in any way. If you do decide to participate in this study, you will need to complete an informed consent which will be available from the researcher Daniel Smart at the beginning of the first testing session. At any stage of the project that you do not want to continue, for what ever reason, you may withdraw without any adverse consequences.
Will I receive feedback on the results of this research?
Yes, you will receive instantaneous feedback about the results of the fitness tests you perform. Results from previous testing will also be available at subsequent testing to compare and see how you have improved over the course of the season or year.
What do I do if I have concerns about this research?
Any concerns regarding the nature of this project should be notified in the first instance to the Project Supervisor, Prof. Will Hopkins; Auckland University of Technology, Division of Sport and Recreation, Private Bag 920006, Auckland; (09) 921 9793.
Concerns regarding the conduct of the research should be notified to the Executive Secretary, AUTEC, Madeline Banda, [email protected] , 921 9999 ext 8044.
Whom do I contact for further information about this research? Researcher Contact Details: Daniel Smart School of Sport and Exercise Science WINTEC Private Bag 3036 Hamilton Phone Mobile: (027) 319 7255 Email: [email protected]

158
Project Supervisor Contact Details: Prof. Will Hopkins Auckland University of Technology Division of Sport and Recreation Private Bag 920006 Auckland Phone Work: (09) 921 9793 Email: [email protected]
Dr. Nicholas Gill School of Sport and Exercise Science WINTEC Private Bag 3036 Hamilton Phone Work: (07) 834 8800 ext 8407 Email: [email protected]

159
Appendix Three: Inform Consent
Consent Form
Project title: Physical, training and injury characteristics of rugby union players
Project Supervisor: Will Hopkins & Nicholas Gill
Researcher: Daniel Smart
o I have read and understood the information provided about this research project in the Information Sheet dated 8 February 2007.
o I have had an opportunity to ask questions and to have them answered.
o I understand that I may withdraw myself or any information that I have provided for this project at any time prior to completion of data collection, without being disadvantaged in any way.
o I agree to participate in fitness testing pre- and post- rugby union season, allow the coach/trainer/physiotherapist to provide information about my training and injury status and allow the researcher to obtain competition statistics about me from applicable computer software.
o I agree to take part in this research.
o I wish to be identified as an individual of Maori ethnicity (please tick one): Yes� No�
o I wish to receive a copy of the report from the research (please tick one): Yes� No�
Participant’s signature: ....................................................……………………………………………
Participant’s name: .....................................................…………………………………………
Participant’s Contact Details (if appropriate):
………………………………………………………………………………………..
………………………………………………………………………………………..
………………………………………………………………………………………..
………………………………………………………………………………………..
Date:
Approved by the Auckland University of Technology Ethics Committee on 4 April 2007 AUTEC Reference number 06-226

160
Parent/Guardian Consent Form
Project title: Physical, training and injury characteristics of rugby union players
Project Supervisor: Will Hopkins & Nicholas Gill
Researcher: Daniel Smart
o I have read and understood the information provided about this research project in the Information Sheet dated 8 February 2007.
o I have had an opportunity to ask questions and to have them answered.
o I understand that I may withdraw my child/children or any information that we have provided for this project at any time prior to completion of data collection, without being disadvantaged in any way.
o If my child/children withdraw, I understand that all relevant information will be destroyed.
o I agree to my child/children taking part in this research.
o I wish to receive a copy of the report from the research (please tick one): Yes� No�
Child/children’s name/s : ………………………………………………………………………...
Parent/Guardian’s signature: .........................................………………………………………
Parent/Guardian’s name: .........................................………………………………………
Parent/Guardian’s Contact Details (if appropriate):
………………………………………………………………………………………..
………………………………………………………………………………………..
………………………………………………………………………………………..
………………………………………………………………………………………..
Date:
Approved by the Auckland University of Technology Ethics Committee on 4 April 2007 AUTEC Reference number 06-226

161
Assent Form For completion by legal minors (people aged under 16 years).
This must be accompanied by a Consent Form.
Project title: Physical, training and injury characteristics of rugby union players
Project Supervisor: Will Hopkins & Nicholas Gill
Researcher: Daniel Smart
o I have read and understood the sheet telling me what will happen in this study and why it is important.
o I have been able to ask questions and to have them answered.
o I understand that the discussions/interviews/activities that I am part of are going to be recorded.
o I understand that while the information is being collected, I can stop being part of this study whenever I want and that I will not be unfairly treated for doing so.
o If I stop being part of the study, I understand that all information about me, including the recordings or any part of them that include me, will be destroyed.
o I agree to take part in this research.
o I wish to be identified as an individual of Maori ethnicity (please tick one): Yes� No�
Participant’s signature: .....................................................…………………………………………
Participant’s name: .....................................................…………………………………………
Participant Contact Details (if appropriate):
………………………………………………………………………………………..
………………………………………………………………………………………..
………………………………………………………………………………………..
………………………………………………………………………………………..
Date:
Approved by the Auckland University of Technology Ethics Committee on 4 April 2007 AUTEC Reference number 06-226
162
Consent Form Intervention
Project title: The effectiveness of an off-season physical development programme in young rugby union players
Project Supervisor: Will Hopkins & Nicholas Gill
Researcher: Daniel Smart
o I have read and understood the information provided about this research project in the Information Sheet dated 6 August 2007.
o I have had an opportunity to ask questions and to have them answered.
o I understand that I may withdraw myself or any information that I have provided for this project at any time prior to completion of data collection, without being disadvantaged in any way.
o I agree to participate in the physical development intervention over the summer period and fitness testing post- intervention and pre- and post-representative rugby season the following year.
o I agree to take part in this research.
o I wish to be identified as an individual of Maori ethnicity (please tick one): Yes� No�
o I wish to receive a copy of the report from the research (please tick one): Yes� No�
Participant’s signature: .....................................................…………………………………………
Participant’s name: .....................................................…………………………………………
Participant’s Contact Details (if appropriate):
………………………………………………………………………………………..
………………………………………………………………………………………..
………………………………………………………………………………………..
………………………………………………………………………………………..
Date:

163
Consent Form Control
Project title: The effectiveness of an off-season physical development programme in young rugby union players
Project Supervisor: Will Hopkins & Nicholas Gill
Researcher: Daniel Smart
o I have read and understood the information provided about this research project in the Information Sheet dated 6 August 2007.
o I have had an opportunity to ask questions and to have them answered.
o I understand that I may withdraw myself or any information that I have provided for this project at any time prior to completion of data collection, without being disadvantaged in any way.
o I agree to participate in fitness testing in 6-months time and pre- and post-representative rugby season the following year.
o I agree to take part in this research.
o I wish to be identified as an individual of Maori ethnicity (please tick one): Yes� No�
o I wish to receive a copy of the report from the research (please tick one): Yes� No�
Participant’s signature: .....................................................…………………………………………
Participant’s name: .....................................................…………………………………………
Participant’s Contact Details (if appropriate):
………………………………………………………………………………………..
………………………………………………………………………………………..
………………………………………………………………………………………..
………………………………………………………………………………………..
Date:

164
Parent/Guardian Consent Form
Project title: The effectiveness of an off-season physical development programme in young rugby union players
Project Supervisor: Will Hopkins & Nicholas Gill
Researcher: Daniel Smart
o I have read and understood the information provided about this research project in the Information Sheet dated 6 August 2007.
o I have had an opportunity to ask questions and to have them answered.
o I understand that I may withdraw my child/children or any information that we have provided for this project at any time prior to completion of data collection, without being disadvantaged in any way.
o If my child/children withdraw, I understand that all relevant information will be destroyed.
o I agree to my child/children taking part in this research.
o I wish to receive a copy of the report from the research (please tick one): Yes� No�
Child/children’s name/s : ………………………………………………………………………...
Parent/Guardian’s signature: ...........................................…………………………………………
Parent/Guardian’s name: .............................……………………………………………………
Parent/Guardian’s Contact Details (if appropriate):
………………………………………………………………………………………..
………………………………………………………………………………………..
………………………………………………………………………………………..
………………………………………………………………………………………..
Date:

165
Assent Form For completion by legal minors (people aged under 16 years).
This must be accompanied by a Consent Form.
Project title: The effectiveness of an off-season physical development programme in young rugby union players
Project Supervisor: Will Hopkins & Nicholas Gill
Researcher: Daniel Smart
o I have read and understood the sheet telling me what will happen in this study and why it is important.
o I have been able to ask questions and to have them answered.
o I understand that the activities that I am part of are going to be recorded.
o I understand that while the information is being collected, I can stop being part of this study whenever I want and that I will not be unfairly treated for doing so.
o If I stop being part of the study, I understand that all information about me, including the recordings or any part of them that include me, will be destroyed.
o I agree to take part in this research.
o I wish to be identified as an individual of Maori ethnicity (please tick one): Yes� No�
Participant’s signature: ......................................………………………………………………………
Participant’s name: ................................................………………………………………………
Participant Contact Details (if appropriate):
………………………………………………………………………………………..
………………………………………………………………………………………..
………………………………………………………………………………………..
………………………………………………………………………………………..
Date:

166
Consent Form
Project title: The validity and reliability of field based fitness assessments used in testing rugby union players.
Project Supervisor: Nicholas Gill & Will Hopkins
Researcher: Daniel Smart
o I have read and understood the information provided about this research project in the Information Sheet dated 5 June 2008.
o I have had an opportunity to ask questions and to have them answered.
o I understand that I may withdraw myself or any information that I have provided for this project at any time prior to completion of data collection, without being disadvantaged in any way.
o I agree to take part in this research.
o I wish to be identified as an individual of Maori ethnicity (please tick one): Yes� No�
o I wish to receive a copy of the report from the research (please tick one): Yes� No�
Participant’s signature: .....................................................…………………………………………
Participant’s name: .....................................................…………………………………………
Participant’s Contact Details (if appropriate):
………………………………………………………………………………………..
………………………………………………………………………………………..
………………………………………………………………………………………..
………………………………………………………………………………………..
Date:

167
Appendix Four: Papers Presented at Conferences
TRENDS AND DIFFERENCES IN THE FITNESS OF PROFESSIONAL AND
AMATEUR RUGBY UNION PLAYERS
Daniel J Smart1, Will G Hopkins
1 and Nicholas Gill
1,2
1Institute of Sport and Recreation Research NZ, AUT University, Auckland
2School of Sport and Exercise Science, Waikato Institute of Technology, Hamilton
Background: Rugby union is unique compared with other professional team sports in
that some players are involved in up to four competitive phases in a calendar year. The
effects of competitive levels and phase of season on player fitness have not previously
been examined.
Purpose: To analyse performance-test data from 2004–2006 to determine differences
between players of various playing levels and the changes within players between the
phases of the season.
Methods: In New Zealand, players at academy level and above perform standard fitness
tests that are uploaded to the Performance Profiler database. Performance-test data on
body composition (body mass, percentage body fat and lean body mass), strength and
power (estimated 1RM) and speed (time to complete 10, 20 and 30 m) for up to 317
players were taken from the database with permission from the NZRU. Players were
grouped according to their playing position (props, hookers, locks, loose forwards,
inside backs, centres, outside backs) and highest competitive level (All Blacks,
professional Super rugby, national provincial, academy and development). Data were
analysed using mixed modelling to estimate mean performance and between- and
within-player variations in performance.
Results: Mean performance showed the expected differences between positional groups
(e.g. highest body mass for props and fastest 10- and 20-m sprint time for outside
backs). Compared with national provincial players, Super rugby players were heavier
(1.9%; 90% confidence limits ±2.5%) and stronger in bench-press (4.6%; ±7.4%) and
weighted chin-ups (3%; ±5.9%), but these differences were small. There were little
differences between Super rugby players and All Blacks. Other differences were trivial
or unclear. As the players moved from Super rugby to the national provincial
championship each year, there was a moderate to large increase in 10-m speed (4.5%;
±1.4%) and small increases in squat (6.0%; ±4.9%), weighted chin-ups (4.0%; ±1.4%)
and power-clean (5.0%; ±2.5%) exercises. Other changes in speed and strength and
changes in body composition from Super rugby to the national provincial championship
were trivial. There were insufficient tests during the All Black phase to track changes
between this and other phases.
Conclusions: The differences between players provide level-specific fitness indicators
at Super rugby and national provincial level, but do not appear to differentiate
international representatives from Super rugby players. The changes of the players’ test
performance over the period of the year may be due to differences in training and
playing loads of the respective competitions. The greater travel involved in the Super
rugby competition and a potentially higher intensity in Super rugby matches may not
allow players to recover and perform optimally during performance testing.

168

169
Related Documents


