Smart Sydney Andrea Beattie Manager Strategic Corporate Planning City of Sydney

Smart Sydney: Opportunities and Challenges - Andrea Beattie , City of Sydney
Apr 08, 2017
Welcome message from author
This document is posted to help you gain knowledge. Please leave a comment to let me know what you think about it! Share it to your friends and learn new things together.
Transcript
Smart Sydney
Andrea BeattieManager Strategic Corporate PlanningCity of Sydney
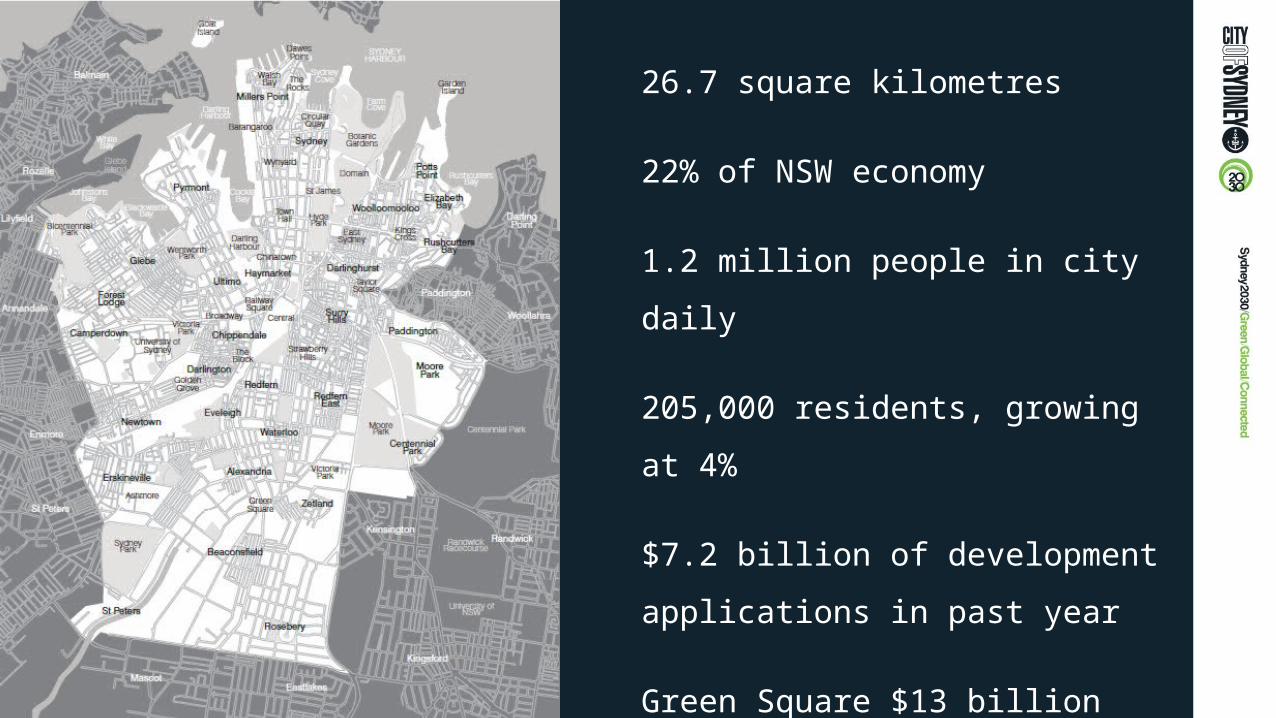
26.7 square kilometres
22% of NSW economy
1.2 million people in city daily
205,000 residents, growing at 4%
$7.2 billion of development
applications in past year
Green Square $13 billion
development

4
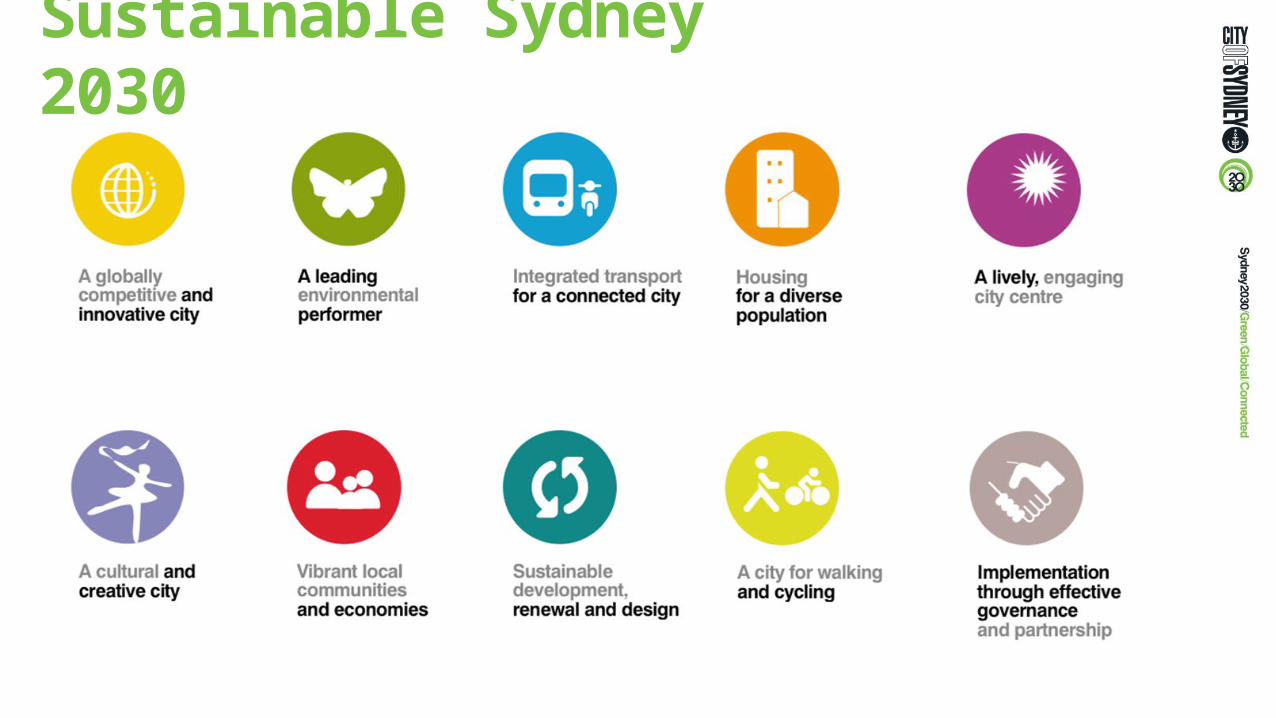
Sustainable Sydney 2030

70% by 2030

Floor Space and Employment Survey
7
red = residentialorange = businessblue = vacantgreen = parks
Circular quay
Potts Point
CBD
Glebe
Botanic gardens
Pyrmont
Centennial Park
RoseberySydney Uni
3D space use data

Floor Space and Employment Survey
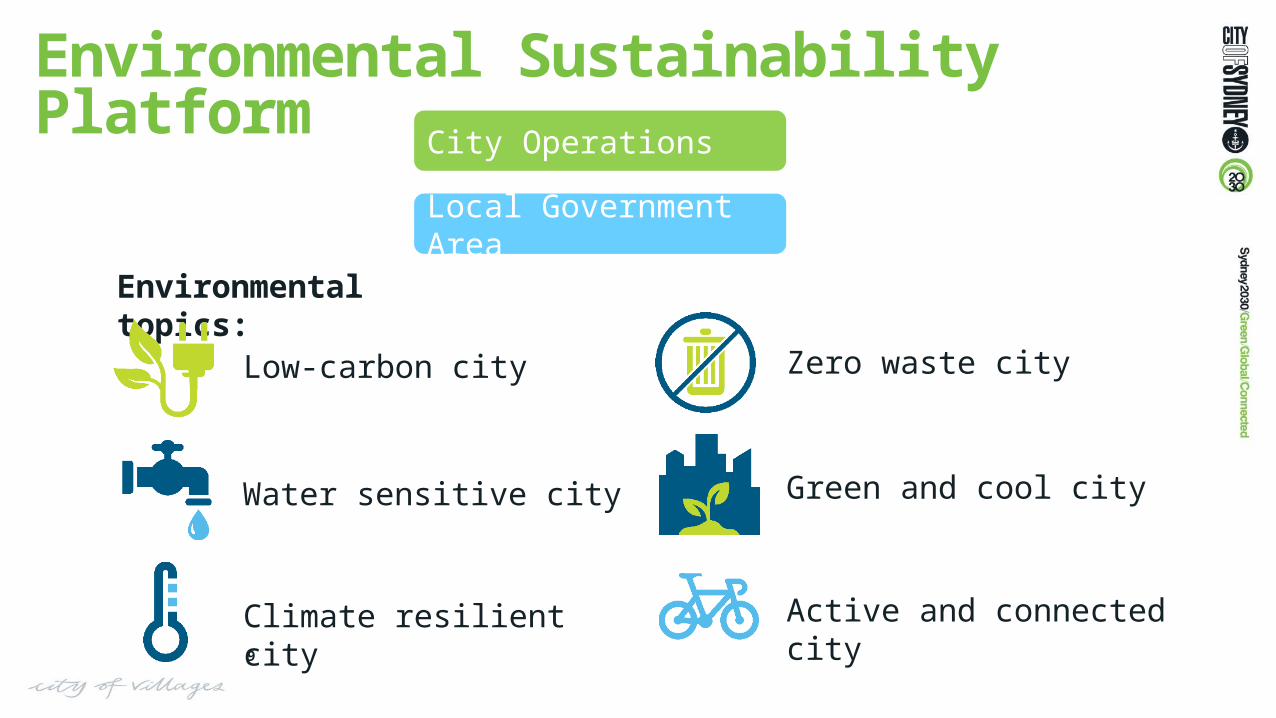
Environmental Sustainability Platform
9
Climate resilient city
City Operations
Local Government Area
Environmental topics:
Zero waste city
Active and connected city
Water sensitive city Green and cool city
Low-carbon city

Environmental Sustainability Platform Part 1: Methodology
Part 4: VisualisationPart 3: Bottom-up analysis
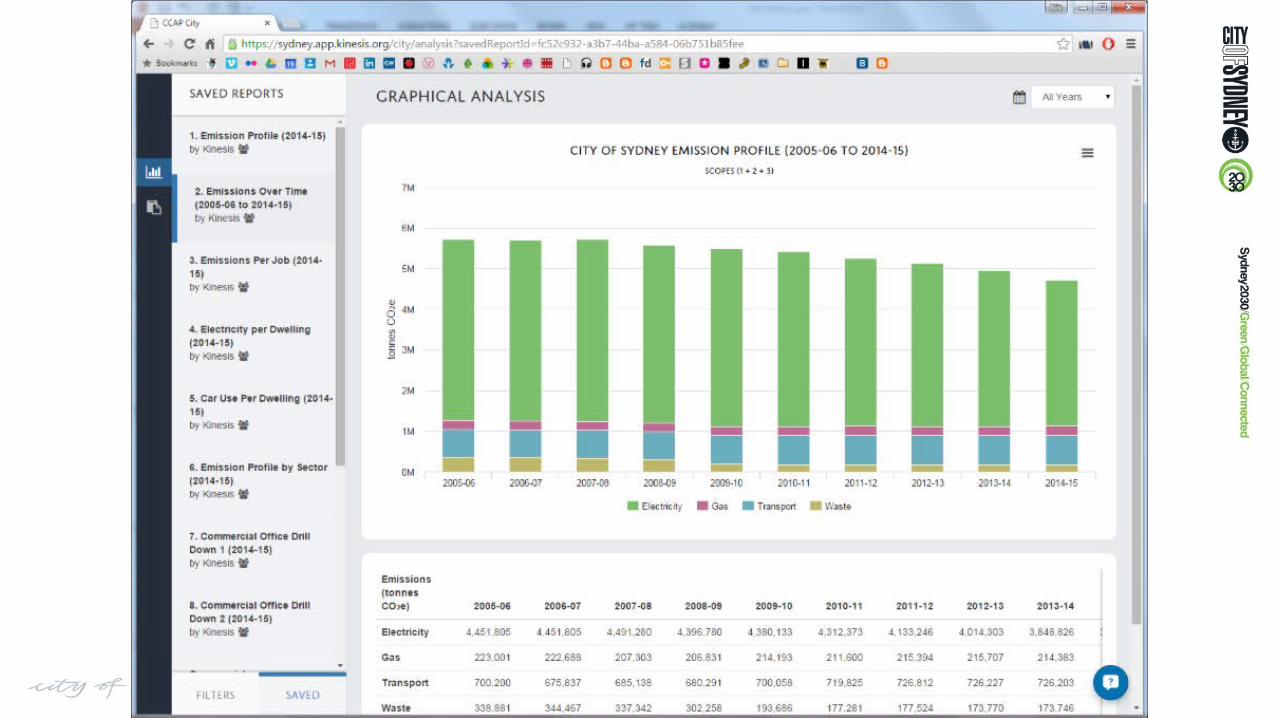
Part 2: Top-down analysis
Data collection process flow, Generic data layers, Sector Hierarchy, Business rules for data, CoS reporting requirements
Outputs parts 1-3 to be publicly reported and presented – “Open Data” approach
Gather, transform, report “bottom up” data provided by Sustainability Programs – BBP, City Switch etc.
Collect, transform, report and store “top down” data from utility companies and other providers of large, coarse-grained data sets
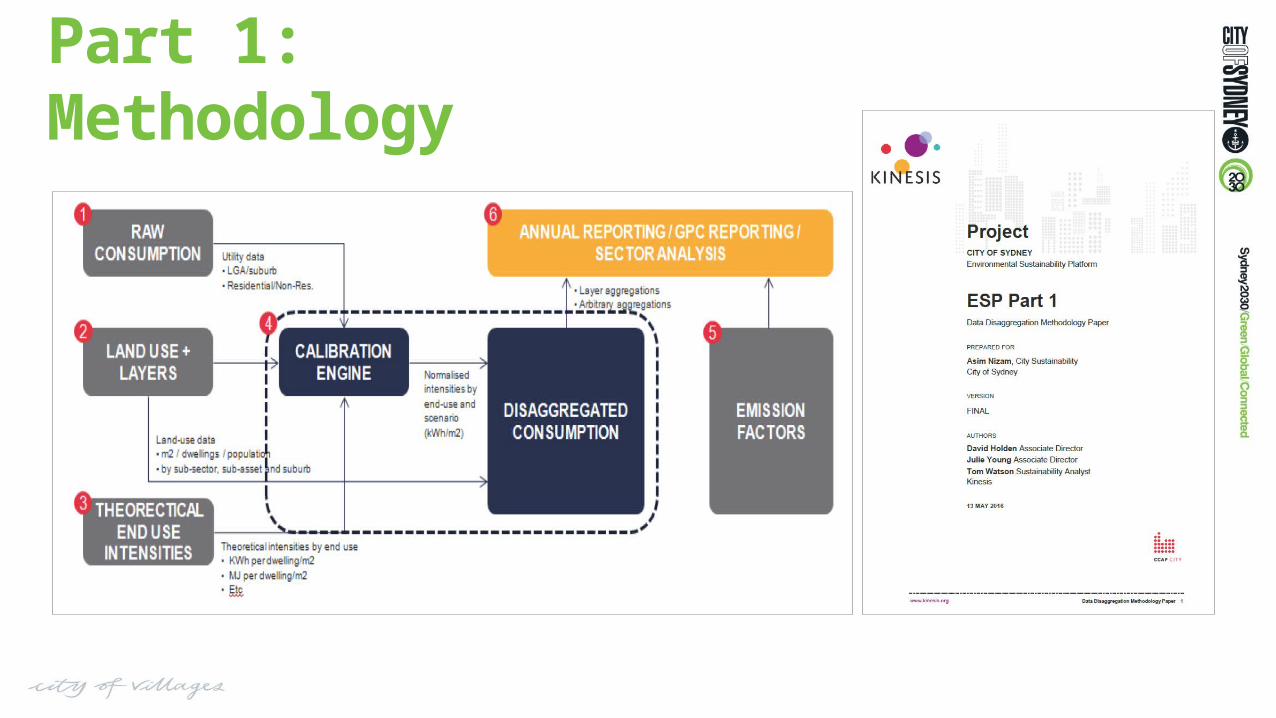
Part 1: Methodology
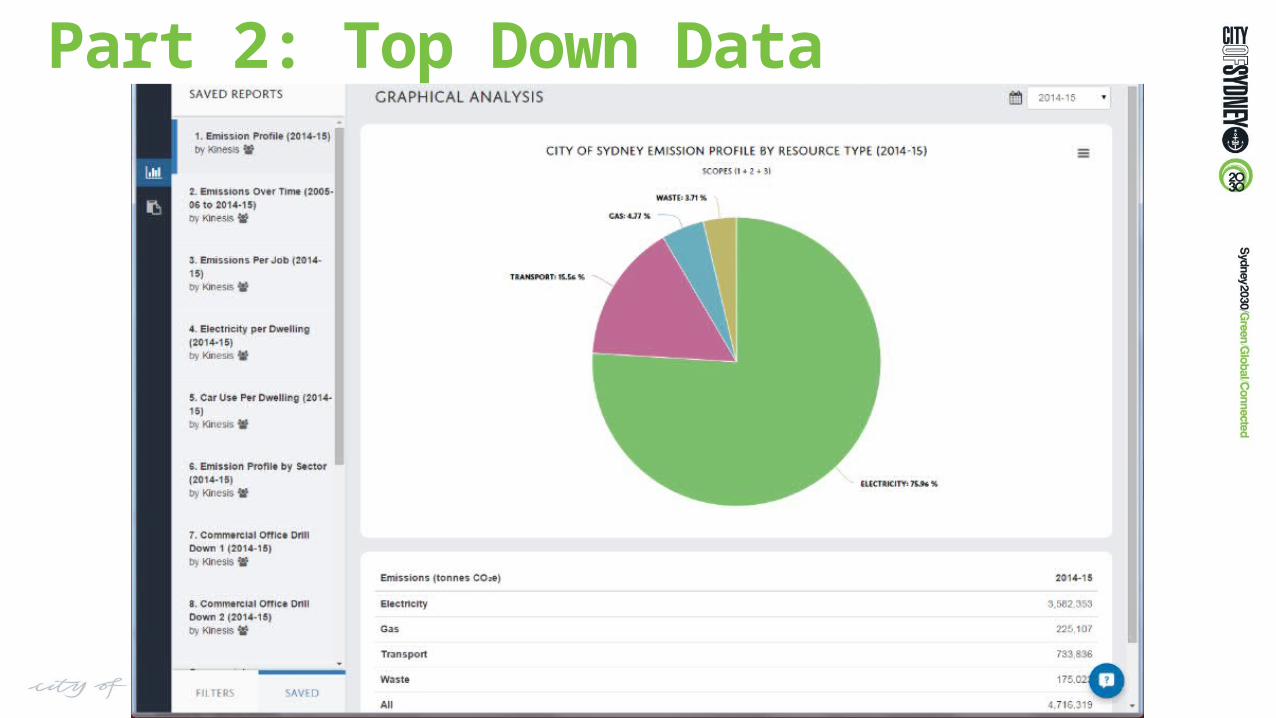
Part 2: Top Down Data

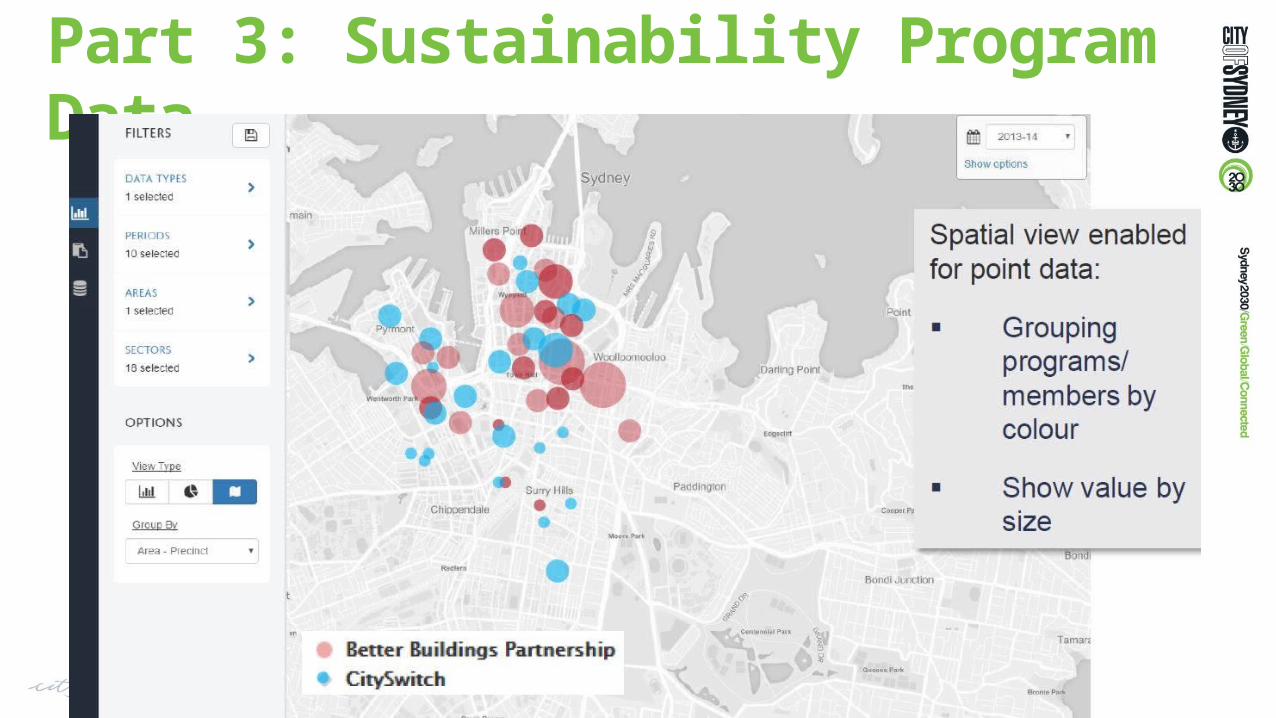
Part 3: Sustainability Program Data

CKAN Open Data Portal
Part 4: Visualisation
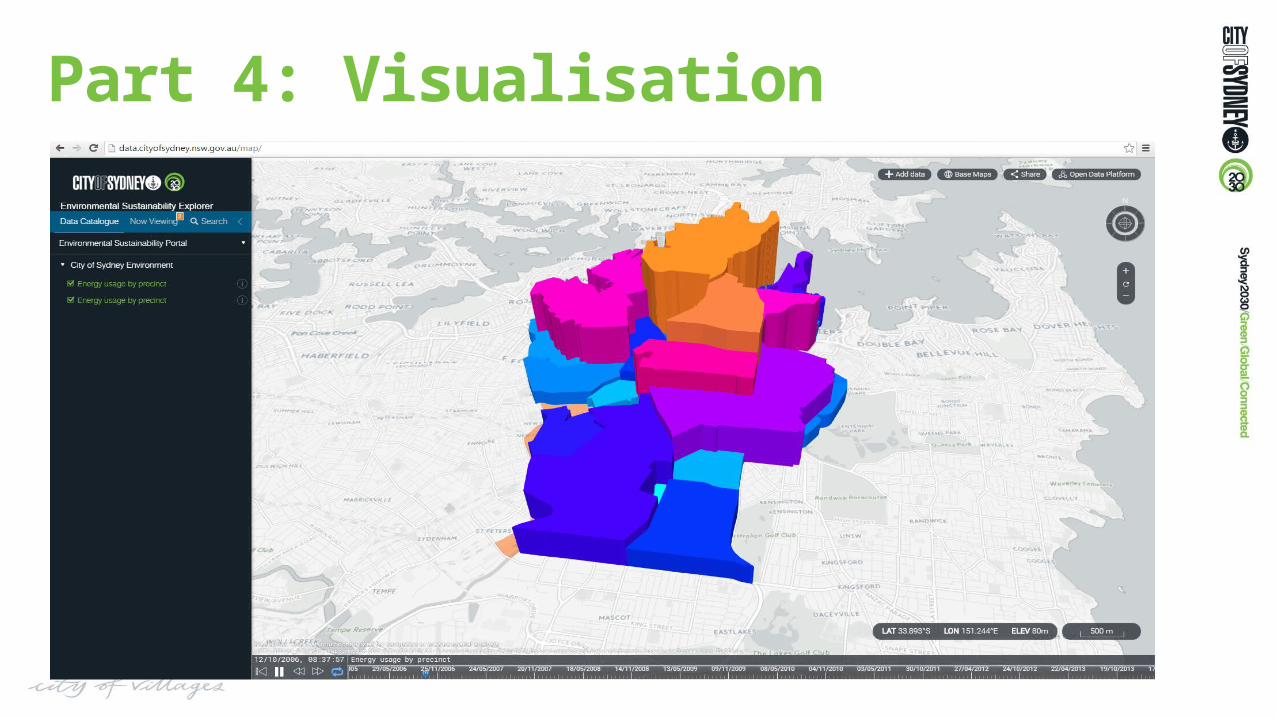
Part 4: Visualisation
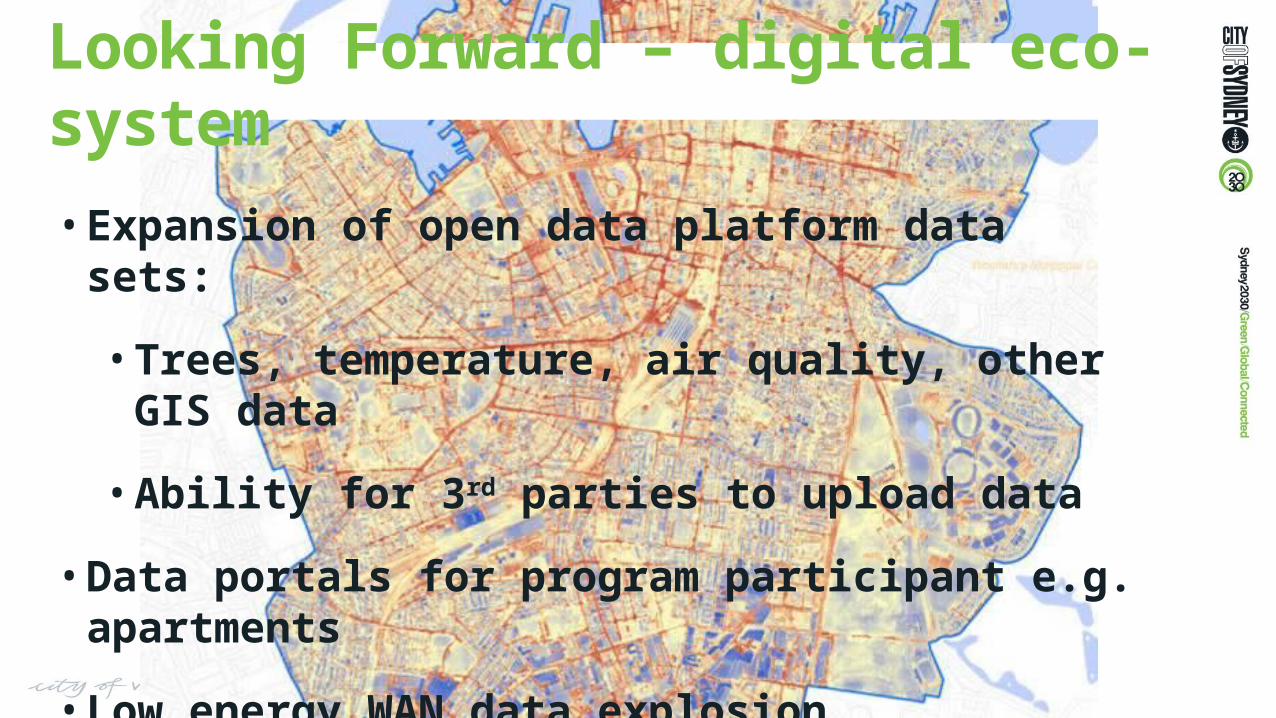
Looking Forward – digital eco-system
• Expansion of open data platform data sets:
• Trees, temperature, air quality, other GIS data
• Ability for 3rd parties to upload data
• Data portals for program participant e.g. apartments
• Low energy WAN data explosion

Looking Forward – digital eco-system

Thank you
Related Documents
![[*1] - Schlam Stone€¦ · roger s. penske, james i. cash jr., samuel nunn, andrea jung, ... mulva, w. geoffrey beattie and james s. tisch, defendants, -and- general electric company,](https://static.cupdf.com/doc/110x72/5b002a3c7f8b9a65618ba8b2/1-schlam-roger-s-penske-james-i-cash-jr-samuel-nunn-andrea-jung-.jpg)