C H A P T E R 3 Drawing Diagrams Drawing Diagrams................................................................................... 82 Connectors and Symbols .......................................................................... 87 Procedures to Explore in On-line Help .................................................... 88

Smart sketchgettingstartedguide4
Aug 05, 2015
Welcome message from author
This document is posted to help you gain knowledge. Please leave a comment to let me know what you think about it! Share it to your friends and learn new things together.
Transcript
C H A P T E R 3Drawing Diagrams
Drawing Diagrams................................................................................... 82
Connectors and Symbols .......................................................................... 87
Procedures to Explore in On-line Help.................................................... 88

Chapter 3 SmartSketch Getting Started Guide
82
Drawing DiagramsYou can create diagrams quickly and easily with the software. To do this, you canuse the following tools:
• Industry solution templates
• Symbols
• Connectors
• Annotations
Tip You can learn how to draw a diagram with a tutorial in the Learning Center.Click the Help menu and then click Learning Center.
Templates (Illustration contains content delivered in full product.)
When you first open the software, you can select a template based on the industrysolution that you need. The best templates to select for drawing diagrams are in theGeneral Diagramming template folder. For example, you can select the NetworkDiagram (Imperial).igr template.
When you open the Network Diagram (Imperial).igr template, the Schematic toolbarautomatically displays the buttons that you would need most often to create adiagram. These commands include Connector, Grid Display, Grid Snap, Text Box,and others.
Tip You can still draw lines, circles, and so forth with buttons on the Drawtoolbar. To display the Draw toolbar, you can click Toolbars on the View menu.

Drawing Elements Chapter 3
83
ConnectorsThe Connector button on the Schematic toolbar allows you to place connectorsanywhere you need. You can connect lines, circles, symbols, or points in freespace.
There are special connector styles that you can use in the diagram. Some examplesin the Network Diagram template include Thick line, Normal line, and Dashed line.On the Connector ribbon bar, you can click the style that you want in the Style box.
On the Connector ribbon bar, you can also select the line start and line endterminators that you want. The following connectors display some of the differenttypes of terminators that you can apply.
Symbols (Illustration contains content delivered in full product.)
The template automatically displays the symbols that you need for a diagram in theSymbol Explorer. For example, the Network Diagram template offers you many kindsof symbols to include modems, servers, annotation, and others.
To place these symbols, you can drag them from the Symbol Explorer into thedocument.

Chapter 3 SmartSketch Getting Started Guide
84
You can manipulate symbols with special handles that appear when you select thesymbol. (Illustration contains content delivered in full product.)
• Black boxes on the outside corners of the range box lines represent scalehandles (A). You can drag a scale handle to resize the entire symbol.
• Yellow boxes in the middle of the range box lines represent standardparametric handles (B). You can drag a parametric handle to resize part of thesymbol.
• A green plus sign represents a mirror handle (C). You can drag a mirror handleto create a copy of the symbol directly horizontal or vertical to the originalsymbol.
• A large green circle represents a rotate handle (D). You can drag this handle torotate the entire symbol. Specific increments are displayed by the pointer whileyou rotate the symbol.
• A series of small green circles represents drag points (E). You can use thesepoints to attach the symbol at a precise point to another symbol or element.
• A small green lock represents a lock handle (F). You can click the lock handleto unlock the symbol. Unlocking allows you to move a symbol away from theelement to which the symbol was associated.
Tip A lock handle appears only if you drag the symbol to an element with oneof the drag points on the symbol.
Text and LabelsYou can also drag labels from the Symbol Explorer. For example, the NetworkDiagram template offers a collection of Smart Labels in the \Modems folder.
Some Smart Labels display a question mark in the Symbol Explorer. You can alsodouble-click on some Smart Labels and edit the text.
Drawing Elements Chapter 3
85
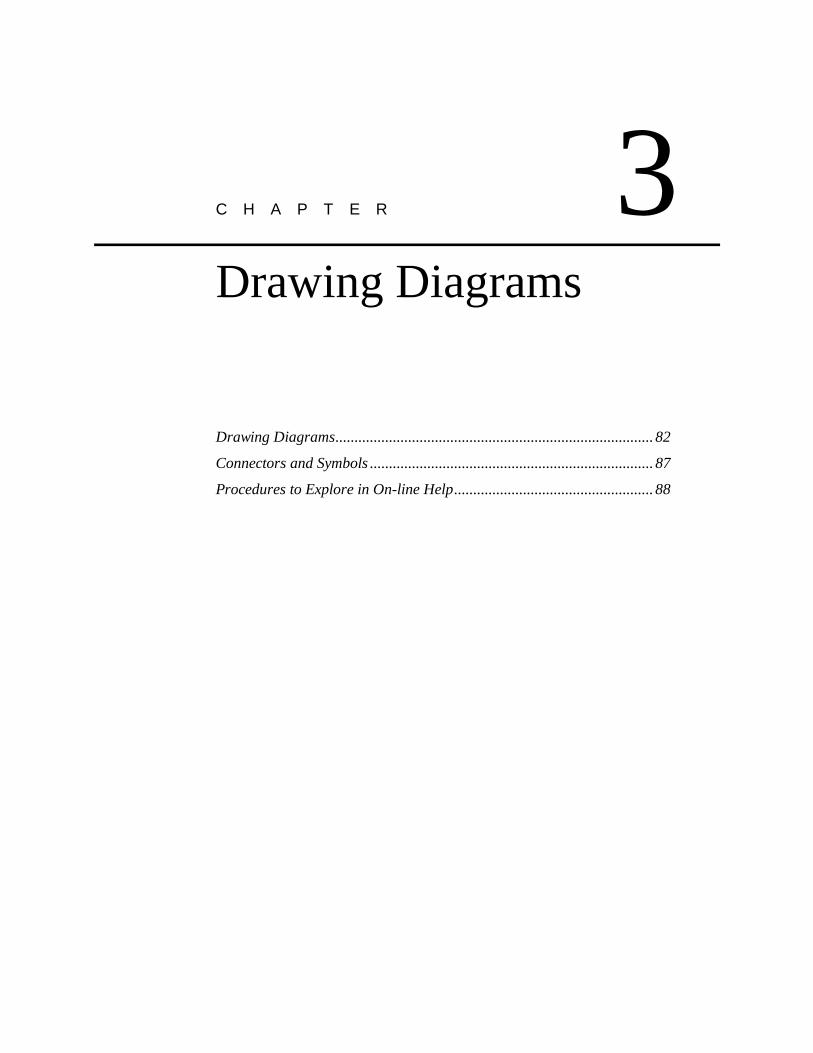
Smart Labels can assume the attributes of the element or symbol that you drag theSmart Label to. You can edit the attributes of the Smart Label in the AttributeViewer. (Illustrations contain content delivered in full product.)
If you want to quickly add text that is associated to an element, you can double-click any element in the diagram. A text label appears in the center or below theelement. When you type in text and press Enter, the text label orients itself with theelement. When you move the element, the text label moves with it.
Tip To add text that is not associated to an element, you can click the Text Boxbutton on the Schematic toolbar.
GridsYou can use a grid view and grid snap to place the items in your diagram at preciseintervals. You can view the grid by clicking the Grid Display option on the Viewmenu. When you set the Grid Snap option on the View menu, elements alwaysalign with the grid lines or nearest intersection of the grid lines.

Chapter 3 SmartSketch Getting Started Guide
86
ReportsThe software delivers some reports that you can update automatically when youadd symbols to a document. The reports work with symbols that have specificattributes assigned to them. You must have Microsoft® Excel™ 97 or laterinstalled on your computer. The software includes several example reports.
Tip For detailed information about symbols, connectors, and annotations, see thefollowing chapters:
• Using Symbols
• Drawing Elements
• Using Annotations and Fonts

Drawing Elements Chapter 3
87
Connectors and SymbolsSome symbols are created with connect points. When you attach a connector to aconnect point, the connector automatically attaches to the point at a predefinedangle. Otherwise, the connector locates and attaches to a keypoint or point alongany elements in the symbol.
The connect points appear as red circles with Xs. The keypoints appear as graycircles with Xs.
Tip If you press the Alt key while drawing a connector, the connector attaches to aconnect point at any angle.
Chapter 3 SmartSketch Getting Started Guide
88
Procedures to Explore in On-line Help• Create a Symbol
• Edit a Symbol
• Place a Connector
• Place a Smart Label
• Create a Text Label
• Edit Attributes

C H A P T E R 4Drawing Elements
Drawing Basic Elements....................................................................... 90
Drawing Lines....................................................................................... 92
Connecting Elements ............................................................................ 93
Drawing Circles, Arcs, and Ellipses..................................................... 95
Drawing Squares and Rectangles......................................................... 96
Drawing FreeForm Shapes................................................................... 97
Isometric Drawings............................................................................... 99
Procedures to Explore in On-line Help .............................................. 100

Chapter 4 SmartSketch Getting Started Guide
90
Drawing Basic ElementsAn element is any line, circle, or other part of the drawing. The Draw toolbar on theleft side of the drawing sheet contains most of the buttons that you can use to drawany type of basic geometric element—freeform shapes, lines, arcs, circles, and soforth.
You can place most basic elements with just a few clicks. For example, if you wantto place a line, you can click the Line/Arc Continuous button on the Draw toolbar.Then, you click two points to indicate where to start and finish the line. If you donot want to place another line, you click the right mouse button to end theoperation.
Tip Clicking the right mouse button ends most operations in the software.
You can also place the line by clicking the Line/Arc Continuous button and thenclicking and dragging the pointer. When you release the mouse, the line appears onthe drawing sheet. With this method, you drag the cursor as if it were a pen. Youcan draw most elements, such as rectangles, circles, and arcs, with this method,sometimes called mouse-down drawing. The mouse-down method is typically usedto place most elements in conceptual sketching and modification.
If you want to place a precise line, you can click the Line/Arc Continuous button,type values into the ribbon bar that appears, and then press ENTER. You can thenclick on the drawing sheet to place the line. This method, sometimes called mouse-up drawing, is typically used for precision placement and when you want to drawelements that are related to each other.
In some cases, you might want to click points on the drawing sheet and type valuesin the ribbon bar to place an element. For example, you can click the Line/ArcContinuous button and then type 3.0 in the Length box on the ribbon bar box andpress ENTER to lock the length value.

Drawing Elements Chapter 4
91
When a line that is three inches long appears next to the pointer, you can clickanywhere on the drawing sheet to indicate where to place one end of the line. Then,you move the line around and click again to set the line’s orientation angle.
If you do not like the results of what you drew, you can click the Undo button onthe Main toolbar. If you want to repeat an action, you click the Redo button on theMain toolbar.

Chapter 4 SmartSketch Getting Started Guide
92
Drawing LinesIf you want to place a line, you click the Line/Arc Continuous button on the Drawtoolbar. Then, you click a point on the drawing sheet to indicate where to start theline. You click a second point to indicate where to end the line. If you do not wantto place another line, you click the right mouse button to end the operation.
You can also place the line by clicking the Line/Arc Continuous button and thenclicking and dragging the pointer. When you release the mouse, the line appears onthe drawing sheet.
If you want to place a precise line, you can click the Line/Arc Continuous button,type values into the ribbon bar that appears, and then press ENTER. You then clickon the drawing sheet to place the line.
You can also use a combination of clicks and ribbon bar input to place the line. Forexample, you can type a line length in the ribbon bar box to lock the length valueand then set the line’s orientation angle graphically. You can set the color and linetype by clicking a style in the Style list box.

Drawing Elements Chapter 4
93
Connecting ElementsYou can use a connector to join two elements together. The Connector button onthe Schematic toolbar or Draw toolbar provides a convenient way to drawschematic. (Illustration below contains content delivered in full product.)
The Connector button allows you to place connectors anywhere you need. You canconnect lines, circles, symbols, or points in free space.
When you point to an element or symbol, the connect points appear as red circleswith Xs. The keypoints appear as gray circles with Xs.
You can also modify the connector after you place it by inserting or moving a linesegment, inserting or moving a vertex, or moving an element with a connector.
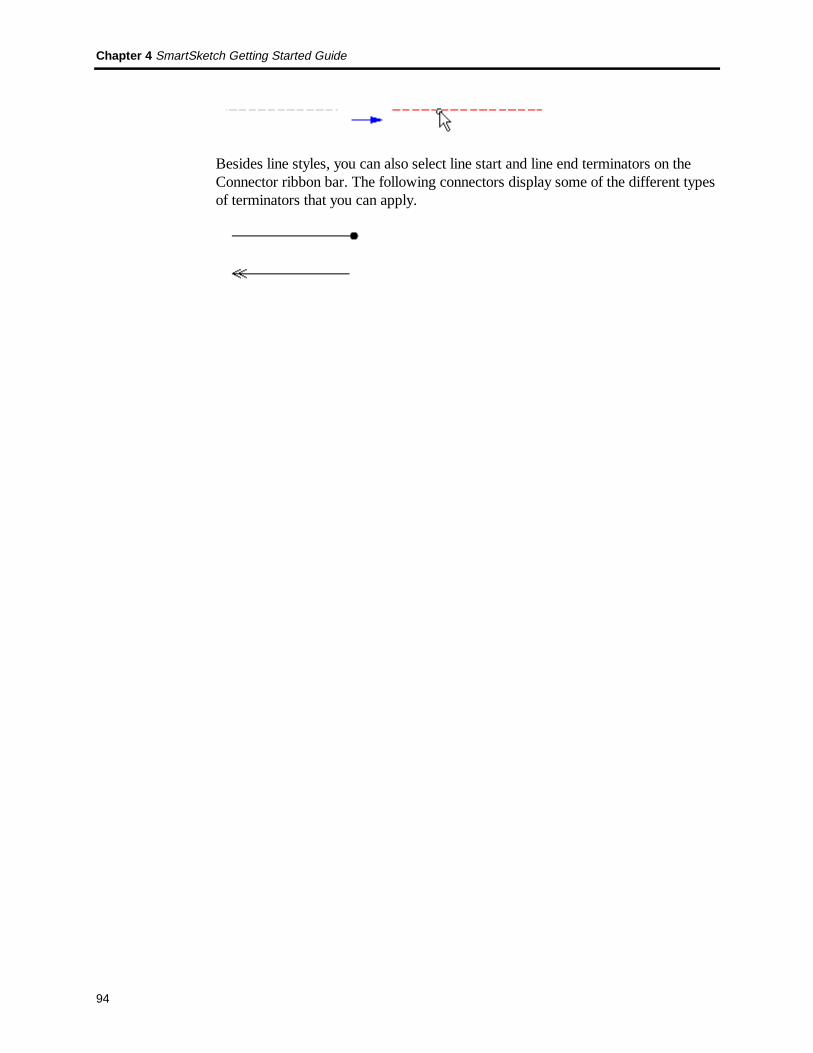
There are special connector styles that you can use in the diagram. On theConnector ribbon bar, you can click the style that you want in the Style box. Youcan then draw a connector that displays the line style that you selected. Forexample, in documents based on the Process Block Diagram template, you canselect Future and Phantom in the Line Style box on the ribbon bar. When youselect Future and draw a connector, the connector appears as a dashed line.
When you select Phantom and draw a connector, it appears grayed out; theconnector is highlighted when you point to it.
Chapter 4 SmartSketch Getting Started Guide
94
Besides line styles, you can also select line start and line end terminators on theConnector ribbon bar. The following connectors display some of the different typesof terminators that you can apply.
Drawing Elements Chapter 4
95
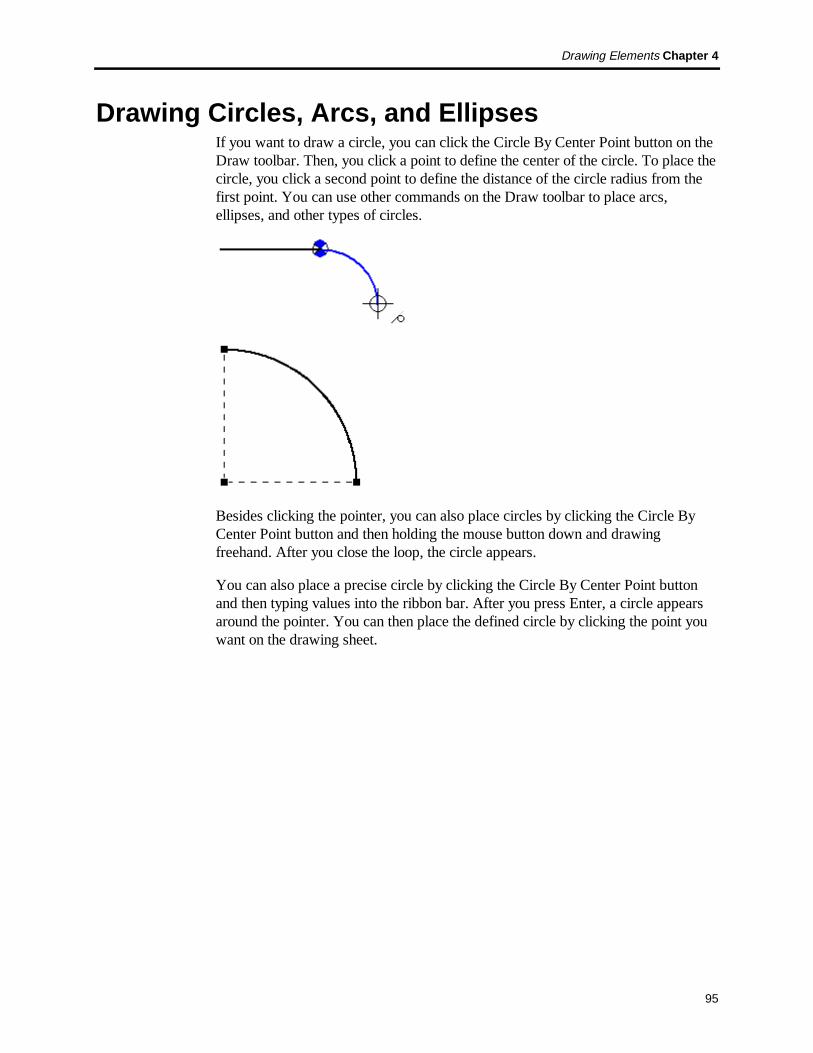
Drawing Circles, Arcs, and EllipsesIf you want to draw a circle, you can click the Circle By Center Point button on theDraw toolbar. Then, you click a point to define the center of the circle. To place thecircle, you click a second point to define the distance of the circle radius from thefirst point. You can use other commands on the Draw toolbar to place arcs,ellipses, and other types of circles.
Besides clicking the pointer, you can also place circles by clicking the Circle ByCenter Point button and then holding the mouse button down and drawingfreehand. After you close the loop, the circle appears.
You can also place a precise circle by clicking the Circle By Center Point buttonand then typing values into the ribbon bar. After you press Enter, a circle appearsaround the pointer. You can then place the defined circle by clicking the point youwant on the drawing sheet.

Chapter 4 SmartSketch Getting Started Guide
96
Drawing Squares and RectanglesTo draw a rectangle or square, you click the Rectangle button on the Draw toolbar.Then, you click two different points to define the rectangle. If you want to preciselydefine the dimensions of the square, you can type values into the ribbon bar andpress Enter.
If you place dimensions on a rectangle, these are always driven dimensions. Thismeans that if you edit the dimensional value of the dimension, the rectangle doesnot change. You need to edit the values on the rectangle ribbon bar to change therectangle. Also, you cannot ungroup a rectangle into individual lines.
Tip If you want to place a rectangle that has driving dimensions, you need to placefour separate lines in the shape of a rectangle by selecting the Line/Arc Continuousbutton on the Draw toolbar.

Drawing Elements Chapter 4
97
Drawing FreeForm ShapesAs you draw, you can place precisely defined lines, arcs, and circles by clickingand typing values in the ribbon bar. You can also use tools to quickly sketch adesign and let the software convert it into a precision drawing.
FreeSketch and FreeForm allow you to quickly place fluid lines and let thesoftware convert these into precision shapes. FreeSketch draws lines, arcs, circles,and rectangles, and FreeForm draws curves (splines).
You can begin sketching anywhere on the drawing sheet. You can draw in freespace or use key points or end points of elements as reference points.
How FreeSketch and FreeForm WorkAs you drag the pointer, a rough sketch of your design appears. When you releasethe pointer, the software recognizes the shapes in your sketch and turns the sketchinto a precise drawing. You can control the accuracy of the shape recognition usingthe ribbon bar options.

Chapter 4 SmartSketch Getting Started Guide
98
FreeSketch and FreeForm OptionsThe FreeSketch Adjust options control how closely FreeSketch interprets mousemovements. When Adjust On is set, the software interprets all lines as eitherhorizontal or vertical, and all arcs as tangent. The first figure shows how thesoftware interprets a rough sketch when Adjust On is set.
The next figure shows how the software interprets a rough sketch when Adjust Offis set.
The FreeForm Smoothing options controls how closely the software interpretsmouse movements when drawing curves. The first figure shows how FreeForminterprets a rough sketch when Smoothing On is set.
The next figure shows how the software interprets a rough sketch when SmoothingOff is set.

Drawing Elements Chapter 4
99
Isometric DrawingsIf you want to create 2D drawings that represent 3D elements, such as cubes, youcan create an isometric drawing. An isometric drawing is not a true 3D drawing,because you cannot view the drawing in perspective or from another angle.However, you can create a 3D effect by aligning the elements and objects in adrawing along three major axes.
The software supplies several tools to create these types of documents:
• Isometric Rectangle button
• Isometric Circle button
• Isometric Line button
• Segmented Styles button
Tip To access these commands, you must place them on a toolbar or menu withthe Customize command on the Tools menu. On the Toolbars tab of the Customizedialog box, click the Draw category.
You can also access dimension styles that you configure to appear at an angle forisometric drawings. These styles are available for any type of dimension, except forchained dimensions and angular dimensions. You can create a document based onone of the Technical Drawing templates and access these dimension styles.
Special fonts for isometric drawings are also available in any template. These fontsare displayed at an angle. The fonts are stored in a resource file in the followinglocation: <Drive Letter>:\PROGRAMFILES\SMARTSKETCH\TEMPLATE\STYLES\ISOFONTS.RSC. You must setthe location for these fonts on the File Locations tab of the Options dialog box.
Chapter 4 SmartSketch Getting Started Guide
100
Procedures to Explore in On-line Help• Draw a Line
• Draw a Circle by Defining 3 Points
• Draw an Arc by Defining 3 Points
• Draw a Curve
• Draw an Ellipse by Defining 3 Points
• Draw with FreeSketch
• Draw a Rectangle or Square

C H A P T E R 5Drawing Methods
Using Feedback from the Pointer as You Draw..................................... 102
Intent Zones ............................................................................................ 105
Using Relationships as You Draw.......................................................... 107
Procedures to Explore in On-line Help.................................................. 114

Chapter 5 SmartSketch Getting Started Guide
102
Using Feedback from the Pointer as You DrawAs you move the pointer, the software automatically updates values in the ribbonbar, giving you constant feedback on the size and position of the element you aredrawing. As you draw, the software shows a temporary, dynamic display of theelement you are drawing by the pointer––this feedback is called a relationshipindicator. This temporary display shows the look of the elements if you place theelement at the current location.
The software gives you more information about the element that you are drawingby displaying relationships between the temporary, dynamic element and thefollowing items:
• Other elements in the drawing
• Horizontal and vertical orientations
• Origin of the element that you are drawing
When the software recognizes a relationship, it displays a relationship indicator atthe pointer. As you move the pointer, the software updates the indicator to shownew relationships. If a relationship indicator appears by the pointer when you clickto draw the element, the software applies that relationship to the element.
Relationship Relationship Indicator
End point
Midpoint
Intersection
Horizontal
Vertical

Drawing Methods Chapter 5
103
Point On Element
Perpendicular
Parallel
Tangent
Center
For example, if the horizontal relationship indicator appears when you click toplace the second end point of a line, then the line is exactly horizontal.
RelationshipsYou can set the types of relationships you want the software to recognize with theSmartSketch Settings command on the Tools menu. The software can recognizeone or two relationships at a time. When the software recognizes two relationships,it displays both relationship indicators at the cursor.
Locate ZoneYou do not have to move the pointer to an exact position for the software torecognize a relationship. The software recognizes relationships for any elementwithin the locate zone of the pointer. The circle around the pointer crosshair or atthe end of the pointer arrow indicates the locate zone. You can change the size ofthe locate zone with the SmartSketch Settings command on the Tools menu.

Chapter 5 SmartSketch Getting Started Guide
104
Infinite ElementsThe software recognizes the Point On Element relationship for lines and arcs as ifthese elements were infinite. In the following example, the software recognizes aPoint On Element relationship when you position the pointer directly over anelement and also when you move the pointer off the element.

Drawing Methods Chapter 5
105
Intent ZonesAs you draw and modify elements, small quadrants called intent zones appear nextto the pointer. The software uses intent zones to interpret your intentions as youdraw. Intent zones allow you to draw and modify elements many ways using fewcommands. You do not need to select a different command for every type ofelement.
How Intent Zones WorkWhen you click to begin drawing certain elements, the software divides the regionaround the clicked position into intent zones. By moving the pointer into one ofthese intent zones on the way to your next click location, you can tell the softwarewhat you want to do next.
The last intent zone you move the pointer into is the active zone. To change theactive intent zone, move the mouse cursor into the zone you want to use, then moveit to the position where you want to click next. You can change the size of theintent zones with the SmartSketch Settings command on the Tools menu.
Drawing Tangent or Perpendicular ArcsYou can use intent zones to change the result of the Tangent Arc command. Todraw an arc tangent to a line, first click a point on the line to place the first endpoint of the arc. Then move the pointer through the tangent intent zone and click toplace the second end point of the arc.
If you want to draw a perpendicular arc instead, you can move the pointer back intothe intent zone region and out through the perpendicular zone before clicking toplace the second end point of the arc. The arc is then perpendicular to the line.
You can also use intent zones to define the arc direction.

Chapter 5 SmartSketch Getting Started Guide
106
Drawing Arcs by Three PointsWhen you use the Arc by 3 Points command, intent zones allow you to input thethree points in any order. You can also use intent zones to change the arc direction.
Drawing Lines Tangent or Connected to CurvedElementsUsing intent zones with the Line/Arc Continuous command, you can draw a linetangent to a circle or arc. Or you can draw a line that is connected to the circle orarc, but not tangent to it.

Drawing Methods Chapter 5
107
Using Relationships as You DrawYou can use relationships to capture and remember your design intent as yoursketch. You can make your drawings associative by applying those relationships—or you can sketch designs that do not use relationships.
How Relationships Affect a DrawingYou can move and change an element that does not use relationships in variousways without affecting other parts of the design. For example, when norelationships exist between two lines, you can move and change each line withoutaffecting the other.
When you modify a part of a drawing that has a relationship to another part of thedrawing, the other part updates automatically. For example, if you apply aperpendicular relationship between the two lines and move one line, the other linemoves with it. The software remembers the relationship between these twoelements and always maintains the perpendicular relationship between the lines.You can manipulate either of the two lines and the software will move or modifythe line automatically to maintain the relationship.
Applying and maintaining relationships in the design simplifies changes to thedesign later. In the following drawing, all the relationships were automaticallyestablished as the design took shape on the drawing sheet. If you want to changethe design, you simply modify one segment of it and all the relationships aremaintained.

Chapter 5 SmartSketch Getting Started Guide
108
Applying and Maintaining RelationshipsYou can place elements that are related to each other as you draw. First, you mustset the Maintain Relationships option on the Tools menu. Then, as you clickcommands on the Draw toolbar and place lines, arcs, and circles, you should watchthe relationship indicators that appear by the pointer. When a relationship indicatorappears by the pointer, you can click to apply that relationship to the element thatyou are drawing.
Visualizing Maintained Relationships.When you apply relationships, relationship handles appear on the related elements.The handles are symbols that show how elements are related. You can display orhide the relationship handles in your drawings by setting or clearing theRelationship Handles option on the Tools menu.
Relationship Relationship Handle
Colinear
Connect
Concentric
Equal
Horizontal/Vertical
Tangent
Symmetric

Drawing Methods Chapter 5
109
Parallel
Perpendicular
Lock
For example, the following four lines appear with relationship handles (A) turnedoff and with relationship handles (B) displayed.
Applying Relationships to Existing GeometryYou can apply relationships to geometry after you place it with the buttons on theRelationship toolbar. These buttons include parallel, tangent, connect, and so on.You can use relationships created with these buttons if you set the MaintainRelationships option on the Tools menu.
Removing RelationshipsYou can quit using all the relationships that you have applied to the drawing if youclear the Maintain Relationships option. You can also remove individualrelationships by selecting a relationship handle and deleting it. Clearing theRelationship Handles option on the Tools menu hides the handles, but therelationships are still maintained and used in the design.
When to Maintain RelationshipsMaintaining relationships makes designing more productive and revisions mucheasier. However, relationships can slow drawing and changes on large data sets.You should decide whether to use relationships depending on the speed of yourcomputer and the importance of easy revision.
For conceptual sketching and diagrams, you might want to use relationships bysetting the Maintain Relationships option. This method allows you to quickly getyour ideas on paper and revise them easily using direct modification and drivingdimensions. The kinds of projects in which you might want to use relationshipsinclude mechanical concepts, architectural details, layouts, and schematicdiagrams.

Chapter 5 SmartSketch Getting Started Guide
110
When to Design Without RelationshipsFor more complex projects where you initially need to draw with precision, youshould not use relationships in the document. You can then draw with precision byusing the PinPoint tool and entering values on ribbon bars. You can still userelationships within symbols. The kinds of projects in which you might want todraw without relationships include multiple-view drawings, floor plans, maps, anddetailed designs.
Note If you switch between using relationships and not using them while youdraw, you can receive confusing results.
Example: Draw a Horizontal Line
You can use relationships to draw a line that is exactly horizontal. You can apply ahorizontal relationship as you draw the line, or draw the line without a horizontalrelationship.
1. Click Tools > SmartSketch Settings.
2. On the Relationships tab, set the Horizontal Or Vertical option, and thenclick OK.
3. On the Draw toolbar, click the Line/Arc Continuous button.
4. Click where you want to place the first end point of the line, anywhere in theapplication window.
5. Move the pointer around in the window. Notice that the dynamic line displayalways extends from the end point you just placed to the current cursorposition. You may also see relationship indicators displayed at the cursor.
6. Move the pointer to make the dynamic line approximately horizontal.

Drawing Methods Chapter 5
111
7. When the horizontal relationship indicator is displayed at the pointer, click toplace the second end point.
If the Maintain Relationships option on the Tools menu is set, the softwareplaces a horizontal relationship handle on the new line.
If you do not want to place a horizontal relationship, you can follow the sameprocedure with the Maintain Relationships option cleared. The line will still beexactly horizontal when you draw it.
Note Relationship handles can be displayed or hidden with the RelationshipHandles button on the Relationship toolbar.

Chapter 5 SmartSketch Getting Started Guide
112
Example: Draw a Line
You can use relationships to connect an element you are drawing with an existingelement. You can apply a connect relationship as you draw the lines, or draw theline without a connect relationship.
1. Click Tools > SmartSketch Settings.
2. On the Relationships tab, set the End Point option, and then click OK.
3. On the Draw toolbar, click the Line/Arc Continuous button.
4. Move the pointer to the end of a line in the application window. Thesoftware displays the End Point relationship indicator at the cursor.
5. While the software displays the relationship indicator, click to place the firstend point of the new line. This end point is connected to the end point of theprevious line.
6. Click where you want to place the second end point of the new line.
7. The new line and the previous line have connected end points.
If the Maintain Relationships option on the Tools menu is set, the softwareplaces a connect relationship handle at the point where the two lines connect.
If you do not want to place a connect relationship, you can follow the sameprocedure with the Maintain Relationships option cleared. The end points of thetwo lines will still be exactly coincident when you draw them.

Drawing Methods Chapter 5
113
Note Relationship handles can be displayed or hidden with the RelationshipHandles button on the Relationship toolbar.

Chapter 5 SmartSketch Getting Started Guide
114
Procedures to Explore in On-line Help• Draw with Relationships
• Display or Hide Relationship Handles
• Maintain Relationships

C H A P T E R 6Using Symbols
Symbols Overview .................................................................................. 116
Creating Symbols ................................................................................... 117
The Symbol Explorer.............................................................................. 118
Placing Symbols ..................................................................................... 120
Discovering Symbol Behavior and Handles........................................... 121
Editing Symbols...................................................................................... 124
Scaling Symbols...................................................................................... 126
Mirroring Symbols ................................................................................. 127
Rotating Symbols.................................................................................... 128
Manipulating Symbols............................................................................ 130
Procedures to Explore in On-line Help.................................................. 133

Chapter 6 SmartSketch Getting Started Guide
116
Symbols OverviewSymbols increase drawing productivity because they allow you to access existinggraphic data quickly and easily. With a symbol, you can place graphic informationrepeatedly without re-creating it. Symbols save you time by eliminating the need tore-create information, as well as help you maintain accurate graphic datathroughout a project. Symbols are contained in documents with an .SYMextension.
Parametric symbols are also available. You can modify these symbols by changinga parameter value.

Using Symbols Chapter 6
117
Creating SymbolsA symbol is a document with an .SYM extension. You can create a symbol byselecting any geometry and clicking the Create Symbol button on the Draw toolbar.You must then define the origin by clicking the point that you want in the select set.After defining the origin, you can save the select set as a symbol with the Save Asdialog box.
Symbols that you create display the following default behaviors:
• 90 degree rotation angles
• Automatic alignment with a target element or object when the symbol is placedin a document
• Automatic association with a target element or object.

Chapter 6 SmartSketch Getting Started Guide
118
The Symbol ExplorerYou can use the Symbol Explorer to drag symbols from a directory to the currentdocument. You can also use the Symbol Explorer to view document directories onyour computer or a network drive. The Symbol Explorer can also display HTMLpages on the World Wide Web or your computer.
When you click the Symbol Explorer button on the Main toolbar, the SymbolExplorer is displayed on the right side of the main window. The buttons on theSymbol Explorer are similar to the ones in the Windows Explorer. For example,you can click a Favorites button to go to one of your favorite web sites.
If you set the path of the Symbol Explorer to point to a directory, you see a treeview, the contents of the directory, and the Attribute Viewer. If you set the path toan HTML page, you see the contents of that page, if Microsoft Internet Explorer3.0 or later is installed. If Internet Explorer is not installed, then the softwareprompts you to install it.
Placing SymbolsThe main use of the Symbol Explorer is to drag symbols from a directory to thecurrent document. The Symbol Explorer acts much like the Windows Explorer. Toview symbols, you can type the name of the directory in the Address Box at the topof the Symbol Explorer; or you can click the Explore Elsewhere button and set thedirectory path that the Symbol Explorer looks in.
If you click the Home button at the top of the Symbol Explorer, it displays thehome page for the symbols that are associated with the template on which theactive document is based. You can override this property by setting a new addresswith the Properties command on the File menu. On the Properties dialog box, youclick the Browser tab to set the option.
After the Symbol Explorer displays the symbols, you can drag a symbol from theSymbol Explorer to the current document.
Displaying HTML PagesThe Symbol Explorer can display HTML pages on the World Wide Web or yourcomputer. To view an HTML page in the Symbol Explorer, you must enter theentire directory path and filename in the Address Box at the top of the SymbolExplorer.

Using Symbols Chapter 6
119
To view HTML pages on the World Wide Web, you must type the HTTP addressin the Address Box at the top of the Symbol Explorer. When you do this, theSymbol Explorer displays the HTML page of the address you entered. The SymbolExplorer can display any web site that you have permissions to access.
Caution HTML pages appear only if Microsoft Internet Explorer 3.0 or later isinstalled.
Searching Document DirectoriesYou can view the Symbols of any directory on your computer or the network withthe Symbol Explorer. You can type the path of the directory in the Address Box; oryou can click the Browse button and set the directory path on the dialog box.
After the Symbol Explorer displays the symbols of the directory that you want, youcan double-click any document, much like the Windows Explorer, and the softwarethat created the document opens and displays the document for editing.
You can drag and drop any document created by software that supports OLE 2.0into the current document. These documents can include .IGR, .DGN, .DWG, and.DXF types.
Symbol Explorer SettingsWhen you set options for the Symbol Explorer, the current document stores anduses these the next time you open the document. You can define a different homepage for each document in the Symbol Explorer with the Properties command onthe File menu.
On the Properties dialog box, you click the Browser tab to set the option. Whenyou set the address for the home page on the Properties dialog box, the SymbolExplorer goes to that address when you click the Home button at the top of theSymbol Explorer.
Tip The address can be a directory on a local or network drive or an HTTPaddress to a web page.

Chapter 6 SmartSketch Getting Started Guide
120
Placing SymbolsTo place a symbol, you can drag the symbol from the Symbol Explorer orWindows Explorer into the current document.
Symbol LibrariesAfter starting the software, you can open a template or document. For moststandard templates, the Symbol Explorer automatically opens and displays a defaultdirectory for all the symbols that would be appropriate to use with that template.For example, templates in the Process category point to directories with processdiagram symbols.
Tip To open the Symbol Explorer, you can also click the Symbol Explorer buttonon the Main toolbar. You might need to click the Home button in the SymbolExplorer. The Home path is stored on the Browser tab of the File Properties dialogbox.
Dragging a SymbolWhen you click a symbol in the Symbol Explorer to drag it into a document, thepointer attaches to the origin of the symbol by default to drag it in. At that instance,the origin is the drag point.
Some symbols contain more than one drag point. These appear as green dots on thesymbol. These drag points are useful if you want to place a symbol using aparticular part of the symbol. You can change to another drag point by pressing theUp and Down arrow keys on the keyboard.
By default, every element in a symbol does not appear when you place the symbolin a document. For example, if you place a symbol that contains dimensions in adocument, the dimensions are not displayed.

Using Symbols Chapter 6
121
Discovering Symbol Behavior and HandlesSymbols can display different types of behavior depending on how the symbol wascreated. When you drag and drop a symbol into a document, you can check outdifferent characteristics of the symbol to see what it can do.
Depending on how the symbol was created, some symbols automatically ungroupinto individual elements in the document when you place the symbol. For example,if you place a symbol that contains a circle and a rectangle in a document, thesymbol immediately ungroups. The parts of the symbol, the circle and rectangle,act as a separate circle and rectangle, not a symbol.
LabelsSome symbols have a label that appears as a question mark under the symbol. Tochange the text in the label, you can double-click the question mark. When theAttribute Viewer appears, you can then edit the text in the Value column and pressEnter.
Commands on the Shortcut MenuWhile the symbol is selected, right-click and look at the shortcut menu. Somesymbols have special commands on the shortcut menu that run custom processesfor the symbol. If the shortcut menu has a Help command, you can access a Helpfile that displays special information about the symbol.
Commands on the shortcut menu can also activate different representations of thesame symbol. For example, you can access different representations of the samevalve symbol, with a flanged globe, a welded globe, and so forth.
Drop PointsYou can move the symbol around in the document with the Select Tool. You candiscover special behaviors by dragging the symbol over an element or anothersymbol.
Chapter 6 SmartSketch Getting Started Guide
122
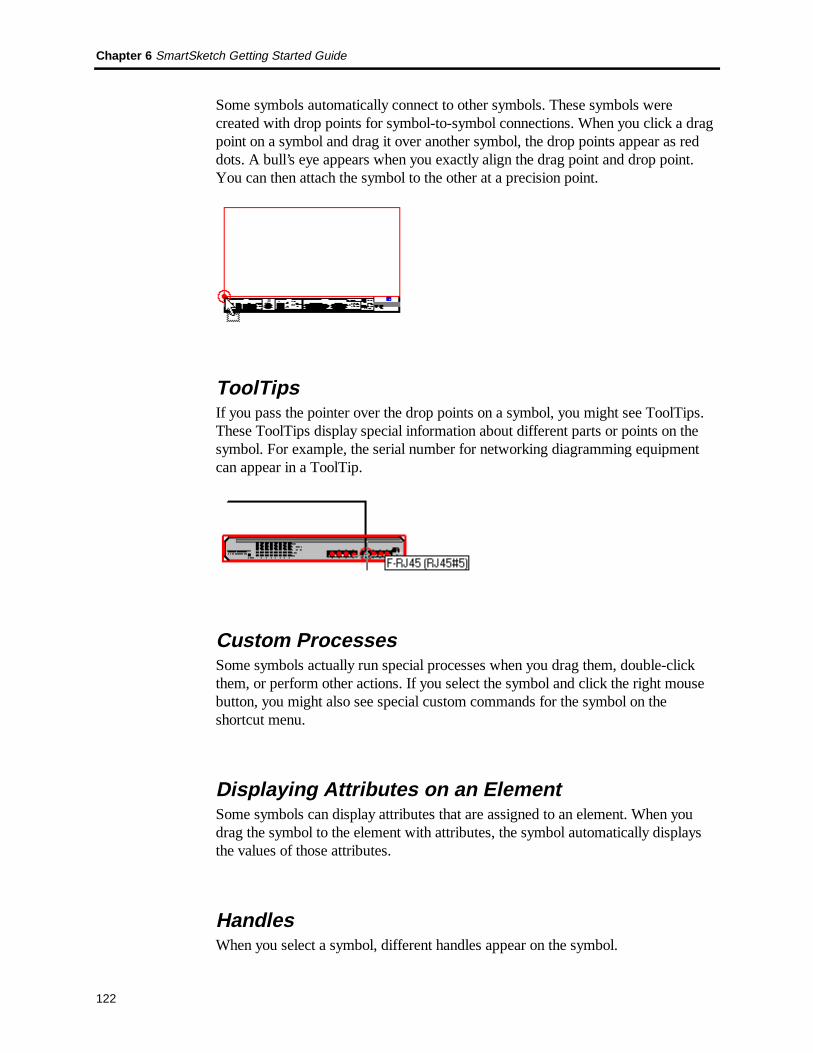
Some symbols automatically connect to other symbols. These symbols werecreated with drop points for symbol-to-symbol connections. When you click a dragpoint on a symbol and drag it over another symbol, the drop points appear as reddots. A bull’s eye appears when you exactly align the drag point and drop point.You can then attach the symbol to the other at a precision point.
ToolTipsIf you pass the pointer over the drop points on a symbol, you might see ToolTips.These ToolTips display special information about different parts or points on thesymbol. For example, the serial number for networking diagramming equipmentcan appear in a ToolTip.
Custom ProcessesSome symbols actually run special processes when you drag them, double-clickthem, or perform other actions. If you select the symbol and click the right mousebutton, you might also see special custom commands for the symbol on theshortcut menu.
Displaying Attributes on an ElementSome symbols can display attributes that are assigned to an element. When youdrag the symbol to the element with attributes, the symbol automatically displaysthe values of those attributes.
HandlesWhen you select a symbol, different handles appear on the symbol.
Using Symbols Chapter 6
123
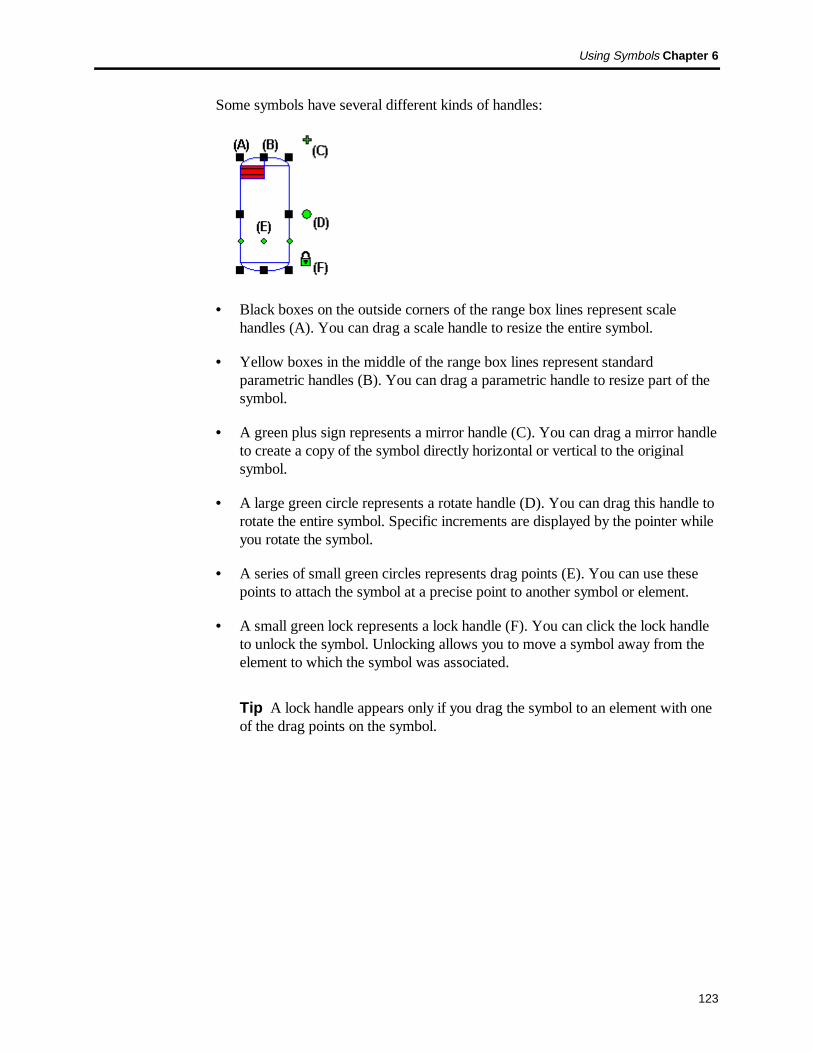
Some symbols have several different kinds of handles:
• Black boxes on the outside corners of the range box lines represent scalehandles (A). You can drag a scale handle to resize the entire symbol.
• Yellow boxes in the middle of the range box lines represent standardparametric handles (B). You can drag a parametric handle to resize part of thesymbol.
• A green plus sign represents a mirror handle (C). You can drag a mirror handleto create a copy of the symbol directly horizontal or vertical to the originalsymbol.
• A large green circle represents a rotate handle (D). You can drag this handle torotate the entire symbol. Specific increments are displayed by the pointer whileyou rotate the symbol.
• A series of small green circles represents drag points (E). You can use thesepoints to attach the symbol at a precise point to another symbol or element.
• A small green lock represents a lock handle (F). You can click the lock handleto unlock the symbol. Unlocking allows you to move a symbol away from theelement to which the symbol was associated.
Tip A lock handle appears only if you drag the symbol to an element with oneof the drag points on the symbol.

Chapter 6 SmartSketch Getting Started Guide
124
Editing SymbolsTo edit a symbol, you should select it and click Open on the shortcut menu.
Tip To display the shortcut menu, you can highlight a symbol with the pointer andthen click the right mouse button.
For some special symbols, you can also edit the properties and parameters tochange the symbol. When you drag and drop these special symbols into adocument, the Attribute Viewer automatically displays the properties andparameters. The properties are in plain text. The parameters are identified withbold text. You cannot edit the names of the parameters.
Tip If the Symbol Explorer is closed, you can also access the properties andparameters of a symbol by selecting it and clicking the Symbol Explorer button.
Editing Embedded or Linked SymbolsIf the symbol is linked, you can open the symbol and edit it. The symbol that youplaced on the drawing sheet updates automatically. Those same changes are savedin the .SYM document on the hard drive.
You can also edit the symbol while viewing the other drawing graphics by usingthe Object Edit command on the Edit menu. As you edit, all graphics except thesymbol become disabled until you finish editing the symbol. When you want tostop editing, you can click Update on the File menu to update the document thatcontains the symbol and then click Close to close the symbol document.
Embedding the symbol means that a copy of the symbol was placed in thedocument. If you edit one instance of the embedded symbol in a document, allcopies of that symbol within the current document reflect those changes.
Tip Before placing a symbol, you can set an option to link or embed the symbolwhen you drag and drop the symbol into the document. You can do this by clickingthe Options command on the Tools menu and then setting the option you want onthe Symbols tab.
Editing Parts of a SymbolTo edit parts of a symbol as individual elements on the drawing sheet, you canconvert the symbol to a group of individual graphics. To do this, you place thesymbol on a drawing sheet, select it, and then click the Convert command on theshortcut menu to convert the symbol into an element group. To ungroup the

Using Symbols Chapter 6
125
elements so that you can edit them individually, you can click the Ungroup buttonon the Change toolbar. You can now edit the individual elements.
Tip You must place a symbol in a document at the default scale (1:1) if you wantto use the Convert command. If you scale the symbol, you cannot convert thesymbol to individual elements.
Symbol LabelsTo create a label, you can double-click the symbol. A blinking pointer appearsbelow the symbol so that you can start typing the text that you want.
Formatting a SymbolYou can change the attributes of a symbol with the Attribute Viewer or theParameters tab on the Properties dialog box. You can change the value of thesymbol attribute, but you cannot change the name of the attribute or add anattribute.

Chapter 6 SmartSketch Getting Started Guide
126
Scaling SymbolsYou can use scale handles on a symbol to resize it. Four black scale handles aredisplayed on the corners of the range box of a symbol. You can drag any of the fourhandles up or down. (Illustration below contains content delivered in full product.)
You can also change the size of the symbol by clicking the Scale button on theChange toolbar.
You can modify different parts of some symbols with parametric handles. Standardparameter handles represent up to four driving dimensions that have been appliedto the graphics in a symbol. The four standard positions where parameter handlescan appear are top center, bottom center, left center, and right center of a symbol’srange box. Dragging a parameter handle changes the value of the dimension by thelength readout precision set on the Units tab of the Properties dialog box when thesymbol is created. (Illustration below contains content delivered in full product.)
You can also scale a parametric symbol by selecting the symbol and then editingthe values in the Attribute Viewer. The Attribute Viewer automatically appearswhen you select the symbol. For example, if you select the Para Tower symbol,you can change the Top attribute from 7.29 to 9.00 so that the height of the symbolincreases. (Illustration below contains content delivered in full product.)

Using Symbols Chapter 6
127
Mirroring SymbolsYou can use mirror handles to mirror a symbol about its center. The mirror handleappears at the right center of a symbol’s range box. Dragging the mirror handleacross the center of a symbol’s range box causes the symbol to mirror about itscenter in dynamics. A center line for the X and Y axis appears through the rangebox of the symbol. The axes appear as solid when the pointer crosses one or bothaxes.
When you manipulate a symbol, you see the same behaviors unique to that symbolthat existed when you placed the symbol in the document.

Chapter 6 SmartSketch Getting Started Guide
128
Rotating SymbolsYou can rotate a symbol by using one of the following methods:
• Clicking the Rotate button.
• Selecting the symbol’s rotate handle to turn it.
• Using a rotation angle.
• Using relationships applied to the symbol.
Rotate ButtonTo rotate a symbol, you can select the symbol and click the Rotate button on theChange toolbar.
Rotate HandlesYou can also rotate a symbol about its center with the appropriate handle. Therotate handle appears as a green circle to the right of the symbol. Dragging therotate handle closer to the center of a symbol’s range box causes the symbol torotate at larger angles. Dragging the rotate handle further away from a symbol’scenter causes the symbol to rotate at smaller angles.
Rotation AngleYou can also rotate a symbol by the rotation angle. When you drag a symbol oralign it to an element, you can press the left or right arrow keys on the keyboard.This rotates the symbol in 15 degree increments by default. Some symbols aredesigned to rotate at different increments.
If the symbol is created with a rotation angle other than zero, you can rotate it bythe defined step angle using the left and right arrow keys.

Using Symbols Chapter 6
129
RelationshipsBy default, when you rotate a symbol, it maintains its orientation on the drawingsheet. In the following example, the line and symbol share a dimensionalrelationship. The lower end of the symbol is set in place with a lock relationship.When you edit the dimensional value of the driving dimension, the symbol does notchange its orientation. The driving dimension changes to a driven dimension that isnot to scale.
You can also allow symbols to change orientation on the drawing sheet accordingto the relationships applied to them. This is handy if you want to change theorientation of whole sets of geometry with one driving dimension or relationship. Inthe example, when you edit the driving dimension between the line and symbol, thesymbol changes orientation on the drawing sheet, maintaining the relationshipsapplied to it.
For a symbol to rotate according to the relationships applied to it, you must first setan option by opening the symbol document (.SYM) directly. You can open thedocument with the Open command on the File menu. Then, you must click theProperties command on the File menu. On the Behavior tab, you must set theAllow Rotation By Relationships check box. After saving and closing the symboldocument, you can drag and drop the symbol into a document.
You can create kinematics animations by editing dimensional relationships betweenelements and symbols.

Chapter 6 SmartSketch Getting Started Guide
130
Manipulating SymbolsYou can manipulate a symbol just like you would manipulate other graphics. Forexample, you can edit symbol properties, apply relationships, move it, or copy it.When you manipulate a symbol, it behaves as a single unit. You can viewproperties for the symbol in the Attribute Viewer that appears at the bottom of theSymbol Explorer.
You can click any part of a symbol to move it around in a document.
Some symbols are created with drag points that appear as green dots on thesymbol. When you move the symbol around in the document, the pointerautomatically attaches to the drag point that you used most recently. You canchange drag points by pressing the Up and Down arrow keys on the keyboard.
If you drag and drop a symbol on an element in the document, the symbol isautomatically associated with that element. When the element moves, the symbolmoves with it. You must click one of the green drag points on the symbol and thenmove the symbol to the element.
Tip Some symbols cannot be associated with an element depending on whatoptions were set when the symbol was created.
Aligning a Symbol with an ElementMany symbols align automatically with elements in the document.
Using Symbols Chapter 6
131
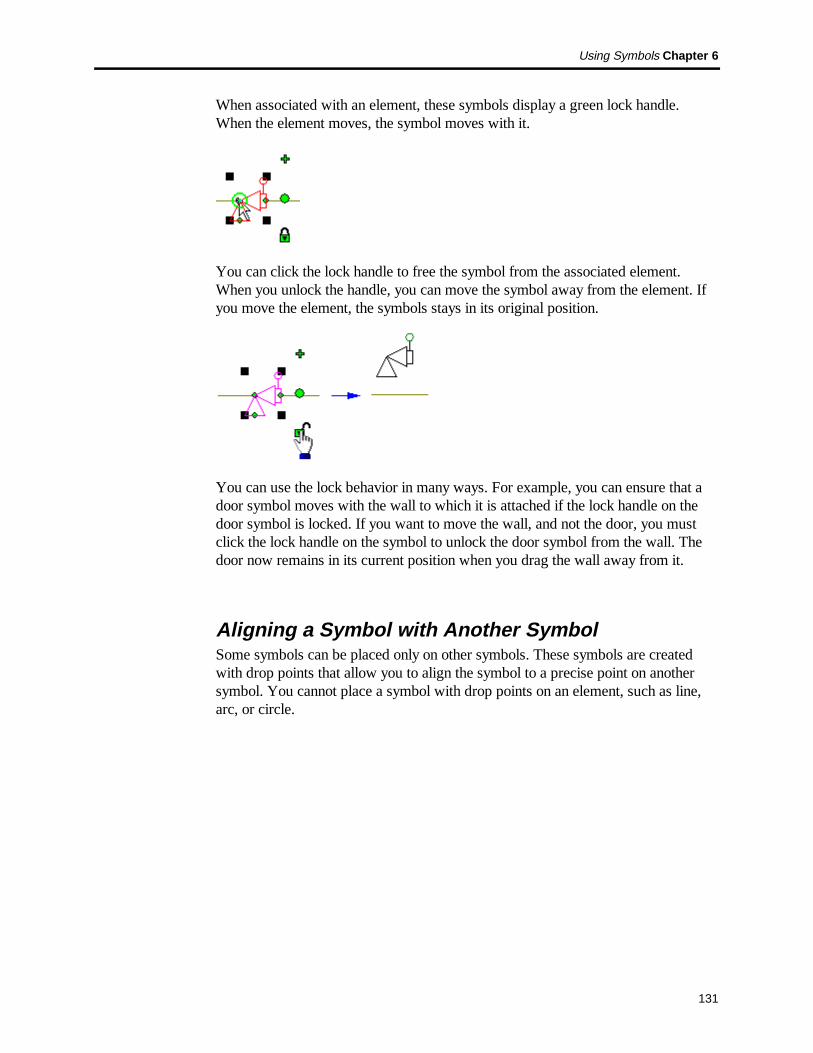
When associated with an element, these symbols display a green lock handle.When the element moves, the symbol moves with it.
You can click the lock handle to free the symbol from the associated element.When you unlock the handle, you can move the symbol away from the element. Ifyou move the element, the symbols stays in its original position.
You can use the lock behavior in many ways. For example, you can ensure that adoor symbol moves with the wall to which it is attached if the lock handle on thedoor symbol is locked. If you want to move the wall, and not the door, you mustclick the lock handle on the symbol to unlock the door symbol from the wall. Thedoor now remains in its current position when you drag the wall away from it.
Aligning a Symbol with Another SymbolSome symbols can be placed only on other symbols. These symbols are createdwith drop points that allow you to align the symbol to a precise point on anothersymbol. You cannot place a symbol with drop points on an element, such as line,arc, or circle.

Chapter 6 SmartSketch Getting Started Guide
132
When a symbol has drop points, red dots appear to indicate the drop points definedon the symbol. These drop points let you know where you can place the symbol onthe target symbol. When you click a drag point on a symbol and drag it overanother symbol, the drop points appear as red dots. A bull’s eye appears when thedrag point and drop point are exactly aligned. You can then attach the symbol tothe other with precision.

Using Symbols Chapter 6
133
Procedures to Explore in On-line Help• Create a Symbol
• Place a Symbol
• Edit a Symbol

Chapter 6 SmartSketch Getting Started Guide
134

C H A P T E R 7Reports and Attribution
Reports ................................................................................................... 136
Smart Labels........................................................................................... 137
Attributes ................................................................................................ 139

Chapter 7 SmartSketch Getting Started Guide
136
ReportsThe software delivers some reports that you can update automatically when youadd symbols to a document. The reports work with symbols that have specificattributes assigned to them. You must have Microsoft® Excel™ 97 or laterinstalled on your computer. The software includes several sample reports.
When you open a template, that specific template displays a default directory ofsymbols in the Symbol Explorer. You can find reports in the Reports directory ofthe default symbol directory. Examples that you can drag into your documentinclude the following reports:
• Network Reports—In the Network template, you can drag in reports listingnetwork equipment contacts and reports inventorying equipment.
• Process Reports—In the Process Flow template, you can drag in heatexchanger, pump and tower equipment reports and a stream report.
The software prompts you to update the report when you add it to a document.After you add more symbols to the document, you can update the existing report bydouble-clicking it.

Reports and Attribution Chapter 7
137
Smart Labels (Illustrations in this section contain content delivered in full product.)
Technical drawings often have many labels that display important informationabout the objects or elements in the document. There are two types of labels: textlabels and Smart Labels.
A Smart Label is associated to an object or element’s text attributes. A Smart Labelsometimes displays a question mark, indicating that you can edit the text in thequestion mark position.
A Smart Label displays the attributes of the element or object as text in thedocument. You can drag and drop Smart Labels from the Symbol Explorer into thecurrent document. Smart Labels have an .SYM extension. As you change anelement’s or object’s attributes in the Attribute Viewer or the Properties dialog box,the Smart Label’s text displays those changes.
If an element or object has no attributes, and you drag a Smart Label to it, theelement or object picks up the attributes of the Smart Label. For example, youmight want to assign attributes to a heat exchanger, such as pressure and materialtype. If the Smart Label has the pressure and material type defined, and the heatexchanger does not, the Smart Label’s pressure and material type are copied to theheat exchanger.

Chapter 7 SmartSketch Getting Started Guide
138
If an element already has values assigned to its attributes, a Smart Label placed onthe element displays the values that are already assigned to the element. The valuesfor the Smart Label are erased. For example, if the heat exchanger already hasvalues for pressure and material type attributes, the values of those attributesoverride any values for a Smart Label placed on the heat exchanger.
Tip Not all Smart Labels assume the text attributes of an element or object. SomeSmart Labels contain shapes that grow automatically if you add text to the SmartLabel.

Reports and Attribution Chapter 7
139
AttributesAttributes can help you work more efficiently by allowing you to enter and editvalues for a symbol, object, or element. Attributes can include such items as themanufacturer, price, and other data. Attributes include user-defined properties andparameters.
A user-defined property is an attribute assigned to an element or object that definesa characteristic about that element or object. A property is usually in the form of atext notation, such as cost, weight, color, and so forth. You can change user-defined properties, but these changes have no affect on the appearance of theelement or object.
A parameter is a mechanism to change a property. A parameter is an attributeassigned to an element or object, usually a numerical value representing adimension.
The Attribute Viewer displays the user-defined properties and parameters for aselected item. The viewer also allows you to edit the values of the properties orparameters.
Tip User-defined properties also appear on the User tab of the Properties dialogbox. Parameters appear only in the Attribute Viewer.
You cannot edit the names of attributes; you can edit only their values. The viewerdisplays two columns, one for the name of the attribute and one for the value. User-defined properties appear in plain text. Parameters appear in bold text.
When editing attributes, you can only work on one element or object at a time.When more than one item in the document is selected, no attributes are displayed inthe Attribute Viewer.

Chapter 7 SmartSketch Getting Started Guide
140
Procedures to Explore in On-line Help• Create a Symbol Report
• View the Attribute Viewer
• Place a Smart Label
C H A P T E R 8Selecting, Moving, andCopying Elements
Selecting Elements.................................................................................. 142
Moving Elements .................................................................................... 144
Cutting or Deleting Elements ................................................................. 146
Copying Elements................................................................................... 147
Creating Patterns ................................................................................... 148
Procedures to Explore in On-line Help.................................................. 149
Chapter 8 SmartSketch Getting Started Guide
142
Selecting ElementsTo select an element, you must use the Select Tool at the top of the Draw toolbar.You can select lines, arcs, or annotations, such as dimensions or fills. You can alsoselect element groups, embedded or linked objects, symbols, or handles onelements that indicate relationships.
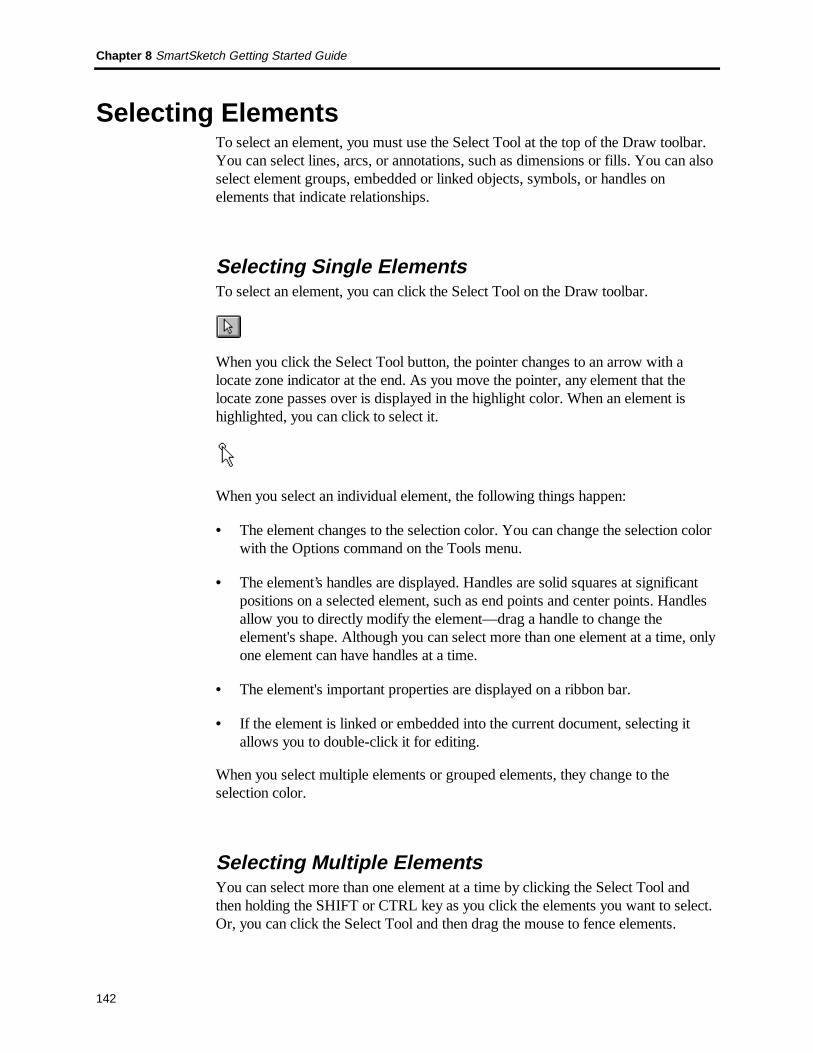
Selecting Single ElementsTo select an element, you can click the Select Tool on the Draw toolbar.
When you click the Select Tool button, the pointer changes to an arrow with alocate zone indicator at the end. As you move the pointer, any element that thelocate zone passes over is displayed in the highlight color. When an element ishighlighted, you can click to select it.
When you select an individual element, the following things happen:
• The element changes to the selection color. You can change the selection colorwith the Options command on the Tools menu.
• The element’s handles are displayed. Handles are solid squares at significantpositions on a selected element, such as end points and center points. Handlesallow you to directly modify the element—drag a handle to change theelement's shape. Although you can select more than one element at a time, onlyone element can have handles at a time.
• The element's important properties are displayed on a ribbon bar.
• If the element is linked or embedded into the current document, selecting itallows you to double-click it for editing.
When you select multiple elements or grouped elements, they change to theselection color.
Selecting Multiple ElementsYou can select more than one element at a time by clicking the Select Tool andthen holding the SHIFT or CTRL key as you click the elements you want to select.Or, you can click the Select Tool and then drag the mouse to fence elements.

Selecting, Moving, and Copying Elements Chapter 8
143
You can use the ribbon bar to select whether you want only elements completelyenclosed by the fence to be selected or any element that is partly enclosed by thefence. Many manipulation commands, like delete, move, copy, and rotate, act uponall elements in the selection set.
Selecting an Element That Overlaps Other ElementsIf you want to select an element that overlaps other elements, and you cannothighlight the element you want by moving the pointer over it, you can use a toolcalled PickQuick. To use it, you should move the pointer over the elements andpause the mouse. When the software displays an ellipsis, or three small circles, bythe pointer, you can click the left or right mouse button to display a small toolbarthat shows the number of selectable elements. You can move the pointer over thenumbers; and, when the element that you want highlights, you can click on thecorresponding number to select it.
Deselecting ElementsTo deselect an element or group of elements, you can click any point on thedrawing sheet.

Chapter 8 SmartSketch Getting Started Guide
144
Moving ElementsYou can move elements on the drawing sheet with one of several methods:
• Dragging elements with the Select Tool.
• Specifying precision points with the Move button on the Change toolbar.
Tip You can also click the Scale and Rotate buttons on the Change toolbar tomove elements.
Using the Select ToolTo move an element, you must first select it with the Select Tool on the Drawtoolbar. You can drag the selected element to move it without changing its shape.
Tip The element’s handles do not need to be displayed for you to move it. If theyare displayed, and you want to move the element and not modify it, position thepointer so it is not over a handle.
You can move an element with precision if you use the relationships indicators.
When you modify a drawing, elements with maintained relationships automaticallyupdate to honor the relationship. For example, if you move an element that shares amaintained parallel relationship with another element, the other element moves asneeded to remain parallel. If a line and an arc share a maintained tangentrelationship, they remain tangent when either is modified.

Selecting, Moving, and Copying Elements Chapter 8
145
Moving Elements by Specifying Precision PointsYou can move a line that shares a tangent relationship with an arc if you select theline and click the Move button on the Change toolbar. As you move the line, theline moves without maintaining the relationship with the arc. You can then specifya from point and a to point by clicking on the drawing sheet or by entering values inthe ribbon bar. You can move any element by specifying precision points with theMove button.

Chapter 8 SmartSketch Getting Started Guide
146
Cutting or Deleting ElementsYou can delete elements by selecting them and clicking the Cut button on the Maintoolbar or by pressing DELETE. Clicking the Cut button allows you to paste theelement in another location. Pressing DELETE removes the element permanently.
Relationships that are no longer applicable after you delete an element areautomatically deleted. For example, if you delete one of a pair of parallel lines, theparallel relationship is deleted from the remaining line.

Selecting, Moving, and Copying Elements Chapter 8
147
Copying ElementsYou can copy any element, dimension, or object by selecting it and using the Copybutton on the Main toolbar. Copying places the selected item on the Clipboard.When you click the Paste button on the Main toolbar, the item is placed on thedrawing sheet.
You can also copy an element with the Select tool. You click the Select tool on theDraw toolbar, select the element, and press CTRL as you drag the element acrossthe drawing sheet. You can also copy several selected elements in the samemanner.
When you copy elements that have relationships, the relationships are copied andretained when possible. For example, if you make a copy of two related lines, therelationship is also copied. However, if you copy one of two lines that are related toeach other, the relationship is not copied.
Tip You can also click the Offset, Move, Scale, and Rotate buttons on the Changetoolbar to create copies.

Chapter 8 SmartSketch Getting Started Guide
148
Creating PatternsPatterns are useful if you want to create several elements quickly that are the samewithout using several commands. You can create patterns by selecting one or moreelements and making several copies of it with the Rectangular Pattern or CircularPattern button on the Change toolbar.
To modify individual members of the pattern, you can select an individual memberof the pattern and change it the way you would any other element.
Selecting, Moving, and Copying Elements Chapter 8
149
Procedures to Explore in On-line Help• Select and Move an Element
• Copy an Element
• Paste an Element
• Offset Elements
• Draw a Circular Pattern
• Draw a Rectangular Pattern

Chapter 8 SmartSketch Getting Started Guide
150

C H A P T E R 9Transforming Elements
Changing the Shape of an Element ........................................................ 152
Rotating Elements................................................................................... 153
Mirroring Elements ................................................................................ 154
Scaling Elements .................................................................................... 155
Extending or Trimming Elements........................................................... 156
Applying Relationships to Change Existing Elements............................ 158
Using Dimensions to Change Existing Elements ................................... 162
Procedures to Explore in On-line Help.................................................. 163
Tip For more information about how to change symbols, see Chapter 6.

Chapter 9 SmartSketch Getting Started Guide
152
Changing the Shape of an ElementYou can change the size, position, or orientation of an element with your pointer.When you select an element with the Select Tool, its handles are displayed at keypositions.
You can change the shape of a selected element by dragging one of its handles. Thefirst figure shows the effect of dragging an end point handle. The second figureshows the effect of dragging the mid point handle.

Transforming Elements Chapter 9
153
Rotating ElementsWith the Rotate button on the Change toolbar, you can rotate one or more elementsa precise angle about a specified point.
You can first select the element and then click the Rotate button or you can clickthe button and then the element.
As you click to define the reference points for the rotation, the softwaredynamically displays a reference axis for the rotation. If you want to define aprecise location for the rotation, you can enter values in the ribbon bar. You canenter increments in the Step Angle box if you want to dynamically view the resultsof the rotation. For example, if the box is set to 30.0, the rotation is displayed in 30degree increments. The default setting is 0 degrees so that the rotation is fullydynamic.
The Rotation Angle box on the ribbon bar displays the angle of change between theold and new positions with a positive value. The Position Angle box displays anabsolute angle of the new position of the rotation. You can type values in both ofthese boxes and preview the results. You then click to complete the rotation of theelement.
By default, a copy is made of the element when you rotate it. If you do not want acopy, you should clear the Copy option on the ribbon bar.
Tip For more information about rotating symbols, see Chapter 6.

Chapter 9 SmartSketch Getting Started Guide
154
Mirroring ElementsTo mirror an element, you can click the Mirror button on the Change toolbar. Thesoftware mirrors one or more selected elements about a line or axis that you define.You can mirror with or without making a copy.
Tip For more information about mirroring symbols, see Chapter 6.

Transforming Elements Chapter 9
155
Scaling ElementsThe Scale command on the Change toolbar reduces or enlarges selected elementsby a scale factor that you define. The scale factor is the same along the x and yaxes. Scalable elements include framed elements, such as text boxes. You cannotuse the Scale command to scale or scale and copy elements in a drawing viewbecause a scale factor has already been applied to the drawing view.
Relationships within the selection set are maintained if the relationships are stillapplicable after the elements have been scaled. If not, the relationships are deleted.
To define the new scale, you can click points on the drawing sheet or you can typea value in the Scale Factor box on the ribbon bar. You can also use the Step box onthe ribbon bar to make the Scale Factor increase or decrease incrementally as youmove the mouse.
Chapter 9 SmartSketch Getting Started Guide
156
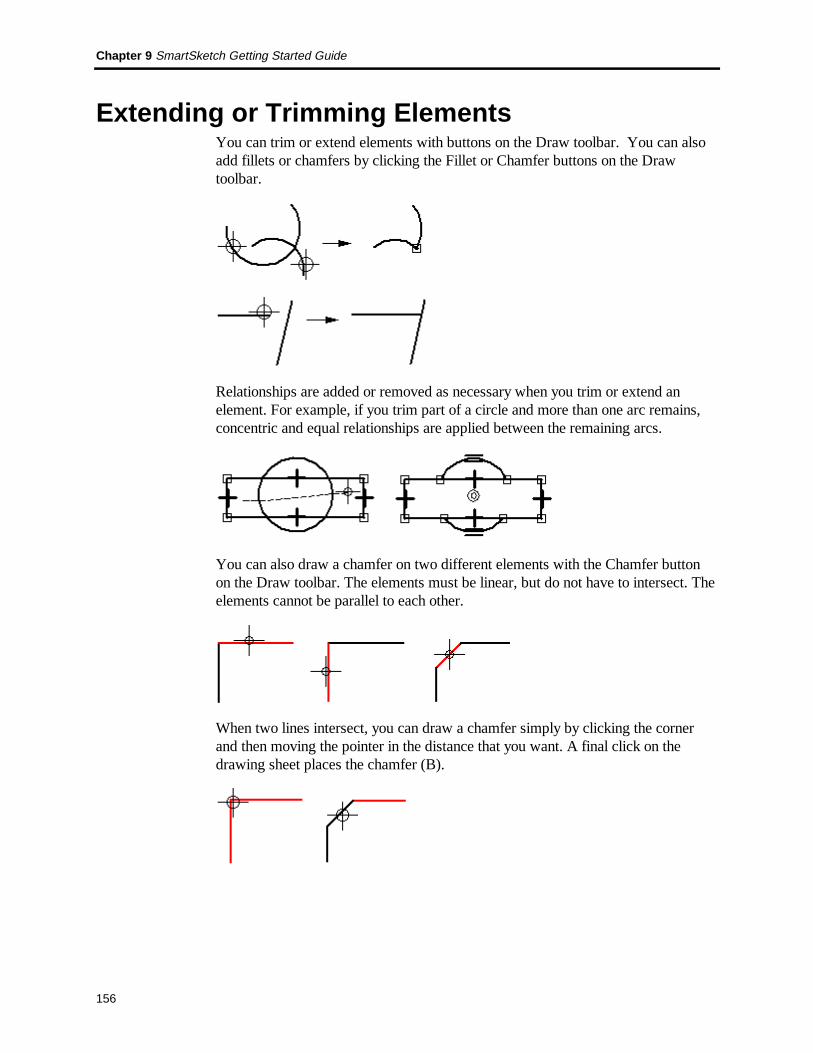
Extending or Trimming ElementsYou can trim or extend elements with buttons on the Draw toolbar. You can alsoadd fillets or chamfers by clicking the Fillet or Chamfer buttons on the Drawtoolbar.
Relationships are added or removed as necessary when you trim or extend anelement. For example, if you trim part of a circle and more than one arc remains,concentric and equal relationships are applied between the remaining arcs.
You can also draw a chamfer on two different elements with the Chamfer buttonon the Draw toolbar. The elements must be linear, but do not have to intersect. Theelements cannot be parallel to each other.
When two lines intersect, you can draw a chamfer simply by clicking the cornerand then moving the pointer in the distance that you want. A final click on thedrawing sheet places the chamfer (B).

Transforming Elements Chapter 9
157
To place a fillet, you can click the Fillet button on the Draw toolbar and then selectthe elements you want to modify. As with any command, you can use acombination of clicks and ribbon bar input.

Chapter 9 SmartSketch Getting Started Guide
158
Applying Relationships to Change ExistingElements
You can apply relationships as you draw and place elements by using therelationship indicators that appear by the pointer. You can also apply relationshipsto elements that you have already placed on the drawing sheet.
Applying Relationships to Existing ElementsTo apply relationships to elements that you have already placed on the drawingsheet, click a button on the Relationship toolbar and then select the elements youwant to relate. When you apply a relationship between elements, the elements aremodified to reflect the relationship. If Maintain Relationships is set when you usethe commands on the Relationship toolbar to add relationships to your drawing, theadded relationships will be maintained.
For example, selecting the Equal command and clicking two circles makes thecircles equal in size.
If a line and arc are not tangent, applying a tangent relationship modifies one orboth elements to make them tangent.
When you use commands on the Relationship toolbar, the software allows you toselect only elements that are valid input for that command. For example, when youuse the Concentric command, the command allows you to select only circles, arcs,and ellipses.

Transforming Elements Chapter 9
159
Perhaps you begin designing with a few key design parameters. You would usuallydraw known elements in relation to one another and then draw additional elementsto fill in the blanks.
As you draw and add elements to the drawing, the relationships are maintained andadditional relationships are applied.
Chapter 9 SmartSketch Getting Started Guide
160
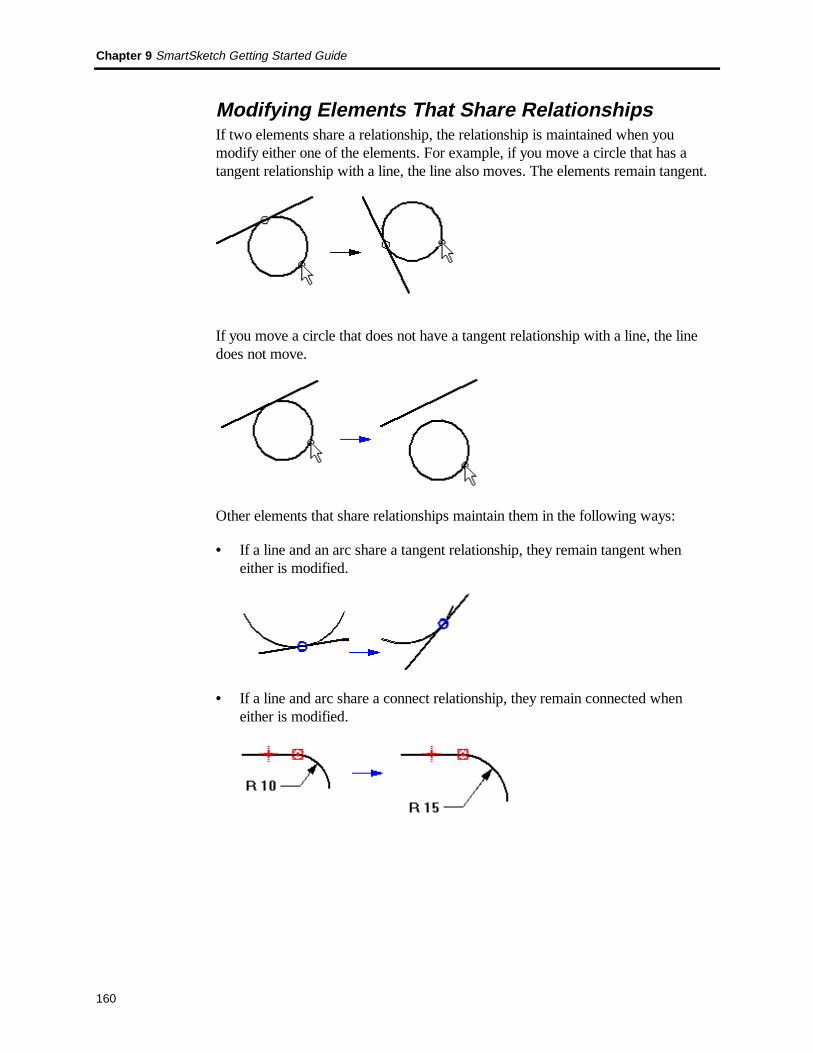
Modifying Elements That Share RelationshipsIf two elements share a relationship, the relationship is maintained when youmodify either one of the elements. For example, if you move a circle that has atangent relationship with a line, the line also moves. The elements remain tangent.
If you move a circle that does not have a tangent relationship with a line, the linedoes not move.
Other elements that share relationships maintain them in the following ways:
• If a line and an arc share a tangent relationship, they remain tangent wheneither is modified.
• If a line and arc share a connect relationship, they remain connected wheneither is modified.

Transforming Elements Chapter 9
161
• If two lines are horizontal, they remain horizontal even if you change theposition and length of one of the lines.
Deleting RelationshipsYou can delete a relationship as you would delete any other element. You select arelationship handle, and then select the Delete command. Relationships areautomatically deleted when their deletion is necessary to allow a modification tooccur. For example, if you rotate an element that has a horizontal relationshipapplied to it, the relationship is automatically deleted.
If you want to change an element by adding or removing a relationship, and theelement does not change the way you expect, it may be controlled by a drivingdimension. You can toggle the dimension from driving to driven, then make thechange.

Chapter 9 SmartSketch Getting Started Guide
162
Using Dimensions to Change Existing ElementsYou can change dimensions on the drawing sheet to change existing elements.Driving dimensions are relationships that allow you to maintain characteristics suchas the size, orientation, and position of elements. When you place a drivingdimension on or between elements, you can change the measured elements byediting their dimensional values—you do not have to delete or redraw elements atdifferent sizes.
For example, dimensioning the radius of an arc maintains its size. Editing the valueof the radius dimension changes its size.
To create dimensional relationships, select a dimension command and click theelements you want to relate.
Tip You must set the Maintain Relationships option on the Tools menu beforedrawing the elements or applying your dimensions.

Transforming Elements Chapter 9
163
Procedures to Explore in On-line Help• Modify an Element with the Select Tool
• Rotate an Element
• Mirror an Element
• Scale an Element
• Trim an Element
• Extend an Element
• Draw a Chamfer
• Draw a Fillet
• Make Elements Tangent
• Make Elements Concentric
• Place a Driving Dimension

Chapter 9 SmartSketch Getting Started Guide
164

C H A P T E R 10Arranging Elements
Placing Elements in Precise Locations .................................................. 166
Placing Elements with a Grid................................................................. 168
Element Groups...................................................................................... 169
Element Display Priority........................................................................ 171
Using Layers to Arrange Elements ........................................................ 172
Procedures to Explore in On-line Help.................................................. 174

Chapter 10 SmartSketch Getting Started Guide
166
Placing Elements in Precise LocationsPinPoint is a tool that helps you draw and modify elements relative to knownpositions in a drawing. You can place a target point and then the softwaredynamically displays the horizontal and vertical distance between the cursor andthe target point. You can use PinPoint with all element drawing commands. Youcan run PinPoint from the Tools menu or the Main toolbar.
How PinPoint WorksPinPoint allows you to provide coordinate input to commands as you draw. The xand y coordinates are relative to a target point that you can position anywhere in thewindow. You can change the location of the target point at any time by clicking theReposition Target button on the ribbon bar and then clicking a new position in thewindow.
As you move the pointer around, PinPoint dynamically displays the horizontal andvertical distance between the cursor position and the target point. Help lines showthe PinPoint x and y axes and the PinPoint orientation.
Locking and Freeing ValuesYou can lock the x coordinate or the y coordinate using the X and Y boxes on theribbon bar. When one coordinate value is locked, you can position the othercoordinate by clicking a position in the window. Or you can set both values usingthe ribbon bar boxes. If you want to free the dynamics for a locked value, you canclear the value box by double-clicking in the box and pressing the Backspace orDELETE key.
PinPoint OrientationIn its default orientation, PinPoint’s x axis is horizontal. You can re-orient the x axisto any angle by setting the angle on the PinPoint ribbon bar. The figure shows thePinPoint angle set to 20 degrees.

Arranging Elements Chapter 10
167
Example: Draw a Line
You can use PinPoint to draw a line starting at a specific x and y distance from aknown position in your drawing.
1. On the Main toolbar, click the PinPoint button.
2. Click where you want the target point to be.
3. Change the step value in the PinPoint Ribbon Bar if it is not already set to avalue that is appropriate for the operation.
4. On the Draw toolbar, click the Line/Arc Continuous button.
5. Move the pointer around on the drawing sheet. PinPoint displays at the cursorits current x and y positions in relation to the target point.
6. Click when the pointer is positioned where you want the line to begin.
7. Click where you want the second point of the line to be, or type the lengthand/or angle on the Line/Arc Continuous ribbon bar and then click to draw theline.

Chapter 10 SmartSketch Getting Started Guide
168
Placing Elements with a GridThe grid and its grid lines allow you to place elements in the document by aligningthem with the grid lines or nearest intersection of the grid lines. You can use thegrid if you want the elements to line up at regular intervals in the document.
The grid is an invisible set of lines in the document. When you set the Grid Snapoption on the View menu, elements always align with the grid lines or nearestintersection of the grid lines. You can view the grid by clicking the Grid Displayoption on the View menu. The grid lines do not print.
You can change the display of the grid from static to dynamic by setting options onthe View tab of the Options dialog box.
When you zoom in or out, the grid lines for a dynamic grid are generateddynamically. You can set dynamic grid lines to appear at fine, medium, or coarselevels. The grid lines appear at common major measurement increments. Adynamic grid displays index lines that intersect with the darker, solid grid lines.
A static grid displays solid grid lines that do not move as you zoom in or out. Youcan set up the increment settings on the View tab of the Options dialog box.

Arranging Elements Chapter 10
169
Element GroupsA group is a set of elements that you have selected. The set behaves like any otherselect set. Grouping elements allows you to work with them as a unit. For example,you could place the holes and center lines of a bolt hole pattern into a group. Thiswould allow you to move, copy, or delete the entire pattern at once, as if it were asingle element.
The following list describes some of the properties of groups:
• An element can be a member of only one group.
• Grouped elements must reside in the same document and be on the samedrawing sheet.
• Any locatable element can be grouped.
• Any combination of elements, such as lines, text, circles, and so forth, can begrouped.
You can use the Group command to nest two or more entire groups within a largergroup, or you can nest individual elements and groups within a larger group.
Once elements are grouped, you can use the Ungroup command to ungroup all ofthe elements at the same time. You can also use the Ungroup command andPickQuick to remove one or more elements from a group.
Selecting Groups and Members of GroupsThe options on the Select Tool ribbon bar allow you to select an entire group orindividual members of a group. If you set the bottom-up option, you can selectindividual members. If you select the top down option, you can select all themembers.
You can also use PickQuick to select one or more group members or an entiregroup.
Performing Tasks on GroupsOnce you select a group, you can use a command or ribbon bar option on all of itsmembers. For example, when you move, copy, or delete a group, all of itsmembers are moved, copied, or deleted. You can move or apply relationships to amember of a group and the changes do not affect the position of the other membersof the group.

Chapter 10 SmartSketch Getting Started Guide
170
When you copy an entire group, all of its members are copied, including nestedgroups. The software creates a new group that contains all of the members of theoriginal group. When you copy one member of a group, only that member iscopied.
If you use PickQuick to select a member of a group, you can perform tasks on themember individually, without affecting other members.

Arranging Elements Chapter 10
171
Element Display PriorityWhen 2-D elements overlap, their display priority determines which is in front. Thefirst element you draw is displayed behind all other elements—it has the lowestdisplay priority. A newly created element is displayed in front of all otherelements—it has the highest display priority.
For example, if you draw a circle, then an ellipse, and then a rectangle, the circle isdisplayed in back. The ellipse is displayed between the circle and the rectangle, andthe rectangle is displayed in front.
Changing the Element Display PriorityYou can change an element's display priority by pulling it up one position, pushingit down one position, sending it to the back, or bringing it to the front. One click onthe striped box changes the display priority.
You can change the display priority of a group the same way. The display priorityof elements within the group does not change.

Chapter 10 SmartSketch Getting Started Guide
172
Using Layers to Arrange ElementsLayers and display settings can help you group elements so that you canmanipulate them more easily on a drawing sheet. Layers and display settings alsomake it easier to keep track of different types of elements. Each drawing sheet in adocument can contain several layers.
When you draw an element, it is assigned to the active layer. To see which layer isactive, or to change the active layer, you can use the Layers button on the Maintoolbar.
Controlling the Display of Elements and ObjectsAfter assigning an element or object to a layer, you can set display criteria tocontrol the way items appear in a window with the Display Manager command onthe Tools menu. With this command, you can set display criteria for any sheet andits associated layers in the current document. The display settings can include thecolor or line type and line width of elements or objects.
Tip If two windows are open for the same document, the display settings that youselect with the Display Manager dialog box affect every window view of thedrawing sheet.
Displaying LayersTo view elements on specific layers, you can turn on one or more layers with theLayers button. When you turn layers off, you cannot see the elements assigned tothe layers on the drawing sheet. For example, you can assign lines to one layer andclosed elements to another layer. Then, if you turn off the layer for closed elementsand turn on the layer for lines, you see only lines on the drawing sheet.

Arranging Elements Chapter 10
173
You can still see relationships between elements that are assigned to differentlayers on a drawing sheet. For example, suppose a line and a circle are tangent andthey are assigned to different layers. If the line’s layer is displayed and the circle’slayer is hidden, you can still see the tangent relationship handle on the line. If theline’s layer is hidden as well, the tangent relationship handle is hidden.
With the Display Manager command on the Tools menu, you can control the wayelements appear on sheets or layers by changing settings, such as the line type orcolor. You can also create custom colors for the display.
Layers and Layer GroupsWhile layers provide a way to control the display of elements on a drawing sheet,layer groups give you another way to control the display of elements on drawingsheets. You can use the Layer Groups command on the Tools menu to define layergroups.
Creating New LayersYou can create new layers with the Layer Groups command or by typing a newlayer name on the ribbon bar. You cannot give the same name to two layers on thesame drawing sheet.
Assigning Elements to LayersAlthough you can assign an element to only one layer, you can change the layer towhich an element is assigned. You can find out which layer an element is assignedto by selecting it and using the Properties command on the Edit menu.

Chapter 10 SmartSketch Getting Started Guide
174
Procedures to Explore in On-line Help• Draw with PinPoint
• Group or Ungroup Elements
• Send an Element to the Back of the Display Order
• Control the Display of Elements in a Window
• Change the Active Layer
• Display or Hide Layers

C H A P T E R 11Viewing Your Work
Viewing Your Work................................................................................. 176
Microsoft’s IntelliMouse......................................................................... 178
Procedures to Explore in On-line Help.................................................. 179

Chapter 11 SmartSketch Getting Started Guide
176
Viewing Your WorkYou can manipulate windows and views to affect how you see a document on thecomputer screen. A window can be compared to a camera. When you look througha camera, you see a view of a real-world object. When you look through a windowon the computer screen, you see a view of the objects in the document. In bothcases, you can change the view by zooming in and out, and focusing on differentparts of the document. You can also use the Microsoft IntelliMouse to zoom or panviews.
WindowsWhen you start the software, the application window displays a blank document.You can use commands on the File menu to create a new document or open anexisting one.
With the commands on the Window menu, you can create and arrange newwindows that allow you to see more than one section of a document or more thanone document. You can minimize open windows and display them as icons in theapplication work space.
ViewsViews are what you see in software windows. With the view commands, you cando the following:
• Use the Zoom Area command to set the zoom area to see more detail in thedocument.
• Use the Zoom In command to enlarge the display of elements around aspecified point in the document.
• Use the Zoom Out command to reduce the display of elements around aspecified point in the document.
• Use the Pan command to position another part of the document in the center ofa view, fit all of the document in a view, or identify the area of the documentyou want to see.
• Use the Fit command to restore the previous view of the document.
• Use the Previous command to restore the previous view.
• Use the Toolbars command to display or hide toolbars in the applicationwindow.

Viewing Your Work Chapter 11
177
Drawing SheetsWith drawing sheets, you can place different drawings on different sheets in adocument. Working sheets are the drawing sheets on which you place most of yourgraphics. Background sheets are drawing sheets that allow you to define anddisplay the border of a drawing sheet.
LayersWithin each drawing sheet, you can place several layers so that you can groupelements. Layers allow you to keep track of elements in the document andmanipulate them more easily. You can also specify the way you want elements tobe displayed in a window.
Note For more information about drawing sheets, see Chapter 15. For moreinformation about layers, see Chapter 7.
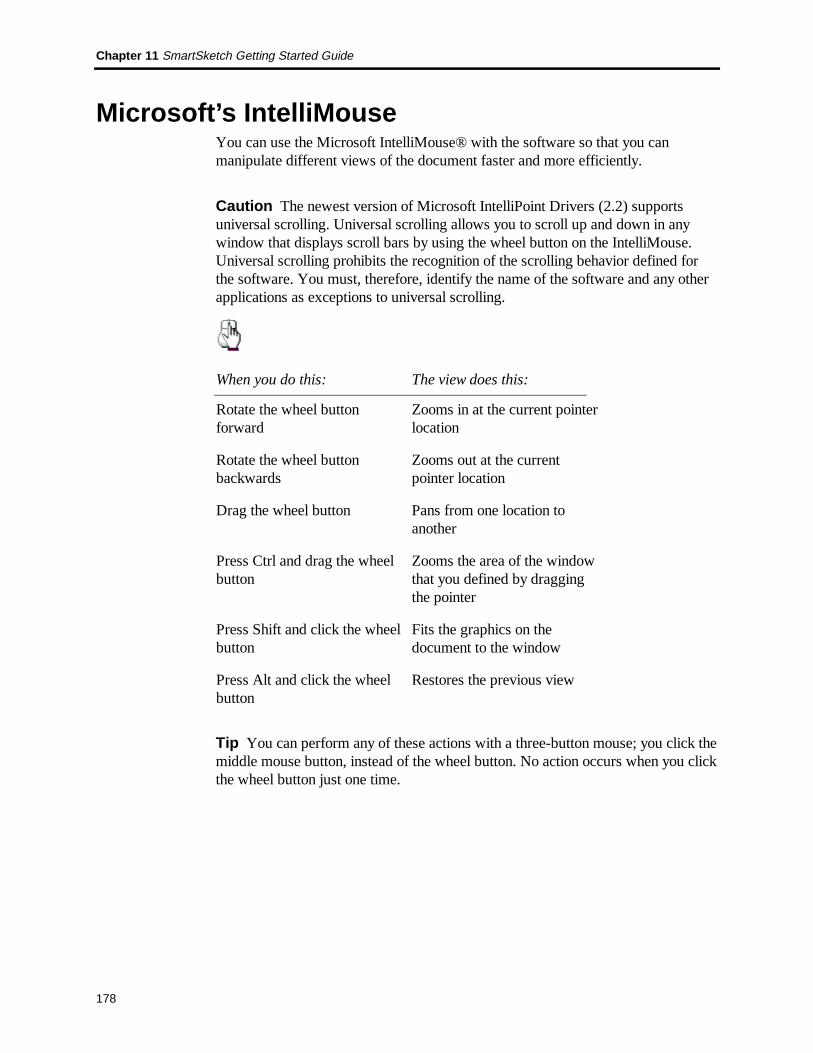
Chapter 11 SmartSketch Getting Started Guide
178
Microsoft’s IntelliMouseYou can use the Microsoft IntelliMouse® with the software so that you canmanipulate different views of the document faster and more efficiently.
Caution The newest version of Microsoft IntelliPoint Drivers (2.2) supportsuniversal scrolling. Universal scrolling allows you to scroll up and down in anywindow that displays scroll bars by using the wheel button on the IntelliMouse.Universal scrolling prohibits the recognition of the scrolling behavior defined forthe software. You must, therefore, identify the name of the software and any otherapplications as exceptions to universal scrolling.
When you do this: The view does this:
Rotate the wheel buttonforward
Zooms in at the current pointerlocation
Rotate the wheel buttonbackwards
Zooms out at the currentpointer location
Drag the wheel button Pans from one location toanother
Press Ctrl and drag the wheelbutton
Zooms the area of the windowthat you defined by draggingthe pointer
Press Shift and click the wheelbutton
Fits the graphics on thedocument to the window
Press Alt and click the wheelbutton
Restores the previous view
Tip You can perform any of these actions with a three-button mouse; you click themiddle mouse button, instead of the wheel button. No action occurs when you clickthe wheel button just one time.

Viewing Your Work Chapter 11
179
Procedures to Explore in On-line Help• Fit All Elements in the Active Window
• Pan a View
• Zoom Out
• Zoom In

Chapter 11 SmartSketch Getting Started Guide
180
C H A P T E R 12Working withMeasurements,Dimensions, andVariables
Dimensions Overview............................................................................. 182
Types of Dimensions .............................................................................. 186
Dimension Groups ................................................................................. 187
Measuring Distances and Areas ............................................................ 189
Bearing and Azimuth.............................................................................. 191
Variables ................................................................................................ 192
Paper and Model Units .......................................................................... 196
Procedures to Explore in On-line Help.................................................. 197

Chapter 12 SmartSketch Getting Started Guide
182
Dimensions OverviewDimensions supply information about the size, location, and orientation ofelements, such as the length of a line, the distance between points, or the angle of aline. Dimensions are associative to the elements they refer to, so you can makedesign changes easily.
You can use the commands on the Dimension toolbar to place the following typesof dimensions:
(A) Linear dimensions
(B) Angular dimensions
(C) Diameter dimensions
(D) Radial dimensions
(E) Dimension groups
Dimension commands on the Dimension toolbar have a ribbon bar that sets optionsfor placing the dimension. When you select a dimension in the drawing, the sameribbon bar options appear. You can use the options to change the selecteddimension.

Working with Measurements, Dimensions, and Variables Chapter 12
183
Placing DimensionsTo dimension elements, you can use a dimension command on the Dimensiontoolbar, such as SmartDimension, and then select the elements you want todimension.
As you place dimensions, the software shows a temporary, dynamic display of thedimension you are placing. This temporary display shows what the new dimensionwill look like if you click at the current pointer position. The dimension orientationchanges depending on where you move the pointer.
For example, when you click Distance Between on the Dimension toolbar andselect an origin element and an element to measure to, the dimension dynamicallyadjusts its orientation depending on where you position your pointer.
Because you can dynamically control the orientation of a dimension duringplacement, you can place dimensions quickly and efficiently without having to useseveral commands. Each of the dimension commands uses placement dynamicsthat allow you to control how the dimension will look before you place it.
Placing Dimensions with the Dimension AxisThe Axis button on the Dimension toolbar sets the orientation of the dimension axison the drawing sheet. You can use the new dimension axis, rather than the defaultaxis of the drawing sheet, while you are using the Distance Between or CoordinateDimension command. You must set the Explicit option on the Dimension ribbonbar to place dimensions that are perpendicular or parallel to new dimension axis.
Dimensioning While You DrawTo dimension elements as you draw them, you can set Dimension Keyin ValuesAutomatically with the Options command on the Tools menu. Although placingdimensions as you draw is convenient, it might be necessary to delete unneededdimensions when you have finished your design.

Chapter 12 SmartSketch Getting Started Guide
184
Note Dimensions placed with this option are only driven dimensions.
Using Dimensions to Drive ElementsYou can place a dimension that controls the size or location of the element to whichit refers. This type of dimension is known as a driving dimension. If you use theribbon bar to change the dimensional value of a driving dimension, the elementupdates.
Dimensions that are not driving dimensions are called driven dimensions. Thevalue of a driven dimension is controlled by the element it refers to. If the elementchanges, the dimensional value updates.
Because both driving and driven dimensions are associative to the element theyrefer to, you can change the design more easily without having to delete and re-apply elements or dimensions when you update the design.
If you want to create a driving dimension, you must first set the MaintainRelationships command on the Tools menu. When you are placing dimensions, anoption on the ribbon bar allows you to specify whether a dimension is driving ordriven. A driving dimension and a driven dimension are distinguished by color.There are different colors for driving dimensions and driven dimensions in adimension style.
Not-to-Scale DimensionsYou can override the value of a driven dimension by editing its dimensional value.This makes the dimension not-to-scale. For example, if you override thedimensional value that is 15 millimeters to be 30 millimeters, the actual size of theline that you see would still be 15 millimeters.

Working with Measurements, Dimensions, and Variables Chapter 12
185
Formatting DimensionsIf you want two or more dimensions to look the same, you can select thedimensions and apply a style with the ribbon bar. If you want to format dimensionsso that they look unique, you can select a dimension and edit its formats on theribbon bar or with the Properties command on the Edit menu.
Using Expressions in DimensionsThere are many instances when the dimensions of individual features in a designare related. For example, the bend radius used to manufacture a sheet metal part isusually a function of the stock thickness. You can define and automate these typesof design relationships with expressions. You can select a dimension and then usethe Variables command on the Tools menu to enter a formula. When the formula issolved, the dimensional value changes to the value that the formula calculates.
You might want to use dimensions with expressions for the following purposes:
• Drive a dimension by another dimension; Dimension A = Dimension B
• Drive a dimension by a formula; Dimension A = pi * 3.5
• Drive a dimension by a formula and another dimension; Dimension A = piDimension B
Setting or Modifying Units of MeasureTo set the units of measure for a dimension, you can use the Properties commandon the Edit menu. To set the units of measure for a document, you can click theProperties command on the File menu and then click the Units tab.

Chapter 12 SmartSketch Getting Started Guide
186
Types of DimensionsA linear dimension measures the length of a line or the distance between two pointsor elements. You can place linear dimensions with the Distance Between andSmartDimension commands.
An angular dimension measures the angle of a line, the sweep angle of an arc, orthe angle between two or more lines or points. You can place angular dimensionswith the Angle Between and SmartDimension commands.
A radial dimension measures the radius of elements, such as arcs, circles, ellipses,or curves. You can place a radial dimension with the SmartDimension command.
A diameter dimension measures the diameter of elements, such as circles andellipses. You can place a diameter dimension with the SmartDimension command.
The components of a dimension are as follows:
(A) Projection line (E) Break line
(B) Dimension line (F) Symbol
(C) Dimensional value (G) Connect line
(D) Terminator

Working with Measurements, Dimensions, and Variables Chapter 12
187
Dimension GroupsYou can place dimensions in dimension groups with several commands. Thismakes the dimensions easier to manipulate on the drawing sheet. All members of astacked or chained dimension group share the same dimension axis.
• Stacked dimension group
• Chained dimension group
A coordinate dimension group is another type of dimension group. Coordinatedimensions measure the position of key points or elements from a common origin.All the dimensions within the group measure from a common origin. You shoulduse coordinate dimensions when you want to dimension elements in relation to acommon origin or zero point.
When you are placing dimension groups with the Distance Between or AngleBetween commands, the cursor position determines what type of dimension groupwill be placed. After you place the first dimension in a group and click the secondelement you want to measure, if the cursor is below the first dimension, then thedimension group will be a chained group.

Chapter 12 SmartSketch Getting Started Guide
188
If the cursor is above the first dimension, then the dimension group will be astacked group.
You can place dimension groups with the following buttons on the Dimensiontoolbar:
• Distance Between
• Angle Between
• Symmetric Diameter
• Coordinate Dimension

Working with Measurements, Dimensions, and Variables Chapter 12
189
Measuring Distances and AreasYou can also measure the length of a line or the diameter of a circle by selectingthe element and looking at the value on the ribbon bar. For more detailed work, thesoftware provides commands for measuring distances or areas in a drawing. Evenwhen you are in the middle of a task, you can measure distances or areas with thesecommands.
• The Measure Distance command measures the distance between points onelements and points in free space.
• The Measure Area command measures the area inside one or more closedboundaries.
The distances are shown using the current units of measure for the document. Toset the units for measuring distances or areas, you can use the Properties commandon the File menu.
Example: Measure the Length of a Line
Even when you are in the middle of a task, you can measure distances with theMeasure Distance command. For example, consider the following workflow.
1. On the Draw toolbar, select the Line/Arc Continuous button and draw a line.
2. On the Tools menu, click the Measure Distance command and measure adistance.
Note You do not need to exit the Line command before measuring a distance.
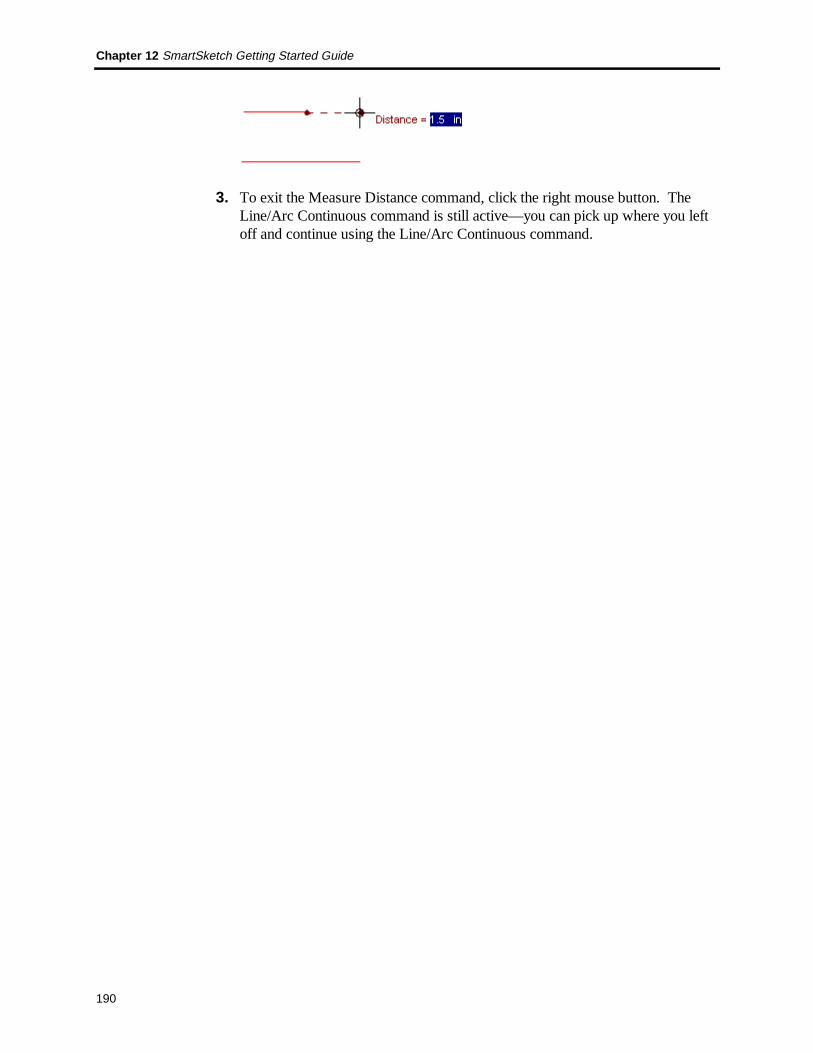
Chapter 12 SmartSketch Getting Started Guide
190
3. To exit the Measure Distance command, click the right mouse button. TheLine/Arc Continuous command is still active—you can pick up where you leftoff and continue using the Line/Arc Continuous command.

Working with Measurements, Dimensions, and Variables Chapter 12
191
Bearing and AzimuthYou may want to orient your drawing in an environment with a specific bearingand azimuth. This tool may be useful for applications such as civil engineering.
Tip The Bearing and Azimuth command is available only if you use theCustomize command on the Tools menu to place it on a toolbar or menu. On theToolbars tab of the Customize dialog box, click the Tools category to access thecommand.

Chapter 12 SmartSketch Getting Started Guide
192
VariablesYou can use the Variable Table to define and edit functional relationships betweenthe dimensions of a design in a familiar spreadsheet format. The Variable Table isaccessed with the Variables command on the Tools menu. There are two types ofvariables: dimensions displayed in the design and variables you create directly inthe Variable Table. Dimension variables directly control elements of a design. Auser variable must be set equal to a value or mathematical expression; for example,PI = 3.14159.
You can use variables to do the following:
• Drive a dimension with another dimension; Dimension A = Dimension B
• Define a constant; pi=3.14
• Drive a dimension with a formula; Dimension A = pi * 3.5
• Drive a dimension with a formula and another dimension; Dimension A = pi *Dimension B
• Drive a dimension with a formula that includes a function; Dimension A =Dimension B + cos(Dimension C)
• Drive a dimension with a value from a spreadsheet, such as a Microsoft Exceldocument, by copying the value from the spreadsheet into the Variable Table.Besides Excel, you can use any other spreadsheet software that can link orembed objects.
• Drive a dimension with a value from a spreadsheet, such as a Microsoft Exceldocument, by copying the value from the spreadsheet into the Variable Table.Besides Excel, you can use any other spreadsheet software that can link orembed objects.
Accessing the Variable TableOnce you select the Variables command on the Tools menu, a table appears withthe following columns: Type, Name, Value, and Formula. Each row of the tabledisplays a variable.

Working with Measurements, Dimensions, and Variables Chapter 12
193
Entering Data into the Variable TableWhen you open the Variable Table in the document, all the dimensional values forthe dimensions on the drawing sheet appear in the columns. The name that appearsin the Name column is automatically generated by the software. You can changethe name to something more logical if you want.
Restricting the Display of VariablesYou can restrict the display of variables in the table with the Filter button on theVariable Table window:
• You can display only the variables for dimensions that the software created.
• You can also display variables that are associated with elements in the currentdocument or the active window
• You can also display a set of elements that you have selected in the document.
Creating ExpressionsThe system provides a set of standard mathematical functions. The functions canbe typed in with the proper syntax or you can use the Function Wizard to select anddefine the function. The Function Wizard is convenient when you forget the propersyntax for a math function. You start the Function Wizard by clicking the Fx buttonin the Variable Table. The function is written in the Formula column of the selectedrow.
ExamplesSuppose you draw a sheet metal bracket and you want to build a relationshipbetween the bend radius and stock thickness. You can use a formula in theVariable Table to build and manage this relationship. The following exampleillustrates how the Variable Table would look if you built a relationship thatchanges the bend radius when the stock thickness changes.
Type Name Value Formula
Variable Stock_thickness .25
Dimension Bend_radius .375 1.5 * stock_thickness
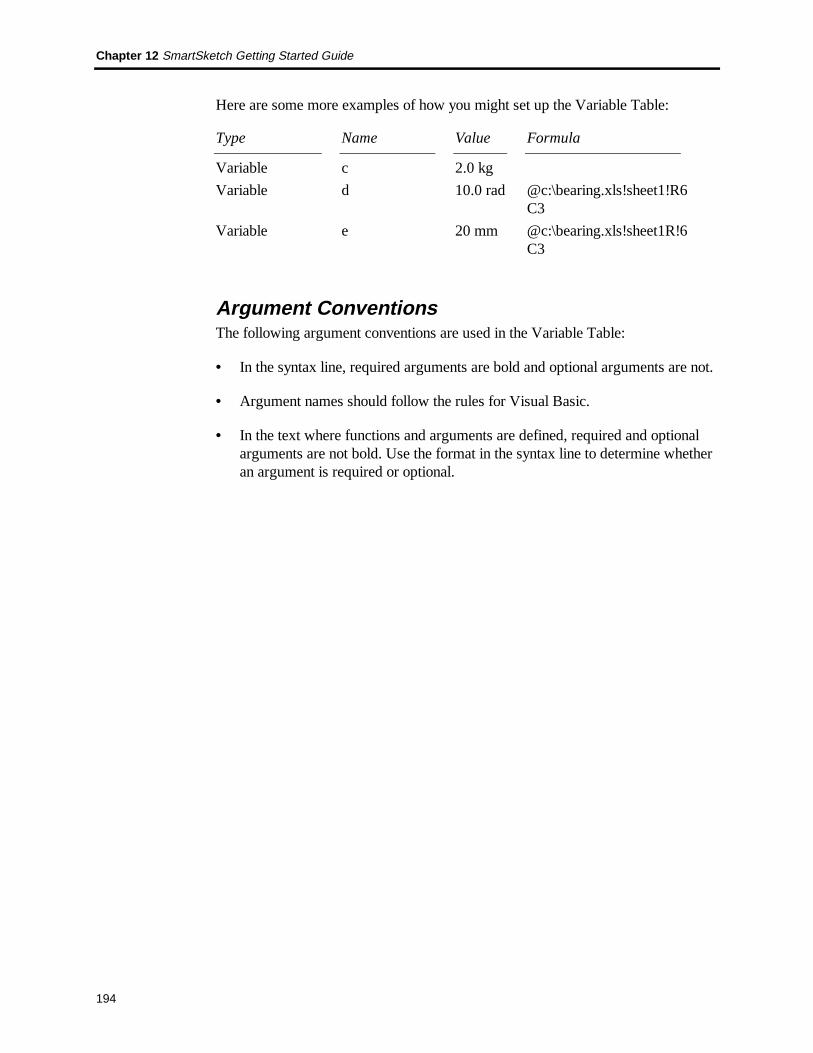
Chapter 12 SmartSketch Getting Started Guide
194
Here are some more examples of how you might set up the Variable Table:
Type Name Value Formula
Variable c 2.0 kg
Variable d 10.0 rad @c:\bearing.xls!sheet1!R6C3
Variable e 20 mm @c:\bearing.xls!sheet1R!6C3
Argument ConventionsThe following argument conventions are used in the Variable Table:
• In the syntax line, required arguments are bold and optional arguments are not.
• Argument names should follow the rules for Visual Basic.
• In the text where functions and arguments are defined, required and optionalarguments are not bold. Use the format in the syntax line to determine whetheran argument is required or optional.
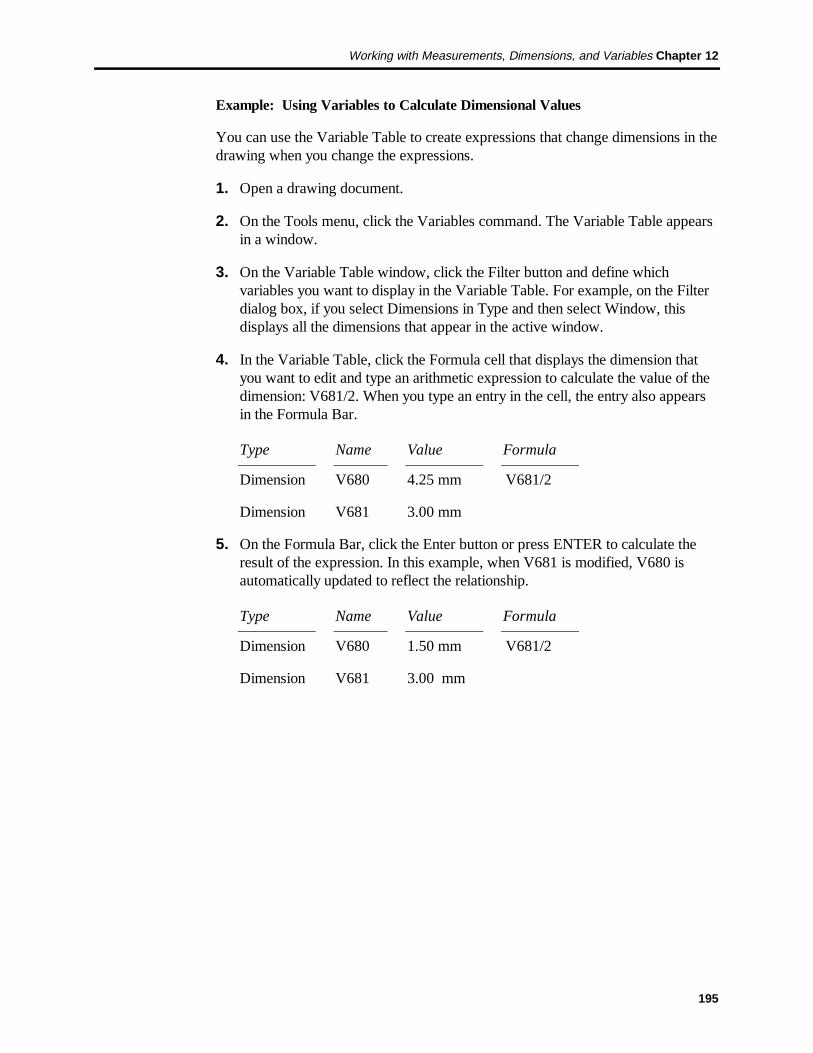
Working with Measurements, Dimensions, and Variables Chapter 12
195
Example: Using Variables to Calculate Dimensional Values
You can use the Variable Table to create expressions that change dimensions in thedrawing when you change the expressions.
1. Open a drawing document.
2. On the Tools menu, click the Variables command. The Variable Table appearsin a window.
3. On the Variable Table window, click the Filter button and define whichvariables you want to display in the Variable Table. For example, on the Filterdialog box, if you select Dimensions in Type and then select Window, thisdisplays all the dimensions that appear in the active window.
4. In the Variable Table, click the Formula cell that displays the dimension thatyou want to edit and type an arithmetic expression to calculate the value of thedimension: V681/2. When you type an entry in the cell, the entry also appearsin the Formula Bar.
Type Name Value Formula
Dimension V680 4.25 mm V681/2
Dimension V681 3.00 mm
5. On the Formula Bar, click the Enter button or press ENTER to calculate theresult of the expression. In this example, when V681 is modified, V680 isautomatically updated to reflect the relationship.
Type Name Value Formula
Dimension V680 1.50 mm V681/2
Dimension V681 3.00 mm

Chapter 12 SmartSketch Getting Started Guide
196
Paper and Model UnitsEach document has both paper and model units. Paper units represent units on anactual sheet of paper. Model units indicate real-world distances and can fit a sheetof paper.
The paper units manage the printable size of dimensions, annotations, and styles.The paper units always appear at a 1:1 scale. The model units represent thescaleable geometry in its real-world size. Both paper and model unit elements aredisplayed at the same time.
Because the drawing sheet dimensions, annotations, and styles use paper units bydefault, scaling issues can arise as you set the sheet scale for the model unitgeometry.
Dimension text and annotations do not scale when you use the Scale command onthe Change toolbar; the scale of dimension text and annotations is based on thesheet size that you select with the Sheet Setup command on the File menu.
Tip If you insert an .IGR or .SYM document into the drawing sheet with theObject command, the terminators, spaces, text, and styles appear in paper unitsrelative to the source document. The dimension lines and extension lines scale asthough they are in real-world units. This behavior can cause the dimensions andtext to appear very large or small in the container document.
You can set or change the size for dimension text and annotations by clicking theStyle command on the Format menu. On the Style dialog box, you select the typeof style you want to set or modify (dimension or text), and then click the New orModify button to set the font size for dimension text or a text box. Changing thefont size of dimension-text style or a text-box style changes only the dimension textor annotations with the modified style applied to them.
You can also set the font size for individual dimension text or annotations byoverriding the style that you applied. You do this by selecting the dimension or textbox and editing its properties with the Properties command on the shortcut menu orfrom the Edit menu.
You can adjust how the model units fit within the printable sheet area by clickingthe Sheet Setup command on the File menu. On the Size and Scale tab, you canselect a scale setting by clicking an item on the Select Scale dropdown list. Thevalue that you select causes the model to resize within the printable area, butneither the paper unit information (dimensions and annotations) or model unitinformation is scaled.
Working with Measurements, Dimensions, and Variables Chapter 12
197
Procedures to Explore in On-line Help• Place a Linear, Angular, or Radial Dimension
• Place a Dimension Group
• Place a Symmetric Diameter Dimension
• Place a Driving Dimension
• Change a Driven Dimension to a Driving Dimension
• Move a Dimension
• Set the Dimension Units
• Format a Dimension or Annotation
• Measure an Area
• Measure a Distance
• Set Bearing and Azimuth
• Create a Variable with a Value or Expression
• Create a Variable with a Link to a Spreadsheet
• Create a Variable Using a Function or Subroutine

Chapter 12 SmartSketch Getting Started Guide
198
Related Documents