Smart Rate Design Authors Jim Lazar and Wilson Gonzalez For a Smart Future July 2015

Welcome message from author
This document is posted to help you gain knowledge. Please leave a comment to let me know what you think about it! Share it to your friends and learn new things together.
Transcript
Smart Rate Design
Authors
Jim Lazar and Wilson Gonzalez
For a Smart Future
July 2015

Electronic copies of this paper and other RAP publications can be found on our website at www.raponline.org.
To be added to our distribution list, please send relevant contact information to
July 2015
AcknowledgmentsThis document was authored by RAP Senior Advisor Jim Lazar and Wilson Gonzalez of Tree House Energy and Economic Consulting, with input from RAP Principal Janine Migden-Ostrander, who acted as project lead. The report was produced with support from the Heising-Simons Foundation. During the first phase of this project, RAP conducted a series of interviews over several months with state commissioners, utility and tech-provider representatives, consumer advocates, and other experts to help frame our understanding of and approach to current rate design issues. Several of the people interviewed also provided useful peer review comments on the draft report. Internal review and project guidance was provided by Richard Sedano, Rick Weston, Donna Brutkoski, Brenda Hausauer, Camille Kadoch, and Becky Wigg.
How to Cite This PaperLazar, J. and Gonzalez, W. (2015). Smart Rate Design for a Smart Future. Montpelier, VT: Regulatory Assistance Project.
Available at: http://www.raponline.org/document/download/id/7680

Smart Rate Design for a Smart Future
1
List of Figures . . . . . . . . . . . . . . . . . . . . . . . . . . . . . . . . . . . . . . . . . . . . . . . . . . . . . . . . . . . . . . . .3List of Tables . . . . . . . . . . . . . . . . . . . . . . . . . . . . . . . . . . . . . . . . . . . . . . . . . . . . . . . . . . . . . . . .3Acronyms . . . . . . . . . . . . . . . . . . . . . . . . . . . . . . . . . . . . . . . . . . . . . . . . . . . . . . . . . . . . . . . . . . .4
Executive Summary . . . . . . . . . . . . . . . . . . . . . . . . . . . . . . . . . . . . . . . . . . . . . . . . . . . . . . . . . .5
I. Introduction . . . . . . . . . . . . . . . . . . . . . . . . . . . . . . . . . . . . . . . . . . . . . . . . . . . . . . . . . . . . .22 Basics of Rate Design . . . . . . . . . . . . . . . . . . . . . . . . . . . . . . . . . . . . . . . . . . . . . . . . . . . . . . .22 Core Rate Design Principles . . . . . . . . . . . . . . . . . . . . . . . . . . . . . . . . . . . . . . . . . . . . . . . . . .23
II. Current and Coming Challenges in Utility Rate Design . . . . . . . . . . . . . . . . . . . . . . . . .25 Customer-Sited Generation . . . . . . . . . . . . . . . . . . . . . . . . . . . . . . . . . . . . . . . . . . . . . . . . . .25 Electric Vehicles . . . . . . . . . . . . . . . . . . . . . . . . . . . . . . . . . . . . . . . . . . . . . . . . . . . . . . . . . . .27 Microgrids . . . . . . . . . . . . . . . . . . . . . . . . . . . . . . . . . . . . . . . . . . . . . . . . . . . . . . . . . . . . . . .27 Definition . . . . . . . . . . . . . . . . . . . . . . . . . . . . . . . . . . . . . . . . . . . . . . . . . . . . . . . . . . . .27 Residential Microgrid . . . . . . . . . . . . . . . . . . . . . . . . . . . . . . . . . . . . . . . . . . . . . . . . . . .27 Microgrids with Community Resources . . . . . . . . . . . . . . . . . . . . . . . . . . . . . . . . . . . . .28 Storage . . . . . . . . . . . . . . . . . . . . . . . . . . . . . . . . . . . . . . . . . . . . . . . . . . . . . . . . . . . . . . . . . .29 Distributed Ancillary Services . . . . . . . . . . . . . . . . . . . . . . . . . . . . . . . . . . . . . . . . . . . . . . . .31
III. Rate Design to Enable “Smart” Technology . . . . . . . . . . . . . . . . . . . . . . . . . . . . . . . . . .32 Survey of Technology . . . . . . . . . . . . . . . . . . . . . . . . . . . . . . . . . . . . . . . . . . . . . . . . . . . . . . .32 Smart Meters. . . . . . . . . . . . . . . . . . . . . . . . . . . . . . . . . . . . . . . . . . . . . . . . . . . . . . . . . .32 Smart Homes and Buildings . . . . . . . . . . . . . . . . . . . . . . . . . . . . . . . . . . . . . . . . . . . . . .34 Smart Appliances . . . . . . . . . . . . . . . . . . . . . . . . . . . . . . . . . . . . . . . . . . . . . . . . . . . . . .34 SCADA and Meter Data Management Systems . . . . . . . . . . . . . . . . . . . . . . . . . . . . . . . .34 Dynamic Integrated Distribution Systems: Putting All the Pieces Together . . . . . . . . . . . . . . .35
IV. Rate Design Principles and Solutions . . . . . . . . . . . . . . . . . . . . . . . . . . . . . . . . . . . . . . .36 Traditional Principles . . . . . . . . . . . . . . . . . . . . . . . . . . . . . . . . . . . . . . . . . . . . . . . . . . . . . . .36 Customer Costs . . . . . . . . . . . . . . . . . . . . . . . . . . . . . . . . . . . . . . . . . . . . . . . . . . . . . . .36 Distribution Costs . . . . . . . . . . . . . . . . . . . . . . . . . . . . . . . . . . . . . . . . . . . . . . . . . . . . . .37 Flat Rates . . . . . . . . . . . . . . . . . . . . . . . . . . . . . . . . . . . . . . . . . . . . . . . . . . . . . . . . . . . .37 Demand Charges . . . . . . . . . . . . . . . . . . . . . . . . . . . . . . . . . . . . . . . . . . . . . . . . . . . . . .37 Power Supply Costs . . . . . . . . . . . . . . . . . . . . . . . . . . . . . . . . . . . . . . . . . . . . . . . . . . . .38
Table of Contents
Smart Rate Design for a Smart Future

Smart Rate Design for a Smart Future
2
Principles for Rate Design in the Wake of Change . . . . . . . . . . . . . . . . . . . . . . . . . . . . . . . . .38 Stakeholder Interests . . . . . . . . . . . . . . . . . . . . . . . . . . . . . . . . . . . . . . . . . . . . . . . . . . . .38 Resource Value Characteristics . . . . . . . . . . . . . . . . . . . . . . . . . . . . . . . . . . . . . . . . . . . .41 Principles Specific to Customer-Sited Solar Rate Design . . . . . . . . . . . . . . . . . . . . . . . . .42 Current and Emerging Rate Design Proposals . . . . . . . . . . . . . . . . . . . . . . . . . . . . . . . . .44 Traditional Rate Designs . . . . . . . . . . . . . . . . . . . . . . . . . . . . . . . . . . . . . . . . . . . . . . . . . . . . .44 Time-Differentiated Pricing . . . . . . . . . . . . . . . . . . . . . . . . . . . . . . . . . . . . . . . . . . . . . . .44 Feed-In Tariffs and Value of Solar Tariffs . . . . . . . . . . . . . . . . . . . . . . . . . . . . . . . . . . . . .45 Utility-Defensive Rate Design Proposals . . . . . . . . . . . . . . . . . . . . . . . . . . . . . . . . . . . . .47 Best-Practice Rate Design Solutions . . . . . . . . . . . . . . . . . . . . . . . . . . . . . . . . . . . . . . . . . . . .49 Overview: Rate Design That Meets the Needs of Utilities and Consumers . . . . . . . . . . . .49 General Rate Design Structure . . . . . . . . . . . . . . . . . . . . . . . . . . . . . . . . . . . . . . . . . . . .51 Time-Sensitive Pricing: A General Purpose Tool . . . . . . . . . . . . . . . . . . . . . . . . . . . . . . .53
V. Rate Design for Specific Applications . . . . . . . . . . . . . . . . . . . . . . . . . . . . . . . . . . . . . . . .56 Rate Design That Enables Smart Technologies . . . . . . . . . . . . . . . . . . . . . . . . . . . . . . . . . . . .56 Apportionment and Recovery of Smart Grid Costs . . . . . . . . . . . . . . . . . . . . . . . . . . . . .56 Smart Rates for Smart Technologies . . . . . . . . . . . . . . . . . . . . . . . . . . . . . . . . . . . . . . . .58 Looking Ahead: Smart Houses, Smart Appliances, and Smart Pricing . . . . . . . . . . . . . . .59 Rate Design for Customers with Distributed Energy Resources (DER) . . . . . . . . . . . . . . . . . .61 DER Compensation Framework . . . . . . . . . . . . . . . . . . . . . . . . . . . . . . . . . . . . . . . . . . .62 Recovery Strategies for DG Grid Adaptation Costs . . . . . . . . . . . . . . . . . . . . . . . . . . . . .63 Rate Design for Electric Vehicles . . . . . . . . . . . . . . . . . . . . . . . . . . . . . . . . . . . . . . . . . . . . . . .66 EV Pricing without AMI . . . . . . . . . . . . . . . . . . . . . . . . . . . . . . . . . . . . . . . . . . . . . . . . .66 EVs with AMI . . . . . . . . . . . . . . . . . . . . . . . . . . . . . . . . . . . . . . . . . . . . . . . . . . . . . . . . .66 Public Charging Stations and Time-Differentiated Pricing . . . . . . . . . . . . . . . . . . . . . . . .67 Vehicle to Grid and Full System Integration of EV (Maryland/PJM RTO Pilot) . . . . . . . .67 Green Pricing . . . . . . . . . . . . . . . . . . . . . . . . . . . . . . . . . . . . . . . . . . . . . . . . . . . . . . . . . . . . .68 Customer-Provided Ancillary Services . . . . . . . . . . . . . . . . . . . . . . . . . . . . . . . . . . . . . . . . . .68
VI. Other Issues in Rate Design . . . . . . . . . . . . . . . . . . . . . . . . . . . . . . . . . . . . . . . . . . . . . . .70 Alternative Futures: Smart and Not-So-Smart . . . . . . . . . . . . . . . . . . . . . . . . . . . . . . . . . . . . .70 Addressing Revenue Erosion . . . . . . . . . . . . . . . . . . . . . . . . . . . . . . . . . . . . . . . . . . . . . . . . .71 Cost of Capital: A “Let the Capital Markets Do It” Approach . . . . . . . . . . . . . . . . . . . . . .72 Incentive Regulation: An “Incentivize Management” Approach . . . . . . . . . . . . . . . . . . . .72 Revenue Regulation and Decoupling: A “Passive Auto-Pilot” Approach . . . . . . . . . . . . . .72 Bill Simplification . . . . . . . . . . . . . . . . . . . . . . . . . . . . . . . . . . . . . . . . . . . . . . . . . . . . . . . . . .73 Customer Revenue Responsibilities . . . . . . . . . . . . . . . . . . . . . . . . . . . . . . . . . . . . . . . . . . . .74 Changes in Customer Characteristics and Class Assignments . . . . . . . . . . . . . . . . . . . . .75
VII. Conclusions . . . . . . . . . . . . . . . . . . . . . . . . . . . . . . . . . . . . . . . . . . . . . . . . . . . . . . . . . . .76
Guide to Appendices . . . . . . . . . . . . . . . . . . . . . . . . . . . . . . . . . . . . . . . . . . . . . . . . . . . . . . . .78 Appendix A: Dividing the Pie: Cost Allocation, the First Step in the Rate Design Process . . . .78 Appendix B: Rate Design for Vertically Integrated Utilities: A Brief Overview . . . . . . . . . . . . .78 Appendix C: Restructured States, Retail Competition, and Market-Based Generation Rates . . . .79 Appendix D: Issues Involving Straight Fixed Variable Rate Design . . . . . . . . . . . . . . . . . . . . .79
Glossary . . . . . . . . . . . . . . . . . . . . . . . . . . . . . . . . . . . . . . . . . . . . . . . . . . . . . . . . . . . . . . . . . .80

Smart Rate Design for a Smart Future
3
List of Figures
Figure 1: Oahu PV Installations as Percent of Minimum Daytime Load . . . . . . . . . . . . . . . . . . . . . . . . . . . 26Figure 2: Residential Microgrid Example . . . . . . . . . . . . . . . . . . . . . . . . . . . . . . . . . . . . . . . . . . . . . . . . . . 28Figure 3: Microgrid with Community Resources . . . . . . . . . . . . . . . . . . . . . . . . . . . . . . . . . . . . . . . . . . . . 28Figure 4: Bidirectional Flows Measured by a Smart Meter . . . . . . . . . . . . . . . . . . . . . . . . . . . . . . . . . . . . . 34Figure 5: Benefits of Energy Efficiency, Separated By Type of Benefit . . . . . . . . . . . . . . . . . . . . . . . . . . . . . 42Figure 6: Austin Energy Residential Rate Block and VOST (2015) . . . . . . . . . . . . . . . . . . . . . . . . . . . . . . . 46Figure 7: US Electricity Sales, 1985-2014 . . . . . . . . . . . . . . . . . . . . . . . . . . . . . . . . . . . . . . . . . . . . . . . . . 48Figure 8: Annual kWh Use Per Household By Income Strata . . . . . . . . . . . . . . . . . . . . . . . . . . . . . . . . . . . 48Figure 9: Rate Design Options by Customer Class . . . . . . . . . . . . . . . . . . . . . . . . . . . . . . . . . . . . . . . . . . . 50Figure 10: Usage Levels and Customer Coincident and Non-Coincident Peak Demand . . . . . . . . . . . . . . 51Figure 11: Conceptual Representation of the Risk-Reward Tradeoff in Time-Varying Rates . . . . . . . . . . . . 57Figure 12: Comparison of Results from Smart Rate Pilots . . . . . . . . . . . . . . . . . . . . . . . . . . . . . . . . . . . . . 59Figure 13: Impact of Enabling Technologies on Customer Price Response . . . . . . . . . . . . . . . . . . . . . . . . . 60Figure 14: Smart Home of the Future . . . . . . . . . . . . . . . . . . . . . . . . . . . . . . . . . . . . . . . . . . . . . . . . . . . . 60Figure 15: Comparison of Results with and without Technology Enhancement . . . . . . . . . . . . . . . . . . . . 61Figure 16: Electricity Usage and Household Income . . . . . . . . . . . . . . . . . . . . . . . . . . . . . . . . . . . . . . . . . 71
List of Tables
Table 1: Functional Attributes of Storage . . . . . . . . . . . . . . . . . . . . . . . . . . . . . . . . . . . . . . . . . . . . . . . . . . 29Table 2: Typical Commercial Rate with a Demand Charge . . . . . . . . . . . . . . . . . . . . . . . . . . . . . . . . . . . . . 37Table 3: CPP and PTR Rate Illustrations . . . . . . . . . . . . . . . . . . . . . . . . . . . . . . . . . . . . . . . . . . . . . . . . . . 45Table 4: Feed-In-Tariff for Gainesville, Florida . . . . . . . . . . . . . . . . . . . . . . . . . . . . . . . . . . . . . . . . . . . . . . 46Table 5: Illustrative Residential Rate Design . . . . . . . . . . . . . . . . . . . . . . . . . . . . . . . . . . . . . . . . . . . . . . . . 50Table 6: Cost Recovery in a TOU Rate Design . . . . . . . . . . . . . . . . . . . . . . . . . . . . . . . . . . . . . . . . . . . . . . 53Table 7: Illustrative Rates Reflecting Rate Design Principles . . . . . . . . . . . . . . . . . . . . . . . . . . . . . . . . . . . . 54Table 8: Common Elements of Utility Operating Benefits of Smart Meters . . . . . . . . . . . . . . . . . . . . . . . . . 56Table 9: Cost Classification Appropriate for Smart Meter and MDMS Costs . . . . . . . . . . . . . . . . . . . . . . . . 57Table 10: LADWP Standard Residential Rate and Electric Vehicle Rate, March 2015 . . . . . . . . . . . . . . . . . 66Table 11: Customer Adjustments . . . . . . . . . . . . . . . . . . . . . . . . . . . . . . . . . . . . . . . . . . . . . . . . . . . . . . . . 74
Smart Rate Design for a Smart Future
4
AMI Advanced metering infrastructure
CP Coincident peak
CPP Critical peak pricing
CRES Competitive retail electric service
DER Distributed energy resources
DG Distributed generation
DR Demand response
EV Electric vehicle
FIT Feed-in tariff
IDGP Integrated distribution grid planning
IRP Integrated resource planning
kW Kilowatt
kWh Kilowatt-hour
LADWP Los Angeles Department of Water and Power
LMP Locational marginal pricing
MDMS Meter data management system
NCP Non-coincident peak
NEISO New England Independent System Operator
Acronyms
NEM Net energy metering
O&M Operations and maintenance
PBR Performance-based regulation
PTR Peak-time rebate
PURPA Public Utilities Regulatory Policies Act
PV Photovoltaic
REC Renewable energy certificate
RPS Renewable portfolio standards
RTP Real-time pricing
SCADA Supervisory control and data acquisition
SFV Straight fixed/variable
SMUD Sacramento Municipal Utility District
SSO Standard service offer
T&D Transmission and distribution
TOU Time-of-use
VAR Volt-ampere reactive
VOST Value of solar tariff

Smart Rate Design for a Smart Future
5
Executive Summary
Introduction
For most of its history, the electric utility industry saw little change in the economic and physical operating characteristics of
the electric system. Though the system provided reliable and low-cost service, little in terms of system status or customer use was known in real or near real time. For an industry in the information age, parts of the electric system can be considered rather “unenlightened.”
Current advancements in technology will have marked impact on current and future rate designs. First, end-users (i.e., customers) are installing their own generation, mostly in the form of photovoltaic (PV) systems, and are connecting different types of end-use appliances with increasing “intelligence” built in; electric vehicles (EVs), too, are poised to grow rapidly as a whole new class of end-use, just as storage systems are poised to become economic. Second, utilities are deploying advanced metering and associated data systems, sometimes referred to as advanced metering infrastructure (AMI) or smart meters, and more sophisticated supervisory control and data acquisition (SCADA) systems to monitor system operations. To realize the full potential of these new systems and end-uses, regulators, utilities, third-party service providers, and customers will need to utilize more advanced rate designs than they have in the past.
Rate design is the regulatory term used to describe the pricing structure reflected in customer bills and used by electric utilities in the United States. Rate design is not only
the itemized prices set forth in tariffs; it is also the underlying theory and process used to derive those prices. Rate design is important because the structure of prices — that is, the form and periodicity of prices for the various services offered by a regulated company — has a profound impact on the choices made by customers, utilities, and other electric market participants. The structure of rate designs and the prices set by these designs can either encourage or discourage usage at certain times of the day, for example, which in turn affects resource development and utilization choices. It can also affect
the amount of electricity customers consume and their attention to conservation. These choices then have indirect consequences in terms of total costs and benefits to society, environmental and health impacts, and the overall economy.1
Despite its critical importance, rate design is poorly un-derstood by the general public and often lacks transparency. The difference between a progressive and regressive design can have a large effect — 15 percent by one estimate, but it could be more — on customer usage.2 Traditional rate designs, which charge a single rate per unit of consumption (or worse, lower that rate as consumption increases) may not serve consumers or society best. As advancements in tech-nology and customer preferences evolve, the industry must adapt to change or risk the fate of landline telephone com-panies, which have lost 60 percent of their access lines since the advent of telecommunications competition.3
Rate design relies in strong measure upon the judicious application of certain economic guidelines. The following
1 Weston, F. (2000). Charging for Distribution Utility Services: Issues in Rate Design. Montpelier, VT: The Regulatory Assistance Project. Available at: http://www.raponline.org/document/download/id/412
2 Lazar, J. (2013). Rate Design Where Advanced Metering Infrastructure Has Not Been Fully Deployed. Montpelier, VT: The Regulatory Assistance Project. Available at: http://www.
raponline.org/document/download/id/6516. Appendix A provides a calculation of how rate design can influence consumption.
3 Federal Communications Commission (2014, October). Local Telephone Competition Report, available at: https://www.fcc.gov/encyclopedia/local-telephone-competition-reports
Rate design is important because the structure of prices — that is, the
form and periodicity of prices for the various services offered by a
regulated company — has a profound impact on the choices made by customers, utilities, and
other electric market participants.
Smart Rate Design for a Smart Future
6
elements of economically efficient rate design that are necessary to address current and coming challenges in the electric industry are based on those laid out in James Bonbright’s 1961 Principles of Public Utility Rates, and in Garfield and Lovejoy’s 1964 Public Utility Economics. These principles require that rates should:
• Be forward-looking and reflect long-run marginal costs;
• Focus on the usage components of service, which are the most cost- and price-sensitive;
• Be simple and understandable; • Recover system costs in proportion to how much
electricity consumers use, and when they use it; • Give consumers appropriate information and the
opportunity to respond by adjusting usage; and• Where possible, be temporally and geographically
dynamic.4
Rates can be designed to meet (or, in the case of poor rate design, frustrate) public policy objectives to use electricity more efficiently, meet environmental goals, and minimize adverse social impacts, including public health, among others. They are also pivotal in providing utilities the opportunity to recover their authorized revenue requirement. Revenue adequacy is a core objective of rate design, but the more constructive design ideal for rates is forward-looking, so that future investment decisions by the utility and by customers can be harmonized.
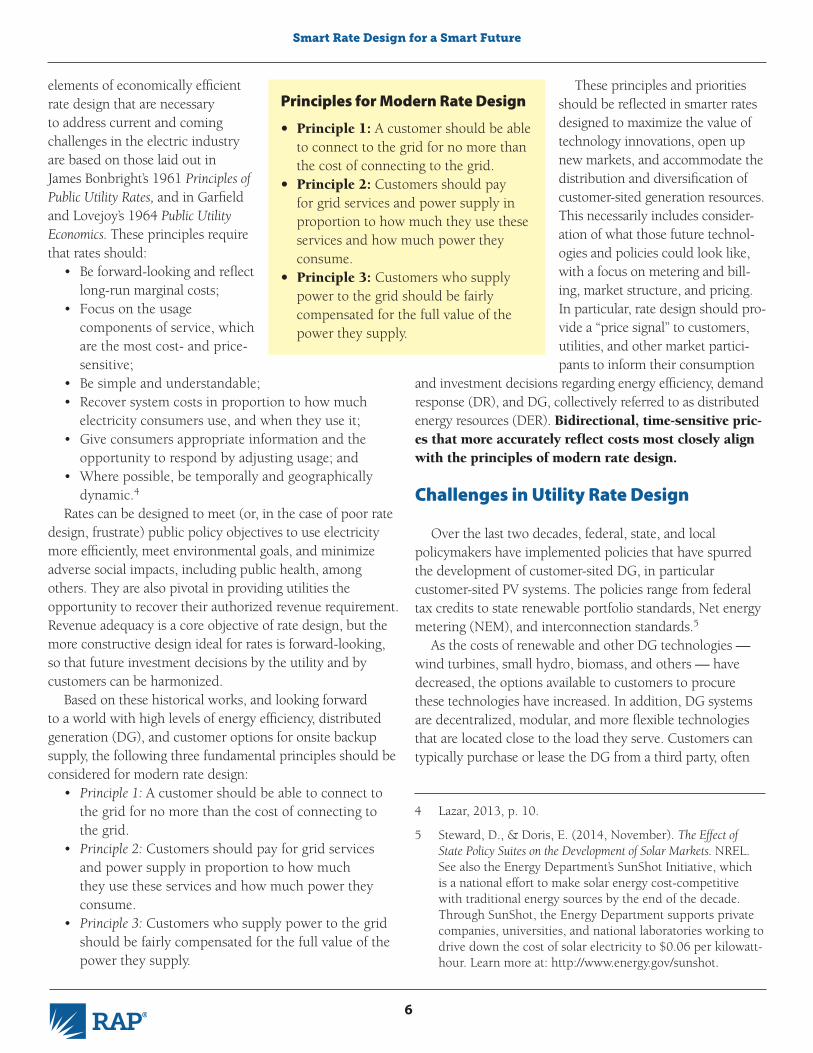
Based on these historical works, and looking forward to a world with high levels of energy efficiency, distributed generation (DG), and customer options for onsite backup supply, the following three fundamental principles should be considered for modern rate design:
• Principle 1: A customer should be able to connect to the grid for no more than the cost of connecting to the grid.
• Principle 2: Customers should pay for grid services and power supply in proportion to how much they use these services and how much power they consume.
• Principle 3: Customers who supply power to the grid should be fairly compensated for the full value of the power they supply.
These principles and priorities should be reflected in smarter rates designed to maximize the value of technology innovations, open up new markets, and accommodate the distribution and diversification of customer-sited generation resources. This necessarily includes consider-ation of what those future technol-ogies and policies could look like, with a focus on metering and bill-ing, market structure, and pricing. In particular, rate design should pro-vide a “price signal” to customers, utilities, and other market partici-pants to inform their consumption
and investment decisions regarding energy efficiency, demand response (DR), and DG, collectively referred to as distributed energy resources (DER). Bidirectional, time-sensitive pric-es that more accurately reflect costs most closely align with the principles of modern rate design.
Challenges in Utility Rate Design
Over the last two decades, federal, state, and local policymakers have implemented policies that have spurred the development of customer-sited DG, in particular customer-sited PV systems. The policies range from federal tax credits to state renewable portfolio standards, Net energy metering (NEM), and interconnection standards.5
As the costs of renewable and other DG technologies — wind turbines, small hydro, biomass, and others — have decreased, the options available to customers to procure these technologies have increased. In addition, DG systems are decentralized, modular, and more flexible technologies that are located close to the load they serve. Customers can typically purchase or lease the DG from a third party, often
4 Lazar, 2013, p. 10.
5 Steward, D., & Doris, E. (2014, November). The Effect of State Policy Suites on the Development of Solar Markets. NREL. See also the Energy Department’s SunShot Initiative, which is a national effort to make solar energy cost-competitive with traditional energy sources by the end of the decade. Through SunShot, the Energy Department supports private companies, universities, and national laboratories working to drive down the cost of solar electricity to $0.06 per kilowatt-hour. Learn more at: http://www.energy.gov/sunshot.
Principles for Modern Rate Design
• Principle 1: A customer should be able to connect to the grid for no more than the cost of connecting to the grid.
• Principle 2: Customers should pay for grid services and power supply in proportion to how much they use these services and how much power they consume.
• Principle 3: Customers who supply power to the grid should be fairly compensated for the full value of the power they supply.

Smart Rate Design for a Smart Future
7
6 Hawaiian Electric Company, with 11-percent PV saturation, is just now beginning to invest in distribution system modifications to adapt to high levels of solar energy. See: Hawaiian Electric Company Distributed Generation Interconnection Plan. (2014).
7 MJ Bradley & Associates. (2013). Electric Vehicle Grid Integration in the US, Europe, and China. Montpelier, VT: The Regulatory Assistance Project. Available at: http://www.raponline.org/document/download/id/6645
8 “Storage” involves a series of acts: converting grid-interconnected electricity to another form of energy, holding that other form of energy for future use, and then either using it in the form stored (thermal or mechanical energy) or converting it back to grid-interconnected electricity at a
with seller or third-party financing. The increasing amounts of DG are impacting the delivery method of energy, and in the future may gradually shift from an exclusively centralized source of power, such as coal, nuclear, or natural gas-fired plants, to a mix of centralized and decentralized, smaller, and customer-centric sources of energy. Rate design must efficiently and fairly incorporate DG contributions to the grid, as well as fairly allocate the benefits and costs of their use for DG customers, non-DG customers, and for the grid.
At low levels of installation of distributed renewables (e.g., under five percent of customers), few if any physical modifications are required to electric distribution systems.6 The scenario changes once solar output exceeds total load on a given substation. This is being experienced in Hawaii, which has the highest PV penetration of any state and where more than ten percent of residential consumers have PV systems installed. Installation rates are more than twenty percent in many single-family residential neighborhoods. At this level of solar saturation, changes to distribution systems may be needed. Hawaii is serving as a laboratory as it adapts to a high-renewable environment, and this paper explores the various adaptations that this state and many other jurisdictions are exploring and implementing.
In addition to increasing penetrations of distributed renewables, other technologies that will increase in the near future will need to be considered by utilities and regulators as they navigate the changing electric system landscape. EVs are a small part of the electricity load currently, but growth in the sector is likely for many reasons — lower battery costs and emissions regulations that are pressuring the industry to find zero-emissions transportation solutions.7 Because of the presence of batteries in the vehicles and the ability to control the timing of when they are charged, EV loads can be very different from traditional loads. Encouraging behavior that
optimizes EVs’ use of the grid requires that rates be designed to provide an incentive for EV owners to charge their cars at the right time. This requires time-sensitive pricing, a topic this paper explores in detail.
Interfacing with microgrids will be another near-future challenge for utilities. These may range from an individual apartment building or office complex with onsite generation to a municipal electric utility connected to an adjacent larger utility. These will depend on utilities for some service, and compensation to utilities is important; however, microgrids will also provide services to utilities at times, so the compensation framework needs to be bidirectional.
Storage technologies such as Tesla’s new Powerwall battery could be a game changer if they can be distributed in communities, interconnected with a smart grid, and not be price-prohibitive.8 Currently, energy supply (generation) and loads (end-uses) must be instantaneously kept in balance, even as customers change their end-uses. But the presence of significant storage on the system would allow generators to generate when they can, while allowing the storage technology to provide additional energy or absorb additional energy as loads change.
The presence of generation, storage, and smart control technologies at customer premises offers the opportunity for customers to provide a number of valuable functions to the grid. These generally fall into a category termed “ancillary services” and include voltage regulation, power factor control, frequency control, and spinning reserves.9 Where system operators or third-party aggregators have the ability to control end-use loads, customer appliances can deliver DR during high cost periods or when the grid is at or near its operating capacity and may be at risk for system failures. Rate design can either enable these values to be garnered or erect barriers to them.
different time. The individual acts that comprise this series may be referenced as, respectively, “charging,” “holding,” and “discharging.” Pomper, D. (2011, June). Electric Storage: Technologies and Regulation. NRRI, p 3. To this should be added other forms of energy storage, such as water heater controls, water system reservoir management, and air conditioning thermal storage, which may provide lower cost means to shape loads to resources and resources to loads.
9 Spinning reserves refer to the availability of additional generating resources that can be called upon within a very short period of time. Different utilities and different utility markets use varying response time frames to define spinning reserve services, ranging from instantaneous to up to an hour or so.

Smart Rate Design for a Smart Future
8
10 These principles, on the basis of which James Bonbright and Alfred Kahn, among others, framed their analyses of regula-tion and the public good, are long embedded in regulatory law and practice throughout the United States. See, by way of example, the National Association of Regulatory Utility Commissioners’ Resolution Adopting ‘Principles to Guide the Restructuring of the Electric Industry’, adopted July 25, 1996, NARUC Bulletin No. 32-1996, p 10.
Rate Design in Theory and Practice
Balancing Stakeholder InterestsA variety of stakeholder interests are at play in the debate
over rate design, and finding common ground is not easy. Regulators face the task of fairly balancing concerns among utilities, consumers and their advocates, industry interests, unregulated power plant owners, and societal interests. The regulator accepting the charge of “regulating in the public interest” considers all of these values.
Reaffirming the Principles of Rate Design in the Wake of Change
Good rate design should work in concert with the indus-try’s clean technologic innovations and institutional changes. Accomplishing this requires the application of well-estab-lished principles to inform the design of rates that promote economic efficiency and equity.10 This will be critical in a future characterized by significant customer-side resource in-vestment and smart technology deployment. The advantages for a state that embraces these efficiency and equity goals are significant, especially in maintaining a state’s competitiveness and promoting customer choice and ingenuity.
Best practice rate design solutions should balance the goals of:
• Assuring recovery of utility prudently incurred costs;• Maintaining grid reliability;• Assuring fairness to all customer classes and sub-
classes; • Assisting the transition of the industry to a clean-
energy future;• Setting economically efficient prices that are forward-
looking and lead to the optimum allocation of utility and customer resources;
• Maximizing the value and effectiveness of new technologies as they become available and are deployed on, or alongside, the electric system; and
• Preventing anticompetitive or anti-innovation market structures or behavior.
Many rate design alternatives have been suggested; most recent studies emphasize the need for time-varying pricing and for some form of DR pricing.11 At the same time, stakeholders currently face a legacy system of non-time-of-use (TOU) rates that are either flat across all usage levels or are designed with increasing or decreasing prices for increasing amounts of consumption (“inclining block” and “declining block” rates, respectively). They may also include demand charges in addition to energy charges, although various types of TOU rates have been used.
Evaluating and Allocating Costs The design of rates begins with a functional evaluation
of the costs incurred by the utility to provide service to its customers — customer costs, distribution costs, and power supply and transmission costs. A critical step is the allocation of costs among different customer classes — residential, commercial, industrial, and others.12 These allocations, typically based on both marginal and embedded cost studies, inform regulatory determinations of revenue responsibilities among the customer classes.
Once the customer class revenue burdens are determined, prices must be set to generate those revenues, in light of expectations of demand for electricity. The general principle that the cost-causer should pay prices that cover the costs he or she causes might also suggest that the nature of the causation and the form of the price are critically related. And, indeed, price elements have traditionally been fashioned to reflect the nature of the cost to be recovered: costs that vary directly with energy usage are recovered in energy (kilowatt-hour [kWh]) charges, costs that are driven by peak demands (whether at the generation, transmission, or distribution level) are recovered in or time-varying kWh charges, and customer-specific costs unrelated to usage are recovered in customer charges. Of course, rate designs vary greatly across customer classes and utilities generally — demand charges,
11 See the bibliography for references to a number of current publications on rate design.
12 For a discussion of how costs are typically assigned to different rate classes, see: Lazar, J. (2011). Electricity Regulation in the US: A Guide. Montpelier, VT: The Regulatory Assistance Project. Available at: http://www.raponline.org/document/download/id/645, Section 9.4.

Smart Rate Design for a Smart Future
9
13 See, e.g.: Hledik, R. (2014). Rediscovering Residential Demand Charges. Electricity Journal, 27(7), August–September 2014, pp. 82–96.
for instance, are rarely imposed on low-usage customer classes — but the basic architecture is well established and ubiquitous. It has been possible only because the industry in question is a monopoly.
The logic of differentiated pricing based on the differing natures of the underlying costs — specifically, their energy, capacity, or customer-specific characteristics — can be taken only so far. All industries are characterized by some combination of variable and fixed (in the short run) costs. In competitive markets, those costs are covered (or not) by the sale of goods and services; and the prices of those goods and services represent the value of society’s resources that are being put to their production — or which are saved if those goods and services are not demanded. Economic efficiency — the greatest good for the lowest total cost in the long term — is served in this way. Monopoly services, simply because they are provided by monopolies, are not entitled to pricing structures that are not sustainable in competitive markets — that is, that are adverse to economic efficiency in the long run (within the constraints of other public policy objectives).
Basic Rate DesignsThe simplest form of rate design is the flat rate, which
is derived by simply dividing the revenue requirement for a given class of customers by the kilowatt-hour sales, and charging a purely volumetric price. A very important principle of rate design is to align the incremental price for incremental consumption with long-run incremental costs, including societal costs. Use of short-run costs, dispatch modeling, or a non-renewable resource as the basis for “incremental cost” is inappropriate and misleading to the consumer and society because it fails to recognize the real costs associated with plant investment and resource choices, many of which have long-term consequences on the order of half a century or more.
Customer charges are per-month fixed charges that apply to each customer in a tariff class, regardless of their usage. This paper addresses these in great detail, to focus attention on those charges that actually change with the number of customers. Although some utilities and regulators use customer charges to recover distribution system costs, this paper demonstrates that this is neither cost-based nor economically efficient. High customer charges impose unfair costs on small-use residential consumers, including most low-income household and apartment residents. The fixed charge for residential or commercial service should not exceed the customer-specific costs attributable to an incremental consumer.
Demand charges are commonly used to recover some costs of generation, transmission, and distribution of large commercial and industrial customers. Because traditional demand charges are measured on the basis of the individual customer’s peak, regardless of whether it coincides with the peaks on any portion of the system, this approach inevitably results in a mismatch between the costs incurred to serve the customer and the prices charged if the customer’s peak is non-coincident with the system peak. This means a customer is charged the same rate whether they use power in times of high demand (adding to system peak and utility costs) or low demand (when utility costs are correspondingly lower). Demand charges were implemented for commercial and industrial customers in an era during which sophisticated metering was prohibitively expensive. Today, with smart meters and AMI, these metering costs are trivial. Movement away from demand charges, toward more granular time-varying energy rates, is appropriate.
A few rate analysts have recommended that demand charges be extended from large commercial customers (where these are nearly universal) to small commercial and residential consumers.13 Some of these analysts suggest this is an appropriate way to ensure that solar customers contribute adequately to system capacity costs. This option is inapt for most situations for several reasons. The only distribution system component sized to individual customer demands is the final line transformer. The relatively small portion of cost of service represented by the line transformer required to serve solar customers amounts to only about $1/kW/month. In addition, the diversity of customer demand at any given time of the day, and the lack of understanding of the potentially complex concept, suggest against this option. Time-differentiated prices can more equitably recover costs that are actually peak-oriented from all customers, including solar customers. However, customer education is a crucial part of this transition.
Energy charges are per-kWh charges for electricity consumed. These can be arranged into inclining or declining block rates, into seasonal charges, and into time-varying charges. This paper finds that time-varying (and, eventually, as technology enables customers to respond, more dynamic) energy charges are the best way to reflect costs to consumers and to encourage efficient use of electricity.

Smart Rate Design for a Smart Future
10
Time-Varying RatesIt is hard to envision an electric system future without
greater use of time-differentiated pricing. Because the underlying costs of providing electricity vary hourly and seasonally, it is impossible for the customer to see to an appropriate price signal without that signal also varying over time. As smart technologies take hold, the connection between customer usage patterns and underlying costs will become apparent. As this happens, it is inevitable that time-differentiated pricing will become more widespread.
TOU rates have been in use for some time in the United States. These rates typically define a multihour time of the day as an “on-peak” period, during which prices are higher than during “off-peak” hours. In most cases, on-peak periods are limited to weekdays. TOU rates are an improvement over flat or inclining block rates because they offer some correlation between the temporally changing costs of providing energy and the customer’s actual consumption of energy. However, they are usually not dynamic in the sense of capturing the real underlying changes of costs from hour to hour, day to day, or season to season. Concentrating peak-related charges into as few hours as possible produces a better customer response.
Critical peak pricing (CPP) and peak-time rebate (PTR) are a variation on the TOU concept. Under CPP, prices during a limited number of specific “critical peak periods” are set at much higher prices. The customer is given some advance notice of critical peak days, usually a day in advance. CPP is designed to produce a response — to get customers to reduce loads during critical peak periods. The CPP has been largely successful. To date, CPP rates have been voluntary opt-in rate forms, but evidence supports
setting these as default rates for large groups of consumers. Under the PTR concept, rather than charging customers a high critical peak price, customers are given a large credit on their bills if they can reduce usage during a peak-time event. PTR is distinguishable from a CPP in that it is a voluntary program. Just as in the case of TOU, both CPP and PTR require the use of an interval meter or a smart meter.
Real-time pricing (RTP) charges the customer the actual prices being set in wholesale markets (for utilities that are not vertically integrated) or short-run marginal generation costs (for vertically integrated utilities) as they vary hour by hour. Prior to the introduction of smart technologies, only the largest customers would typically be on real-time rates. As newer smart technologies take hold, some form of RTP may expand to other customers who have smart appliances that can monitor prices automatically, respond accordingly, and monetize the benefits.
Rates to Compensate DGSeveral jurisdictions have adopted special pricing for
compensation of solar customers for the power supplied to the grid by these systems.
Originating in Europe, feed-in tariffs (FIT) pay a premium price for renewable energy, generally based on the cost of the resources, not the value of the output. The payments for solar were typically higher than for wind, and the payment for power from small systems was greater than for larger systems. FITs were generally designed to be an infant-industry incentive.
A value of solar tariff (VOST) is fundamentally different from a FIT, compensating the solar provider on the basis of the value provided, not the cost incurred. As studied by Austin, Texas, plus the states of Minnesota and
Table ES-1
Illustrative Residential Rate Design
Rate Element Based On the Cost Of Illustrative Rate
Customer Charge Service Drop, Billing, and Collection Only $4.00/month
Transformer Charge Final Line Transformer $1/kVA/month
Off-Peak Energy Baseload Resources + Transmission and Distribution $.07/kWh
Mid-Peak Energy Baseload + Intermediate Resources + T&D $.09/kWh
On-Peak Energy Baseload, Intermediate, and Peaking Resources + T&D $.14/kWh
Critical Peak Energy (or PTR) Demand Response Resources $.74/kWh

Smart Rate Design for a Smart Future
11
14 Tong, J., & Wellinghoff, J. (2015, February 13). Why Fixed Charges Are a False Fix to the Utility Industry’s Solar Challenges. Utility Dive.
15 Lazar, J. (2014, November). Electric Utility Residential Customer Charges and Minimum Bills: Alternative Approaches for Recovering Basic Distribution Costs. Montpelier, VT: The Regulatory Assistance Project. Available at: http://www.raponline.org/document/download/id/7361
Maine, a VOST will generally provide equal or greater compensation to the solar producer than simple NEM, reflecting the combined high value of the energy and non-energy benefits provided by solar.
Net energy metering (NEM) is an approach that measures the customer’s net usage from the grid, and charges that usage at the standard tariff price for electricity. In effect, NEM allows customers to exchange excess generation from their solar (or other onsite) generators at times they do not need it for power from generic grid resources (usually fossil fuels) at other times.
For utilities in which only a small percentage of consum-ers have installed solar systems, a simple NEM option will generally be easier to measure, more acceptable to consum-ers, simpler to administer, and will produce fewer signifi-cant impacts on grid-dependent customers. Another option is bidirectional pricing, especially where solar penetration is high. Bidirectional pricing, which would require a smart meter, would allow the customer to pay the retail rate for any power consumed and be compensated based on the full value of the energy delivered to the grid. Time-differentiated pricing for power flows in each direction may likewise be appropriate. The customer pays for power used on a TOU basis, and is credited (either the retail TOU rate or a different time- differentiated VOST) for power fed to the utility.
The three principles of modern rate design outlined earlier suggest some other considerations for solar customers:
• Only customer-specific costs should be applied to the bill for the privilege of connecting to the grid and accessing grid services.
• The cost for use of the distribution grid should be charged in relation to customer purchases of energy.
• Time-varying rates are appropriate in both directions of the transaction in which a customer is consuming and selling energy to the grid.
• Some skeptics have portrayed PV as unfairly shifting costs to other customers or of using the distribution system in some way without paying for it. This is a misapplication of rate design and cost recovery principles and practice which have never charged generators for use of the distribution system, as well as accepted cost allocation methods, which are themselves dynamic in nature.
• DG customers should be free from discrimination. Any cost imposed on a DG customer should be based on a real cost to the utility system resulting
from the DG, or net of cost savings resulting from the DG. In the absence of a VOST or other data, NEM is appropriate as a proxy where PV saturation is relatively low. It is unlikely that this will overcompensate DG customers, and likely that it will still send sufficient price signals to the customer to make economic choices about whether to install DG. Where PV saturation is low, the impact on the utility system and revenues would also be quite low.
The success of DG has, unfortunately, prompted the proposal and implementation of rate designs in some states that harm existing DG customers and present a formidable barrier for customers contemplating investments in DG resources.14
Rate Designs That Discourage DGA minimum bill charges the customer a minimum
fixed charge, which entitles the customer to a minimum amount of energy. For example, a residential minimum bill might charge $20 as a minimum charge, which entitles the customer to receive their first 100 kWh energy included in the price. A flat or inclining block rate structure would then be applied for additional usage. Minimum bills are not typically considered good rate design; they have the effect of reducing the value of energy efficiency, conservation, and customer-sited DG, to the extent those efforts would otherwise reduce consumption below the minimum threshold. The key is to set the minimum bill at a level that guarantees the utility a certain level of revenue it can count on, while not penalizing the vast majority of customers.15
Even less desirable is straight fixed/variable (SFV) design. Utilities in some parts of the United States are seeking to sharply increase monthly fixed charges, with offsetting reductions to the per-unit price for electricity. This approach deviates from long-established rate design principles holding that only customer-specific costs — those that actually change with the number of customers served — properly belong in fixed monthly fees. It also deviates from accepted economic theory of pricing on

Smart Rate Design for a Smart Future
12
Dynamic
time-of-use
rates
Economic
efficiency,
resource
conservation,
and
affordability
Smart
deployment
of technology
Sound cost
allocation
Customers have good choices
Bidirectional
pricing
Fair shake for distributed generation
SLOW
The PrinciplesA customer should be
able to connect to the
grid for no more than
the cost of connecting
to the grid.
Customers that supply
power to the grid should
be fairly compensated
for the full value of the
power they supply.
Customers should pay
for grid services and
power supply in
proportion to how much
they use these services,
and how much power
they consume.
1 2
3Ill-Advised ShortcutFailing to apply the principles for
modern rate design may lead to higher
usage and higher bills for customers.
Straight-fixed-variable rate designs with
large fixed customer charges discriminate
against low-usage customers and those with
distributed generation, potentially leading
customers to abandon the grid entirely.
Utilities face unprecedented changes in the way power is generated and delivered.
With the ramp-up in distributed generation, energy efficiency and demand response,
electric vehicles, smart appliances, and more, the industry must rethink its rate
structures to accommodate and encourage these innovations. Progressive
rate design can make the difference in cost-effectively meeting public
policy objectives—to use electricity more efficiently, meet
environmental goals, and minimize adverse social impacts—
while ensuring adequate revenue for utilities.
Rate Design Roadmap forthe 21st Century Utility

Smart Rate Design for a Smart Future
13
Dynamic
time-of-use
rates
Economic
efficiency,
resource
conservation,
and
affordability
Smart
deployment
of technology
Sound cost
allocation
Customers have good choices
Bidirectional
pricing
Fair shake for distributed generation
SLOW
The PrinciplesA customer should be
able to connect to the
grid for no more than
the cost of connecting
to the grid.
Customers that supply
power to the grid should
be fairly compensated
for the full value of the
power they supply.
Customers should pay
for grid services and
power supply in
proportion to how much
they use these services,
and how much power
they consume.
1 2
3Ill-Advised ShortcutFailing to apply the principles for
modern rate design may lead to higher
usage and higher bills for customers.
Straight-fixed-variable rate designs with
large fixed customer charges discriminate
against low-usage customers and those with
distributed generation, potentially leading
customers to abandon the grid entirely.
Utilities face unprecedented changes in the way power is generated and delivered.
With the ramp-up in distributed generation, energy efficiency and demand response,
electric vehicles, smart appliances, and more, the industry must rethink its rate
structures to accommodate and encourage these innovations. Progressive
rate design can make the difference in cost-effectively meeting public
policy objectives—to use electricity more efficiently, meet
environmental goals, and minimize adverse social impacts—
while ensuring adequate revenue for utilities.
Rate Design Roadmap forthe 21st Century Utility

Smart Rate Design for a Smart Future
14
16 USEIA. (2014). Extracted by National Consumer Law Center.
17 In February, an Arizona utility voted to impose a monthly surcharge of about $50 for NEM customers (Warrick, 2015).
Typical Pre-AMI Rate
DesignInclining
Block Rate
TOU Rate Fixed Time
Period
TOU plus Critical Peak
Pricing
Baseline- Referenced Real
Time Pricing
Market Indexed Real Time Pricing
ResidentialFlat Energy
Charge
Default (if kwh-only
metering in place)
Default (if TOU
meters or AMI in place)
Optional if AMI in place Pilot Not
Available
Small Commercial
0-20 kwDemand
Flat Energy Charge
Not Available
Default (if TOU
meters in place)
Optional if AMI in place Pilot Not
Available
Medium General Service
20-250 kw
Demand Charge---
Flat Energy Charge
Not Available
Default (until AMI installed)
Default (after AMI installed)
Optional Not Available
Large General Service
250- 2,000 kw
Demand Charge---
Flat Energy Charge
Not Available
Not Available Default Optional Optional
Extra Large General Service
>2000 kw
Demand Charge---
Flat Energy Charge
Not Available
Not Available
Not Available
Customer Must Choose Between These Two Options
Figure ES-1
Rate Design Options by Customer Class
the basis of long-run marginal costs. The effect is to sharply increase bills for most apartment dwellers, urban consumers, highly efficient homes, and customers who have DG systems installed, while benefitting larger homes and suburban and rural customers. Also often impacted are low-income customers who tend to be low-use customers.16 Large-volume (often wealthier) customers, meanwhile, see decreasing bills.
Some states, such as New Mexico and Arizona,17 are considering imposing new distribution system cost surcharges on DG customers that utilities argue reflect their use of the grid, even though there are no demonstrated additional costs being incurred by the utility as a result of DG output. A Wisconsin utilities commission
approved a similar fee for solar users last year.18 Exit fees are charges imposed on consumers who cease
taking utility service. In general, these are applied only to consumers departing the system on short notice, and for whom the utility has made significant investments to provide service. This may be customer-specific distribution system investments, or may be investments in power supply intended to provide long-term service. As a general rule, exit fees are inappropriate rate design measures. The risk for customer loss is an ordinary business risk, for which the utility rate of return is the compensation.
In contrast to the approaches outlined previously, Figure 1 gives an overview of the appropriate rate designs for all customer classes for both default and optional services.
18 Content, T. (2014, November 14). Regulators Agree to Increase Fixed Charge on WE Energies Electric Bills. Milwaukee Journal Sentinel.
Source: Adapted from RAP research for New England Demand Response Initiative (NEDRI), 2002

Smart Rate Design for a Smart Future
15
Enabling Smart Technology
Utilities from Maine to California have deployed smart grid upgrades or are beginning the transition to a smarter grid.19 These upgrades promise to deliver an entirely new level of information about system operations and consumer behavior. In short, the information age is coming to the electric industry.20 Computerizing the traditional grid with AMI and advanced SCADA systems will enable the development of new and dynamic rate offerings. Meanwhile, smart home appliances that can monitor pricing conditions and be made dispatchable by system operators will assist customers in managing their usage. Moreover, these new technologies will aid system operators in minimizing total system costs and increasing system reliability.21 They will also help accommodate customer-owned generation, utility-scale renewable power, energy storage (both customer- and utility-scale), EVs, and microgrids.
Smart meters provide data acquisition, equipment control, and communication capability between the customer and the power grid.22 They are able to record customer usage at a fine time scale and then communicate that information back to the utility and to the customer. This information can in turn be used to control end-use appliances in response to price signals and system conditions. When used by system controllers, they can aid in reducing loads during times of system stress. When employed by the customers or on their direct behalf, smart meters can be used to shift usage from on-peak to off-peak periods, utilizing low operating cost renewable energy.
Smart meter deployment is expected to reach 91 percent of the United States by 2022.23 It is important to note, however, that merely installing smart meters does not alone facilitate advanced pricing. Meter data management system
(MDMS) investments, billing engine modifications, and sophisticated rate studies are needed to develop advanced pricing.24 Although smart meters can enable advanced pricing mechanisms, given the relative price-variability risks and economic rewards of different types of pricing, the desired consumer rewards of lower bills are applicable only to a subset of pricing options, primarily TOU, CPP, and RTP.
Smart meters and the associated MDMS perform multiple functions. The costs associated with smart grid investments should be apportioned so that the costs are shared by all aspects of utility service that benefit. Simply stated, to justify deployment of smart meters and an MDMS there should be an expected net savings to the utility customers over the life of the investments. No single category (energy, capacity, or customer) should be assigned costs that exceed that particular benefit.
Various technology enhancements can improve the effectiveness of more complex rate designs by enabling customers to respond to prices automatically. Some examples include smart thermostats, grid-integrated water heating, EV chargers, and vehicle-to-grid applications.
Customers who have PV systems or other onsite grid-interconnected generation or battery storage systems both take power from the grid and deliver it to the grid. Keeping track of these flows is necessary for accurate billing and crediting of services provided to the grid, when the value of customer production is a priority. Smart meters have this capability and are needed when the rate design requires knowing when power is flowing and in which direction, to more accurately value the cost of customer use and the value of customer production. Clearly if the customer is consuming most of their power during off-peak periods, and supplying power mostly during on-peak periods, the solar customer is providing significant value to the grid that
19 We use the term “smart grid” broadly to include both utility grid-side and customer investments.
20 Determining whether AMI and smart grid are projected to be cost-effective before deployment is an important consid-eration and one that is beyond the purview of this report. A good discussion on smart grid benefits to costs can be found in: Alvarez, P. (2014). Smart Grid Hype & Reality. Wired Group Publishing, ch 4-9.
21 PR Newswire. (2013, January 8). ComED Launches Smart Home Showcase Contest. Available at: http://www.prnewswire.com/news-releases/comed-launches-smart-home-showcase-contest-186025412.html
22 They also provide operational benefits like reduced meter reading costs and outage detection.
23 Telefonica. (2014, January). The Smart Meter Revolution: Towards a Smarter Future. Available at: https://m2m.telefonica.com/multimedia-resources/the-smart-meter-revolution-to-wards-a-smarter-future
24 Lazar, J. (2013). Rate Design Where Advanced Metering Infrastructure Has Not Been Fully Deployed. Montpelier, VT: The Regulatory Assistance Project. Available at: http://www.raponline.org/document/download/id/6516

Smart Rate Design for a Smart Future
16
market customers. Some utilities are considering making these rates applicable to all residential consumers, either as the default rate design with the ability for the customer to opt out of the rate, or as a mandatory rate design. Tools to protect customers during this transition may include dual or shadow billing, in which customers still on traditional rates are shown potential savings on their bills; customer guarantees of tariffs that provide them with the lowest bill; “hold harmless” and first-year bill forgiveness programs; and continuation of low-income rates. The critical factor in all of these is that it gives the individual customer the opportunity to compare their bill based on a traditional rate design and a more dynamic rate design.
Evidence shows that advanced pricing works best with technology enhancement to enable automated response to higher prices that can tie directly into time-differentiated prices. Over 200 time-differentiated rate tests have been conducted worldwide, with differing results. The consensus of these pilot programs is that customers respond to prices. Furthermore, enabling technologies (in home displays, smart phone applications, smart thermostats, and
is not captured by simple monthly kWh NEM.25
The introduction of SCADA systems late in the 20th century enabled grid operators, for the first time, to see how their systems operate at a more granular level and in real or near real time. The addition of smart meters and other devices, collectively referred to as the smart grid, promises to vault the level of sophistication to an even higher level and enable more clearly defined rate designs.
Smart technologies enable distribution optimization in many ways, and rate design will play a key role in bringing customer end-uses into utilities’ toolbox of solutions. In addition, it will inform the customer about opportunities to save money and to be rewarded for providing value to the overall grid. Poor rate design can impair this ability and prevent the true value of smart technologies from being realized, clogging the gears of this dynamic.
Implementing Smart Rates
“Smart rates” describe those rate designs that require the type of data collection that smart meters provide, and that are expected to produce significant peak load reductions, reduced and shifted energy consumption, improved system reliability, improved power quality, and reduced emissions. These include TOU, PTR, CPP, and RTP (all with and without technology, such as in-home displays).
The effectiveness of different TOU rate designs varies considerably. Figure ES-2 shows a comparison of pilot program peak reduction results for a variety of smart rates. CPP rates clearly show the greatest promise of delivering strong peak reductions by customers.
Currently most utilities that have smart rates offer them as optional services, especially for residential and mass
25 “Net energy metering” is a pricing scheme that “pays” for the output of customer-sited generation at the same rate that the customer pays for energy delivered from the electric system.
Pricing Pilot
Peak
Red
ucti
on
1 1090%
10%
20%
30%
40%
50%
60%
Figure ES-2
Average Peak Reduction from Time-Varying Rate Pilots
TOU CPP CPPw/Tech
RTPw/Tech
RTP
TOU w/Tech
PTR PTRw/
Tech
Source: Faruqui, Time-Varying and Dynamic Pricing, RAP, 2012

Smart Rate Design for a Smart Future
17
appliances) enhance price responsiveness. TOU and CPP rates may also be more fair to customers than traditional flat rates, because customers who contribute more to the increased costs of peak usage are made to pay more, while customers who use less of the expensive peak power have the opportunity to save more.26
By having rates that reflect system value, customers will have the incentive to take action that over time will reduce system costs, and thus benefit all ratepayers. Overall then, rates should be lower with time-differentiation and critical peak pricing than they would be with traditional rates, owing to reductions in system costs to serve peak demands.
In order for homes to respond to dynamic pricing, either manual customer intervention or automated technology needs to be deployed. Experience shows that automated technology provides greater energy benefits by far. To achieve this, either energy management systems or smart appliances (or both) are required.
The TOU/CPP approach discussed previously is also optimal for customers who own DER. A number of compensation mechanisms have been considered by regulators for distributed resources. They range from value-to-grid approaches using avoided costs to the establishment of a system of distribution credits.27
One such incentive is locational pricing, which provides incentives for DER that are located in areas that reduce congestion. This can be beneficial to the distribution system, as critically sited DER can lead to the postponement or avoidance of costly upgrades. The pragmatic way to reflect locational values to residential and small commercial consumers is through targeted incentives for peak load management, as are typically provided by energy efficiency suppliers and DR aggregators, not necessarily through complex retail rate designs that consumers may be unlikely to understand.
Separating out the existing cost analysis into its constituent parts — energy, demand, and ancillary services — can also support smarter DR and DER investment. The ancillary services needed in providing electricity service can also promote DER investments that help the grid’s reliability and resiliency.
Hawaiian Electric Company has prepared a detailed Distributed Generation Integration Plan, which may be a postcard from the future for mainland utilities preparing for a much higher uptake of solar PV. Key considerations in the overall plan include the correct sizing of line transformers, analysis of when upgrades to circuit capacity are needed, installation of voltage
regulators, and additions of electricity storage in some locations. Recovering the costs of grid modifications associated with DG is a topic of considerable controversy. In Hawaii, where these modifications are more imminently needed, Hawaiian Electric has implemented a change to require smart inverters, and the overall plan includes installation of voltage regulators, upgrades to substations, upgrades to conductors, and implementation of DR. The determination by the Hawaii Public Utility Commission on the appropriate method for recovery of the associated costs is pending.
Hawaii may be leading the nation in change, but dockets have been convened in Arizona, Colorado, California, New Mexico, and other states examining the appropriate way to recover DG-related grid costs, including modifications needed to adapt to high levels of solar. In general, regulators will weigh issues including the recovery of existing, incremental, stranded, and new generation costs, as well as the role of the value of solar.
The outcome of these investigations will produce different results state by state. In general, states looking ahead at marginal costs will conclude that solar customers are bringing great value to the system, whereas states focused on embedded cost concepts will see stranded cost issues. Adhering to the guidelines below, which follow from the three principles of rate design outlined in this paper, should ensure that solar and other residential consumers are treated equitably.
• Customer Charges. Should not exceed the customer-specific costs associated with an additional customer, such as the service drop, billing, and collection.
• Energy Charges. Should generally be time-varying and those time differentiations should apply both to power delivered by the utility to customers, and to power delivered to the utility from customer generation. This assures that solar output is valued appropriately, and high-cost periods are reflected in the prices charged to customers using power at those times. Until smart rates are applied universally, it may
26 Traditional flat rates force all customers to a rate based on the average costs assigned to the class, to the detriment of customers who use less on-peak and therefore have less costly consumption patterns.
27 Moskovitz, D. (2001, September). Distributed Resource Distribution Credit Pilot Programs: Revealing the Value to Consumers and Vendors. Montpelier, VT: The Regulatory Assistance Project.

Smart Rate Design for a Smart Future
18
28 Lazar, J. (2014, November). Electric Utility Residential Customer Charges and Minimum Bills: Alternative Approaches for Recovering Basic Distribution Costs. Montpelier, VT: The Regulatory Assistance Project. Available at: http://www.raponline.org/document/download/id/7361
29 Lazar, J., Joyce, J., and Baldwin, X. (2008). Plug-In Vehicles, Wind Power, and the Smart Grid. Montpelier, VT: The Regulatory Assistance Project. Available at: www.raponline.org/docs/RAP_Lazar_PHEV-WindAndSmartGrid_2007_12_31.pdf
be appropriate to make time-varying rates mandatory for solar customers, but optional for small-use non-solar customers (see discussion on this in Chapter VI).
• Minimum Bills. Where utilities have high numbers of seasonal customers who only consume power during the summer or winter, an annual minimum bill may be an appropriate rate design to ensure a minimum level of revenue from customers in this category. Otherwise, minimum bills are not a particularly desirable rate design.28
• Demand or Connected Load Charges. Demand charges are generally inappropriate for residential and small commercial customers who share distribution transformers with other consumers, and where implemented should not exceed the cost of the final transformer, about $1/kW/month. They are never appropriate for upstream distribution costs that can be recovered in a TOU rate. The illustrative rate designs eliminate demand charges entirely except for the final line transformer, including the remaining system capacity costs in TOU and CPP rates.
Optimal rate design choices may also differ according to the level of the utility’s costs:
• Low-Cost Utilities (average revenue <$0.10/kWh). May need to retain or institute inclining block rates to ensure that the end-block of usage reflects long-run marginal costs for clean power resources, transmission, and distribution.
• Most (Average-Cost) Utilities (average revenue $0.10 to $0.20/kWh). Conventional NEM (of the full rate, including volumetric charges for power supply and distribution) is likely an appropriate strategy; although grid operators lose distribution revenues, their consumers gain all of the other benefits of increased renewable generation, and taken as a whole, the value of solar energy added to the system is usually equal or greater in value than the retail electricity price.
• High-Cost Utilities (average revenue > $0.20/kWh). Utilities that have average residential prices in excess of the long-run marginal cost of new clean-energy resources ($0.10/kWh to $0.25/kWh) may need to reflect distribution charges separately, collected from all customers receiving grid power, and crediting only a power supply rate when solar power is fed to the grid.
As emerging technologies become more mainstream, rate designs will need to adapt to changes in how customers use electricity and how it impacts the grid. DG can be
viewed as a tool to strengthen the grid and rate designs of the future can encourage the utility-customer partnership to ensure the efficiency and economy of the grid. Key will be the temporal rates discussed previously, but innovations in terms of unbundling the customer-generated power to provide ancillary services and providing credits to DER that is strategically located to support the grid will be important components.
This paper also explores other utility strategies to encourage uptake of DER, including green pricing services that allow customers to pay a premium on their bills to support utilities’ investment in renewable energy, and design of rates that can compensate customers for ancillary services that they provide the utility, such as the use of smart grid solutions to aid reliability.
Electric VehiclesEVs are another emerging technology poised to play a
growing role in this future, and utilities can use rate design to send EV owners the optimal price signals. Even without AMI deployment, interval TOU meters to be read manually can allow EVs to be separately metered. But a utility that has AMI has many options for providing a rate for EV owners that is appealing to the customer and remunerative to the utility. These can include a simple TOU rate, a multi-period TOU rate with a super-off-peak period, a critical peak pricing rate, or a real-time price.
For public charging stations, a wide variety of pricing schemes are used, from free charging to hourly parking to TOU rates. In states that subject EV charging stations to regulation for the resale of electricity, charging stations avoid regulation by charging for the parking space, often on a time-varying basis, and not charging for the electricity.
One of the great promises of EVs is that they will become fully grid-integrated, providing a market for off-peak power, a source for on-peak power, and multiple ancillary services.29 This requires a combination of sophisticated

Smart Rate Design for a Smart Future
19
charging units in vehicles, complex pricing, and a very smart grid. Vehicle-to-grid pilot programs that make use of these features are in the early stages.
Policies to Complement Smart Rate Design
Utilities find themselves at a crossroads in which they could embrace or shun rate designs that support a smarter future. The smart future will see extensive use of technology to help consumers manage their energy costs, and utility pricing that enables these savings to occur. A mix of central generation, DG, energy efficiency, DR, and customer response to time-varying pricing will provide a rich mix of reliable and environmentally friendly sources to provide quality service at reasonable costs. Consumers will increasingly have smart homes and appliances, and utilities will use AMI to collect key data from these resources and respond accordingly.
To achieve this smart future, regulators at various levels will have to take many discrete actions, including:
• Utility regulators will need to adopt time-varying and dynamic rate designs, with consumer education, shadow-billing during a pre-deployment phase, a “hold harmless” provision for the first year of implementation, and excellent customer support throughout.
• Some form of revenue regulation will be necessary to ensure that utilities retain a reasonable opportunity to earn a fair return on investment on used and useful property serving the public, and maintain access to capital at reasonable prices.
• State building energy codes will need to require home energy management systems in new homes (as most already do for commercial buildings).
• Customer-sited generation will include: smart inverters, which will provide reliability and ancillary services; customer-sited batteries which will provide service not only to the locations where they are installed, but be available to grid operators for system support; and variable solar orientation to optimize peak time production.
• Federal appliance standards must require installation
of control technologies in new major appliances such as refrigerators, water heaters, furnaces, heat pumps, and air conditioners, dishwashers, clothes washers, and clothes dryers, so that they can automatically adjust to changing prices.
The “not-so-smart” future would involve movement toward high recurring fixed charges. They provide utilities with stable revenues and address their immediate concerns. In doing so, they punish lower-usage customers and discourage efficiency improvements and adoption of distributed renewables, and over time can lead to an
unnecessary increase in consumption or, in the event distributed storage technologies become more accessible, promote customer grid defection. This is to say, such rates are economically inefficient and inequitable and are not justified by any fundamental principle of neoclassical economic theory. They are, in fact, nothing more than a government-sanctioned exercise of monopoly power. The adverse impacts on electric consumers and public policy goals for electricity regulation include skewed incentives against energy efficiency, customers looking to
go totally off the grid, and higher bills for most low-income households.
The first of the principles of electricity pricing set out earlier in this paper notes that a customer should be able to connect to the grid for no more than the cost of adding that customer. The imposition of a fixed charge solely for the privilege of being a customer is not common in other economic sectors, from supermarkets to hotels and airlines, that have similarly significant fixed costs to those of utilities. Allowing utilities to impose high fixed monthly charges is an exercise of monopoly power and impedes the longstanding goal of universal service in the United States. Utilities’ concern about loss of revenue is fair, but an SFV model is probably the worst option available by which to address it.
Utility cost recovery and revenue stability can be addressed many different ways, some desirable and some less desirable. In addition to fixed charges, three other options — a higher allowed rate of return, incentive regulation, and revenue decoupling — are discussed below.
In states where revenue regulation mechanisms have not been deployed, but utility revenues are erratic or
High recurring fixed charges provide utilities with stable revenues and address their
immediate concerns. In doing so, they punish lower-usage customers, discourage
efficiency improvements and adoption of distributed
renewables, and over time can lead to an unnecessary increase
in consumption or promote customer grid defection.

Smart Rate Design for a Smart Future
20
declining owing to changes in usage, the market will demand a higher return on invested capital. Regulators are effectively letting the capital markets set a higher rate of return for the utility. But either a higher return on equity or a higher equity ratio will increase the utility revenue requirement. Thus, this laissez faire approach certainly results in higher costs to consumers over time.
Incentive regulation, or performance-based ratemaking, is another way to address the revenue loss that utilities experience if customer sales decline. If the regulator sets the achievement of a defined level of sales reduction from energy efficiency as a goal, and provides a financial reward to the utility for achieving that, the regulator can make up the lost earnings that the utility experiences. The challenge in performance-based ratemaking is to set the objectives for the utility to be achievable but challenging, and to set the rewards to be ample but not excessive.
Revenue-based regulation, or “decoupling,” is widely used throughout the United States to insulate gas and electric utilities from revenue impacts attributable to sales variations. The essence of revenue regulation is that the utility regulator sets an allowed revenue level, and then makes periodic small adjustment to rates to ensure that allowed revenue is achieved, independent of changes in units (kW and kWh) sold. One benefit of revenue regulation is that the utility normally receives a “formula” to reflect higher costs, such as a “revenue per customer” allowance. These do tend to lead to very small annual increases in revenues. Whether prices increase depends on whether average consumption by customers is rising or declining as the number of customers change. Critics worry that these mechanisms result in annual increases, and that declining costs are not offset against rising costs, but a well-structured mechanism can address these concerns.
A well-designed revenue regulation framework is the best option to address utility revenue attrition that energy efficiency or renewable energy deployment may cause. There is no silver bullet to address the legitimate concerns of all interests. The evidence, however, demonstrates that high fixed charges have the most adverse impacts on consumers, the environment, the economy, and society. Good rate design addresses the legitimate concerns of all major interests, provides a framework for stable regulation of utilities, and enables the growth of renewable energy and
energy efficiency to meet electricity requirements.
Good rate design should be accompanied by bill simplification. In many states, the utility bill has become a rather dense tangle of line items that represent, in many cases, a long history of policy initiatives and regulatory decisions. To the extent that line items can be eliminated or combined, consumer confusion is
likely to be reduced. Utilities should be required to display the “effective” rate to customers, including all surcharges, credits, and taxes, so consumers can measure the value of investing in energy efficiency or other measures that reduce (or increase) their electricity consumption.
As customers utilize greater energy efficiency and deploy more PV, the reductions in their bills can have the effect of allocating greater cost recovery responsibility to other customers. This is often described as a cross-subsidy. This is an unfair characterization; in fact, the system for allocating costs among customers and customer classes has always been a dynamic one that reflects the changing characteristics of all customers over time. Still, this is an important issue, and regulators will need to take care in rate design to assure that all customers share in the benefits that industry changes will bring and that no customer group is left out of the mix. This includes customers who may not be in a position to maximize smart grid usage, such as renters. If the rate design for DG customers is implemented according to the principles we have outlined, then non-DG customers should see equitable prices for energy delivered to their meters. By properly implemented, we mean that DG customers are not unduly rewarded for deploying DG; the collateral benefits of DG, such as reduced line losses, deferred and avoided distribution investments, health impacts, and other non-energy benefits are considered; and the potential for overall reductions in the price of generation is accounted for.
Conclusion
Rate design will be an important driver of utilities’ success in making the transition to a clean power system. Utilities, customers, and third-party service providers will need the tools to manage the grid as efficiently as possible. Regulators will need to ensure that benefits and costs are fairly allocated. Prices that are accurate and easy to
Good rate design addresses the legitimate concerns of all major interests, provides a framework
for stable regulation of utilities, and enables the
growth of renewable energy and energy efficiency to meet
electricity requirements.

Smart Rate Design for a Smart Future
21
understand can reward customers for energy usage behavior that contributes to the reduction, rather than increase, of utility system costs.
Utility rate designs will have to more appropriately reflect the costs of electricity provided (or merely delivered) by the utility and the benefits that are provided to the utility system by customers. As utilities and third-party vendors develop and offer more innovative technologies (such as smart appliances that can respond to grid pricing signals), pricing will need to become even more geographically, temporally, and functionally granular and precise. Smart rate designs will need to address not only the amount consumed but also when it is consumed and its impact on costs and other customers. In addition to recognizing locational benefits in pricing, good rate design recognizes the attributes that a customer can provide in terms of energy, capacity, and ancillary services.
A small number of utilities offer some kind of dynam-ically priced rate to residential customers, whether it is a TOU rate or a peak-time rebate. However, for policymakers to move forward in the direction of TOU pricing on a larger scale, customer education will be important to empower informed decisions about energy use.
For DG customers specifically, the price they pay or receive for electricity they either consume or provide to the grid respectively will matter greatly in terms of encouraging or discouraging growth. Bidirectional rates with TOU pricing may offer one of the best solutions for this segment of the market. Under this rate design, the DG customer pays the full retail rate for any power consumed, just like any other customer. This customer is then compensated based on the same time periods, either using the retail rate or on a value basis. That value can be based on an analysis
of the contribution of DG to the grid and can be set independently by a state public service commission.
Viewed as a quick fix to lost revenues associated with customer engagement in energy solutions, utilities are increasingly proposing SFV rates with high monthly fixed charges. Yet SFV is not a step forward, but a step backward. It discourages innovation and efficiency, penalizes low-income and apartment residents, and results in per-unit prices that fall far short of
total system long-run incremental costs. The argument against SFV also follows clearly from the argument against unavoidable, recurring charges generally: it is not justified by fundamental economic principles.
Utilities have a long history of operating as monopolies, but technology means that both they and their regulators must adapt. Utilities may find they need to view their business differently. Power sector transformation will need to incorporate new tools to address this. Rate design will be an important element. The role of regulation in this power sector transformation will be to develop pathways that lead to smarter solutions that optimize the value of interconnection and two-way communication for the customer and the grid. Many of these solutions will be market-driven.
The speed at which change takes place will vary from jurisdiction to jurisdiction and will be influenced by what customers want and the utility culture. Regulators will have an important role to play in overseeing this transformation. In doing so, they should strive to avoid expensive mistakes based on defense of the legacy structure of the industry. Instead, regulators will need to focus on identifying costs and benefits of alternative strategies and seek to maximize the net value to customers and society.
Rate design will be an important driver of utilities’
success in making the transition to a clean power system. Smart rate designs
will need to address not only the amount consumed
but also when it is consumed and its impact on costs and
other customers.

Smart Rate Design for a Smart Future
22
I. Introduction
For most of its history, the electric utility industry saw little change in the economic and physical operating characteristics of the electric system. Large central station generating plants connected
to high-voltage transmission delivered power to local distribution grids for delivery to end users, mostly by vertically integrated utilities that owned all of these components. Though reliable and remarkably low-cost, the historical electric system was, and in many ways remains, a black box to both customers and to system operators. Little in terms of the status of the system or customer use of the system was known in real- or near real-time. In short, for an industry in the information age, parts of the electric system can be considered rather “unenlightened.”1
Today, the industry is facing a number of radical changes that will change this unintelligent landscape. Information systems are coming to the grid that will inform customers and system operators about how the system really works and how actions or failures to act can impact costs to customers and to society. Two categories of these changes will both demand and allow a more sophisticated method of pricing services to customers, a concept generally referred to in the industry as “rate design.”
First, end users are installing their own generation, mostly in the form of photovoltaic (PV) systems, and are connecting different types of end-use appliances with increasing “intelligence” built in. Changes in customer usage brought about by energy efficiency and demand reductions in the face of price signals have allowed these phenomena to be recognized as virtual energy resources. In addition, the electric vehicle as a whole new class of end use is poised to grow rapidly over the coming years just as energy storage systems are poised to finally become economical. Together, these and other emerging technologies will usher in an entirely new system planning and operational dynamic. These changes, all at or near the customers’ premises, will allow greater control of end-use loads and position the customer to respond to prices and system operational conditions in real-time or near real-time.
Second, utilities are deploying advanced metering,
sometimes referred to as “advanced metering infrastructure” (AMI) or “smart meters,” and more sophisticated system control and data acquisition (SCADA) systems that will provide system operators a new, real-time understanding of the state of the electric system, as well as the ability to communicate with generators, substations, transformers, meters, and end-use appliances.
To realize the full potential of these new systems and end uses, regulators, utilities, third-party service providers, and customers will need to utilize more advanced rate designs. Most important of these will be the more widespread use of bidirectional, time-sensitive prices that more accurately reflect cost. At the same time, regulators will need to take care to avoid potential pitfalls that would undermine the value of these new technologies.
Basics of Rate Design
Rate design is the regulatory term used to describe the pricing structure used by electric utilities in the United States. It explicitly includes the itemized prices set forth in tariffs and implicitly includes the underlying theory and process used to derive those prices. The structure of prices—that is, the form and periodicity of prices for the various services offered by a regulated company—has an impact on the choices made by customers, utilities, and other electric market participants which, in turn, affect resource development and utilization choices. These choices then have indirect consequences in terms of total costs to society; environmental and health impacts; and the overall economy.2
1 Those interested in the emerging changes and the challenges they present are invited to go directly to the sections covering Rate Design Principles and Rate Design for Specific Applications.
2 Weston, F. (2000). Charging for Distribution Utility Services: Issues in Rate Design. Montpelier, VT: Regulatory Assistance Project. Available at: http://www.raponline.org/document/download/id/412

Smart Rate Design for a Smart Future
23
Core Rate Design Principles
As one might expect, although rate design for electric utility customers is of critical importance, it is poorly understood by the general public and often lacks transparency.3 Yet because customer energy usage choices are affected by the prices they pay, the difference between a progressive and regressive rate design can increase customer usage by as much as 15 percent.4 Traditional simplistic rate designs that charge a single rate per unit of consumption, or worse, charge a lower rate as consumption increases, are still common in many Central and Southern states.5 However, those traditional rate designs may not be the preferred rate for consumers, or be in the best interest of the utilities that serve them or society. Things are changing, and the industry must adapt to change or risk the fate of landline telephone companies, which have lost 60 percent of their access lines since the advent of telecommunications competition.
Rate design determines the prices consumers see and use to guide their consumption and investment choices. Prices affect how consumers use the electrical devices, appliances, and systems in our homes and factories. Electricity prices also influence how consumers invest in new equipment and the value consumers obtain from that equipment.
Most people who have ever tried their hands at designing rates for regulated utilities invariably say that it is “more art than science.” Because of the shared nature of the system and the need to spread cost recovery fairly among all customers, the idea that rates should be set based on customer cost causation is a foundational concept in rate design. Analysts who ask, in a causal sense, “why” costs are incurred often reach different conclusions than those who measure, in an engineering sense, “how” costs are incurred. Rate design
relies in strong measure upon the judicious application of certain economic guidelines. The following elements of economically efficient rate design necessary to address current and coming challenges in the electric industry are based on those laid out in James Bonbright’s 1961 Principles of Public Utility Rates, and in Garfield and Lovejoy’s Public Utility Economics. These principles require that rates should:
• Be forward-looking and reflect long-run marginal costs;
• Focus on the usage components of service, which are the most cost- and price-sensitive;
• Be simple and understandable;• Recover system costs in proportion to how much
customers use, and when they use it;• Give consumers appropriate information and the
opportunity to respond by adjusting usage; and• Where possible, be temporally and geographically
dynamic.6
Rate design signals public priorities about short-term and long-term economics, including especially the type and pace of future resource procurements. Rates can be designed to meet or, in the case of poor rate design, frustrate public policy objectives to use electricity more efficiently, meet environmental goals, and minimize adverse social impacts, including public health.
Rates are also pivotal in providing utilities the opportunity to recover their authorized revenue requirement. Revenue adequacy is a core objective of rate design, but the more constructive design ideal for rates is forward-looking, so that future investment decisions by the utility and by customers can be harmonized.
Based on these traditional rate design concepts, and looking forward to a world with high levels of energy efficiency, distributed generation, and customer options for
3 This is evidenced by the number of recent rate design reports. See: Rocky Mountain Institute (RMI) eLab. (2014, August). Rate Design for the Distribution Edge. Available at: http://www.rmi.org/elab_rate_design#pricing_paper; RMI. (2015, February 26). Why New Electricity Pricing Approaches are a Sheep in Wolf’s Clothing [Blog post]. Available at: http://blog.rmi.org/blog_2015_02_25_why_new_electricity_pric-ing_approaches_are_a_sheep_in_wolfs_clothing; and Tong, J., and Wellinghoff, J. (2015). Why fixed charges are a false fix to the utility industry’s solar challenges. Utility Dive, February 13, 2015. Available at: http://www.utilitydive.com/news/tong-and-wellinghoff-why-fixed-charges-are-a-false-fix-to-the-utility-indu/364428/.
4 See Lazar. J. (2013). Rate Design Where Advanced Metering Infrastructure Has Not Been Fully Deployed. Montpelier, VT: The Regulatory Assistance Project. http://www.raponline.org/document/download/id/6516. Appendix A provides a calculation of how rate design can influence consumption.
5 Worse, in that new generation, transmission and distribution resources accelerated by declining block rate designs, cost more than older resources. Also, utility capital cost forecasts are rising as are environmental costs.
6 Lazar, 2013, p. 10.

Smart Rate Design for a Smart Future
24
on-site backup supply, modern rate design should adhere to three basic principles:
• Principle 1: A customer should be able to connect to the grid for no more than the cost of connecting to the grid.
• Principle 2: Customers should pay for grid services and power supply in proportion to how much they use these services, and how much power they consume.
• Principle 3: Customers that supply power to the grid should be fairly compensated for the full value of the power they supply.
These principles and priorities should be reflected in smarter rates designed to maximize the value of technology innovations, open up new markets, and accommodate the distribution and diversification of customer-sited generation
resources. This necessarily includes consideration of what those future technologies and policies could look like, with a focus on metering, market structure, and pricing. In particular, consideration of how rates provide a “price signal” to customers, utilities, and other market participants to inform their consumption and investment decisions regarding energy efficiency (EE), demand response (DR), and distributed generation (DG), collectively referred to as distributed energy resources (DER).7
7 Quite a bit of background is necessary to fully appreciate the nuances of current practice, and the path to future rate designs. The reader is directed to the Guide to Appendices at the end of this document for more in-depth treatment of these issues.
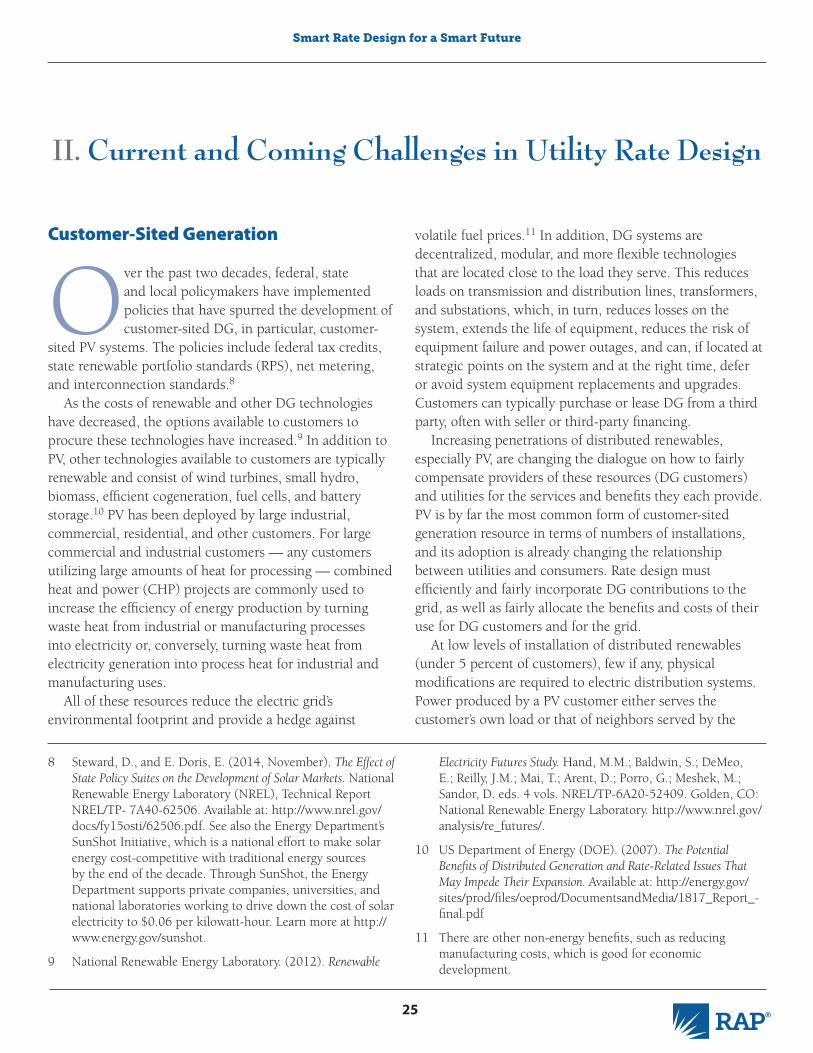
Smart Rate Design for a Smart Future
25
8 Steward, D., and E. Doris, E. (2014, November). The Effect of State Policy Suites on the Development of Solar Markets. National Renewable Energy Laboratory (NREL), Technical Report NREL/TP- 7A40-62506. Available at: http://www.nrel.gov/docs/fy15osti/62506.pdf. See also the Energy Department’s SunShot Initiative, which is a national effort to make solar energy cost-competitive with traditional energy sources by the end of the decade. Through SunShot, the Energy Department supports private companies, universities, and national laboratories working to drive down the cost of solar electricity to $0.06 per kilowatt-hour. Learn more at http://www.energy.gov/sunshot.
9 National Renewable Energy Laboratory. (2012). Renewable
II. Current and Coming Challenges in Utility Rate Design
Customer-Sited Generation
Over the past two decades, federal, state and local policymakers have implemented policies that have spurred the development of customer-sited DG, in particular, customer-
sited PV systems. The policies include federal tax credits, state renewable portfolio standards (RPS), net metering, and interconnection standards.8
As the costs of renewable and other DG technologies have decreased, the options available to customers to procure these technologies have increased.9 In addition to PV, other technologies available to customers are typically renewable and consist of wind turbines, small hydro, biomass, efficient cogeneration, fuel cells, and battery storage.10 PV has been deployed by large industrial, commercial, residential, and other customers. For large commercial and industrial customers — any customers utilizing large amounts of heat for processing — combined heat and power (CHP) projects are commonly used to increase the efficiency of energy production by turning waste heat from industrial or manufacturing processes into electricity or, conversely, turning waste heat from electricity generation into process heat for industrial and manufacturing uses.
All of these resources reduce the electric grid’s environmental footprint and provide a hedge against
volatile fuel prices.11 In addition, DG systems are decentralized, modular, and more flexible technologies that are located close to the load they serve. This reduces loads on transmission and distribution lines, transformers, and substations, which, in turn, reduces losses on the system, extends the life of equipment, reduces the risk of equipment failure and power outages, and can, if located at strategic points on the system and at the right time, defer or avoid system equipment replacements and upgrades. Customers can typically purchase or lease DG from a third party, often with seller or third-party financing.
Increasing penetrations of distributed renewables, especially PV, are changing the dialogue on how to fairly compensate providers of these resources (DG customers) and utilities for the services and benefits they each provide. PV is by far the most common form of customer-sited generation resource in terms of numbers of installations, and its adoption is already changing the relationship between utilities and consumers. Rate design must efficiently and fairly incorporate DG contributions to the grid, as well as fairly allocate the benefits and costs of their use for DG customers and for the grid.
At low levels of installation of distributed renewables (under 5 percent of customers), few if any, physical modifications are required to electric distribution systems. Power produced by a PV customer either serves the customer’s own load or that of neighbors served by the
Electricity Futures Study. Hand, M.M.; Baldwin, S.; DeMeo, E.; Reilly, J.M.; Mai, T.; Arent, D.; Porro, G.; Meshek, M.; Sandor, D. eds. 4 vols. NREL/TP-6A20-52409. Golden, CO: National Renewable Energy Laboratory. http://www.nrel.gov/analysis/re_futures/.
10 US Department of Energy (DOE). (2007). The Potential Benefits of Distributed Generation and Rate-Related Issues That May Impede Their Expansion. Available at: http://energy.gov/sites/prod/files/oeprod/DocumentsandMedia/1817_Report_-final.pdf
11 There are other non-energy benefits, such as reducing manufacturing costs, which is good for economic development.

Smart Rate Design for a Smart Future
26
same substation bus. At the distribution substation, all that is observed is a lower overall load during the solar day. This is the situation in most of the United States. The low penetration scenario changes once solar output exceeds total load on a given substation. This is being experienced in Hawaii, which has the highest PV penetration of any state and where over 10 percent of residential consumers have PV systems installed. In the single-family residential sector, it is more than 20 percent in many neighborhoods. At this level of solar saturation, changes to distribution systems may be needed.
Solar penetration is measured in several ways: percent of customers, installed capacity as a percentage of peak demand, or installed capacity as a percentage of the minimum daytime load. Figure 1 is a map of the island of Oahu (Honolulu), showing which circuits have high levels of solar saturation; over half of the residential circuits have installed solar capacity in excess of 100 percent
of the minimum daytime load. Therefore, it is possible (depending on the consumption of the customers that have the solar systems) for the customers’ local distribution circuit to be delivering power upstream through the substation, rather than the traditional downstream flow of power from generation to transmission to distribution circuits.
Once solar penetration reaches about 10 percent of customers, as it has in Hawaii, there may be specific costs to the grid operator, such as additional voltage regulators, that are attributable to high levels of solar penetration. This does not necessarily mean that solar customers should pay different or additional charges compared with non-solar consumers because in most cases this solar penetration is helping to avoid other offsetting generation, transmission, and distribution costs.12
Hawaii is serving as a laboratory as it adapts to a high-renewable environment, with a mix of geothermal,
hydro, biomass, wind, and solar making up an increasing percentage of electricity supply. The primary utility networks in the state recently submitted two important studies to the state PUC, addressing both distribution13 and generation14 planning. With the changes identified in these plans, Hawaiian Electric anticipates being able to adapt and ensure a reliable future with 65 percent renewable energy by 2030, and the state of Hawaii has adopted a legislative standard of 100 percent renewable electricity by 2045.
Adaptations that Hawaii is exploring and implementing include upgrading distribution system components such as higher capacity line transformers, increasing circuit capacity, adding voltage regulation, updating substation equipment, and investing in flexible generation to replace older units that must run continuously to be available to provide service during key hours.
Figure 1
Oahu PV Installations as Percent of Minimum Daytime Load
%DG of Circuit Daytime Minimum Load
12 Also, among two solar installations, a solar installation with a smart inverter that can provide ancillary services to the grid may provide the grid with more value than a PV installation with a standard inverter. For more detail on the benefits of solar PV, see: RMI. (2013). A Review of Solar PC Benefit & Cost Studies, second edition. Available at: http://www.rmi.org/cms/Download.aspx?id=10793&file=eLab_DERBenefitCost-Deck_2nd_Edition&title=A+Review+of+Solar+PV+Bene-fit+and+Cost+Studies
13 Hawaiian Electric Company. (2014, August 26). Distributed Generation Integration Plan. Available at: http://files.hawaii.gov/puc/4_Book%201%20(transmittal%20ltr_DGIP_Attachments%20A-1%20to%20A-5).pdf
14 Hawaiian Electric Company. (2014, August 26). Power Supply Improvement Plan. Available at: http://files.hawaii.gov/puc/3_Dkt%202011-0206%202014-08-26%20HECO%20PSIP%20Report.pdf
Source: Hawaiian Electric Company

Smart Rate Design for a Smart Future
27
15 Lantry, L. (2015). The Car of the Future Will Be All Electric and Self-Driving. EcoWatch. Available at: http://ecowatch.com/2015/06/17/car-of-future-electric-self-driving/
16 This section is primarily extracted from a larger publication on electric vehicles, MJ Bradley & Associates. (2013). Electric Vehicle Grid Integration in the US, Europe, and China. Montpelier, VT: The Regulatory Assistance Project. Available at: http://www.raponline.org/document/download/id/6645
17 Hilshey, A.D. (2012). Electric vehicle charging: Transformer im-pacts and smart, decentralized solutions. University of Vermont School of Engineering. Power and Energy Society General Meeting, Institute of Electrical and Electronics Engineers (IEEE), 2012. Available at: http://www.uvm.edu/~prezaei/Papers/Hilshey_GM2012.pdf
18 Lawrence Berkeley National Laboratory (LBNL). About Microgrids. Available at: https://building-microgrid.lbl.gov/about-microgrids
Electric Vehicles
Electric vehicles (EVs) are a small part of the electricity load currently, but growth in electric vehicles is likely for many reasons. First, the cost of batteries is declining, and this cost has historically been a major barrier to the EV market. Second, the evolution of the self-driving car is likely to stimulate a greater market for simple vehicles that can be remotely operated. EVs may be well-suited for this market segment.15 Finally, emissions regulations are pressuring the industry to find zero-emissions transportation solutions.16
Electric vehicles such as the Nissan Leaf and Ford Focus can travel three to four miles per kilowatt-hour (kWh), meaning that ten kWh is functionally equal to one gallon of gasoline. An electric vehicle that travels 10,000 miles per year (800 miles per month) will use 3,000 to 4,000 kWh per year, about equal to the annual usage of a residential electric water heater or central air conditioner.
Because of the presence of batteries in the vehicles and the ability to control the timing of when they are charged, EV loads can be very different from traditional loads. If the vehicle battery capacity is adequate for a day’s driving (less than 80 miles for the vast majority of drivers), the batteries can be charged at night or at other times when power is plentiful and lower cost, and impose little or no incremental peak demand for the utility system. They can even be controlled by smart transformers connected to smart grid distribution automation systems so that, in aggregate, they impose the minimum load on the system during primarily night-time charging hours.17 However, encouraging that behavior means that rates should be designed to provide an incentive for EV owners to charge
their cars when power costs are low and distribution system capacity is not congested. This requires time-sensitive pricing, a topic discussed in greater detail later in this paper.
Microgrids
DefinitionIn the near future, utilities will need to interface with
customer- or community-owned microgrids. These may range from an individual apartment building or office complex with on-site generation to a municipal electric utility connected to an adjacent larger utility.
Lawrence Berkeley National Laboratories (LBNL) has defined a microgrid as “a localized grouping of electricity sources and loads that normally operates connected to and synchronous with the traditional centralized grid (macrogrid), but can disconnect and function autonomously as physical and/or economic conditions dictate.”18 Large hotels and hospitals, and an increasing number of individual homes, have had on-site emergency generation for decades, but generally fall short of the definition of a microgrid due to lack of communication and control technologies to interact in a bidirectional manner with the grid. But technological progress will potentially extend implementation of this microgrid concept to thousands of customers on each major utility, and millions nationwide.
Residential MicrogridThe visual representation in Figure 2 depicts an example
of a residential microgrid as envisioned by LBNL.

Smart Rate Design for a Smart Future
28
Wall-mounted residential electric vehicle charging station Wind
turbine
Community electric vehicle charging station
Community-level solar panels
Battery (local storage for the micro grid)
Bidirectional electricity flow
Grid interface controller
Figure 2
Residential Microgrid Example19
19 University of California at Irvine. Cyber-Physical Energy Systems (CPES). Available at: http://aicps.eng.uci.edu/research/CPES/ (2014).
Microgrids with Community Resources
In the near future, whole communities may be planned around a microgrid concept, with single- and multi-family housing constructed with smart meters and smart appliances. These microgrids may utilize DG (both individual- and community-owned) and storage technologies as shown in Figure 3. Microgrids will depend on utilities for some service at appropriate rates; however, microgrids will also provide services to utilities at times, and so the compensation framework needs to be symmetrical and bidirectional.
Figure 3
Microgrid with Community Resources
Source: Cleanskies.org
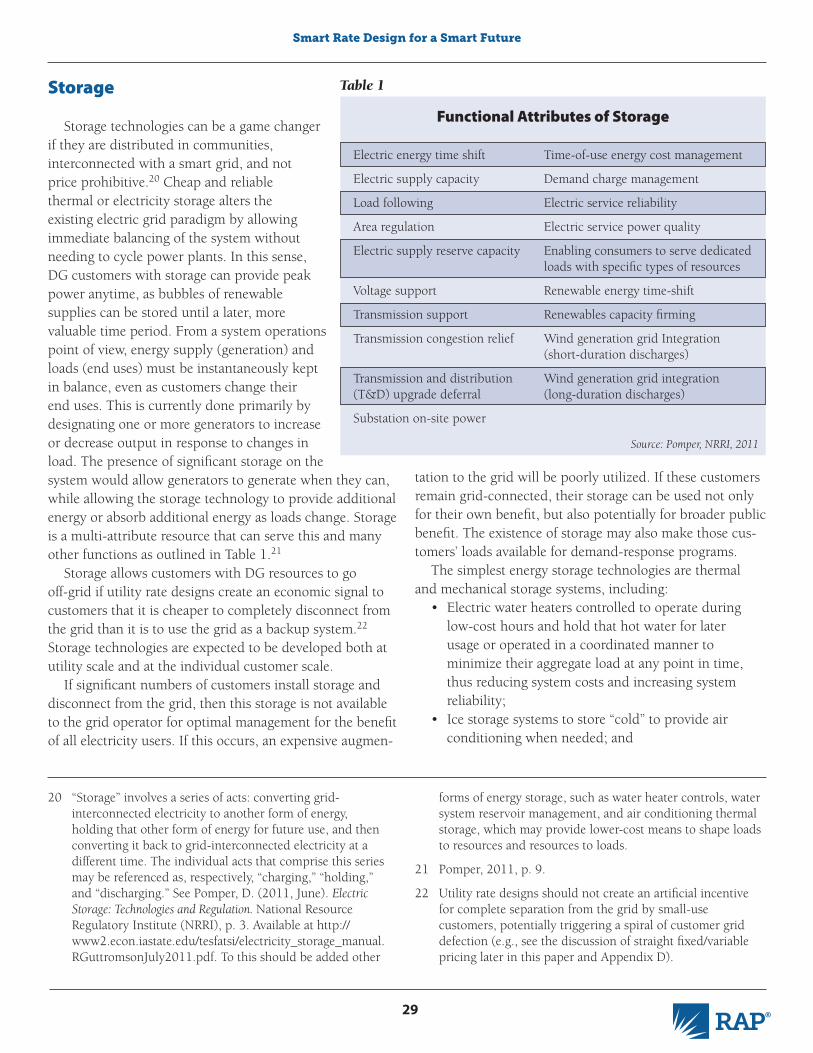
Smart Rate Design for a Smart Future
29
Storage
Storage technologies can be a game changer if they are distributed in communities, interconnected with a smart grid, and not price prohibitive.20 Cheap and reliable thermal or electricity storage alters the existing electric grid paradigm by allowing immediate balancing of the system without needing to cycle power plants. In this sense, DG customers with storage can provide peak power anytime, as bubbles of renewable supplies can be stored until a later, more valuable time period. From a system operations point of view, energy supply (generation) and loads (end uses) must be instantaneously kept in balance, even as customers change their end uses. This is currently done primarily by designating one or more generators to increase or decrease output in response to changes in load. The presence of significant storage on the system would allow generators to generate when they can, while allowing the storage technology to provide additional energy or absorb additional energy as loads change. Storage is a multi-attribute resource that can serve this and many other functions as outlined in Table 1.21
Storage allows customers with DG resources to go off-grid if utility rate designs create an economic signal to customers that it is cheaper to completely disconnect from the grid than it is to use the grid as a backup system.22 Storage technologies are expected to be developed both at utility scale and at the individual customer scale.
If significant numbers of customers install storage and disconnect from the grid, then this storage is not available to the grid operator for optimal management for the benefit of all electricity users. If this occurs, an expensive augmen-
20 “Storage” involves a series of acts: converting grid-interconnected electricity to another form of energy, holding that other form of energy for future use, and then converting it back to grid-interconnected electricity at a different time. The individual acts that comprise this series may be referenced as, respectively, “charging,” “holding,” and “discharging.” See Pomper, D. (2011, June). Electric Storage: Technologies and Regulation. National Resource Regulatory Institute (NRRI), p. 3. Available at http://www2.econ.iastate.edu/tesfatsi/electricity_storage_manual.RGuttromsonJuly2011.pdf. To this should be added other
forms of energy storage, such as water heater controls, water system reservoir management, and air conditioning thermal storage, which may provide lower-cost means to shape loads to resources and resources to loads.
21 Pomper, 2011, p. 9.
22 Utility rate designs should not create an artificial incentive for complete separation from the grid by small-use customers, potentially triggering a spiral of customer grid defection (e.g., see the discussion of straight fixed/variable pricing later in this paper and Appendix D).
Table 1
Functional Attributes of Storage
Electric energy time shift
Electric supply capacity
Load following
Area regulation
Electric supply reserve capacity
Voltage support
Transmission support
Transmission congestion relief
Transmission and distribution (T&D) upgrade deferral
Substation on-site power
Time-of-use energy cost management
Demand charge management
Electric service reliability
Electric service power quality
Enabling consumers to serve dedicated loads with specific types of resources
Renewable energy time-shift
Renewables capacity firming
Wind generation grid Integration (short-duration discharges)
Wind generation grid integration (long-duration discharges)
tation to the grid will be poorly utilized. If these customers remain grid-connected, their storage can be used not only for their own benefit, but also potentially for broader public benefit. The existence of storage may also make those cus-tomers’ loads available for demand-response programs.
The simplest energy storage technologies are thermal and mechanical storage systems, including:
• Electric water heaters controlled to operate during low-cost hours and hold that hot water for later usage or operated in a coordinated manner to minimize their aggregate load at any point in time, thus reducing system costs and increasing system reliability;
• Ice storage systems to store “cold” to provide air conditioning when needed; and
Source: Pomper, NRRI, 2011

Smart Rate Design for a Smart Future
30
Pedestrian Crossing Signals: Example of Widespread Grid Defection
The earliest economic applications of solar with storage were for remote applications, including military and national park sites where extending grid service was prohibitively expensive.
This has expanded in recent years to low-level uses of power where even a short utility line extension and billing account exceed the cost of a solar panel and battery. For example, tens of thousands of pedestrian crossing signals are being installed in urban areas with this technology, despite being adjacent to grid electric service. Low-wattage LED light bulbs, coupled with cheaper solar panels, make it cost-effective to leave out the cost of a grid connection.
The threshold size at which grid independence makes sense is a function of two interacting costs: the cost of a stand-alone system and the charges that utilities make for grid service. If the fixed charges for grid services rise, the number of applications where grid independence is economical will rise.
Graphic from: www.xwalk.com
• Mechanical storage systems that spin a flywheel, compress air or another vapor, or raise a weight when power is cheap to provide end-use service power at a later time.
Some other types of electricity storage technologies are utility-pumped storage, chemical batteries, and super capacitors. Unfortunately, these types of electricity storage have over recent history been very expensive, ranging from $60/kWh to $860,000/kWh of daily storage capacity depending on the technology.23 However, there is excitement in the storage world that costs may soon be driven down, given the partnership between Tesla cars and Solar City to provide backup systems for PV owners. Because they necessarily come with batteries, EVs represent a potential means of electricity storage for both customers and for the grid as a whole. The limited driving range of the current supply of EVs means they have limited capacity to serve as whole-house backup systems; however, Toyota already sells such a vehicle in Japan, spurred to market after the tsunami of 2011.24 In addition, the development of cheaper battery technology for vehicles will likely be transferred to stationary storage systems for customers and utilities; the recent announcement by Tesla of the residential “Powerwall” battery is an initial step in this direction.25
In 2014, about one out of five household PV systems in Germany was sold with a battery pack, and that is projected to be one in three in 2015.26 Costs are headed down, with Bloomberg New Energy Finance predicting that residential-scale battery storage costs will fall 57 percent by 2020. Lux Research sees the global market for PV systems combined with battery storage growing from the current $200 million a year to $2.8 billion in 2018.27
Although it is relatively inexpensive to install limited storage to mitigate the afternoon and early-evening impact
on utility peak, it is more expensive (though getting cheaper) to install sufficient storage to enable complete disconnection from the grid. Utility rates should be
23 Pomper, 2011, pp. 17-20
24 Carter, M. (2012, June 5). Toyota Develops System that Enables Electric Vehicles To Power Your Home. Inhabitat. Available at: http://inhabitat.com/toyota-develops-system-that-enables-electric-vehicles-to-power-your-home/
25 See Powerwall. Tesla Home Battery. http://www.teslamotors.com/powerwall. A 10 kWh system will be for backup appli-cations will be available in the summer of 2015 for $3,500. It comes with a ten year warranty but installation and invert-er costs are additional. Such a system in Southern California, under a time-differentiated rate design, is estimated to have a five-year payback. Also see: Teslarati. (2015, May 2). A Tesla Powerwall-Powered Home: Will It Pay Off? Available at: http://
www.teslarati.com/tesla-powerwall-home-will-it-pay-off/
26 Deign, J. (2015). German Energy Storage: Not for the Fainthearted. Greentech Media, March 13, 2015. Available at http://www.greentechmedia.com/articles/read/german-ener-gy-storage-not-for-the-faint-hearted. “The cost of combined PV-and-battery systems runs from about €13,000 to €25,000 ($13,800 to $26,600). Batteries make up about 30 percent of the total bill.”
27 Guevara-Stone, L. (2014). Solar City and Tesla shine spotlight on solar-battery systems. GreenBiz, January 16, 2014. Available at: http://www.greenbiz.com/blog/2014/01/16/solarcity-and-tesla-shine-spotlight-solar-battery-systems.

Smart Rate Design for a Smart Future
31
structured to encourage cost-effective storage solutions (e.g., through the use of time-varying rates).
Distributed Ancillary Services
The presence of generation, storage, and smart control technologies at customer premises offers the opportunity for customers to provide a number of valuable functions to the grid. These generally fall into a category termed “ancillary services” and include voltage regulation, power factor control, frequency control, and spinning reserves.28 In addition, where system operators or third-party aggregators have the ability to control end-use
28 Spinning reserves refer to the availability of additional gener-ating resources, which can be called upon within a very short period of time. Different utilities and different utility markets utilize varying response time frames to define spinning reserve services, ranging from instantaneous to up an hour or so.
loads, customer appliances can deliver demand response during high-cost periods or when the grid is at or near its operating capacity and may be at risk for system failures. Demand response, in addition to being an economic response by customers, becomes a form of spinning reserve when placed at the disposal of system operators.

Smart Rate Design for a Smart Future
32
III. Rate Design to Enable “Smart” Technology
Survey of Technology
The traditional electric utility is undergoing fundamental change. Utilities from Maine to California have deployed smart grid upgrades or are beginning the transition to a smarter grid.29
These upgrades promise to deliver an entirely new level of information about system operations and consumer behavior. In short, the information age is coming to the electric industry.30 Computerizing the traditional grid with AMI and advanced SCADA systems will enable the development of new and dynamic rate offerings. Meanwhile, smart home appliances that can automatically respond to prices or be dispatched by system operators or third-party service providers will assist customers in managing their usage and minimize total system costs and increase system reliability.31 These new smart technologies will also help accommodate customer-owned generation, utility-scale renewable power, energy storage (both customer- and utility-scale), electric vehicles, and microgrids.
Various technology enhancements can improve the effectiveness of more complex rate designs, by enabling customers to respond to prices automatically. Some examples include:
• Smart thermostats: Can automatically change heating and cooling settings in response to real-time price changes, while allowing the consumer
to manually override these. The Nest, SilverPAC Silverstat 7 Advanced, and GE Nucleus are examples of thermostats with that capability. Good pricing can be supplemented by good utility or regional wholesale power market entity programs that offer curtailment inducements based on grid value.
• Grid-integrated water heating: Can automatically increase hot water storage during low-cost periods, curtail water heating operation during high-cost periods, and also supply ancillary services to the utility without the consumer even noticing that this is happening. Great River Energy, serving electric cooperatives in Minnesota, is currently demonstrating this potential.32
• Electric vehicle chargers: Can be programmed to provide “economy” charges, allowing the customer to take advantage of low-cost energy when it is available.
• Vehicle-to-grid applications: Can enable EV batteries to flow power back to the grid during critical hours, essentially allowing the grid operator use of the EV batteries and provide a means of compensation to EV owners for supplying the energy.33 A pilot program is underway in Maryland and Delaware to enable vehicle-to-grid service.
Smart MetersSmart meters provide data acquisition, equipment
control and communication capability between the
29 The term “smart grid” is used here broadly to include both utility grid-side and customer investments.
30 Determining whether AMI and smart grid are projected to be cost-effective before deployment is an important consid-eration and one that is beyond the purview of this report. A good discussion on smart grid benefits and costs can be found in Alvarez, P. (2014). Smart Grid Hype & Reality. Wired Group Publishing, Chapters 4-9.
31 PR Newswire (2013, January 8). ComED Launches Smart
Home Showcase Contest. Available at: http://www.prnewswire.com/news-releases/comed-launches-smart-home-showcase-contest-186025412.html
32 Podorson, D. (2014, September 9). Battery Killers: How Water Heaters Have Evolved into Grid-Scale Energy-Storage Devices. E Source White Paper. Available at: http://www.esource.com/ES-WP-18/GIWHs
33 EV World. The V2G Revolution Gets a Textbook [Podcast]. Available at: http://www.evworld.com/article.cfm?story-id=1675

Smart Rate Design for a Smart Future
33
customer and the power grid, plus outage detection and reduced meter reading costs.34 Smart meters are able to record customer usage at a fine timescale and then communicate that information back to the utility and to the customer. This information can, in turn, be used to control end-use appliances in response to price signals and system conditions. When used by system controllers, they can aid in reducing loads during times of system stress, thereby reducing losses on the system and wear and tear on equipment. This will help to avoid system failures and outages. When employed by the customers or on their direct behalf, smart meters can be used to shift usage from high-cost periods to periods when lower cost energy is available.
Smart Meters for Distributed Generation
Customers with PV systems or other on-site grid-interconnected generation or battery storage systems both take power from the grid and deliver power to the grid.
Keeping track of these flows is necessary for accurate billing and crediting of services provided to the grid at different times of the day when the value may be very different. Smart meters have this capability, and are needed when the rate design requires knowing when power is flowing and in which direction, to more accurately value the cost of customer use and the value of customer production. Figure 4 shows the kind of data that a smart meter can record for a home with a PV system; the red shows the total on-site consumption of electricity (including sporadic 4 kW spikes of an electric water heater), and the green shows the production of PV power. Where the green exceeds the red, the customer is a net exporter to the grid. Clearly if the customer is consuming most of its power during off-peak periods, and supplying power mostly during on-peak periods, the solar customer is providing significant value to the grid that is not captured by simple monthly kWh net energy metering (NEM).35
Without smart meters, when utilities disconnect service (move -out, or non-payment), they must send a service person to the premises to lock out the meter. This has a cost, normally recovered through a levy on the individual consumer. Where disconnections are effected for non-payment, it often (depending on regulatory commission rules) involves three site visits, one to post the notice of impending disconnection, one to effect disconnection, and a third to reconnect. The second and third site visits reduce the likelihood of disconnection by providing an opportunity for the consumer to make a payment at the site to avoid disconnection. With smart meters, the disconnection and reconnection can be done remotely. This has an economic benefit, but raises a social equity concern. The challenge is to realize the operational benefit of the remote disconnect and reconnect while maintaining safeguards for vulnerable populations.
Low-income advocates have a concern about this capability, because disconnection can be done without
any site visit, and customers with medical needs, or who have the ability to make a field payment, are disconnected. Some utilities with remote disconnect capability have addressed this by having the site visit performed by a (lower paid and more customer-oriented) customer service agent who is better able to judge an exception or accept field payment, rather than by a (more technically trained) electrical worker. This can provide lower costs and better service than previous approaches, and avoid one or two site visits. In any event, with remote reconnection, it is possible for a customer to phone in a payment, and have service restored immediately. Regulators are becoming aware of both the promise and pitfalls of this remote capability. In some foreign countries, money transfer via prepaid cellular phone systems enables immediate payment even for consumers without credit cards or bank accounts. Further, the charge for of disconnection and reconnection to the consumer should be dramatically reduced to reflect the reduced costs to the utility.
Remote Disconnection and Reconnection: Challenge and Opportunity
34 They also provide operational benefits such as reduced meter reading costs and outage detection.
35 “Net energy metering” is a pricing scheme that “pays” for the output of customer-sited generation at the same rate that the customer pays for energy delivered from the electric system.

Smart Rate Design for a Smart Future
34
Smart Homes and BuildingsSmart homes and buildings are structures in which
end uses such as heating, ventilation and air conditioning (HVAC); water heaters; and lighting systems are controlled by intelligent networks to minimize cost. Smart building end-use appliances may also respond automatically to conditions within the building by providing lighting or space conditioning only when people are present or reducing load in response to price signals received from the grid operator.
Smart AppliancesSmart appliances include the building systems noted
above, as well as such other items as refrigerators, washers and dryers, computers or any other appliance equipped to communicate with smart grid control systems. Some smart appliances will be programmed to act on their own, based on information they can garner from their interconnection to an information system and customer preferences. Others will be controlled by other systems such as home energy management systems or demand response aggregator controls, which gather that information and provide the decision-making software.37
SCADA and Meter Data Management SystemsFrom a system management and operations standpoint,
much of the electric utility system remained unchanged
Figure 4
Bidirectional Flows Measured by a Smart Meter36
5 kW
4 kW
3 kW
2 kW
1 kW
0 kW
12am 3am 6am 9am 12pm 3pm 6pm 9pm 12am
Energy From Grid
Energy to Grid
Power Used
Power Generated
from its early 20th century condition until the introduction of SCADA systems late in the century. SCADA systems enabled grid operators, for the first time, to see how their systems operate at a more granular level and in real or near-real time. The addition of smart meters and other devices, collectively referred to as the “smart grid,” promises to vault the level of sophistication to an even higher level. A key element of any smart grid deployment is the information system that collects data from smart meters and other measurement and control devices and transmits it to the utility. It is also used to communicate back to the customer and, increasingly, directly to customer appliances and third parties such as curtailment service providers.
A meter data management system (MDMS) enables the utility to aggregate the data of individual customers’ usage at the service, transformer, and circuit level, to identify where demand response measures may be valuable, where distribution system upgrades are necessary, and where specific loads such as electric water heaters and electric
36 Courtesy of Convergence Research; the customer-identifying data has been removed to product the consumer’s privacy.
37 Master meter buildings are the scourge of “smart” since the owner is not the user and so preferences can be ignored. They represent an interesting challenge to create programs to help overcome this gap, which may include deploying technology throughout the structure.
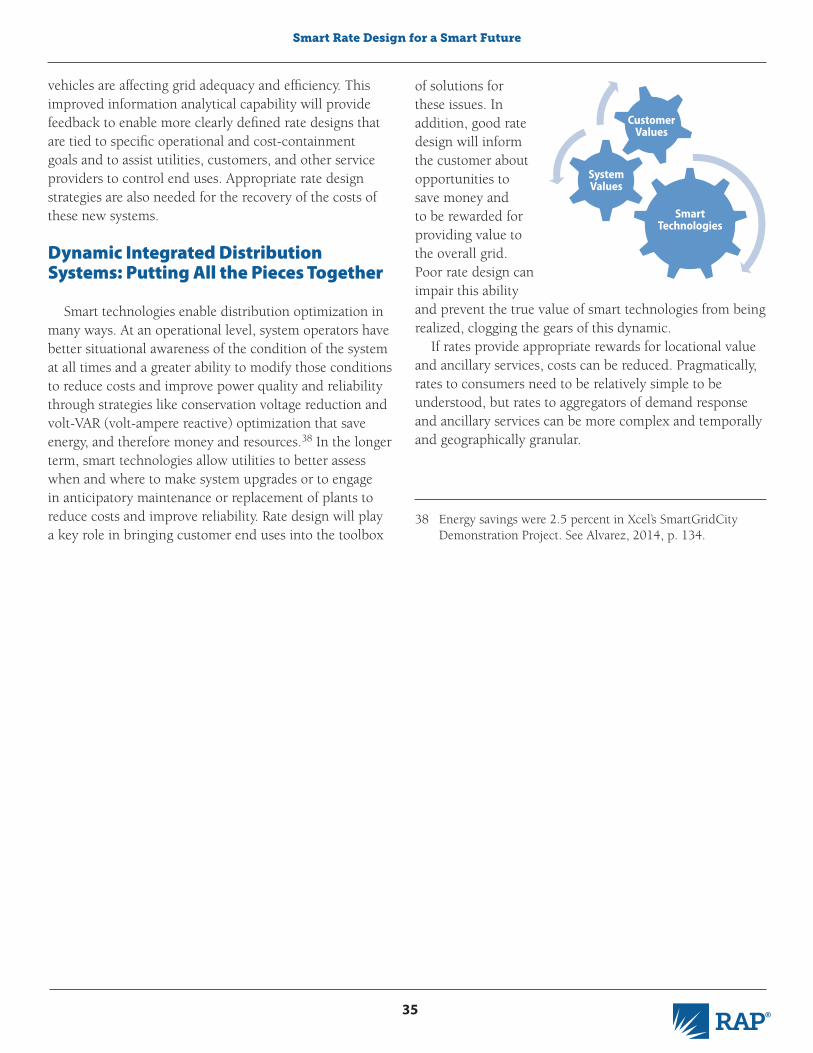
Smart Rate Design for a Smart Future
35
of solutions for these issues. In addition, good rate design will inform the customer about opportunities to save money and to be rewarded for providing value to the overall grid. Poor rate design can impair this ability and prevent the true value of smart technologies from being realized, clogging the gears of this dynamic.
If rates provide appropriate rewards for locational value and ancillary services, costs can be reduced. Pragmatically, rates to consumers need to be relatively simple to be understood, but rates to aggregators of demand response and ancillary services can be more complex and temporally and geographically granular.
vehicles are affecting grid adequacy and efficiency. This improved information analytical capability will provide feedback to enable more clearly defined rate designs that are tied to specific operational and cost-containment goals and to assist utilities, customers, and other service providers to control end uses. Appropriate rate design strategies are also needed for the recovery of the costs of these new systems.
Dynamic Integrated Distribution Systems: Putting All the Pieces Together
Smart technologies enable distribution optimization in many ways. At an operational level, system operators have better situational awareness of the condition of the system at all times and a greater ability to modify those conditions to reduce costs and improve power quality and reliability through strategies like conservation voltage reduction and volt-VAR (volt-ampere reactive) optimization that save energy, and therefore money and resources.38 In the longer term, smart technologies allow utilities to better assess when and where to make system upgrades or to engage in anticipatory maintenance or replacement of plants to reduce costs and improve reliability. Rate design will play a key role in bringing customer end uses into the toolbox
38 Energy savings were 2.5 percent in Xcel’s SmartGridCity Demonstration Project. See Alvarez, 2014, p. 134.
Customer Values
System Values
SmartTechnologies

Smart Rate Design for a Smart Future
36
IV. Rate Design Principles and Solutions
Traditional Principles
The design of rates begins with a functional evaluation of the costs incurred by the utility to provide service to its customers. A foundational notion of rate design is to charge customers in
relation to the costs incurred to serve them. A critical step is the allocation of costs among different customer classes — residential, commercial, industrial, and others. Customer cost allocations determine what piece of the utility revenue requirement pie a specific class will be charged. In reaching a cost allocation determination, regulators usually will consider different approaches (embedded cost vs. marginal cost, single peak hour or multiple peak hours,39 etc.) and review different cost of service studies. The end result is often some blend of the different approaches that hopefully match the overarching priorities of the state. Given the judgment involved, no single approach can be said to be “correct”; rate making is partly science and partly art. Appendix A of this paper “Dividing the Pie,” addresses these ideas in more detail.40
Rate design involves the definition, allocation, and recovery of customer costs, distribution costs, power supply and transmission costs, and other general costs incurred by the utility to provide service to customers.
Customer CostsRate design necessarily involves tying cost causation
to the type of price used to recover that cost. A simple example would be the use of a per-kWh charge for fuel costs, which reflects the fact that, as more kWhs are consumed, more fuel is consumed. In the case of customer costs, the inquiry focuses on those costs that vary with the number of customers served. This includes such costs as metering, billing and collection, and customer assistance. These costs are always quite small, typically amounting to no more than $5 to $10 a month per residential consumer.
The fixed charge for residential or commercial service should not exceed the customer-specific costs attributable to an incremental consumer. For urban and suburban
residential consumers, this is the cost of a service drop, the portion of the meter cost directly related to billing for usage, plus the cost of periodic (monthly, bimonthly, or quarterly) billing and collection. Monthly billing is usually desirable, because with less frequent billing customer bills become large and potentially unmanageable. However, the size of the bills is driven by usage levels, not merely a cost of connecting to the system; thus, even the cost of billing has a usage-related component, which should be recovered in volumetric prices.
AMI enables a wide array of functions unassociated with metering or billing and collection. The role of AMI in peak load reduction, energy efficiency, system operations and reliability, and other functions of the utility clearly establish that smart meter costs do not belong exclusively in the category of customer-related costs. The incremental cost of smart meters, above and beyond what would have to be spent for older style meters, should be recovered through the same pricing mechanisms used to recover other costs associated with those other functions, and a portion of the net benefit that smart meters provides should be applied to reduce customer-related costs. If regulators treat smart meter costs in the same manner as traditional meters — apportioning the costs on a per-customer basis — they are ignoring a cost-follows-benefit principle.
Other cost minimization strategies may be applied to billing as well. Many banks, brokerages, and other businesses offer a discount to customers that choose electronic billing and auto-payment options; the same discounts may be extended to customers of utilities, helping to reduce the monthly billing-related cost of electricity services that is often reflected in customer charges.
39 Coincident peak (CP) is a measure of peak demand that can be as narrow as the highest single hour (1CP), the average of the four summer monthly peaks (4CP) or the average of 12 monthly system peak hours (12CP).
40 Appendix A explores how the assumptions made in the cost-allocation process can influence rate design decisions.

Smart Rate Design for a Smart Future
37
Distribution CostsThe basic distribution infrastructure — poles, wires,
and transformers, plus associated maintenance costs — comprises approximately one-quarter of the revenue requirement for the typical electric utility. Although many utilities view these as “fixed costs,” in the long run all costs are variable. Customer usage levels may change dramatically over time and there may be operational alternatives increasingly available such as on-site generation and storage. With the experienced and anticipated reduction in cost for these alternatives, the likelihood of their deployment and use will only increase, making possible the deferral or avoidance of distribution infrastructure investment. At the same time, as customer usage grows within any portion of the distribution system, upgrades and expansions will be required, resulting in greater capital and operating costs. Accordingly, it is important to recover distribution costs on the basis of the end-use consumption and, only where DG penetration is very high, consider specific additional investment in distribution facilities.
Flat Rates The simplest form of rate design is the flat rate, which
is derived by simply dividing the revenue requirement for a given class of customers by the kilowatt-hour sales, and charges a purely volumetric price.
A very important principle of rate design is to align the incremental price for incremental consumption with long-run incremental costs, including societal costs. As discussed earlier, this means that a price reflects the cost of a new renewable energy resource (or a conventional resource plus full environmental damage costs), plus the transmission, distribution, and other utility services needed to deliver that to a consumer.41 Use of short-run costs, dispatch modeling, or a non-renewable resource as the basis for “incremental cost” is inappropriate and misleading to the consumer and society because it fails to recognize the real costs associated with plant investment and resource choices, many of which have long-term consequences on the order of a half-century or more. The issue of whether societal costs are recovered in the utility revenue requirement is immaterial to setting the incremental price correctly to guide efficient consumer response. This is one reason many utility regulators have implemented inclining
41 The alternative to using a renewable resource as the bench-mark would be to include conventional resources plus the monetized cost of societal impacts; since this is unknowable, the prudent alternative is to use an emissions-free resource as the benchmark.
42 Individual peak demands measured in this manner are typically referred to as non-coincident peaks.
block rates — to reflect both utility costs and societal costs in the incremental price per kilowatt-hour.
Demand ChargesDemand charges are sometimes used to recover the non-
fuel costs of generation, transmission, and distribution of large commercial and industrial customers. These demand charges have typically been applied to the individual peak demand of each consumer, regardless of whether it occurs during system peak periods.42
Table 2
Typical Commercial Rate with a Demand Charge
Rate Element Illustrative Rate How Applied
Customer Charge $10/mo Independent of usage
Demand Charge $10/kW Customer’s highest 1-hour usage per month
Energy Charge $.10/kWh All kWh
It is generally agreed that demand or capacity-related costs, to the extent they occur on a system, are primarily associated with the system peak demand, not the individual customer peak demand. Only very local components of the distribution system (service drop, line transformer) are sized to the individual customer load.
Because traditional demand charges are measured on the basis of the individual customer’s peak, regardless of whether it coincides with the peaks on any portion of the system, this approach results in a mismatch between the system coincident peak costs used to set prices and the actual costs incurred at the time of the customer’s non-coincident peak. While the revenue to be collected is represented by the system coincident peak costs, the billing units used to set the prices are the sum of all customers’ individual non-coincident peaks. This results in a lower demand charge for everyone, but has the effect of requiring customers who are not contributing proportionately to the system peak to bear a greater share, while those who are contributing to the system peak bear a lesser share of

Smart Rate Design for a Smart Future
38
revenue responsibility than would occur if demand charges were based on usage during the system coincident peak.
A demand “ratchet” is a rate element that requires a customer to pay a demand charge in every month that is based on their highest usage during the year, often based on summer peak demand. These provide stable revenues to utilities, but discourage energy efficiency throughout the year, since a significant part of the cost of service is fixed and the savings from peak load reduction from energy efficiency are not realized until the ratchet period has been completed. This also has the effect of aggravating the mismatch between on-peak costs and on-peak usage, noted above.
Power Supply CostsPower supply costs include the investment-related
capital costs of power plants and transmission costs, fuel and purchased power costs, and generation and transmission operations and maintenance (O&M). In the past, many of these, such as capital costs and purchased power demand charges, were treated as demand-related costs, allocated to each customer class on a measure of demand (typically class contribution to system coincident peak, average demand, or a combination of the two). These may be reflected in individual customer demand charges, based on individual customer peak usage (not necessarily coincident to the system peak) for large-use (i.e., commercial and industrial) customers, or, preferably, in time-of-use (TOU) energy charges.
Fuel and purchased power costs, most of which were treated as energy-related costs, are typically allocated among the classes on a measure of total energy consumed (annual, seasonal, or time-varying). For electric utilities, as in other industries, capital costs, on the one hand, and short-run incremental unit costs (e.g., fuel and purchased power costs), on the other, are substitutes. A capital-intensive generating resource like wind, solar, or nuclear displaces fuel costs, typically gas or coal; a local resource like a combustion turbine displaces the need for transmission.
Likewise, a market mechanism that pays customers to reduce demand during high price periods or when the system is under stress displaces the need for generation, transmission, and distribution to meet short-term peaking requirements. In restructured and competitive wholesale power markets, however, the power supply costs discussed above in this section are nearly all recovered on a time-varying energy basis. A small portion may be recovered in capacity payments, but experience in the PJM and ISO-NE
regions shows that, where allowed to compete, demand response potential quickly bids down the prices for short-duration capacity.
Principles for Rate Design in the Wake of Change
Good rate design should work in concert with the industry’s clean technological innovations and institutional changes. Accomplishing this requires the application of well-established principles to inform the design of rates that promote economic efficiency, equity, and utility revenue recovery. This will be critical in a future characterized by significant customer-side resource investment and smart technology deployment. The advantages of a state that embraces these efficiency, equity, and utility revenue adequacy goals are significant, especially in maintaining a state’s competitiveness and promoting customer choice and ingenuity. Unleashing the potential of new technologies will also require consideration of changing stakeholder interests as the power sector evolves.
Best practice rate design solutions should balance the goals of:
• Assuring recovery of prudently incurred utility costs; • Maintaining grid reliability; • Assuring fairness to all customer classes and sub-
classes; • Assisting the transition of the industry to a clean
energy future;• Setting economically efficient prices that are forward-
looking and lead to the optimum allocation of utility and customer resources;
• Maximizing the value and effectiveness of new technologies as they become available and are deployed on, or alongside, the electric system; and
• Preventing anti-competitive or anti-innovation market structures or behavior.
Stakeholder InterestsFinding common ground on rate design among utilities,
consumer advocates, environmental advocates, and others is not easy. The interests are different, the perspectives are different, and even the perceived public policy goals are viewed differently by different parties.
Utility InterestsUtilities tend to see costs associated with generating plant,
transmission, distribution, and customer billing as “fixed

Smart Rate Design for a Smart Future
39
costs” and generally seek a reliable method for assuring their recovery. Recently, a number of utilities have sought to recover these costs through fixed charges or demand charges, asserting that “fixed costs” should be recovered through “fixed charges.” The use of high fixed charges is one avenue being pursued to provide revenue stability to the utility, in-dependent of sales volumes and independent of whether the customer deploys energy efficiency or distributed generation.
Utilities seeking high fixed charges argue that the per-customer responsibility for distribution service is fully independent of sales volumes to the customer, because all customers must use the distribution network and should share equally in distribution system costs. In this view, when solar customers reduce their usage of grid-supplied power, their responsibility for distribution cost recovery is undiminished. They perceive that if solar customers do not pay these costs, then the burden falls either on other electric consumers (after a rate case or decoupling adjustment) or on utility shareholders.43 From the perspective of other customers, this is no different than the earnings effect from customers who reduce their usage through conservation, energy efficiency, or departure from the system. On growing systems in the South and West, most of these reductions in cost recovery are offset by overall growth in the number of customers served by the utility.
That said, no rate design can get around the basic constraint that the costs of service can only be allocated among existing customers and across their collective usage, unless the regulator finds that a portion of these costs should be disallowed from the revenue requirement. In low- or negative-growth states, this can create a schism between consumers pursuing efficiency and renewable energy sources and consumers who obtain all of their power from the grid. The issues surrounding the use of high fixed charges may have more to do with the adverse impact on low-use customers (who are often lower-income or live in urban areas or in apartments) and anti-competitive effects on competing generating resources (e.g., customer-owned DG), than recovery of costs by the utility.
Later on in this paper (see “Utility-Defensive Rate Design Principles”), as well as in Appendix D, we discuss why the use of high fixed charges may be a problematic strategy in the long run compared with alternatives. Both the telephone and cable television markets have imposed higher fixed charges. Both have seen significant customer and revenue attrition as customers have moved to competitive and volumetric alternatives. Similar results may be expected for electric utilities that employ this approach.
43 A case can be made that utility shareholders are only affected during the period between the reduction in sales to solar customers and the implementation of new rates after the utility’s next rate case or potentially through a decoupling mechanism, depending on how it is structured.
44 Data from Federal Communications Commission
45 Although, in some states, consumer bills look more like long-running scorecards for regulatory battles between the utility and ratepayer advocate, showing special charges for utility victories and special credits for ratepayer advocate victories. See, for example, a residential bill from any of the large utilities in California. As a result, the consumer is often left with a clouded understanding of the prices being charged for energy and a reduced ability to respond appropriately.
Consumer InterestsConsumers and their advocates come in many varieties.
State consumer advocates may sometimes have different perspectives from low-income advocates. State consumer
200,000
150,000
100,000
50,000
0
ILE
C A
cces
s L
ines
(F
CC
For
m 4
77)
1999 2002 2004 2007 2010 2012
How Did High Fixed Charges Work Out for the Landline Phone Companies?44
80
60
40
20
0 1990 1993 1996 1999 2002 2005 2008 2011 2014
How About Cable TV? Cable TV Subscribers in the U.S.
advocates are generally focused on minimizing the utility revenue requirement, and minimizing utility rate increases for all customers. They tend to favor a flat rate, and the plethora of bill riders utilized by some utilities is anathema to them.45 Nonprofit consumer advocates mostly (but not

Smart Rate Design for a Smart Future
40
always) have a pro-environment perspective. Low-income advocates may perceive their clients to be “have-nots” in the drive for distributed energy and smart technology who are adversely impacted when households with more disposable income choose to invest in solar energy or smart appliances. Their focus is on affordability for the most vulnerable populations. Occasionally, interest groups representing large-use residential consumers form, and they typically have a very different perspective than other consumer advocates.
Rate design that favors energy efficiency and renewable energy helps to minimize the overall utility revenue requirement, but may also result in higher per-kWh prices as distribution costs are spread across lower sales levels. Most consumer advocates will favor rate design with low fixed charges, to ensure universal service and protect low-use customers.
Low-income advocates have generally also favored rate designs with low fixed charges and inclining blocks, recognizing that the majority of low-income consumers will benefit. They raise skepticism about default or mandatory TOU pricing,46 because some low-income families have little ability to shift consumption. However, they are also concerned about high-use low-income households. Part of the challenge is that the construction of these households and their appliances is generally less efficient. That has been and can continue to be addressed through energy-efficiency programs and in some states through discounted rates for low-income consumers. Part of the problem is that reaching all low-income households through energy efficiency and weatherization will take years to accomplish given the funding available and the large number of homes in need.
Further, the needs of large families, often multi-generational, sharing dwellings due to the high cost of housing are more challenging to address within rate design, except by designing rates to favor high-use consumers or by designating a customized customer baseline within an inclining block rate design. California does this for electric
and gas rates by defining housing types and climate zones and setting differential baselines; some water utilities allow customers with large families or medical needs to apply for a higher baseline allowance, and this approach could be applied to electricity.47
Large industrial energy user advocates often prefer rate designs with higher fixed charges and low volumetric energy rates, because this minimizes their bills given their high-volume 24/7 usage. Many often seek “economic development” discounts. They engage in DR where profitable and seek to opt out of utility energy efficiency programs. This group also tends to voice concerns about the costs of RPS.
Solar InterestsThe solar industry now employs more people than
the coal or nuclear industry in the United States and is not a trivial interest.48 Falling costs for PV have resulted in a surge of customer-sited PV systems. This industry is growing and regulators will be forced to grapple with the impact of solar installations on the utilities they regulate and the customers they are charged with protecting. With respect to rate design, regulators should assure that solar technology is fairly treated, while addressing the concerns of utilities and other customers.
The customer-sited solar industry has an interest in ensuring that their access to customers is unrestricted, and that those customers get the maximum economic value from an investment in solar energy. Industry representatives see pricing that recovers production or distribution costs in fixed charges as anti-competitive behavior and an unacceptable deployment of monopoly pricing power that utility regulation was created to prevent. This group favors traditional net metering, low customer charges, and inclining block rate designs that align the end block of rates with the long-run societal cost of power (including environmental, risk, and other costs). They also favor feed-in tariffs (FITs), RPS with solar carve-outs, and value of solar tariffs (VOSTs). Current research into the actual value
46 “Default” TOU pricing refers to the introduction of TOU rates for a customer class and automatically putting all customers in the class on the new rate, but allowing them to opt out. This is as opposed to offering the rate on an opt-in basis, which requires action on the part of the customer to begin using TOU rates.
47 Brown, J.M. (2014). Hundreds request more water amid Santa Cruz rationing. Santa Cruz Sentinel, May 17, 2014. Available at: http://www.santacruzsentinel.com/general-news/20140517/hundreds-request-more-water-amid-santa-cruz-rationing
48 Korosek, K. (2015). In U.S, there are twice as many solar workers as coal miners. Fortune, January 16, 2015. Available at: http://fortune.com/2015/01/16/solar-jobs-report-2014/
Smart Rate Design for a Smart Future
41
of solar to customers who deploy it, as well as the value to other customers, tends to support the conclusion that the value of solar equals or exceeds the “payment” to customers realized through NEM.49
However, solar vendors that focus on the utility-scale solar installation market may see things a little differently. They may benefit from actions that discourage rooftop solar installation in favor of central station solar facilities. To the extent that the grid has limited flexibility to accept variable power, their interests are harmed when penetration of rooftop solar begins to affect the operation of the grid. As long as the system has constraints on the overall level of intermittent resources, distributed solar and central station solar interests will potentially be in competition with one another.
Unregulated Power Plant Owner InterestsIndependent power plant (IPP) owners with coal or
nuclear resources are threatened by the deployment of competing generation resources, whether they are central-station renewables or distributed renewables. The presence of these resources depresses power prices in the middle of the day50 and, depending on whether theirs is the marginal generating unit at the time, may displace the utility’s own generation. This tends to make the market favor flexible resources, such as gas turbines, that can ramp up sharply in the afternoon when the solar day ends. IPPs also have a negative view of energy efficiency and DR, as these resources tend to reduce prices in both the wholesale energy and capacity markets.51 Conversely, unregulated owners of flexible generation may welcome the deployment of variable renewable energy resources, especially if the flexibility of their plants is valued and monetized.
Societal InterestsSocietal interests encompass the interests of all of the
market participants, including those identified above, plus all non-market participants and interests. Society as a whole values overall economic efficiency. Societal interests also
include all environmental impacts of the electric system, including carbon dioxide and criteria pollution emissions, and also other impacts such as fuel cost risk, fuel supply risk, the value of a diversified portfolio of resources, the economic development value of stimulating new resource development, efficient utilization of natural and societal resources, health impacts, health costs, and other factors.
The regulator accepting the charge of “regulating in the public interest” considers all of these values. They may in some instances be legally constrained from monetizing all of these in resource procurement decisions, but even then, the presence of societal interests should be identified and recognized so that legislatures and courts are aware of the constraints they have imposed and the increased costs that are incurred or benefits that are not realized when these values are not monetized.
Resource Value CharacteristicsA good illustration of the different values of system
resources may be found in a 2012 decision of the Vermont Public Service Board.
Figure 5 shows the multitude of measurable values of energy efficiency. These are separated into those that are typically reflected in the utility revenue requirement and those that are not, while highlighting those that vary in the short run: energy, line losses, and avoided reserves. Relatively few regulators consider risk (fuel supply risk and fuel cost risk), or difficult-to-quantify non-energy benefits (DTQNEB) in the conservation program valuation process, and most do not consider avoided water, sewer, natural gas, propane, or heating oil savings. All of these are important elements of the total value stream that electricity efficiency investments help procure.
In the context of this graphic, consumer interests reflected in utility tariff rates are in the lower portion of the graph. Utility interests, in the short run, will focus only on those items that vary in the short run; owners of unregulated generating units may share that short-run interest. Societal interests include the entire range. Rooftop
49 See, for example, Minnesota’s VOST methodology at http://mn.gov/commerce/energy/businesses/energy-leg-initiatives/value-of-solar-tariff-methodology%20.jsp or Maine’s at http://www.synapse-energy.com/project/value-distributed-so-lar-maine
50 Power prices from competitive generation can also be affect-ed at night. For example, high winds blowing in the middle
of the night can lead to negative prices.
51 Litvak, A. (2014). FirstEnergy says demand response putting power plants out of business. Pittsburgh Post-Gazette, November 25, 2014. Available at: http://powersource.post-gazette.com/powersource/policy-powersource/2014/11/25/FirstEnergy-says-demand-response-putting-powerplants-out-of-business/stories/201411250013

Smart Rate Design for a Smart Future
42
solar installers will want to embrace the entire range, while central-station solar developers will want to consider the entire group of costs at the top of the graphic —those that are not included in the utility revenue requirement as values of their product. However, they may not consider distribution costs for the utility, as their product does not displace these.
Principles Specific to Customer-Sited Solar Rate Design
Rate design for solar customers should adhere to the following refinements within the three basic principles of rate design discussed previously:
• Principle 1: A customer should be able to connect to the grid for no more than the cost of connecting to the grid. Only customer-specific costs should be applied to the bill for the privilege of connecting to the grid and accessing grid services. • The only truly customer-specific
costs, which vary with the number of customers on a typical urban/suburban electric grid, are service drops, meters, and billing services. The grid itself does not change with the number of customers connected to it.
• If a customer is already connected to the grid and then invests in a PV system, then a one-time cost-based fee may be appropriate to process the net metering and interconnection agreement and to inspect the installation if required. The rationale for this principle is discussed at length in Appendix D.
• Principle 2: Customers should pay for grid services and power supply in proportion to how much they use these services, how much power they consume, and when they consume this power. Nearly all utility services should be priced volumetrically, but may vary by time of day, season of year, and by voltage level (customers only pay for the portions of the distribution system that serves them).• The cost for use of the distribution grid should
be charged in relation to customer purchases of energy and not for customer-generated energy delivered to the grid. Customer-owned generation should be treated in the same manner as other generators who supply energy to the grid.
Accepted market practice is to charge consuming customers for use of the distribution system, rather than generators. High-voltage transmission rates are sometimes borne by generators seeking to sell their product to a specific utility at a specific point of delivery.
• Time-varying rates are appropriate in both directions. Utility time-differentiated rate designs should treat DG customers in a symmetrical manner. If DG produces “valuable daytime power,” the customers installing DG should reap that benefit through higher remuneration and likewise, if DG customers require “valuable ramping period” power, DG customers should pay higher bills for that at the same rate charged to other users at that time. Smart meters with bidirectional capability enable the utility to offer time-differentiated TOU and critical peak pricing (CPP) rates to their customer base. DG and non-DG customers who subscribe to those types of rates will be paying a more cost-based rate and therefore there is less chance for inappropriate apportionment among customers. It may also be appropriate to require
Figure 5
Benefits of Energy Efficiency, Separated By Type of Benefit
Updated Externality and NEB Values, $/MWh
$180
$160
$140
$120
$100
$80
$60
$40
$20
$0
Risk
DTQ NEB
Other Fuel
O&M
Other Resources
Externalities
Avoided Resources
Line Losses
Distribution Capacity
Transmission Capacity
Capacity
Energy
Included in Utility
Revenue Requirement
Vary for Utility in Short-Run with Change in Usage
Not included in Utility Revenue
Requirement
Created with assistance from Efficiency Vermont, based upon data from their annual reports and
personal communications.

Smart Rate Design for a Smart Future
43
that DG customers be on a TOU rate so that what they pay for energy and what they receive in compensation more accurately reflects the utility’s true costs.
• The presence of high levels of solar on a utility system may dramatically suppress the on-peak period prices that affect most utility systems during afternoon hours. If the time-varying pricing is changed to reflect this, the net effect is that non-solar customers receive lower afternoon prices as a result of solar customer investments, while solar customers receive less in the form of avoided payments to the utility. When pricing solar on a “value” basis, some of the benefits from the price reductions should continue to flow to the solar producers in recognition of the fact that it is their continued presence that creates this value for all customers.
• The PV customer should pay for power supply and distribution service at non-discriminatory rates for all power received from the grid. When PV customers are drawing power from the grid they should pay for power supply and distribution service, and any other generation costs, at the same price as non-PV customers. Until TOU rates are universal, a good temporary approach would be to place all solar customers on a TOU rate that has the same fixed charges applied to non-TOU customers. This would ensure that solar customers pay the full costs of power supply and grid services they receive.
• The only component of the distribution system that is sized to the individual demands of the individual customer is the final line transformer. Although these need to be sized to the maximum level of usage (in either direction) for a DG customer, this is a very small component of the total distribution system cost. DG customers seldom require more capacity to feed power to the system than they require for their night-time consumption.
• Recovery of distribution costs as customer usage profiles change. At the distribution level, the overwhelming majority of utility regulators have allowed distribution costs no longer being paid by consumers who generate power on-site to be recovered from remaining (and new) sales. As a practical matter, recovery of these costs across the reduced usage caused by distributed generation is
no different than the recovery of newly installed distribution facilities that temporarily represent excess capacity or reductions in revenues associated with customers who reduce usage through energy efficiency, conservation, or by terminating service altogether. In all these cases, traditional cost allocation methodologies, based as they are on customer usage at any given point in time, reflect the dynamic nature of the electric system and of its utilization by customers and have always been considered “fair” at any such point in time.
Some participants in the regulatory process have portrayed PV as unfairly shifting costs to other customers or of utilizing the system in some way without paying for it. This is a misapplication of rate design and cost recovery principles and practice, which have never charged generators for use of the distribution system, as well as accepted cost allocation methods that are themselves dynamic in nature. It also mischaracterizes how and when DG customers use the distribution system, incorrectly equating injection of energy into the system with deliveries taken from the system. In truth, at any given point in time, only those customers who are taking energy from the distribution system are using that system. When injecting energy into the system, DG customers are not using the distribution system any more than a remote central-station generator is using the system — that is, not at all. In fact, when energy is injected into the distribution system at the customer’s location, energy losses in that system actually go down and the net effect is a negative cost — i.e., a benefit — from the presence of the DG.
• Principle 3: Customers that supply power to the grid should be fairly compensated for the full value of the power they supply. Prices paid, or amounts credited for customer generation, must consider avoided production, transmission, distribution, environmental benefits, losses, reserves, fuel cost and fuel supply risk, and other avoided costs that their power supply may provide to the public. For some utilities, this will be more than the retail rate, and for others, it will be less.• DG customers should be free from
discrimination. Most state statutes have provisions prohibiting discrimination among and within classifications of customers. DG customers should be accorded the same protection. Fixed or other non-economically based charges should not be imposed on DG customers. Any cost

Smart Rate Design for a Smart Future
44
imposed on a DG customer should be based on a real cost to the utility system resulting from the DG, net of cost savings resulting from the DG. Just as customers who install efficient LED lighting in their homes to reduce their bills are not charged individually for the energy they do not consume, neither should solar customers who displace their purchases with solar generation.
• NEM is a reasonable proxy for the value of solar in the absence of better information. Solar power delivered to the grid at the distribution level is a superior product with higher value than generic “grid power” due to locational and environmental characteristics. These benefits must be considered in determining the proper fair compensation to the PV customer supplying power to the grid. In the absence of a VOST or of data on the various values of solar, it is appropriate to continue the use of NEM as a proxy for those values. It is unlikely that this will overcompensate DG customers and likely that it will still send sufficient price signals to the customer to make economic choices about whether to install DG or not.
Current and Emerging Rate Design ProposalsMany alternatives have been suggested for future rate
design applications from sources as divergent as the Edison Electric Institute and the Rocky Mountain Institute. Most recent rate design studies emphasize the need for time-varying pricing and for some form of demand-response pricing. At the same time, stakeholders currently face a legacy system of non-TOU rates that are either flat across all usage levels or are designed with increasing or decreasing prices for increasing amounts of consumption (“inclining block rates” and “declining block rates” respectively). They may also include demand charges in addition to energy charges (typically for commercial and industrial users and in rare instances for high-use residential customers), although various types of TOU rates have been used.
Traditional Rate Designs
Time-Differentiated PricingIt is hard to envision an electric system future without
greater utilization of time-differentiated pricing. Because the underlying costs of providing electricity vary hourly and seasonally, it is impossible for the customer to see an appropriate price signal without that signal also varying
over time. As smart technologies take hold, the connection between customer usage patterns and underlying costs will become apparent. As this happens, it is inevitable that time-differentiated pricing will become more widespread. A number of time-differentiated rates have already been utilized by utilities and are outlined below. Their importance as part of a best practices approach to rate design is discussed in the following pages (see “Best-Practice Rate Design Solutions”).
Time-of-Use RatesTOU rates have been in use for some time in the United
States. These rates typically define a multi-hour time of the day as “on-peak” period, during which prices are higher than during “off-peak” hours. In most cases, on-peak periods are limited to weekdays. Some TOU rates also include a “shoulder” rate for usage occurring between on-peak and off-peak periods. In some cases, they are limited to summer or winter periods and are not applied during spring and fall periods when overall loads on the system are not as high. TOU rates require the use of a more advanced meter (i.e., an “interval” meter that can report usage for specific periods of time) than is typical for non-TOU customers. Today’s advanced smart meters can also provide this function at yet a more temporally granular level.
TOU rates are common, and often required, for commercial and industrial customers of all sizes. For residential customers, they are in most cases optional if they are offered at all.
TOU rates are an improvement over flat or inclining block rates because they offer some correlation between the temporally changing costs of providing energy and the customer’s actual consumption of energy. However, they are usually not dynamic in the sense of capturing the real underlying changes of costs from hour to hour, day to day, or season to season. If the high-cost hours cover too much of the day, however, customers may not be able to adjust their usage to adapt. Concentrating peak-related charges into as few hours as possible produces a better customer response and actually tracks closer to underlying increased costs, which are, themselves, concentrated into relatively few hours of the day and year.
Critical Peak Pricing and Peak-Time RebateCritical peak pricing (CPP) and its common variant
peak-time rebate (PTR) are a more dynamic variation on the TOU concept. Under CPP, prices during specific “critical peak periods” are set at much higher prices.

Smart Rate Design for a Smart Future
45
Typically, under CPP, the customer agrees to pay the high price during a short (e.g., three-hour) period on a few declared “critical peak days” of the year. There is usually a maximum number of days (and total hours) that can be declared as critical — often three or four hours per day, ten to 12 days per year, or less than 1 percent of the hours of the year. Those days may also be limited to the on-peak season, usually summer or winter, depending on when the utility experiences its overall system peak. The customer is given some advance notice of critical peak days, usually a day in advance. CPP is designed to produce a response — to get customers to reduce loads during critical peak periods. The CPP has been largely successful. To date, CPP rates have been voluntary opt-in rate forms, but evidence supports setting these as default rates for large groups of consumers.
A closely related variant to CPP is the PTR. Under the PTR concept, rather than charging customers an elevated critical peak price, customers are given a large credit on their bills if they can reduce usage during a peak-time event. This requires the identification and quantification of what the customer’s usage would have been (i.e., a baseline) in the absence of the usage reduction. PTR is distinguishable from a CPP in that it is a voluntary program. Failure to participate does not result in any penalty, but the customer pays a slightly higher rate to which credits are applied.55 Table 3 compares the two approaches.
Just as in the case of TOU, CPP and PTR both require the use of an interval meter or a smart meter.
Real-Time PricingReal-time pricing (RTP) charges the customer the actual
prices being set in wholesale markets (for utilities that are
55 A recent US DOE study reports that average peak demand reductions for customers taking service on critical peak pricing (CPP) rates were almost twice the size (21 percent) than they were for customers participating in critical peak rebate (CPR) programs (11 percent). However, when automated controls were provided, peak demand reductions were about the same (30 percent for CPP and 29 percent for CPR). See: US DOE. (2015). Interim Report on Customer Acceptance Retention, and Response to Time-Based Rates from the Consumer Behavior Studies. Smart Grid Investment Grant
Program. Available at: http://energy.gov/oe/downloads/interim-report-customer-acceptance-retention-and-response-time-based-rates-consumer
56 New Jersey has a pure RTP for their largest customers (i.e., hourly price based on integrated average of the past hour zonal LMP in PJM’s spot market). This is different than other applications of RTP, which are predicated on system lambda or LMP out of unit commitment algorithms that are run a day-ahead.
Table 3
CPP and PTR Rate Illustrations
Critical Peak Pricing
CPP uses pricing to set the consumer price for consumption during critical peak events.
The baseline rate is lower, and customer is charges a very high price for usage in these events.
Illustrative Rate Customer Charge: $5.00/mo
Off-Peak Usage: $.08/kWh
On-Peak Usage: $.15/kWh
Critical Usage: $.75/kWh
Peak-Time Rebates
PRT uses customer rewards (discounts) for curtailing usage during critical peak events.
The baseline rate is higher than for CPP, but the customer receives a credit for reducing usage in these events.
Illustrative Rate Customer Charge: $5.00/mo
Off-Peak Usage: $.09/kWh
On-Peak Usage: $.17/kWh
Critical Usage: -$.75/kWh
not vertically integrated) or short-run marginal generation costs (for vertically integrated utilities) as they vary hour by hour.56 Prior to the introduction of smart technologies, only the largest customers would typically be on RTP, as it usually requires either a trained, often-dedicated, employee or a third-party service provider to constantly monitor prices and manage load in order for the customer to take advantage of this type of pricing. As newer smart technologies take hold, some form of RTP may expand to other customers who have smart appliances that can monitor prices automatically, respond accordingly, and monetize the benefits.
Feed-In Tariffs and Value of Solar TariffsSeveral jurisdictions have adopted special pricing for
compensation of solar customers for the power supplied to the grid by these systems.
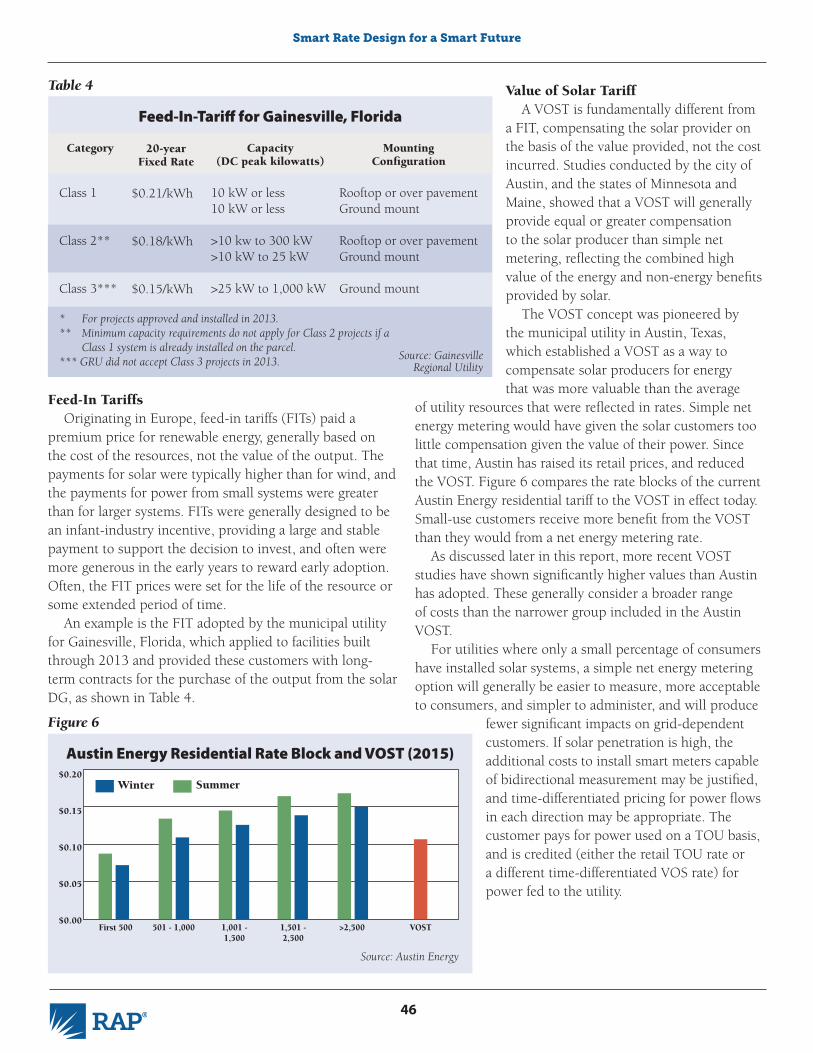
Smart Rate Design for a Smart Future
46
Feed-In TariffsOriginating in Europe, feed-in tariffs (FITs) paid a
premium price for renewable energy, generally based on the cost of the resources, not the value of the output. The payments for solar were typically higher than for wind, and the payments for power from small systems were greater than for larger systems. FITs were generally designed to be an infant-industry incentive, providing a large and stable payment to support the decision to invest, and often were more generous in the early years to reward early adoption. Often, the FIT prices were set for the life of the resource or some extended period of time.
An example is the FIT adopted by the municipal utility for Gainesville, Florida, which applied to facilities built through 2013 and provided these customers with long-term contracts for the purchase of the output from the solar DG, as shown in Table 4.
Value of Solar TariffA VOST is fundamentally different from
a FIT, compensating the solar provider on the basis of the value provided, not the cost incurred. Studies conducted by the city of Austin, and the states of Minnesota and Maine, showed that a VOST will generally provide equal or greater compensation to the solar producer than simple net metering, reflecting the combined high value of the energy and non-energy benefits provided by solar.
The VOST concept was pioneered by the municipal utility in Austin, Texas, which established a VOST as a way to compensate solar producers for energy that was more valuable than the average
of utility resources that were reflected in rates. Simple net energy metering would have given the solar customers too little compensation given the value of their power. Since that time, Austin has raised its retail prices, and reduced the VOST. Figure 6 compares the rate blocks of the current Austin Energy residential tariff to the VOST in effect today. Small-use customers receive more benefit from the VOST than they would from a net energy metering rate.
As discussed later in this report, more recent VOST studies have shown significantly higher values than Austin has adopted. These generally consider a broader range of costs than the narrower group included in the Austin VOST.
For utilities where only a small percentage of consumers have installed solar systems, a simple net energy metering option will generally be easier to measure, more acceptable to consumers, and simpler to administer, and will produce
fewer significant impacts on grid-dependent customers. If solar penetration is high, the additional costs to install smart meters capable of bidirectional measurement may be justified, and time-differentiated pricing for power flows in each direction may be appropriate. The customer pays for power used on a TOU basis, and is credited (either the retail TOU rate or a different time-differentiated VOS rate) for power fed to the utility.
* For projects approved and installed in 2013.** Minimum capacity requirements do not apply for Class 2 projects if a Class 1 system is already installed on the parcel.*** GRU did not accept Class 3 projects in 2013.
Category
Class 1
Class 2**
Class 3***
Capacity (DC peak kilowatts)
10 kW or less10 kW or less
>10 kw to 300 kW>10 kW to 25 kW
>25 kW to 1,000 kW
20-year Fixed Rate
$0.21/kWh
$0.18/kWh
$0.15/kWh
Mounting Configuration
Rooftop or over pavementGround mount
Rooftop or over pavementGround mount
Ground mount
Table 4
Feed-In-Tariff for Gainesville, Florida
Winter$0.20
$0.15
$0.10
$0.05
$0.00First 500 501 - 1,000 1,001 -
1,5001,501 - 2,500
>2,500 VOST
Figure 6
Austin Energy Residential Rate Block and VOST (2015)
Summer
Source: Gainesville Regional Utility
Source: Austin Energy

Smart Rate Design for a Smart Future
47
Utility-Defensive Rate Design Proposals Recent growth in DG has been very rapid. Installed
solar capacity in the United States increased 30 percent in 2014 and residential installations surpassed 1 gigawatt.57 The relative success of DG has raised concerns in electric utility boardrooms and has caught the attention of the Edison Electric Institute.58 This success has led to the proposal and implementation of rate designs that undermine the economics for existing DG customers and present a formidable barrier for customers contemplating investments in DG resources.59 These proposals may impair the value that DG brings to the grid and to society as a whole. Renewable solar and wind businesses that have relied on federal tax credits, state RPS directives, and NEM have a lot at stake and are reacting to preserve their business model. A primary goal of these policies was to help transform the market in order to allow volume sales to reduce the unit costs and, as has been noted above, prices have declined significantly over the past decade. The policies have been successful, and this success presents new challenges to utility regulation.
Some utilities have proposed rate designs that are intended to assure recovery of embedded system costs from
57 Doom, J. (2015). U.S. Solar Jumps 30% as Residential Installs Exceed 1 Gigawatt. Bloomberg Business, March 10, 2015.Available at: http://www.bloomberg.com/news/articles/2015-03-10/u-s-solar-jumps-30-as-residential-installs-exceed-1-gigawatt-i738dw27. “GTM Research expects solar demand this year will grow 31 percent to about 8.1 gigawatts.”
58 Kind, P. (2013). Disruptive Challenges: Financial Implications and Strategic Responses to a Changing Retail Electric Business. EEI, January 2013. Available at: http://www.eei.org/ourissues/finance/documents/disruptivechallenges.pdf
59 Tong and Wellinghoff, 2015.
60 Warrick, J. (2015). Utilities wage campaign against rooftop solar. Washington Post, March 7, 2015. Available at: http://www.washingtonpost.com/national/health-science/utilities-sensing-threat-put-squeeze-on-booming-solar-roof-industry/2015/03/07/2d916f88-c1c9-11e4-ad5c-3b8ce89f1b89_story.html
61 See New York Public Service Commission, “Reforming the Energy Vision,” at http://www3.dps.ny.gov/W/PSCWeb.nsf/All/CC4F2EFA3A23551585257DEA007DCFE2.
62 US Energy Information Administration. (2015, April). Electric Power Monthly. Available at: http://www.eia.gov/electricity/monthly/update/archive/april2015/
63 Faruqui, A. (2012). The Future of Demand Growth: How Five Forces Are Creating a New Normal. Presentation before the Goldman Sachs 11th Annual Power and Utility Conference, August 14, 2012. Available at: http://www.brattle.com/system/publications/pdfs/000/004/431/original/The_Future_of_Demand_Growth_Faruqui_Aug_14_2012_Goldman_Sachs.pdf?1378772105. One counter to this perspective states that the future of the electric sector is decarbonized transport and industry and therefore electricity sales will grow significantly over the next 40 years.
64 See Kind, 2013, and Craver, T. (2013). Raising Our Game: Distributed energy resources present opportunities and challenges for the electric utility industry. Electric Perspectives, EEI, September/October 2013. Available at: http://www.edison.com/content/dam/eix/documents/our-perspective/2013-09-01-RAISEGAME.pdf
solar customers. As stated in a recent article, “The industry and its fossil-fuel supporters are waging a determined campaign to stop a home-solar insurgency that is rattling the boardrooms of the country’s government-regulated electric monopolies.”60 Meanwhile, states such as New York are looking to reform their utility business models to be more in line with customer preferences and choices.61 The uncertainty created by some of these proposals could cause a disruption in clean energy investment. If implemented, these proposals may drastically curtail deployment of customer-sited DG.
High Fixed Charge RatesThe expansion of energy-efficiency programs and
customer generation, coupled with a weak economy, increasingly stringent building and appliance codes and standards, and fuel switching has led to flat or declining electricity sales62 in some parts of the United States63 and a serious challenge to the traditional electric utility business model that ties profitability to electricity throughput.64 Utilities have sought to shore up their revenues by imposing minimum fees or new fees to replace declining sales.

Smart Rate Design for a Smart Future
48
that approximately 1.5 percent of consump-tion would have an incentive to increase usage to the level of the minimum bill, and over 98 percent of consumption would have a higher incentive to constrain usage.
Straight Fixed/Variable RatesUtilities in some parts of the United
States are seeking changes to rate design that sharply increase monthly fixed charges, with offsetting reductions to the per-unit price for electricity. High fixed charges as part of a straight fixed variable (SFV) design can stabilize utility revenues in the near term and are easy to administer. This approach however, deviates from long-established rate design principles holding that only customer-specific costs — those that actually change
with the number of customers served — properly belong in fixed monthly fees. It also deviates from accepted economic theory of pricing on the basis of long-run marginal costs. The effect of this type of rate design is to sharply increase bills for all low-use customers — which includes most apartment dwellers, urban consumers, highly efficient homes, and customers with DG systems installed — while benefitting larger homes and suburban and rural customers.
A common objection to this kind of rate is that it discourages conservation and DG by decreasing customer savings and increasing paybacks in customer investments and that it results in bill increases for low-volume (sometimes low-income) customers while decreasing bills for large-volume (often wealthier) customers.
Because they lower the energy rate component of the
Minimum BillsA minimum bill charges the customer a minimum
fixed charge, which entitles the customer to a minimum amount of energy. For example, a residential minimum bill might charge $20 as a minimum charge, which entitles the customer to receive its first 100 kWh energy included in the price. The customer charge is usually included in the minimum bill charge. Because some customers may have total usage below the minimum energy threshold, prices for energy above the minimum will be reduced slightly to offset the additional revenue collected from those customers.
Minimum bills are not typically considered good rate design, because they have an effective “zero price” for very small levels of usage. They are better than Straight Fixed/Variable rates (discussed next), which can impose up to $50 or more as a fixed charge and impose sharply lower per-unit prices. To the extent energy efficiency, conservation, and customer-sited DG would reduce consumption below the minimum threshold, minimum bills have the effect of reducing their value. Customers considering any of these options would tend to reduce the magnitude of their effort as usage falls into the minimum-bill range because no further savings could be achieved.
The key is to set the minimum bill at a level that guar-antees the utility a certain level of revenue it can count on, while not penalizing the vast majority of customers. Those most likely to be harmed with a minimum bill include sea-sonal households or households that are energy efficient and rely heavily on DG as their major source of energy. At the $20 per month minimum bill hypothetical, it is estimated
1985
1987
1989
1991
1993
1995
1997
1999
2001
2003
2005
2007
2009
2011
2013
1,600,000
1,400,000
1,200,000
1,000,000
800,000
600,000
400,000
200,000
0
Mil
lion
kW
h/y
ear
Figure 7
US Electricity Sales, 1985-2014
16,000
14,000
12,000
10,000
8,000
6,000
4,000
2,000
0<$25,000 $25,000 -
$49,999$50,000 - $74,999
$75,000 - $99,999
>=$100,000
Figure 8
Annual kWh Use Per Household By Income Strata
Source: US EIA
Source: John Howat, National Consumer Law Center, 2014

Smart Rate Design for a Smart Future
49
customer’s tariff, SFV rates discourage conservation and DG by decreasing customer savings associated with reduced consumption, thereby increasing payback periods in customer investments. SFV rates adversely impact those who have already invested efficiency and DG and may dissuade those who are considering such investments from deploying energy efficiency and DG.
Later in this paper, as well as in Appendix D, we discuss how the future is better served by reflecting costs that are not customer-specific — including nearly all distribution system costs — in usage-based (preferably time-varying) rates.
Distribution System Cost SurchargesSome states, such as New Mexico, are considering
imposing new fees on DG customers that utilities argue reflect their use of the grid. Arizona and Wisconsin have already imposed new fees on DG customers even though there may be no demonstrated additional costs being incurred by the utility as a result of DG output.65 These new fee-based rate designs can adversely impact customers who have made investments predicated upon the stability of a historic rate design, as well as dissuade other customers from deploying DG. In some states surcharges applicable only to new solar customers are being considered. How these provisions are applied makes a difference in the impact they will have on new and existing customers. If there is a grandfathering provision for existing solar installations, they will discourage new solar installations, but not penalize customers who made investments based on expected savings.
On the other hand, commissions in Idaho, Louisiana, and Utah have rejected fixed charges on solar customers66 while California has statutorily limited fixed charges to no more than $10 per month for all residential consumers,
including any demand or other unavoidable charges.
Exit FeesExit fees are charges imposed on consumers who cease
taking utility service. In general, these are applied only to consumers departing the system on short notice, and for whom the utility has made significant investments to provide service. This may be customer-specific distribution system investments, or may be investments in power supply intended to provide long-term service.
As a general rule, exit fees are inappropriate rate design measures. The risk of customer loss is an ordinary business risk, for which the utility rate of return is the compensation. In addition, overall growth in customers and customer usage may more than offset the losses from defecting customers, enabling utilities to redeploy resources freed up by conservation and DG to serve new customers or increased use by other existing customers.
Where specific costs are attributable to specific customers (for example, building a substation to serve an industrial facility), it may be appropriate to impose a charge based on the unamortized investment if the customer did not pay the costs of the facilities expansion as a connection charge at the time service was initiated. However, these costs are typically addressed in special contracts between the utility and the customer and not through a general exit fee tariff.
Best-Practice Rate Design Solutions
Overview: Rate Design That Meets the Needs of Utilities and Consumers
Figure 9 gives an overview of the appropriate rate designs for all customer classes for both default and optional services.67
65 In Wisconsin, the commission did not examine utility costs for DG customers, but instead determined that a fixed charge “more appropriately aligned costs.” Likewise, the Arizona Corporation Commission granted an interim fixed charge increase for DG customers until the utility’s next rate case without examining specific costs, rationalizing that such a move was necessary to address the “cost-shift” from DG customers to non-DG customers. See WI PSC. (2014, December). Final Decision. Docket No. 5-UR-107. Available at: http://psc.wi.gov/apps40/dockets/default.aspx; and AZCC. (2013, December 3). Final Decision. Docket No. E-01345A-33-0248. Available at: http://images.edocket.azcc.gov/docketpdf/0000149849.pdf
66 Tracy, R. (2013, July 8). Utilities Dealt Blow Over Solar-Power Systems. Wall Street Journal. Available at: http://www.wsj.com/articles/SB10001424127887324507404578594122250075566; and Trabish, H. (2014). Utah regulators turn down Rocky Mountain Power’s bid for solar bill charge. September 3, 2014. Available at: http://www.utilitydive.com/news/utah-regulators-turn-down-rocky-mountain-powers-bid-for-solar-bill-charge/304455/
67 This is an update of a matrix developed in 2003 for the New England Demand Response Initiative, reflecting changing costs of smart grid capabilities and increased value of time-differentiation due to the high levels of variable renewable generation available today. See http://www.raponline.org/document/download/id/687.

Smart Rate Design for a Smart Future
50
For residential consumers, the general rate design reflected in Table 5 will serve the needs of both utilities and consumers, providing incentives for efficiency, compensation for services received, and a pathway to a future that is less dependent on fossil generation. Differences will be appropriate for very low-cost utilities and very high-cost utilities. The issue of whether CPP or PTR is most appropriate to reflect needle-peak costs is discussed below (see “Time-Sensitive Pricing”).
In the simplest of terms, this rate design recovers customer-specific costs, such as billing and collection in a fixed monthly charge, and combines power supply and distribution costs into a TOU rate framework. This enables fair recovery of costs from small and large customers, and from customers whose peak demands may occur at different times from one another, and at different times from the system peak. It also provides reasonable compensation to DG customers who supply power to the
Typical Pre-AMI Rate
DesignInclining
Block Rate
TOU Rate Fixed Time
Period
TOU plus Critical Peak
Pricing
Baseline- Referenced Real
Time Pricing
Market Indexed Real Time Pricing
ResidentialFlat Energy
Charge
Default (if kwh-only
metering in place)
Default (if TOU
meters or AMI in place)
Optional if AMI in place Pilot Not
Available
Small Commercial
0-20 kwDemand
Flat Energy Charge
Not Available
Default (if TOU
meters in place)
Optional if AMI in place Pilot Not
Available
Medium General Service
20-250 kw
Demand Charge---
Flat Energy Charge
Not Available
Default (until AMI installed)
Default (after AMI installed)
Optional Not Available
Large General Service
250- 2,000 kw
Demand Charge---
Flat Energy Charge
Not Available
Not Available Default Optional Optional
Extra Large General Service
>2000 kw
Demand Charge---
Flat Energy Charge
Not Available
Not Available
Not Available
Customer Must Choose Between These Two Options
Figure 9
Rate Design Options by Customer Class
Table 5
Illustrative Residential Rate Design
Rate Element
Customer Charge
Transformer Charge
Off-Peak Energy
Mid-Peak Energy
On-Peak Energy
Critical Peak Energy (or PTR)
Based On The Cost Of
Service Drop, Billing, and Collection Only
Final Line Transformer
Baseload Resources + transmission and distribution
Baseload + Intermediate Resources + T&D
Baseload, Intermediate, and Peaking Resources + T&D
Demand Response Resources
Illustrative Rate
$4.00/month
$1/kVA/month
$.07/kWh
$.09/kWh
$.14/kWh
$.74/kWh
Source: Adapted from RAP research for New England Demand Response Initiative (NEDRI), 2002

Smart Rate Design for a Smart Future
51
grid at certain times, and receive power from the grid at other times.
General Rate Design StructureDemand Charges
Demand charges are usually based on the customer’s metered peak usage over a short period of time (e.g., 15 minutes or an hour), regardless of whether that usage coincides with the generation peak, transmission system peak, distribution system peak, or the customer’s circuit peak. In addition, demand charges are often “ratcheted,” which means that the customer pays a monthly demand charge based on the maximum metered peak over a longer than one-month period — usually a year.
Demand charges were implemented for commercial and industrial customers in an era where sophisticated TOU metering was prohibitively expensive. Today, with smart meters and AMI, these costs are trivial.
Although demand charges once served the useful function of providing a simple price signal to customers that their peak usage caused long-term costs for capacity to be incurred to meet peak demand even when those resources lay idle most of the time, they may not be appropriate in the presence of current market conditions, smart technologies, and other regulatory policies.68 Progress with demand response and the development of robust wholesale energy markets allows utilities to meet short-term peak needs with short-term resources, obviating the need for demand charges. Given these conditions, it is more appropriate to utilize more temporally granular time-differentiated rates, in lieu of demand charges. AMI provides an opportunity to move away from the rather crude allocation of cost responsibility afforded by demand charges, and toward a cost recovery framework that is more focused on the costs that utilities and society incur to meet the daily and hourly needs of the system.
A few rate analysts have recommended that demand charges be extended from large commercial customers (where they are nearly universal) to small commercial and residential consumers.69 Some argue that this is an appropriate way to ensure that solar customers contribute adequately to system capacity costs. This option is inapt for most situations for several reasons:
• The only component of the distribution system that is sized to the demand of the individual consumer is the line transformer, and this is a small portion of the total cost of service.
• Residential and small commercial consumers have
68 For example, daily “as-used” demand charges for combined heat and power standby rates may be appropriate. For a discussion of this, see.Selecky, J., et. al. (2014). Standby Rates for Combined Heat and Power Systems. Montpelier, VT: Regulatory Assistance Project. Available at: www.raponline.org/document/download/id/7020
69 See, e.g., Hledik, R. (2014). Rediscovering Residential Demand Charges. Electricity Journal, 27(7), August-September 2014, pp. 82–96.
70 Presentation of William Marcus of JBS Energy to the Western Conference of Public Service Commissioners, 2015.
70%
60%
50%
40%
30%
20%
10%
0% <250 250-500 500-750 750-1000 1000-1500 >1500
Figure 10
Usage Levels and Customer Coincidentand Non-Coincident Peak Demand70
Average Monthly Summer kWh
NCP Load Factor
CP Coincidence
CP Load Factor
high diversity, meaning different customers use power at different times of the day. This is particularly true for multi-family customers, where the utility never actually sees the sum of the individual customer demand on a coincident basis even at the transformer level. Small consumers “share” most of the capacity costs on a utility system. Figure 10 shows how small-use customers have lower contribution to the system coincident peak (CP), even though (relative to kWh usage) they have higher non-coincident peak (NCP) demands — which is what demand charges typically are applied to.
• Customer understanding of demand charges is poor among large commercial consumers currently exposed to them, and there is reason to believe that customer understanding would be very poor among residential and small commercial consumers. While a daily as-used demand charge for standby service is likely to be well-understood by an industrial CHP customer, this sophistication does not extend to residential or small

Smart Rate Design for a Smart Future
52
commercial users.• Solar customers may actually contribute power to
the grid during peak periods, reducing capacity costs for the system; imposing a non-coincident demand charge would be unfair in that situation. To the contrary, a time-varying NEM tariff automatically credits solar customers for this benefit and a properly designed VOST should do the same.
• The same time periods should apply to both power supply and distribution pricing. There may be periods on weekends when residential distribution circuits are congested even though power supply is not, and asking customers to keep track of two different time-varying rates is likely to be confusing.
• Time-varying prices can more equitably recover actual peak-oriented costs from all customers, including solar customers. Considerable education is needed to assist customers in the transition to default TOU and CPP/PTR pricing. As discussed, a period of shadow billing before the rate taxes effect may be an important element of this education.
A monthly fixed charge based on a transformer rental charge may be appropriate, particularly on rural systems where most transformers serve a single customer. Some utilities already apply this as a “facilities” charge, on the order of $1/kW-month, based either on the customer panel size, the measured demand, or the actual size of the installed line transformer.71 Our illustrative rate designs include this element, in part to focus attention on how small a demand charge applied to a residential customer should be to recover only customer-specific capacity costs.
Demand charges imposed on non-coincident peak demands are not appropriate for cost recovery of any system costs upstream of the line transformer and coincidence should be tied to utilization of specific parts of the systems where costs are incurred — that is, at the generation, transmission, distribution, or even circuit level — which do not necessarily incur peak usage at the same time. For utilities in restructured markets (where utilities primarily own distribution but not transmission or generation), demand response pricing will be used to provide short-duration capacity at specific points along the distribution system, not to signal investment in generation, transmission, and distribution systems. Even for vertically integrated utilities, the presence of more robust wholesale markets means that these short-term needs can be procured on a short-term basis, rather than on a long-term “build and own” basis. A critical peak or real-time energy
price more appropriately recovers this cost of providing short-duration peaking capacity from the consumers using that capacity, without penalizing other consumers whose demand may occur at other hours when high-cost resources are not needed.
Illustrative rate designs for vertically integrated systems are shown in the next section.
Pricing for Restructured UtilitiesIn general, pricing for restructured utilities would be
similar to that for vertically integrated utilities, except that the power supply charges will be separately stated, or even separately billed.
• First and foremost, the monthly fixed charges should not exceed the customer-specific costs incurred.
• Second, demand charges should be used sparingly and only be applied to recover the cost of customer-specific capacity, typically line transformers, primarily for customers having dedicated transformers.
• Third, most distribution costs should be reflected on a TOU/CPP or TOU/PTR basis, to reflect recovery of basic distribution infrastructure costs across all hours, and to reflect recovery of long-run marginal capacity costs to “upsize” that system to meet requirements during on-peak and critical-peak hours.
• Default energy service should have the same time periods and rate differentiation as distribution charges; this avoids customer confusion.
• Consumers desiring a non-differentiated price may be able to contract with a competitive energy supplier to accept the risk of high costs during some periods and bundle the cost of risk management into a contracted price.72
• Considerable education is needed to assist customers in the transition to default TOU and CPP/PTR pricing. As discussed, a period of shadow billing before the
71 Manitoba Hydro, for example, imposes a residential customer charge of $7.28 on residential consumers with 200 amp and smaller panels, but $14.56 on consumers with larger electrical panels. Burbank Water and Power (California) implemented a similar approach in 2015.
72 Or some restructured states may offer standard service offer (SSO) customers both a time differentiated and fixed default rate. In this case, competitive retail electric service (CRES) providers will have a market-based price to compete against for both SSO rate types. This approach should exert some market discipline on CRES.

Smart Rate Design for a Smart Future
53
rate taxes take effect may be an important element of this education.
Illustrative rate designs for restructured systems are shown in the next section.
Time-Sensitive Pricing: A General Purpose ToolTOU Energy Charges Combined with CPP
There are a number of time-varying elements of cost in the generation and delivery of energy. Defined narrowly this would only include recognition that, because the order in which generation is utilized is based on a system of economic dispatch, on-peak power generation will always be the generation with highest short-run marginal cost — that is, the least efficient power plant with highest fuel costs per kWh at that point in time.
The challenge is to set prices that are sufficiently targeted to produce the desired result, without causing too much customer confusion. The more than 100 pilots using time-varying pricing provide clear guidance on this point.73
In terms of customer understanding and behavioral response, experience shows that the most effective rate structure is a two- or three-period TOU price, coupled with either a CPP element or a PTR element. This rate design should recover a portion of generation, transmission, and distribution costs in each of the three major time periods, with the recovery of those costs concentrated into the on-peak periods.
Consistent with Garfield and Lovejoy’s guidance as introduced earlier, a model TOU rate would ensure that:
• Every kilowatt-hour sold should make some contribution to system capacity-related costs.
• Peak-period and mid-peak-period kilowatt-hours should recover a larger share of system capacity-related costs than off-peak kilowatt-hours.
• The price for the critical peak hours should be based on the cost of operating a demand response program for those hours, because it is less expensive to induce customers to curtail usage for short periods than to build resources for those rare circumstances. But
73 See Faruqui, A., et al. (2012). Time-Varying and Dynamic Rate Design. Montpelier, VT: Regulatory Assistance Project. Available at: http://www.raponline.org/document/download/id/5131
Customer Off-Peak Mid-Peak On-Peak Peak
Generation Baseload n n n nIntermediate n n nPeaking n n Transmission Generation-Related n n n nReliability-Related n n nEconomy Energy Related n n Distribution Substations n n n nCircuits n n n nLine Transformers ? n n n n Meters n n n n n Billing and Collection Quarterly Costs n Monthly Costs n n n n Demand Response n
Table 6
Cost Recovery in a TOU Rate Design
that price, applied to the consumption that does occur, served by resources built for longer periods of service. But that price would generate revenue that would contribute to cost recovery for production, transmission, and distribution costs for kilowatt-hours that flow as well.
Table 6 provides rough guidance as to what costs are reflected in each element of this type of rate design.
Illustrative rate schedules for different classes of consumers reflecting this guidance are shown in Table 7. In these rate schedules, the only demand charges imposed are for customers with dedicated transformers; all other costs are reflected in the TOU energy prices. A CPP rate is demonstrated in combination with TOU prices but not a PTR option. This reflects a judgment that the effectiveness of CPP is demonstrably superior, even though customer acceptance is higher for PTR. The advantage of PTR is that it offer s a no-risk option to introduce customers to
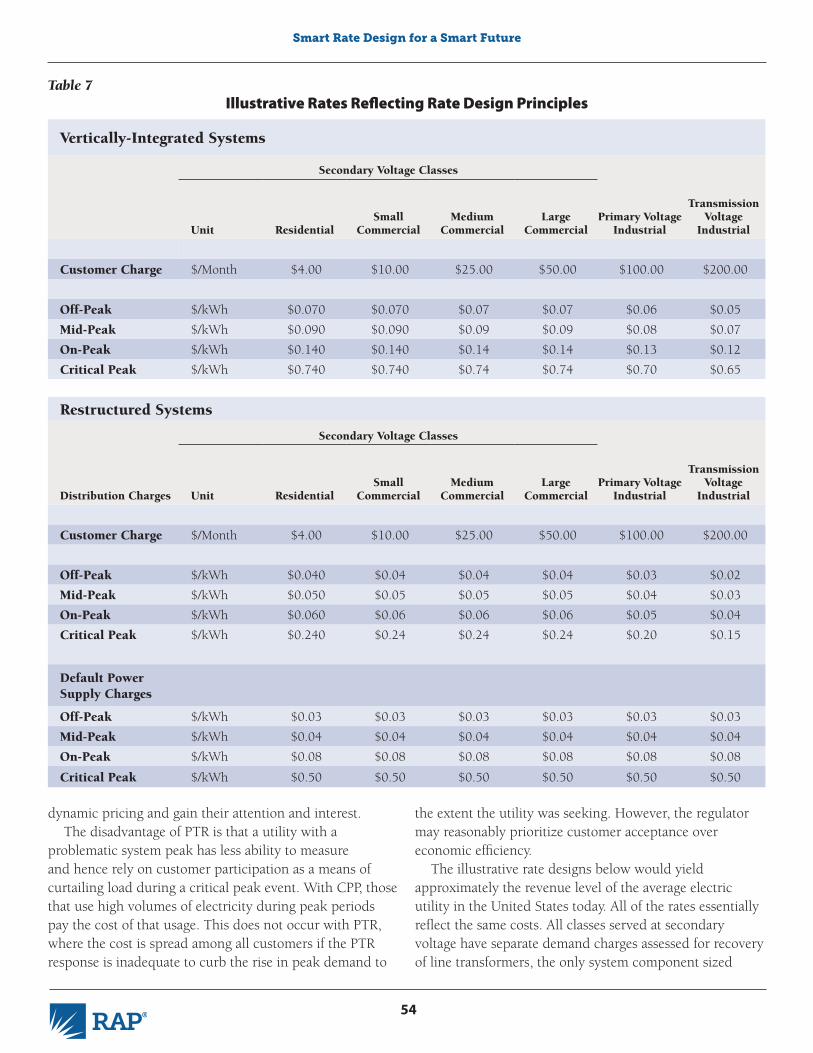
Smart Rate Design for a Smart Future
54
Vertically-Integrated Systems
Secondary Voltage Classes
Unit ResidentialSmall
CommercialMedium
CommercialLarge
CommercialPrimary Voltage
Industrial
Transmission Voltage
Industrial
Customer Charge $/Month $4.00 $10.00 $25.00 $50.00 $100.00 $200.00
Off-Peak $/kWh $0.070 $0.070 $0.07 $0.07 $0.06 $0.05
Mid-Peak $/kWh $0.090 $0.090 $0.09 $0.09 $0.08 $0.07
On-Peak $/kWh $0.140 $0.140 $0.14 $0.14 $0.13 $0.12
Critical Peak $/kWh $0.740 $0.740 $0.74 $0.74 $0.70 $0.65
Restructured Systems
Secondary Voltage Classes
Distribution Charges Unit ResidentialSmall
CommercialMedium
CommercialLarge
CommercialPrimary Voltage
Industrial
Transmission Voltage
Industrial
Customer Charge $/Month $4.00 $10.00 $25.00 $50.00 $100.00 $200.00
Off-Peak $/kWh $0.040 $0.04 $0.04 $0.04 $0.03 $0.02
Mid-Peak $/kWh $0.050 $0.05 $0.05 $0.05 $0.04 $0.03
On-Peak $/kWh $0.060 $0.06 $0.06 $0.06 $0.05 $0.04
Critical Peak $/kWh $0.240 $0.24 $0.24 $0.24 $0.20 $0.15
Default Power Supply Charges
Off-Peak $/kWh $0.03 $0.03 $0.03 $0.03 $0.03 $0.03
Mid-Peak $/kWh $0.04 $0.04 $0.04 $0.04 $0.04 $0.04
On-Peak $/kWh $0.08 $0.08 $0.08 $0.08 $0.08 $0.08
Critical Peak $/kWh $0.50 $0.50 $0.50 $0.50 $0.50 $0.50
Table 7Illustrative Rates Reflecting Rate Design Principles
dynamic pricing and gain their attention and interest. The disadvantage of PTR is that a utility with a
problematic system peak has less ability to measure and hence rely on customer participation as a means of curtailing load during a critical peak event. With CPP, those that use high volumes of electricity during peak periods pay the cost of that usage. This does not occur with PTR, where the cost is spread among all customers if the PTR response is inadequate to curb the rise in peak demand to
the extent the utility was seeking. However, the regulator may reasonably prioritize customer acceptance over economic efficiency.
The illustrative rate designs below would yield approximately the revenue level of the average electric utility in the United States today. All of the rates essentially reflect the same costs. All classes served at secondary voltage have separate demand charges assessed for recovery of line transformers, the only system component sized
Smart Rate Design for a Smart Future
55
with consideration of individual customer demands. All shared capacity costs are reflected in the TOU rates, so that customers share these costs in proportion to their usage. The larger customers may have very different usage patterns, and benefit (or be harmed) by the TOU rate design, so the average revenue for each class would not be the same, even where the underlying prices may be the same.
An Opt-Out Regime and Customer EducationTOU pricing is a more economically efficient way to
charge customers for their electricity use than a fixed average rate, since it tracks more closely to the changing cost of electricity during the day and the on-peak cost of congestion on the transmission and distribution system.
Utility rate experiments have allowed customers to choose whether to participate in the rate pilots (“opt in”), and in those cases where customers had to “opt out” or are forced to be on a rate, there are typically customer protections at the end of the experiment.
From a customer enrollment perspective, however, “default TOU rate offerings are likely to lead to enrollment levels that are 3 to 5 times higher than opt-in TOU rates.”74 The SMUD SGIG-funded project provides empirical evidence that supports offering of time-varying rates to residential customers under default environments.75 Overall, rates should be lower with time differentiation and CPP because customers would not have to pay a risk premium for the flat rate. Higher participation rates should lead to decreasing system costs that benefit all customers.
The transition to a default TOU and CPP/PTR pricing regime will require extensive customer education. Consideration should be given to the following options:
• Dual or shadow billing: Some customers stay
on traditional billing, but are shown through their monthly bills what they could save.
• Customer guarantee: Each customer could be served on the tariff that provides them with the lowest annual bill during the transition period. If the complex rate results in a higher annual bill, the customer is automatically charged on the basis of the lower-cost rate.
• “Hold harmless” and first-year bill forgiveness programs: These provide important consumer protections during a pricing transition.
• Multi-year data: The development and deployment of more sophisticated bill comparison software incorporating multi-year individual customer interval data could inform a customer whether their subscription into a certain rate design offered by a competitive retail electricity supplier (CRES) would lead to higher bills than the TOU default rate, and what steps they can take to come out ahead. These could include specific energy-efficiency measures or peak reduction control technology.
• Best practices: Utility time-differentiated pilot programs that have worked well provide key lessons.76
• Low-income rate programs: This option can provide an important safety net for at-risk populations.
• Deploy targeted energy-efficiency and demand-response programs: Customers who would be worse off under TOU or CPP rates, especially low-income customers, should be targeted for energy efficiency and demand response programs that can mitigate the impact of those rates, or possibly move them from the “worse off” to the “better off” category.
74 See Faruqui, A., Hledik, R., and Lessem, N. (2014, August). Smart by Default. Public Utilities Fortnightly. Available at: http://www.fortnightly.com/fortnightly/2014/08/smart-default; and US DOE, 2015, which states: “Opt-out enrollment rates were about 3.5 times higher than they were for opt-in, and retention rates for both were about the same. While demand reductions for opt-in customers were generally higher, one utility found opt-out enrollment approaches to be more cost-effective than comparable opt-in offers due to significantly higher aggregate benefits and lower marketing costs.”
75 George, S., et al. (2014). SMUD Smart Pricing Options Final Evaluation, p. 4. Prepared by Nexant for Sacramento Municipal Utility District (SMUD). Available at: https://www.smartgrid.
gov/files/SMUD_SmartPricingOptionPilotEvaluationFinalCom-bo11_5_2014.pdf
76 See: US DOE, 2015; US DOE. (2014, September). Experiences from the Consumer Behavior Studies on Engaging Customers. Smart Grid Investment Grant Program. Available at http://www.energy.gov/sites/prod/files/2014/11/f19/SG-CustEngagement-Sept2014.pdf; Lundin, B. (2014). Utilities now have a smart grid customer education model. SmartGrid News, January 8, 2014. Available at: http://www.smartgridnews.com/story/utilities-now-have-smart-grid-customer-education-model/2014-01-08; and PEPCO. (2013, March 19). AMI Implementation Customer Education Plan Phase II. Available at: https://www.smartgrid.gov/sites/default/files/Pepco_Plan_Phase_II.pdf.
http://www.smartgridnews.com/story/utilities-now-have-smart-grid-customer-education-model/2014-01-08
http://www.smartgridnews.com/story/utilities-now-have-smart-grid-customer-education-model/2014-01-08

Smart Rate Design for a Smart Future
56
Smart meter deployment is expected to reach 91 percent of the United States by 2022.78 It is important to note, however, that merely installing smart meters does not alone facilitate advanced pricing; MDMS investments, billing engine modifications, and sophisticated rate studies are needed to develop advanced pricing.79
Smart meters can enable advanced pricing mechanisms, but given the relative price-variability risks and economic rewards of different types of pricing, the desired consumer rewards of lower bills are applicable only to a subset of pricing options. Figure 11 shows this risk-reward tradeoff, and where smart meters become relevant and useful.
Note that in some restructured states with retail competition and smart meters, metering and billing services can (or must) be provided by a competitive provider.
Apportionment and Recovery of Smart Grid Costs
Smart meters, and the support systems necessary for them to realize their full potential, are a costly investment. These costs have been justified by the full spectrum of benefits described above, many of which are related to energy savings, peak load management, and distribution cost controls, not just the billing of consumers.
V. Rate Design for Specific Applications
Rate Design That Enables Smart Technologies
Smart technologies need smart rate design in order to take advantage of their functionality. Smart meters allow utilities to manage diverse power flows. Smart meters and associated MDMS and
SCADA provide the opportunity to achieve multiple benefits, including energy and demand savings and operational benefits. The common elements of utility operating benefits afforded by smart technologies are outlined in Table 8 below.
Table 8
Common Elements of Utility Operating Benefits of Smart Meters77
Reduced manual meter reading cost Improved bill-to-pay time
Reduced problem investigations Reduced uncollectible bills
Improved meter accuracy Improved accounting
Reduced meter testing Call center cost reductions
Elimination of lock rings Improved asset utilization
Reduced need for use of estimated bills Outage reporting
Reduced theft Improved outage management
Improved read-to-bill time Reduction in lost outage sales
Time-varying pricing for energy cost savings Dynamic pricing for peak load control
Demand-response enablement Reduced line losses
Identification of stressed transformers Improved cost allocation accuracy
77 King. C. (2010, October 14). Making the Business Case for Smart Meters [Presentation]. Smart Grid Newsletter Webinar, p. 10. Available at: http://assets.fiercemarkets.net/public/smartgridnews/eMeter_Oct_14_2010_Biz_Case_Rev3_1_.pdf
78 Telefonica. (2014, January). The Smart Meter Revolution: Towards a smarter future. Available at: https://m2m.telefoni-ca.com/multimedia-resources/the-smart-meter-revolution-to-wards-a-smarter-future.
79 Lazar, 2013.
https://m2m.telefonica.com/multimedia-resources/the-smart-meter-revolution-towards-a-smarter-future.

Smart Rate Design for a Smart Future
57
Figure 11
Conceptual Representation of the Risk-Reward Tradeoff in Time-Varying Rates80
Flat Rate
RTP
CPP
VPP
Inclining Block Rate
Seasonal Rate
TOU
Super Peak TOU
PTR
Incr
easi
ng R
ewar
d
Increasing Risk
Less Risk, Lower Reward
More Risk, Higher Reward
Risk (Variance in Price)
Potential Reward
(Discount from
Flat Rate)
Therefore, these additional costs of smart meters should not be recovered in fixed monthly charges. Traditionally, in utility cost analysis, “meters” were considered a customer-related cost, allocated based on the number of customers in each class because each customer typically required one meter. Those costs were typically reflected in rates as part of the monthly customer charge.
When those meters only performed the function of providing input to the billing system, this made sense; however, smart meters are very different. Because of all
of the non-billing functions that smart meters provide, a portion of the cost of smart meters and the associated data collection and data management system should be treated as energy costs, peak load management costs, distribution system reliability costs, or other types of costs, not just as customer-related costs. Smart meter functions related to capacity, reliability, or other aspects of the electric system should be recovered in the same manner as other investments made for those purposes.
Charges associated with connection and disconnection of customers are usually separately billed. Accordingly, the costs of smart meters allocated to these functions should not be included in monthly fixed charges, but should recovered through separately billed fees. Table 9 reflects the appropriate classification of costs associated with some of the more important smart
80 Adapted from Faruqui et al., 2012.
Table 9
Cost Classification Appropriate for Smart Meter and MDMS Costs
Smart Meter and MDMS Facilitates Classification Basis
Time-Differentiated Pricing (TOU) Energy and Demand
Dynamic Pricing (CPP), Demand Response Demand
Bidirectional Measurement Energy
Distribution Optimization Capacity and Energy
Remote Disconnection and Reconnection Separately Billed, as Applicable

Smart Rate Design for a Smart Future
58
meter and MDMS functions.Smart meters and the associated MDMS perform
multiple functions. The costs associated with smart grid investments should be apportioned so that all aspects of utility service that benefit share in the costs. Simply stated, to justify deployment of smart meters and an MDMS, there should be an expected net savings to the utility customers over the life of the investments. No single category (energy, capacity, customer) should be assigned costs that exceed that particular benefit. These multiple benefits should mean that the customer billing function is at least no more costly than before deployment of the new systems and, in fact, given the expected savings in the billing and customer service costs, should reflect a net savings in the long run. At the time of smart meter installation, the monthly fixed charge for billing and collection functions should therefore be reduced, to reflect the multiple anticipated benefits of a smart meter implementation. This could take place in a general rate case or during the smart grid ramp-up in a net of benefits rider that would reduce not only the monthly customer charge, but also the capacity and energy-related charges to reflect the total benefits, net of incremental costs.
To date, three separate approaches have been used for smart grid cost recovery. They are special purpose riders, riders with limits based on expected economic benefits, and traditional rate case treatment, which is subject to a prudence review.81 The risk to consumers is greater with special purpose riders without limits and less when the utility is required to file a rate case. In a net of benefits rider approach, the smart grid investment risk is shared between customers and utility shareholders by putting the utility at risk to actually achieve the promised cost savings. In all cases, smart grid costs should be apportioned so there is a net savings to the customer billing, energy and capacity classification to reflect the multiple benefits of a smart grid implementation; in essence — rates and bills should decline as a result of smart grid deployment. This can take place in a general rate case or during the smart grid
81 Alvarez, P. (2012). Maximizing Customer Benefits: Performance measurement and action steps for smart grid investments. Public Utilities Fortnightly, January 2012, p. 33. Available at: http://www.fortnightly.com/fortnightly/2012/01/maximizing-customer-benefits
82 The MetaVu Duke Energy Ohio audit report includes 26 separate operational benefit categories. See MetaVu. (2011, June 30). Duke Energy Ohio Smart Grid Audit and Assessment, p. 72. Available at: https://www.smartgrid.
ramp-up, in a net of benefits rider. A number of regulatory examples are instructive:
• Duke Energy Ohio Smart Grid Audit and Assessment/ Ohio PUC: calculated $383 million in net present value operational benefits over a 20-year period.82 Duke Energy Ohio agreed to reflect a total of $56 million in operational benefits for the years 2012 through 2015 in their existing net of benefits smart grid rider,83 and to account for all benefits in the next rate case.84
• California Public Utilities Commission (CPUC) / Southern California Edison: $1.4246/month in smart operational benefits with each smart meter that the utility puts into service. The Southern California Edison Co. was required to credit $1.4246 of the operational benefit per month beginning eight months after the smart meter is reflected in rate base.85
• Oklahoma Corporation Commission/Oklahoma Gas and Electric: Immediate deduction of operational savings from the revenue requirement when smart grid systems went into service.86
Smart Rates for Smart TechnologiesThe term “smart rates” is used here to describe those
rate designs that require the type of data collection that smart meters provide, and which are expected to produce significant peak load reductions, reduced energy consumption, improved system reliability, improved power quality, and reduced emissions. These include:
• TOU (with and without technology, such as in-home displays);
• PTR (with and without technology);• CPP (with and without technology); and• RTP (with and without technology).Aside from the TOU-oriented rate designs, payment and
credits based on specific services, such as the provision to voltage regulation, spinning reserves, frequency control or other ancillary services will need to be provided.
gov/files/Duke_Energy_Ohio_Smart_Grid_Audit_Assessment_201104.pdf
83 Settlement filed in Duke Energy Ohio Case No. 10-2326-GE-RDR.
84 Ibid.
85 CPUC Decision No. 08-09-039 (September 18, 2008), pp. 37-38.
86 Alvarez, 2014, p. 258.

Smart Rate Design for a Smart Future
59
years and consecutive events.”88 Furthermore, enabling technologies (in-home displays, smartphone applications, smart thermostats, and appliances) enhance price responsiveness. TOU and CPP rates may also be fairer to customers than traditional flat rates because customers who contribute more to the increased costs of peak usage are made to pay more.89
By having rates that reflect system value, customers can and will take action that over the population and over time will reduce system
costs, and in so doing reduce costs and thus rates for everyone. Overall then, rates should be lower with time differentiation and critical peak pricing. Utility rates include both an operating expense provision and a risk element in the rate of return to enable the utility to purchase high-cost energy as needed during extreme periods. Because customers are directly bearing this risk at the time it is experienced, the base rates for non-critical periods will logically decline slightly.
A demonstration of the power of rate design in influencing customer behavior is depicted in Figure 13, which shows results of 30 different pilot programs. The impacts on reductions in peak demand are grouped by rate type and whether customers have enabling technology.
87 Faruqui et al., 2012.
88 Sanem Sergici, S. (2014, August 6). Dynamic Pricing: Transitioning from Experiments to Full Scale Deployments [Presentation]. The Brattle Group, p. 6. Available at: http://www.nga.org/files/live/sites/NGA/files/pdf/2014/1408MichRetreatDynamicPricing_Sergici.pdf
Pricing Pilot
Peak
Red
ucti
on
1 1090%
10%
20%
30%
40%
50%
60%
Figure 12
Comparison of Results from Smart Rate Pilots87
TOU CPP CPPw/Tech
RTPw/Tech
RTP
TOU w/Tech
PTR PTRw/
Tech
89 Traditional flat rates force all customers to a rate based on the average costs assigned to the class, to the detriment of customers who use less on-peak and, therefore, have less costly consumption patterns.
The effectiveness of different TOU rate designs varies considerably. Figure 12 shows a comparison of pilot program peak reduction results for a variety of smart rates. CPP rates clearly show the greatest promise of delivering strong peak reductions by customers.
Looking Ahead: Smart Houses, Smart Appliances, and Smart Pricing
Evidence shows that advanced pricing works best with technology enhancement to enable automated response to higher prices that can tie directly into time-differentiated prices. Over 200 time-differentiated rate tests have been conducted worldwide, with differing results. The consensus of these pilot programs is that customers respond to prices. The modified consumption patterns “persist across several

Smart Rate Design for a Smart Future
60
50%
40%
30%
20%
10%
0%
Ave
rage
Red
uct
ion
in
Pea
k D
eman
d
1 2 3 4 5 6 7 8 9 10 11 12 13 14 15 16 17 18 19 20 21 22 23 24 25 26 27 28 29 30
Pricing/Technology Test
Notes: Chart shows only treatments testing price and technology side-by-side.Technology included automation (e.g. smart thermostats) and/or information (e.g., in-home displays).
Increase in response due to enabling technology
Response to price only
Figure 13
Impact of Enabling Technologies on Customer Price Response90
Average increase in response = 90%
Figure 14
Smart Home of the Future91
Pricing Signals for Smart Appliances
Figure 14 reflects the multitude of smart appliances in a smart home. In order to fulfill their smart functions, most of these appliances must be integrated into an energy management system, which responds to the dynamic pricing signal of the underlying rate design or connects to a customer preferences profile.
A number of technology companies are developing products that interface with a utility’s smart grid deployment. General Electric, for example, has developed smart appliances that communicate with their smart thermostat to manage appliance electricity usage based on real-time utility pricing. 90 Sergici, 2014, p. 4.
91 Source: SmarterUtility.com
Source: Sergici, 2014
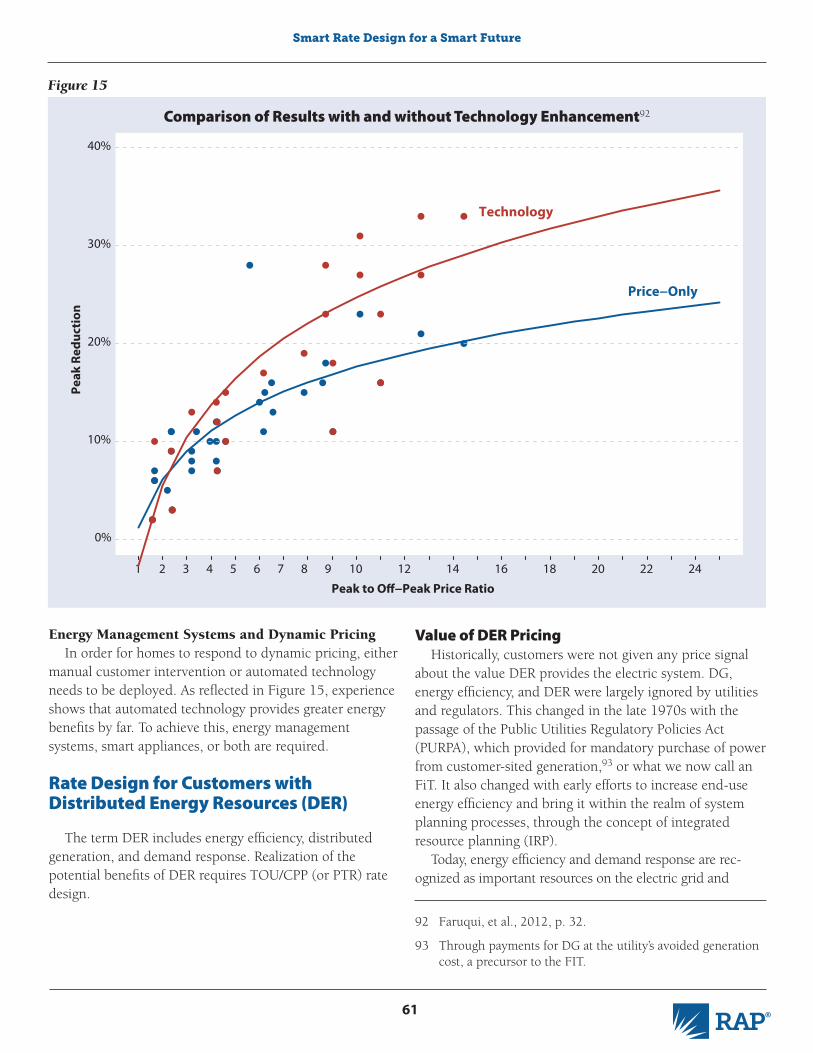
Smart Rate Design for a Smart Future
61
Energy Management Systems and Dynamic PricingIn order for homes to respond to dynamic pricing, either
manual customer intervention or automated technology needs to be deployed. As reflected in Figure 15, experience shows that automated technology provides greater energy benefits by far. To achieve this, energy management systems, smart appliances, or both are required.
Rate Design for Customers with Distributed Energy Resources (DER)
The term DER includes energy efficiency, distributed generation, and demand response. Realization of the potential benefits of DER requires TOU/CPP (or PTR) rate design.
Figure 15
Comparison of Results with and without Technology Enhancement92
Peak to Off−Peak Price Ratio
Pea
k R
edu
ctio
n
1 2 3 4 5 6 7 8 9 10 12 14 16 18 20 22 24
0%
10%
20%
30%
40%
Price−Only
Technology
92 Faruqui, et al., 2012, p. 32.
93 Through payments for DG at the utility’s avoided generation cost, a precursor to the FIT.
Value of DER PricingHistorically, customers were not given any price signal
about the value DER provides the electric system. DG, energy efficiency, and DER were largely ignored by utilities and regulators. This changed in the late 1970s with the passage of the Public Utilities Regulatory Policies Act (PURPA), which provided for mandatory purchase of power from customer-sited generation,93 or what we now call an FiT. It also changed with early efforts to increase end-use energy efficiency and bring it within the realm of system planning processes, through the concept of integrated resource planning (IRP).
Today, energy efficiency and demand response are rec-ognized as important resources on the electric grid and

Smart Rate Design for a Smart Future
62
customer-sited DG is on an accelerated course to become an important generating resource. DER enables the displace-ment of generation, transmission, and distribution costs on a cost-effective basis. To take advantage of this, appropriate rate design and planning processes will need to be in place.
DER Compensation FrameworkA number of compensation mechanisms have been
considered by regulators for distributed resources. They range from value to grid approaches using avoided costs to the establishment of a system of distribution credits.94 What value the distributed resource provides to the grid is determined using avoided cost calculations that can be made systemwide or, preferably, are location specific. While the former uses an average rate for DER, the latter is based on location-specific costs and projected growth rates.
Locational Value of DERPostage stamp rates are a form of cost averaging among
customers in the same rate class that is taken for granted by many rate analysts. Urban and multi-family customers require less investment in distribution facilities per customer or per kilowatt-hour than suburban and rural customers, but nearly all utilities charge all residential customers the same rates and do not distinguish on that basis.95 Customers with overhead distribution service are cheaper to serve (but have more outages) than customers with underground service. But with nearly all utilities both pay the same rates. Customers with low usage may use only their ratable share of existing low-cost resources, and not require the more expensive new resources that drive many rate increases.
Providing incentives or preferential pricing for DER located in areas of congestion can be beneficial to the distribution system. Critically sited and timely DER can lead to the postponement or avoidance of costly upgrades. A distribution utility would have to make known preferential locations to prospective DER developers and provide some form of incentive.96
Some of the earliest energy-efficiency programs operated by electric utilities were directed at locations with impending reliability problems due to distribution system constraints.97 “Hot spots” on the distribution system stem from congestion linked to overloading of the distribution infrastructure. Locational marginal pricing (LMP) provides a mechanism for revealing the cost of supplying the next unit (e.g., megawatt) of load at a specific location or node in order to send a price signal for avoiding or eliminating congestion. It takes into account bid prices for generation, the flow of power within the transmission system, and power transfer constraints.98 LMP is a tool targeted primarily at organized hourly or daily wholesale markets, although its underlying framework is applicable at the retail level. However, retail customers are not typically in a position to respond to a dynamic LMP regime. An approach tailored to the retail market is required to implement the concepts of LMP at that level.
The pragmatic way to reflect locational values to residential and small commercial consumers is through targeted incentives for peak load management, as are typically provided by energy-efficiency suppliers and demand response aggregators, not necessarily through complex retail rate designs that consumers may be
94 Moskovitz, D. (2001, September). Distributed Resource Distribution Credit Pilot Programs: Revealing the Value to Con-sumers and Vendors. Montpelier, VT: Regulatory Assistance Project. Available at: http://www.raponline.org/docs/RAP_Moskovitz_DistributedResourceDistributionCreditPilotPro-grams_2001_09.pdf
95 Commonwealth Edison and NV Energy are notable exceptions, with lower rates for multi-family consumers.
96 The State of Vermont, for example, designates specific areas for Efficiency Vermont to target with peak load reduction measures each year. See https://www.efficiencyvermont.com/About-Us/Energy-Efficiency-Initiatives/Geographic-Targeting. See also Greentech Media. (2014, July 21). Con Ed Looks to Batteries, Microgrids and Efficiency to Delay $1B Substation Build. Available at: http://breakingenergy.com/2014/07/21/con-ed-looks-to-batteries-microgrids-and-efficiency-to-delay-1b-substation-build
97 Tacoma Power, 1979, and Snohomish Public Utility District, 1983-84, both concentrated energy efficiency on electrically heated homes located on stressed distribution substations.
98 Arsuaga, P. (2002). Primer on LMP. Available at: http://www.elp.com/articles/print/volume-80/issue-12/power-pointers/primer-on-lmp.html. A nodal price in an LMP system is the incremental increase in total system cost associated with supplying the next increment of load at a specific location or bus. In a constrained system, the next increment of load at a given bus is typically supplied by adjusting the output of more than one generator, each contributing to the load in a ratio dictated by the physical attributes of each system and the location of the bus relative to other elements in the system. Typically, the output of some generators must be decreased when the output of other generators is increased, to prevent the flow on constrained lines from exceeding the constraint.

Smart Rate Design for a Smart Future
63
unlikely to understand. Candidate zones are those that are approaching the maximum capacity of the affected part of the grid, with low to moderate growth rates over the medium to long term.99 When DER is placed in a congested area or otherwise desirable location with respect to the grid, a pricing approach based on the utility’s avoided costs provides compensation to the DER customer. In this manner, DER that is tactically located and more valuable to the utility will receive greater compensation than DER that is built simply to serve a customer’s generating load. One way to compensate the customer is through the use of a distribution rate credit, which pays a premium (above the generally applicable rate) for distributed resources that locate in an area targeted for near-term distribution upgrades and which accommodate postponement or avoidance of the upgrade. The same is true for other DER resources such as demand response and energy efficiency.
All of these scenarios offer opportunities for better association of costs with prices. The question for regulators may be more a matter of customer acceptance than one of theory, because customers located physically close to one another, but served on different distribution circuits, would see different pricing and programmatic incentives. In addition, regulators would want to consider whether the costs associated with any form of location pricing, especially where whole new rate classes are created, is worth the benefits to the affected customers.
Other Benefits of DERSeparating out the existing cost analysis into its
constituent parts — energy, demand, and ancillary services — can also support smarter demand response and DER investment. Providing a market for DER-provided ancillary services will support DER investments that help the grid’s reliability and resiliency. For example, Germany (and a current proposal in Hawaii) requires smart solar inverters to perform certain functions, such as power ramping and volt/VAR control, which lead to more grid stability and improved power quality. DER with smart inverters are more expensive, but more valuable than DER with older inverters
and should be compensated for providing that value.
Recovery Strategies for DG Grid Adaptation Costs
Recovering the costs of grid modifications associated with DG is a topic of considerable controversy. Even without a need for grid modification, in the absence of a revenue restoration mechanism such as decoupling (see “Revenue Regulation and Decoupling”), solar installations operated with NEM reduce utility revenues and may result in reallocation of non-generation costs to remaining consumers if growth on the system does not absorb these costs. With very high levels of renewable energy, additional distribution system and generation costs will likely be incurred to integrate more distributed and intermittent resources. Utilities and consumer advocates may seek to recover these costs during the hours that DG customers are net consumers from the grid. However, whether this is appropriate depends on the associated benefits that DG provides to all non-DG customers.
In Hawaii, where these modifications are more imminently needed, Hawaiian Electric has proposed a significant revision in compensation to solar generators as part of a proposal to raise the cap on allowed levels of solar installation. The Hawaiian Electric proposal in the short run includes lower compensation to new solar producers for power fed to the grid, and in the long run includes higher monthly fixed charges to recover grid costs. The reaction has been hostile from affected interests — consumers and the solar industry alike. The Hawaii PUC Chairman reached an agreement100 with Hawaiian Electric to resume rapid approval of solar connections, but without approval of the lower compensation for power fed to the grid; consideration of higher fixed charges was retracted by the utility in the context of a pending merger application.
This work in Hawaii may be a postcard from the future for mainland utilities. The overall plan to adapt to high levels of DG in Hawaii, motivated in large measure by a determination to dramatically reduce the amount of fuel oil required by the Hawaiian economy,101 includes
99 See Shirley, W. (2001). Distribution System Cost Methodologies for Distributed Resources. Montpelier, VT: Regulatory Assis-tance Project. Available at: http://www.raponline.org/docs/RAP_Shirley_DistributionCostMethodologiesforDistributed-Generation_2001_09.pdf
100 Hawaii PUC. (2015, February 27). PUC Chair and HECO President Sign Agreement to Address Residential PV Inter-
connection [Press release]. Available at: http://puc.hawaii.gov/wp-content/uploads/2015/03/NewRelease.20150227.pdf
101 For more detail on the Hawaii Clean Energy Initiative, see: http://www.hawaiicleanenergyinitiative.org/about-the-hawaii-clean-energy-initiative/.

Smart Rate Design for a Smart Future
64
the following examples of grid modifications, beginning adjacent to the consumer premises and working upstream:
• Line transformer: Line transformers must be sized to handle the maximum flow in either direction. Where multiple residential or small business consumers share a transformer, the transformers are normally sized based on the estimated coincident peak usage or DG generation of the customers served by that transformer. This is significantly less than the sum of the individual customer peaks, because different consumers use power at different hours. However, if all of these customers have solar systems installed, it is more likely that they will be exporting simultaneously, and it is possible that the transformer may need to be sized to their coincident export peak, which can be larger than the consumption peak for which transformers have historically been sized. A customer-specific transformer charge is one approach for allocating and recovering the costs of such a resized transformer; a simple TOU tariff for all delivery service is another. Our basic rate design provides for direct recovery of line transformer costs from the customers using them, so a solar customer that requires an augmented line transformer capacity will bear this cost directly.
• Circuit capacity: Until installed solar significantly exceeds the circuit capacity, upgrades to circuit capacity will not be required. Even when the solar systems are producing their maximum output, as long as some of that generation is consumed on site at some of the generating locations, the circuit capacity will not be exceeded by exported power. However, if installed solar rises to exceed the sum of the circuit capacity plus the amount consumed on site during periods of peak generation, circuit upgrades of conductors may be required. Nevertheless, even Hawaiian Electric, depicted above, has estimated that installed solar can safely reach 250 percent of the minimum daytime load without requiring major circuit modifications if smart inverters are required.
• Smart inverters: Hawaii is requiring that new inverters be capable of “riding through” system disturbances, avoiding a situation where a failure of a resource on one part of the system results in other resources tripping off-line, compounding a minor outage. Requiring new inverters to also include the ability to provide voltage and frequency support to the grid may be cost-effective, and should be
considered. If they are required, compensation to the owner for the value of these services needs to be addressed.
• Voltage regulation: High levels of solar penetration result in power being injected into the distribution circuits at different points at different times of the day. If power flows downstream from the substations to loads during non-solar hours, and upstream to substations from distributed generators during the solar day, it may be necessary to install voltage regulators at additional points along the distribution circuit. While not prohibitive in cost, these can add up across an entire electric utility service territory. At the same time, these devices enable avoidance of central station generation, transmission, and distribution substation upgrades, which are far more expensive, so all consumers generally benefit.
• Substations: If and when an individual circuit is generating more power from distributed generation than the consumers on the circuit are using, power will flow to the low-voltage bus of the distribution substation. In urban and suburban areas, where multiple circuits connect at the bus, excess power will simply flow to the other circuits on that bus. The substation itself will only experience a lower level of demand for power supplied from the transmission side of the substation. If flows exceed the demand of all circuits combined — something that might occur when 20 percent or more of the consumers served by a substation have PV installations — then the power will flow “backward” through the substation, meaning what is normally a step-down function becomes a step-up function. Substations may need additional voltage regulators installed or, in an extreme case, a replacement multi-tap station transformer, to accommodate reverse flows. New station transformers deliver line loss reductions and other benefits that may fully offset the incremental costs.
• Generation: On most utility systems in the United States, many utilities are interconnected in large networks, with tens of thousands of megawatts of interconnected generating units dispatched to meet demand in an economic fashion. Simply by retiring older, less-flexible steam generation; adding more flexible newer generation; and implementing cost-effective energy efficiency programs, demand-response programs, time-varying prices, and greater inter-regional cooperation, most regions can adapt

Smart Rate Design for a Smart Future
65
their power supply to a high-renewables future.102 On island systems, like Hawaii, this is more challenging, and deployment of electricity storage may be an important component of this transition.
• Demand response: Most regions of the United States have begun implementing demand response programs to reduce loads during extreme circumstances. More innovative programs, like grid-integrated water heating and storage air conditioning may be cost effective ways to add flexibility to better enable adaptation to a high-renewables future.103
Hawaii may be leading the nation in change, but dockets have been convened in Arizona, Colorado, California, New Mexico, and other states examining the appropriate way to recover grid costs from DG customers, including the cost of grid modifications needed to adapt to high levels of solar. In general, regulators will be faced with the following issues:
• Value of solar: Should the value of solar energy, including avoided generation, transmission, distribution, fuel cost risk, fuel supply risk, environmental benefits, and other factors be considered?
• Recovery of existing distribution costs: Should existing distribution costs be recovered volumetrically, or through some sort of fixed charge or demand charge?
• Recovery of incremental distribution costs: If grid modifications are incurred to adapt to increased penetration of customer-sited DG, will these costs be recovered directly from the DG customers or spread to all distribution customers?
• Recovery of stranded generation costs: If demand for grid-supplied power decreases, will solar customers bear a share of cost recovery for generating resources that are retired? Will non-DG (grid-dependent) customers bear these costs?104
• Recovery of new generation costs: If new flexible generation must be added to serve the more variable usage of solar customers (zero during the solar day; unchanged, i.e., traditional consumption at night), should these costs be recovered from all customers or only from solar customers?
The outcome of these investigations will produce different results, state by state. In general, states looking ahead at marginal costs will recognize that solar customers are bringing great value to the system and will enjoy lower costs over the long run, while states focused on embedded cost concepts will see stranded cost issues, but experience higher costs over the long run.
Following the guidelines below should ensure that solar and other residential consumers are treated equitably:
• Customer charges: Should not exceed the customer-specific costs associated with an additional customer, such as the service drop, billing, and collection.
• Energy charges: Should generally be time-varying and those time differentiations should apply both to power delivered by the utility to customers and to power delivered to the utility from customer generation. This assures that solar output is valued appropriately, and high-cost periods are reflected in the prices charged to customers using power at those times. It may be appropriate to make time-varying rates mandatory for solar customers, but optional for small-use non-solar customers.
• Minimum bills: Where utilities have high numbers of seasonal customers who only consume power during the summer or winter, an annual minimum bill may be an appropriate rate design to ensure a minimum level of revenue from customers in this category. However, minimum bills are not a particularly desirable rate design as a rule.105
• Demand or connected load charges: Demand charges are only relevant for recovery of the relatively
102 See Lazar, J. (2014). Teaching the “Duck” to Fly. Montpelier, VT: Regulatory Assistance Project. Available at: http://www.raponline.org/document/download/id/6977
103 See Cowart, R. (2003). Dimensions of Demand Response. Montpelier, VT: Regulatory Assistance Project. Available at: http://www.raponline.org/docs/RAP_Cowart_NEDRIOverview_2003_11.pdf; and Taylor, B. and Taylor, C. (2015). Demand Response: Managing Electric Power Peak Load Shortages with Market Mechanisms. Beijing: Regulatory
Assistance Project. Available at: http://www.raponline.org/document/download/id/7527
104 This is normally a question for vertically integrated utilities and not for restructured utilities, where the generation is supplied separately by unregulated suppliers.
105 See Lazar, J. (2015). Electric Utility Residential Customer Charges and Minimum Bills. Montpelier, VT: Regulatory Assistance Project. Available at: http://www.raponline.org/document/download/id/7361
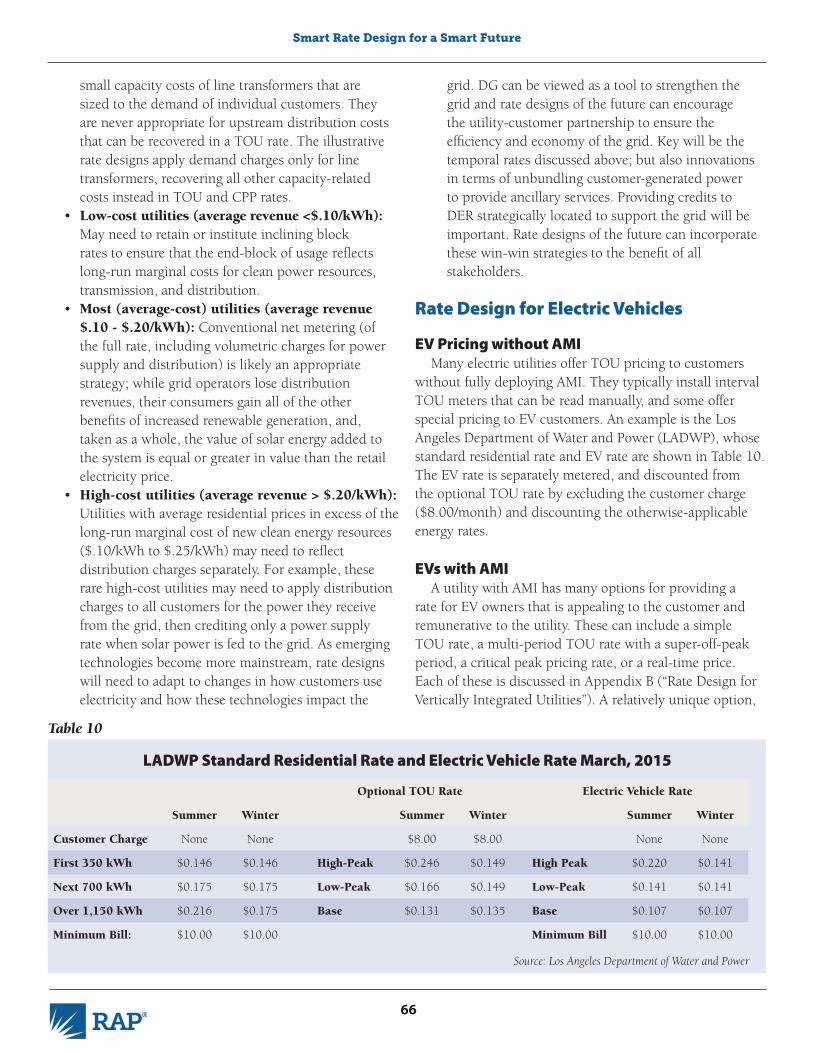
Smart Rate Design for a Smart Future
66
small capacity costs of line transformers that are sized to the demand of individual customers. They are never appropriate for upstream distribution costs that can be recovered in a TOU rate. The illustrative rate designs apply demand charges only for line transformers, recovering all other capacity-related costs instead in TOU and CPP rates.
• Low-cost utilities (average revenue <$.10/kWh): May need to retain or institute inclining block rates to ensure that the end-block of usage reflects long-run marginal costs for clean power resources, transmission, and distribution.
• Most (average-cost) utilities (average revenue $.10 - $.20/kWh): Conventional net metering (of the full rate, including volumetric charges for power supply and distribution) is likely an appropriate strategy; while grid operators lose distribution revenues, their consumers gain all of the other benefits of increased renewable generation, and, taken as a whole, the value of solar energy added to the system is equal or greater in value than the retail electricity price.
• High-cost utilities (average revenue > $.20/kWh): Utilities with average residential prices in excess of the long-run marginal cost of new clean energy resources ($.10/kWh to $.25/kWh) may need to reflect distribution charges separately. For example, these rare high-cost utilities may need to apply distribution charges to all customers for the power they receive from the grid, then crediting only a power supply rate when solar power is fed to the grid. As emerging technologies become more mainstream, rate designs will need to adapt to changes in how customers use electricity and how these technologies impact the
grid. DG can be viewed as a tool to strengthen the grid and rate designs of the future can encourage the utility-customer partnership to ensure the efficiency and economy of the grid. Key will be the temporal rates discussed above; but also innovations in terms of unbundling customer-generated power to provide ancillary services. Providing credits to DER strategically located to support the grid will be important. Rate designs of the future can incorporate these win-win strategies to the benefit of all stakeholders.
Rate Design for Electric Vehicles
EV Pricing without AMIMany electric utilities offer TOU pricing to customers
without fully deploying AMI. They typically install interval TOU meters that can be read manually, and some offer special pricing to EV customers. An example is the Los Angeles Department of Water and Power (LADWP), whose standard residential rate and EV rate are shown in Table 10. The EV rate is separately metered, and discounted from the optional TOU rate by excluding the customer charge ($8.00/month) and discounting the otherwise-applicable energy rates.
EVs with AMIA utility with AMI has many options for providing a
rate for EV owners that is appealing to the customer and remunerative to the utility. These can include a simple TOU rate, a multi-period TOU rate with a super-off-peak period, a critical peak pricing rate, or a real-time price. Each of these is discussed in Appendix B (“Rate Design for Vertically Integrated Utilities”). A relatively unique option,
Optional TOU Rate Electric Vehicle Rate
Summer Winter Summer Winter Summer Winter
Customer Charge None None $8.00 $8.00 None None
First 350 kWh $0.146 $0.146 High-Peak $0.246 $0.149 High Peak $0.220 $0.141
Next 700 kWh $0.175 $0.175 Low-Peak $0.166 $0.149 Low-Peak $0.141 $0.141
Over 1,150 kWh $0.216 $0.175 Base $0.131 $0.135 Base $0.107 $0.107
Minimum Bill: $10.00 $10.00 Minimum Bill $10.00 $10.00
Table 10
LADWP Standard Residential Rate and Electric Vehicle Rate March, 2015
Source: Los Angeles Department of Water and Power

Smart Rate Design for a Smart Future
67
grid-operator controlled charging, would allow the EV owner to request an “economy charge” by a defined time (7 am, for example) and then the grid operator would ensure the vehicle was charged by the time required by taking advantage of the communication technology in the vehicle’s charge controller and using the lowest-cost available hours during the charge window. The grid operator can thus spread the charging load among a diversity of EVs, and vary the battery charging rate from minute to minute to supply voltage support and frequency regulation ancillary services to the utility, further reducing the cost of service to charge EVs.
Public Charging Stations and Time-Differentiated Pricing
EV owners sometimes need to charge during the day, or when they are away from home. To do so, they need to be able to take advantage of public charging stations. The pricing schemes for public charging and workplace charging vary widely from, and include the following:
• Free charging: Some utilities, public agencies, and retailers offer free public charging. For the utilities and agencies, this is an overt effort to stimulate EV sales and reward EV owners. For retailers it may be a sales tool: By offering free EV charging, the retailer can attract a presumably upper-income consumer to spend an hour in their business — with an implicit assumption that the expected increased sales will more than offset the electricity cost.
• Hourly parking: In states where the regulation of electricity prices precludes the resale of electricity for vehicle charging, owners of EV charging stations commonly avoid regulation by charging hourly for parking, and charging nothing for the electricity. The hourly pricing can be time-differentiated to reflect both power supply costs and consumer demand for charging.
• Time-differentiated pricing: Some owners of EV
charging stations impose time-varying rates per kWh for EV charging, corresponding to wholesale market or utility TOU prices.
To ensure that EV charging station operators are able to implement time-varying prices, regulators and legislators need to consider whether the public interest is served by imposing regulation on EV charging,106 or whether that will discourage the availability of EV charging stations and thus suppress the EV market. Implicit in this consideration is whether the free market will function appropriately so that price regulation is not needed.
Regulators will need to determine if the public benefit of providing an infant industry subsidy to EV charging is consistent with the public interest. This consideration goes well beyond the electric utility pricing realm, into broad areas of energy security, environmental policy, and economic development.
Vehicle-to-Grid and Full System Integration of EV (Maryland/PJM RTO Pilot)
One of the great promises of EVs is that they will become fully grid-integrated, providing a market for off-peak power, a source for on-peak power, and multiple ancillary services.107 This requires a combination of sophisticated charging units in vehicles, complex pricing, and a very smart grid.108 Commonly called Vehicle-to-Grid (V2G), experiments to demonstrate this concept are underway in Maryland and Delaware through a partnership among Honda, the University of Delaware, and Delmarva Power.109 There are many questions being addressed, including the impact of utility use of vehicle batteries on battery life, compensation mechanisms for both energy storage and ancillary services as vehicles move from service territory to service territory, and methods to ensure that EV owners always have the energy they need to reach their planned destinations. While smart charging offers imminent benefits to the grid, V2G technologies will require more time to develop.
106 Regulators can pay attention to how all customers are affected by vehicle charging, and if costs for vehicle charging are spread to all customers, it should be because all customers are likely to benefit sooner or later.
107 For a discussion of this potential, see Lazar, J., Joyce, J. and Baldwin, X. (2007). Plug-In Vehicles, Wind Power, and the Smart Grid. Available at: http://www.raponline.org/docs/RAP_Lazar_PHEV-WindAndSmartGrid_2007_12_31.pdf
108 Ibid.
109 See University of Delaware. (2014). UD, Honda partner on vehicle-to-grid technology [Press release]. Available at: http://www.udel.edu/udaily/2014/dec/honda-dela-ware-v2g-120513.html

Smart Rate Design for a Smart Future
68
Green Pricing
Green pricing is an optional utility rate or service that allows customers to support a greater level of utility company investment in renewable energy technologies. Participating customers typically pay a premium on their electric bills to cover the incremental cost of the additional renewable energy.110 The funds gathered from green pricing programs are either used to develop renewable energy projects or to support existing projects by purchasing renewable energy certificates (RECs).111 Approximately 850 utilities — including investor-owned, municipal utilities, and cooperatives — offer a green pricing option.112
In restructured states, a number of Competitive Retail Electricity Suppliers (CRES) offer green products such as 100 percent wind. Interestingly, these products are very competitive with other supply options with mixed fuel sources.
Because green power customers are paying a premium for a resource that does not rely on fossil fuels, they should be exempt from any fuel adjustment mechanisms that recover varying costs for these fuels. Few regulators have addressed this important issue.113
Customer-Provided Ancillary Services
Providing rates with time-varying energy, capacity, and ancillary service components could allow DG, energy efficiency, and DR programs to be compensated for newly
recognized values that they bring to the system. Such compensation can provide additional revenue streams to these resources and make them more cost-effective for customers to deploy or utilize. It could also lead to a rebalancing of the grid investment portfolio in favor of decentralized solutions.
This is especially true in the case of ancillary services. In smart grid technology, an ancillary service supports the transmission of electricity from its generation site to the customer, may be reliability based, and may include load regulation, spinning reserves, non-spinning reserves, replacement reserves and voltage support, among other functions.114
For example, a smart grid’s built-in communications infrastructure could enable the system operator to manage water heaters and distributed resources to provide reactive power, voltage support, and other ancillary services under some circumstances. The system operator would need to have operational control over DER in order to provide these services.115 For this to happen with PV systems, the deployment of smart inverters would be required.116 Germany requires solar inverters to perform certain functions, such as power ramping and volt/VAR control, which leads to more grid stability. EPRI is developing standards that set key functionalities for smart inverters to allow them to communicate with the grid.117
Pragmatically, it makes little sense to offer rates to residential and small commercial consumers that are so detailed that they include separate charges (or credits)
110 For a list of Green Pricing Programs by state, see: http://apps3.eere.energy.gov/greenpower/markets/pricing.shtml?page=1.
111 Ibid. RECs, also known as renewable energy credits, green certificates, green tags, or tradable renewable certificates, represent the environmental attributes of the power produced from renewable energy projects and are sold separate from the associated commodity electricity.
112 Ibid.
113 For more information on green pricing, see the Center for Resource Solutions: http://www.resource-solutions.org/progs_bce.html.
114 FERC defines ancillary services as those “necessary to support the transmission of electric power from seller to purchaser given the obligations of control areas and transmitting utilities within those control areas to maintain reliable operations of the interconnected transmission system.” See Hirst, E., and Kirby, B. (1996, February).
Electric Power Ancillary Services, p. 1. Available at: http://www.consultkirby.com/files/con426_Ancillary_Services.pdf
115 Schwartz, L., and Sheaffer, P. (2011). Is It Smart if It’s Not Clean? Smart Grid, Consumer Energy Efficiency, and Distributed Generation, Part Two. Montpelier, VT: Regulatory Assistance Project, p. 9. Available at: http://www.raponline.org/docs/RAP_Schwartz_SmartGrid_IsItSmart_PartTwo_2011_03.pdf
116 IEEE 1547 is the accepted engineering standard for distributed generation that interconnects to the grid. It was develop with an eye toward maintaining system safety and integrity, but not with an eye toward maximizing the value of DG to the system. For example, inverters meeting the IEEE 1547 standard are designed to separate the DG from load in the event the grid becomes unstable or unavailable, rather than continuing to supply energy to the customer and disconnecting from the grid altogether.
117 IEEE 1547.8, the latest update to the standard, is expected to allow inverter manufacturers to provide smart grid features.

Smart Rate Design for a Smart Future
69
for ancillary services. However, aggregators of demand response that can also provide ancillary services should be well-positioned to deal with detailed tariffs.
Most programs that reward customers for allowing grid-interactive control of loads for ancillary services are priced on a “virtual” rather than “measured” basis, providing a fixed monthly bill credit in exchange for allowing the utility or demand-response aggregator a defined level of control over the air conditioner, water heater, thermostat, or other controlled load. Many provide an “override”
118 Ecofys water heater and space conditioning pilot for Bonneville Power Administration, 2012.
function allowing the customer to disengage participation when energy requirements are high, such as during a house party. These types of flexible arrangements greatly improve customer satisfaction and participation rates, and have been shown to have a very small impact on program performance.118

Smart Rate Design for a Smart Future
70
VI. Other Issues in Rate Design
Alternative Futures: Smart and Not-So-Smart
The Smart Future: Customers and Technology Unleashed
The smart future will see extensive use of technology to help consumers manage their energy costs, and utility pricing that enables these savings to occur. A mix of central generation,
DG, energy efficiency, DR, and customer response to time-varying pricing will provide a rich mix of reliable, flexible, and environmentally benign sources to provide quality service at reasonable costs.
Consumers will increasingly have smart homes, as shown in Figure 14 (page 60), with smart appliances, water heaters, thermostats, and, in many cases, electric vehicles. These will receive information from the utility or grid operator on current conditions and prices, and respond intelligently to optimize comfort and service and minimize energy bills.
Utilities will use AMI for two-way communication, learning of conditions at individual nodes on the generation, transmission, and distribution system, and then dispatching a mix of supply resources and demand management to optimize costs, emissions, and reliability.
To achieve this smart future, regulators at various levels will have to take many discrete actions, including:
• Adopting time-varying and dynamic rate designs, with consumer education, shadow billing during a pre-deployment phase, a “hold harmless” provision the first year of implementation and excellent customer support throughout.
• Implementing some form of revenue regulation to ensure that utilities retain a reasonable opportunity to earn a fair return on investment on used and useful property serving the public and maintain access to capital at reasonable prices without erecting barriers to economic innovation.
• Implementing new state building energy codes to require home energy management systems in new
homes (as most already do for commercial buildings).• Requiring that new customer-sited generation include
smart inverters, responding to provide reliability and ancillary services; enabling customer-sited batteries to not only provide service to the locations where they are installed, but to also be available to grid operators for system support; and incorporating solar orientation standards to optimize peak time production.
• Adopting appliance standards to require installation of control technologies in new major appliances such as refrigerators, water heaters, furnaces, heat pumps, air conditioners, dishwashers, clothes washers, and clothes dryers, so that they can automatically respond to changing prices.
Not-So-Smart Future
A number of electric utilities have proposed SFV rate designs in which all costs claimed to be “fixed costs” are recovered in a fixed monthly charge, and only those costs that are considered “variable” are recovered on a per-kilowatt-hour basis. While most have focused only on distribution costs, a few have gone further, proposing that the recovery of costs related to generation and transmission investment be included in monthly fixed charges.
High fixed charges provide utilities with stable revenues and address their immediate concerns, but in doing so, they punish lower-usage customers, and discourage efficiency improvements and adoption of distributed renewables. Over time these charges can lead to an unnecessary increase in consumption or, in the event that distributed storage technologies become more affordable, promote customer grid defection. The adverse impacts on electric consumers and public policy goals for electricity regulation include:
• Energy efficiency: A higher fixed charge results in a lower per-kWh rate, which leads to disproportionate savings for larger dwellings and undermines customers’ incentives to invest in efficiency improvements. For example, if a high-efficiency air
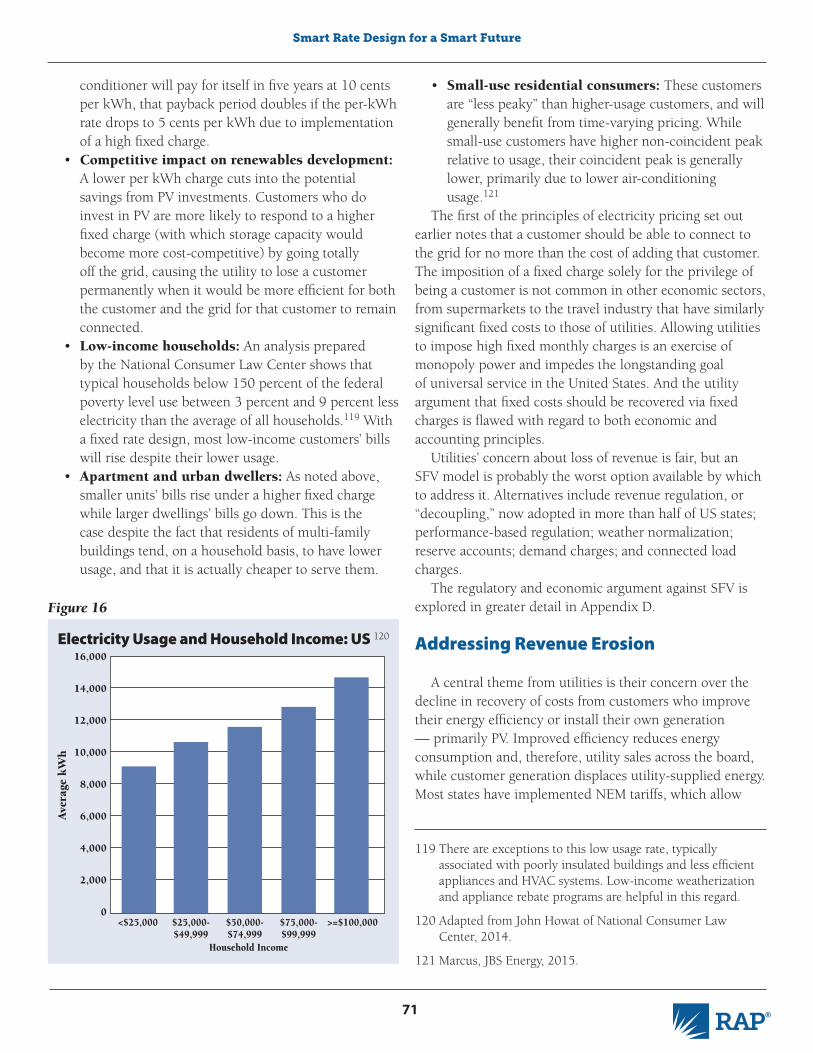
Smart Rate Design for a Smart Future
71
conditioner will pay for itself in five years at 10 cents per kWh, that payback period doubles if the per-kWh rate drops to 5 cents per kWh due to implementation of a high fixed charge.
• Competitive impact on renewables development: A lower per kWh charge cuts into the potential savings from PV investments. Customers who do invest in PV are more likely to respond to a higher fixed charge (with which storage capacity would become more cost-competitive) by going totally off the grid, causing the utility to lose a customer permanently when it would be more efficient for both the customer and the grid for that customer to remain connected.
• Low-income households: An analysis prepared by the National Consumer Law Center shows that typical households below 150 percent of the federal poverty level use between 3 percent and 9 percent less electricity than the average of all households.119 With a fixed rate design, most low-income customers’ bills will rise despite their lower usage.
• Apartment and urban dwellers: As noted above, smaller units’ bills rise under a higher fixed charge while larger dwellings’ bills go down. This is the case despite the fact that residents of multi-family buildings tend, on a household basis, to have lower usage, and that it is actually cheaper to serve them.
119 There are exceptions to this low usage rate, typically associated with poorly insulated buildings and less efficient appliances and HVAC systems. Low-income weatherization and appliance rebate programs are helpful in this regard.
120 Adapted from John Howat of National Consumer Law Center, 2014.
121 Marcus, JBS Energy, 2015.
Figure 16
Electricity Usage and Household Income: US 120
16,000
14,000
12,000
10,000
8,000
6,000
4,000
2,000
0
Ave
rage
kW
h
<$25,000 $25,000-$49,999
$50,000-$74,999
$75,000-$99,999
>=$100,000
Household Income
• Small-use residential consumers: These customers are “less peaky” than higher-usage customers, and will generally benefit from time-varying pricing. While small-use customers have higher non-coincident peak relative to usage, their coincident peak is generally lower, primarily due to lower air-conditioning usage.121
The first of the principles of electricity pricing set out earlier notes that a customer should be able to connect to the grid for no more than the cost of adding that customer. The imposition of a fixed charge solely for the privilege of being a customer is not common in other economic sectors, from supermarkets to the travel industry that have similarly significant fixed costs to those of utilities. Allowing utilities to impose high fixed monthly charges is an exercise of monopoly power and impedes the longstanding goal of universal service in the United States. And the utility argument that fixed costs should be recovered via fixed charges is flawed with regard to both economic and accounting principles.
Utilities’ concern about loss of revenue is fair, but an SFV model is probably the worst option available by which to address it. Alternatives include revenue regulation, or “decoupling,” now adopted in more than half of US states; performance-based regulation; weather normalization; reserve accounts; demand charges; and connected load charges.
The regulatory and economic argument against SFV is explored in greater detail in Appendix D.
Addressing Revenue Erosion
A central theme from utilities is their concern over the decline in recovery of costs from customers who improve their energy efficiency or install their own generation — primarily PV. Improved efficiency reduces energy consumption and, therefore, utility sales across the board, while customer generation displaces utility-supplied energy. Most states have implemented NEM tariffs, which allow

Smart Rate Design for a Smart Future
72
the DG customer to offset bills at the full retail rate. These implicitly assign a premium value to new renewable energy that is equal to the volumetric distribution price avoided by the NEM customer. Because those rates collect not just the incremental cost of generating energy delivered to the customer, but the costs of delivering that energy over the distribution and transmission systems, crediting customers with the full retail rate for the energy they produce causes a reduction in revenues that were designed to recover those costs. The rate design concepts discussed above do not address that issue. Rather, the rate designs discussed above focus on a fair and equitable allocation of costs based on the causation of those costs. Other solutions, however, are available, and this is a separate issue from revenue requirements.
Utility cost recovery and revenue stability can be addressed in many different ways, some desirable and some less desirable. Fixed charges, a higher allowed rate of return, incentive regulation, and revenue decoupling are four different approaches, all of which can serve to address the earnings volatility from sales variations. Fixed charges were previously discussed. The other approaches are discussed below.
Cost of Capital: A “Let the Capital Markets Do It” Approach
In states where revenue regulation mechanisms have not been deployed, regulators are effectively letting the capital markets set a higher rate of return for the utility. This leads to higher costs. The utility-allowed return on equity and equity capitalization ratio are the way that utilities are rewarded for taking the risks associated with serving customers at regulated prices. The return on equity is the percentage of shareholder profit allowed on the utility’s plant investment, while the equity capitalization ratio is the percentage of capital in the business that is derived from shareholders (as opposed to bondholders, who get a fixed return).
If the utility enterprise is subject to earnings variations that are a part of the business, then the business is arguably riskier than a utility without such earnings variations. A
utility exposed to earnings variations due to changes in customer usage may require a higher rate of return or equity ratio. Conversely, a utility with any sort of revenue stabilization mechanism (a fuel adjustment clause or a decoupling mechanism, as examples) would need a lower equity capitalization ratio, reducing the overall rate of return (but not the return on shareholder equity) and, in turn, educing the overall revenue requirement.
Either a higher return on equity or a higher equity ratio will increase the utility revenue requirement and ultimately lead to higher rates for customers. Thus this laissez-faire approach certainly results in higher costs to consumers over time.
Incentive Regulation: An “Incentivize Management” Approach
Incentive regulation, or performance-based ratemaking (PBR), is a large topic well beyond the scope of this rate design report. It is addressed in great detail in several other RAP publications.122 However, PBR is one way to address the revenue loss that utilities experience if customer sales decline. If the regulator sets the achievement of a defined level of sales reduction from energy efficiency as a goal, and provides a financial reward to the utility for achieving that, the regulator can make up the lost earnings that the utility experiences. Similarly, if the regulator sets a specific goal for deployment of renewable generation, and provides a financial reward to the utility for achieving that, the regulator can provide for recovery of lost earnings that the utility experiences.
The challenge in PBR is to set the objectives for the utility to be achievable but challenging, and to set the rewards to be ample but not excessive. This is complex, but can address some or all of the lost revenue challenge for utilities if properly developed and monitored and can change the utility culture toward performance that is more in line with public policy goals. PBR does require significant effort on the part of regulators to implement and monitor and can impose additional expenses on stakeholders involved in utility rate cases.
122 See Lazar, J. (2014). Performance-Based Regulation for EU Distribution System Operators. Brussels: Regulatory Assistance Project. Available at: www.raponline.org/document/down-load/id/7332; and Weston et al. (2000). Performance Based
Regulation for Distribution Utilities. Montpelier, VT: Regulatory Assistance Project. Available at: http://www.raponline.org/docs/RAP_PerformanceBasedRegulationforDistributionUtili-ties_2000_12.pdf

Smart Rate Design for a Smart Future
73
Revenue Regulation and Decoupling: A “Passive Auto-Pilot” Approach123
Revenue-based regulation, or “decoupling,” is widely used throughout the United States to insulate gas and electric utilities from revenue impacts due to sales variations. The essence of revenue regulation is that the utility regulator sets an allowed revenue level, and then makes periodic small adjustment to rates to ensure that allowed revenue is achieved, independent of changes in units (kW and kWh) sold. Revenue regulation does not assure a given profit level, only the allowed revenue recovery.
Because revenue regulation removes utility management’s incentive to increase sales, most of the electric revenue regulation mechanisms in the United States were established to facilitate more active utility involvement in energy-efficiency programs that by their nature are intended to reduce sales. The success of those programs in California, Oregon, Washington, and other states is widely attributed to the removal of the shareholder earnings impact of lower sales.124
The essence of revenue regulation is that changes in sales volumes do not result in changes in revenue. This does not always mean a rate increase, because sales sometimes rise above the levels anticipated in general rate proceedings. For example, in a year with a hotter summer or colder winter, the utility would reduce rates. In the context of DG and EV, this means that the “excess revenues” from additional sales to electric vehicles may offset the “lost revenues” due to solar or energy conservation investments.
One benefit of revenue regulation is that the utility normally receives a “formula” to reflect higher costs, such as a “revenue per customer” allowance. These do tend to lead to very small annual increases in revenues. Whether prices rise depends on whether average consumption by customers is rising or declining as the number of customers change. The use of a revenue per customer adjustment may allow the utility to maintain a total revenue trajectory sufficient to delay its next general rate case, saving both the utility and the regulator the significant costs that rate cases
involve.Revenue regulation has critics, primarily state utility
consumer advocates and some low-income advocates. Their concern is that these mechanisms result in annual increases, and that declining costs in some areas are not offset against rising costs in other areas, as occurs in a general rate case. A well-structured mechanism can address these concerns. It should be noted also that the alternatives to revenue regulation, such as SFV, may have even more serious adverse impacts on these constituencies.
A well-designed revenue regulation framework is the best option to address utility revenue attrition that energy efficiency or renewable energy deployment may cause, for the following reasons:
• The rates can remain volumetric, preserving incentives for efficient use of energy and for deployment of renewable resources;
• Customer bills remain very predictable, and linked to usage so customers can control the size of their bills;
• Small-use customers are not disproportionately affected, as they are with high fixed charges;
• Utilities, regulators, and intervenors avoid the cost of annual rate cases;
• If actual revenues exceed authorized revenues, customers can see a rate decrease;
• The framework provides transparency for customers to know what the level of revenues are; without decoupling, utilities who do not seek rate increases for long stretches may not be filing because their earnings are higher than authorized; and
• A periodic general rate case review of all costs and revenues ensures that any imbalance between costs and revenues does not persist. A three- to five-year periodic review is typical.
There is no silver bullet to address the legitimate concerns of all interests. The evidence, however, is that high fixed charges have the most adverse impacts on consumers, the environment, the economy, and society. Good rate design addresses the legitimate concerns of all major interests, provides a framework for stable regulation
123 For more information see: Lazar, J., Weston, R., and Shirley, W. (2011). Revenue Regulation and Decoupling. Montpelier, VT: Regulatory Assistance Project. Available at: http://www.raponline.org/document/download/id/902
124 See Morgan, P. (2012). A Decade of Decoupling for US Energy Utilities: Rate Impacts, Designs, and Observations. Graceful
Systems. Available at: http://aceee.org/collaborative-report/decade-of-decoupling; and Howat, J., and Cavanagh, R. (2012). Finding Common Ground Between Consumer and Environmental Advocates. Electricity Policy. Available at: http://switchboard.nrdc.org/blogs/rcavanagh/Ralph%20Cavanagh%20and%20John%20Howat_Final.pdf

Smart Rate Design for a Smart Future
74
usage blocks (or time-of-use periods), and as many as ten surcharges, credits, and taxes added to these usage-related prices.
Some utilities present all of the detail on the bill, and it can be confusing and overwhelming to the consumer. Table 11 shows an example of how the customer’s bill may look with all of the detail. To the extent that line items can be eliminated or combined, consumer confusion is likely to be reduced.
Alternatively, all of the detail can be provided, but the bill should “roll-up” all of the rate components, adjustments, taxes, surcharges, and credits into an “effective” rate that the consumer pays. Table 11 shows what the customer actually pays in each usage-related rate component and better informs customers what they will
pay if they use more electricity, or save if they use less electricity.
Utilities should be required to display the “effective” rate to customers, including all surcharges, credits, and taxes in the effective price, so consumers can measure the value of investing in energy efficiency or other measures that reduce (or increase) their electricity consumption.
Customer Revenue Responsibilities
As mentioned earlier, as customers utilize greater energy efficiency and deploy more PV, the reductions in their bills can have the effect of allocating greater cost recovery responsibility to other customers. This is often described as a cross-subsidy. However, this is an unfair characterization. In fact, the system for allocating costs among customers and customer classes has always been a dynamic one that reflects the changing characteristics of all customers over time. The fact that relative cost responsibility changes from one time period to another is not conclusive of the existence of a subsidy. This is especially true given that there is no single “correct” method of allocating costs and, even if there were one, it would by necessity have to accommodate changing consumption patterns over time. It is also unfair because the direct customer
of utilities, and enables the growth of renewable energy and energy efficiency to meet electricity requirements.
Bill Simplification
In many states, the utility bill has become a rather dense tangle of line items that represent, in many cases, a long history of policy initiatives and regulatory decisions. In many cases, they are a kind of tally of the rate-case battles won and lost by advocates and utilities, a catalogue of special charges and “trackers” dealing with particularly knotty investment and expenditure requirements. The accumulated result is often a bill that consumers find difficult to navigate. A customer’s electric bill typically consists of a monthly customer charge, one or more
Table 11
Customer Adjustments
Example of an electric bill that lists all adjustments to a customer’s bill.
Your Usage: 1,266 kWh
The rate above, with all of the surcharges, credits, and taxes applied to each of the usage-related components of the rate design.
Base Rate
Base Rate
Amount
Amount
Rate
Rate
Usage
Usage
Customer Charge $5.00 1 $5.00 First 500 kWh $0.05000 500 $25.00 Next 500 kWh $0.10000 500 $50.00 Over 1,000 kWh $0.15000 266 $39.90
Fuel Adjustment Charge $0.01230 1,266 $15.57 Infrastructure Tracker $0.00234 1,266 $2.96 Decoupling Adjustment $(0.00057) 1,266 $(0.72) Conservation Program Charge $0.00123 1,266 $1.56 Nuclear Decommissioning $0.00037 1,266 $0.47
Subtotal: $139.74 State Tax 5% $6.99 City Tax 6% $8.80
Total Due $155.53
Customer Charge $5.56500 1 $ 5.56First 500 kWh $0.07309 500 $ 36.55Next 500 kWh $0.12874 500 $ 64.37Over 1,000 kWh $0.18439 266 $ 49.05
Total Due $155.53
Source: Lazar et al, Revenue Regulation and Decoupling, 2011.

Smart Rate Design for a Smart Future
75
investment is replacing capital and other costs that the utility would otherwise have to incur and charge to all customers. That said, this is an important issue that regulators will face as energy efficiency, customer-owned generation, and storage become more prevalent.
Changes in Customer Characteristics and Class Assignments“Smart”-Enabled Customers
Even if all customers in a given class (e.g., residential or small commercial) are equipped with smart meters, they may not all be in the same position to deploy smart appliances or be able to finance energy efficiency or distributed generation in their homes or businesses — especially those who rent, rather than own, their homes or business premises. This may present a challenge for regulators in terms of assuring a sense of fairness among otherwise similarly situated customers. Ideally, the presence of additional smart technologies will actually lower costs for all customers, even those who do not have access to all of the smart bells and whistles. Regulators will need to take care in rate design to assure that all customers share in the benefits that industry changes will bring and that no customer group is left out of the mix.
Once past these issues, regulators should focus on rate design approaches that will maximize the value of smart technologies for customers who can take advantage of them. This includes all smart-metered customers, but also those with smart appliances and smart buildings. Without appropriate rate design, the value of smart technologies to those customers and to the electric system generally will not be realized.
DG CustomersAs power producers, DG customers represent a special
group of customers. Going forward, if these customers are subject to time-varying rates, they will pay for all services they receive from the utility whether at on-peak or off-peak times, and be credited for the time-differentiated value of the power they supply, also whether at on-peak or off-peak times. If they directly bear the cost of their connection to the grid (service drop, meter, billing), and if grid costs are recovered appropriately in time-varying rates, they
will pay the full cost of any service they receive from the utility. The rate design principles set forth at the beginning of this paper are crafted with this in mind. The position advocated by some, that all customers have an equal cost responsibility for grid costs regardless of usage levels, is inconsistent with how the cost of infrastructure is recovered in competitive industries, and a key purpose of regulation is to enforce the pricing discipline that competition normally provides.
Non-DG CustomersCustomers who have not deployed their own generation
systems (non-DG customers) will likely see some increase in the prices they pay for non-generation-related costs as additional customer-sited DG comes onto the grid if this results in a sales decline. This effect will be most notable with respect to distribution costs. To the extent DG and other customer resources are replacing utility capital, overall costs in utility rates may decline.
If the rate design for DG customers is properly implemented, that is, if customers are not unduly rewarded for deploying DG, the collateral benefits of DG — such as reduced line losses, deferred and avoided distribution investments, and the potential for overall reductions in the price of generation — then non-DG customers will see equitable prices for energy delivered to their meters. Regulators should account for these benefits when considering the impact of customer-owned DG on non-DG customers.
Departing CustomersCustomers who install their own generation and go “off
grid” deliver a one-time decline in system costs, to the extent that system investments are deferred or avoided by their absence. However, they do not deliver many of the benefits that grid-connected DG customers provide, because they are not injecting energy into the system at any time. Thus, reduced losses, reduced wear and tear on equipment and other savings derived from their presence are not present to benefit other customers. As discussed, regulators should avoid rate design strategies that encourage customers to depart the system when their continued presence would be a net benefit to everyone.

Smart Rate Design for a Smart Future
76
The future of the electric sector will likely include storage, microgrids, EVs, and more DER. Homes and businesses will use electricity more efficiently. As entrepreneurs continue to study consumer
behavior and a greater understanding of the operational characteristics of the electric system is revealed through smart technologies, new technologies and applications will undoubtedly develop. Change will likely be constant and subject to iterations, refinements, and new technologies. How regulators respond to these changes will matter greatly in terms of the expansion of new frontiers or perpetuation of the status quo.
Rate design will be an important driver of the success of the utility of the future at assisting with the transition to a clean power system. Utilities, customers, and third-party service providers will need the tools to manage the grid as efficiently as possible. Regulators will need to assure that benefits and costs are fairly allocated. Knowledge of and accuracy in pricing can reward customers for energy usage behavior that contributes to the reduction, rather than increase, in utility system costs.
For DG customers specifically, the price they pay or receive for electricity they either consume or provide to the grid respectively will matter greatly in terms of encouraging or discouraging the growth of this industry. Bidirectional rates with TOU pricing may offer one of the best solutions for this segment of the market. Under this rate design, the DG customer pays the full retail rate for any power con-sumed, just like any other customer. This customer is then compensated based on the same time periods, either using the retail rate or on a value basis. That value can be based on an analysis of the contribution of DG to the grid and can be set independently by a state public service commission.
Whether as a separate rate or as a proxy, the commission can use the same retail generation TOU rate used for charging customers, applied to the price at the time the DG produces power to the grid. Other benefits can be layered on to reflect additional value that a DG might provide in terms of location or other attributes.
Utility rate designs will have to more appropriately reflect
VII. Conclusions
the cost of electricity provided by the utility and the benefits that are provided to the utility system by customers. With more innovative technologies being developed and offered by utilities and third-party vendors (such as smart appliances able to respond to grid pricing signals), the need to become more geographically, temporally, and functionally granular and more precise with pricing will expand. While rates today are typically flat or inclining, these rates only send price signals about consumption and conservation. Smart rate designs will need to address not only the amount consumed but also when it is consumed and its impact on costs and other customers.
A small number of utilities offer some kind of dynamically priced rate to residential customers, whether it be a TOU rate or a PTR. As of this publication, most dynamic residential rates are offered only on a pilot basis. Some studies like that conducted by SMUD and OG&E have produced good data demonstrating the potential benefits of TOU rates for residential (including low-income) customers and the utility system as a whole.
However, for policymakers to move forward in the direc-tion of TOU pricing on a larger scale, customer education will be important to empower informed decisions about en-ergy use. Customers will also need to see the value of TOU rates and should be given a choice among rate options. Providing customers with a shadow bill that compares their monthly energy bill under a flat or inclining rate with what it would have been under a TOU rate is a good tool to edu-cate customers. Shadow bills not only educate customers as to how TOU rates work, but they also offer an opportunity for customers to analyze how that rate affects them person-ally and learn how they can reduce their electric bills.
Where a DG resource is located is an important factor in determining its value to the customer and to the electric system as a whole. DG that is strategically located at a load center can bolster voltage support and alleviate a utility’s obligation to provide additional transmission and distribution facilities, deferring or avoiding the associated costs. Rate design that rewards customers for deploying those resources helps make the economic case to build.

Smart Rate Design for a Smart Future
77
Aging grid infrastructure is a nationwide problem that will cost billions of dollars to remedy, and creative solutions that combine DG, storage, advanced metering, and other technologies should be increasingly deployed to help minimize those costs.
In addition to recognizing locational benefits in pricing, good rate design recognizes the attributes that a customer can provide in terms of energy, capacity, and ancillary services. Recognizing these attributes through appropriate price signals will allow DG, DR, and energy efficiency to access new markets that can provide additional revenue streams to improve the economics of those resources for the end-use customer. It can also lead to a rebalancing of the centralized grid portfolio in favor of a mix of flexible generation and decentralized solutions. This could become increasingly more important in the wake of concerns regarding cybersecurity and the threat of massive blackouts.
A number of rate designs have been discussed here that explore the pros and cons of those rate structures that are already frequently used as well as those that are just emerging. Viewed as a quick fix to lost revenues associated with customer engagement in energy solutions, SFV rates with high monthly fixed charges are increasingly being proposed by utilities. SFV is not a step forward, but a step backward. With new technologies becoming more prevalent, it will be important that rate designs reflect actual future changes in system costs and benefits associated with customer usage in order to properly align responsibility for costs, compensate for benefits, and send the correct price signals to all customers. SFV is the antithesis of this, creating a simplistic one-size-fits-all rate that does not align cost to cost causation and has adverse consequences for urban, multi-family, low-income, and low-use customers as well as those who invest in energy efficiency, demand response, and distributed generation. By de-linking customer use from the customer’s bill, SFV encourages wasteful consumption and sends misleading, incomplete price signals to the consumer.
The role of regulation in power sector transformation will be to develop pathways that lead to smarter solutions that optimize the value of interconnection and two-way communication for the customer and the grid. Many of these solutions will be market-driven.
Utilities have a long history of operating as a monopoly. As technology and innovation encroach on what was their exclusive domain, they will need to adapt and, to some degree, reinvent themselves. As such, power sector transformation will need to incorporate new tools to
address these changes. Rate design will be an important element.
However, there are other instruments available to prepare for and move with these changes. They include PBR and integrated distribution grid planning (IDGP), among other tools, to help protect the financial integrity of the grid while assuring that rates are fair and affordable for all customers. PBR, for example, can help change utility motivation and culture by rewarding the utility, not through a return on investments but through behavioral changes such as expanding energy efficiency and DR programs, encouraging DG, making the grid more reliable, improving customer service, and increasing operating efficiency.
IDGP, just emerging in California and New York, can provide valuable information to regulators as to what is needed to keep the grid secure. Like an IRP, it can identify least-cost solutions that could include the strategic location of DG or the implementation of demand response and energy efficiency at a load site or some combination thereof.
The speed at which change takes place will vary from jurisdiction to jurisdiction and will be influenced by what customers want as well as utility culture. Regulators will have an important role to play in overseeing this transformation. There will be many pilots and projects implemented, including microgrids; storage via electric vehicle batteries or other sources; and energy efficiency programs from whole-house home performance programs to using smart, two-way communication technologies to manage water heaters and distributed generation in order to provide voltage support, reactive power and other ancillary services. Learning from pilots and experiments is a new duty for regulators, and will require additional resources.
A critical component of unlocking the real value of these changes will be the utilization of time-differentiated pricing and the connection of customer and system operator level technologies that will allow a more dynamic interaction between the two. Rather than the traditional model of simply building the necessary supply-side resources to meet an unmitigated demand for energy, smart grids, meters, homes, buildings, and appliances will need to become a more interconnected whole that yields a more optimum cost and engineering solution than previously experienced.
In the interim transition to this future, regulators should strive to avoid expensive mistakes based on defense of the legacy structure of the industry. In their stead, regulators will need to focus on identifying costs and benefits of alternative strategies and seek to maximize the net value to customers and society.

Smart Rate Design for a Smart Future
78
Appendix A: Dividing the Pie: Cost Allocation, the First Step in the Rate Design Processhttp://www.raponline.org/document/download/id/7766
Cost allocation among customer classes, commonly called the “cost of service” study, is the first step in the rate design process. In the past, cost allocation followed historically evolved methods in each state, with costs divided into “customer,” “demand,” and “energy” costs. With the evolution of demand response as the lowest-cost peak capacity resource, the ability to measure usage for all classes by time of day, and the use of smart meters not only for customer billing but also for energy conservation and peak load management purposes, these historical methodologies require fundamental revision.
In general, only customer-specific costs, such as billing and collection, are properly considered customer-related costs. Most grid costs and power supply costs are best treated as time-varying volumetric costs, not as simple “demand” or “energy” costs.
Appendix A provides a greater discussion of these issues. A significantly more in-depth publication is tentatively planned in 2016 and will address cost allocation.
Guide to AppendicesThese accompaniments to the main paper can be found in our online library at the links below.
Appendix B: Rate Design for Vertically Integrated Utilities: A Brief Overviewhttp://www.raponline.org/document/download/id/7767
Most electric utilities in the United States have had relatively simple rate designs for residential consumers. These consist, generally, of a monthly fixed customer charge that collects customer-specific costs like billing and collection, and one or more energy blocks that collect all other costs. Some utilities have seasonal rates, some have inclining block rates, and many offer optional time-varying rates. A few have moved to include distribution costs within the monthly fixed customer charge, while others use a minimum bill form, rather than a customer charge, to collect some revenue from very low-use consumers.
Appendix B provides a greater discussion of current rate designs. In addition, detail can be found in these previous publications on this topic:
• Distribution System Cost Methodologies for Distributed Generation (2001)
• Pricing Do’s and Don’ts (2011)• Time-Varying and Dynamic Pricing (2012)• Rate Design Where Advanced Metering Infrastructure
Has Not Been Fully Deployed (2013)• Designing Distributed Generation Tariffs Fairly (2014)

Smart Rate Design for a Smart Future
79
Appendix C: Restructured States, Retail Competition, and Market-Based Generation Rateshttp://www.raponline.org/document/download/id/7767
In states that have restructured, the power or generation portion of a customer’s bill is usually not provided by the incumbent utility. The distribution utility in some restructured states can acquire the power requirements for the customer, called the Standard Service Offer (SSO) or Default Service. The SSO is typically competitively procured by the distribution utility in an auction process.
In states that allow retail competition, the customer can bypass the SSO and directly select a competitive retail energy supplier from a list of certified suppliers to provide his/her power requirements. Customers can also join governmental or community aggregations to attain supplier price discounts. The competitive retail suppliers may offer rate designs for power supply that differ significantly from the SSO rate design.
The evolution of wholesale power markets has led to the development of businesses that aggregate the demand management power attributes of one or many customers and offer this resource back into the energy and capacity market at a price.
Appendix C provides a greater discussion of these topics.
Appendix D: Issues Involving Straight Fixed Variable Rate Design http://www.raponline.org/document/download/id/7771
Utilities in some parts of the United States are seeking changes to rate design that sharply increase monthly fixed charges, with offsetting reductions to the per-unit price for electricity. This approach deviates from long-established rate design principles holding that only customer-specific costs — those that actually change with the number of customers served — properly belong in fixed monthly fees. They mistakenly use the notion that short-run so-called “fixed” costs should be recovered through fixed charges. As a result, they do not appropriately reflect long-term costs, all of which are variable. The effect of this type of rate design is to sharply increase bills for most apartment dwellers, urban consumers, highly efficient homes, and customers with DG systems installed, while benefitting high-use larger homes and rural customers with above-average distribution costs. While these rates do provide revenue stability for utilities, there are more appropriate and economically sound approaches that should be used in their stead. The use of these rates risks placing consumers on an ill-advised consumption path, while putting the very viability of the industry in question.
Appendix D discusses how the future is better served by reflecting costs that are not individual customer-specific — including nearly all distribution system costs — in time-varying rates for usage that is beneficial to the public interest.

Smart Rate Design for a Smart Future
80
Glossary
Adjusted Test Year A utility’s investment, expense, and sales information used to allocate costs among customer classes and for setting prices for each customer class. Adjustments to historical data are made for known and measurable changes to reflect the operating and financial conditions the utility is expected to face when new rates are implemented. See Also: “Test Year,” “Historical Test Year.”
Adjustment Clause A rate adjustment mechanism, implemented on a recurring and ongoing basis, to recover changes in expenses or capital expenditures that occur between rate cases. The most common adjustment clause is the fuel and purchased power adjustment clause, which tracks changes in fuel costs and costs of purchased power. Some utilities have weather normalization adjustment clauses, which correct for abnormal weather conditions. See Also: “Tracker,” “Weather Normalization” and “Lost Revenue Adjustment Mechanism.”
Advanced Metering Infrastructure (AMI) A combination of smart meters, communication systems, system control and data acquisition systems and meter data management systems. Together, these allow for metering of customer energy usage with high temporal granularity; the communication of that information back to the utility and, optionally, to the customer; and the potential for direct end-use control in response to real-time cost variations and system reliability conditions. AMI is an integral part of the smart grid concept. See Also: “Smart Meter,” “Supervisory Control and Data Acquisition,” “Meter Data Management System,” “Smart Appliance,” “Smart Technology,” and “Smart Grid.”
Aggregation Bundling of multiple customers or loads to achieve economies of scale in energy markets. Aggregation also takes advantage of the diversity of loads among multiple customers and enables companies to offer price risk management services to those customers. Aggregator A company that offers aggregation services and products. Allocation The assignment of utility costs to customers, customer groups, or unbundled services based on cost causation principles.
Allowed Rate of Return The weighted cost of capital used by the regulator to determine a utility’s revenue requirement. See Also: “Cost of Capital,” “Weighted Cost of Capital,” “Cost of Debt” and “Revenue Requirement.”
Ancillary Service One of a set of services offered in and demanded by system operators that generally address system reliability and operational requirements. Ancillary services include such items as voltage control and support, reactive power, harmonic control, frequency control, spinning reserves and standby power. The Federal Energy Regulatory Commission defines ancillary services as those services “necessary to support the transmission of electric power from seller to purchaser given the obligations of control areas and transmitting utilities within those control areas to maintain reliable operations of the interconnected transmission system.”
Appliance Any device that consumes electricity. Appliances includes lights, motors, water heaters, and electronics, as well as typical household devices such as washers, dryers, dishwashers, computers and televisions. See Also: “Smart Appliance.”
Area Regulation Area regulation is one of the ancillary services for which storage may be especially well-suited. It involves managing “interchange flows with other control areas to match closely the scheduled interchange flows” and moment to moment variations in demand within the control area. In more basic terms, area regulation is used to reconcile momentary differences between supply anddemand. That is, at any given moment, the amount of electric supply capacity that is operating may exceed or may be less than load.
Avoided Cost The cost of providing additional power, including the cost of the next power plant a utility would have to build to meet growing demand, plus the costs of augmenting reliability reserves, additional transmission and distribution facilities, environmental costs, and line losses associated with delivering that power.
Baseline Rate A rate that allows all customers to buy a set allowance of energy at lower rates than additional usage.

Smart Rate Design for a Smart Future
81
Baseload Generation/Baseload Units/Baseload Capacity/Baseload Resources Electricity generating units which are most economically run for extended hours. Baseload generation is generally characterized by low short-run marginal costs (i.e., fuel) and, usually, high capital costs. Baseload resources are the “first” units dispatched to serve load. Baseload units often have operating constraints which make it difficult from an engineering or economic viewpoint to cycle their output up and down to match changes in load. Typical baseload units include coal-fired and nuclear-fueled steam generators. Capacity The ability to generate, transport, process, or utilize power. Capacity is measured in watts, usually expressed as kilowatts (kW) or megawatts (MW). Generators have rated capacities that describe the output of the generator at its bus bar when operated at its maximum output at a standard ambient air temperature and altitude. The capacity of some types of generation (e.g., combustion turbines) varies inversely with ambient air temperature and altitude. Transmission and distribution circuits have rated capacities that describe the maximum amount of power that can be transported across them and vary inversely with ambient air temperature. Transformers and substations have rated capacities that describe the amount of power that can be moved through their transformation systems and switching equipment. Generally, the capacity of any portion of the grid declines as temperatures rise. In some systems, components are said to be “thermally limited,” or limited by their physical capability to withstand the heat produced by the electric current. In other systems, notably in the Western Interconnection, the physical configuration of the system (long transmission lines and generation that is extremely remote from load centers) presents stability issues with respect to frequency, voltage and other parameters, in which case the capacity of the system is said to be “stability limited.” See Also: “Circuit.”
Capacity Firming The use of low-cost options including demand response, interruptibility, or emergency generators to supply capacity when other generating resources, including variable renewable energy resources, are not supplying energy to the grid. The fixed costs of firming resources are generally much smaller than the cost of additional dispatchable generation capacity.
Central Station/Central-Station Power Supply A generating unit that is not located at or near customer load. The term is usually used to denote generators that require high-voltage transmission, often over long distances, to deliver power from the generator to the load centers. See Also: “Customer-Sited Generation” and “Distributed Generation.”
Circuit Circuit generally refers to a wire that conducts electricity from one point to another. At the distribution level, multiple customers may be served by a single circuit that runs from a local substation or transformer to those customers. At the transmission level, the term “circuit” may also describe a pathway along which energy is transported or the number of conductors strung along that pathway. See Also: “Distribution,” “Substation,” and “Transformer.”
Class Peak Demand The combined demand of all customers in a single rate class at the point in time when that demand is at its maximum, usually during a specific historical or forecast year, during a specific month or a specific hour of the day. Class peak demands do not necessarily — indeed, usually do not — coincide with the system peak demand. Residential classes tend to experience their daily peak demand in the late afternoon and early evening. Commercial customers tend to experience their daily peak demand in early to mid-afternoon. Industrial customers may experience their peak demand at virtually any hour of the day, depending upon their internal processes and their ability to manage multiple types of loads. See Also: “Peak Demand,” “System Peak Demand,” “Coincident Peak Demand,” and “Non-Coincident Peak Demand.”
Classification A step in an embedded cost of service study in which costs are separated into demand-related, energy-related, joint, and customer-related categories. Cogeneration/Combined Heat and Power (CHP) A method of producing power in conjunction with providing process heat to an industry, or space and/or water heat to buildings. Coincident Peak Demand The combined demand of a single customer or multiple customers at a specific point in time or circumstance, relative to the peak demand of the system, where system can refer to the aggregate load of single utility or of multiple utilities in a geographic zone or interconnection or some part thereof. See Also: “Peak Demand,” “System Peak Demand,” “Class Peak Demand,” and “Non-Coincident Peak Demand.”
Community Aggregation The bundling of multiple customers into a single purchasing block, usually at a municipal or other local governmental level, but potentially including local microgrid or residential or commercial development aggregations. Competitive Retail Electricity Supplier (CRES) In states where retail competition is allowed, the party contracting with the customer to provide electric or other services.

Smart Rate Design for a Smart Future
82
Congestion A condition that occurs when insufficient transfer capacity is available to implement all the preferred schedules for electricity transmission simultaneously. Congestion prevents the economic dispatch of electric energy from power sources. Connected Load Charge A rate design in which customers pay a fixed charge based on the capacity of their service interconnection. The bigger the capacity of the interconnection, the greater the fixed charge. Connected load charges are a way of allocating and recovering the costs of, primarily, distribution system costs.
Connection Charge An amount to be paid by a customer to the utility, in a lump sum or in installments, for connecting the customer’s facilities to the supplier’s facilities.
Conservation Voltage Reduction (CVR) Using smart distribution grid sensors and controls to ensure that distribution voltages are maintained at a uniform level just above the minimum level required by electrical equipment. Sometimes called Conservation Voltage Regulation.
Cost Allocation Division of a utility’s cost of service among its customer classes. Cost allocation is an integral part of a utility’s cost of service study. See Also: “Cost of Service Study.”
Cost of Capital The costs a utility incurs borrowing money and, in the case of for-profit utilities, issuing equity to shareholders. Cost of capital includes the interest paid on debt and what is commonly thought of as the utility’s profit. For purposes of regulation, the utility’s profit is considered a cost because it represents the return on investment which shareholders demand to induce them to purchase the company’s stock.See Also: “Cost of Equity,” “Cost of Debt,” “Weighted Cost of Capital” and “Rate of Return.”
Cost of DebtThe average interest rate on all debt issued by the utility, including bonds, notes, and other instruments. In some regulatory proceedings, this is separated into long-term debt (over 1 year to maturity) and short-term debt.
Cost of EquityThe rate of return necessary for a utility to attract equity capital, as determined by the regulator using one of several different methodologies.
Cost of Service Study (COSS)A mathematical allocation of the utility’s revenue requirement among customer classes, based on the number of customers, kilowatt-hours of consumption, and capacity requirements for each class. Some states use embedded cost studies looking at historical costs, while others use marginal cost studies looking at prospective costs. There are as many ways of doing cost of service studies as there are analysts performing these studies, and the assumptions made have a significant impact on the results calculated.See also: “Embedded Cost” and “Marginal Cost.”
Criteria Pollutant/Criteria Pollution Emission The United States Environmental Protection Agency (EPA) is mainly concerned with emissions which are or could be harmful to people. EPA calls this set of principal air pollutants criteria pollutants. The criteria pollutants are carbon monoxide (CO), lead (Pb), nitrogen dioxide (NO2), ozone (O3), particulate matter (PM), and sulfur dioxide (SO2). These are distinct from carbon dioxide (CO2) pollution.
Critical Peak Pricing/Critical Period Pricing (CPP) A rate design in which a limited number of hours or other periods of the year are declared by the utility, usually on a day-ahead basis, to be critical peak demand periods. when system reliability is at risk due to generation or transmission equipment failures, and during these times, prices charged to the customer will be extraordinarily high. The purpose of critical peak pricing is to reduce demand during the small number of hours of the year when generation costs are at their highest. See Also: “Flat Rate,” “Inclining Block Rate,” “Declining Block Rate,” “Time-of-Use Rate,” “Peak Time Rebate,” “Seasonal Rate” and “Straight-Fixed/Variable Rate.”
Curtailment/Curtailment Service A reduction in customer load in response to prices or when system reliability is threatened. Price-responsive curtailment is made possible through specific curtailment programs or when offered in competitive markets as a resource. Utilities typically have a curtailment plan that can be implemented if system reliability is threatened. Critical loads, such as hospitals, police stations and fire stations, may be given high priority and be last to be curtailed in an emergency, while non-critical loads, such as some industrial and commercial customers, may be the first to be curtailed. Many customers enter into specific contracts specifying their protection from or willingness to be curtailed. They may also have interruptible tariffs which, in return for price discount, allow the utility to curtail service on short notice. See Also: “Curtailment Service Provider.”

Smart Rate Design for a Smart Future
83
Curtailment Service Provider A party that contracts with retail customers to procure the right to curtail their service under certain conditions (based on market prices or system reliability conditions), then sells that curtailment right to a utility as a service or offers it as a service in a competitive market, where it is treated as an energy resource. See Also: “Curtailment/Curtailment Service.”
Customer Charge/Basic Charge/Service Charge A fixed charge to customers each billing period, typically to cover metering, meter reading, and billing costs that do not vary with size or usage. Customer Choice The ability of a customer to choose an energy supplier. Customer choice is available in a limited number of jurisdictions where retail competition is allowed. In most instances, the choice is limited to generation supply. The delivery of that supply to the customer is typically still provided by the local monopoly utility.
Customer Class A collection of customers sharing common usage or interconnection characteristics. Common customer classes include residential (sometimes called household), small commercial, large commercial, small industrial, large industrial, agriculture (primary irrigation pumping), mining, and municipal lighting (streetlights and traffic signals). All customers within a class are typically charged the same rates, although some classes may be broken down into subclasses based on the nature of their loads (electric vehicle charging or solar photovoltaic generation customers may be placed in their own subclass), the capacity of their interconnection (e.g., the size of commercial or residential service panel) or the voltage at which they receive service.
Customer-Related Cost Costs that vary directly with the number of customers. Customer-related costs include a portion of metering, billing, and customer service costs, but do not include distribution system, transmission, or generation costs.
Customer-Sited Generation Generation located at a customer’s site. Customer-sited generation includes residential solar photovoltaic, as well as backup generating units such as are common in hospitals, hotels, and critical government facilities. Customer-sited generation is a form of distributed generation. Most customer-sited generation is “behind the meter,” meaning it operates on the customer’s side of the utility’s meter. But it may be interconnected to the grid, which requires it to operate synchronously with the electric system and makes it subject to certain operational and equipment requirements usually specified in an interconnection agreement or tariff. Output from customer-sited renewable generation is often accounted for under net energy metering tariffs. See Also: “Distributed Generation” and “Net Energy Metering.”
Declining Block Rate A form of rate design in which blocks of energy usage have declin-ing prices as the amount of usage increases. Declining block rates have largely fallen out of favor because they reward greater energy usage by the customer and do not properly reflect the increased costs associated with new resources needed to supply greater usage. They also undermine the economics of energy efficiency and renewable energy by reducing the savings a customer can achieve by reducing energy purchases from the utility. See Also: “Flat Rate,” “Inclining Block Rate,” “Time-of-Use Rate,” “Critical Peak Pricing,” “Peak-Time Rebate,” “Seasonal Rate,” and “Straight-Fixed/Variable Rate.”
Decoupling A form of revenue regulation in which the utility’s nonvariable costs are recovered through a prescribed level of revenues, regardless of the sales volume experienced by the utility. Under traditional regulation, regulators determine a set of prices (customer charge, energy charge, demand charge, etc.) that remain constant between rate cases and are based on adjusted test year sales volumes, regardless of the actual sales volume experienced by the utility. As a result, actual revenues, and implicitly utility profits, will rise or fall from expected levels as sale volumes increase or decrease. Decoupling fixes the amount of revenue to be collected and allows the price charged to float up or down between rate cases to compensate for variations in sales volume in order to maintain the set revenue level. The target revenue is sometimes allowed to increase between rate cases on the basis of a fixed inflator or on the basis of the number of customers served. The latter approach is known as “revenue-per-customer decoupling.” Full decoupling also has the effect of weather-normalizing revenues — that is, the effects of abnormal weather are removed so as to assure recovery of the target revenues. Decoupling was developed as a way to eliminate utility management’s incentive to increase profits by increasing sales and the converse incentive to undermine end-use energy efficiency and customer-sited generation, both of which reduce sales volume. Decoupling has typically been implemented in conjunction with regulator-required, utility-sponsored energy efficiency programs. See Also: “Lost Revenue Adjustment Mechanism,” “Revenue Regulation,” and “Weather Normalization.”
Default Rate/Default Service/Standard Service Offer (SSO)The rate schedule a customer will pay if a different rate option is not affirmatively chosen in a competitive or restructured framework. When new rate designs are offered or experimental rates are implemented, it is typical for the utility to either use an opt-in or opt-out approach for determining what rate a customer will pay. In opt-in cases, the default rate is usually the same rate the customer would have paid before the new rate design was made available. In opt-out cases, the default rate is the rate associated with the new rate design. In the context of competitive markets and retail competition, the default rate is the rate the customer will pay if a competitive alternative is not affirmatively chosen by the customer. See Also: “Opt-In,” “Opt-Out,” and “Default Service Customers.”

Smart Rate Design for a Smart Future
84
Default Service CustomersElectricity consumers served by a competitive or restructured utility who do not affirmatively choose a power supplier. They are served with power procured by the distribution utility under rules established by the regulator.
Demand In theory, an instantaneous measurement of the rate at which power or natural gas is being consumed by a single customer, customer class, or the entirety of an electric or gas system. Demand is expressed in kW or MW for electricity or therms for natural gas. Demand is the load-side counterpart to an electric system’s capacity. In practical terms, electricity demand is actually measured as the average rate of energy consumption over a short period of time, usually 15 minutes or an hour. For example, a 1,000-watt hair dryer run for the entirety of a 15-minute demand interval would cause a demand meter using a 15-minute demand interval to record 1 kW of demand. If that same hair dryer were only run for seven and a half minutes, however, the measured demand would only be 0.5 kW. Metering of demand requires the use of either a demand meter or a smart meter. See Also: “Capacity,” “Interval Meter,” and “Demand Charge.”
Demand Charge A charge paid on the basis of metered demand. Demand charges are usually expressed in dollars per watt units, for example kW (usually expressed as $/kW). Demand charges are common for large (and sometimes small) commercial and industrial customers, but have not typically been used for residential customers because of the high cost of demand meters. The widespread deployment of smart meters would enable the use demand charges for any customer served by those meters.See Also: “Capacity,” “Interval Meter,” and “Demand.”
Demand Meter A meter capable of measuring and recording a customer’s demand. Demand meters include conventional meters with separate demand registers, interval meters and smart meters. See Also: “Demand,” “Interval Meter,” and “Smart Meter.”
Demand Ratchet A demand charge pricing scheme that charges for demand based on the highest metered demand over multiple billing cycles, usually one year. Demand ratchets have been justified on the theory that the system must be built to meet the maximum demand placed on it and a ratchet causes customers to pay for their own contribution to that demand based on their own maximum demand. Demand ratchets fail to capture the effects of time diversity and non-coincident of a customer’s peak demand with the peak usage of any portion of the system. The increased temporal and geographic granularity of customer usage patterns made possible by smart meters obviates the need for demand ratchets and traditional demand charges. See Also: “Demand Charge.”
Demand-Related Cost Costs which are associated primarily with the maximum demand placed on the system, as opposed to costs, such as fuel, which are driven primarily by total energy consumed. The term “demand-related cost” is an artifact of the era when utilities did not have precise data on the use of each customer or customer class at different hours of the day, and a time when all generation equipment had similar capital costs. This term was often applied to either all capital and operating costs of all generation, transmission, and shared distribution plant, or else to that portion determined necessary to meet peak demand. In an era where usage can be precisely measured by time period, and costs allocated accordingly, it is a somewhat anachronistic measurement. See Also: “Energy-Related Cost.”
Demand Response (DR) Reduction in energy use in response to either system reliability concerns or increased prices (where wholesale markets are involved) or generation costs (in the case of vertically integrated utilities). Demand response must generally be measurable and controllable to participate in wholesale markets or be relied upon by system operators. Demand-Response Program A formalized system under which participating customers agree to reduce their consumption when called upon to do so. The agreement may be with their local utility (most likely under a formal tariff) or with a third-party curtailment service provider. The collective effect of the customers’ reduction can be utilized by system operators to balance supply and demand or recognized by wholesale markets as an energy resource, paid at the prevailing market rate for energy at that point in time. Most demand-response programs limit the number of hours a given customer can be called upon to reduce usage. Participating customers are paid an incentive payment, in addition to the savings on their utility bill caused by their reduction in metered usage. Distributed Energy Resources/Demand-Side Resources (DER) Any resource or activity at or near customer loads that generates energy or reduces energy consumption. Distributed energy resources include customer-sited generation, such as solar photovoltaic systems and emergency backup generators, as well as energy efficiency and controllable loads.
Distributed Generation (DG) Any electricity generator located at or near customer loads. Distributed generation usually refers to customer-sited generation, such as solar photovoltaic systems, but may include utility-owned generation placed within the distribution system. See Also: “Customer-Sited Generation.”

Smart Rate Design for a Smart Future
85
Distribution The delivery of electricity to end users via low-voltage electric power lines (usually 34 kV and below).
Distribution System The portion of the electric system used to distribute energy to customers. The distribution system is usually distinguished from the transmission system on the basis of voltage. After energy is received from a generator’s bus bar, its voltage is stepped up to very high levels where it is transported by the transmission system. Transmission system components carry energy at voltages as high 758 kW or higher and as low as 115 kV or lower. Different utilities use different voltage levels as the demarcation between transmission and distribution. Urban utilities may use a lower voltage because their systems quickly transition from long-distance transmission facilities to local distribution needs, while more rural utilities may treat higher voltage facilities as distribution because of the need to “distribute” energy over longer distances. Because energy losses increase with each passage through a transformer and as voltages decrease, there is a general design bias toward keeping energy at higher voltage levels as long as possible along the route between generation and load. Industrial customers may take service at transmission level voltages, in which case it would be inappropriate to allocated distribution system costs to them. See Also: “Generation” and “Transmission.”
Duration Curve A graphic plot depicting, on a cumulative basis, the different prices (price duration curve), demand levels (load duration curve) or resource utilization (resource utilitzation duration curve) over the course of a specific time period.
Dynamic Pricing Dynamic pricing creates changing prices for electricity that reflect actual wholesale electric market conditions. Examples of dynamic pricing include critical period pricing and real-time rates.
Economic Dispatch The utilization of existing generating resources to serve load as inexpensively as possible.
Embedded Cost A cost that has already been incurred or is unavoidable in the future. Rate cases based upon historical test years often use embedded cost-of-service studies that allocate the actual recorded historical investments (net of accumulated depreciation) and actual operating expenses among customer classes. See Also: “Cost of Service Study” and “Marginal Cost.”
Energy A unit of demand consumed over a period of time. Energy is expressed in watt-time units, where the time units are usually one hour, such as 1 kilowatt-hour (kWh), 1 megawatt-hour (MWh), etc. An appliance placing 1 kW of demand on the system for one hour will consume 1 kWh of energy.
Energy Charge A price component based on energy consumed. Energy charges are typically expressed in dollars per watt-hours, such as $/kWh or $/MWh. See Also: “Energy,” “Demand,” and “Demand Charge.”
Energy Conservation The use of any device or activity that attempts to reduce energy, especially during times of system peaks. Energy conservation is usually meant to denote behavioral changes or changes in patterns of use. For example, increasing thermostat settings in the summer or decreasing them in the winter is a form of conservation. Energy conservation may last only so long as the associated behavior or usage pattern remains in effect. See Also: “Energy Efficiency.”
Energy Efficiency The deployment of end-use appliances that achieve the same or greater end-use value while reducing the energy required to achieve that result. Higher-efficiency boilers and air conditioners, increased building insulation, and higher-energy-rated windows are all examples of energy efficiency. Energy efficiency implies a semi-permanent, longer-term reduction in the use of energy by the customer. See Also: “Energy Conservation.”
Energy Time-Shift A process by which purchasing inexpensive electric energy, available during periods when price is low, to charge the storage plant so that the stored energy can be used or sold at a later time when the price is high. Entities that time-shift may be regulated utilities or nonutility merchants. Energy-Related Cost Any cost categorized as an energy cost in a cost of service study. Energy-related costs always include costs such as fuel and purchased power and may include other costs as well. The widespread deployment of smart meters may result in elimination of other cost categories, such as demand, in favor or more sophisticated time-of-use energy rates designs that would allocate all non-customer-related costs to energy. See Also: “Fuel Cost,” “Purchased Power,” “Demand-Related Cost,” and “Customer-Related Cost.”
Externalities Costs or benefits that are side effects of economic activities and are not reflected in the booked costs of the utility. Environmental impacts are the principal externalities caused by utilities (e.g., health-care costs as a result of air pollution).
Fixed Charge Any fee or charge that does not vary consumption. Customer charges are a typical type of fixed charge. In some jurisdiction, customer are charged a connected load charge based on the size of their service panel or total expected maximum load. Minimum bills and straight/fixed variable rates are additional forms of fixed
Smart Rate Design for a Smart Future
86
charges. See Also: “Minimum Bill,” “Straight-Fixed/Variable Rate” and “Customer Charge.”
Fixed Cost An accounting term meant to denote costs that do not vary within a certain period of time, usually one year. This term is often misapplied to denote costs associated with plant and equipment (which are themselves denoted “fixed assets” in accounting terms) or other utility costs that cannot be changed in the short run. From a regulatory and economics perspective, the concept of fixed costs is irrelevant. For purposes of regulation, all utility costs are variable in the long run. The costs associated with seemingly fixed assets, such as the distribution system, are not fixed even in the short run. Utilities are constantly upgrading and replacing distribution facilities throughout their system as more customers are served and customer usage increases, and efforts to reduce demand can have immediate impacts on those costs.
Flat Rate A rate design with a uniform price per kWh for all levels of consumption. A rate design that charges a single price for all consumption, typically used to denote that form of energy rate pricing. See Also: “Inclining Block Rate,” “Declining Block Rate,” “Time-of-Use Rate,” “Critical Peak Pricing,” “Peak-Time Rebate,” “Seasonal Rate,” and “Straight-Fixed/Variable Rate.”
Frequency The cycles per second of an alternating current electric system. In most of North America, the electric system operates at a nominal 60 cycles per second (expressed in “hertz” as 60 Hz), while most of the rest of the world operates at 50 Hz. All of the generators connected to a single interconnection are required to synchronize the cycles of their own equipment to that of the entire system. From a system operator’s point of view, loads must be constantly and near-instantaneously matched to generation output in order to maintain system frequency within a narrow allowed band (e.g., 59.9 to 60.1 Hz). When the frequency exceeds allowed limits, many generators and loads are designed to automatically disconnect from the grid, which may cause serious disruptions to service, including brownouts and blackouts.
Fuel Cost The cost of fuel, typically burned, used to create electricity. Fuel types include nuclear, coal, natural gas, diesel, biomass, bagasse, wood, and fuel oil. Some generators, such as wind turbines and solar photovoltaic and solar thermal generators, use no fuel or, in the case of hydroelectric generation, virtually cost-free fuel.
Future Test Year/Projected Test Year A regulatory accounting period that estimates the rate base and operating expenses a utility will incur to provide service in a future year, typically the first full year during which rates determined in that rate case will be in effect. See Also: “Adjusted Test Year” and “Historical Test Year.”
Generation Any equipment or device that supplies energy to the electric system. Generation is often classified by fuel source (i.e., nuclear, coal, gas, solar, etc.) or by operational or economic characteristics (“must-run,” baseload, intermediate, peaking, intermittment, load following, etc.).
Green Power An offering of environmentally preferred power by a utility to its consumers, typically at a premium above the regular rate.
Grid The electric system as a whole or as a reference to the non-generation portion of the system.
Grid Integration The management of the variable power flows from generating units, maintaining power quality, and managing voltage and frequency stability. Variable renewable resources create different challenges for grid integration than conventional generating units, including minute-to-minute variations in output, periods of large wind generation shortfall, and power quality issues created by wind gusts. Historical Test Year A regulatory accounting period that measures the actual costs that a utility incurred to provide service in a 12-month period, typically adjusted for known and measurable changes that have occurred or are expected to occur afterward. See Also: “Adjusted Test Year” and “Historical Test Year.”
IEEE 1547 A industry standard governing the engineering and performance criteria for interconnection of customer-sited generation to the electric system. When a proposed interconnection meets certain criteria, it is usually allowed to proceed without any further review or approval of the utility, except for the execution of a required interconnection agreement. This is the case unless the interconnection would cause the total capacity of customer-sited generation on local parts of the distribution system to exceed certain threshold or would be expected to create a situation-specific safety or reliability hazard to the system or the public. Generally, under the terms of the original IEEE 1547, a customer-sited generator would be required to automatically disconnect from the system and the customer’s load in the event the grid fails or becomes unstable. An updated version, IEEE 1547.8, is currently being drafted for “smart inverters” to enable smart grid functions that allow system operators to communicate with the inverter, dispatch it for certain ancillary services, and allow the PV unit to continue to serve the customer’s load in the event the grid becomes unstable or unavailable. See Also: “Distributed Generation.”

Smart Rate Design for a Smart Future
87
Incentive Regulation/Performance-Based Regulation (PBR) A form of regulation in which the utility is given specific performance targets or benchmarks to achieve and is rewarded financially for meeting or exceeding them and, optionally, penalized for failing to meet them. In a sense, all regulation is incentive regulation, but, as a term of art, this refers specifically to the formal system of establishing rewards and penalties for specific performance criteria such as cost controls, reliability and customer service. See Also: “Decoupling” and “Revenue Regulation.”
Inclining Block Rate A form of rate design in which blocks of energy usage have increasing prices as the amount of usage increases. Inclining block rates appropriately, if crudely, reflect the fact that increased costs are associated with greater usage. They enhance the economics of energy efficiency and renewable energy by increasing the savings a customer can achieve by reducing energy purchases from the utility. See Also: “Flat Rate,” “Declining Block Rate,” “Time-of-Use Rate,” “Critical Peak Pricing,” “Peak-Time Rebate,” “Seasonal Rate” and “Straight-Fixed/Variable Rate.”
Incremental Cost A cost of study method based on the short-run cost of augmenting an existing system. An incremental cost study rests on the theory that prices should reflect the cost of producing the next unit of energy or deploying the next unit of capacity in the form of generation, transmission or distribution.
Independent Power Plant (IPP)/Merchant Power Plant A power plant that operates in a competitive market and is not directly included in the rates of a regulated utility or subject to general utility regulation.
Integrated Resource Planning (IRP) A public planning process and framework within which the costs and benefits of both demand and supply-side resources are evaluated to develop the least total-cost mix of utility resource options. Also known as least-cost planning.
Interconnection Agreement A contract between a utility and a customer governing the connection and operation of customer-sited generation which is operated synchronously with the electric system. See Also: “Distributed Generation,” “Net Energy Metering” and “IEEE 1547.”
Interval Meter A meter capable of measuring and recording a customer’s usage over a defined period of time.
Intervenor An individual, group, or institution that is officially involved in a rate case.
Kilowatt (kW) A kilowatt is equal to 1,000 watts. See Also: “Watt.”
Kilowatt-hour (kWh) A kilowatt-hour is equal to 1,000 watt-hours. See Also: “Watt-hour.”
Line Transformer A transformer directly providing service to a customer, either on a dedicated basis or among a small number of customers.
Load The combined demand for electricity placed on the system. The term is sometimes used in a generalized sense to simply denote the aggregate of customer energy usage on the system, or in a more specific sense to denote the customer demand at a specific point in time.
Load Following The process of matching variations in load over time by increasing or decreasing generation supply or, conversely, decreasing or increasing loads. One or more generating units or demand response resources will be designated as the load following resources at any given point in time. Baseload and intermediate generation is generally excluded from this category except in extraordinary circumstances.
Load Management Active control of customer usage levels for the purpose of avoiding the use of high-cost supply resources or in response to system reliability needs.
Long-Run Marginal Costs The long-run costs of the next unit of electricity produced, including the cost of a new power plant, additional transmission and distribution, reserves, marginal losses, and administrative and environmental costs. Also called long-run incremental costs.
Losses/Energy Losses/Technical Losses/Non-Technical Losses The energy (kWh) and power (kW) lost or unaccounted for in the operation of an electric system. Losses are usually in the form of energy lost to heat, sometimes referred to as “technical losses”; however, energy theft from illegal connections or tampered meters, sometimes referred to as “non-technical losses,” will also contribute to losses. See Also: “Energy” and “Lost Revenue Adjustment Mechanism.”
Lost Revenue Adjustment Mechanism (LRAM)A mechanism by which a regulator allows a utility to recovery the sales margins that are lost when customers participate in utility-sponsored energy efficiency or renewable energy programs. See Also “Decoupling.”

Smart Rate Design for a Smart Future
88
Marginal Cost The long-run costs of the next unit of electricity producted, including the cost of a new power plant, additional transmission and distribution, reserves, marginal line losses, and administrative and environmental costs. Long-run marginal costs should look at the cost of building a new utility system, not just the costs of augmenting output from an existing system. Also called long-run incremental costs (LRIC) or total system long-run incremental costs (TSLRIC).
Megawatt (MW) A megawatt is equal to one million watts or 1,000 kilowatts. See Also: “Watt.”
Megawatt-Hour (MWh) A megawatt-hour is equal to one million watt-hours or 1,000 kilowatt-hours. See Also: “Watt-hour.”
Meter Data Management System (MDMS) A computer and control system which gathers metering information from smart meters, makes it available to the utility and, optionally, to the customer. A meter data management system is part of the suite of smart technologies and is integral to the smart grid concept. See Also: “Smart Grid” and “Smart Meter.”
Microgrid A localized grouping of electricity sources and loads that normally operates connected to and synchronous with the traditional centralized grid (macrogrid), but can disconnect and function autonomously as physical and/or economic conditions dictate.
Minimum Bill A rate design that charges a minimum amount of money in return for a designated amount of energy, which must be paid even if they customer’s actual usage is less that amount of energy.
Minimum Charge A rate-schedule provision stating that a customer’s bill cannot fall below a specified level. These are common for rates that have no separate customer charge.
Municipal Utility (Muni)A utility owned by a unit of government, and operated under the control of a publicly elected body. About 15% of Americans are served by munis.
Net Energy Metering (NEM)/Net MeteringA rate design which allows a customer with distributed genera-tion, typically solar photovoltaic systems, to receive a bill credit at the full retail rate for all energy injected into the electric system.
Non-Coincident Demand (NCD)/Non-Coincident Peak LoadA customer’s maximum energy demand during a billing period or a year, even if it is different from the time of the system peak demand. See Also: “Coincident Peak” and “System Peak.”
Off-Peak The period of time that is not on-peak. During off-peak periods, system costs are generally lower and system reliability is not an issue. Time-of-use rates typically have off-peak prices which are lower than on-peak prices. See Also: “On-Peak.”
On-Peak The period of time when customer demand is higher than normal. During on-peak periods, system costs are higher than average and reliability issues may be present. Many rate designs and utility “programs” are oriented to reducing on-peak usage. Planning and investment decisions are often driven by expectations about the timing and magnitude peak demands during on-peak period. Time-of-use rates typically have on-peak prices that are higher than off-peak prices. See Also: “Off-Peak.”
Opt-In A way of determining whether customers will be placed on an alternative or new rate schedule. In an opt-in approach, customers will only be placed on the rate schedule if they actively choose that option. The opt-in approach assures that customers are not placed on a rate schedule without their express permission, but will typically result in fewer customers taking the new rate. See Also: “Opt-Out.”
Opt-Out A way of determining whether customers will be placed on an alternative or new rate schedule. In an opt-out approach, customers will automatically be placed on the rate schedule unless they actively to choose to stay on their existing rate schedule. The opt-out approach results in a participation rate on the new rate schedule, but risks placing customers on a rate without their knowledge and consent. See Also: “Opt-In.”
Payback Period The amount of time required for the net revenues of an investment to return its costs. This metric is often employed as a simple tool for evaluating energy efficiency measures.
Peak Demand The maximum demand by a single customer, a group of customers located on a particular portion of the electric system, all of the customers in a class, or all of a utility’s customers during a specific period of time — hour, day, month, season or year.

Smart Rate Design for a Smart Future
89
Peak Load The maximum total demand on a utility system during a period of time.
Peaking Resource/Peaking Generation/Peaker Generation that is used to serve load during periods of high demand. Peaking generation typically has high fuel costs or limited availability (e.g., pumped storage hydro generation), but often has low capital costs. Peaking generation is used a limited number of hours, especially as compared baseload generation. Peaking resources may connote non-generation resources such as storage or demand-side resources. See Also: “Baseload Generation.”
Peak-Time Rebate (PTR) A rate design which provides a bill credit to a customer who reduces usage below a baseline level during a period of high peak demand or when system reliability may be at risk. Peak-time rebates are an alternative to critical peak pricing rate designs. See Also: “Flat Rate,” “Inclining Block Rate,” “Declining Block Rate,” “Time-of-Use Rate,” “Critical Peak Pricing,” “Seasonal Rate” and “Straight-Fixed/Variable Rate.”
Photovoltaic (PV) SystemsAn electric generating system utilitzing photovoltaic cells to generate electricity from sunlight. PV systems may be either used in off-grid, stand-alone applications, or operated synchronously with the electric system by interconnecting through a power inverter which converts their output to system quality, AC power, which is synchronized with the AC cycles of the electric system. In the United States, synchronous operation requires the use of an inverter that meets the standards of IEEE 1547, in addition to possible additional requirements of the local utility.
Power Factor The fraction of power actually used by a customer’s electrical equipment compared with the total apparent power supplied, usually expressed as a percentage. A power factor indicates the extent to which a customer’s electrical equipment causes the electric current delivered at the customer’s site to be out of phase with system voltage.
Power Quality Technical metrics applied to the voltage stability, frequency, waveform, and other details of electricity supply. These include power factor (reactive power), harmonic distortion, and other factors that affect the performance of electrical and electronic equipment connected to the grid.
Price CapThe highest price allowed in the wholesale market and is a price mitigation tool. An “offer cap” is the highest price that a resource, including DR, can offer to the wholesale market. “DR” means the demand response treatment in the market.
Prudence Review The process by which a regulator determines the prudence of utility resource decisions. If a cost is found imprudent, it may be disallowed from rates. While retrospective, prudence reviews are typically determined on the basis of the information available to decision-makers at the time the decision was made.
Purchased Power Cost The cost incurred by a utility to purchase energy from another entity. Purchased power costs are usually collected through a utility’s fuel and purchased power adjustment clause and typically have no markup or profit-adder for the utility. Power may be purchased in organized markets at the market clearing price or through bilateral contracts, which may specify resource, prices, timing and other terms and have reservation or demand charges in addition to energy charges.
Rate Base The appropriate value for ratemaking purposes of the utility’s investment in utility plant and other assets, including working capital, that is “used and useful” in providing service to the public. See Also: “Used and Useful.”
Rate Case A proceeding, usually before a regulatory commission, involving the rates and policies of a public utility.
Rate Design Specification of prices for each component of a rate schedule for each class of customers, which are calculated to produce the revenue requirement allocated to the class. In simple terms, prices are equal to revenues divided by billing units, based on historical or assumed usage levels. Total costs are allocated across the different price components such as customer charges, energy charges, demand charges and each price component is then set at the level required to generate sufficient revenues to cover those costs.
Rate of Return A percentage value which is multiplied by rate base to determine a portion of the revenue requirement. The rate of return is equal to the utility’s weighted cost of capital. See Also: “Cost of Capital,” “Cost of Equity,” “Cost of Debt,” and “Weighted Cost of Capital.”
Reactive Power In an energized electric system, a portion of the energy injected into the system is initially diverted into magnetic fields. In a perfectly designed and operated system, this is a one-time injection of energy and all additional energy injected into the system is delivered to end-use appliances or lost as heat. When the system is de-energized, the energy use to create the magnetic field is recovered. In reality, some end-use appliances, typically motors as they commence operation, can draw some of their energy requirements from the magnetic field, rather than from the

Smart Rate Design for a Smart Future
90
intended flow of energy, causing the customer’s load to become out of phase with the system. Additional energy must then be injected into the system to maintain the magnetic field. This energy is termed reactive power. Customers whose equipment draws reactive power from the system are typically charged a power factor adjustment to account for this phenomenon. See Also: “Power Factor.”
Real-Time Pricing (RTP)/Dynamic Pricing Establishing rates that adjust as frequently as hourly, based on wholesale electricity costs or actual generation costs.
Reliability A measure of the ability of the electric system to provide continuous service to customers over time. Reliability is often measure in terms of “loss of load probability” (LOLP). The US-Canadian-Mexican interconnections generally experience extremely high reliability. Reliability standards are set and maintained by the North American Electric Reliability Corporation and its regional counterparts, as well as by RTOs/ISOs and electric utilities. Compliance with reliability standards is compulsory.
Renewable Energy Certificate (REC)/Renewable Energy Credit/ Green Certificate/Green Tag/Tradable Renewable Certificate Documentation of energy produced by a renewable energy resource. RECs can be severed from the energy produced and separately traded. Utilities that must comply with a renewable portfolio standard usually are required to document their compliance by possessing RECs, through their own generation or by purchasing RECs from third-parties, to document the production of energy from renewable resources. See Also: “Renewable Resources” and “Renewable Portfolio Standard.”
Renewable Portfolio Standard (RPS) A regulatory requirement that utilities meet a specified percentage of their power supply using qualified renewable resources. See Also: “Renewable Resources” and “Renewable Energy Certificate.”
Renewable Resources Power generating facilities that use wind, solar, hydro, biomass, or other non-depleting fuel sources. In some states, qualified renewable resources exclude large hydro stations or some other types of generation.
Reserve Account An allowed accumulation of revenues in excess of regularly occurring costs of service that may be drawn down in the event the utilities revenues are less than expected or its expenses are greater than expected.
Reserve Capacity/Reserve Margin/Reserves The amount of capacity that a system must be able to supply, beyond what is required to meet demand, in order to assure reliability when one or more generating units or transmission lines are out of service. Traditionally, a reserve capacity of 15–20 percent was thought to be needed for good reliability. In recent years, the accepted value in some areas has declined to 10 percent or even lower.
Reserves Shortage PricingPricing and penalties that are invoked by a system operator in cases of reduced power reserves to ensure sufficient generation is available when needed.
Restructured State/Restructured Market Replacement of the traditional vertically integrated electric utility with some form of competitive market. In some cases, the generation and transmission components of service are purchased by the customer-serving distribution utility in a wholesale competitive market. In other cases, retail customers are allowed to choose their generation suppliers directly in a competitive market. See Also: “Retail Choice.”
Retail Choice/Retail Competition A restructured market in which customers are allowed or must choose their own competitive supplier of generation and transmission services. In most states with retail choice, the incumbent utility or some other identified entity is designated as a default service provider for customers who, through inaction, do not choose another supplier. In Texas, there is no default service provider and all customers must make a choice.
Return on Equity The profit rate allowed to the shareholders of an investor-owned utility, expressed as a percentage of the equity capital invested.
Revenue per Customer/Revenue per Customer Adjustment (RPC) A form of revenue decoupling. RPC allows the target revenue for revenue decoupling to be adjusted based on the number of customers being served. In it’s usual application, at the end of a rate case the allowed revenue to be collected from each billing component (i.e., customer charge, energy charge, demand charge, etc.) is divided by the adjusted test year billing units to derive an RPC value. In subsequent periods, the allowed revenue is recomputed by multiplying the actual number of customers being served by the RPC values for each rate component. That revenue value is then divided by the actual billing units for that period to derive the new price to be charged customers. See Also: “Decoupling” and “Adjusted Test Year.”

Smart Rate Design for a Smart Future
91
Revenue Regulation A regulator approach which allows a utility to collect a target revenue level, regardless of its sales volume. The target revenue may be fixed between rate cases or may be allowed to change formulaically between rate cases. See Also: “Decoupling” and “Lost Revenue Adjustment Mechanism.”
Revenue Requirement The annual revenues that the utility is entitled to collect (as modified by adjustment clauses). It is the sum of operation and maintenance expenses, depreciation, taxes, and a return on rate base. In most contexts, revenue requirement and cost of service are synonymous.
Seasonal Rate A rate that is higher during the peak-usage months of the year. Seasonal rates are intended to reflect differences in the underlying costs of providing service associated with different times of the year. See Also: “Flat Rate,” “Inclining Block Rate,” “Declining Block Rate,” “Time-of-Use Rate,” “Critical Peak Pricing,” “Peak Time Rebate” and “Straight-Fixed/Variable Rate.”
Service Drop A transformer, conductor, pole, or underground facilities connecting a single customer to the electric system.
Smart Appliance An appliance which is capable of communicating with a customer- or utility-owned data acquisition and control system. See Also: “Smart Grid,” “Smart Meter,” and “Smart Technology.”
Smart Grid An integrated network of sophisticated meters, computer controls, information exchange, automation, and information processing, data management, and pricing options that can create opportunities for improved reliability, increased consumer control over energy costs, and more efficient utilization of utility generation and transmission resources. See Also: “Smart Appliance,” “Smart Meter,” and “Smart Technology.”
Smart Meter An electric meter with electronics that enable recording of customer usage in short time intervals and two-way communication of data between the utility and the meter (and, optionally, the customer). See Also: “Smart Appliance,” “Smart Grid,” and “Smart Technology.”
Smart Technology The collection of smart meters, smart appliances, system control and data acquisition systems and meter data management systems, which together enable utilities, system operators and customer to monitor current conditions and control one or more portions of the electric grid and connected appliances to optimize costs and reliability. See Also: “Smart Appliance,” “Smart Grid,” and “Smart Meter.”
Spinning Reserve Any energy resource which can be called upon within a designated period of time which system operators may use to balance loads and resources. Spinning reserves may be in the form of generators, energy storage or demand response. Spinning reserves may be designated by how quickly they can be made available, from instantaneously up to some short period of time.
Standby Service Support service that is available, as needed, to supplement supply for a consumer, a utility system, or another utility if normally scheduled power becomes unavailable. The unavailable source may be a third party provider or a customer-owned generator.
Straight-Fixed/Variable Rate (SFV) A rate design method that recovers all short-run fixed costs in a fixed charge, and only short-run variable costs in a per-unit charge. See Also: “Flat Rate,” “Inclining Block Rate,” “Declining Block Rate,” “Time-of-Use Rate,” “Critical Peak Pricing,” and “Peak-Time Rebate.”
Substation A facility with a transformer that steps voltage down from a portion of the system which transports energy in greater bulk and to which one or more circuits or customers may be connected.
Supervisory Control and Data Acquisition (SCADA) A collection of sensors, meters, communications equipment and computers that monitors the status of any portion of the electric system, reports that status to system operators, utilities, and optionally, customers and provides for control of system equipment and, optionally, end-use appliances to optimize costs and reliability.
System Peak Demand The maximum demand placed on the electric system at a single point in time. System peak demand may be measure for an entire interconnection, for sub-regions within an interconnection or for individual utilities or service areas.
Tariff A listing of the rates, charges, and other terms of service for a utility customer class, as approved by the regulator.
Therm A unit of natural gas equal to 100,000 Btu. The quantity is approximately 100 cubic feet, depending on the exact chemical composition of the natural gas.
Time-of-Use Rate/Time-Differentiated Rate (TOU) Rates that vary by time of day and day of the week. TOU rates are intended to reflect differences underlying costs incurred to provide service at different times of the day or week. See Also: “Flat Rate,” “Inclining Block Rate,” “Declining Block Rate,” “Critical Peak Pricing,” “Peak-Time Rebate,” “Seasonal Rate” and “Straight-Fixed/Variable Rate.”

Smart Rate Design for a Smart Future
92
Tracker A rate schedule provision giving the utility company the ability to change its rates at different points in time, to recognize changes in specific costs of service items without the usual suspension period of a rate filing. See Also: “Adjustment Clause.”
Transformer A device that raises (“steps up”) or lowers (“steps down”) the voltage in an electric system. Electricity coming out a generator is often stepped up to very high voltages (345 kW or higher) for injection into the transmission system and then repeatedly stepped down to lower voltages as the distribution system fans out to connect to end-use customers. Some energy loss occurs with every voltage change. Generally, higher voltages can transport energy for longer distances with fewer energy losses.
Transmission Voltage Voltage levels used to in the transmission system for transport of power to substations. Transmission voltages are generally above 50kV. See Also: “Transmission.”
Transmission/Transmission System That portion of the electric system designed to carry energy in bulk. The transmission system is operated at the highest voltage of any portion of the system. It usually designed to either connect remote generation to local distribution facilities or to interconnect two or more utility’s systems to facilitate exchanges of energy between systems. See Also: “Distribution” and “Generation.”
Unit Cost The costs allocated to a specific function, such as demand or energy, divided by the billing units for function (billed demand or billed energy). The result is expressed in dollars per unit, as in $/kW or $/kWh.
Used and Useful A regulatory concept — often triggered when plant is first placed in service, but applicable throughout the life of the plant — for determining whether utility plant is eligible for inclusion in a utility’s rate base. While different state courts have interpreted the concept differently, utility plant is generally considered “used” if it is actually used or is available for use in providing service to the public. This includes reserve inventories available to replace failed equipment or for upgrades and expansions anticipated in the near future, as well reasonable levels of generation “reserves” in excess of that needed to serve the utility’s anticipated peak load. Utility plant is generally considered “useful” if it is the appropriate kind of plant to be used in providing service and is available at a reasonable cost. To be included in a utility’s rate base or expenses, plant must satisfied both of these conditions. For example, a combined-cycle gas turbine might be both used and useful, while a highly inefficient oil-fired plant that cannot meet emissions requirements would not, even though they might
both be actually used to generate electricity during a rate case test year. Alternatively, that same combined-cycle plant might be useful, but unused because the utility has sufficient other resources to provide service.
Value of Solar Tariff (VOST) A tariff that pays for the injection of solar generated power into the electric system at a price based on its value. The valuation of solar is usually based on some or all of the following: avoided energy costs, avoided capital costs, avoided O&M expenses, avoided system losses, avoided spinning and other reserves, avoided social costs, any other avoided costs, less any increased costs incurred on account of the presence of solar resources, such as backup resources, spinning reserves, transmission or distribution system upgrades or other identifiable costs. A VOST is an alternative to net energy metering and non-value-based feed-in tariffs. See Also: “Net Energy Metering” and “Feed-In Tariff.”
Vehicle-to-Grid (V2G) The process of treating elecric vehicles as a distributed resource for the electric grid and allowing system operators to withdraw power from them or store energy in them or later use, with the constraint that they will be adequately charged for use when needed by the EV driver.
Volt A unit of measurement of electromotive force. Typical transmission level voltages are 115 kV, 230 kV and 500 kV. Typical distribution voltages are 4 kV, 13 kV, and 34 kV.
Voltage Support An ancillary service in which the provider’s equipment is used to maintain system voltage within a specified range. See Also: “Ancillary Service.”
Watt The electric unit used to measure power, capacity or demand. Equivalent to one joule per second and equal to the power in a circuit in which a current of one ampere flows across a potential difference of one volt. One kilowatt = 1,000 watts. One megawatt = one million watts or 1,000 kilowatts.
Watt-Hour The amount energy generated or consumed with one watt of power over the course of one hour. One kWh equals 1,000 watts consumed or delivered for one hour. One MWh equals one million watts consumed or delivered for one hour. The W is capitalized in the acronym in recognition of electrical pioneer James Watt.
Weather Normalization An adjustment made to test year sales to remove the effects of abnormal weather. Because many end uses, especially air conditioning and heating, vary with temperature, there is a direct correlation between weather conditions and energy sales. The

Smart Rate Design for a Smart Future
93
objective in weather normalization is characterize the sales a utility would have is the weather experienced during a specific period had been the same as the average weather over some sufficiently long period of time, usually 20 to 30 years. See Also: “Adjustment Clause” and “Decoupling.”
Weatherization A process or program for increasing a building’s thermal efficiency. Examples include caulking windows, weather stripping, and adding insulation to the wall, ceilings, and floors.
Weighted Cost of Capital A composite cost rate that reflects the cost of debt and cost of equity in proportion to their respective share of the utility’s capital structure. The weighted cost of capital is sometimes expressed in after-tax terms, so that income taxes on the cost of equity and tax savings on the cost of debt are accounted for. The weighted cost of capital is the rate of return normally applied to rate base in the computation of a utility’s revenue requirement. See Also: “Cost of Capital,” “Cost of Equity,” “Cost of Debt,” “Capital Structure” and “Rate of Return.”

Smart Rate Design for a Smart Future
94
Electricity Regulation in the United States: A Guidehttp://www.raponline.org/document/download/id/645
This 120-page guide offers a broad look at utility regulation in the US. Its intended audience includes anyone involved in the regulatory process, from regulators to industry to advocates and consumers. The chapters briefly touch on most topics that affect utility regulation, but do not go into depth on each topic as the discussion is intended to be short and understandable. A lengthy glossary appears at the end of this guide to explain utility sector terms.
Rate Design Where Advanced Metering Infrastructure Has Not Been Fully Deployedhttp://www.raponline.org/document/download/id/6516
This paper identifies sound practices in rate design applied around the globe using conventional metering technology. Rate design for most residential and small commercial customers (mass market consumers) is most often reflected in a simple monthly access charge and a per-kWh usage rate in one or more blocks and one or more seasons. A central theme across the practices highlighted in this paper is that of sending effective pricing signals through the usage-sensitive components of rates in a way that reflects the character of underlying long-run costs associated with production and usage. While new technology is enabling innovations in rate design that carry some promise of better capturing opportunities for more responsive load, the majority of the world’s electricity usage is expected to remain under conventional pricing at least through the end of the decade, and much longer in some areas. Experience to date has shown that the traditional approaches to rate design persist well after the enabling technology is in place that leads to change.
Time-Varying and Dynamic Rate Designhttp://www.raponline.org/document/download/id/5131
This report discusses important issues in the design and deployment of time-varying rates. The term, time-varying rates, is used in this report as encompassing traditional time-of-use rates (such as time-of-day rates and seasonal rates) as well as newer dynamic pricing rates (such as critical peak pricing and real time pricing). The discussion is primarily focused on residential customers and small commercial customers who are collectively referred to as the mass market. The report also summarizes international experience with time-varying rate offerings.
Designing Distributed Generation Tariffs Wellhttp://www.raponline.org/document/download/id/6898
Improvements in distributed generation economics, increasing consumer preference for clean, distributed energy resources, and a favorable policy environment in many states have combined to produce significant increases in distributed generation adoption in the United States. Regulators are looking for the well-designed tariff that compensates distributed generation adopters fairly for the value they provide to the electric system, compensates the utility fairly for the grid services it provides, and charges non-participating consumers fairly for the value of the services they receive. This paper offers regulatory options for dealing with distributed generation. The authors outline current tariffs and ponder what regulators should consider as they weigh the benefits, costs, and net value to distributed generation adopters, non-adopters, the utility, and society as a whole. The paper highlights the importance of deciding upon a valuation methodology so that the presence or absence of cross-subsidies can be determined. Finally, the paper offers rate design and ratemaking options for regulators to consider, and includes recommendations for fairly implementing tariffs and ratemaking treatments to promote the public interest and ensure fair compensation.
Revenue Regulation and Decoupling: A Guide to Theory and Applicationhttp://www.raponline.org/document/download/id/902
This guide was prepared to assist anyone who needs to understand both the mechanics of a regulatory tool known as decoupling and the policy issues associated with its use. This would include public utility commissioners and staff, utility management, advocates and others with a stake in the regulated energy system. While this guide is somewhat technical at points, we have tried to make it accessible to a broad audience, to make comprehensible the underlying concepts and the implications of different design choices. This guide includes a detailed case study that demonstrates the impacts of decoupling using different pricing structures (rate designs) and usage patterns.
Related Resources

Smart Rate Design for a Smart Future
95
The Regulatory Assistance Project (RAP)® is a global, non-profit team of experts focused on the long-term economic and environmental sustainability of the power sector. We provide technical and policy assistance on regulatory and market policies that promote economic efficiency, environmental protection, system reliability, and the fair allocation of system benefits among consumers. We work extensively in the US, China, the European Union, and India. Visit our website at www.raponline.org to learn more about our work.
Decoupling Case Studies: Revenue Regulation Implementation in Six Stateshttp://www.raponline.org/document/download/id/7209
This paper examines revenue regulation, popularly known as decoupling, and the various elements of revenue regulation that can be assembled in numerous ways based on state priorities and preferences to eliminate the throughput incentive. This publication focuses on six utilities: Pacific Gas and Electric Company, Idaho Power Company, Baltimore Gas and Electric Company, Wisconsin Public Service Company, National Grid-Massachusetts, and Hawaiian Electric Company, and the different forms of revenue regulation their regulators have implemented. These examples examine the details of revenue regulation and provide a range of options on how to implement revenue regulation. These specific utilities were chosen in order to represent a range of mechanisms used throughout the US and to contrast differences to provide a broader overview of the options available in designing decoupling mechanisms and to describe how they have worked to assist state regulators and utilities considering implementing revenue regulation.
Charging for Distribution Utility Services: Issues in Rate Designhttp://www.raponline.org/document/download/id/412
In this report, we evaluate rate structures for electric distribution services, including embedded and marginal cost valuation methods, approaches and principles of rate design, and interactions with competitive markets.
Pricing Do’s and Don’ts: Designing Retail Rates as if Efficiency Countshttp://www.raponline.org/document/download/id/939
Rate design is a crucial element of an overall regulatory strategy that fosters energy efficiency and sends appropriate signals about efficient system investment and operations. Rate design is also fully under the control of state regulators. Progressive rate design elements can guide consumers to participate in energy efficiency programs and reduce peak demand, yet relatively few utilities and commissions have implemented many of these elements. This RAP paper identifies some best practices. Because pricing issues tie closely to utility growth incentives, we also address revenue decoupling.

50 State Street, Suite 3Montpelier, Vermont 05602802-223-8199www.raponline.org
Related Documents


