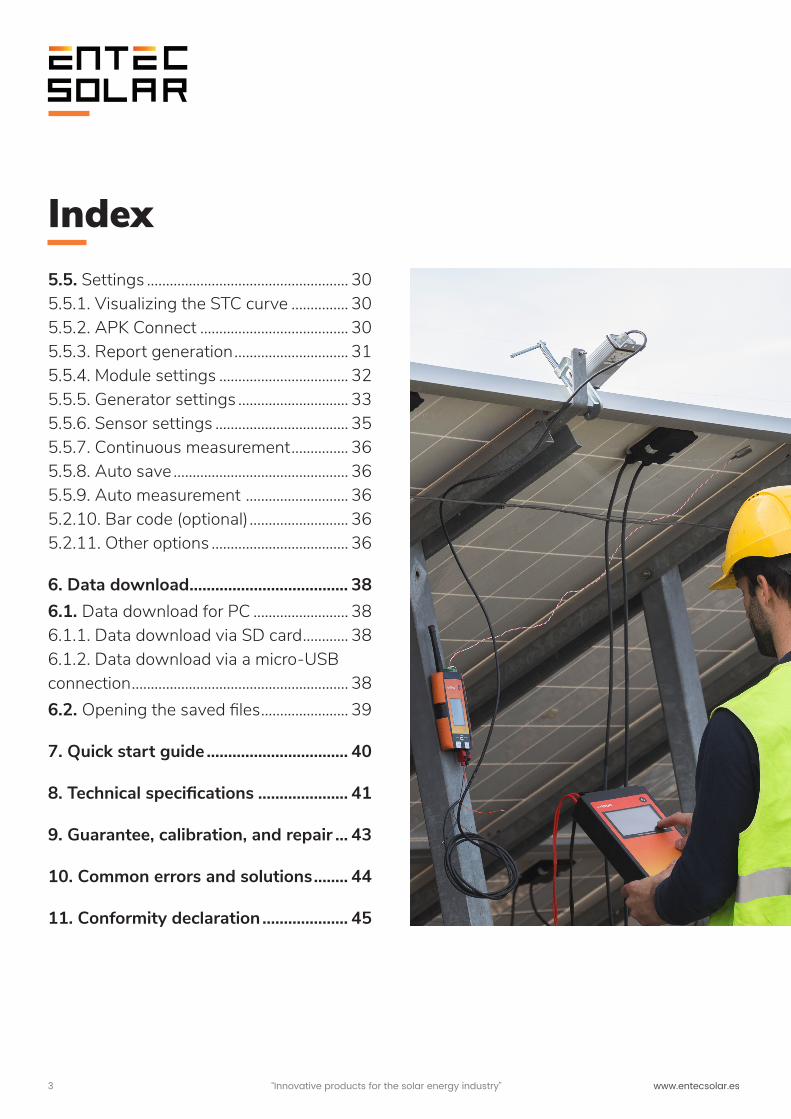
Smart I-V curve tracer Entec Solar User Manual for E-1000 and E-Sens

Welcome message from author
This document is posted to help you gain knowledge. Please leave a comment to let me know what you think about it! Share it to your friends and learn new things together.
Transcript
Smart I-V curve tracer Entec Solar
User Manual for E-1000 and E-Sens

2 “Innovative products for the solar energy industry” www.entecsolar.es
0. Thank you letter ................................... 04
1. Warnings ............................................... 05 1.1. Symbols..................................................... 06 1.2. Device safety .......................................... 07
2. General description ............................ 08 2.1. Device functionality ............................. 09 2.2. External connectors and device anatomy ............................................................. 10 2.2.1. E-1000 ................................................... 10 2.2.2. E-Sens .................................................... 11 2.3. Scope of supply ...................................... 12
3. Operating conditions to obtain accurate and consistent results ........... 13
4. Measurements preparation ............... 14 4.1. Start-up .................................................... 14 4.2. Battery charging .................................... 14 4.3. Memory card insertion ........................ 15 4.4. Initial configuration ............................... 15 4.5. Mounting and connecting the irradiance and temperature sensors to the E-Sens ...... 16 4.6. Connecting the module or generator under test .......................................................... 17
5. Configuration and operation ........... 19 5.1. Start-up ..................................................... 19 5.2. Main screen .............................................. 20 5.2.1. Main screen information .................. 20 5.2.2. Main screen control ........................... 21 5.2.2.A. TC sensor selection ....................... 21 5.2.2.B. Settings options menu ................. 21 5.2.2.C. Saving the I-V curve ...................... 21 5.2.2.D. Measuring the I-V curve .............. 21 5.2.2.E. Naming the file ................................ 21 5.3. I-V curve measurement ....................... 22 5.3.1. General considerations ..................... 22 5.3.2. Manual measurement ....................... 23 5.3.3. Auto measurement ........................... 23 5.3.4. Continuous measurement ............... 25 5.3.5. Bar code registration ......................... 26 5.3.6. E-Temp temperature measurement ................................................... 26 5.3.7. Measurement process and results ................................................................. 27 5.4. Saving the I-V curve ............................. 28 5.4.1. Manual save ......................................... 28 5.4.2. Auto save .............................................. 28 5.4.3. Saved file format................................. 29
Index
3 “Innovative products for the solar energy industry” www.entecsolar.es
Index5.5. Settings ..................................................... 30 5.5.1. Visualizing the STC curve ............... 30 5.5.2. APK Connect ....................................... 30 5.5.3. Report generation .............................. 31 5.5.4. Module settings .................................. 32 5.5.5. Generator settings ............................. 33 5.5.6. Sensor settings ................................... 35 5.5.7. Continuous measurement ............... 36 5.5.8. Auto save .............................................. 36 5.5.9. Auto measurement ........................... 36 5.2.10. Bar code (optional) .......................... 36 5.2.11. Other options .................................... 36
6. Data download ..................................... 38 6.1. Data download for PC ......................... 38 6.1.1. Data download via SD card ............ 38 6.1.2. Data download via a micro-USB connection ......................................................... 38 6.2. Opening the saved files ....................... 39
7. Quick start guide ................................. 40
8. Technical specifications ..................... 41
9. Guarantee, calibration, and repair ... 43
10. Common errors and solutions ........ 44
11. Conformity declaration .................... 45

4 “Innovative products for the solar energy industry” www.entecsolar.es
With Entec Solar’s goal of creating hardware tools to facilitate people’s work, the E-1000 curve tracer has been developed. The E-1000 I-V curve tracer has been developed in collaboration with QPV (www.qpv.es), a company specialized in audits and quality control of large photovoltaic plants, which has exposed the current needs in the measurement of I-V curves in the field. The union of Entec’s hardware development experience and QPV’s I-V curve measurement expertise has resulted in the fastest and most innovative I-V curve tracer on the market, all with an umatched measurement precision.
This high precision instrument allows the measurement of up to 200 I-V curves per working hour, either of photovoltaic modules or strings of up to 1000V and 20A. It also incorporates several new elements such as: a barcode reader for the automatic identification of the module under test and its position in the installation, an automatic report generation tool to reduce processing time, an automatic measurement option for hands-free panel measurement, a wireless sensor (E-Sens) with a communication range of up to 2km to measure irradiance and temperature conditions, an application for a mobile phone to control the device remotely , and many more options that will change the way you carry out your I-V curve measurements.
In addition, through a WiFi connection, the E-1000 is synchronized with the PVET® servers (www.pvet. es), facilitating the post-processing of measurement campaigns, storing all historical measurements, and allowing intercomparisons and data cross-checking for optimum fault diagnosis in your plants.
Thank you for purchasing the E-1000 I-V tracer

5 “Innovative products for the solar energy industry” www.entecsolar.es
1. Warnings
The E-1000 is an I-V curve tracer designed to work with voltages of up to 1,000 VDC, which can be hazardous to humans. That is why the E-1000 and its accessories should only be used with the components supplied by Entec Solar. Before using the E-1000, read this manual in its entirety and pay special attention to the points related to electrical safety and the points highlighted by the warning and risk of electric shock symbols (see section 1.2).
The use of unapproved accessories can affect the safety of this device and can cause considerable damage to equipment or people. The E-1000 should be used only by personnel trained in low voltage electrical installations and preferably with specific training in photovoltaic solar energy installations. Entec Solar will not assume any responsibility for damages caused due to misuse of the device or its associated components. The E-1000 and its components must not be manipulated, modified, opened, or repaired by any personnel other than those of Entec Solar. Any tempering of the device by third-party personnel may result in loss of equipment warranty. In case the E-1000 or any of its associated accessories or components need repair or re-calibration, please contact Entec Solar or any of its distributors.

6 “Innovative products for the solar energy industry” www.entecsolar.es
1.1 Symbols
• Continuous or reinforced double insulation (protection class II)
• Danger warning! Consult documentation! Appears in front of important instructions to prevent harming people and equipment.
• Refer to the documentation that comes with the device.
• Warning, high voltage, high fatality risk.
• The measurement devices should not be disposed of in the domestic trash bins.
!
i

7 “Innovative products for the solar energy industry” www.entecsolar.es
1.2 Device safety
The E-1000 has been designed and manufactured following the regulation EN61010-1:2011: “Safety regulations for electrical devices for measurement, control and laboratory use.” Under these standards, the E-1000 has been certified by an independent laboratory and has been approved as insulated reinforced CAT II 1000V DC device.
To ensure the security with which the device has been designed, the following rules must be scrupulously observed:
- Before using the device, read the entire manual carefully and pay special attention to the points related to electrical safety.
- Use the device only for measurements in photovoltaic installations. Other sources of current or voltage that are not of photovoltaic origin can damage or destroy the instrument.
- Disconnect the PV circuit under test from any other circuit to which it is connected to during normal operation (i.e. inverter, charge controller, battery, etc.)
- Before carrying out the measurements, make sure that they do not exceed the operating limits of the device: 1,000V and 20A. Exceeding these limits could cause irreparable damage.
- The device must be used only by personnel trained in low voltage electrical installations and must have been previously trained for the use of this specific device.
- During measurements, use the recommended personal protective equipment (PPE): insulating gloves, safety boots, face shield, etc.
- Never disconnect the device cables while a measurement is being made. This could cause an electric arc and cause damage to the device and people.
- Avoid contact with the photovoltaic circuit under test and with any other metallic object in the vicinity.
- Avoid exposing the device to direct sunlight.
- Do not carry out measurements in humid environments or in the event of rain and make sure that no liquid enters the device.
- Do not carry out measurements in environments with presence of gas or explosive, combustible materials or in dusty environments.
- Use only the original Entec Solar accessories.

8 “Innovative products for the solar energy industry” www.entecsolar.es
With the goal of creating hardware tools to facilitate field work, Entec Solar has developed the E-1000 I-V curve tracer to provide the best possible experience when measuring I-V curves of photovoltaic installations.
The E-1000 has been developed in collaboration with QPV (www.qpv.es), a company specialized in audits and quality controls of large photovoltaic power plants, which has exposed the current needs in the measurement of I-V curves in the field. The combination of Entec’s hardware development expertise and QPV’s I-V curve measurement experience has resulted in the fastest and most innovative I-V curve tracer on the market, all with an unmatched measurement precision.
This high precision instrument allows the measurement of up to 200 I-V curves per hour of work, either of photovoltaic modules or strings of up to 1000V and 20A. It also incorporates several new elements such as: a barcode reader for an automatic identification of the module under test and its position in the installation, an automatic report generation tool to reduce processing time, an automatic measurement option for hands-free operation during connection and disconnection of the tested panels, a wireless sensor (E-Sens) with a communication range of up to 2km to measure irradiance and temperature conditions, a mobile phone application to control the device remotely, and many more options that will change the way you carry out your I-V curve measurement campaigns. In addition, through a WiFi connection, the E-1000 is synchronized with the PVET® servers (www.pvet.es), facilitating the post-processing of the measurement campaigns, storing all the historical measurements, and allowing intercomparisons and data crossing for rapid and precise diagnosis of possible faults in your plants.
2. General description

9 “Innovative products for the solar energy industry” www.entecsolar.es
2.1 Device functionality
The E-1000 can be used alone or in conjunction with other accessories, such as the E-Sens, the E-Temp or the barcode reader. The use of the E-1000 with all its accessories provides the greatest comfort and precision when measuring I-V curves.
All the functionalities provided by the E-1000 and its accessories are listed below.
- Open circuit voltage, VOC measurement. (E-1000)
- Short circuit current, ISC measurement. (E-1000)
- 4-Point I-V curve measurement of up to 1000V and 20A. (E-1000)
- Irradiance measurement through a reference cell or module. (E-Sens)
- Measurement of up to three temperature points using PT-1000. (E-Sens)
- Temperature measurement of a reference module. (E-Sens)
- Temperature measurement by infrared sensor. (E-Temp)
- Wireless transmission of irradiance and temperature data. (E-1000, E-Temp)
- Extrapolation to STC using IEC-60891. (E-1000)
- Selection of the temperature sensor for extrapolation. (E-1000)
- Reading the barcode of the module under test. (E-1000)
- Automatic generation of daily reports. (E-1000)
- Automatic measurement mode. (E-1000)
- Automatic measurement saving mode. (E-1000)
- Continuous measurement mode through a selectable period. (E-1000)
- Micro-USB interface for data download to a PC. (E-1000)
- Data storage on removable SD card. (E-1000)
- Data storage on removable uSD card. (E-Sens)
- Data transmission via a WiFi connection (E-1000)
- Visualization and control with a phone app (E-1000)

10 “Innovative products for the solar energy industry” www.entecsolar.es
Figure 2.3. Lateral inputs and their descriptions.
1. Jack connection for the battery charger
2. USB input for the bar code reader
3. Micro USB input for SD card access
Figure 2.1. Top inputs and their description.
1. SMA connector for an external antenna
2. SD card slot 3. Negative pole inputs for I-V curve measurement
4. Positive pole inputs for I-V curve measurement
Figure 2.2. Frontal inputs and their description.
1. Power button
2. 5 inch color touch screen with a 800x480 resolution
2.2 External connectors and device anatomy
2.2.1 E-1000

11 “Innovative products for the solar energy industry” www.entecsolar.es
2.2 External connectors and device anatomy
2.2.2 E-sens
Figure 2.7. Lateral inputs and their description.
1. USB input for a battery charger
2. Charger level LED indicator
Figure 2.5. Frontal inputs and their descriptions.
1. Power botton
2. Color screen
Figure 2.4. Top inputs and their descriptions.
1. SMA connector for an external antenna2. uSD card slot
ch1 ch2 ch3
Figure 2.6. Shows bottom inputs and their description.
1. 60V channel2. 2V chanel
12 “Innovative products for the solar energy industry” www.entecsolar.es
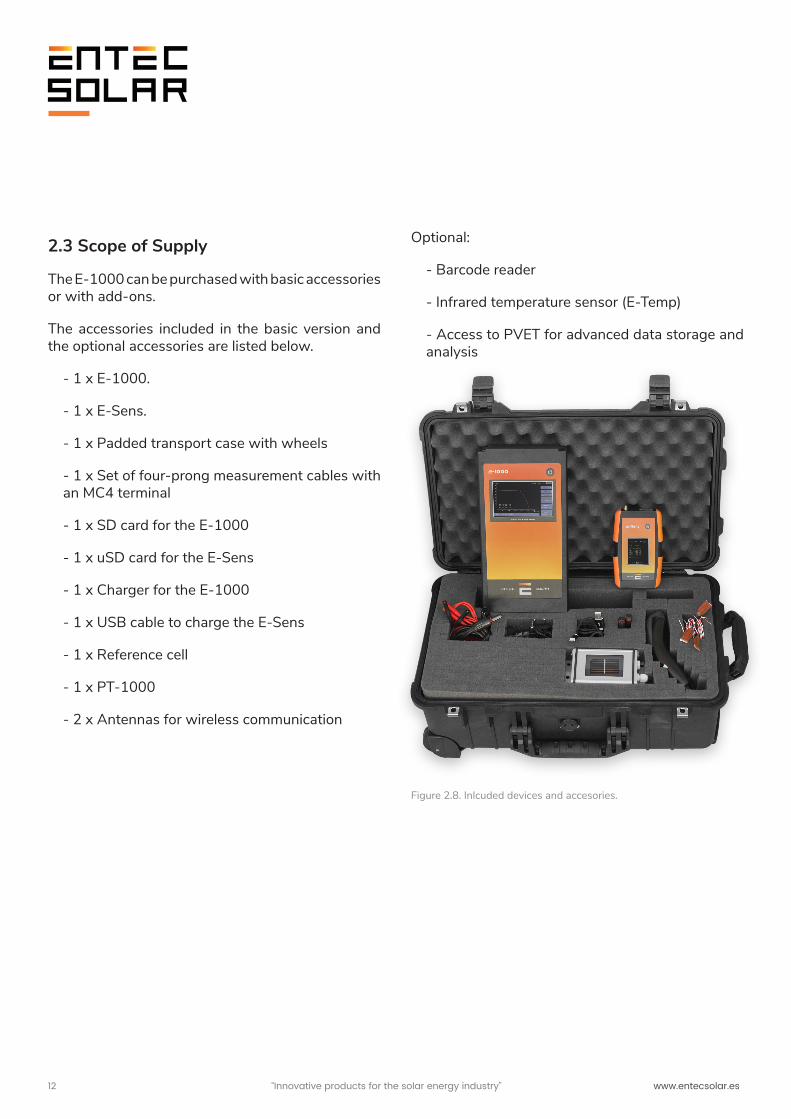
2.3 Scope of Supply
The E-1000 can be purchased with basic accessories or with add-ons.
The accessories included in the basic version and the optional accessories are listed below.
- 1 x E-1000.
- 1 x E-Sens.
- 1 x Padded transport case with wheels
- 1 x Set of four-prong measurement cables with an MC4 terminal
- 1 x SD card for the E-1000
- 1 x uSD card for the E-Sens
- 1 x Charger for the E-1000
- 1 x USB cable to charge the E-Sens
- 1 x Reference cell
- 1 x PT-1000
- 2 x Antennas for wireless communication
Optional:
- Barcode reader
- Infrared temperature sensor (E-Temp)
- Access to PVET for advanced data storage and analysis
Figure 2.8. Inlcuded devices and accesories.

13 “Innovative products for the solar energy industry” www.entecsolar.es
The I-V curves measured in real sunlight require special considerations regarding the meteorological conditions during the test. The irradiance and the temperature of the module under test are the variables that most affect the result and therefore special attention must be paid to their measurement if precise and consistent results are to be obtained. The following precautions must be taken.
For irradiance measurement:
- Carry out the measurements during periods of the day with a clear sky. If the reference cell and the circuit under test are exposed to a different irradiance levels, due to the passage of clouds for example, the results of the extrapolation to Standard Test Conditions (STC) will not be consistent.
- Ensure coplanarity and closeness between the reference cell and the circuit under test. Differences in orientation, tilt, or in measured irradiance between the reference cell and the circuit under test will result in non-coherent STC extrapolations.
- The IEC 61829 standard recommends a minimum irradiance of 700 W/m2 during measurements. However, the closer to 1000 W/m2 the irradiance, the more accurate the results will be.
- Avoid that the angle of incidence of the sun on the circuit under test greater than 40°.
For temperature measurement:
-Avoid measurements on very windy days. Wind can cause very large variations between the actual cell temperature and the measured temperatures, as well as temperature differences within the circuit under test.
When measuring modules in strings, the wind can cause large differences between the modules at the ends and those in the center of the chain or between those in the lower rows and the upper rows. Large temperature differences between the circuit under test and that measured by the E-Sens will cause inconsistent results on extrapolation to STC.
- To minimize errors due to temperature differences within the circuit under test (i.e. temperature difference between cells within a module or temperature differences between modules in module strings) it is recommended to measure the temperature at different points of the circuit.
- The IEC 61853-1 standard recommends measuring the temperature of a module in the three positions shown in Figure 3.1. and using the average of the three temperatures for extrapolation to STC. The E-1000 has been programmed to be able to carry out the average of up to three PT-1000s measured with the E-Sens or use the average with a number of points selected by the user and measured with the E-Temp.
- When measuring module string temperatures, it is recommended to take the temperature of at least three of the modules in the string, at the three points indicated in Figure 3.1. within each module. It is recommended to take one module near the end of the string and two modules from the center of the string. For this, the use of the E-Temp is very useful, which allows taking these measurements wirelessly.
Figure 3.1. An example of temperature measurement locations within a module according to IEC 61853-1.
3. Operating conditions to obtain accurate and consistent results
14 “Innovative products for the solar energy industry” www.entecsolar.es
4.1 Start-up Prior to shipment, the E-1000 has undergone rigorous quality controls during production and has been electrically and mechanically tested post-production. All functionalities have been tested and all possible precautions have been taken so that the device is delivered without any damage or malfunction. However, it is advisable to thoroughly examine the device and test its operation upon receipt before starting a measurement campaign. In case of detecting any defect or anomaly in the operation, immediately contact Entec Solar or your nearest distributor.
4.2 Battery charging
Both the E-1000 and the E-Sens contain a rechargeable lithium-ion battery. The set comes with a specific charger for the E-1000 battery and another specific charger for the E-Sens. Each charger has a different type of connector; while the E-1000 utilizes the Jack type, the E-Sens utilizes a micro-USB type. The charging connector of each device can be seen in figures 2.3 and 2.6 in sections 2.2 and 2.3.
By default, both devices are distributed charged to 60%. Before using the device for the first time, be sure to charge both batteries to 100% and use them for as long as possible.
With a fully charged battery, the E-1000 can operate for more than 10 hours, while the E-Sens can operate for more than 15 hours.
The E-1000 charger includes an LED that indicates charging status. During battery charging, this LED will be red and once the device is fully charged, it will turn green. The E-Sens charges via a standard micro-USB cable from any 5 V source, such as a USB port on a computer or a mobile phone charger.
When charging, E-Sens a red LED light located just above the micro-USB connector activates (See Figure 4.1.). When fully charged, the LED changes to green.
The battery charge status of both devices (E-1000 and E-Sens) can also be seen in the upper right corner of their respective screens (Figure 4.1.). The indicator shows the state of charge by levels where each level indicates a corresponding state (Figure 4.1.).
- A red square: battery level between 0-10%.
- A white square: battery level between 10-25%.
- Two white squares: battery level between 25-50%.
- Three white squares: battery level between 50-75%.
- Four white squares: battery level between 75-100%.
The real battery voltage is visible on the device. This value represents a more exact value of the battery charge level, where below 3.5V it is recommended to immediately charge the device. The E-Sens battery charge status indicator can also be seen on the E-1000 when both devices are turned on and connected to each other. This indicator is in the upper right corner of the screen immediately below the E-1000’s battery charge indicator (Figure 4.1.). The code that follows this indicator is the same as previously mentioned for the respective indicators of the E-1000 and the E-Sens, with the only addition that with absence of communication with the E-Sens, the battery level is shown as four blue squares. This functionality is designed to track the battery charge status remotely. Its importance lies in the fact that on a regular basis, the E-Sens will remain fixed in one location while the user moves between the circuits under test only with the E-1000.
4. Measurements preparation

15 “Innovative products for the solar energy industry” www.entecsolar.es
IMPORTANT: the charge level of the batteries are for guidance only of a standard battery type and depend on many variables such as the ambient temperature, the rate of use of the device, the battery age, manufacturing differences between different batteries, etc. These levels may change over time and cause the battery to discharge earlier than intended or even jump between levels faster than the percentages described in this section. As the device is used, these levels may change and the user should take this into account in order to not run out of battery in the middle of a measurement procedure.
4.3 Memory card insertion
The E-1000 and E-Sens store all the measured data on SD cards, the E-Sens uses a micro-SD card. Although, both devices work without these cards, they lose the ability to store the data. The use of top brand SD cards is recommended to avoid possible data loss or memory corruption. The devices come with the memory cards required by default. Before each use, make sure that the SD cards are correctly inserted and working properly to store all the measurements.
The cards must be inserted in the slots found in the upper part of each of the devices. (Figures 2.1. y 2.4.).
IMPORTANT: the insertion and removal of the cards must be performed when the devices are off to avoid damage and the possibility of losing the stored data.
IMPORTANT: the format of the cards must be FAT32.
4.4 Initial configuration
The E-1000 has been designed for ease of use and minimal configuration.
However, a basic configuration is required before each measurement campaign. The main steps that must be followed in the configuration of the E-1000 before starting a measurement are listed below:
- 1) Setting the E-1000 time to local time and synchronizing the E-1000 with the E-Sens. (See section 5.5.11.A.)
- 2) Configuration of the characteristics of the module and the generator under test: the E-1000 uses the main electrical characteristics of the module under test (VOC, ISC, VM, IM, α, ẞ y NS, that have to be provided by the manufacturer) as well as the configuration of the generator (number of modules in series and parallel to calculate the series resistance and the parameter k, both necessary to carry out the extrapolation to STC according to the IEC-61829 standard. (See section 5.5.4.).
- 3) Configuration of radiation and temperature sensors¹: configuration of the calibration values of the reference cell (irradiance sensor) and selection of the cell temperature measurement method (I.E. PT-1000, reference module, E-Temp) as described in section 5.2.2.A.
- 4) Selection of the file name for data storage (See section 5.2.2.E.)
- 5) Selection of measurement options and saving (auto-save, automatic measurement, continuous measurement, barcode reading, etc, as described in section 5.4.).
For a more detailed description of how to carry out the previous steps, see the corresponding sections.
All these settings, except for the measurement option, are saved in the device even when it is turned off. Therefore, it will only be necessary to carry out this configuration at the beginning of a new measurement campaign, when changing the module or generator type under test or to modify the name of the file.
!
!
!
1 To obtain the calibration values of the reference cell, consult the calibration certificate delivered with the device.

16 “Innovative products for the solar energy industry” www.entecsolar.es
The E-Sens does not require any configuration beyond the synchronization of the time with the E-1000, an adjustment that is carried out from the E-1000. (see section 5.5.11.A.).
IMPORTANT: steps 2 and 3 of the previous listing are essential to obtain consistent results of the values extrapolated to STC.
4.5 Mounting and connecting the radiation and temperature sensors to the E-Sens
The process for mounting and connecting the irradiance and temperature sensors is detailed below. The settings necessary for these sensors to function properly are defined in section 5.5.6.B.
4.5.1 Irradiance sensor
The irradiance sensor supplied with the device is a calibrated silicon solar cell. This cell must be mounted coplanar to the module or generator under test (Figure 4.2).
Once fixed with the appropriate inclination, and as close as possible to the modules under test, it will be connected to the E-Sens through the banana type connection for the ISC measurement in the 2 V connector at the bottom of the E-Sens (See Figure 2.4.). In addition, the reference cell incorporates a PT-1000 to correct the irradiance measurement with temperature. This PT-1000 will be connected to the RTD connections of the E-Sens, which will automatically correct the current measurement.
The calibration parameters, provided in the calibration certificate delivered with your device, must be included in the settings as detailed in section 5.5.6.A.
4.5.2 Temperature sensor
There are three types of sensors that can be used to record temperature with the E-Sens:
- 1) PT-1000
PT-1000 can measure the module under test (Tmod), the temperature of the reference cell (Tsen) or the ambient temperature (Ta). When measuring Tmod, the PT-1000 must be attached to the back of the module, ideally according to Figure 4.2. The PT-1000 must be connected to the E-Sens, which has three inputs on the top, marked as ch1 ch2, and ch3 in Figure 2.4., for the temperature reading. The temperature of the reference cell is measured through a PT-1000 as previously detailed. For more information on how to configure the PT-1000s with the E-Sens see section 5.5.6.B.
- 2) Calibrated module
The calibrated module must be mounted in a representative position of the module to be tested. If the test is on multiple generators, then it should be a central module so that its conditions are representative of most of the modules in the plant. The output of the module must be connected to the 60 V channel of the E-Sens with the correct polarity. To obtain a correct temperature value, the reference module calibration values must be configured in the E-1000 (see section 5.5.6.B.)
!
Figure 4.2. Reference module setup.

17 “Innovative products for the solar energy industry” www.entecsolar.es
- 3) E-Temp infrared temperature sensor
The E-Temp connects via radio frequency to the E-1000 automatically at the time of measuring temperatures. Therefore, no prior configuration is required. Ensure that the E-Temp and E-1000 are close enough to ensure the wireless connection.
For more information on how to measure with the E-Temp see section 5.3.6.
4.6 Connecting the module or generator under test
Before connecting the circuit under test, be it a single photovoltaic module or a generator with several modules in series and parallel, the user must disconnect this circuit from any other element to which it was connected, for example the inverter, charge regulator, battery, or other circuits in series or parallel with the sample under test. Once the circuit is completely isolated from other elements, it can be connected to the E-1000.
Use the supplied set of cables to connect the circuit under test to the E-1000. This set made up of two pairs of measurement cables, one red and one black, allows a four-prong measurement assembly. This assembly is used in high precision measurements since it avoids the voltage drop produced in the wiring during the measurement. This ensures that the actual I-V curve at the PV module output is measured without distortions.
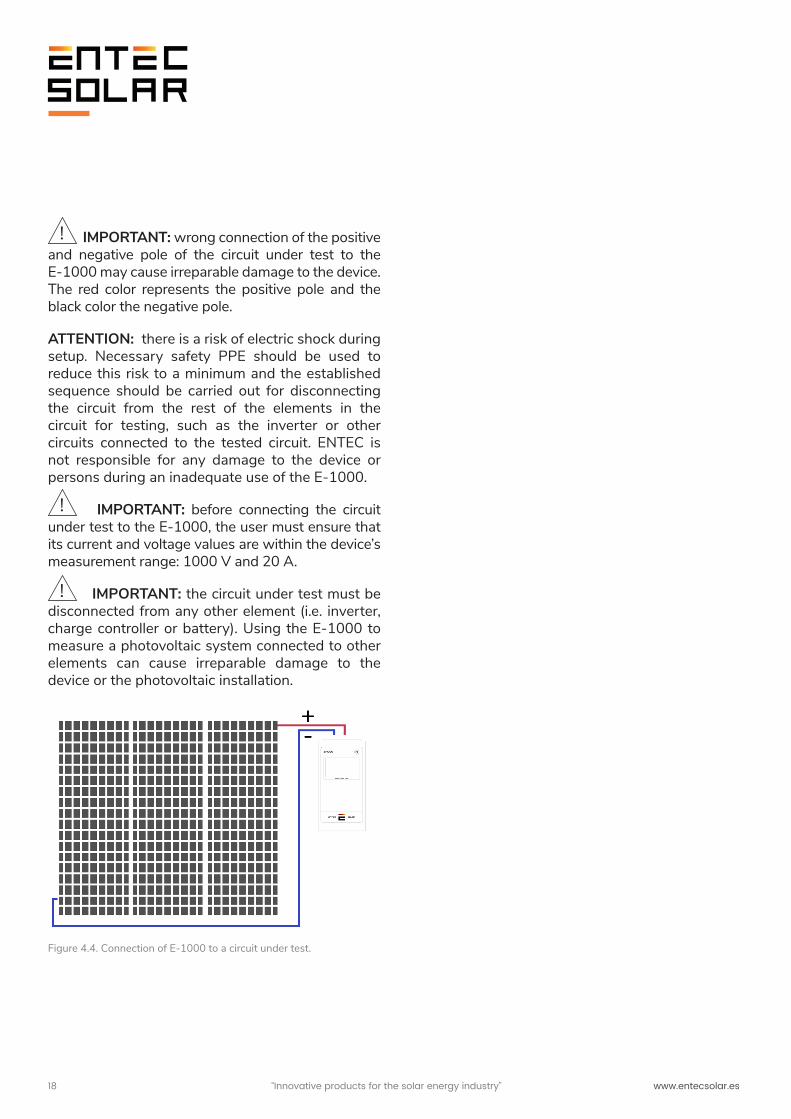
First, connect the four banana cables (two red and two black) to the E-1000. Connect the red banana cables to the red inputs of the E-1000 and the black banana cables to the black inputs. Red represents the positive pole of the circuit under test and black the negative pole (Figure 4.3a and 4.3b).
Once the cables are connected to the E-1000, connect the other side of the wiring to the circuit under test. The supplied cables have MC4 endings for direct connection to photovoltaic modules. The cables supplied with the E-1000 have been manufactured to have the opposite terminals than the modules to allow their direct connection. Therefore, the positive pole (red cable) has a female MC4 terminal and the negative pole (black cable) has a male MC4 terminal. Avoid using third-party or self-made cables to minimize risks and to prevent possible polarity problems.
For the connection of the E-1000 to other elements, such modules in parallel, Entec can supply a special cable with four crocodile terminals instead of an MC4 terminal.
Figure 4.3.a. Correct connection to E-1000.
Figure 4.3.b. Incorrect connection to E-1000.
18 “Innovative products for the solar energy industry” www.entecsolar.es
IMPORTANT: wrong connection of the positive and negative pole of the circuit under test to the E-1000 may cause irreparable damage to the device. The red color represents the positive pole and the black color the negative pole.
ATTENTION: there is a risk of electric shock during setup. Necessary safety PPE should be used to reduce this risk to a minimum and the established sequence should be carried out for disconnecting the circuit from the rest of the elements in the circuit for testing, such as the inverter or other circuits connected to the tested circuit. ENTEC is not responsible for any damage to the device or persons during an inadequate use of the E-1000.
IMPORTANT: before connecting the circuit under test to the E-1000, the user must ensure that its current and voltage values are within the device’s measurement range: 1000 V and 20 A.
IMPORTANT: the circuit under test must be disconnected from any other element (i.e. inverter, charge controller or battery). Using the E-1000 to measure a photovoltaic system connected to other elements can cause irreparable damage to the device or the photovoltaic installation.
!
!
!
Figure 4.4. Connection of E-1000 to a circuit under test.

19 “Innovative products for the solar energy industry” www.entecsolar.es
The control and configuration of the E-1000 is carried out through the touch screen that is incorporated into the device. The following sections describe each configuration menu and the corresponding settings available.
5.1 Start-up
During startup, the E-1000 performs a setup and checks that the main peripherals are working properly. While doing this initial setup, the E-1000 displays the home screen (Figure 5.1.) with the following information:
- Device serial number: permits identification of each unit and will be necessary for any communication with the technical service. The last four digits indicate the month and year of manufacture.
- Firmware version: indicates the firmware version currently installed on the device and allows for comparison against latest version available. The firmware version will also be required for any communication with the technical service.
- Calibration date: indicates the device calibration date.
- Valid until: indicates the date until which the device calibration is valid. Once this date is reached, the device must be sent to the factory for its re-calibration.
After a few seconds, two messages will appear on the main screen related to the initialization of the SD card and the LoRa communication module (the wireless communication module built into the E-1000, the E-Sens and the E-Temp).
If there is an error in the initialization, an error message will be displayed in red. Upon success, a favorable configuration message will be displayed in white (Figure 5.2.).
5.2 Main screen
Once the device has been initialized, the main screen (Figure 5.3.) will be accessed automatically. This screen presents all the information and controls necessary to carry out the I-V curve measurement.
5 Configuration and operation
Figure 5.1. Start-up screen during initialization of E-1000.
Figure 5.2. Start-up screen with a correct initialization of a LoRa communication module but with an SD card error.

20 “Innovative products for the solar energy industry” www.entecsolar.es
5.2.1 Main screen information
The main screen (Figure 5.3.) shows the following information:
- Date and Time: date and time set on the E-1000. These values are automatically stored and updated even if the device runs out of battery. However, over time, there may be a small time lag of the internal clock and thus must be updated periodically as indicated in section 5.5.11.A. It will also be necessary to adjust the date and time when changing the time zone or with the time change in the summer and winter.
- Battery levels: E-1000 and E-Sens battery levels are displayed in the upper right corner as described in section 4.2.
- VOC rectangle: shows the open circuit voltage of the circuit under test, between 0 and 1,000 V. When there is no circuit connected, the displayed voltage is 0.0 V.
- Solar radiation rectangle (G): shows the incident irradiance on the reference cell measured with the E-Sens. To obtain a coherent irradiance value, the cell must be installed in the same plane as the circuit under test (see section 4.4.1) and the E-1000 has to be configured with the calibration values of the reference cell. (see section 5.5.6.).
This rectangle is also shown with a color code that represents the suitability of the incident radiation to carry out the measurements:
· Green: radiation between 800 and 1,200 W/m2. Indicates optimal I-V curve measurement conditions.
· Yellow: radiation between 600-800 W/m2. It indicates that the moment is suitable to carry out an I-V curve measurement, although it is not optimal. The error may be slightly more than that obtained at higher radiation, but still within acceptable margins.
· Red: radiation less than 600 W/m2. I-V curve measurements can be carried out but it is not recommended to take the results as conclusive. The error in extrapolation to STC conditions is large and can lead to inconsistent results.
- Cell temperature rectangle (TC): shows the temperature of the circuit under test in Celsius degrees. As in the irradiance rectangle, several situations can occur:
· If communication with the E-Sens is obtained when the device is turned on, the measurement in °C will be displayed in the rectangle.
· If the device is turned on, but there is no communication with the E-Sens, nothing will be shown in the rectangle.
· If the values received from the E-Sens are out of range, the N/A symbol will be displayed, blinking every second.
· If communication has stopped with the E-Sens, the N / A symbol will be displayed permanently.
5.2.2 Main screen control
5.2.2.A TC sensor selection
This rectangle shows the temperature sensor in use and allows the selection between reference module, PT-1000 or E-Temp. Mounting of these sensors or
Figure 5.3. The view of the main screen.
21 “Innovative products for the solar energy industry” www.entecsolar.es
the adjustment of their parameters is explained in detail in their respective sections (4.5.2 and 5.5.6.B).
In addition, this rectangle shows a three-number code that indicates the configuration of the three PT-1000s (in case this method is selected as a temperature sensor) where:
· 0: off
· 1: Tmod
· 2: Tsen
· 3: Ta
For example, the code PT-1000: 123 indicates that the PT-1000-1 is configured to measure the temperature of the circuit under test, the PT-1000-2 is configured to measure the temperature of the reference cell and the PT-1000-3 is configured to measure the ambient temperature.
5.2.2.B Settings options menu
The “Settings” button accesses the settings menu where the E-1000 is configured. To learn more about the available settings, see section 5.5.
5.2.2.C Saving the I-V curve
This button allows saving of the last measured I-V curve. To do this, simply press the “Save Curve” button. To learn more about the saving process, see section 5.12.
5.2.2.D Measuring the I-V curve
This button serves as a trigger to measure an I-V curve. To learn more about the measurement process see section 5.3.
5.2.2.E Naming the file
Clicking on this box opens a keypad to be used to introduce the name of the file with which the measurements will be saved.
For a more detailed explanation of how the saving process is carried out and how the name influences this process, please refer to section 5.4.
IMPORTANT: Since the device adds the measurement number to the selected name (see section 5.4 for more information), it is recommended not to use names ending in a hyphen followed by a number from 000 to 999.
5.3 Curve measurement
The E-1000 has been designed to simplify the measurement of I-V curves of photovoltaic systems as much as possible. However, the process of measuring I-V curves under sunlight is complex and requires certain instrument settings to obtain accurate and consistent results. This section describes all the details necessary for the correct setup and operation of this instrument.
5.3.1 General considerations
Once the irradiance and temperature sensors have been mounted, and the E-1000 has been configured with the module, generator and sensor values, I-V measurements are ready to be carried out.
The measurement of an I-V curve is performed in three phases: preparation for the measurement, measurement of the I-V curve and preparation for the next measurement.
The measurement of the I-V curve itself typically takes between 30 and 300 milliseconds, although it will depend on the circuit under test and on the irradiance and temperature conditions. The first measurement may take a longer time than normal during which the device is automatically optimizing the time and measurement points. In this case, a message will appear at the top of the screen indicating:
“Adjusting measurement time”
!

22 “Innovative products for the solar energy industry” www.entecsolar.es
Once the device has adjusted the measurement time, readjustment will not be necessary as long as the measurement conditions remain stable (i.e. irradiance, temperature, or type of circuit under test such as the module model or the quantity of modules in parallel).
However, it should be noted that the complete measurement cycle takes about 3-4 seconds as the device must prepare to perform the next measurement.
At the beginning of the measurement, the “Measure I-V Curve” button will turn red, indicating that the measurement has started. First, the device will carry out a check that the voltage of the module under test is within the measurement limits. If it is not, a warning will be displayed on the screen and the measurement of the I-V curve will not be executed. If the voltage is within the allowable range, the I-V curve measurement will be triggered automatically.
At the end of the measurement, the I-V curve will be displayed on the screen. However, the device will remain locked for an additional 3 seconds to prepare for the next measurement. Upon completion of a complete measurement cycle, the measurement button will turn blue indicating that it is now possible to carry out the next measurement.
At that point, the curve must be saved manually if automatic saving has not been activated (see section 5.4). Once the file has been saved correctly, the name under which it was saved and the message “–saved” after it will appear in the name rectangle.
NOTE: On days with variable cloud cover, the measurement time may be longer than indicated above, as the device must continuously adjust the measurement time to adapt to the variable conditions. In case of measuring modules with defects, the measurement time can also be increased or, even, that the measurement cannot be carried out. In these cases, a message will appear at the top
of the screen indicating “Adjusting Measurement Time” so that the user is aware of the situation.
IMPORTANT: do not disconnect the measurement cables until the I-V curve is shown on the screen. Once the I-V curve has been shown on the screen, the circuit under test can be disconnected and the next circuit connected even though the complete cycle has not been completed. This allows to reduce the time of measurement cycles.
The E-1000 has several modes to measure the I-V curve:
· Manual measurement
· Auto measurement
· Continuous measurement
IMPORTANT: to obtain measurements extrapolated to STC, the first step should be the mounting of the irradiance and temperature sensors, as well as their connection to the E-Sens (see section 4.4). Furthermore, the measurement conditions must be adequate (see section 3).
IMPORTANT: make sure that the characteristic values of the module and the generator under test and the sensor settings are correctly configured (see section 5.5.4-5)
IMPORTANT: before connecting the E-1000 to the circuit under test, make sure that it is within the voltage and current limits of the device. Connecting the E-1000 to a circuit with voltage values greater than 1,000 V and currents greater than 20 A can cause irreparable damage.
!
!
!
!

23 “Innovative products for the solar energy industry” www.entecsolar.es
5.3.2 Manual measurement
For manual measurement, do the following:
1. Connect the E-1000 to the circuit under test (section 4.5).
2. Verify that the open circuit voltage displayed by the E-1000 is correct and within the limits of the device. This voltage can be seen in the VOC rectangle on the main screen (section 5.2).
3. Press the “Measure I-V Curve” button located on the main screen.
If the circuit voltage is within the measurement range, the “Measure I-V Curve” button will turn red and the device will start the measurement process (section 5.3.1). Additionally, before being able to save the measurement (or it is automatically saved if this option is activated, section 5.4.2), the steps corresponding to the registration of the barcode (section 5.3.5) or the measurement of temperature using the E-Temp (section 5.3.6) must be completed if these options were previously activated.
5.3.3 Auto measurement
The E-1000 includes a very practical measurement function (“Auto measurement”) that allows the user to free their hands during the measurement process to be able to use them to connect or disconnect to the circuits under test or to take notes.
This option is intended to be used in conjunction with the “Auto save” option (section 6.2.2) and to allow the entire I-V curve measurement and saving process to be executed without the need to operate the device. Furthermore, if used in combination with the Android App, it allows the device to be carried in a backpack and completely free the operator’s hands.
This function is also compatible with the “Bar code” option (section 5.3.5.) and “E-Temp” (section 5.3.6.).
IMPORTANT: This feature is not compatible with “Continuous measurement” (section 5.3.4). If both options are activated simultaneously, an error message will be displayed when trying to measure the I-V curve and both options will be deactivated, requiring one of the two to be activated again.
The measurement process varies depending on the options chosen. The sequence common to all options is the following:
1. Enter the settings menu and press the “Auto measurement” button.
2. The button will turn red indicating that the option is active.
3. Also select the “Auto save” option if you want to use this option together.
4. Return to the main screen.
5. Connect the E-1000 to the circuit under test.
6. At this point, if the voltage of the circuit under test is within the range of the device, the measurement process will start automatically (section 6.1.4).
7. Once the I-V curve measurement is finished, a first beep will be emitted.
8. After the beep is emitted, disconnect the circuit under test.
At the end of the previous sequence, there are several options available to continue the process.
A. If no option is selected:
9A. The I-V curve will be drawn on the screen and the characteristic values of the curve will be displayed.
10A. The device will remain unusable for about three seconds while it is configured for the next measurement.
!

24 “Innovative products for the solar energy industry” www.entecsolar.es
11A. When finishing the configuration for the next measurement, the device emits a double beep that indicates that it is ready to execute the next measurement. However, the device will not start on a measurement again until it detects a disconnection and a connection, or until the measurement is manually started.
12A. If a satisfactory result is obtained, the curve can be saved manually. Once the curve has been saved, the device can be connected to the next circuit under test.
13A. Repeating the measurement of the same circuit under test may be done again manually or by disconnecting and reconnecting the device to the circuit under test.
IMPORTANT: The E-1000 detects that the device has been automatically disconnected and reconnected to a new circuit. For this, a time of more than one second must pass between disconnection and new connection. Furthermore, the E-1000 must detect a voltage lower than 5 V during disconnection and higher than 5 V in the new connection. If these criteria are met, a new measurement process will start automatically.
IMPORTANT: In some cases, especially when measuring module strings, due to capacitive effects of the photovoltaic field, the voltage measured when disconnecting only one of the poles is higher than 5 V. In this case, it will be necessary to disconnect both poles to be able to use the auto-measurement function or else opt for the manual measurement.
B. If only the “Auto save” option is selected:
9B. The I-V curve will be drawn on the screen and the characteristic values of the curve will be displayed.
10B. The device will proceed to automatically save the I-V curve (section 5.4.2.) and prepare for the next measurement.
11B. It will remain unusable for about three seconds while it is configured for the next measurement.
12B. Once the three seconds have elapsed, a double beep will be emitted, and it will be ready for the next measurement. However, the device will not start on another measurement until it detects a disconnection and a connection, or until the measurement is manually started.
C. If the “Bar code” option is selected:
9C. The I-V curve will be drawn on the screen and the characteristic values of the curve will be displayed.
10C. The following message will appear on the screen “Waiting for Bar code”.
11C. The E-1000 will remain unusable until a barcode is read by the associated reader.
12C. After the barcode is read, a second beep will sound.
13C. If the “Auto save” option is active, the I-V curve will be saved automatically and a double beep will be emitted. If this option is not activated, the user must save the I-V curve manually.
14C. The device is ready for the next measurement. However, it will not start until it detects a disconnection and a connection, or until the measurement is manually launched.
D. If the “E-Temp” option is selected:
9D. The I-V curve will be drawn on the screen and the characteristic values of the curve will be displayed.
10D. The following message “Waiting for E-Temp measurement” will appear on the screen.
!
!

25 “Innovative products for the solar energy industry” www.entecsolar.es
11D. The device waits for the number of temperature points selected by the user to be measured. The user must wait a minimum of 300 milliseconds between consecutive temperature measurements.
12D. Once the three temperature measurements have been obtained, the E-1000 will emit a second beep.
13D. If “Auto save” is active, the I-V curve will be saved automatically and a double beep will be emitted. If this option is not activated, the user must save the I-V curve manually.
14D. The device is ready for the next measurement. However, it will not start until a disconnection and a connection are detected, or until the measurement is manually started.
5.3.4 Continuous measurement
This function is intended to leave the E-1000 fixed in the same circuit under test for a set period, measuring the I-V curve periodically and automatically. In this case the “Auto Save” function must be used so that the results of each measurement are saved in an automatic way. In this mode, the “Bar code” or “E-Temp” functions may not be used.
To configure this option:
1. Enter the settings menu.
2. Press the button “Continuous measurement.”
3. A sub-menu will appear to configure the measurement period.
4. Select the measurement period, which should be between 15 and 600 seconds.
5. Exit the sub-menu.
6. When exiting the sub-menu, the “Auto save” function will be activated automatically. This function can also be disabled.
7. Press the “Exit” button to return to the main screen.
8. At the top of the main screen, a message will appear indicating that continuous measurement is active and the period is selected.
9. Connect to the circuit under test.
10. Press the “Measure I-V Curve” button to start continuous measurement.
11. A new red button will appear on the main screen with the name “Stop Measurement”. To stop the continuous measurement process, the button should be pressed twice while the “Measure I-V Curve” button is blue.
12. The E-1000 will execute the measurement of the I-V curve and will save it automatically if the “Auto save” option has been previously chosen.
IMPORTANT: In continuous measurement mode the measured curves will not be saved if the auto-save option is not selected.
After 15 seconds into the continuous measurement process, the device screen will turn off to save battery life. To periodically check on the process, the screen can be turned on again by pressing on any part of it. After 15 seconds the display will turn off again.
IMPORTANT: if the screen seems unresponsive to touch, wait about three seconds and try again. It may be that the screen is touched precisely during the measurement of an I-V curve when the device is unresponsive.
!
!
26 “Innovative products for the solar energy industry” www.entecsolar.es
IMPORTANT: The start of each measurement always begins at the exact moment according to the selected period. However, if the measurement time has to be adjusted to some extent (especially due to variable irradiance conditions) it may happen that the measured curves are not taken in exact intervals.
IMPORTANT: This function is not compatible with “Auto measure” (section 5.3.3). If both options are activated simultaneously, an error message will be issued when trying to measure the I-V curve and both options will be deactivated, requiring one of the two to be activated again.
5.3.5 Bar code registration
If the barcode registration option is selected (section 5.5.10) the barcode of the module under test can be registered so that it is recorded together with the measurement. In this way, the data analysis and identification of each I-V curve with its corresponding module is facilitated. If the option is activated, the bar code registration will be requested using the supplied reader (if it has been purchased together with the rest of the device components) after measuring the I-V curve by means of the following message: “Waiting for Bar code”. The E-1000 will remain unusable until a barcode is read, once the E-1000 is read it will beep and proceed with the usual measurement cycle.
5.3.6 E-Temp temperature measurement
If the temperature is measured with an E-Temp (section 5.5.6.B) it is possible to also record the temperature after each measurement of the I-V curve.
This allows faster and easier temperature recording without the need to make separate connections to each module. If the option is activated, the recording of three temperatures will be requested (it is recommended to use the points defined in
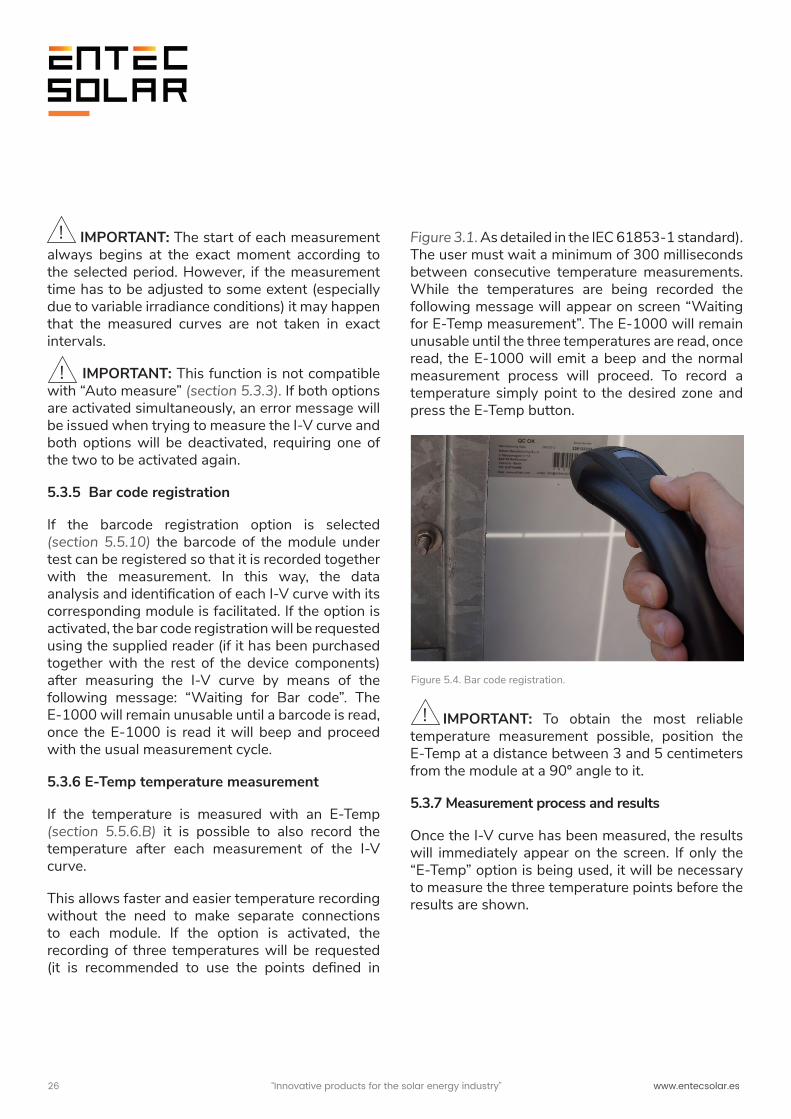
Figure 3.1. As detailed in the IEC 61853-1 standard). The user must wait a minimum of 300 milliseconds between consecutive temperature measurements. While the temperatures are being recorded the following message will appear on screen “Waiting for E-Temp measurement”. The E-1000 will remain unusable until the three temperatures are read, once read, the E-1000 will emit a beep and the normal measurement process will proceed. To record a temperature simply point to the desired zone and press the E-Temp button.
IMPORTANT: To obtain the most reliable temperature measurement possible, position the E-Temp at a distance between 3 and 5 centimeters from the module at a 90º angle to it.
5.3.7 Measurement process and results
Once the I-V curve has been measured, the results will immediately appear on the screen. If only the “E-Temp” option is being used, it will be necessary to measure the three temperature points before the results are shown.
!
!
Figure 5.4. Bar code registration.
!

27 “Innovative products for the solar energy industry” www.entecsolar.es
If the irradiance and temperature data are being correctly received from the E-Sens, two curves will appear on the screen, one white and the other green. The white curve represents the actual measurement and the green curve the result of extrapolation to STC conditions. To not display the green curve (STC conditions), deactivate this option as detailed in section 5.5.1. The results of PM, VOC, and ISC shown correspond with the results of the curve extrapolated to STC (if calculated). These results can be used to compare the performance obtained with the manufacturer’s catalog values.
Extrapolation to STC will not be possible if the irradiance and temperature conditions are not received from the E-Sens. Consequently, only the white curve (actual measurement) will be displayed along with PM, VOC, and ISC which correspond to the measured curve. In this case, the results cannot be used with the manufacturer’s catalog values.
Once the curve is measured, the process will continue depending on the selected measurement options (see sections 5.3.2-5.3.4). In addition, the
name of the file will change, incrementing by one while displaying the real name with which the curve will be saved in case the user wishes to save it. For more information on the format and content of the saved file of the I-V curve measurement see section 5.4.3.
5.4 Saving the I-V curve
The file will be saved with the name shown in the “Name” box. This name is automatically modified by the device adding the measurement number at the end of it (quantity of the measurements with the same name base).
Thus, the final name consists of the base name configured by the user (section 5.2.2.E) followed by a hyphen, the curve number (which is automatically updated) and the extension “.csv” at the end. An example of the saved name is shown below:
· Measure-009.csv
Before saving a curve with the assigned name, the device verifies in the SD that there is no file with that name. If a file with the same name is found, the new name will be automatically incremented by one before being saved under a new name. The numeration starts with number 1 and is limited to up to 999 curves with the same name.
Figure 5.5. Temperature measurement with an E-Temp.Figure 5.6. I-V curve measurement example.

28 “Innovative products for the solar energy industry” www.entecsolar.es
Upon reaching the limit, a warning will be shown that the limit has been reached: “SAME NAME CURVE LIMIT REACHED”.
IMPORTANT: to avoid problems with asynchronous curve names, it is advisable to not have curves stored in the SD with the same base name as the new curves to be measured. If there are curves with the same base name, the E-1000 could assign non-consecutive numbers to the new measurements.
IMPORTANT: the device adds numbers sequentially, starting with number 1. This may cause a curve to be overwritten if the same base name is being used as in previous measurements. It is recommended that in each new sequence of measurements the base name of the measurements be changed to avoid overwriting files.
To save the last I-V curve measured there are two options:
· Manual saving
· Automatic saving
In either case, the device assigns an automatic name to the measurement to facilitate the saving process when multiple curves are being measured and thus save time. If the curve has been saved correctly, the message “ -Saved ” will appear to the right of the filename inside the filename rectangle.
5.4.1 Manual save
Allows the user to save the last measured curve. When pressing the button, one of the following could occur:
· If there is any measured curve pending to be saved, the button will turn red, indicating that saving is in process.
Once saved, the button will turn blue again and the message “-Saved” will appear to the right of the file name within the file name rectangle.
· If there is no new measured curve, or the last curve has already been saved, a message will appear in the center of the screen stating: “NO CURVE HAS BEEN MEASURED”
5.4.2 Auto save
When the automatic save option is activated, a measurement saving process is executed after each measurement performed, whether this measurement has been done manually, automatically, or continuously (see sections 5.3.2-4). To activate this option, enter “Settings” and select the automatic save option. The blue box will change to red, indicating that the option is activated.
NOTE: Remember that if certain options, such as barcode registration or E-Temp measurement, are enabled, it will be necessary to perform certain steps after the I-V curve measurement before the data is saved (see section 5.3).
5.4.3 Saved file format
The data corresponding to the I-V measurement are saved in a file in “.csv” format without any encoding, so the data is accessible directly from any spreadsheet program such as Excel, LibreOffice or any text editor.
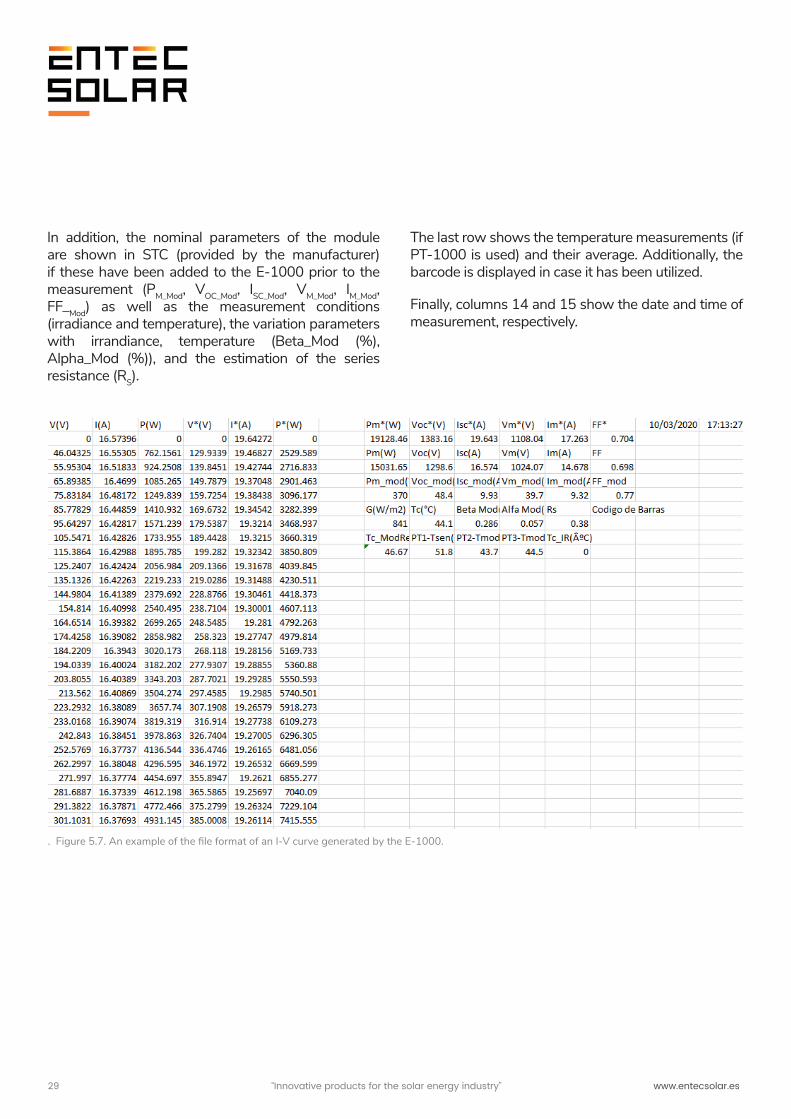
Figure 5.7. demonstrates an example of an I-V curve measurement file generated by the E-1000. The first columns correspond to the measured I-V curve (V, I and P) and the next three to the I-V curve extrapolated to STC (V *, I * and P *). On the right (columns 8-13), the parameters of the extrapolated I-V curve (PM*, VOC*, ISC*, VM*, IM* y FF*) are shown in the second row, and the parameters of the measured I-V curve (PM, VOC, ISC, VM, IM y FF) in the fourth.
!
!
29 “Innovative products for the solar energy industry” www.entecsolar.es
In addition, the nominal parameters of the module are shown in STC (provided by the manufacturer) if these have been added to the E-1000 prior to the measurement (PM_Mod, VOC_Mod, ISC_Mod, VM_Mod, IM_Mod, FF_Mod) as well as the measurement conditions (irradiance and temperature), the variation parameters with irrandiance, temperature (Beta_Mod (%), Alpha_Mod (%)), and the estimation of the series resistance (RS).
The last row shows the temperature measurements (if PT-1000 is used) and their average. Additionally, the barcode is displayed in case it has been utilized.
Finally, columns 14 and 15 show the date and time of measurement, respectively.
. Figure 5.7. An example of the file format of an I-V curve generated by the E-1000.
30 “Innovative products for the solar energy industry” www.entecsolar.es
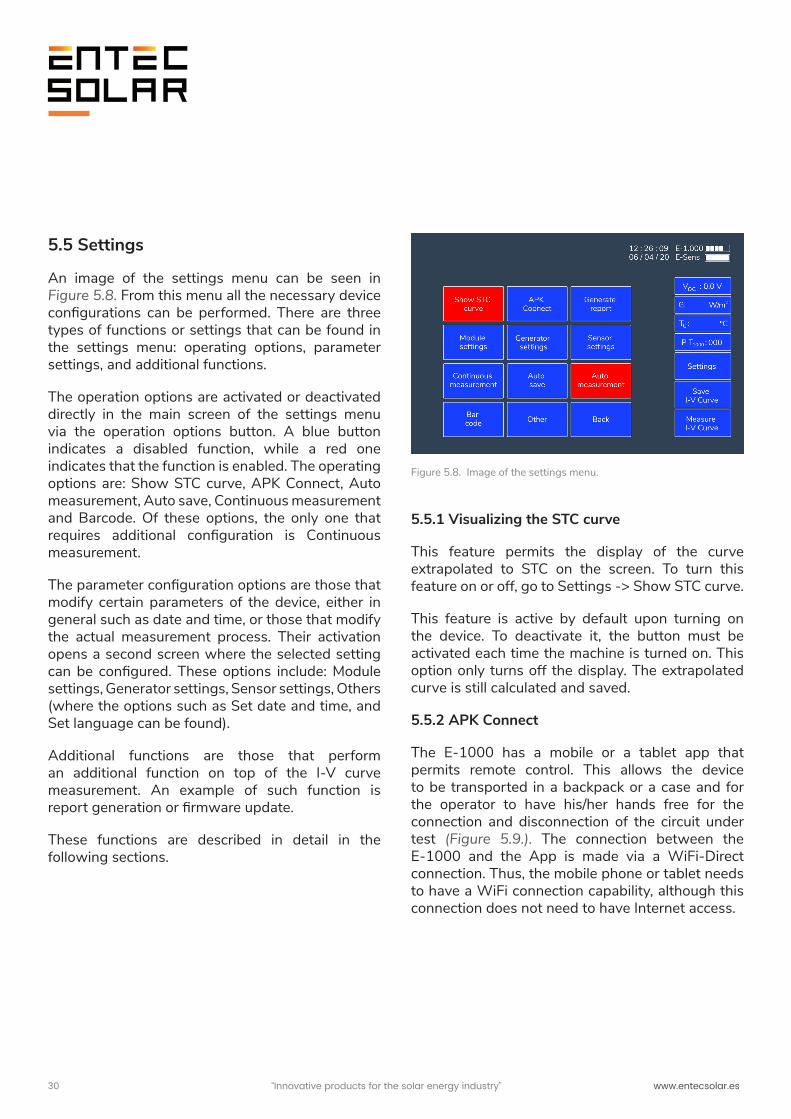
5.5 Settings
An image of the settings menu can be seen in Figure 5.8. From this menu all the necessary device configurations can be performed. There are three types of functions or settings that can be found in the settings menu: operating options, parameter settings, and additional functions.
The operation options are activated or deactivated directly in the main screen of the settings menu via the operation options button. A blue button indicates a disabled function, while a red one indicates that the function is enabled. The operating options are: Show STC curve, APK Connect, Auto measurement, Auto save, Continuous measurement and Barcode. Of these options, the only one that requires additional configuration is Continuous measurement.
The parameter configuration options are those that modify certain parameters of the device, either in general such as date and time, or those that modify the actual measurement process. Their activation opens a second screen where the selected setting can be configured. These options include: Module settings, Generator settings, Sensor settings, Others (where the options such as Set date and time, and Set language can be found).
Additional functions are those that perform an additional function on top of the I-V curve measurement. An example of such function is report generation or firmware update.
These functions are described in detail in the following sections.
5.5.1 Visualizing the STC curve
This feature permits the display of the curve extrapolated to STC on the screen. To turn this feature on or off, go to Settings -> Show STC curve.
This feature is active by default upon turning on the device. To deactivate it, the button must be activated each time the machine is turned on. This option only turns off the display. The extrapolated curve is still calculated and saved.
5.5.2 APK Connect
The E-1000 has a mobile or a tablet app that permits remote control. This allows the device to be transported in a backpack or a case and for the operator to have his/her hands free for the connection and disconnection of the circuit under test (Figure 5.9.). The connection between the E-1000 and the App is made via a WiFi-Direct connection. Thus, the mobile phone or tablet needs to have a WiFi connection capability, although this connection does not need to have Internet access.
Figure 5.8. Image of the settings menu.

31 “Innovative products for the solar energy industry” www.entecsolar.es
To use the E-1000 App, it must be firstly installed on the mobile phone or tablet to be used. The “E-1000” App can be downloaded and installed from the Play Store.
After the App is installed on the remote device, the following steps should be used to operate the E-1000 remotely:
1. Turn on the WiFi adapter on the mobile phone.
2. Select the APK option on the E-1000 by accessing settings and selecting APK connect.
3. The APK Connect button will turn red and the E-1000’s screen will be blocked.
4. Look for the E-1000XXX WiFi network from the remote device where the XXX is the ID of the E-1000.
5. Connect to the E-1000 network from the remote device.
6. Connect to the E-1000 network from the remote device. The WiFi password is: carga1234.
The application has an interface identical to that of the E-1000 (Figure 5.3.), with the only difference that the settings button does not allow for the settings configuration of the E-1000 other than the wireless connection between the App and the E-1000 (specifically the IP and the port). These settings do not need to be modified as the default values are appropriate. The buttons “Measure Curve” and “Save Curve” work the same way as on the E-1000. To set the name there is no dedicated button but that can be accessed directly by clicking on the area where the name is inserted. Also, when writing the name of the measurement press the submit button to set it. One of the advantages of using the App is that the number of characters that can be used for naming the measurement is significantly higher than on the E-1000. The App will show the measured and extrapolated curves as well as warnings in the same way as the E-1000 does.
7. Select Settings and press connect.
IMPORTANT: only the functions of the main screen can be performed from the App on the remote device and no settings can be performed (Figure 5.10.). All necessary settings must be configured on the E-1000 directly before connecting to the remote device.
Figure 5.9. The use of the E-1000 App with a mobile device.
!
Figure 5.10. An example of a daily report generated by the E-1000.

32 “Innovative products for the solar energy industry” www.entecsolar.es
5.5.3 Report generation
This option allows the generation of a summary report of all measures performed in a single day. This facilitates the analysis of the results as well as the preparation of the final report of measurements.
The report is generated in in a ‘.csv’ format and includes the characteristic values of the measured curves.
· G: Irradiance at the time of measurement (W/m2)
· TC*: Average cell temperature at the time of measurement (ºC)
· PM and PM*: Power measured at the maximum power point, PM, and extrapolated to STC, PM* (W)
· VOC and VOC*: Measured open circuit voltage, VOC and extrapolated to STC, VOC* (V)
· ISC and ISC* : Short-circuit current measured, ISC and extrapolated to STC, ISC * (A)
· VM and VM*: Voltage measured at maximum power point, VM, and extrapolated to STC, VM* (V)
· IM and IM*: Current measured at maximum power point, IM , and extrapolated to STC, IM* (A)
· FF and FF* : Measured I-V curve fill factor, FF, and extrapolated to STC, FF* (Adim)
· Barcode: Barcode of the measured module. If not measured, “N/A” will be displayed.
The daily report does not include all the data of an I-V curve. To access the rest, as well as to be able to visualize the I-V curve, the individual file of each I-V curve has to be accessed (see section 5.4.3.).
To generate the daily report the following steps should be executed:
1. Assure that all the curves from which the report will be generated is on the SD card and that it is properly inserted into the device.
2. Within the settings menu, access the “Generate report” submenu (see Figure 5.8.).
3. Select the date for which to generate the report.
4. Press “Set date”.
5. The button will change to red and the date will change to dd/mm/yy.
6. Enter the desired date using the number key on the left. As the numbers are typed, they will appear in the corresponding position in order of insertion.
IMPORTANTE: all numbers must be entered even if they are zeros.
NOTE: If the device detects that an impossible date is entered (i.e. day 36 or month 15), the wrong selection will be deleted and the date will have to be re-entered.
7. Press the generate report button (see Figure 5.11.).
8. The message “Generating report” will appear on the screen.
9. At the end of the report generation, the message “Generated report” will appear and the report will be saved to the SD card.
10. Turn off the device to access the SD card and to download the data to the PC.
!

33 “Innovative products for the solar energy industry” www.entecsolar.es
5.5.4 Module settings
IMPORTANT: before starting a new set of measurements, make sure that the values configured in this section match those in the module under test.
For a correct extrapolation of the measured I-V curves, it is necessary to enter the characteristic parameters of the module under test, which are usually provided by the manufacturer. Based on these parameters, the E-1000 estimates the values of the serial resistance (RS) and the thermal coefficient of variation of the RS (k) using an internal algorithm. These values are also necessary to perform a correct extrapolation of the I-V curve, so any error or variation in these values will lead to errors in the extrapolation of the curve.
To configure the parameters of the module under test, access the following menu via:
· Settings -> Module settings
Entering this sub-menu will display the screen shown in Figure 5.12., which confirms the location with a message “Module settings” in the top left. The user must configure all module parameters under test according to catalog values and under standard measurement conditions (STC).
These values can be found in the module model data sheet or on the sticker that is pasted onto the back of the modules that includes the main module information.
The following values should be configured:
· VOC: Open circuit voltage under STC (V)
· ISC: Short circuit current under STC (A)
· VM: Voltage at maximum power point in STC (V)
· IM: Current at maximum power point in STC (A)
· Alpha (α): Coefficient of current variation with temperature
· Beta (ẞ): Coefficient of voltage variation with temperature
· Ns: Number of cells in series
Each value can be configured by clicking on the box of the parameter to be modified and modifying it. At that point, the box with the name of the selected parameter will change to red and the setting of that parameter will be enabled, showing hyphens instead of numbers (see Figure 5.12.). As the desired value is marked, the numbers will fill the corresponding positions automatically.
Figure 5.12. Module settings sub-menu.
!
Figure 5.11. Image of a “Generate report” sub-menu.

34 “Innovative products for the solar energy industry” www.entecsolar.es
IMPORTANT: values must be entered in each slot, even if they are zeroes before or after the decimal point.
IMPORTANT: the settings configured in this menu are stored in memory and maintained even if the device is turned off. By changing the module model under test, the values must be updated.
IMPORTANT: all modules under test must be of the same type and category with the same nominal values of the above parameters. Otherwise, inconsistent results may be produced.
Once the parameters are entered, press the variable name button again to save the new value.
The name will change back to blue and the new configured value will appear in the box immediately below. If the value that appears is not the value that was set, it must be re-entered making sure to enter numeric values in all spaces where hyphens appear.
5.5.5 Generator settings
IMPORTANT: before starting a new set of measurements, make sure that the values configured in this section match those of the generator under test.
For a correct extrapolation of the measured I-V curves, it is necessary to configure the number of modules in series and in parallel in the “Generator settings” (section 5.5.5 and Figure 5.13.).
To configure the generator parameters under test enter the menu through:
· Settings -> Generator settings
Entering this sub-menu will display the screen shown in Figure 5.14. where the message “Generator settings” on the top left will be shown.
To configure one of the variables (number of modules series or parallel) press the name of the variable. The pressed area will change to red and the numeric value of that variable will be replaced by hyphens, which indicates all digits that must be entered to set the variable (Figure 5.15.). The digits filled in will occupy the corresponding positions automatically.
Figure 5.13. Module settings screen.
!
!
Figure 5.14. Module settings sub-menu.
!
!
Figure 5.15. Image of generator settings for series.

35 “Innovative products for the solar energy industry” www.entecsolar.es
IMPORTANT: all slots must be filled in, including any zeroes before and after the decimal.
IMPORTANT: the settings configured in this menu are stored in memory and are saved even if the device is turned off. If the generator configurations are changed or if individual modules are now under test, these values must be updated.
Once the parameters are entered, the variable name should be pressed again to set the new value in memory. The name changes back to blue and the new configured value will appear in the box below the name. If the value that appears is not the value configured, it must be re-entered making sure that there is a digit in all hyphened spaces.
5.5.6 Sensor settings
IMPORTANT: before starting a new set of measurements, make sure that the values configured in this section match those of the sensor used.
For the correct extrapolation of the measured I-V curves, it is necessary to enter the characteristic parameters of the sensors used to characterize the measurement conditions. These parameters are necessary to identify the difference between the measurement taken and the the STCs, and the extrapolation to STC, so that process to calculate the I-V curve in STC can take place.
5.5.6.A Irradiance sensor setup
Within the irradiance sensor setup, the ISC of the reference cell, and the alpha coefficient of variation with the temperature must be set. Both values will appear on the calibration report delivered along with the rest of the device results. To set these values enter:
· Settings-> Sensor settings
To configure one or both parameters, the name of the variable to configure must be selected which will shortly turn red, filled with hyphens.
Enter the desired value by ensuring that as many digits are entered as the displayed hyphens, including as many leading or trailing zeros.
IMPORTANT: all slots must be filled in, including any zeroes before and after the decimal.
IMPORTANT: the settings configured in this menu are stored in memory and are saved even if the device is turned off. If the module model under test is changed, these values must be updated.
5.5.6.B Temperature sensor setup
Part of the temperature sensor setup is choosing the right sensor (PT-1000, reference module or E-Temp) and configuring the device accordingly. These configurations can be accessed and changed through Settings, Sensor Settings and pressing the box below the current sensor settings until the desired selection appears:
· PT-1000: if using the PT-1000, it is necessary to choose what is being measured: a module under test (Tmod), a reference cell temperature (Tsen), an ambient temperature (Ta) or, if it is not being used – OFF must be selected. To do this, activate the corresponding PT-1000 name (PT_1, PT_2, or PT_3) until the measurement type for that PT-1000 appears below it. The selected PT-1000 code will be displayed on the main screen as indicated in section 5.2.1.
· MOD REF: if using a reference module, both the VOC and the beta coefficient of variation with the temperature must be set. To configure the parameters, the name of the variable to configure must be selected which will shortly turn red, filled with hyphens. Enter the desired value by ensuring that as many digits are entered as the displayed hyphens, including as many leading or trailing zeros.
· E-Temp: if using an infrared temperature sensor, only a connection of the E-Temp with the E-1000 must be insured.
!
!
!
!
!
36 “Innovative products for the solar energy industry” www.entecsolar.es
5.5.7 Continuous measurement
This function sets the E-1000 to measure a curve periodically (Figure 5.16.). Pressing the button enters a sub-menu where the period of continuous measurement can be set. For more information on how to use this mode, see section 5.3.4.
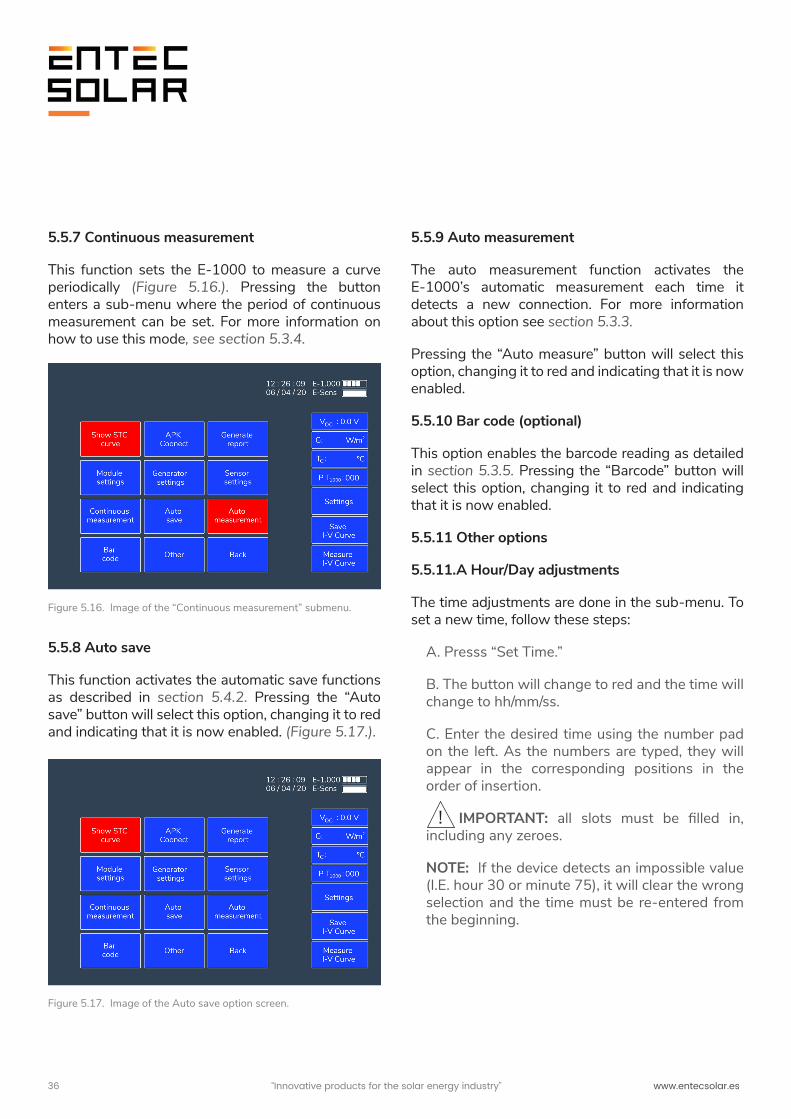
5.5.8 Auto save
This function activates the automatic save functions as described in section 5.4.2. Pressing the “Auto save” button will select this option, changing it to red and indicating that it is now enabled. (Figure 5.17.).
5.5.9 Auto measurement
The auto measurement function activates the E-1000’s automatic measurement each time it detects a new connection. For more information about this option see section 5.3.3.
Pressing the “Auto measure” button will select this option, changing it to red and indicating that it is now enabled.
5.5.10 Bar code (optional)
This option enables the barcode reading as detailed in section 5.3.5. Pressing the “Barcode” button will select this option, changing it to red and indicating that it is now enabled.
5.5.11 Other options
5.5.11.A Hour/Day adjustments
The time adjustments are done in the sub-menu. To set a new time, follow these steps:
A. Presss “Set Time.”
B. The button will change to red and the time will change to hh/mm/ss.
C. Enter the desired time using the number pad on the left. As the numbers are typed, they will appear in the corresponding positions in the order of insertion.
IMPORTANT: all slots must be filled in, including any zeroes.
NOTE: If the device detects an impossible value (I.E. hour 30 or minute 75), it will clear the wrong selection and the time must be re-entered from the beginning.
Figure 5.17. Image of the Auto save option screen.
Figure 5.16. Image of the “Continuous measurement” submenu.
!

37 “Innovative products for the solar energy industry” www.entecsolar.es
5.5.11.B Update Firmware
An E-1000 firmware update can be performed using the file provided by Entec Solar. This file has the name “E-1000_update.bin” If the update file does not have this name, the name must be changed for the file to be detected. To update the firmware, follow these steps:
- Upload the attached file onto an SD card.
- Insert the SD card into the device.
- Go to Settings -> Other -> Update Firmware
- The device will indicate that an update firmware has been detected. Pressing Yes twice will initiate the update process.
IMPORTANT: do not turn off the device or remove the SD during the update process.
!
38 “Innovative products for the solar energy industry” www.entecsolar.es
6.1 Data download for PC
All data measured by the E-1000 and the E-Sens are stored on two SD-type cards in the device. All the files stored are in csv format and do not have any encoding, so the data is accessible directly from an Excel-like spreadsheet program such as LibreOffice or any text editor.
There are three alternative methods to transfer the measurement data from the SD card to the PC.
-Removing the SD card from the computer and inserting it into the PC.
-Connecting the E-1000 to a PC via micro-USB cable.
-Connecting to a PC through a WiFi connection and a web browser.
To extract the data measured by the E-Sens it will only be possible to use the SD card method only.
6.1.1 Data download via SD card
To obtain the measurement data through the removal of the SD card, follow these steps:
1. Make sure the device is turned off.
IMPORTANT: Removing the SD card with the device on may cause irreparable damage to it with the consequential loss of data.
2. Press the SD card lightly towards the inside of the device until the spring clicks. For the E-Sens it will be necessary to use a thin object to push the micro-SD card into the device.
3. Release pressure and wait for the card to come out of its slot by itself.
4. Completely remove the card from the device.
5. Insert the card into the card reader of a PC or, use a USB type card reader.
6. The PC will automatically detect the inserted SD card.
7. Open a file explorer folder on an operating system.
8. Copy the files from the directory on the SD card to the destination directory on a PC.
6.1.2 Data download via a micro-USB connection
The E-1000 also offers the ability to access the SD card data via and the E-1000’s micro-USB connection (located on the right side of the E-1000, under the USB port connection for the barcode reader). This feature is only available on the E-1000 and not on the E-Sens.
To access the data on the SD card through the USB connection, follow these steps only when the device is off:
1. Make sure the E-1000 is turned off.
2. Connect a USB cable from a USB port on your PC to the E-1000’s micro-USB port.
3. The PC will recognize the SD card automatically.
4. Open a file explorer on your PC and navigate to the SD card directory.
5. Copy files from the SD card directory to the destination directory on the PC.
6 Data download
!

39 “Innovative products for the solar energy industry” www.entecsolar.es
6.2 Opening the saved files
To display the data of the measured I-V curves, open the file for each curve in an Excel-like program. This file shows all the current, voltage, and power values of the measured curve as well as the curve extrapolated to STC. A summary of the main parameters of both curves (PM, VOC, etc), the radiation and temperature values of the measurement, and the measurement configuration parameters are also displayed.
With the data included in this file, the measured and extrapolated I-V and P-V curves can be drawn as shown in Figure 6.1. To graph them, select the corresponding columns and follow the steps shown in Figure 6.2.
Figure 6.3. An example of the resulting graphs. Figure 6.1. Follow the indicated steps to prepare the data.
Figure 6.2. To visualize the data, you can choose certain columns and view the corresponding graph.

40 “Innovative products for the solar energy industry” www.entecsolar.es
If your system defaults to a comma as the decimal separator, follow these steps before importing the data. Select the tab File -> Options (Figures 6.4 and 6.5). Once inside, select the Advanced tab (see Figure 6.6.), deselect the option to use system separators (defined by the language) and manually select the desired separators - in this case a dot as decimal separator and comma as thousands separator.
Figure 6.6. Choose Advanced, uncheck the option to use the system separators and choose the desired decimal and thousands separators (in this case comma as decimal separator and period as thousands separator).
Figure 6.4. Go the the File tab.
Figure 6.5. Go to options.

41 “Innovative products for the solar energy industry” www.entecsolar.es
The following list summarizes the components of procedure required to perform a complete measurement cycle. It is strongly recommended to read the entire manual before proceeding and to consult the corresponding sections in case of any doubt.
1. Battery level check of all devices, as well as making sure that the SD cards are inserted.
2. Connection of E-Sens with the E-1000.
3. Connection of the barcode reader to the E-1000 (optional).
4. Connection the irradiance and temperature sensors to the E-Sens.
5. Setting the time of the E-1000 to local time and synchronization of the time with the E-Sens.
6. Configuration of module characteristics under test (VOC, ISC, VM, and IM, α, ẞ and NS)
7. Configuration of generator characteristics (number of modules in series and in parallel).
8. Irradiance sensor configuration (reference cell)
9. Selection and configuration of the temperature sensor (reference module, PT-1000, or E-Temp).
10. Selection of the file name under which the data will be saved.
11. Selection and configuration of the measurement process (manual measurement, auto-measurement, or continuous measurement).
12. Selection of the method for saving the data (manual save, or auto save).
13. Execution of the measurement process in line with the selected options.
In addition, it is recommended to carry out the measures considering the following:
-Carry out the measurements during periods of the day when the sky is clear and with little wind.
-Ensure coplanarity and closeness between reference module and the circuits under test. It is advisable to also measure the temperature at different points of the circuit.
-Perform measurements with an irradiance level of between 800 and 1200 W/m2, and never below 600 W/m2.
-Avoid angles of incidence of the sun greater than 40º.
7 Quick start guide

42 “Innovative products for the solar energy industry” www.entecsolar.es
Technical specifications - E-1000
Input voltage range 0-1000 V
Input current range 0.1-20 A
± 0.3% ± 2 digits (voltage y current) ± 0.5% ± 0,1 W (power)
15 mV 0.3 mA
Measurement time 30-200 ms (typical)
Measure cycle time 3 - 4 s (typical)
I-V curve points 200
Operating temperature -10 a +65 ºC
Battery life 10 hours continuous operation. (More than 2000 I-V curves)
Dimensions 298x160x50 mm
Weight 1.3 kg
Protections Over-voltage, over-current and reverse polarity
SD card. 12 KB per I-V curve in .csv format
Electrical safety CAT II- 1000V, EN-61010-1
Measurement of I-V curves according to IEC-61829 Extrapolation to EMC according to IEC-60891
Warranty 2 years on product failure
8 Technical specifications
Precision
Resolution
Data storage and format
Standards

43 “Innovative products for the solar energy industry” www.entecsolar.es
Technical specifications - E-Sens
1 x 2 V. Channel for measuring irradiance 1 x 60 V. Channel for temperature measurement
Temperature inputs 3 x PT-1000
Accuracy in voltage measurement ± 0.3%
Temperature measurement accuracy ± 0.3 ºC. Clase B
0.45 mV for the 60 V channel. 0.015 mV for 2 V channel
1 second for radiation channel 2 seconds for all other channels
Wireless link distance Up to 2 km depending on the obstacles
Wireless link frequency 433 MHz, (915 Mhz for E.E.U.U.)
Operating temperature -10 to +65ºC
Battery duration 15 hours of operation
Dimensions 195x95x29 mm
Weight 265 grams
Protections Over-voltage and reverse polarity
Data storage and format Micro-SD card. Data is stored automatically while the computer is on
Electrical safety EN-61010-1
Warranty 2 years on product failure
Voltage inputs
Measuring range
Resolution

44 “Innovative products for the solar energy industry” www.entecsolar.es
Entec Solar guarantees that this product and its associated accessories will be free from defects during the legal warranty period of 24 months and from the date of purchase, reflected in the sales invoice. This warranty does not cover fuses or damage caused by accidents, negligence, modifications or abnormal operating conditions, or improper use or handling. Opening the equipment for inspection or tampering with it in any way will immediately result in a warranty loss. Distributors are not authorized to extend this warranty on behalf of Entec Solar.
During manufacture, the E-1000, the E-Sens and the reference cell have been subjected to a calibration process in the voltage and current measurements of the same and an internal adjustment has been carried out to compensate for any variation in the measured parameters. Over time, degradation of electronic components can occur due to changes in temperature, high operating currents, application of voltage for long periods, etc. This can cause maladjustments in the calibration constants of the devices and, therefore, return erroneous results during measurements. Entec Solar guarantees the calibration of all its devices for a period of 24 months, after which the equipment must be returned to the factory to carry out a recalibration and thus ensure the highest precision in measurements.
All items that are sent for repair or calibration, whether within the warranty framework or outside of it, must attach the Entec service form. The document can be obtained from the website www.entecsolar.es or directly from your nearest distributor.
9 Guarantee, calibration, and repair
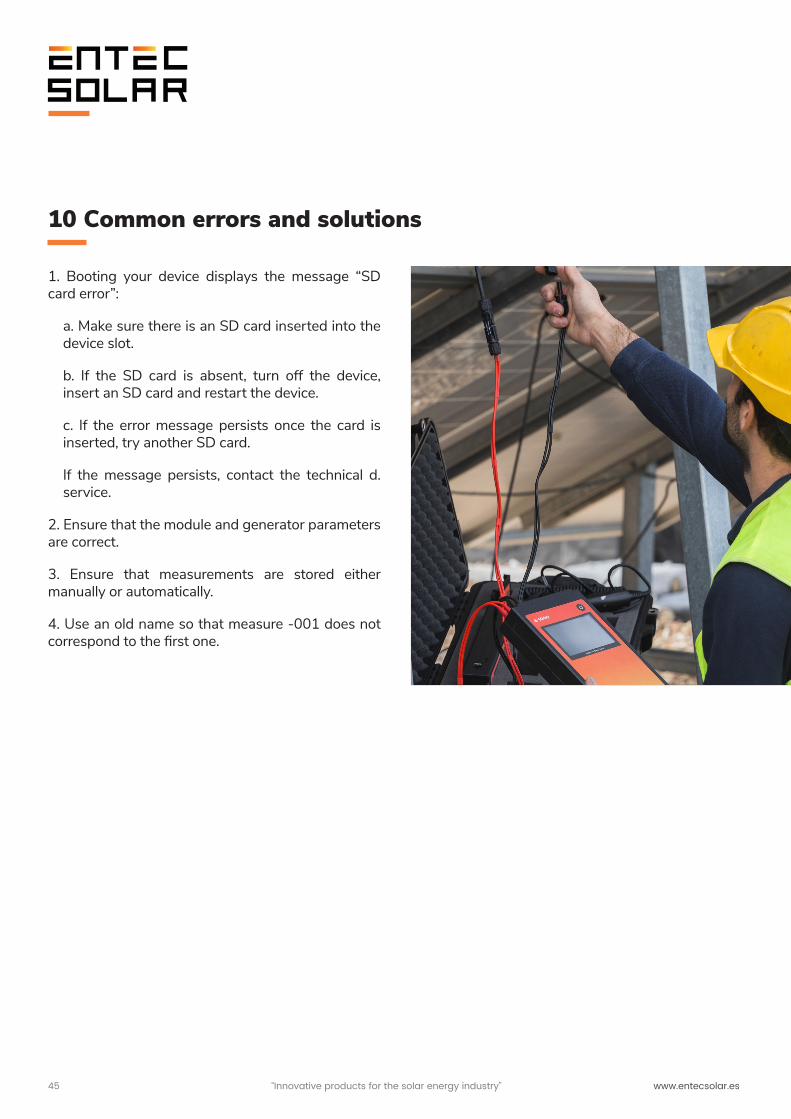
45 “Innovative products for the solar energy industry” www.entecsolar.es
1. Booting your device displays the message “SD card error”:
a. Make sure there is an SD card inserted into the device slot.
b. If the SD card is absent, turn off the device, insert an SD card and restart the device.
c. If the error message persists once the card is inserted, try another SD card.
If the message persists, contact the technical d. service.
2. Ensure that the module and generator parameters are correct.
3. Ensure that measurements are stored either manually or automatically.
4. Use an old name so that measure -001 does not correspond to the first one.
10 Common errors and solutions

46 “Innovative products for the solar energy industry” www.entecsolar.es
Declaración de conformidadDeclaration of conformity
Nombre del fabricante: Manufacturer´s name:
Dirección del fabricante: Manufacturer´s address:
Declara que el producto: Declares that the poduct:
Nombre del producto:Product name:
Modelo:Model:
Año de fabricación:Year manufactured:
La utilización que se dará de este producto será exclusivamente para:The product is excusively used for:
Seguridad:Safety:
Aislamiento:Insulation:
Grado de suciedad:Pollution degree:
Cat. de aislamiento:Installation category:
ENTEC SOLAR S.L.
Calle Bambu 4, 11c. 28036, Madrid. España /Spain
SMART I-V CURVE TRACER
E-1000
Medición de curvas I-V de módulos o strings fotovoltaicos que cumplan con la normativa.Measurement of the I-V curve of PV modules or strings that are in conformity with the directive.
UNE-EN-61010-1:2011
Clase II. Aislamiento reforzadoClass II. Double insulation
2
(@ altitud <3000m)(@ height <3000m)
CAT II 1000V DC CAT II 1000V DCCAT III 300V a tierra CAT III 300V to groundMax 1000Vdc de entrada Max 1000Vdc inputs
El producto cumple con los requisitos de la Directiva Europea de Baja Tensión 2014/35/UE, de la Directiva de Compatibilidad Electromagnética 2014/35/UE y la Directiva de Radio R&TTE (199/5/EC).The product herewith complies with the requirements of the Low Voltage Directive (LVD) 2014/35/UE, the Electromagnetic Compatibility Directive (EMC) 2014/35/UE and Radio R&TTE Directive (199/5/EC)
Dr. Jorge SolórzanoCEO & Founding Partner
11 Conformity declaration

“Innovative products for the solar energy industry”Contact: [email protected] www.entecsolar.es
Related Documents