Smart Grids: From Concept to Reality Professor Philip Taylor Deputy Pro Vice Chancellor Head of Engineering Siemens Professor of Energy Systems The Devan Nair Institute for Employment and Employability, Jurong East, Singapore

Welcome message from author
This document is posted to help you gain knowledge. Please leave a comment to let me know what you think about it! Share it to your friends and learn new things together.
Transcript

Smart Grids: From Concept to
Reality
Professor Philip Taylor
Deputy Pro Vice Chancellor
Head of Engineering
Siemens Professor of Energy Systems
The Devan Nair Institute for Employment and
Employability, Jurong East, Singapore

Course Overview
Day 1: Tuesday 27 June 08:45 – 09:00 Registration 09:00 – 10:30 Introduction to smart grids, Professor Phil Taylor 10:30 – 11:00 Refreshments & networking 11:00 – 12:30 Smart grids and real case studies in the UK, Professor Phil Taylor 12:30 – 13:30 Lunch (provided) 13:30 – 15:00 Integration of energy storage, Dr Damian Giaouris 15:00 – 15:30 Refreshments & networking 15:30 – 17:00 Integration of energy storage and DSR, Dr Damian Giaouris Day 2: Wednesday 28 June
08:45 – 09:00 Registration 09:00 – 10:30 Active network management, Dr Anurag Sharma 10:30 – 11:00 Refreshments & networking 11:00 – 12:30 Advanced power flow, Dr Thillainathan Logenthiran 12:30 – 13:30 Lunch (provided) 13:30 – 15:00 Integration of renewable energy sources, Dr Haris Patsios 15:00 – 15:30 Refreshments & networking 15:30 – 17:00 Integration of renewable energy sources, Dr Haris Patsios Closing remarks, Professor Phil Taylor

The function of a
conventional power system• Generate electric energy economically and with the
minimum ecological disturbance and to transfer this energy over transmission lines and distribution networks with the maximum efficiency and reliability for delivery to consumers at virtually fixed voltage and frequency
• Safety ??

Current Electricity Network

Evolving Networks
• Trilemma
• Affordability, Sustainability, Security
• Increased Electrification, Decarbonisation of Electrical Networks
• Heat and Transport
• Ageing Assets
• Severe Weather Events
• Capital Cost
• Planning Permission

Drivers for Smart Grids
• Distributed Generation
• Renewable Energy, Micro-generation
• Heat onto Electricity grid
• Transport onto Electricity grid
• Ageing Assets
• Severe Weather Events
• Customer Expectations
• Capital Cost
• Planning Permission

275 kV
132 kV
132 kV
33 kV
33 kV
11 kV
11 kV
400 V
Distribution
Transmission
Traditional Power System
Passive

275 kV
132 kV
132 kV
33 kV
33 kV
11 kV
11 kV
400 V
Distribution
Transmission500 MW
20 MW
5 MW
Distributed Generation

Distributed Generation
• Why ?
• Reduction in CO2 emissions
• Energy efficiency and rational use of energy
• Deregulation and competition policy
• Diversification of energy sources
• National power requirement
• Availability of modular generating plant
• Ease of finding sites for smaller generators
• Short construction times and lower capital costs of smaller plant
• Generation may be sited closer to load, which may reduce transmission costs

Distributed Generation
Plant
• Combined Heat and Power CHP
• Wind/Wave/Tidal
• Landfill Gas
• Hydro (Run of River)
• Photovoltaic

Evolving Networks
• Distributed Generation
• Unidirectional to Multidirectional Power Flows
• Transition from Passive to Active Networks
• Active Network Management/Smart Grids
• Transition
– Now 10 to 15 Generating Units used for
Frequency control all transmission connected,
2030 600,000 Transmission and Distribution
– 10, 000 voltage control devices now 2030
900,000
– Home control systems zero now, 15 million by
2030
Evolving Networks
• UK Networks 800 000 km (twice the distance from the earth to the moon)
• Ofgem estimate £32 billion must be invested in networks in next decade in UK alone.
• Renewable mix growing all the time
• Overall UK solar PV capacity at the end of February 2015 stood at 5,229 MW, across 668,714 installations, an increase of 0.9 per cent in capacity and 1.4 per cent in installations compared to the end of January 2015.
• Coal 30.3% (down 6pp), gas 29.5% (up 4pp), nuclear 15.8% (down 3pp), renewables (wind, hydro & bioenergy) 22.0% (up 4pp). Overall low carbon generation was 37.8%. Q4 2015

Definition of Active Network Management
• Shift away from fit and forget approach
• The ENA, the trade association of the DNOs, define active management as;
• The methodology by which the DNO and the Generator monitor their respective plant with the intention of reacting to network or generation changes in order to ensure that the network and generation continue to operate within safe and prescribed limits, where monitoring means manual, electronic or any other from of monitoring that is suitable for the particular installation.

14
The ENSG smart grid definition
A Smart Grid as part of an electricity power system can intelligently integrate the actions
of all users connected to it - generators, consumers and those that do both - in order to
efficiently deliver sustainable, economic and secure electricity supplies.
A Smart Grid employs communications, innovative products and services together with
intelligent monitoring and control technologies to:
Significantly reduce the environmental impact of the total electricity supply system4
1 Facilitate connection and operation of generators of all sizes and technologies
2 Enable the demand side to play a part in optimising the operation of the system
3 Provide consumers with greater information and choice of supply, and extend the scope
of the market into both distribution systems and to the end customers
Deliver required levels of reliability, flexibility, quality and security of supply5

The ENSG smart grid vision
“The UK’s smart grid will develop to support and accelerate a cost-effective transition to
the low-carbon economy. The smart grid will help the UK meet its 2020 carbon targets,
while providing the foundations for a variety of power system options out to 2050.
The Vision sets out how smart grids may, directly or indirectly: maintain or enhance
quality and security of electricity supply; facilitate the connection of new low- and zero-
carbon generating plants, from industrial to domestic scale; enable innovative demand-
side technologies and strategies; facilitate a new range of energy products and tariffs to
empower consumers to reduce their energy consumption and carbon output; feature a
holistic communications system that will allow the complete power system to operate in
a coherent way, balancing carbon intensity and cost, and providing a greater visibility of
the grid state; allow the cost and carbon impact of using the networks themselves to be
optimised.”
It is critical to acknowledge that the vision goes far beyond technology.
Technology will play an important role in meeting the UK’s needs but
regulatory, legal, commercial, market, industry and cultural change will
also be critical.

Smart Grid
• Observable
• Controllable
• Automated
• Fully Integrated

Future Smart Grids ?

Technical Impacts of
Distributed Generation
• Voltage Changes
• Fault Levels
• Power Quality
• Protection
• Stability

Voltage Changes(Refresher on voltage change equations)
X

Distance
Voltage
Max
MinSummer
Winter
No Generation
Voltage Drop Down
a Radial Feeder
)( XQPRV

Over-voltage due to
Embedded Generation
Summer
Winter
Distance
Voltage
Max
Min
Generation
)( netnet XQRPV

Fault Levels
• Embedded Generation Increases Fault Levels
• Synchronous and Induction Generators and Motors contribute to fault current
• Sometimes beyond equipment ratings

Fault Levels
• Describing the effect of faults on a system in terms of the current that would flow in a fault could be somewhat confusing.
• This fault current must be compared to the normal load current, and this load current is inversely proportional to the nominal voltage.
• To compensate for the effect of voltage level, the magnitude of potential faults in the system is given in terms of fault level.
• This quantity is usually expressed in MVA and is defined as:
)(min MVAIVFL falno
Fault Levels
• The base quantities are usually chosen such that:
• If we divide the first equation by the second and assume that Vbase is the same as V nominal, it can be seen that:
• FL pu = If pu
• Link to ability of network to accommodate EG
• Weak Network
BBB IVMVA

Power Quality
• Power Quality = Voltage Quality
• Frequency
• Amplitude
• Purity
• Power Quality Problem
• Any power problem manifested in voltage, current, or frequency deviations that results in failure or mal-operation of customer equipment
• Why increased emphasis ?
• Sensitive loads
• Power electronic loads/generator interfaces
• Increased customer awareness

Source of Power
Quality Disturbances

Power Quality
• Voltage Flicker
• Harmonics
• Unbalance

Flicker
• Impression of unsteadiness of visual sensation induced by a light stimulus whose luminance fluctuates with time.

Harmonics
• Distortion Increasing
• Caused by the non linear characteristics of devices and loads
• Increases losses in machines
• Interfere with power electronic control systems

Harmonics

Unbalance
• Caused primarily by single phase loads or potentially by single phase micro-generators
• The maximum deviation from the average of the three phase voltages or currents, divided by the average of the three phase voltages or currents.

Unbalance
0
10
20
30
40
50
60
70
80
90
100
00:00:00 03:00:00 06:00:00 09:00:00 12:00:00 15:00:00 18:00:00 21:00:00 00:00:00
Po
we
r (k
W)
Time (hrs)
Phase 1 Phase 2 Phase 3
238
240
242
244
246
248
250
00:00:00 03:00:00 06:00:00 09:00:00 12:00:00 15:00:00 18:00:00 21:00:00 00:00:00
Vo
ltag
e (
V)
Time (hrs)
Phase 1 Phase 2 Phase 3

Energy Policy and European Targets
• European Commission Target
• 20/20 by 2020
• GHG down by 20%
• RE up to 20%
• UK 15%
• UK Target 80% by 2050 (Mandatory)
• Relative to 1990 levels
• Each persons carbon footprint will have to be one fifth of its current value
• 2050 pathways online calculator

How ? BEIS view is ...
• Demand Reduction
• Electrification of heat, transport, and industry
• Electricity supply will need to double and be decarbonised
• Renewable increase but how balance ?
• Bio-energy
• Fossil Fuels still important, carbon capture and storage
• Nuclear ?

Why need Energy Policy ?
• Privatised Energy Systems
• Governments commit to targets
• How motivate private industry so targets can be met ?
• Appropriate Energy Policy !

Electricity Industry
• CEGB Central Electricity Generating Board
• Government owned
• Vertically Integrated
• Privatisation/Deregulation/Unbundling …
• Internationally the trend is this way
• UK leading the way

Structure of the UK
Electricity Industry ?
Privatised in 1989
Raised £21 billion
Monopoly Businesses
Regulation Required

Ofgem
• The office of gas and electricity markets
• Principal objective
• To protect the interests of consumers, present and future, wherever appropriate by promoting effective competition.

The UK Electricity Market
• The “Pool”
• 1990 - 2001
• Open to manipulation
• NETA
• 2001 – 2005
• Commodity trading
• Balancing and settlement code
• BETTA
• 2005 - …
• GB wide better deal for Scotland

Prices
• Up until recently the claims were ….
• Privatisation has lead to prices of electricity dropping significantly.
• Prices ?
• Average bill in 1990 £365
• Average bill in 2002 £250
• 72p/day inc VAT for a House
• 2016 £586
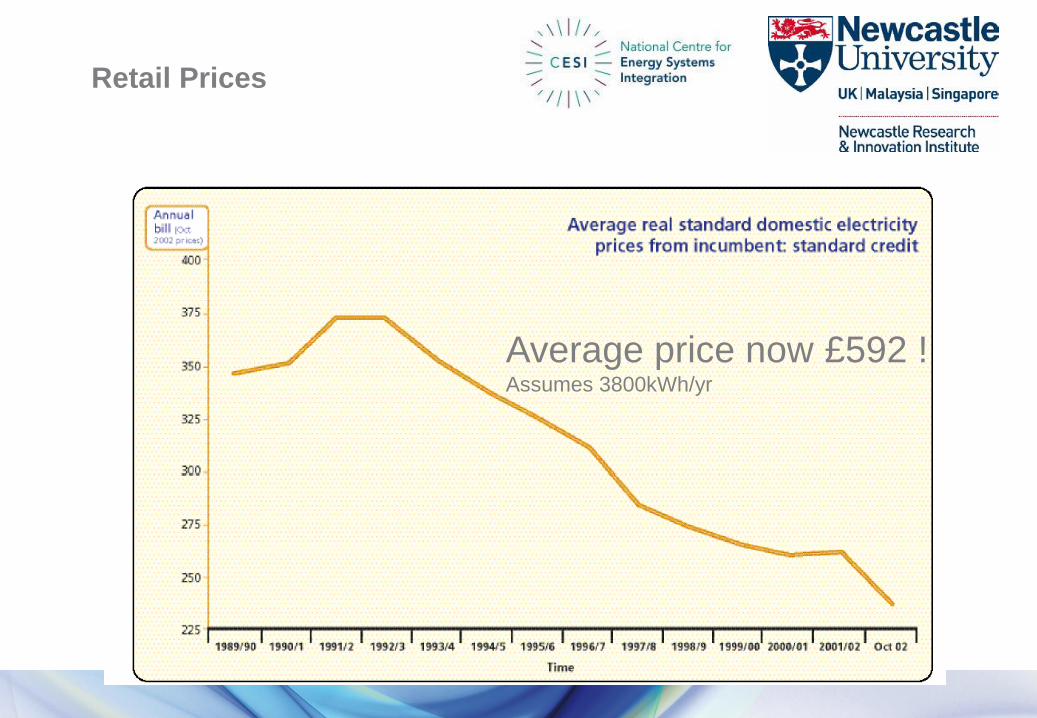
Retail Prices
Average price now £592 !Assumes 3800kWh/yr

Regulation and Renewable
Energy• The Non Fossil Fuel Obligation
• 1989 Subsidise Nuclear Power
• Small amount for renewables
• Money raised by the Fossil Fuel Levy
• Highly competitive
• The Renewable Obligation
• 2002 Target for suppliers to source part of their electricity from Renewable Generation

The Renewable
Obligation

Feed in Tariffs
(FIT)


PV was 43 p/kWh
In December 2011
cut to 21p/kWh

Feed in Tariffs/RO - PV Growth

Feed in Tariffs

Summary
• Challenging Targets
• Lots of Government Intervention
• Private Investment Needed
• Will it work ?

Real Smart Grids
• Smart Metering
• Demand Response
• Real Time Ratings
• Energy Storage Systems
• Integrated Smart Grid Control

Smart Meter Data (~10,000 customers)
0
0.1
0.2
0.3
0.4
0.5
0.6
0.7
0.8
0.9
00:00 03:00 06:00 09:00 12:00 15:00 18:00 21:00 00:00
Po
we
r (k
W)
Time (GMT)
May_11 June_11 July_11 August_11 September_11
October_11 November_11 December_11 January_12 February_12
March_12 April_12 May_12

0
0.1
0.2
0.3
0.4
0.5
0.6
0.7
0.8
00:00:00 03:00:00 06:00:00 09:00:00 12:00:00 15:00:00 18:00:00 21:00:00 00:00:00
Po
we
r (k
W)
Mar-11 Apr-11 Mar-12 Apr-12
Weather Dependence
Warmest April since 1910
Coldest April for 23 years

Weekday
0.95
1
1.05
1.1
00:00 03:00 06:00 09:00 12:00 15:00 18:00 21:00 00:00
Load
(p
u)
Bas
e:
We
ekd
ay
Monday / Weekday Tuesday / Weekday Wednesday / Weekday
Thursday / Weekday Friday / Weekday

Time of Use Tariffs – TC1 - TC 9

Time of use Tariffs pre – post intervention

Solar PV – Automatic In premises balancing

What is Real-Time Thermal Rating....
What is Line Rating... What is Real-Time Thermal Rating...
•Rating is calculated in real time,
based on the conditions of the
conductor
Solar Radiation = 0
Wind Speed= 0.5m/s at 0o to the line
Ambient Temperature =2oC (Winter)
9oC (Spring/Autumn)20oC (Summer)

Potential Benefits

Potential Applications
•Support Network in fault conditionsWind Farm Connections
Q
Other Applications: Defer Network Reinforcement, Assist Scheduled Downtime...

Real Time Thermal Ratings, North Wales
132kV Lynx Conductor
0
200
400
600
800
1000
1200
P 1 P 60 P 119 P 178 P 237 P 296
Rat
ing [
A]
Rating
static
0
200
400
600
800
1000
1200
1400
Jan Mar May Jun Aug Oct Dec
Rat
ing [
A]
SeasonalDaily
Town
Woodland

Impact Quantification, UK Wide

Possible uses for Energy Storage Systems in Smart Grids
• Stability, Voltage control
• Power flow management
• Restoration
• Energy market
• Regulation
• Network management
Energy storage
# 1 # 2 # 3 # n
~
PCC

Demonstration of Energy Storage at 11kV
Saft Li-ion battery
• Energy capacity:200 kWh
• Max voltage: 5.82 kV
IGBT 3-level Voltage Source Converter
• Four-quadrant operation
• Real power: 200 kW (nominal)
• Reactive power: 600 kVAr

Measurement and communication
Martham
Primary
Ormesby
Primary
Energy
Storage
device
Windfarm:
2.25MW

Real Demonstration

ESS/Network Simulation Tool
Network Model
ESS Model
One year of
network
data
Event
definitions
Results
Simulation
Coordination
Operation
Strategy
Real historical data
P intervention time limited
Q intervention not
Forecasting
Multiple objectives/constraints

Reverse power flow
0
5
10
15
20
25
30
35C
ou
nt
Time of day
Events 0.4 MW
0
5
10
15
20
25
30
35C
ou
nt
Time of day
Events 0.3 MW
0
5
10
15
20
25
30
35C
ou
nt
Time of day
Events 0.2 MW
0
5
10
15
20
25
30
35C
ou
nt
Time of day
Events 0.1 MW
0
5
10
15
20
25
30
35
Co
un
t
Time of day
Events0.0 MW

Under-voltage
0
10
20
30
40
50
60C
ou
nt
Time of day
Events 0.4 MVAr
0
10
20
30
40
50
60C
ou
nt
Time of day
Events 0.3 MVAr
0
10
20
30
40
50
60C
ou
nt
Time of day
Events 0.2 MVAr
0
10
20
30
40
50
60C
ou
nt
Time of day
Events 0.1 MVAr
0
10
20
30
40
50
60
Co
un
t
Time of day
Events0.0 MVAr

0
10
20
30
40
50
P/Q = 0.2 MW/MVAr P/Q = 0.4 MW/MVAr
Ene
rgy
Tran
sfe
r (M
Wh
)
Single Net (1), P only Single Net (1), V&P
Single Net (2), P only Single Net (2), V&P
With NOP With NOP and TSB
Multiple objectives multiple networks

71
2.5MVA – 5MWh Electrical
Energy Storage
at Rise Carr 33/6kV

A real, smart grid enabled distribution network is adopted as the case study
network, to investigate the voltage problems and to evaluate the proposed
coordinated voltage control scheme. This network, operated by Northern
Powergrid, is a rural network located in the Northeast of England.
Case Study: (IEEE Trans SG)
Voltage Control, Storage and Tap
Changers

• Typical daily demand profiles from case study
network SCADA data for MV feeders;
• Typical wind farm generation profile derived from 30
wind farm sites owned by Northern Powergrid;
• Domestic customer demand profile and power
profiles of multiple LCTs derived from historical
data from over 5000 domestic customers covering
the period May 2011 to May 2012
Data from the CLNR project are
used to create the future scenario:

• Voltage profiles at MV feeder
ends;
• Voltage profiles at LV Feeder 1
end;
• %VUF at LV Feeder 1 end.
Voltage problems in the case
study network without control

• Voltage profiles at MV feeder ends;
• Tap position of the OLTC at primary
substation;
• Power output of the EES at MV
Feeder 1 end
IPSA2 results with
Proposed Control Scheme

Voltage profiles at LV Feeder 1 end Tap position of the OLTC at secondary
substation
%VUF at LV Feeder 1 end Power output of the EES at LV Feeder 1
end
Network in the Loop Emulation Results
with Proposed Control Scheme

Conclusions
• Many Challenges
• Many Possible Solutions
• Flexibility and/or Network Reinforcement
• What is the optimum mix of social, technical and commercial interventions ?

SummaryConventional Electricity Network

Future Smart Grids ?

Course Overview
Day 1: Tuesday 27 June 08:45 – 09:00 Registration 09:00 – 10:30 Introduction to smart grids, Professor Phil Taylor 10:30 – 11:00 Refreshments & networking 11:00 – 12:30 Smart grids and real case studies in the UK, Professor Phil Taylor 12:30 – 13:30 Lunch (provided) 13:30 – 15:00 Integration of energy storage, Dr Damian Giaouris 15:00 – 15:30 Refreshments & networking 15:30 – 17:00 Integration of energy storage and DSR, Dr Damian Giaouris Day 2: Wednesday 28 June
08:45 – 09:00 Registration 09:00 – 10:30 Active network management, Dr Anurag Sharma 10:30 – 11:00 Refreshments & networking 11:00 – 12:30 Advanced power flow, Dr Thillainathan Logenthiran 12:30 – 13:30 Lunch (provided) 13:30 – 15:00 Integration of renewable energy sources, Dr Haris Patsios 15:00 – 15:30 Refreshments & networking 15:30 – 17:00 Integration of renewable energy sources, Dr Haris Patsios Closing remarks, Professor Phil Taylor
Related Documents