Smart energy, smart living Elizabeth Shove, Lancaster University WWW.DEMAND.AC.UK The promise: To give an informed view on how all the different threads of energy generation and use combine for the smart house, workplace and lifestyle. Energy demand reduction, low carbon emissions

Welcome message from author
This document is posted to help you gain knowledge. Please leave a comment to let me know what you think about it! Share it to your friends and learn new things together.
Transcript

Smart energy, smart livingElizabeth Shove, Lancaster University
WWW.DEMAND.AC.UK
The promise:
To give an informed view on how all the different threads of energy generation and use combine for the smart house, workplace and lifestyle.
Energy demand reduction, low carbon emissions
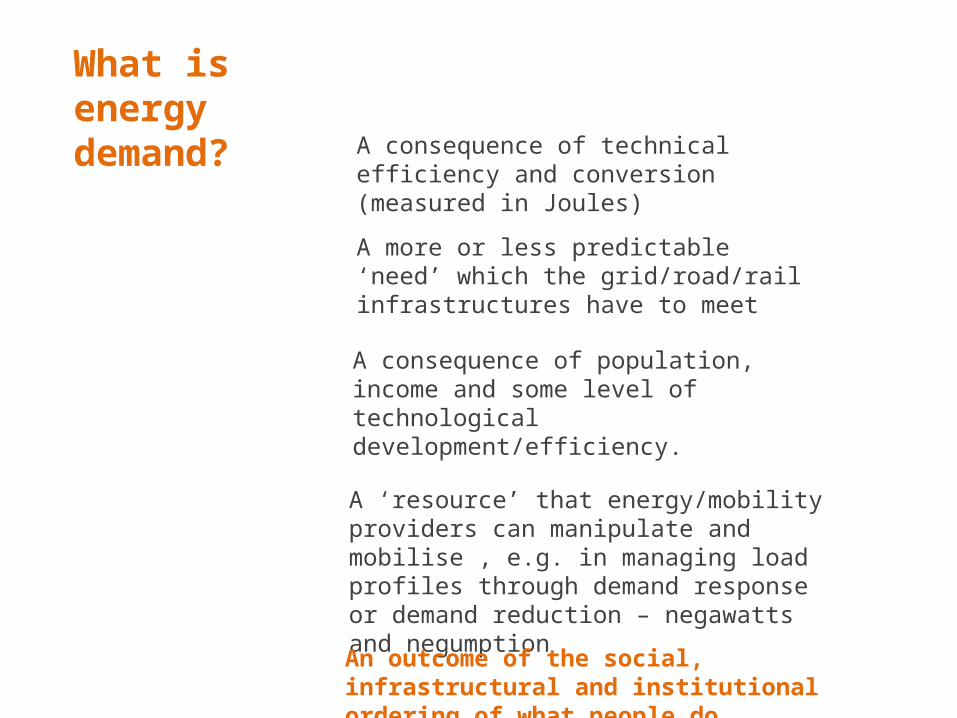
What is energy demand? A consequence of technical efficiency
and conversion (measured in Joules)
A consequence of population, income and some level of technological development/efficiency.
A ‘resource’ that energy/mobility providers can manipulate and mobilise , e.g. in managing load profiles through demand response or demand reduction – negawatts and negumption
An outcome of the social, infrastructural and institutional ordering of what people do.
A more or less predictable ‘need’ which the grid/road/rail infrastructures have to meet

The need for electricity is made one practice at a time. Hughes: Networks of Power, 1983.
Energy is never used in the abstract
Picture of electrified kettle

Energy is used in accomplishing social practices at home, at work and in moving around (e.g. heating, commuting, shopping, laundering, cooling etc.).
Social practices and related systems and infrastructures of provision constitute each other. Generation, provision and use are intertwined.
Energy demand and smarter, lower carbon living are consequence of these arrangements.
Normal room temperature
Patterns of societal synchronisation
Car-dependent practices
Understanding how energy generation and use combine in making and changing
Starting points

From person heating to space heating
Average room temperature of 13° Celsius (55°F) in the UK in 1970.
Social conventions of comfort are changing all the time.
Design and engineering are implicated in making and not just ‘meeting’ needs.
Fanger’s equation There is nothing natural about 22°C.
How energy generation, management and use combine
Picture of shetland croft and of shetland crofter, in jumper
Picture of ole fanger
Picture of thermostat at 22

What would be a ‘smarter’ configuration?
Heating as a system of elements
Waistcoat – representing clothingHeating systemCooling systemBuilding fabric/wallOur skin – the body’s thermoregulatory system

How energy generation, management and use combine
• What are peaks made of?• Societal synchronisation• Sequences and flexibilities• Trends over time• Where does policy influence lie?
• Balancing supply and demand • Decarbonisation/renewables• Smart metering• Future demand• Relation between mobility and
energy in buildings
Smart grids and smart ways of living

Source: MTUS 1974-2005, Ben Anderson’s calculations, weighted
Infrastructures sized for peak
Devices in use make peak
Resources delivered to meet peak
Frequency and synch-ronisation
Temporal relation between practices
How energy generation, management and use combine

Data from the multi-national time use studies, 2000.
Finland
These graphs show what people are doing at different times of day.
They show that France is more ‘synchronised’ than Finland. Especially at lunchtime.
Such patterns matter for what happens when, and hence for peak demand.
Societal synchronisation
France
Again, this is not a matter of individual choice and decision making or about technological . Nor is it about introducing more efficient technology .
Is smarter living a matter of ‘flatter’ living?
Night timeSaturday morningsMonday morningsEvenings
Employment policyand smarter living??
Lunch time

To understand demand we need to understand social practices and how they change
What are cars for?Which practices are car-dependent practices?
Pictures of tesco express, white van, people at a gym, home office, credit cards
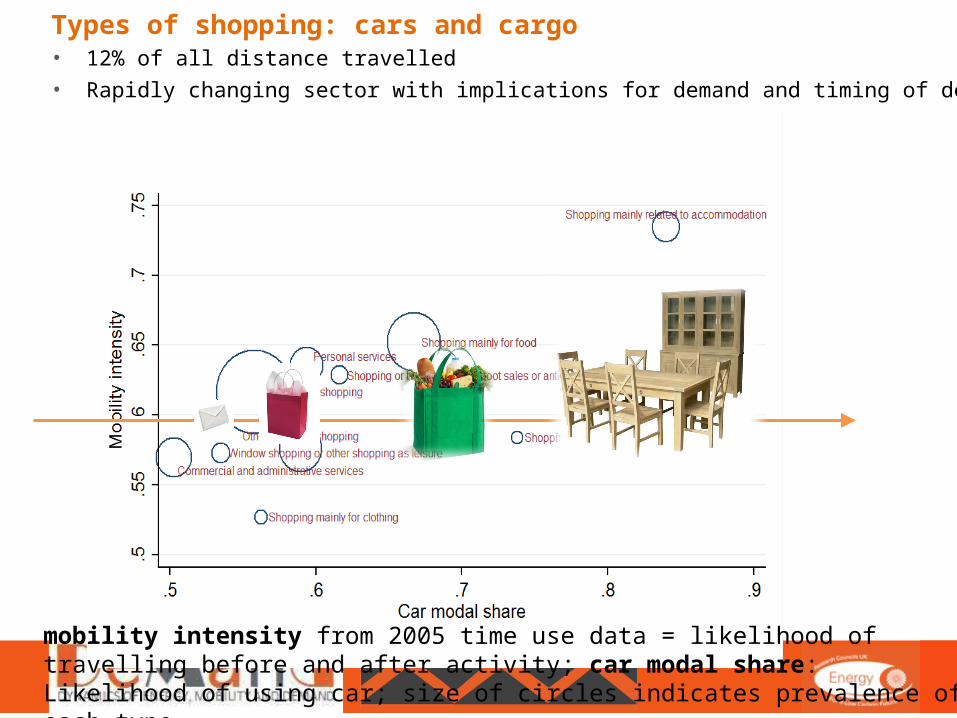
• 12% of all distance travelled• Rapidly changing sector with implications for demand and timing of demand
Types of shopping: cars and cargo
mobility intensity from 2005 time use data = likelihood of travelling before and after activity; car modal share: Likelihood of using car; size of circles indicates prevalence of each type
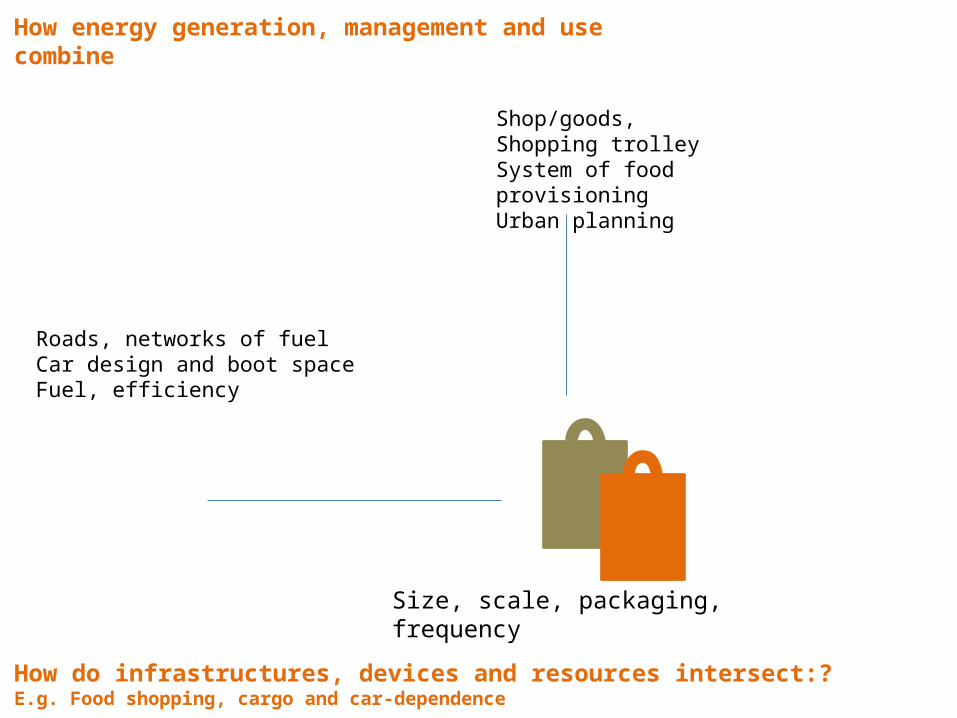
Shop/goods, Shopping trolleySystem of food provisioningUrban planning
Roads, networks of fuelCar design and boot spaceFuel, efficiency
Size, scale, packaging, frequency
How do infrastructures, devices and resources intersect:? E.g. Food shopping, cargo and car-dependence
How energy generation, management and use combine

Focusing on efficiency
• obscures the ways in which technologies constitute demand
• tends to have no history (what is the reference point?)
• isolates technologies – the freezer not the food system, the car not car-dependence
Efficient technologies often help reproduce unsustainable patterns of demand
A+ energy rating
http://ao.com/product/rl4362fbasl-samsung-gseries-fridge-freezer-stainless-steel-27050-28.aspx
Picture of huge fridge freezer

AttitudeBehaviourChoice
DynamicsInfrastructurePracticesRegimesSystemsTransitions
WWW.DEMAND.AC.UK

Strategies for smarter living
Beyond energy efficiency and behaviourShould there be a policy of breaking the cold chain?
Or of changing office life?
Are these energy efficient technologies?
How do employment policies structure energy demand?
Pic of office work
Pic of waistcoat
Related Documents