energies Article SMART Computational Solutions for the Optimization of Selected Technology Processes as an Innovation and Progress in Improving Energy Efficiency of Smart Cities—A Case Study Krzysztof Gaska 1, * and Agnieszka Generowicz 2 1 Department of Water and Wastewater Engineering, Silesian University of Technology, Konarskiego 18, 44–100 Gliwice, Poland 2 Department of Environmental Technologies, Cracow University of Technology, Warszawska 24, 31–155 Cracow, Poland; [email protected] * Correspondence: [email protected] Received: 9 May 2020; Accepted: 29 June 2020; Published: 30 June 2020 Abstract: The paper presents advanced computational solutions for selected sectors in the context of the optimization of technology processes as an innovation and progress in improving energy efficiency of smart cities. The main emphasis was placed on the sectors of critical urban infrastructure, including in particular the use of algorithmic models based on artificial intelligence implemented in supervisory control systems (SCADA-type, including Virtual SCADA) of technological processes involving the sewage treatment systems (including in particular wastewater treatment systems) and waste management systems. The novelty of the presented solution involves the use of predictive diagnostic tools, based on multi-threaded polymorphic models supporting decision making processes during the control of a complex technological process and objects of distributed network systems (smart water grid, smart sewage system, smart waste management system) and solving problems of optimal control for smart dynamic objects with logical representation of knowledge about the process, the control object and the control itself, for which the learning process consists of successive validation and updating of knowledge and the use of the results of this updating to make control decisions. The advantage of the proposed solution in relation to the existing ones lies in the use of advanced models of predictive diagnostics, validation and reconstruction of data, implemented in functional tools, allowing the stabilization of the work of technological objects through the use of FTC technology (fault tolerant control) and soft sensors, predictive measurement path diagnostics (sensors, transducers), validation and reconstruction of measurement data from sensors in the measuring paths in real time. The dedicated tools (Intelligent Real Time Diagnostic System - iRTDS) built into the system of a hierarchical, multi-threaded control optimizing system of SCADA system allow to obtain advanced diagnostics of technological processes in real time using HPC technology. In effect of the application of the proprietary iRTDS tool, we obtain a significant rise of energy efficiency of technological processes in key sectors of the economy, which in global terms, e.g., urban agglomeration, increases the economic efficiency. Keywords: smart cities; smart computational solution; artificial intelligence; energy economics; control systems; energy efficiency of technological processes; wastewater treatment system; fuel from wastes 1. Introduction The transformation of global economies towards the effective use of energy sources and the reduction of pollution emissions, including greenhouse gases, is becoming one of key challenges faced Energies 2020, 13, 3338; doi:10.3390/en13133338 www.mdpi.com/journal/energies

Welcome message from author
This document is posted to help you gain knowledge. Please leave a comment to let me know what you think about it! Share it to your friends and learn new things together.
Transcript
energies
Article
SMART Computational Solutions for the Optimizationof Selected Technology Processes as an Innovation andProgress in Improving Energy Efficiency of SmartCities—A Case Study
Krzysztof Gaska 1,* and Agnieszka Generowicz 2
1 Department of Water and Wastewater Engineering, Silesian University of Technology, Konarskiego 18,44–100 Gliwice, Poland
2 Department of Environmental Technologies, Cracow University of Technology, Warszawska 24,31–155 Cracow, Poland; [email protected]
* Correspondence: [email protected]
Received: 9 May 2020; Accepted: 29 June 2020; Published: 30 June 2020�����������������
Abstract: The paper presents advanced computational solutions for selected sectors in the contextof the optimization of technology processes as an innovation and progress in improving energyefficiency of smart cities. The main emphasis was placed on the sectors of critical urban infrastructure,including in particular the use of algorithmic models based on artificial intelligence implemented insupervisory control systems (SCADA-type, including Virtual SCADA) of technological processesinvolving the sewage treatment systems (including in particular wastewater treatment systems) andwaste management systems. The novelty of the presented solution involves the use of predictivediagnostic tools, based on multi-threaded polymorphic models supporting decision making processesduring the control of a complex technological process and objects of distributed network systems(smart water grid, smart sewage system, smart waste management system) and solving problems ofoptimal control for smart dynamic objects with logical representation of knowledge about the process,the control object and the control itself, for which the learning process consists of successive validationand updating of knowledge and the use of the results of this updating to make control decisions. Theadvantage of the proposed solution in relation to the existing ones lies in the use of advanced modelsof predictive diagnostics, validation and reconstruction of data, implemented in functional tools,allowing the stabilization of the work of technological objects through the use of FTC technology (faulttolerant control) and soft sensors, predictive measurement path diagnostics (sensors, transducers),validation and reconstruction of measurement data from sensors in the measuring paths in real time.The dedicated tools (Intelligent Real Time Diagnostic System − iRTDS) built into the system of ahierarchical, multi-threaded control optimizing system of SCADA system allow to obtain advanceddiagnostics of technological processes in real time using HPC technology. In effect of the applicationof the proprietary iRTDS tool, we obtain a significant rise of energy efficiency of technologicalprocesses in key sectors of the economy, which in global terms, e.g., urban agglomeration, increasesthe economic efficiency.
Keywords: smart cities; smart computational solution; artificial intelligence; energy economics;control systems; energy efficiency of technological processes; wastewater treatment system; fuelfrom wastes
1. Introduction
The transformation of global economies towards the effective use of energy sources and thereduction of pollution emissions, including greenhouse gases, is becoming one of key challenges faced
Energies 2020, 13, 3338; doi:10.3390/en13133338 www.mdpi.com/journal/energies
Energies 2020, 13, 3338 2 of 41
by our civilization. The world economy is shaped by the interpenetrating sectors of energy production,wastes disposal, water and wastewater management, transport and municipal management. Withrespect to power generation sector, an important aspect of the performance of any energy system is toensure balance between the demand and the production of energy carriers when we are confrontedwith conditions or factors destabilizing its proper functioning. Such factors involve, for example,power supply fluctuations of renewable energy sources, failures of networks or generators, changes inenergy demand, etc. The need for an effective response to such disturbances in energy production anddistribution systems is even more justified when frequent large power supply failures occur and theconsequences are severe for all energy market participants.
The search for optimal technological solutions, both hard and soft ones, in the energy sector,water and wastewater management, or waste disposal requires specialist, domain knowledge, whichsupplemented by solutions can be a key element in intelligent IT systems. By the application ofnumerical modeling, we can develop systems based on the knowledge of complex solutions, processesand installations in a relatively short time. It is particularly important in the context of processoptimization that requires complex calculations for one specific case (building real models for eachsolution variant is impossible for technical reasons). Models of this type are used in each of the fieldsof power generation and environmental engineering, ranging from simulation of individual devices,through designs of power systems, such as power plants, to technical and social models of entiresystems for a region.
Models of processes are usually described by partial differential equations describing the behaviorof systems. The computational complexity of such algorithmic models is usually so large that the ITsystems required to solve them make software engineers resort to parallel computing architecture.Sometimes the exact nature of the problem is unknown, and we have to rely on knowledge derivedfrom observation, or the applied software imposes a specific modeling method that does not allowaccurate reproduction of all the nuances of the system under consideration.
An alternative solution that can be used in such a situation is the application of advancedsolutions based on artificial intelligence (artificial neural networks, fuzzy sets, genetic algorithms, etc.).In the field of industrial automation, many solutions based on artificial intelligence are available,including inferential, predictive and adaptive systems, which are a key element in the optimal controlof technological processes.
For the comprehensive optimization of the control of industrial process parameters, we arecurrently using advanced control algorithms in combination with predictive and adaptive models. Themain objective of the control process of modern installations for industry, including energy sector, is tostabilize the parameters of the technological process and maintain balance in the process managementsystem, which helps reduce the occurrence of sudden and significant changes in operating parameters.
The current industrial research and development works in the areas of energy management, waterand wastewater management or waste disposal are a vital part of the contemporary strategic activitiesdetermining the development of smart cities. The global economy is shaped by the development ofadvanced ICT technologies, in particular in the field of HPC, big data, cloud computing, soft sensorsmetering, as well as industrial automation. The development of these technologies guarantees thesustainable development of cities while ensuring the security of fuel and energy supplies, drinkingwater for end users and optimal management of resources, including non-renewable energy.
The international smart cities strategies of conservation and sustainability policies as well as thecomplexity of critical infrastructure make water management a challenging in a respect of monitoringand technology processes control problem. Optimization and optimal control techniques provide animportant input to a smart management strategy of computation for water networks (DWN) [1–3].The problems related to modelling of water distribution systems have been the subject of researchefforts over the last few years [4–7]. In [6,8] the authors presented an MPC- based control technique toimprove the performance of DWNs. The developed control strategies have been tested on the waterdistribution network of Barcelona [9–11].
Energies 2020, 13, 3338 3 of 41
In the area of the optimization of energy consumption in the wastewater sector, a lot of researchstudies have been focused on solutions to increase energy efficiency. Measures to reach self-sufficientWWTPs include the following:
• Process optimization.• Enhanced biogas yield.• Efficient on-site combined heat and power (CHP) generation.• Co-digestion of sludge with food waste as a option to increase the biogas output.
An important area of research involves the waste management sector due to its high energypotential. The report from The World Bank estimates that by 2025 waste amount will increaseto 2.2 billion tons all over the world [5]. Around the world, waste-to-energy technologies are animportant part of integrated waste management systems to address global warming and climatechange. Globally, waste-to-energy technologies play a vital role in sustainable waste management andin the mitigation of environmental issues. These technologies are classified as biological and thermaltreatment technologies.
Despite many advanced solutions dedicated to the sectors of water and sewage managementand waste management, the problem of generating incorrect control trajectories for executive devices(motors driving pumps, fans) in supervisory control systems has not been solved yet. The main reasonis the lack of predictive diagnostics of the technological process (predictive diagnostics of deviceoperating states) and predictive diagnostics of measuring data (in measuring tracks), as well as thelack of precise calibration of process models (including hydraulic) in real time, affecting the low energyefficiency of these processes (too low efficiency of pumps, fans and too low control quality indicator).
The problem of optimizing the electricity consumption by technological processes in strategicsectors for urban agglomerations of water and wastewater management and waste managementhas been solved. It was a scientific and technological challenge to be able to develop a noveltysolution involves the use of predictive diagnostic tools, based on multi-threaded polymorphic modelssupporting decision making in the control of complex technological process and objects of dispersednetwork systems (smart water grid, smart sewage system, smart waste management system) andsolving the problems of optimal control for intelligent dynamic objects with logical representationof knowledge about the process, about the control object and the control process itself for which thelearning process consists in successive validation and updating of knowledge and the use of the resultsof this updating to determine control decisions.
The advantage of the proposed solution in relation to the existing ones lies in the use of advancedmodels of predictive diagnostics, validation and reconstruction of data, implemented in functional tools,allowing the stabilization of the work of technological objects through the use of fault tolerant controltechnology and soft sensors, predictive measurement path diagnostics, validation and reconstruction ofmeasurement data from sensors in measuring paths in real time. The solution comprises two modulesimplementing validation methods based on the so-called quality levels to detect anomalies and missingdata, and the data reconstruction method based on the method of space time series analysis used toestimate the missing/incorrect data.
It was a scientific and technological challenge to be able to develop optimization algorithmicmodels that control the operation of the technological processes, allowing for the following in particular:
1. SMART Computational Solutions for the optimization of solid waste fuel production fromseparate combustible fractions—a polymorphic model of multi-threaded optimization of theproduction process of fuel components from combustible municipal waste fractions,
• Thread A—optimization of the light fraction production process with preset physicochemical,combustion and emission properties.
Energies 2020, 13, 3338 4 of 41
• Thread B—optimization of the production process of hybrid fuel components, by mixing thelight fraction with fossil fuels, while fulfilling the objective function (Wd-calorific value) andconstraints imposed on decision-making optimization tasks.
2. SMART Wastewater Treatment Plant Computational Solutions-a model for optimizing thebiological process of wastewater treatment using a multi-threaded hierarchical adaptive controlalgorithm, including:
• Thread A—a model for automatic control of the nitrification and denitrification process,while monitoring the value of total nitrogen in the treated wastewater,
• Thread B—a model for the optimization of internal and external recirculation processes ofthe bioreactor.
The paper presents advanced computational solutions for selected sectors in terms of theoptimization of selected technology processes as an innovation and progress in improving energyefficiency of Smart Cities.
The solutions presented in the article are affected by utilitarian scientific and technologicalchallenges undertaken by the authors and relate to key strategic areas of smart cities, including inparticular the development of technologically advanced models of hierarchical, multi-threaded controloptimizing the parameters of technological processes.
The structure of the paper is the following: Section 2 presents the advanced soft computingapplications and industrial automation in selected SMART sectors. Section 3 presents the advancedalgorithmic models in selected areas of critical infrastructure of smart cities, including:
1. SMART Waste Management Computational Solution,2. SMART Wastewater Treatment Plant Computational Solution.
Additionally, Section 3 presents the implementation details of the predictive optimal strategy andshows the application of the optimal operational control of the real objects of the SMART town ofNowy Sacz (Poland). The results and discussion are presented in Section 4, and the conclusions areoutlined in Section 5.
2. Advanced Soft Computing Applications and Industrial Automation in Selected SMART Sectors
A dynamic development of ICT and industrial automation systems determines the economicdevelopment in all strategic sectors of the world economy as well as the development of cities andintelligent technologies.
The most important element of advanced ICT systems involves supplementing the existingsolutions (integrating GIS, SCADA and dedicated models) with the optimizing control layer (includingMPC predictive control models). In the existing systems, the supervisory layer is the highest levelin the hierarchical control structure. The superiority of the said systems in relation to the existingones lies in the application, among other things, of the MPC predictive control models, which areintegrating the knowledge base on control objects and technological processes, models of state andevent space. By using evolutionary strategies, the MPC control algorithm is less sensitive to signalerrors, and by using soft sensors and Performance Analysis Diagnostics & Optimization (PADO) andComplex Event Processing (CEP) technologies, it allows to generate optimal control trajectories forthe supervisory control layer. What is more, parallel computing architecture (e.g., NVidia CUDA) ismore and more frequently used, allowing for the acceleration of numerical calculations and for thereduction of time complexity of algorithms. The knowledge base on control objects is updated in realtime from SCADA. The system of multi-threaded hierarchical control of industrial processes works inthe background-parallel to the real system, conducting a huge number of simulations in the state andevent space-learning (from the real-time knowledge base updated from SCADA systems, GIS, modelsof control objects, models of state and events in real time, constantly improving the quality of control.
Energies 2020, 13, 3338 5 of 41
The models of state and event space are part of the knowledge base on control objects. The solutionspresented in the article are affected by the completed research and development projects financedby the National Center for Research and Development from structural funds under the OperationalProgram Intelligent Development and the Operational Program Infrastructure and Environment in2017–2020. The presented results, i.e., algorithm models, have been realized and implemented insupervisory control systems in network-type companies in several cities (Warsaw, Zywiec, Nowy Sacz).
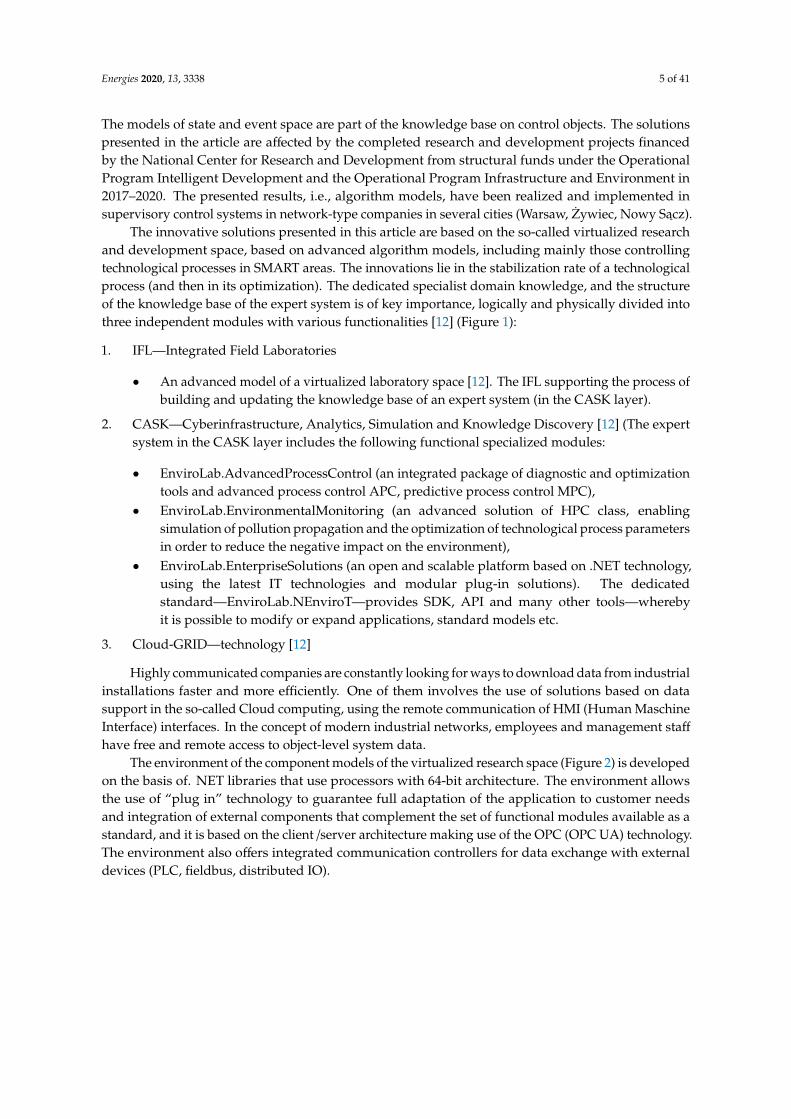
The innovative solutions presented in this article are based on the so-called virtualized researchand development space, based on advanced algorithm models, including mainly those controllingtechnological processes in SMART areas. The innovations lie in the stabilization rate of a technologicalprocess (and then in its optimization). The dedicated specialist domain knowledge, and the structureof the knowledge base of the expert system is of key importance, logically and physically divided intothree independent modules with various functionalities [12] (Figure 1):
1. IFL—Integrated Field Laboratories
• An advanced model of a virtualized laboratory space [12]. The IFL supporting the process ofbuilding and updating the knowledge base of an expert system (in the CASK layer).
2. CASK—Cyberinfrastructure, Analytics, Simulation and Knowledge Discovery [12] (The expertsystem in the CASK layer includes the following functional specialized modules:
• EnviroLab.AdvancedProcessControl (an integrated package of diagnostic and optimizationtools and advanced process control APC, predictive process control MPC),
• EnviroLab.EnvironmentalMonitoring (an advanced solution of HPC class, enablingsimulation of pollution propagation and the optimization of technological process parametersin order to reduce the negative impact on the environment),
• EnviroLab.EnterpriseSolutions (an open and scalable platform based on .NET technology,using the latest IT technologies and modular plug-in solutions). The dedicatedstandard—EnviroLab.NEnviroT—provides SDK, API and many other tools—wherebyit is possible to modify or expand applications, standard models etc.
3. Cloud-GRID—technology [12]
Highly communicated companies are constantly looking for ways to download data from industrialinstallations faster and more efficiently. One of them involves the use of solutions based on datasupport in the so-called Cloud computing, using the remote communication of HMI (Human MaschineInterface) interfaces. In the concept of modern industrial networks, employees and management staff
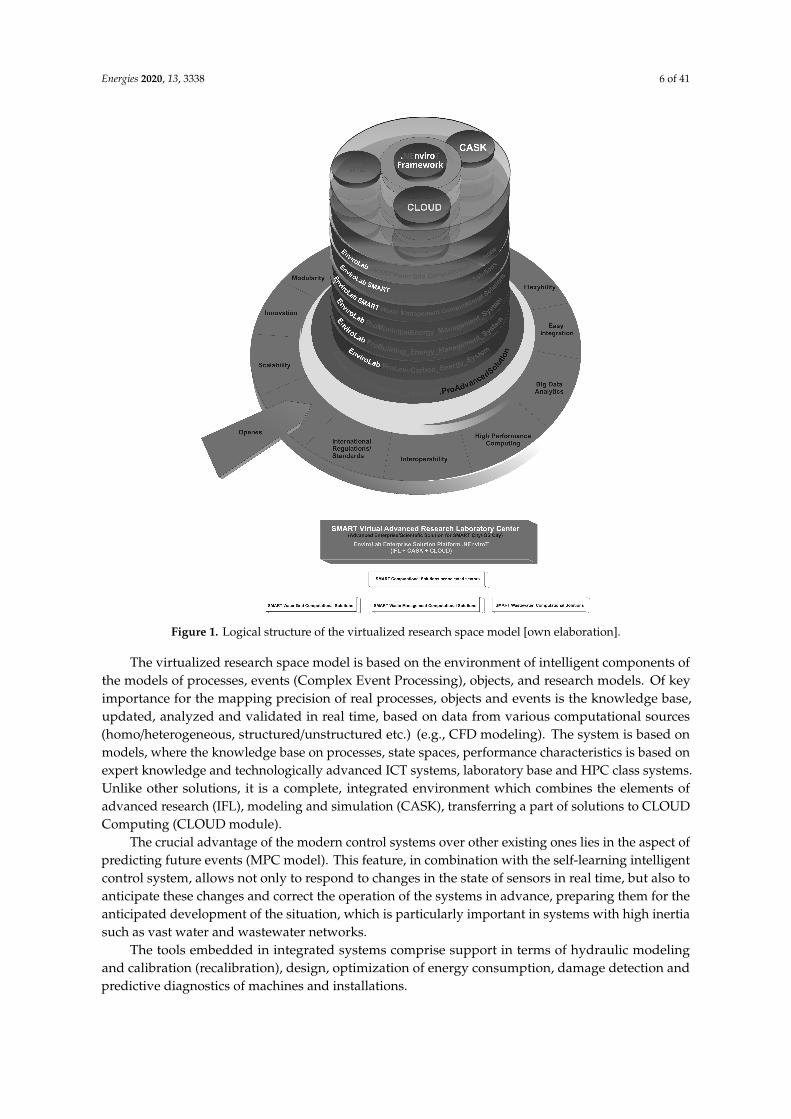
have free and remote access to object-level system data.The environment of the component models of the virtualized research space (Figure 2) is developed
on the basis of. NET libraries that use processors with 64-bit architecture. The environment allowsthe use of “plug in” technology to guarantee full adaptation of the application to customer needsand integration of external components that complement the set of functional modules available as astandard, and it is based on the client /server architecture making use of the OPC (OPC UA) technology.The environment also offers integrated communication controllers for data exchange with externaldevices (PLC, fieldbus, distributed IO).
Energies 2020, 13, 3338 6 of 41Energies 2020, 13, x FOR PEER REVIEW 6 of 41
Figure 1. Logical structure of the virtualized research space model [own elaboration].
The virtualized research space model is based on the environment of intelligent components of the models of processes, events (Complex Event Processing), objects, and research models. Of key importance for the mapping precision of real processes, objects and events is the knowledge base, updated, analyzed and validated in real time, based on data from various computational sources (homo/heterogeneous, structured/unstructured etc.) (e.g., CFD modeling). The system is based on models, where the knowledge base on processes, state spaces, performance characteristics is based on expert knowledge and technologically advanced ICT systems, laboratory base and HPC class systems. Unlike other solutions, it is a complete, integrated environment which combines the elements of advanced research (IFL), modeling and simulation (CASK), transferring a part of solutions to CLOUD Computing (CLOUD module).
The crucial advantage of the modern control systems over other existing ones lies in the aspect of predicting future events (MPC model). This feature, in combination with the self-learning intelligent control system, allows not only to respond to changes in the state of sensors in real time, but also to anticipate these changes and correct the operation of the systems in advance, preparing them for the anticipated development of the situation, which is particularly important in systems with high inertia such as vast water and wastewater networks.
The tools embedded in integrated systems comprise support in terms of hydraulic modeling and calibration (recalibration), design, optimization of energy consumption, damage detection and predictive diagnostics of machines and installations.
The developing technologies of intelligent monitoring, control and management systems for dispersed network objects in metropolises are a response to contemporary challenges in the context of a dynamic development of intelligent cities (SMART cities) in the field of sustainable management
Figure 1. Logical structure of the virtualized research space model [own elaboration].
The virtualized research space model is based on the environment of intelligent components ofthe models of processes, events (Complex Event Processing), objects, and research models. Of keyimportance for the mapping precision of real processes, objects and events is the knowledge base,updated, analyzed and validated in real time, based on data from various computational sources(homo/heterogeneous, structured/unstructured etc.) (e.g., CFD modeling). The system is based onmodels, where the knowledge base on processes, state spaces, performance characteristics is based onexpert knowledge and technologically advanced ICT systems, laboratory base and HPC class systems.Unlike other solutions, it is a complete, integrated environment which combines the elements ofadvanced research (IFL), modeling and simulation (CASK), transferring a part of solutions to CLOUDComputing (CLOUD module).
The crucial advantage of the modern control systems over other existing ones lies in the aspect ofpredicting future events (MPC model). This feature, in combination with the self-learning intelligentcontrol system, allows not only to respond to changes in the state of sensors in real time, but also toanticipate these changes and correct the operation of the systems in advance, preparing them for theanticipated development of the situation, which is particularly important in systems with high inertiasuch as vast water and wastewater networks.
The tools embedded in integrated systems comprise support in terms of hydraulic modelingand calibration (recalibration), design, optimization of energy consumption, damage detection andpredictive diagnostics of machines and installations.
Energies 2020, 13, 3338 7 of 41
Energies 2020, 13, x FOR PEER REVIEW 8 of 41
individual objects of the critical infrastructure of the network as well as detection and identification of erroneous signals from measurement paths, damage to control paths, etc.
Figure 2. Specialized platform of the virtual laboratory EnviroLab [own elaboration] [12].
The specialization follows up the learning process in the space of states and events through validation, reconstruction of object data structures and reconfiguration of control algorithms.
A three-layer hierarchical control system was introduced [12]. The direct control layer is used to control actuators, the supervisory control layer is responsible for data supervision and acquisition, and the third of the layers – the optimizing control layer, consists of an additional computer unit realizing complex predictive control algorithms, using specialized scientific applications (Matlab/Simulink, PADO, CEP, Neurosolution), including advanced proprietary solutions.
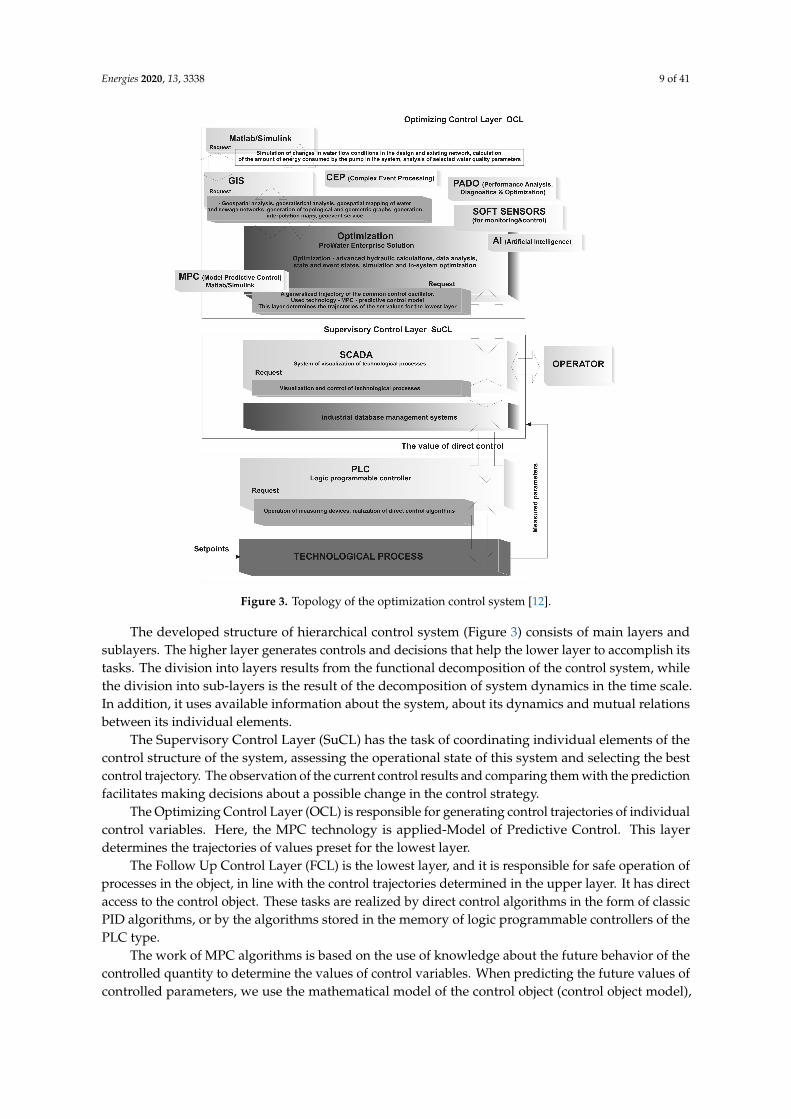
The developed structure of hierarchical control system (Figure 3) consists of main layers and sublayers. The higher layer generates controls and decisions that help the lower layer to accomplish its tasks. The division into layers results from the functional decomposition of the control system, while the division into sub-layers is the result of the decomposition of system dynamics in the time scale. In addition, it uses available information about the system, about its dynamics and mutual relations between its individual elements.
Figure 2. Specialized platform of the virtual laboratory EnviroLab [own elaboration] [12].
The developing technologies of intelligent monitoring, control and management systems fordispersed network objects in metropolises are a response to contemporary challenges in the context ofa dynamic development of intelligent cities (SMART cities) in the field of sustainable management ofmunicipal infrastructure in metropolises, including sustainable management of resources, in terms ofimproving the efficiency of use of these resources.
Most integrated programming environments for industrial control systems (i.e., those in whichapplications for control, visualization, and control of electric drives, or communication in industrialnetworks are developed in parallel) enable the simulation of project operation before final compilationand dispatch to the controller. Innovative solutions in this regard combine simulation technology withthree-dimensional visualization of the workspace of the programmed installations. The applied ITtechnologies are significant in this type of solutions. These comprise, among others, programmingwith the use of. NET framework platform, Microsoft Presentation Foundation and OPC servertechnology (OLE for Process Control), including mainly Data Access specification (the tools such as
Energies 2020, 13, 3338 8 of 41
Matlab/Simulink have the OPC UA client function, whereby it possible to communicate with industrialcontrol systems).
Nowadays, the most sophisticated technique for designing machine control systems is the so-calledmechatronic or parallel design. In the case of hardware and software platforms for rapid prototypingof the development procedure of a new algorithm (using a typical, scientific approach) the following isto be considered:
1. Preparation of a simulation model.2. Compilation of the project in the dedicated card containing analog/digital input/output interfaces.3. Development of a target hardware module, e.g., using the systems ASIC, FPGA, microcontrollers.
The new approach to the prototyping of industrial control systems eliminates the need to usededicated prototype cards in favor of compilation of the code in the target device. This approachsignificantly reduces implementation time and the cost of the entire solution. Rapid prototyping asa technique for developing new control algorithms has been known for a dozen or so years. It issuccessfully used in projects in the field of mechatronics, mainly due to shortening the time betweenthe development of a concept and the implementation for final tests.
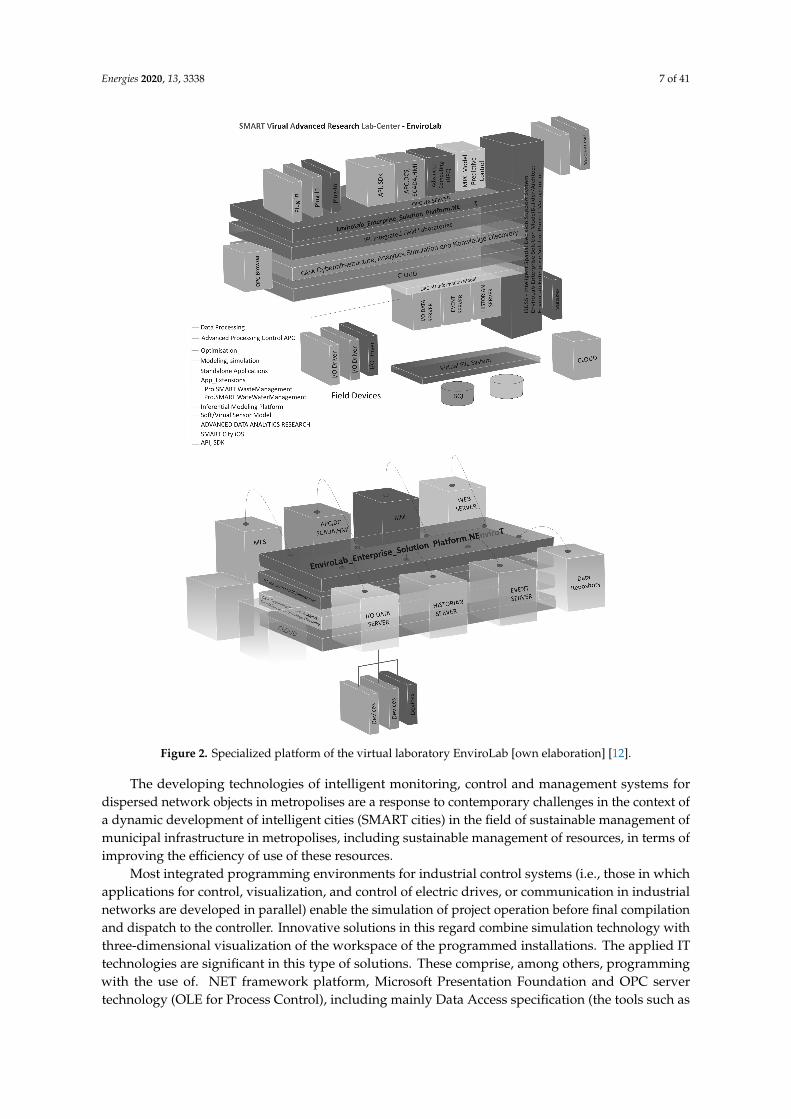
Many years of research and development works for business entities in the SMART City sectorshave yielded an innovative solution of the hierarchical control system (Figure 3), which consists ofmain layers (Supervising, Optimizing, and Follow up) and sub-layers (slow, medium and fast) Theupper layer generates controls and decisions that help the lower layer to accomplish its tasks. Thedivision into layers results from the functional decomposition of the control system, while the divisioninto sub-layers is the result of the decomposition of system dynamics in the time scale. In addition,it uses available information about the system, about its dynamics and mutual relations between itsindividual elements (knowledge base on control objects).
The novelty of the developed system lies in the mathematical model of technological processes andthat of intelligent critical infrastructure of the network, including wastewater, water supply, comprisingmodels of technological objects as well as models of control and monitoring systems. One of the keymodels is the mathematical model of an expert hierarchical system of predictive and adaptive controlof water supply and wastewater networks, providing a significant upturn in the reliability of thesystems and rapid stabilization of work and restoration of full functionality in response to failures andconditions destabilizing the operation of the network.
The decision-making problem involving (the control of) a complex technological process or objectin the dispersed sewerage system (water supply) has been formulated as a problem of optimal controlfor intelligent dynamic objects (components of the critical network), with a logical representationof knowledge about the control and the control object for which the learning process consists in asuccessive validation and updating of knowledge, and in using the results of this update to determinecontrol decisions. Intelligent objects of the network with a logical representation of knowledge aboutcontrol, owing to the use of artificial neural network models (including auto associative memory)and neural-like algorithms have the so-called specialization and adaptation in response to a changein the operating status of devices, process and technological parameters of individual objects of thecritical infrastructure of the network as well as detection and identification of erroneous signals frommeasurement paths, damage to control paths, etc.
The specialization follows up the learning process in the space of states and events throughvalidation, reconstruction of object data structures and reconfiguration of control algorithms.
A three-layer hierarchical control system was introduced [12]. The direct control layer is used tocontrol actuators, the supervisory control layer is responsible for data supervision and acquisition, andthe third of the layers—the optimizing control layer, consists of an additional computer unit realizingcomplex predictive control algorithms, using specialized scientific applications (Matlab/Simulink,PADO, CEP, Neurosolution), including advanced proprietary solutions.
Energies 2020, 13, 3338 9 of 41Energies 2020, 13, x FOR PEER REVIEW 9 of 41
Figure 3. Topology of the optimization control system[12].
The Supervisory Control Layer (SuCL) has the task of coordinating individual elements of the control structure of the system, assessing the operational state of this system and selecting the best control trajectory. The observation of the current control results and comparing them with the prediction facilitates making decisions about a possible change in the control strategy.
The Optimizing Control Layer (OCL) is responsible for generating control trajectories of individual control variables. Here, the MPC technology is applied - Model of Predictive Control. This layer determines the trajectories of values preset for the lowest layer.
The Follow Up Control Layer (FCL) is the lowest layer, and it is responsible for safe operation of processes in the object, in line with the control trajectories determined in the upper layer. It has direct access to the control object. These tasks are realized by direct control algorithms in the form of classic PID algorithms, or by the algorithms stored in the memory of logic programmable controllers of the PLC type.
The work of MPC algorithms is based on the use of knowledge about the future behavior of the controlled quantity to determine the values of control variables. When predicting the future values of controlled parameters, we use the mathematical model of the control object (control object model), previous values of the control signal and the values of interfering signals (past, present and possibly future ones).
The MPC algorithm directly takes into account various types of constraints; constraints involving the value of control variables; constraints involving the increments in the value of control variables; constraints involving output variables; constraints of technological variables, which are formulated analogously to the constraints involving output variables. The MPC / APC system is implemented at a higher level of supervision to manipulate the setpoints of many control loops, to optimize control systems and track the changes in the values of process variables, and it is based on modeling the state space of the processes [12].
Figure 3. Topology of the optimization control system [12].
The developed structure of hierarchical control system (Figure 3) consists of main layers andsublayers. The higher layer generates controls and decisions that help the lower layer to accomplish itstasks. The division into layers results from the functional decomposition of the control system, whilethe division into sub-layers is the result of the decomposition of system dynamics in the time scale.In addition, it uses available information about the system, about its dynamics and mutual relationsbetween its individual elements.
The Supervisory Control Layer (SuCL) has the task of coordinating individual elements of thecontrol structure of the system, assessing the operational state of this system and selecting the bestcontrol trajectory. The observation of the current control results and comparing them with the predictionfacilitates making decisions about a possible change in the control strategy.
The Optimizing Control Layer (OCL) is responsible for generating control trajectories of individualcontrol variables. Here, the MPC technology is applied-Model of Predictive Control. This layerdetermines the trajectories of values preset for the lowest layer.
The Follow Up Control Layer (FCL) is the lowest layer, and it is responsible for safe operation ofprocesses in the object, in line with the control trajectories determined in the upper layer. It has directaccess to the control object. These tasks are realized by direct control algorithms in the form of classicPID algorithms, or by the algorithms stored in the memory of logic programmable controllers of thePLC type.
The work of MPC algorithms is based on the use of knowledge about the future behavior of thecontrolled quantity to determine the values of control variables. When predicting the future values ofcontrolled parameters, we use the mathematical model of the control object (control object model),
Energies 2020, 13, 3338 10 of 41
previous values of the control signal and the values of interfering signals (past, present and possiblyfuture ones).
The MPC algorithm directly takes into account various types of constraints; constraints involvingthe value of control variables; constraints involving the increments in the value of control variables;constraints involving output variables; constraints of technological variables, which are formulatedanalogously to the constraints involving output variables. The MPC/APC system is implemented ata higher level of supervision to manipulate the setpoints of many control loops, to optimize controlsystems and track the changes in the values of process variables, and it is based on modeling the statespace of the processes [12].
3. Materials and Methods
In Section 3 the authors present the advanced algorithmic models in the selected areas of criticalinfrastructure of smart cities and the implementation details of the predictive optimal strategy, as wellas the application of the optimal operational control of the real objects of the SMART town of NowySacz (Poland), i.e.,
1. Section 3.1—SMART Waste Management Computational Solution,2. Section 3.2—Computational Solution of SMART Wastewater Treatment Plant.
3.1. SMART Waste Management Computational Solution
In this section was presented the model of multi-threaded optimization of the manufacturingprocess of fuel components. A growing demand for heat and electricity used in many industry sectorsand in the municipal economy leads to a drastic reduction of natural resources of conventional fuels, i.e.,hard coal, lignite, crude oil and natural gas. Excessive exploitation of natural energy carriers results inenvironmental degradation and irreversible climate changes [13]. In effect of the production of energycarriers and products or semi-finished products used in various technological processes, we generatepost-process secondary waste of various types. The wastes (apart from industry) are also generatedby other entities, as streams of hazardous wastes, municipal wastes, whose enthalpy of devaluationallows its secondary use after proper treatment [14]. Owing to the use of molded fuel componentsfrom segregated waste groups, in the associated co-firing processes with conventional fuels, significantsavings are obtained resulting from a partial replacement of fossil fuels and the reduction of ecologicalnuisance resulting directly from the reduction of the migration of waste substances to the environment(to soil, atmospheric air, surface water and groundwater). A special emphasis should be placed on thepossibility of using certain groups of hazardous waste (pesticides, medical waste) in these processes.Conducting technological processes with the use of molded fuel components in associated thermalsystems must be conditioned by technical criteria, which means that they cannot interfere with basicprocesses, and in global terms, with sustainable development factors. The process involving thepreparation of fuel from wastes requires careful analysis in terms of technological conditions andphysic-chemical properties of the waste fraction of the produced fuel components. The regulationsinvolving the process of thermal decomposition of substances in BIO-power boilers impose a numberof requirements for fuels. The molded fuel must have [15–17]:
1. Optimal calorific value (enthalpy of devaluation).2. Appropriate fractional, elemental composition, fuel properties (moisture content, combustible
content, non-combustible content, volatile content, aggressive content.3. Suitable ash softening and melting temperature, flash point, combustion temperature), as well as
relevant material properties (shape, porosity).
The concept of converting segregated combustible components generated by various technologicaloperations into fuel is essentially based on the following assumptions:
1. Substances included in fuels have identified chemical properties and composition.
Energies 2020, 13, 3338 11 of 41
2. The combustion process involving molded fuels is known.
The recycling process of the post-process waste must be preceded by detailed technical as wellas ecological and economic analyses [18]. At present, there are a number of technologies that allowthe recovery of materials and energy raw materials from various waste groups and the reuse ofsuch materials as raw materials or as energy resources in various industries. Molded fuels can beintroduced directly into the furnace chamber as an addition to conventional fuels, or after beingprocessed (degassing, gasification) into process gas, they can be burned, e.g., in energetic dust boilers.
Technological processes of producing fuel components is controlled by advanced supervisorycontrol systems of SCADA type, which ensure monitoring of process parameters, visualization of theprocess and implement complex control algorithms, through the use of freely programmable PLCcontrollers, (including adaptive, predictive and inferential control algorithms).
3.1.1. Algorithmic Model of Multi-Threaded Optimization of the Manufacturing Process ofFuel components
The task of optimizing a complex technological process involving the production of fuelcomponents molded from separated combustible fractions of municipal waste to be applied inthe cement industry, thermal power engineering and professional power engineering comprises twomain threads:
1. optimization of the light fraction production process-consisting in separating (in the opticalseparator/s) from the heavy oversize fraction of waste stream- non-metallic components withhigh calorific value Wd, exceeding 38 MJ/kg in the case of PE using the advanced MPC predictivecontrol algorithm (based on a Multi Class Vector Support Machine algorithm model) implementedin the optimizing control layer of the SCADA system,
2. optimization of the production process of hybrid fuel components-consisting in mixing the lightfraction (obtained as a result of the optimization of the optical separation process-thread A) withfossil fuels, while fulfilling the objective function, i.e., its maximizing max
u∈SWT
d u while meeting the
constraints imposed on decision variables of the optimization task, determined by the parametersof the realized technological processes. The optimization of the process is carried out by themodified simplex algorithm.
The selection of technological processes and their mechanical parameters as well as theinterrelationship between the processes is defined on the basis of knowledge in the field of morphologicalcomposition, the frequency and amount of supplied waste, as well as on the concept involving furtherhandling of the recovered fractions. Quite significant are such physical properties as humidity (fullymechanical sorting plant is preferred for dry waste) and density of waste. Depending on theseparameters, the technological process will take different forms. These installations can differ not onlyin terms of the devices used in them, but also in terms of their number and order of location in thetechnological line. Only the proper selection of individual elements of the segregation line guaranteesthe acquisition of the assumed fraction recovery rates from the mixed municipal waste. In this aspect,the knowledge of the processes used to extract individual fractions from waste seems to be of keyimportance in the design and operation of a waste segregation line.
All components of the system are connected by a control system based on a complex algorithm.In the context of ensuring the correct course of the technological process, we must consider the MoldedFuels Production Plant as a complex, non-linear, multidimensional control object.
A complex, multi-threaded control algorithm of the process, built into the PLC logic controller,freely programmable (supervised by SCADA) performs the task of solving the optimization problemdefined as a neural classifier model (network Support Vector Machine—SVM) of non-metallic fractioncomponents (mainly ballistic and optical separation) where it reproduces the patterns of predefinedclasses-subsets generated by the greedy approximation algorithm (greedy set cover) containing
Energies 2020, 13, 3338 12 of 41
components-fractions, described by a set of features (including physicochemical properties, fuelproperties, emission properties, texture, structure, spectroscopic spectra).
Each subset-representing a pattern of a class of fractions-components-making the molded fuel isthe effect of optimization, using the greedy approximation algorithm (greedy set cover), maximizingthe objective function (calorific value Wd), meeting at the same time the process and technologicalconstraints imposed on the decision variables of the linear programming tasks (humidity, chlorineshare, heavy metals). The patterns of classes are described by a set of features (texture, structure,spectroscopic spectrum), which allows the algorithm at a lower level of the control of the sorting processto carry out classification using the network model SVM (MC SVM) on the basis of a set of featuresassigned to predefined patterns of classes, represented by disjoint subsets of the cover generated by themaster algorithm, Greedy Set Cover, and finally to check if the identified component/fraction belongsto the pattern of class by the incident matrix.
3.1.1.1. Algorithmic Subsystem Model for the Optimization of the Light-Caloric Fraction ProductionProcess—Thread A
The optimization of the production process of light fraction (so-called caloric)—consists in theseparation (in the optical separator/s) the waste stream components with high calorific value Wd,exceeding 38 MJ/kg in the case of PE (mainly plastics PE, PET, PP) using the advanced MPC predictivecontrol algorithm (based on the modified multi class vector support machine—MC SVM algorithmmodel) implemented in the optimizing control layer of the SCADA control system.
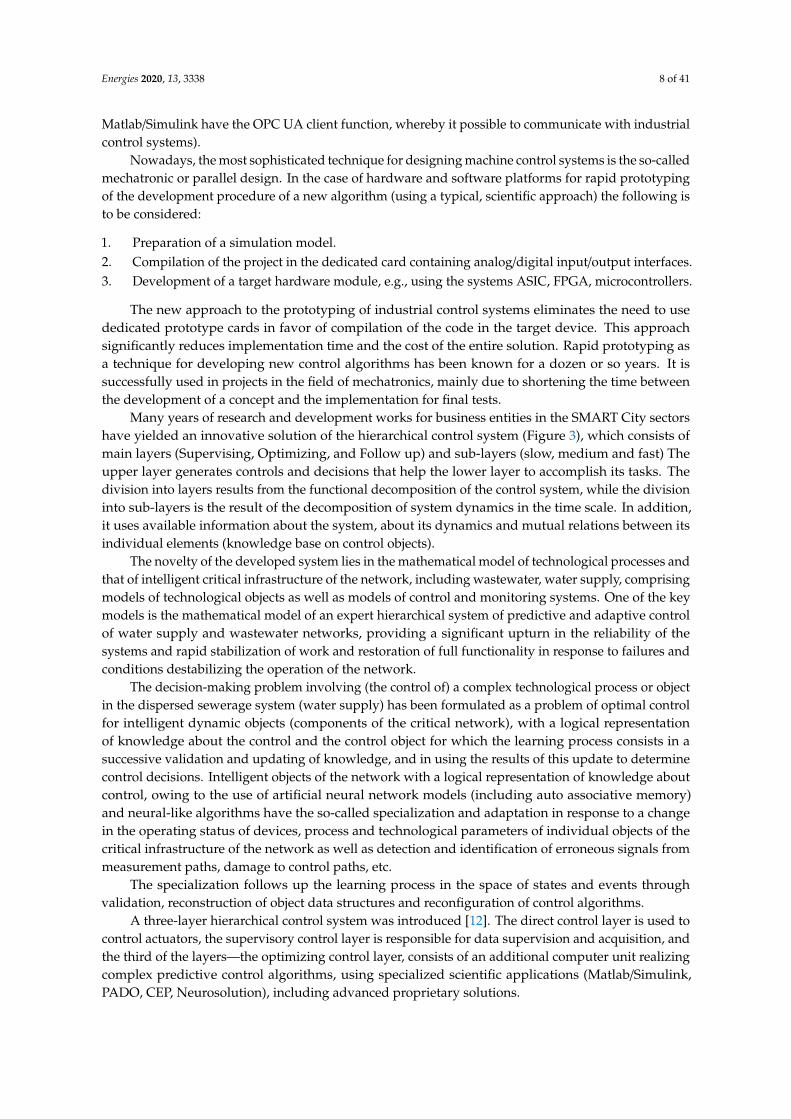
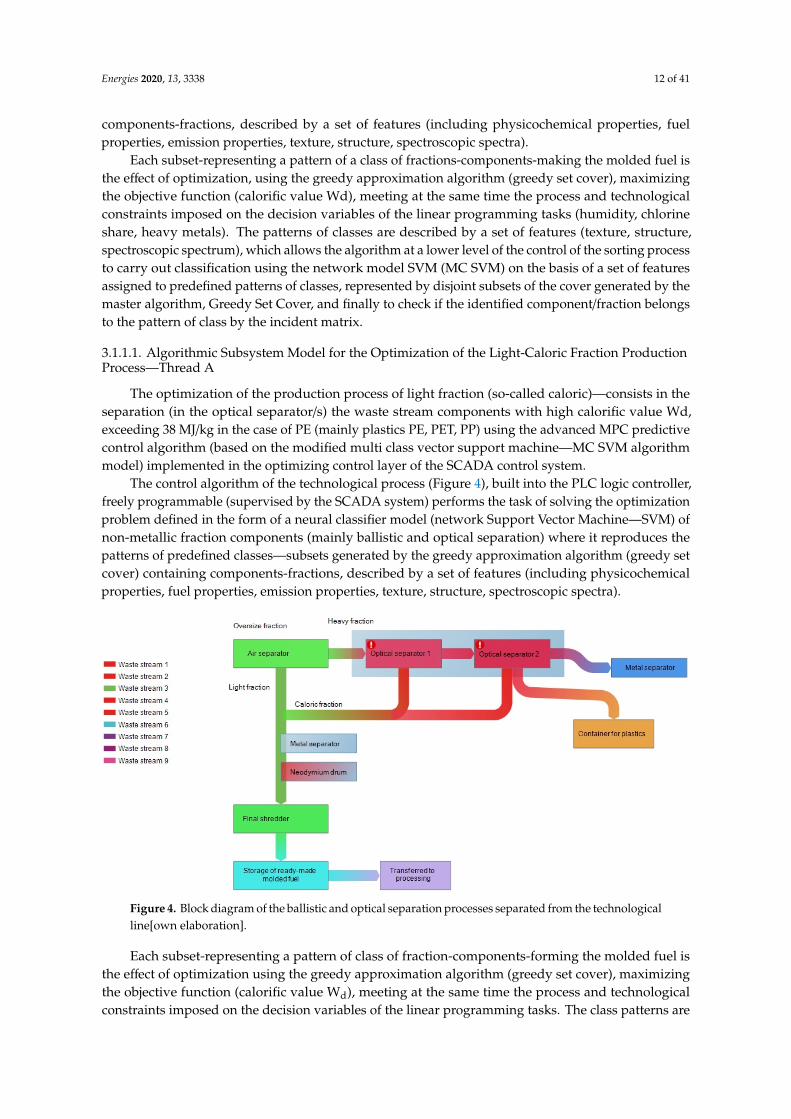
The control algorithm of the technological process (Figure 4), built into the PLC logic controller,freely programmable (supervised by the SCADA system) performs the task of solving the optimizationproblem defined in the form of a neural classifier model (network Support Vector Machine—SVM) ofnon-metallic fraction components (mainly ballistic and optical separation) where it reproduces thepatterns of predefined classes—subsets generated by the greedy approximation algorithm (greedy setcover) containing components-fractions, described by a set of features (including physicochemicalproperties, fuel properties, emission properties, texture, structure, spectroscopic spectra).
Energies 2020, 13, x FOR PEER REVIEW 12 of 41
3.1.1.1. Algorithmic subsystem model for the optimization of the light-caloric fraction production process – Thread A
The optimization of the production process of light fraction (so-called caloric) – consists in the separation (in the optical separator/s) the waste stream components with high calorific value Wd, exceeding 38 MJ/kg in the case of PE (mainly plastics PE, PET, PP) using the advanced MPC predictive control algorithm (based on the modified multi class vector support machine − MC SVM algorithm model) implemented in the optimizing control layer of the SCADA control system.
The control algorithm of the technological process (Figure 4), built into the PLC logic controller, freely programmable (supervised by the SCADA system) performs the task of solving the optimization problem defined in the form of a neural classifier model (network Support Vector Machine − SVM) of non-metallic fraction components (mainly ballistic and optical separation) where it reproduces the patterns of predefined classes − subsets generated by the greedy approximation algorithm (greedy set cover) containing components-fractions, described by a set of features (including physicochemical properties, fuel properties, emission properties, texture, structure, spectroscopic spectra).
Figure 4. Block diagram of the ballistic and optical separation processes separated from the technological line[own elaboration].
Each subset - representing a pattern of class of fraction-components - forming the molded fuel is the effect of optimization using the greedy approximation algorithm (greedy set cover), maximizing the objective function (calorific value Wd), meeting at the same time the process and technological constraints imposed on the decision variables of the linear programming tasks. The class patterns are described by a set of features (texture, structure, spectroscopic spectrum), which allows the algorithm at a lower level of the control of the sorting process to carry out classification using the network model SVM (MC SVM) on the basis of a set of features assigned to predefined class patterns, represented by disjoint subsets of the cover, generated by the master algorithm, Greedy Set Cover, and finally to check if the identified component/fraction belongs to the class pattern by the incident matrix.
Pneumatic segregation is based on the use of the correlation of the compressed air stream and the density of the segregated wastes, ensuring that at least two fractions differing in density parameter are selected. An undisputed advantage of this process is the ability to define a segregating parameter, which is the resultant of the gravity and momentum of the segregated particles, thanks to which the pneumatic segregation is a very flexible process that can comprise the applicability of many waste fractions belonging to the raw or partially selected municipal waste stream. The ballistic separation has a similar nature, except that the driving force is provided by the impeller that
Figure 4. Block diagram of the ballistic and optical separation processes separated from the technologicalline[own elaboration].
Each subset-representing a pattern of class of fraction-components-forming the molded fuel isthe effect of optimization using the greedy approximation algorithm (greedy set cover), maximizingthe objective function (calorific value Wd), meeting at the same time the process and technologicalconstraints imposed on the decision variables of the linear programming tasks. The class patterns are
Energies 2020, 13, 3338 13 of 41
described by a set of features (texture, structure, spectroscopic spectrum), which allows the algorithmat a lower level of the control of the sorting process to carry out classification using the network modelSVM (MC SVM) on the basis of a set of features assigned to predefined class patterns, represented bydisjoint subsets of the cover, generated by the master algorithm, Greedy Set Cover, and finally to checkif the identified component/fraction belongs to the class pattern by the incident matrix.
Pneumatic segregation is based on the use of the correlation of the compressed air stream and thedensity of the segregated wastes, ensuring that at least two fractions differing in density parameter areselected. An undisputed advantage of this process is the ability to define a segregating parameter,which is the resultant of the gravity and momentum of the segregated particles, thanks to which thepneumatic segregation is a very flexible process that can comprise the applicability of many wastefractions belonging to the raw or partially selected municipal waste stream. The ballistic separation hasa similar nature, except that the driving force is provided by the impeller that mechanically ejects thewaste into the sorting chamber. The process of aerodynamic separation is carried out in aerodynamicseparators, and the process of ballistic separation in ballistic separators. They allow the separationof wastes into two main fractions: light and heavy. The light fraction obtained from aerodynamicsegregation may include, for example, paper, foil, plastics, fabrics, and then by passing it to the ballisticseparator, it is easy to extract geometrically unstable fractions such as foil, paper, fabrics. The heavyfraction remaining from the processes of aerodynamic and ballistic segregation can be passed forfurther segregation or classed as ballast and taken to landfills.
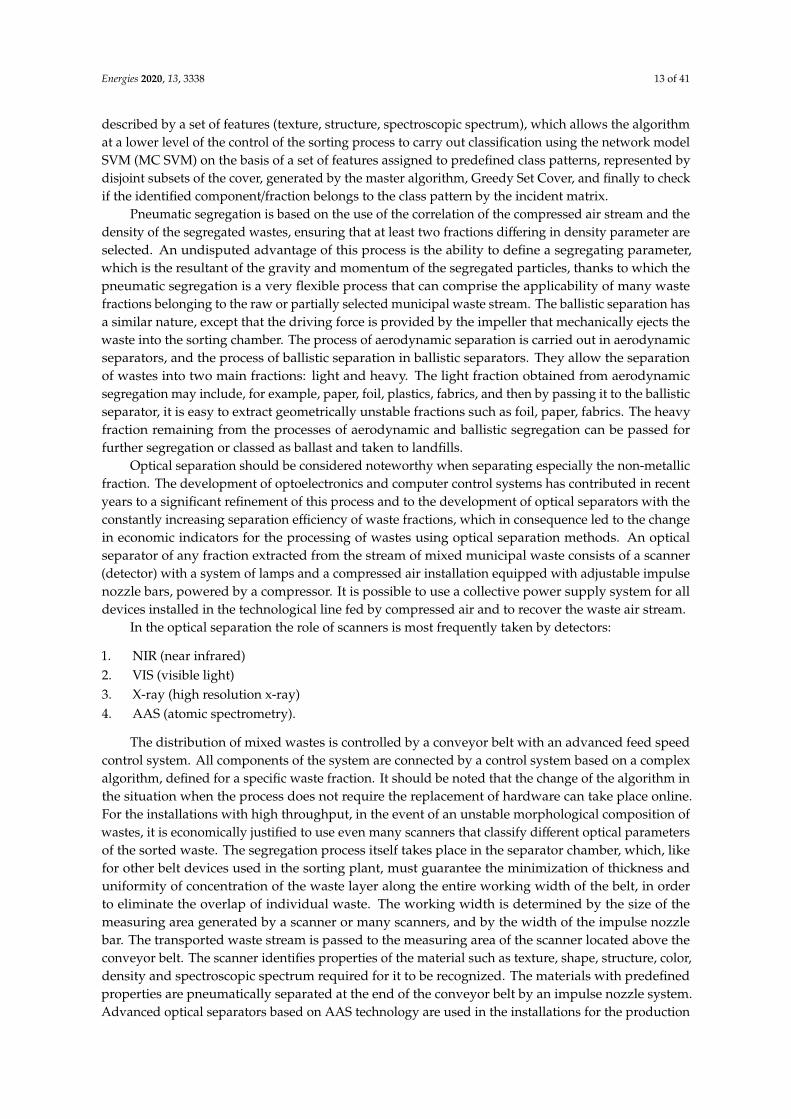
Optical separation should be considered noteworthy when separating especially the non-metallicfraction. The development of optoelectronics and computer control systems has contributed in recentyears to a significant refinement of this process and to the development of optical separators with theconstantly increasing separation efficiency of waste fractions, which in consequence led to the changein economic indicators for the processing of wastes using optical separation methods. An opticalseparator of any fraction extracted from the stream of mixed municipal waste consists of a scanner(detector) with a system of lamps and a compressed air installation equipped with adjustable impulsenozzle bars, powered by a compressor. It is possible to use a collective power supply system for alldevices installed in the technological line fed by compressed air and to recover the waste air stream.
In the optical separation the role of scanners is most frequently taken by detectors:
1. NIR (near infrared)2. VIS (visible light)3. X-ray (high resolution x-ray)4. AAS (atomic spectrometry).
The distribution of mixed wastes is controlled by a conveyor belt with an advanced feed speedcontrol system. All components of the system are connected by a control system based on a complexalgorithm, defined for a specific waste fraction. It should be noted that the change of the algorithm inthe situation when the process does not require the replacement of hardware can take place online.For the installations with high throughput, in the event of an unstable morphological composition ofwastes, it is economically justified to use even many scanners that classify different optical parametersof the sorted waste. The segregation process itself takes place in the separator chamber, which, likefor other belt devices used in the sorting plant, must guarantee the minimization of thickness anduniformity of concentration of the waste layer along the entire working width of the belt, in orderto eliminate the overlap of individual waste. The working width is determined by the size of themeasuring area generated by a scanner or many scanners, and by the width of the impulse nozzlebar. The transported waste stream is passed to the measuring area of the scanner located above theconveyor belt. The scanner identifies properties of the material such as texture, shape, structure, color,density and spectroscopic spectrum required for it to be recognized. The materials with predefinedproperties are pneumatically separated at the end of the conveyor belt by an impulse nozzle system.Advanced optical separators based on AAS technology are used in the installations for the production
Energies 2020, 13, 3338 14 of 41
of molded fuels because they allow for the separation of e.g., only plastics desired in fuel (PE, PP,PET), and the ballast e.g., PVC containing chlorine, undesirable in combustion processes is passedto landfills.
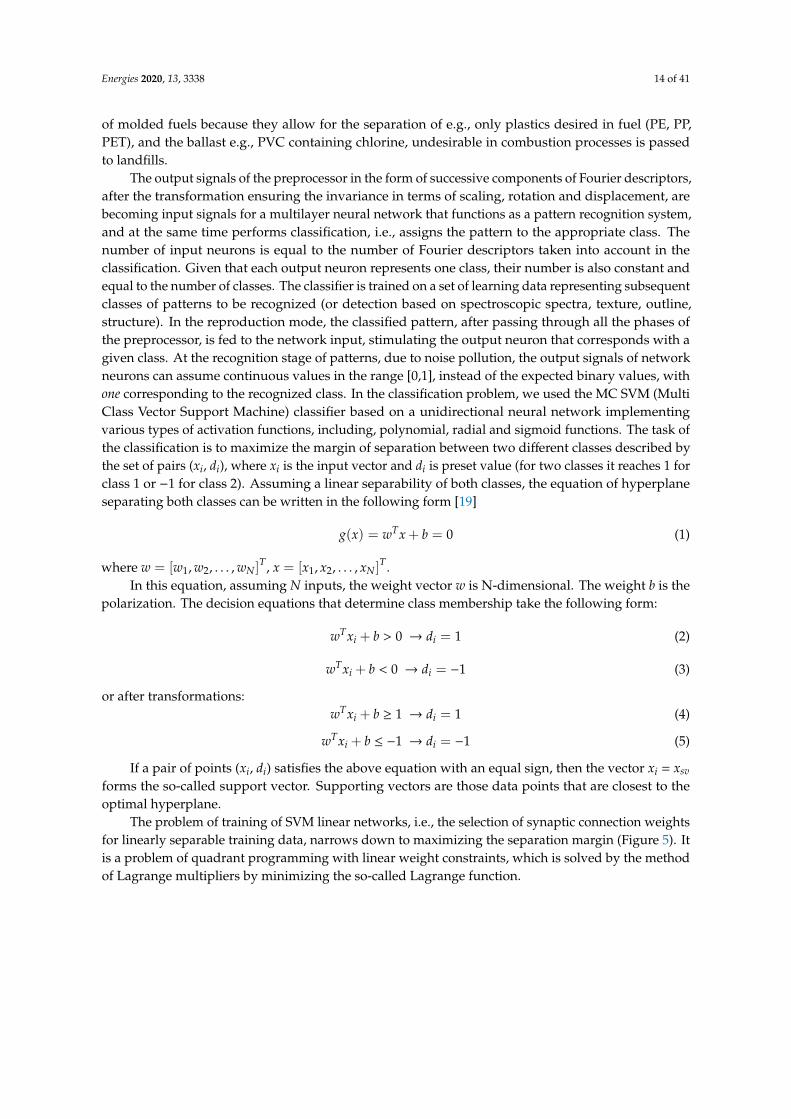
The output signals of the preprocessor in the form of successive components of Fourier descriptors,after the transformation ensuring the invariance in terms of scaling, rotation and displacement, arebecoming input signals for a multilayer neural network that functions as a pattern recognition system,and at the same time performs classification, i.e., assigns the pattern to the appropriate class. Thenumber of input neurons is equal to the number of Fourier descriptors taken into account in theclassification. Given that each output neuron represents one class, their number is also constant andequal to the number of classes. The classifier is trained on a set of learning data representing subsequentclasses of patterns to be recognized (or detection based on spectroscopic spectra, texture, outline,structure). In the reproduction mode, the classified pattern, after passing through all the phases ofthe preprocessor, is fed to the network input, stimulating the output neuron that corresponds with agiven class. At the recognition stage of patterns, due to noise pollution, the output signals of networkneurons can assume continuous values in the range [0,1], instead of the expected binary values, withone corresponding to the recognized class. In the classification problem, we used the MC SVM (MultiClass Vector Support Machine) classifier based on a unidirectional neural network implementingvarious types of activation functions, including, polynomial, radial and sigmoid functions. The task ofthe classification is to maximize the margin of separation between two different classes described bythe set of pairs (xi, di), where xi is the input vector and di is preset value (for two classes it reaches 1 forclass 1 or −1 for class 2). Assuming a linear separability of both classes, the equation of hyperplaneseparating both classes can be written in the following form [19]
g(x) = wTx + b = 0 (1)
where w = [w1, w2, . . . , wN]T, x = [x1, x2, . . . , xN]
T.In this equation, assuming N inputs, the weight vector w is N-dimensional. The weight b is the
polarization. The decision equations that determine class membership take the following form:
wTxi + b > 0 → di = 1 (2)
wTxi + b < 0 → di = −1 (3)
or after transformations:wTxi + b ≥ 1 → di = 1 (4)
wTxi + b ≤ −1 → di = −1 (5)
If a pair of points (xi, di) satisfies the above equation with an equal sign, then the vector xi = xsv
forms the so-called support vector. Supporting vectors are those data points that are closest to theoptimal hyperplane.
The problem of training of SVM linear networks, i.e., the selection of synaptic connection weightsfor linearly separable training data, narrows down to maximizing the separation margin (Figure 5). Itis a problem of quadrant programming with linear weight constraints, which is solved by the methodof Lagrange multipliers by minimizing the so-called Lagrange function.
Energies 2020, 13, 3338 15 of 41
Energies 2020, 13, x FOR PEER REVIEW 14 of 41
that corresponds with a given class. At the recognition stage of patterns, due to noise pollution, the output signals of network neurons can assume continuous values in the range [0,1], instead of the expected binary values, with one corresponding to the recognized class. In the classification problem, we used the MC SVM (Multi Class Vector Support Machine) classifier based on a unidirectional neural network implementing various types of activation functions, including, polynomial, radial and sigmoid functions. The task of the classification is to maximize the margin of separation between two different classes described by the set of pairs (xi, di), where xi is the input vector and di is preset value (for two classes it reaches 1 for class 1 or –1 for class 2). Assuming a linear separability of both classes, the equation of hyperplane separating both classes can be written in the following form [19] ( ) = + = 0 (1)
where = , , … , , = , , … , In this equation, assuming N inputs, the weight vector w is N-dimensional. The weight b is the
polarization. The decision equations that determine class membership take the following form: + > 0 → = 1 (2) + < 0 → = −1 (3)
or after transformations: + ≥ 1 → = 1 (4) + ≤ −1 → = −1 (5)
If a pair of points (xi, di) satisfies the above equation with an equal sign, then the vector xi = xsv forms the so-called support vector. Supporting vectors are those data points that are closest to the optimal hyperplane.
The problem of training of SVM linear networks, i.e., the selection of synaptic connection weights for linearly separable training data, narrows down to maximizing the separation margin (Figure 5). It is a problem of quadrant programming with linear weight constraints, which is solved by the method of Lagrange multipliers by minimizing the so-called Lagrange function.
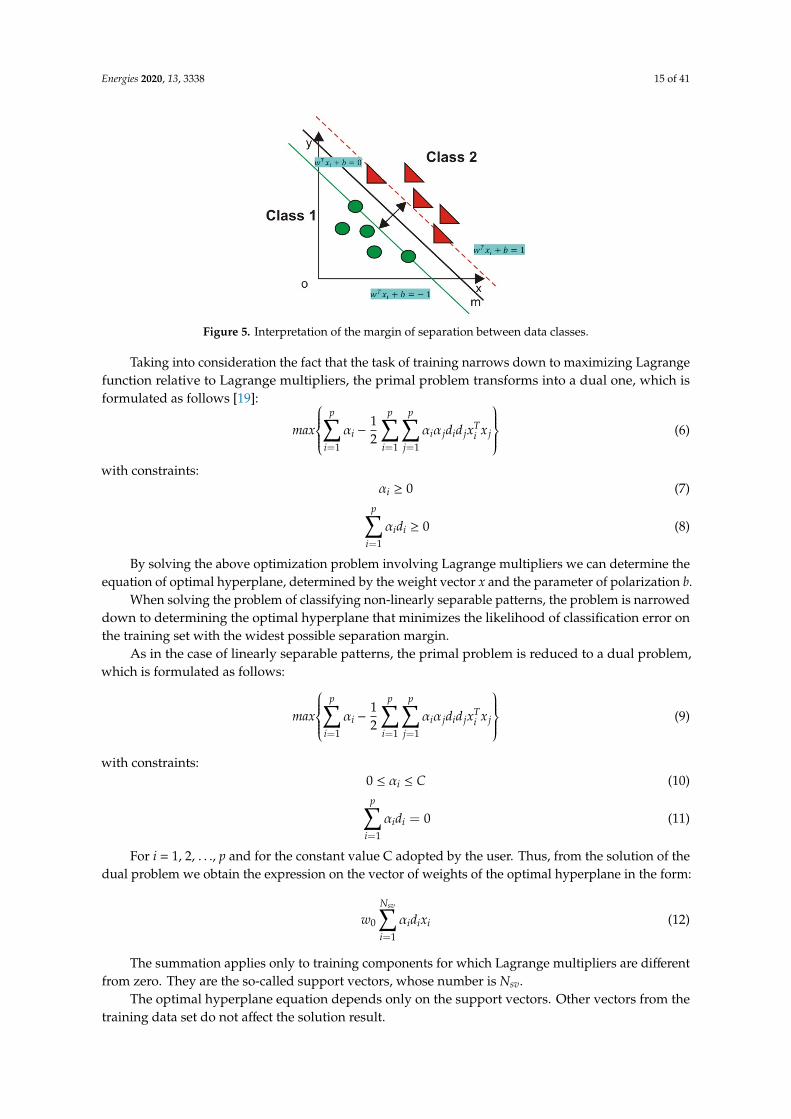
Figure 5. Interpretation of the margin of separation between data classes.
Taking into consideration the fact that the task of training narrows down to maximizing Lagrange function relative to Lagrange multipliers, the primal problem transforms into a dual one, which is formulated as follows [19]:
− 12 (6)
with constraints: ≥ 0 (7)
Figure 5. Interpretation of the margin of separation between data classes.
Taking into consideration the fact that the task of training narrows down to maximizing Lagrangefunction relative to Lagrange multipliers, the primal problem transforms into a dual one, which isformulated as follows [19]:
max
p∑
i=1
αi −12
p∑i=1
p∑j=1
αiα jdid jxTi x j
(6)
with constraints:αi ≥ 0 (7)
p∑i=1
αidi ≥ 0 (8)
By solving the above optimization problem involving Lagrange multipliers we can determine theequation of optimal hyperplane, determined by the weight vector x and the parameter of polarization b.
When solving the problem of classifying non-linearly separable patterns, the problem is narroweddown to determining the optimal hyperplane that minimizes the likelihood of classification error onthe training set with the widest possible separation margin.
As in the case of linearly separable patterns, the primal problem is reduced to a dual problem,which is formulated as follows:
max
p∑
i=1
αi −12
p∑i=1
p∑j=1
αiα jdid jxTi x j
(9)
with constraints:0 ≤ αi ≤ C (10)p∑
i=1
αidi = 0 (11)
For i = 1, 2, . . ., p and for the constant value C adopted by the user. Thus, from the solution of thedual problem we obtain the expression on the vector of weights of the optimal hyperplane in the form:
w0
Nsv∑i=1
αidixi (12)
The summation applies only to training components for which Lagrange multipliers are differentfrom zero. They are the so-called support vectors, whose number is Nsv.
The optimal hyperplane equation depends only on the support vectors. Other vectors from thetraining data set do not affect the solution result.
Energies 2020, 13, 3338 16 of 41
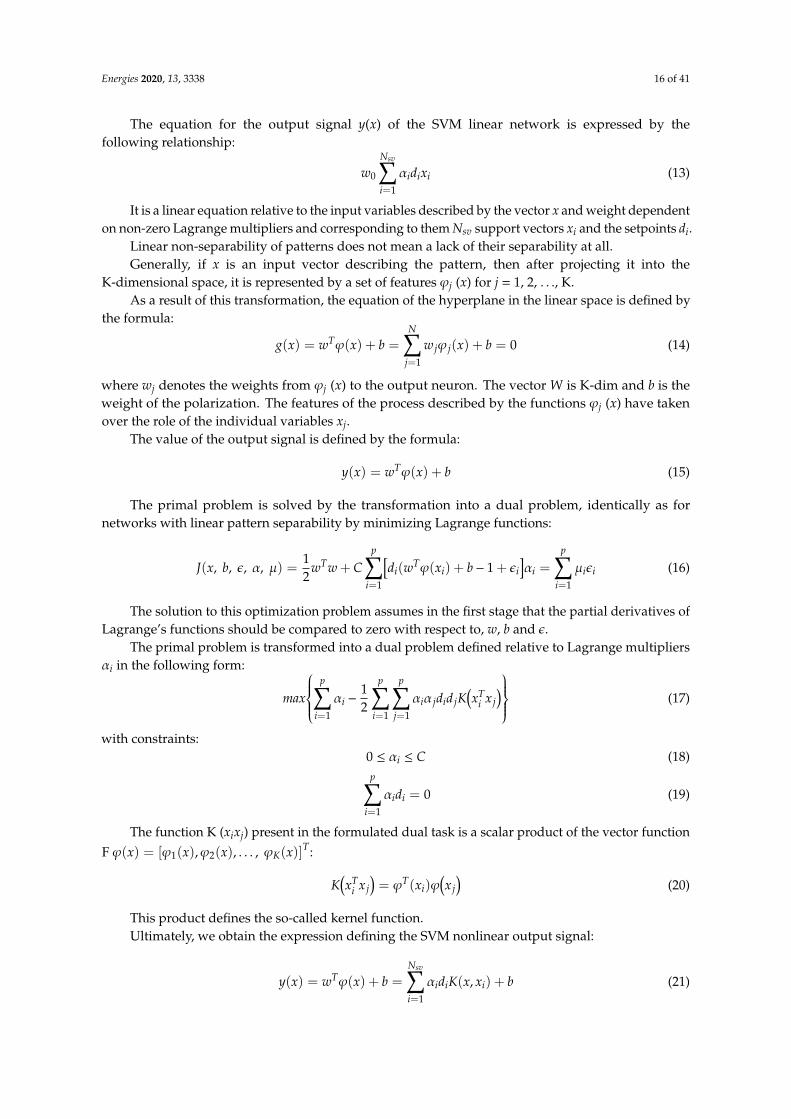
The equation for the output signal y(x) of the SVM linear network is expressed by thefollowing relationship:
w0
Nsv∑i=1
αidixi (13)
It is a linear equation relative to the input variables described by the vector x and weight dependenton non-zero Lagrange multipliers and corresponding to them Nsv support vectors xi and the setpoints di.
Linear non-separability of patterns does not mean a lack of their separability at all.Generally, if x is an input vector describing the pattern, then after projecting it into the
K-dimensional space, it is represented by a set of features ϕj (x) for j = 1, 2, . . ., K.As a result of this transformation, the equation of the hyperplane in the linear space is defined by
the formula:
g(x) = wTϕ(x) + b =N∑
j=1
w jϕ j(x) + b = 0 (14)
where wj denotes the weights from ϕj (x) to the output neuron. The vector W is K-dim and b is theweight of the polarization. The features of the process described by the functions ϕj (x) have takenover the role of the individual variables xj.
The value of the output signal is defined by the formula:
y(x) = wTϕ(x) + b (15)
The primal problem is solved by the transformation into a dual problem, identically as fornetworks with linear pattern separability by minimizing Lagrange functions:
J(x, b, ε, α, µ) =12
wTw + Cp∑
i=1
[di(wTϕ(xi) + b− 1 + εi
]αi =
p∑i=1
µiεi (16)
The solution to this optimization problem assumes in the first stage that the partial derivatives ofLagrange’s functions should be compared to zero with respect to, w, b and ε.
The primal problem is transformed into a dual problem defined relative to Lagrange multipliersαi in the following form:
max
p∑
i=1
αi −12
p∑i=1
p∑j=1
αiα jdid jK(xT
i x j) (17)
with constraints:0 ≤ αi ≤ C (18)p∑
i=1
αidi = 0 (19)
The function K (xixj) present in the formulated dual task is a scalar product of the vector functionF ϕ(x) = [ϕ1(x),ϕ2(x), . . . , ϕK(x)]
T:
K(xT
i x j)= ϕT(xi)ϕ
(x j
)(20)
This product defines the so-called kernel function.Ultimately, we obtain the expression defining the SVM nonlinear output signal:
y(x) = wTϕ(x) + b =
Nsv∑i=1
αidiK(x, xi) + b (21)
Energies 2020, 13, 3338 17 of 41
which depends on the kernel function K (x, xi) and not on the activation function ϕ (x).Due to the classification problem necessitating the split of data into a larger number of classes,
multiple classifications are required using the method “one against all” and “one against one”. In the“one against all” method with M classes, we define M SVM networks that recognize exactly one class.The method requires the training of M SVM networks, each of which is trained on a different data set.
After training all M networks, there is a reconstruction step in which the same vector x is fedto each SVM network, and the output signals (M decision functions) of all trained SVM networksare determined.
The SVM network was selected for the task of classifying patterns due to generalization capabilities.The SVM network is only slightly sensitive to the selected training hyperparameters determining thenumber of neurons in the hidden layer.
The algorithm for classifying waste fractions in the optical separator, based on the classic versionof SVM network, allows to separate fractions-components on the basis of the predefined class patternsdescribed by the vector of parameters characterizing spectral bands (spectroscopic spectra) of textures,structure, shape.
Due to the need to increase the quality indicator of the control of a technological process realizedin the optical separator, in terms of the acquisition of products with precisely defined physicochemical,combustion and emission properties, the SVM algorithm was modified by expanding the library ofbase class patterns (defined on the basis of spectroscopic spectra, textures and geometric features)with a library of predefined class patterns described by physicochemical and combustion properties(calorific value, humidity, volatile content).
The master algorithm, i.e., the greedy approximation algorithm that solves the problem of setcover, is responsible for generating class patterns corresponding to the optimized, disjoint subsets ofthe set, whose elements are the components of the waste fraction directed to the optical separator(s).
The class patterns are described by a set of features (texture, structure, spectroscopic spectrum),which allows the algorithm at the lower level of the control of the sorting process to carry out aclassification using the SVM network model (MC SVM) on the basis of the set of features assigned tothe predefined class patterns, represented by disjoint subsets of the cover generated by the masteralgorithm Greedy Set Cover.
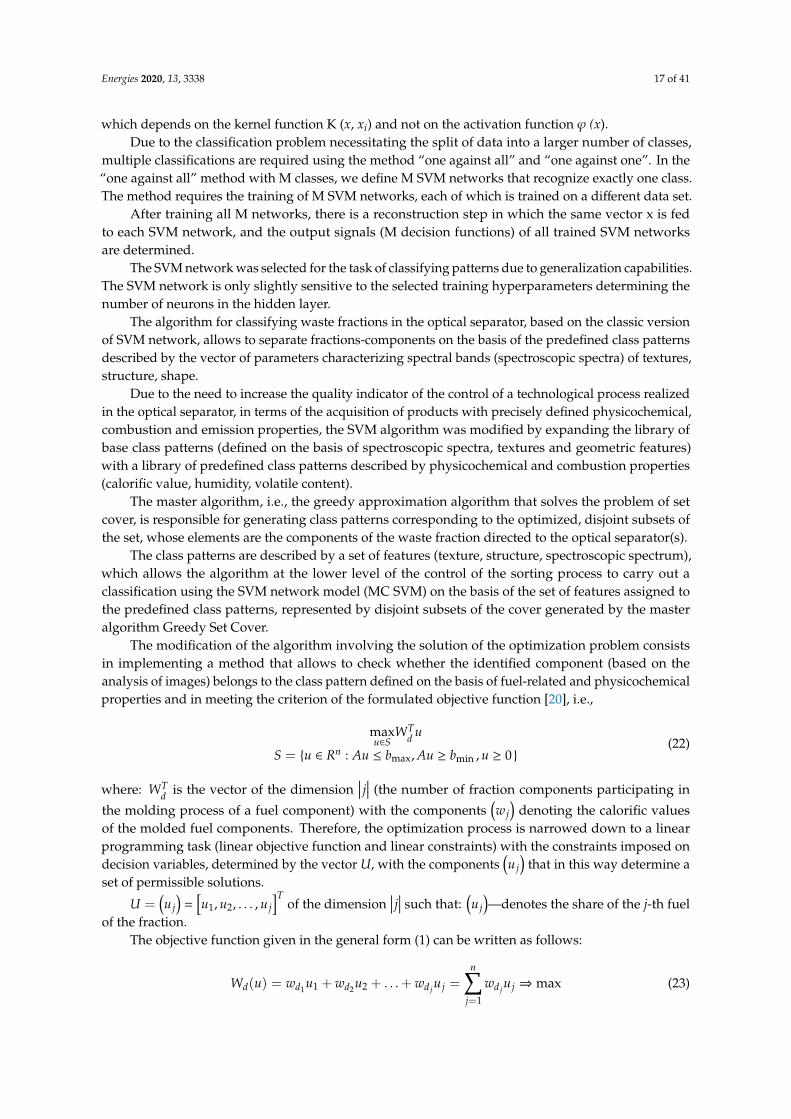
The modification of the algorithm involving the solution of the optimization problem consistsin implementing a method that allows to check whether the identified component (based on theanalysis of images) belongs to the class pattern defined on the basis of fuel-related and physicochemicalproperties and in meeting the criterion of the formulated objective function [20], i.e.,
maxu∈S
WTd u
S = {u ∈ Rn : Au ≤ bmax, Au ≥ bmin , u ≥ 0 }(22)
where: WTd is the vector of the dimension
∣∣∣ j∣∣∣ (the number of fraction components participating in
the molding process of a fuel component) with the components(w j
)denoting the calorific values
of the molded fuel components. Therefore, the optimization process is narrowed down to a linearprogramming task (linear objective function and linear constraints) with the constraints imposed ondecision variables, determined by the vector U, with the components
(u j
)that in this way determine a
set of permissible solutions.
U =(u j
)=
[u1, u2, . . . , u j
]Tof the dimension
∣∣∣ j∣∣∣ such that:(u j
)—denotes the share of the j-th fuel
of the fraction.The objective function given in the general form (1) can be written as follows:
Wd(u) = wd1u1 + wd2u2 + . . .+ wd ju j =n∑
j=1
wd ju j ⇒ max (23)
Energies 2020, 13, 3338 18 of 41
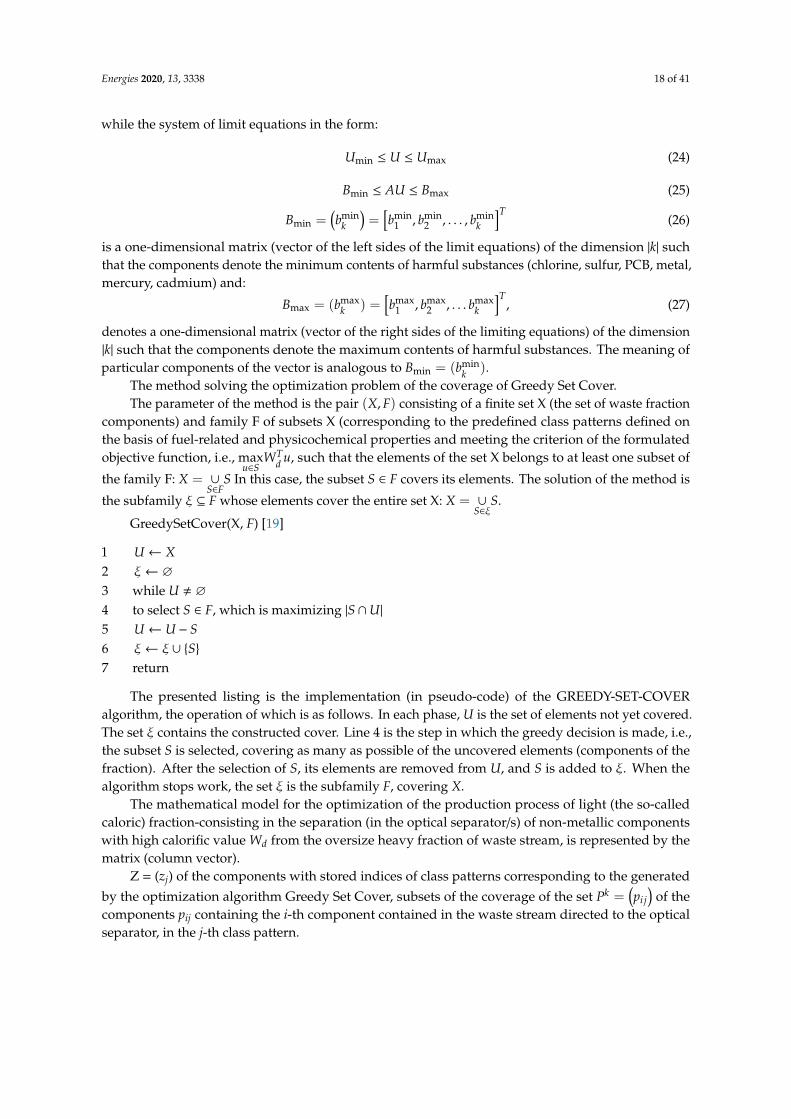
while the system of limit equations in the form:
Umin ≤ U ≤ Umax (24)
Bmin ≤ AU ≤ Bmax (25)
Bmin =(bmin
k
)=
[bmin
1 , bmin2 , . . . , bmin
k
]T(26)
is a one-dimensional matrix (vector of the left sides of the limit equations) of the dimension |k| suchthat the components denote the minimum contents of harmful substances (chlorine, sulfur, PCB, metal,mercury, cadmium) and:
Bmax = (bmaxk ) =
[bmax
1 , bmax2 , . . . bmax
k
]T, (27)
denotes a one-dimensional matrix (vector of the right sides of the limiting equations) of the dimension|k| such that the components denote the maximum contents of harmful substances. The meaning ofparticular components of the vector is analogous to Bmin = (bmin
k ).The method solving the optimization problem of the coverage of Greedy Set Cover.The parameter of the method is the pair (X, F) consisting of a finite set X (the set of waste fraction
components) and family F of subsets X (corresponding to the predefined class patterns defined onthe basis of fuel-related and physicochemical properties and meeting the criterion of the formulatedobjective function, i.e., max
u∈SWT
d u, such that the elements of the set X belongs to at least one subset of
the family F: X = ∪S∈F
S In this case, the subset S ∈ F covers its elements. The solution of the method is
the subfamily ξ ⊆ F whose elements cover the entire set X: X = ∪S∈ξ
S.
GreedySetCover(X, F) [19]
1 U← X2 ξ← ∅3 while U , ∅4 to select S ∈ F, which is maximizing |S∩U|5 U← U − S6 ξ← ξ∪ {S}7 return
The presented listing is the implementation (in pseudo-code) of the GREEDY-SET-COVERalgorithm, the operation of which is as follows. In each phase, U is the set of elements not yet covered.The set ξ contains the constructed cover. Line 4 is the step in which the greedy decision is made, i.e.,the subset S is selected, covering as many as possible of the uncovered elements (components of thefraction). After the selection of S, its elements are removed from U, and S is added to ξ. When thealgorithm stops work, the set ξ is the subfamily F, covering X.
The mathematical model for the optimization of the production process of light (the so-calledcaloric) fraction-consisting in the separation (in the optical separator/s) of non-metallic componentswith high calorific value Wd from the oversize heavy fraction of waste stream, is represented by thematrix (column vector).
Z = (zj) of the components with stored indices of class patterns corresponding to the generated
by the optimization algorithm Greedy Set Cover, subsets of the coverage of the set Pk =(pi j
)of the
components pij containing the i-th component contained in the waste stream directed to the opticalseparator, in the j-th class pattern.
Energies 2020, 13, 3338 19 of 41
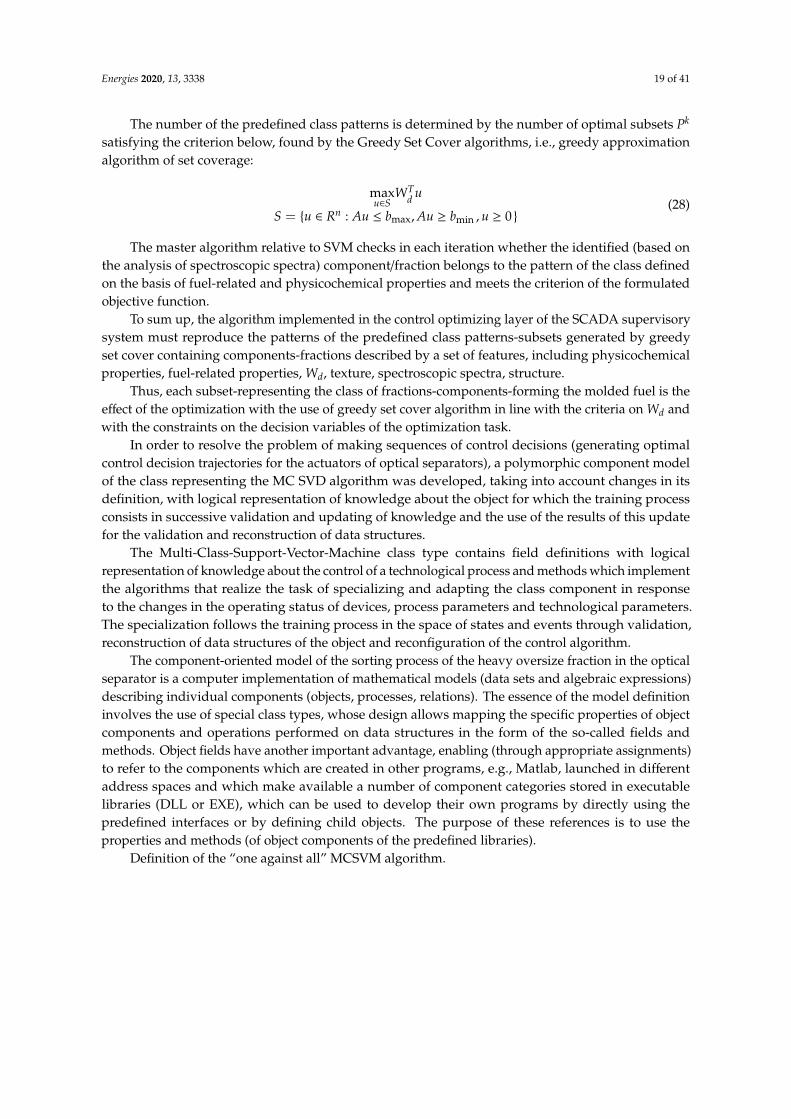
The number of the predefined class patterns is determined by the number of optimal subsets Pk
satisfying the criterion below, found by the Greedy Set Cover algorithms, i.e., greedy approximationalgorithm of set coverage:
maxu∈S
WTd u
S = {u ∈ Rn : Au ≤ bmax, Au ≥ bmin , u ≥ 0 }(28)
The master algorithm relative to SVM checks in each iteration whether the identified (based onthe analysis of spectroscopic spectra) component/fraction belongs to the pattern of the class definedon the basis of fuel-related and physicochemical properties and meets the criterion of the formulatedobjective function.
To sum up, the algorithm implemented in the control optimizing layer of the SCADA supervisorysystem must reproduce the patterns of the predefined class patterns-subsets generated by greedyset cover containing components-fractions described by a set of features, including physicochemicalproperties, fuel-related properties, Wd, texture, spectroscopic spectra, structure.
Thus, each subset-representing the class of fractions-components-forming the molded fuel is theeffect of the optimization with the use of greedy set cover algorithm in line with the criteria on Wd andwith the constraints on the decision variables of the optimization task.
In order to resolve the problem of making sequences of control decisions (generating optimalcontrol decision trajectories for the actuators of optical separators), a polymorphic component modelof the class representing the MC SVD algorithm was developed, taking into account changes in itsdefinition, with logical representation of knowledge about the object for which the training processconsists in successive validation and updating of knowledge and the use of the results of this updatefor the validation and reconstruction of data structures.
The Multi-Class-Support-Vector-Machine class type contains field definitions with logicalrepresentation of knowledge about the control of a technological process and methods which implementthe algorithms that realize the task of specializing and adapting the class component in responseto the changes in the operating status of devices, process parameters and technological parameters.The specialization follows the training process in the space of states and events through validation,reconstruction of data structures of the object and reconfiguration of the control algorithm.
The component-oriented model of the sorting process of the heavy oversize fraction in the opticalseparator is a computer implementation of mathematical models (data sets and algebraic expressions)describing individual components (objects, processes, relations). The essence of the model definitioninvolves the use of special class types, whose design allows mapping the specific properties of objectcomponents and operations performed on data structures in the form of the so-called fields andmethods. Object fields have another important advantage, enabling (through appropriate assignments)to refer to the components which are created in other programs, e.g., Matlab, launched in differentaddress spaces and which make available a number of component categories stored in executablelibraries (DLL or EXE), which can be used to develop their own programs by directly using thepredefined interfaces or by defining child objects. The purpose of these references is to use theproperties and methods (of object components of the predefined libraries).
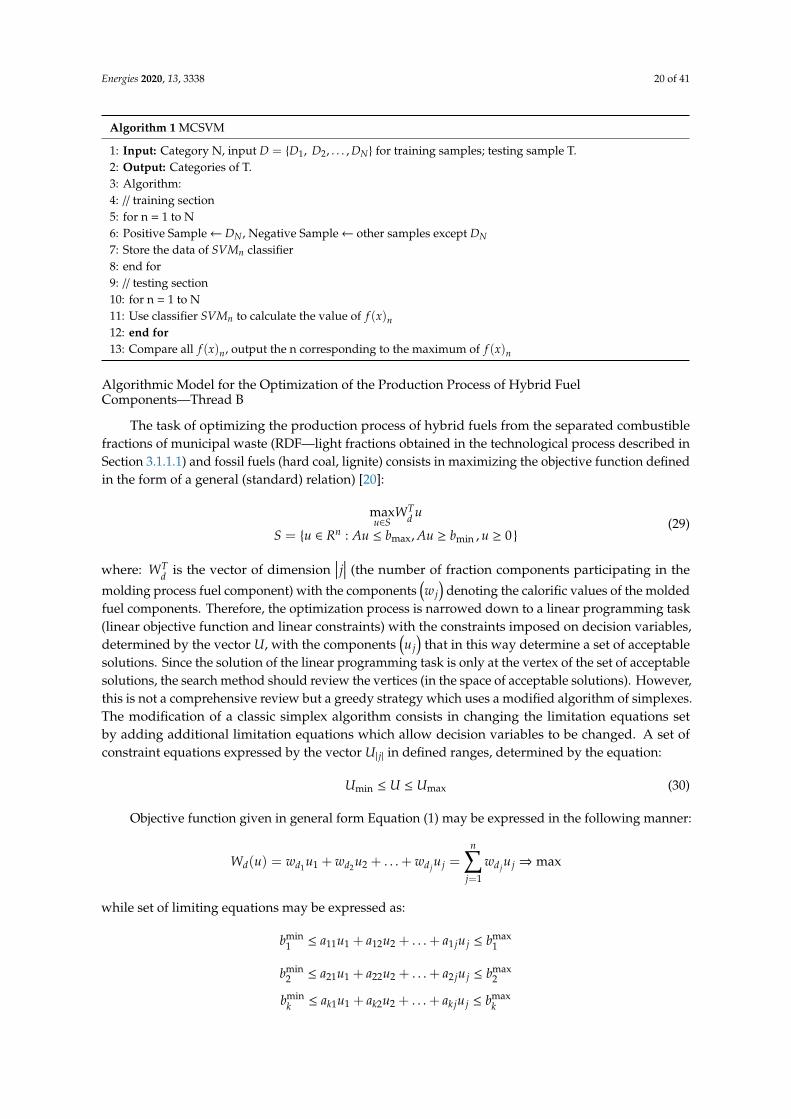
Definition of the “one against all” MCSVM algorithm.
Energies 2020, 13, 3338 20 of 41
Algorithm 1 MCSVM
1: Input: Category N, input D = {D1, D2, . . . , DN} for training samples; testing sample T.2: Output: Categories of T.3: Algorithm:4: // training section5: for n = 1 to N6: Positive Sample← DN , Negative Sample← other samples except DN7: Store the data of SVMn classifier8: end for9: // testing section10: for n = 1 to N11: Use classifier SVMn to calculate the value of f (x)n12: end for13: Compare all f (x)n, output the n corresponding to the maximum of f (x)n
Algorithmic Model for the Optimization of the Production Process of Hybrid FuelComponents—Thread B
The task of optimizing the production process of hybrid fuels from the separated combustiblefractions of municipal waste (RDF—light fractions obtained in the technological process described inSection 3.1.1.1) and fossil fuels (hard coal, lignite) consists in maximizing the objective function definedin the form of a general (standard) relation) [20]:
maxu∈S
WTd u
S = {u ∈ Rn : Au ≤ bmax, Au ≥ bmin , u ≥ 0 }(29)
where: WTd is the vector of dimension
∣∣∣ j∣∣∣ (the number of fraction components participating in the
molding process fuel component) with the components(w j
)denoting the calorific values of the molded
fuel components. Therefore, the optimization process is narrowed down to a linear programming task(linear objective function and linear constraints) with the constraints imposed on decision variables,determined by the vector U, with the components
(u j
)that in this way determine a set of acceptable
solutions. Since the solution of the linear programming task is only at the vertex of the set of acceptablesolutions, the search method should review the vertices (in the space of acceptable solutions). However,this is not a comprehensive review but a greedy strategy which uses a modified algorithm of simplexes.The modification of a classic simplex algorithm consists in changing the limitation equations setby adding additional limitation equations which allow decision variables to be changed. A set ofconstraint equations expressed by the vector U| j| in defined ranges, determined by the equation:
Umin ≤ U ≤ Umax (30)
Objective function given in general form Equation (1) may be expressed in the following manner:
Wd(u) = wd1u1 + wd2u2 + . . .+ wd ju j =n∑
j=1
wd ju j ⇒ max
while set of limiting equations may be expressed as:
bmin1 ≤ a11u1 + a12u2 + . . .+ a1 ju j ≤ bmax
1
bmin2 ≤ a21u1 + a22u2 + . . .+ a2 ju j ≤ bmax
2
bmink ≤ ak1u1 + ak2u2 + . . .+ akju j ≤ bmax
k
Energies 2020, 13, 3338 21 of 41
or in matrix notation:Bmin ≤ AU ≤ Bmax (31)
Bmin =(bmin
k
)=
[bmin
1 , bmin2 , . . . , bmin
k
]T(32)
denotes a one-dimensional matrix (the vector of the left sides of the constraint equations) of thedimension |k| such that the components denote minimum contents of harmful substances (chlorine,sulfur, PCB, metal, mercury, cadmium) and:
Bmax = (bmaxk ) =
[bmax
1 , bmax2 , . . . bmax
k
]T, (33)
denotes a one-dimensional matrix (vector of the right sides of the limiting equations) of the dimension|k| such that the components denote the maximum contents of harmful substances. The meaning ofparticular components of the vector is analogous to Bmin = (bmin
k ).The revised simplex algorithm finds the optimal solution by examining a sequence of points in the
permissible area—in the area of n-dimensional space whose points satisfy the systems of inequalitiesAU ≤ Bmax and AU ≥ Bmin.
Substitution of auxiliary variables εmin and εmax gives:
bmaxk − akju j = εmax and akju j − bmin
k = εmin
In general, the solution of the algorithm is based on the observation that the solution thatmaximizes the objective function Wd(u) is located at a certain extreme point or at the vertex of thepermissible area. In the algorithm there is a sequential review of the vertices delimiting the permissiblearea until further correction of the value of objective function is no longer possible.
The solution of the linear programming problem involves the following options:
1. There is one constrained solution (the objective function takes the smallest value at one vertex ofthe set of permissible solutions).
2. There is an unrestricted solution (when the objective function can adopt any small value whilenot violating the constraints).
3. There are infinitely many solutions (there are at least two vertices of the set of permissiblesolutions at which the function assumes the same minimum value).
4. There is no solution, i.e., the set of permissible solutions is an empty set.
This problem can be resolved in polynomial or exponential time.Optionally, additional constraints can be introduced (extending the basic model), which result
from the permissible concentration values of the emitted substances in the combustion process of theobtained fuel components, which determine the process of their formation:
C f =(c f
i
)< Cdop (34)
where C f denotes the matrix of process gas parameters (products of combustion process), of thedimension |i| such that:(
c fi
)—denotes the i-th parameter-molar share of the component i in the fumes (CO2, O2, SO2, HCl,
N2, H2O).Cdop =
(cdop
i
)—denotes as above, but for permissible values specified in standards.
Molar shares of process gas components are determined from the set of stoichiometric equationsof the combustion process of fuels.
The scalability of the model allows to formulate further equations and inequalities limiting thescope of changes of decision variables of the optimization task taking into account the geometry ofcombustion chamber, type of grate, etc.
Energies 2020, 13, 3338 22 of 41
3.2. SMART Wastewater Treatment Plant Computational Solution
In this section was presented the algorithmic model for the optimization of the biological processof wastewater treatment using adaptive hierarchical control. The objective of the biological wastewatertreatment process is to provide the bioreactor with the required amount of air (oxygen) determiningthe optimal development of bacteria that break down organic substances contained in the wastewater.In the solution of the aeration control system used so far, the concentration of dissolved oxygen wasadopted as the reference value. In the proposed solution of the control system, we take into accountthe strongly non-linear characteristics of the bioreactor’s operation as a control object. The non-linearcharacter of the object, variable operating conditions of the sewage treatment plant, the impact ofdisturbance, e.g., irregular supply of sewage to the bioreactor, the change of pollution load, temperatureand content of mineral substances enforce the change of reference concentration of oxygen over time.The reference value of oxygen is determined by the master control. The reference value of oxygenconcentration depends on the content of ammonium nitrogen and nitrate nitrogen. The dependenceof the reference value on the content of ammonium nitrogen leads to the increased efficiency ofwastewater treatment. In the presented approach, the control trajectory of oxygen concentration istending to obtain the reference value. The use of advanced event prediction tools, detection systems ofoccurring damages in the measuring paths, paths of control and process visualization are aimed at thepoly optimization of electricity consumption and the control of the biological process of municipalwastewater treatment [21–23]. In the work we used the non-linear activated sludge model ASM2d,taking into account 21 biochemical processes, calibrated based on the measurement results of processparameters and laboratory tests.
It was a scientific and technological challenge to be able to develop algorithms that control theoperation of the bioreactor, allowing for the following in particular:
1. Automatic control of the nitrification and denitrification process, with simultaneous control oftotal nitrogen in the treated wastewater.
2. Elimination of situations related to the overload of activated sludge chambers at the time when theinflow of the load of ammonium nitrogen in raw sewage was lower, and related to it disturbanceof the denitrification process.
3. Optimization of the internal and external recirculation processes of the bioreactor.4. Reduction of electricity consumption in the aeration and recirculation processes.
3.2.1. Multi-Threaded Optimization of Electricity Consumption in the Biological WastewaterTreatment Process
The multi-threaded control system comprises quality control of wastewater, i.e., ammonia (NH4)and nitrate (NO3) concentrations, whose permissible values are limited by legal regulations specifyingthe permissible parameters of nitrogen compounds in treated wastewater released into public waters.
The concentration of ammonia (NH4) and nitrates (NO3) in the oxygen chamber is regulated by amultidimensional regulator. Oxygen concentration and the stream of recirculated wastewater are usedas manipulated variables. Manipulated variables are used as external setpoints for lower level PIDcontrollers. The biological reactor is divided into the anoxic part in which the denitrification process iscarried out and the oxygen part in which the nitrification process is carried out.
The concentration of oxygen (controlled variable) is regulated by the PID controller by changingthe rotation speed of the induction motor (through the inverter) driving the blowers (manipulatedvariable), which supplies air to the oxygen chamber of the biological reactor. The PID controllerreceives a signal corresponding to the setpoint from the MPC controller [24,25].
The multifunction meter measures the concentration of ammonia (NH4) and the concentration ofnitrates (NO3), and controls them through the concentration of oxygen and through the flow of therecirculating wastewater stream, by changing the pump efficiency effected by changing the rotationspeed of the induction motor. The slave controller receives a signal from the MPC controller. The slave
Energies 2020, 13, 3338 23 of 41
controller sends a signal requesting a change in the airflow, depending on the preset value of oxygenconcentration (via the MPC controller). For this purpose, the subordinate controller determines therotational speed of the blower motor.
Model of the Subsystem for Oxygen Concentration Control—Thread A
The purpose of the control is to minimize the electricity consumption of the blower assembly,while meeting the process and technological constraints.
The objective function is described by the expression [26]:
J =∑
j∈{1,2}
Hp∑i=l
(So, j(k + i|k ) − Sre f
o, j (k + i|k )
+
Hp∑i=l
γ(Qair, j(k + i|k )) −Qair, j(k + i− l|k )
)2
+ µ(Qair, j(k− l|k− l )) −Qair, j(k|k )
)2+
Hp∑i=l
ϑ(Qair, j(k + i− l|k )
)2
(35)
The coefficients γ, µ and υ were determined experimentally based on the simulation results. Thefirst expression in dependence 29 represents the follow up error after the preset trajectory of oxygen.The second and third components correspond to the technological constraint, i.e., (duty cycle) theswitch-over frequency of the blowers. The fourth element is connected with the energy used by airpumping to the nitrification chamber. The multidimensional nonlinear predictive controller generates,at the moment k on the horizon Hp, controls:{
Qair, j(k), . . . , Qair, j(k + Hp − l
)}2
j=l(36)
Based on the discretized non-linear model of oxygen concentration So, with the prediction ofrespiration value:
ˆRr, j(k) f or k ∈[k, k + Hp − l
](37)
defined by the controls (30), minimizing the objective function (35), while meeting the constraints (37–43).For the j-th oxygen chamber (j = {1, 2}) the discretized model of oxygen concentration in the j-th
oxygen chamber is described by the dependences:
So, j(k + i) − So, j(k + i− l)
T= kLa
(Qair, j(k + i− l)
)(So,sat − So, j(k + i− l))
−So, j(k + i− l) − So, j(k + i− l)
Ko + So, j(k + i− l)Rr, j(k + i− l)
(38)
where: So—oxygen concentration; kLa—oxygen transfer function; Qair—inflow intensity of air to theoxygen chamber; S(o, sat) = 8.64 [g O2/m3]-oxygen saturation coefficient; Ko = 0.2 [g/m3]—Monodconstant for dissolved oxygen and Rr—respiration.
The oxygen transfer function kLa was made dependent on the air supply rate Qair and it wasadopted as the function:
kLa(k) = 0, 208·Qair, j(k) (39)
Energies 2020, 13, 3338 24 of 41
The variable Rr, j is treated as an external disturbance. This value is estimated (no measurement)assuming that the dynamics of oxygen concentration is faster than that of respiration. The respirationestimates at the momentk-1 is described by the relationship:
Rr, j(k− l) = −Ko + Sp
o, j(k− l)
Spo, j(k− l)
(Spo, j(k) − Sp
o, j(k− l)
T− kLa
(Qair, j(k− l)
)·(Sp
o, j(k) − Spo, j(k− l))
)(40)
Due to slow variability of respiration in relation to the rate of change of oxygen concentration in thereactor, this value is also adopted as an estimate of respiration at the moment k. Since in the dependence(34), we use direct readings from on-line measurements, when determining the respiration estimateswe are witnessing a kind of “differentiation” of measurement noise occurring in the measurement ofoxygen concentration.
The control variables the airflow Qair, j and the controlled variables the concentration of oxygen inthe nitrification chamber Sp
o, j. In addition, the object is subject to the following disturbances: sewageinflow intensity, chemical demand for oxygen, total nitrogen and total phosphorus [26–29]:
Qminair, j ≤
∑j∈{1,2}
Qair, j((k + i− l|k )) ≤ Qmaxair, j, i = l, . . .Hp (41)
where: Qminair, j—minimal stream of air inflow to the oxygen chamber, Qmax
air, j—maximumstream of air
inflow. Qminair, j with constraints imposed on the minimum and maximum control value in a single
prediction step, i.e., where: Qminair, j = 0; Qmax
air, j = 5700 [m3/h].The constraint on the maximum change in control rate in a single prediction step was expressed
by the system of inequalities:∣∣∣Qair, j (k + i|k )) −Qair, j(k + i− l|k )∣∣∣∣≤ ∆Qmax
air, j; j ∈ {1, 2}; i = l, . . .Hp (42)
∣∣∣Qair, j (k− l|k− l )) −Qair, j(k|k )∣∣∣∣≤ ∆Qmax
air, j; j ∈ {1, 2}; i = l, . . .Hp (43)
where: ∆Qmaxair, j = 5700 [m3/h].
Model of the Subsystem for Internal Recirculation Control—Thread B
Parallel to the external recirculation process, internal recirculation is carried out from the end of thenitrification chamber to the denitrification chamber, where nitrates are reduced to gas nitrogen. Internalrecirculation can be directed to anoxic chambers, and the wastewater stream can be separated in anyproportions. The recycled sludge is directed from the bottom of the secondary settler to the anaerobicchamber. The manipulating variables are flow rates (internal, external recirculation, recirculation ofair to oxygen chambers, and excess sludge removal, dosing of reagents), (Figure 6). The degree ofthe removal of nitrogen compounds is determined by the ratio of wastewater recirculation from theoxygen chamber to the anoxic one, i.e., the rise of the degree of recirculation results in the rise ofremoval efficiency of nitrogen compounds [30,31]. The control of the recirculated wastewater andsludge streams depends on the volume of raw sewage stream at the inlet and on the pollution load.
The system of balance equations for the determination of changes in the concentration of organiccompounds by gradual wastewater treatment in anaerobic and aerobic bioreactors with internalrecirculation of the sludge mixture [32,33], taking into account the recirculation of activated sludgefrom the secondary settler, can be presented as follows:
nN = Qp/Qin; nN = Qp/Qin; Cmix =Cin + Cex·R
1 + R;; R =
ai1000
Ji− ai
(44)
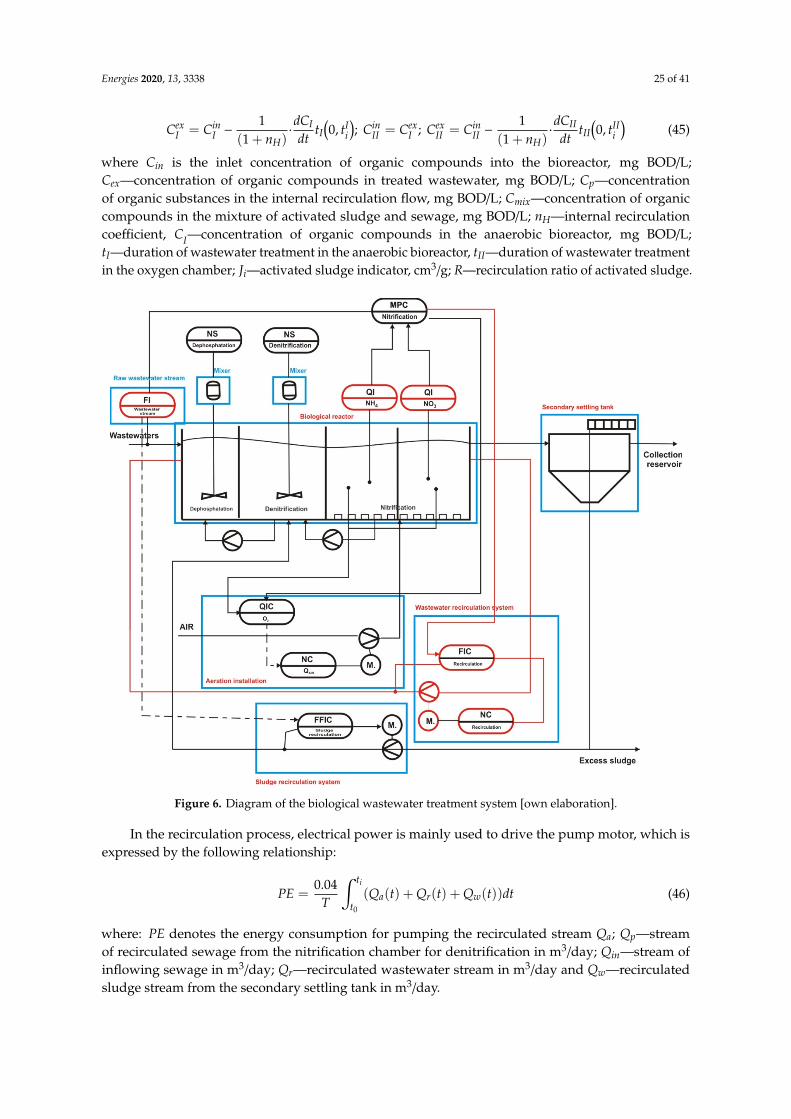
Energies 2020, 13, 3338 25 of 41
CexI = Cin
I −1
(1 + nH)·dCI
dttI(0, tI
i
); Cin
II = CexI ; Cex
II = CinII −
1(1 + nH)
·dCII
dttII
(0, tII
i
)(45)
where Cin is the inlet concentration of organic compounds into the bioreactor, mg BOD/L;Cex—concentration of organic compounds in treated wastewater, mg BOD/L; Cp—concentrationof organic substances in the internal recirculation flow, mg BOD/L; Cmix—concentration of organiccompounds in the mixture of activated sludge and sewage, mg BOD/L; nH—internal recirculationcoefficient, CI—concentration of organic compounds in the anaerobic bioreactor, mg BOD/L;tI—duration of wastewater treatment in the anaerobic bioreactor, tII—duration of wastewater treatmentin the oxygen chamber; Ji—activated sludge indicator, cm3/g; R—recirculation ratio of activated sludge.Energies 2020, 13, x FOR PEER REVIEW 25 of 41
Figure 6. Diagram of the biological wastewater treatment system [own elaboration].
In the recirculation process, electrical power is mainly used to drive the pump motor, which is expressed by the following relationship: = 0,04 ( ) + ( ) + ( ) (46)
where: denotes the energy consumption for pumping the recirculated stream ; - stream of recirculated sewage from the nitrification chamber for denitrification in m3/day; -stream of inflowing sewage in m3/day; – recirculated wastewater stream in m3/day and - recirculated sludge stream from the secondary settling tank in m3/day.
The unit pumping energy consumption depends on pump head and on the efficiency of pump unit γz, which is the product of the pump efficiency γ, induction motor γs and frequency converter (inverter) : = ∙ ∙ (47)
3.2.2. Simulation of the Operation of Biological Reactor - Classic Closed-Loop Control Versus MPC
In order to analyze energy efficiency of the biological reactor, a simulation was carried out, taking into account the changes in the raw sewage stream flowing into the bioreactor. Two cases were analyzed, i.e., the classic closed-loop control and MPC controller [25,33,34], taking into account the concentration parameters of ammonia (NH4), nitrate (NO3), dissolved oxygen in nitrification chambers (O2) and rotational speed of blowers (n).
Figure 6. Diagram of the biological wastewater treatment system [own elaboration].
In the recirculation process, electrical power is mainly used to drive the pump motor, which isexpressed by the following relationship:
PE =0.04
T
∫ ti
t0
(Qa(t) + Qr(t) + Qw(t))dt (46)
where: PE denotes the energy consumption for pumping the recirculated stream Qa; Qp—streamof recirculated sewage from the nitrification chamber for denitrification in m3/day; Qin—stream ofinflowing sewage in m3/day; Qr—recirculated wastewater stream in m3/day and Qw—recirculatedsludge stream from the secondary settling tank in m3/day.
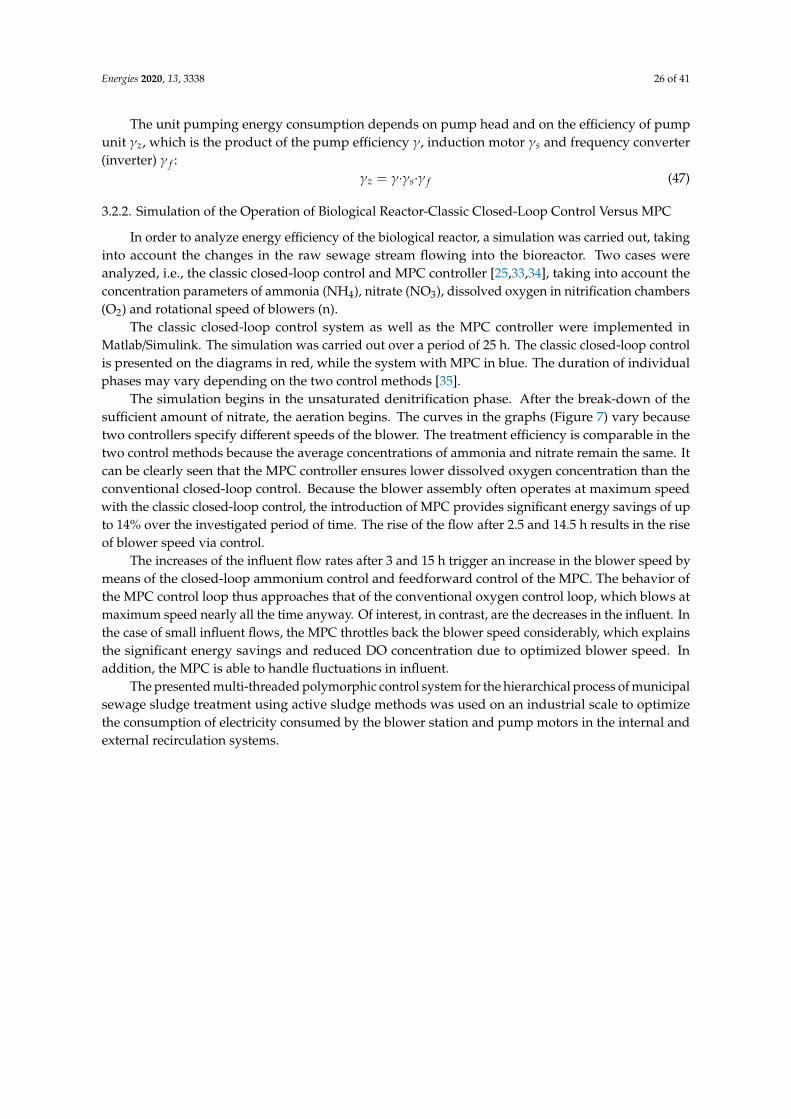
Energies 2020, 13, 3338 26 of 41
The unit pumping energy consumption depends on pump head and on the efficiency of pumpunit γz, which is the product of the pump efficiency γ, induction motor γs and frequency converter(inverter) γ f :
γz = γ·γs·γ f (47)
3.2.2. Simulation of the Operation of Biological Reactor-Classic Closed-Loop Control Versus MPC
In order to analyze energy efficiency of the biological reactor, a simulation was carried out, takinginto account the changes in the raw sewage stream flowing into the bioreactor. Two cases wereanalyzed, i.e., the classic closed-loop control and MPC controller [25,33,34], taking into account theconcentration parameters of ammonia (NH4), nitrate (NO3), dissolved oxygen in nitrification chambers(O2) and rotational speed of blowers (n).
The classic closed-loop control system as well as the MPC controller were implemented inMatlab/Simulink. The simulation was carried out over a period of 25 h. The classic closed-loop controlis presented on the diagrams in red, while the system with MPC in blue. The duration of individualphases may vary depending on the two control methods [35].
The simulation begins in the unsaturated denitrification phase. After the break-down of thesufficient amount of nitrate, the aeration begins. The curves in the graphs (Figure 7) vary becausetwo controllers specify different speeds of the blower. The treatment efficiency is comparable in thetwo control methods because the average concentrations of ammonia and nitrate remain the same. Itcan be clearly seen that the MPC controller ensures lower dissolved oxygen concentration than theconventional closed-loop control. Because the blower assembly often operates at maximum speedwith the classic closed-loop control, the introduction of MPC provides significant energy savings of upto 14% over the investigated period of time. The rise of the flow after 2.5 and 14.5 h results in the riseof blower speed via control.
The increases of the influent flow rates after 3 and 15 h trigger an increase in the blower speed bymeans of the closed-loop ammonium control and feedforward control of the MPC. The behavior ofthe MPC control loop thus approaches that of the conventional oxygen control loop, which blows atmaximum speed nearly all the time anyway. Of interest, in contrast, are the decreases in the influent. Inthe case of small influent flows, the MPC throttles back the blower speed considerably, which explainsthe significant energy savings and reduced DO concentration due to optimized blower speed. Inaddition, the MPC is able to handle fluctuations in influent.
The presented multi-threaded polymorphic control system for the hierarchical process of municipalsewage sludge treatment using active sludge methods was used on an industrial scale to optimizethe consumption of electricity consumed by the blower station and pump motors in the internal andexternal recirculation systems.
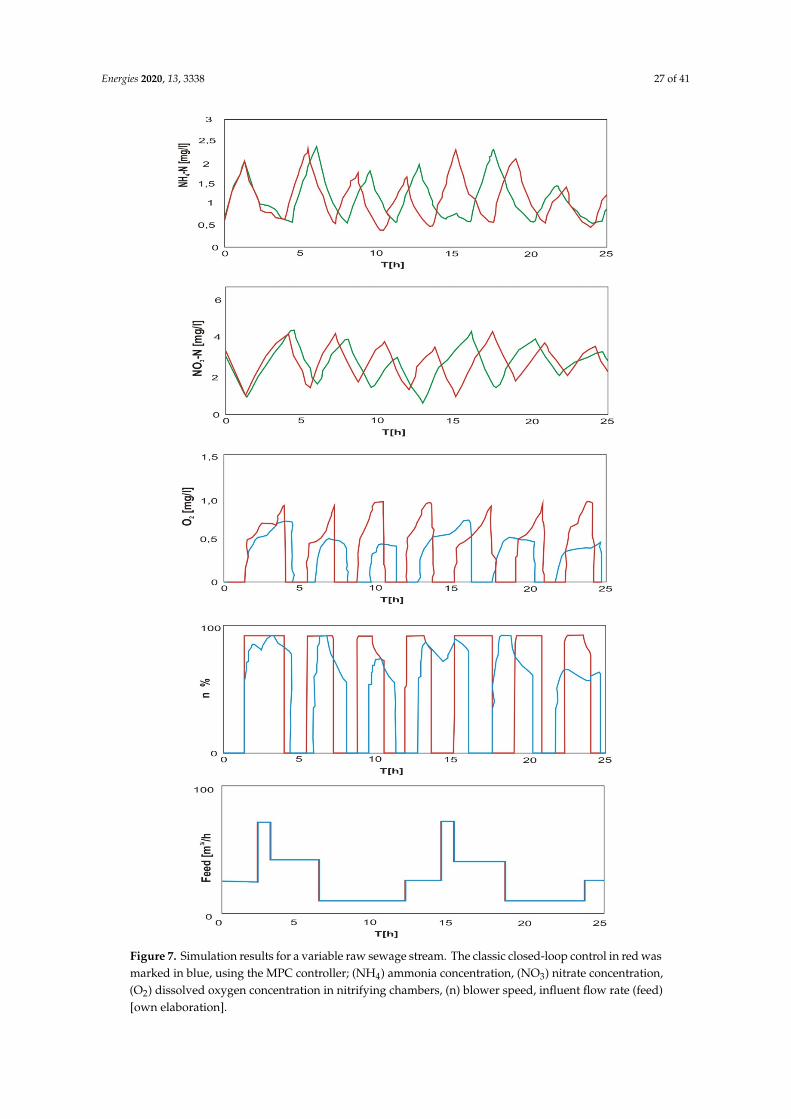
Energies 2020, 13, 3338 27 of 41Energies 2020, 13, x FOR PEER REVIEW 27 of 41
Figure 7. Simulation results for a variable raw sewage stream. The classic closed-loop control in red was marked in blue, using the MPC controller; (NH4) ammonia concentration, (NO3) nitrate concentration, (O2) dissolved oxygen concentration in nitrifying chambers, (n) blower speed, influent flow rate (feed) [own elaboration].
Figure 7. Simulation results for a variable raw sewage stream. The classic closed-loop control in red wasmarked in blue, using the MPC controller; (NH4) ammonia concentration, (NO3) nitrate concentration,(O2) dissolved oxygen concentration in nitrifying chambers, (n) blower speed, influent flow rate (feed)[own elaboration].
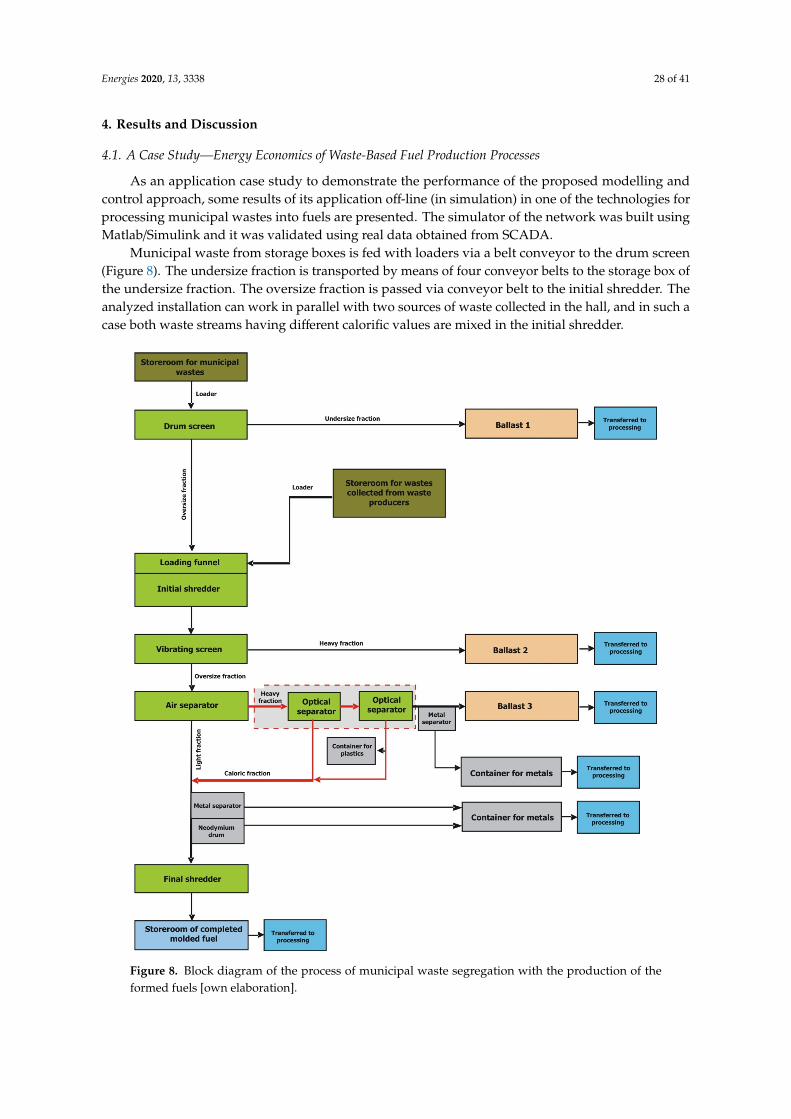
Energies 2020, 13, 3338 28 of 41
4. Results and Discussion
4.1. A Case Study—Energy Economics of Waste-Based Fuel Production Processes
As an application case study to demonstrate the performance of the proposed modelling andcontrol approach, some results of its application off-line (in simulation) in one of the technologies forprocessing municipal wastes into fuels are presented. The simulator of the network was built usingMatlab/Simulink and it was validated using real data obtained from SCADA.
Municipal waste from storage boxes is fed with loaders via a belt conveyor to the drum screen(Figure 8). The undersize fraction is transported by means of four conveyor belts to the storage box ofthe undersize fraction. The oversize fraction is passed via conveyor belt to the initial shredder. Theanalyzed installation can work in parallel with two sources of waste collected in the hall, and in such acase both waste streams having different calorific values are mixed in the initial shredder.Energies 2020, 13, x FOR PEER REVIEW 29 of 41
Figure 8. Block diagram of the process of municipal waste segregation with the production of the formed fuels [own elaboration].
Fuels made from wastes, produced by production plants of (alternative) molded fuels have the following composition and physicochemical properties summarized in Tables 1 and 2.
Table 1. properties of molded fuel - values required by cement plants.
Item Parameter Required Value 1. Calorific value ≥15 000 kJ/kg 2. Ash content ≤20.0 % 3. Total sulfur content ≤2.0 % 4. Chlorine content ≤1.0 % 5. Granulation ≤40 mm 6. Moisture content ≤30% 7. Average bulk density 0.2 Mg/m3 – 0.6 Mg/m3 8. Scrap content ≤0.5%
Table 2. Permissible values of the share of heavy metals in the molded fuel.
Parameter Permissible Value [ppm]
Figure 8. Block diagram of the process of municipal waste segregation with the production of theformed fuels [own elaboration].
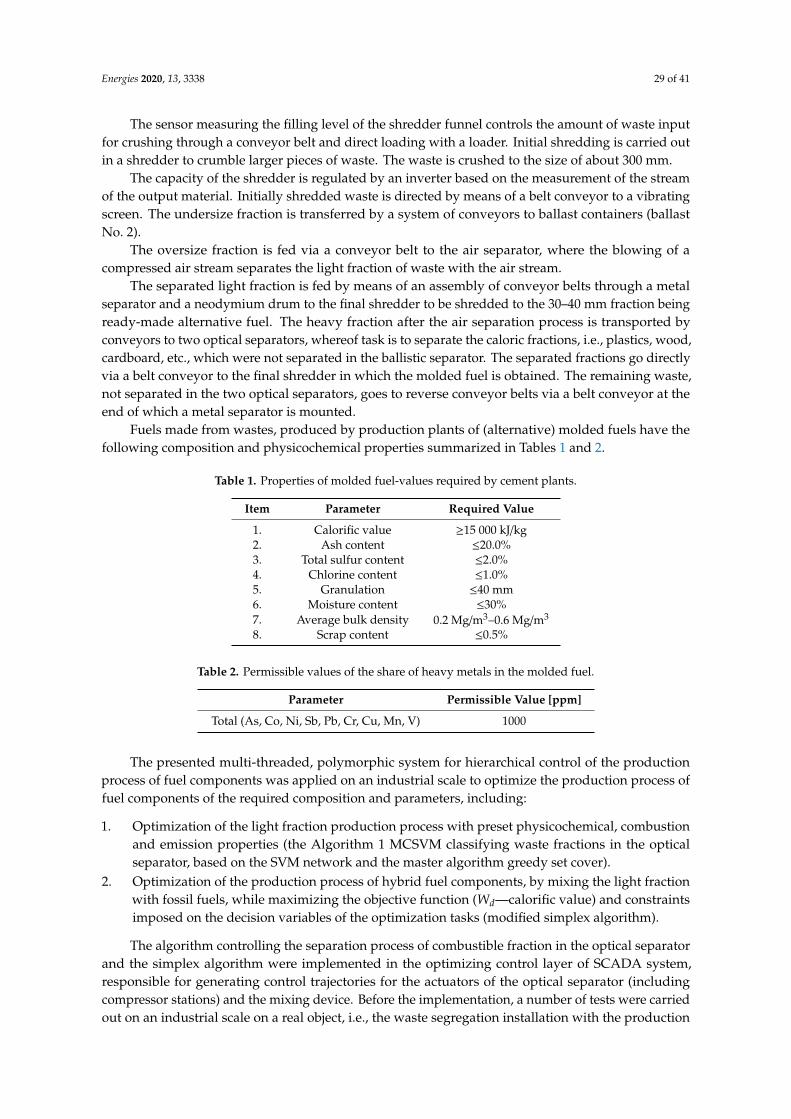
Energies 2020, 13, 3338 29 of 41
The sensor measuring the filling level of the shredder funnel controls the amount of waste inputfor crushing through a conveyor belt and direct loading with a loader. Initial shredding is carried outin a shredder to crumble larger pieces of waste. The waste is crushed to the size of about 300 mm.
The capacity of the shredder is regulated by an inverter based on the measurement of the streamof the output material. Initially shredded waste is directed by means of a belt conveyor to a vibratingscreen. The undersize fraction is transferred by a system of conveyors to ballast containers (ballastNo. 2).
The oversize fraction is fed via a conveyor belt to the air separator, where the blowing of acompressed air stream separates the light fraction of waste with the air stream.
The separated light fraction is fed by means of an assembly of conveyor belts through a metalseparator and a neodymium drum to the final shredder to be shredded to the 30–40 mm fraction beingready-made alternative fuel. The heavy fraction after the air separation process is transported byconveyors to two optical separators, whereof task is to separate the caloric fractions, i.e., plastics, wood,cardboard, etc., which were not separated in the ballistic separator. The separated fractions go directlyvia a belt conveyor to the final shredder in which the molded fuel is obtained. The remaining waste,not separated in the two optical separators, goes to reverse conveyor belts via a belt conveyor at theend of which a metal separator is mounted.
Fuels made from wastes, produced by production plants of (alternative) molded fuels have thefollowing composition and physicochemical properties summarized in Tables 1 and 2.
Table 1. Properties of molded fuel-values required by cement plants.
Item Parameter Required Value
1. Calorific value ≥15 000 kJ/kg2. Ash content ≤20.0%3. Total sulfur content ≤2.0%4. Chlorine content ≤1.0%5. Granulation ≤40 mm6. Moisture content ≤30%7. Average bulk density 0.2 Mg/m3–0.6 Mg/m3
8. Scrap content ≤0.5%
Table 2. Permissible values of the share of heavy metals in the molded fuel.
Parameter Permissible Value [ppm]
Total (As, Co, Ni, Sb, Pb, Cr, Cu, Mn, V) 1000
The presented multi-threaded, polymorphic system for hierarchical control of the productionprocess of fuel components was applied on an industrial scale to optimize the production process offuel components of the required composition and parameters, including:
1. Optimization of the light fraction production process with preset physicochemical, combustionand emission properties (the Algorithm 1 MCSVM classifying waste fractions in the opticalseparator, based on the SVM network and the master algorithm greedy set cover).
2. Optimization of the production process of hybrid fuel components, by mixing the light fractionwith fossil fuels, while maximizing the objective function (Wd—calorific value) and constraintsimposed on the decision variables of the optimization tasks (modified simplex algorithm).
The algorithm controlling the separation process of combustible fraction in the optical separatorand the simplex algorithm were implemented in the optimizing control layer of SCADA system,responsible for generating control trajectories for the actuators of the optical separator (includingcompressor stations) and the mixing device. Before the implementation, a number of tests were carriedout on an industrial scale on a real object, i.e., the waste segregation installation with the production
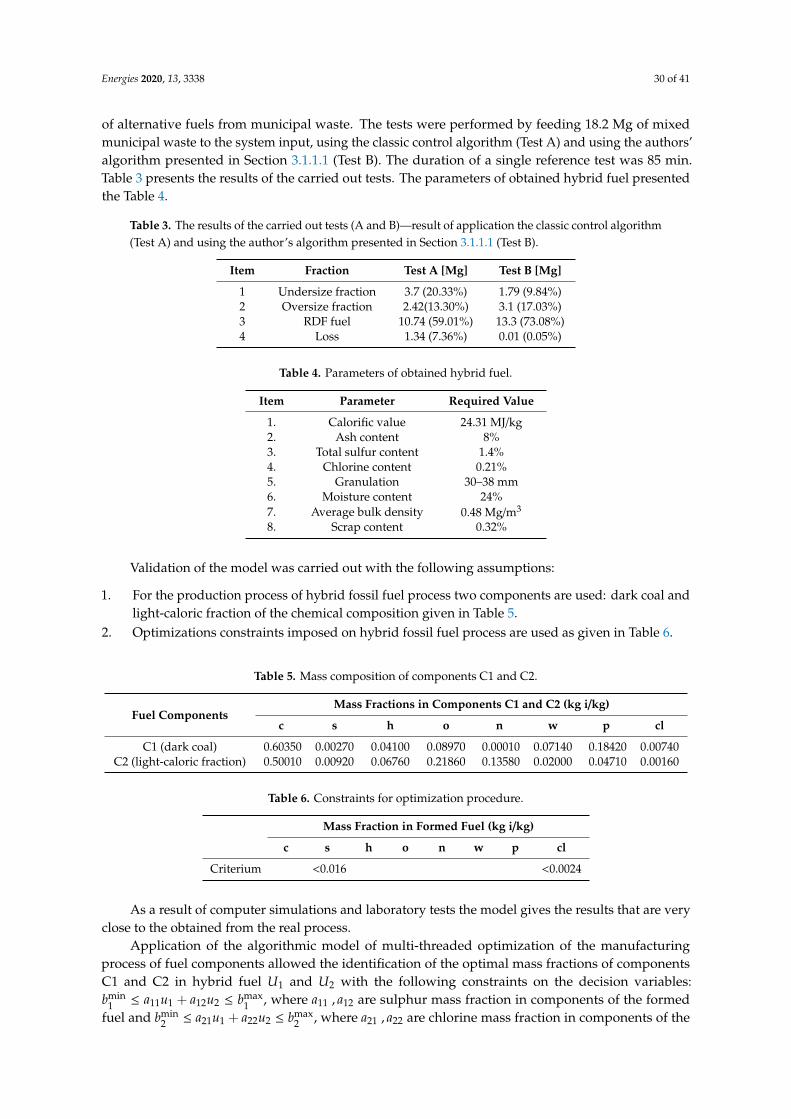
Energies 2020, 13, 3338 30 of 41
of alternative fuels from municipal waste. The tests were performed by feeding 18.2 Mg of mixedmunicipal waste to the system input, using the classic control algorithm (Test A) and using the authors’algorithm presented in Section 3.1.1.1 (Test B). The duration of a single reference test was 85 min.Table 3 presents the results of the carried out tests. The parameters of obtained hybrid fuel presentedthe Table 4.
Table 3. The results of the carried out tests (A and B)—result of application the classic control algorithm(Test A) and using the author’s algorithm presented in Section 3.1.1.1 (Test B).
Item Fraction Test A [Mg] Test B [Mg]
1 Undersize fraction 3.7 (20.33%) 1.79 (9.84%)2 Oversize fraction 2.42(13.30%) 3.1 (17.03%)3 RDF fuel 10.74 (59.01%) 13.3 (73.08%)4 Loss 1.34 (7.36%) 0.01 (0.05%)
Table 4. Parameters of obtained hybrid fuel.
Item Parameter Required Value
1. Calorific value 24.31 MJ/kg2. Ash content 8%3. Total sulfur content 1.4%4. Chlorine content 0.21%5. Granulation 30–38 mm6. Moisture content 24%7. Average bulk density 0.48 Mg/m3
8. Scrap content 0.32%
Validation of the model was carried out with the following assumptions:
1. For the production process of hybrid fossil fuel process two components are used: dark coal andlight-caloric fraction of the chemical composition given in Table 5.
2. Optimizations constraints imposed on hybrid fossil fuel process are used as given in Table 6.
Table 5. Mass composition of components C1 and C2.
Fuel ComponentsMass Fractions in Components C1 and C2 (kg i/kg)
c s h o n w p cl
C1 (dark coal) 0.60350 0.00270 0.04100 0.08970 0.00010 0.07140 0.18420 0.00740C2 (light-caloric fraction) 0.50010 0.00920 0.06760 0.21860 0.13580 0.02000 0.04710 0.00160
Table 6. Constraints for optimization procedure.
Mass Fraction in Formed Fuel (kg i/kg)
c s h o n w p cl
Criterium <0.016 <0.0024
As a result of computer simulations and laboratory tests the model gives the results that are veryclose to the obtained from the real process.
Application of the algorithmic model of multi-threaded optimization of the manufacturingprocess of fuel components allowed the identification of the optimal mass fractions of componentsC1 and C2 in hybrid fuel U1 and U2 with the following constraints on the decision variables:bmin
1 ≤ a11u1 + a12u2 ≤ bmax1 , where a11 , a12 are sulphur mass fraction in components of the formed
fuel and bmin2 ≤ a21u1 + a22u2 ≤ bmax
2 , where a21 , a22 are chlorine mass fraction in components of the
Energies 2020, 13, 3338 31 of 41
formed fuel. Symbols bmin1 , bmax
1 and bmin2 , bmax
2 denotes allowable values of sulphur and chlorinemass fractions in components of the formed fuel respectively (bmin
1 ≥ 0, bmax1 ≤ 0.016 kg s/kg and
bmin2 ≥ 0,bmax
2 ≤ 0.0024 kg cl/kg. Optimum value of the objective function Woptd was found within the
range of 23.14 to max 24.31 MJ/kg.In effect of the optimization of the technological process, the efficiency index of optical separator
increased from 81% to 92%. Savings in electricity consumption were also reported, and thus the unitcost of RDF fuel production decreased from PLN 18.24/Mg to PLN 16.33/Mg.
4.2. A Case Study—Energy Economics of Wastewater Treatment Plant Processes
The subject of the research involved a municipal sewage treatment plant with the capacity of165,000 RLM, with an average daily flow of 23,000 m3/day. The biological wastewater treatment processis carried out in the UCT type flow bioreactor using activated sludge technology with fine-bubblecompressed air aeration. The optimal aeration process of an aerobic chamber requires the supply oflarge amounts of electricity (to drive blowers) and accounts for over 45% of the annual electricityconsumption in the entire wastewater treatment process. The second element of the installation thatrequires optimization of electricity consumption is the internal and external recirculation process,which accounts for over 10% of annual energy consumption.
The actual process of biological transformation is represented by a group of activated sludgemodels (ASM) proposed by the International Water Association (IWA). In the considered object, formodeling of the real process, we used the ASM2d model, described by the vector of 21 state variables,20 stoichiometric and kinetic parameters. The model also describes the removal processes of organiccarbon and nitrogen, as well as transformations with the use of bacteria which have the ability to storephosphorus in cell biomass.
The non-linear nature of the process, different operating conditions of the sewage treatment plant,a strong impact of disturbances (including mainly irregular inflow of sewage to the treatment plant, achanging load of wastes) enforce a change of reference trajectory of oxygen concentration over the24 h operation period. It is determined by the optimizing control layer of the technological process.Following up the oxygen reference trajectory by changing the air supply intensity as a control quantityis a classic task of controlling the process of biological decomposition of organic matter [34,36].
The biological part of the treatment plant includes radial secondary settling tanks and twobioreactors. The internal recirculation (versus external rec.) is carried out from the end of thenitrification chamber to the denitrification chamber, where nitrates are reduced to gas nitrogen. Internalrecirculation can be directed to anoxic chambers, and the wastewater stream can be divided in anyproportions. The recycled sludge is directed from the secondary settling tank to the anaerobic chamber.The manipulating variables are flow rates (internal and external recirculation, air stream to oxygenchambers and the level of excess sludge discharge, dosing of reagents). The removal degree of nitrogencompounds is determined by the degree of recirculation of wastewater from the oxygen chamber tothe anoxic chamber, i.e., the rise of the degree of recirculation rises the removal efficiency of nitrogencompounds. The control of the recirculated streams of wastewater and sludge depends on the volumeof raw wastewater stream at the inlet and on the pollution load.
The computer model of the wastewater treatment plant was developed in the Matlab/Simulinkand SIMBA environment. To model biochemical processes, we applied the model Activated SludgeModel No. 2d (ASM2d), comprising removal processes of organic carbon and nitrogen as well as thetransformation involving bacteria having the ability to store phosphorus in cell biomass. Then, thequantitative and qualitative parameters were identified and the model was calibrated. The final stepinvolved the validation of the entire model. It was carried out using a set of data from outside thosethat were used to calibrate the model. Both in the calibration process and in model validation we usedgenetic algorithms. High accuracy of the model was obtained and its usability for the purposes ofdesigning the control system was confirmed.
Energies 2020, 13, 3338 32 of 41
The model was calibrated in two stages. In the first stage, static model calibration was performed.Static calibration does not consider the variability of parameters over time and is the first approximationto determine the values of kinetic coefficients of individual groups of microorganisms that are part ofthe activated sludge. In the second stage dynamic calibration was carried out, which took into accountthe variability of sewage composition and treatment plant operation parameters during the day.
Static calibration consisted of simulations at different values of kinetic coefficients of processesoccurring in the biological reactor. Factors of fundamental importance for the processes ofnutrient removal:
1. Maximum growth rates of autotrophs, heterotrophs and phosphorus accumulating heterotrophs.2. Decomposition rates of autotrophs, heterotrophs and phosphorus accumulating heterotrophs.3. Appropriate saturation constants and other coefficients, describing, e.g., the hydrolysis process,
yields of growth of individual groups of microorganisms and other, with slightly less importancefor the course of purification processes.
Calibration was carried out until an acceptable level of compliance of the simulation results withthe results of the treatment plant was obtained. As values to which the calibration results were referred,the average values of the basic concentrations of pollutants in the wastewater flowing out of thesecondary settling tank during the 14 days of testing were adopted. For the approximate assessment ofcompliance of simulation results with real values, so-called “Compliance indicator” being the sumof squares of relative differences in concentrations of basic pollution indicators: COD, suspension,N-NH4, N-NO3 and total phosphorus as well as biomass concentration in the reactor.
The values of kinetic coefficients obtained as a result of static calibration constituted the startingpoint for carrying out dynamic calibration of the model, the purpose of which was to preciselydetermine the values of these coefficients in such a way that the dynamic reaction of the model tochanges in the composition of the wastewater flowing into the reactor during the day was similarto that of the real system. It should be remembered that the model’s response to input changes willnever perfectly match reality. This is because the model always idealizes the conditions at the sewagetreatment plant, without taking into account e.g., the lack of full mixing in the reactor, changes insewage temperature, the amount of air supplied to the system and certain unregistered operatingactivities. During the dynamic calibration of the model, the growth rates of individual groups ofmicroorganisms and the rate of their breakdown in the ranges of about ±10% in relation to the valuesobtained as a result of static calibration were changed. As a result of the dynamic calibration of themodel, the following values of kinetic coefficients were determined:
1. Growth rate of autotrophs: µA = 0.692. Growth rate of heterotrophs: µH = 4.83. Growth rate of phosphorus accumulating heterotrophs: µPH = 3.94. Autotroph decomposition rate: bA = 0.0395. Heterotroph decomposition rate: bH = 0.496. Decomposition rate of phosphorus accumulating heterotrophs: bPH = 0.011
For the obtained kinetic coefficients, the model was validated on an independent data set assumingat the entrance to the model the average concentrations of pollutants flowing into the biological reactor,obtaining a compliance index value of 1.12.
Optimization of technological process parameters-objective function and constraints imposed ondecision variables of the optimization task.
The purpose of the control is to minimize the objective function expressing the consumption ofelectricity by the aeration station (a set of blowers, diffusers, throttles), while meeting the process andtechnological constraints described by the expressions (expressions).
The sewage treatment plant was modeled in the Matlab/Simulink environment using the calibratedASM2d model. Then, a nonlinear regulation system was implemented using the Optimization Toolbox
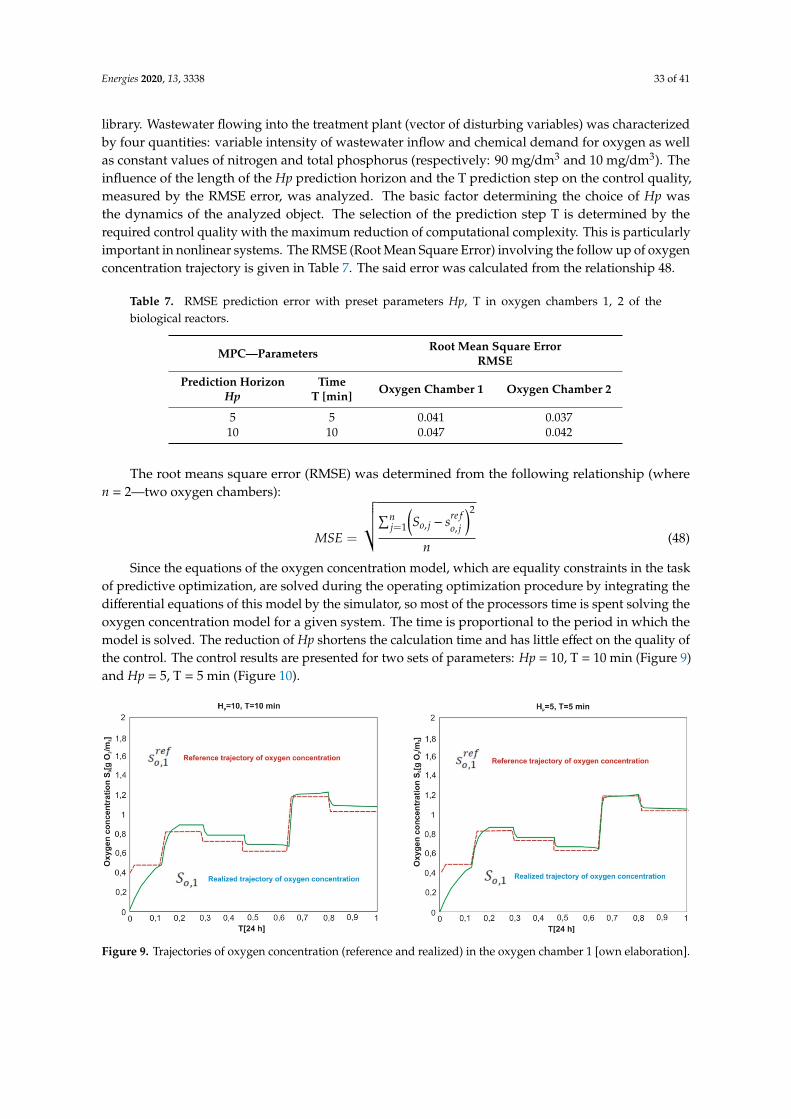
Energies 2020, 13, 3338 33 of 41
library. Wastewater flowing into the treatment plant (vector of disturbing variables) was characterizedby four quantities: variable intensity of wastewater inflow and chemical demand for oxygen as wellas constant values of nitrogen and total phosphorus (respectively: 90 mg/dm3 and 10 mg/dm3). Theinfluence of the length of the Hp prediction horizon and the T prediction step on the control quality,measured by the RMSE error, was analyzed. The basic factor determining the choice of Hp wasthe dynamics of the analyzed object. The selection of the prediction step T is determined by therequired control quality with the maximum reduction of computational complexity. This is particularlyimportant in nonlinear systems. The RMSE (Root Mean Square Error) involving the follow up of oxygenconcentration trajectory is given in Table 7. The said error was calculated from the relationship 48.
Table 7. RMSE prediction error with preset parameters Hp, T in oxygen chambers 1, 2 of thebiological reactors.
MPC—Parameters Root Mean Square ErrorRMSE
Prediction HorizonHp
TimeT [min] Oxygen Chamber 1 Oxygen Chamber 2
5 5 0.041 0.03710 10 0.047 0.042
The root means square error (RMSE) was determined from the following relationship (wheren = 2—two oxygen chambers):
MSE =
√√√√∑nj=1
(So, j − sre f
o, j
)2
n(48)
Since the equations of the oxygen concentration model, which are equality constraints in the taskof predictive optimization, are solved during the operating optimization procedure by integrating thedifferential equations of this model by the simulator, so most of the processors time is spent solving theoxygen concentration model for a given system. The time is proportional to the period in which themodel is solved. The reduction of Hp shortens the calculation time and has little effect on the quality ofthe control. The control results are presented for two sets of parameters: Hp = 10, T = 10 min (Figure 9)and Hp = 5, T = 5 min (Figure 10).
Energies 2020, 13, x FOR PEER REVIEW 34 of 41
increased sewage inflows with high concentration of pollutants, the oxygen concentration trajectories can be significantly different, and the system with independently working MPC regulators may have problems with proper air distribution. It also applies to the decision to divide the restriction involving the maximum air supply. The control system with a multidimensional MPC controller takes into account the needs of two oxygen chambers and thus it finds an optimal distribution of air stream.
Figure 9. Trajectories of oxygen concentration (reference and realized) in the oxygen chamber 1 [own elaboration].
Figure 10. Trajectories of oxygen concentration (reference and realized) in the oxygen chamber 2 [own elaboration].
When optimizing the electricity consumption of actuators in the system of biological reactor, special attention was paid to the required degree of wastewater treatment, in order to ensure the quality parameters of wastewater in compliance with the accepted standards. For the analyzed sewage treatment plant, whereof capacity is 165,000 RLM, the concentration of total nitrogen in the treated wastewater should not exceed 10 mg/L, and the concentration of total phosphorus should not exceed 1 mg/L. The highest permissible values for the individual nitrogen compounds should be 10 mg/L for NH4+ ammonium nitrogen, 30 mg/l for NO3- nitrate nitrogen and 1 mg/L for NO2- nitrite nitrogen, respectively.
The analysis involved also the changes of dissolved oxygen concentration in the nitrification chamber in relation to the electric energy consumption by the actuators. When conducting the analysis of computer simulation, we assumed the concentration of dissolved oxygen in the activated sludge chambers in the range of 0.5 to 2 mg/l. The changes in the concentration of ammonium nitrogen (NH4+ -N) and nitrate nitrogen (NO3 -N) are presented in Figure 11.
Figure 9. Trajectories of oxygen concentration (reference and realized) in the oxygen chamber 1 [own elaboration].
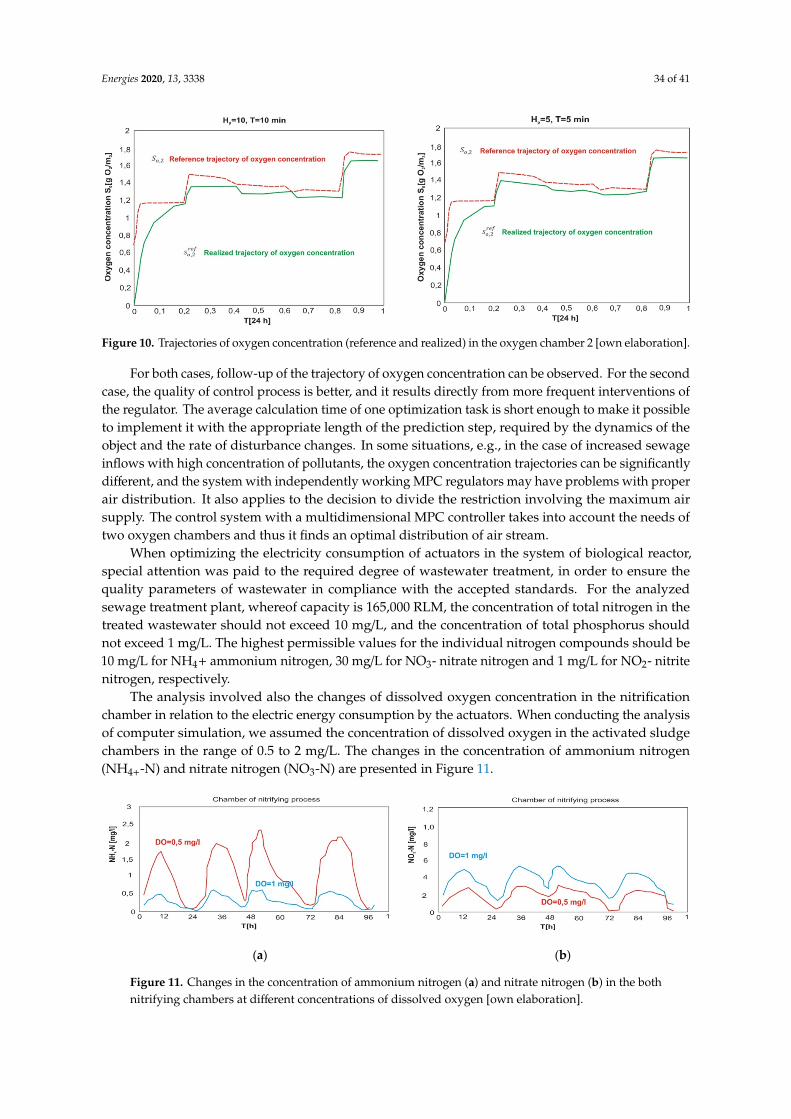
Energies 2020, 13, 3338 34 of 41
Energies 2020, 13, x FOR PEER REVIEW 34 of 41
increased sewage inflows with high concentration of pollutants, the oxygen concentration trajectories can be significantly different, and the system with independently working MPC regulators may have problems with proper air distribution. It also applies to the decision to divide the restriction involving the maximum air supply. The control system with a multidimensional MPC controller takes into account the needs of two oxygen chambers and thus it finds an optimal distribution of air stream.
Figure 9. Trajectories of oxygen concentration (reference and realized) in the oxygen chamber 1 [own elaboration].
Figure 10. Trajectories of oxygen concentration (reference and realized) in the oxygen chamber 2 [own elaboration].
When optimizing the electricity consumption of actuators in the system of biological reactor, special attention was paid to the required degree of wastewater treatment, in order to ensure the quality parameters of wastewater in compliance with the accepted standards. For the analyzed sewage treatment plant, whereof capacity is 165,000 RLM, the concentration of total nitrogen in the treated wastewater should not exceed 10 mg/L, and the concentration of total phosphorus should not exceed 1 mg/L. The highest permissible values for the individual nitrogen compounds should be 10 mg/L for NH4+ ammonium nitrogen, 30 mg/l for NO3- nitrate nitrogen and 1 mg/L for NO2- nitrite nitrogen, respectively.
The analysis involved also the changes of dissolved oxygen concentration in the nitrification chamber in relation to the electric energy consumption by the actuators. When conducting the analysis of computer simulation, we assumed the concentration of dissolved oxygen in the activated sludge chambers in the range of 0.5 to 2 mg/l. The changes in the concentration of ammonium nitrogen (NH4+ -N) and nitrate nitrogen (NO3 -N) are presented in Figure 11.
Figure 10. Trajectories of oxygen concentration (reference and realized) in the oxygen chamber 2 [own elaboration].
For both cases, follow-up of the trajectory of oxygen concentration can be observed. For the secondcase, the quality of control process is better, and it results directly from more frequent interventions ofthe regulator. The average calculation time of one optimization task is short enough to make it possibleto implement it with the appropriate length of the prediction step, required by the dynamics of theobject and the rate of disturbance changes. In some situations, e.g., in the case of increased sewageinflows with high concentration of pollutants, the oxygen concentration trajectories can be significantlydifferent, and the system with independently working MPC regulators may have problems with properair distribution. It also applies to the decision to divide the restriction involving the maximum airsupply. The control system with a multidimensional MPC controller takes into account the needs oftwo oxygen chambers and thus it finds an optimal distribution of air stream.
When optimizing the electricity consumption of actuators in the system of biological reactor,special attention was paid to the required degree of wastewater treatment, in order to ensure thequality parameters of wastewater in compliance with the accepted standards. For the analyzedsewage treatment plant, whereof capacity is 165,000 RLM, the concentration of total nitrogen in thetreated wastewater should not exceed 10 mg/L, and the concentration of total phosphorus shouldnot exceed 1 mg/L. The highest permissible values for the individual nitrogen compounds should be10 mg/L for NH4+ ammonium nitrogen, 30 mg/L for NO3- nitrate nitrogen and 1 mg/L for NO2- nitritenitrogen, respectively.
The analysis involved also the changes of dissolved oxygen concentration in the nitrificationchamber in relation to the electric energy consumption by the actuators. When conducting the analysisof computer simulation, we assumed the concentration of dissolved oxygen in the activated sludgechambers in the range of 0.5 to 2 mg/L. The changes in the concentration of ammonium nitrogen(NH4+-N) and nitrate nitrogen (NO3-N) are presented in Figure 11.Energies 2020, 13, x FOR PEER REVIEW 35 of 41
(a) (b)
Figure 11. Changes in the concentration of ammonium nitrogen (a) and nitrate nitrogen (b) in the both nitrifying chambers at different concentrations of dissolved oxygen [own elaboration].
Based on the results of dynamic modeling, it was found that the dissolved oxygen content in the range of 0.5 mg/L to 2 mg/L is correct in terms of the quality of sewage outflow. Nevertheless, during the hours of the largest inflow of pollution load, the concentration of ammonium nitrogen increases significantly. Based on the analysis, we can state that the most optimal concentration of dissolved oxygen is within 1 mg/L at high efficiency of the process. The consumption of total energy can be reduced by up to 14% by adopting the concentration of oxygen at the level of 1 mg/L relative to 2 mg/L in the nitrifying chamber.
Oxygen concentration levels in both nitrification chambers are different due to the fact that the first part of the nitrification chamber not only receives a large N-NH4 load, but also a large load of organic pollutants. It follows that the load of activated sludge with an organic charge in the first part of the nitrification chamber is higher than in the second part of the nitrification chamber, and thus, in addition to the oxygen demand of Nitrosomonas bacteria (the first nitrification phase), very high oxygen demand is shown by heterotrophic bacteria that mineralize the organic contaminants. In the second part of the nitrification chamber, the demand for oxygen is definitely lower due to the fact that the greater part of the organic charge has been removed in the first part of the chamber. In addition, the demand for oxygen by nitrifying bacteria of the first phase of nitrification (oxidation of N-NH4 to N-NO2) is as much as 75% of the total oxygen pool needed to achieve full nitrification, and for the second phase of nitrification (oxidation of N-NO2 to N-NO3) oxygen by Nitrobacter only 25%, which is also associated with lower oxygen demand in the second part of the nitrification chamber.
The next step in optimizing the costs of wastewater treatment involves the analysis of the impact of stream change in the internal recirculation process from the nitrification chamber to the denitrification chamber. During the simulation, a constant dissolved oxygen concentration (1 mg/L) was adopted. The simulation was carried out at various internal recirculation rates from 50% to 300% of the inflowing sewage. The results of the simulation are presented in Figure 11.
Based on the simulation results, it can be observed that recirculation changes significantly affect the concentration of NO3-N in the outflow. Lowering the flow rate deteriorates the efficiency of the process. With the 50% recirculation, the nitrate nitrogen concentration is on the border of the permissible value of total nitrogen (<10 mg/L).
As part of the research carried out on an industrial scale, an impact analysis was carried out involving the change of the recirculated wastewater stream (internal recirculation) from the outlet of the nitrifying chamber to the denitrification chamber. For the simulation, a constant concentration of dissolved oxygen (1 mg/L) was adopted. The simulation was carried out at various internal recirculation rates from 50% to 300% of the inflowing sewage. Lowering the flow rate deteriorates the efficiency of the process. With the 50% recirculation, the nitrate nitrogen concentration is on the border of the permissible value of total nitrogen (<10 mg/L).
The degree of internal recirculation at most wastewater treatment plants is about 300% of raw sewage inflow. By adopting the internal recirculation of 200% of the incoming sewage, we can save up to 30% of electricity by reducing the total nitrogen concentration by about 13% in the outflow. However, the total nitrogen concentration is below the permissible threshold (<10 mg/l). By
Figure 11. Changes in the concentration of ammonium nitrogen (a) and nitrate nitrogen (b) in the bothnitrifying chambers at different concentrations of dissolved oxygen [own elaboration].
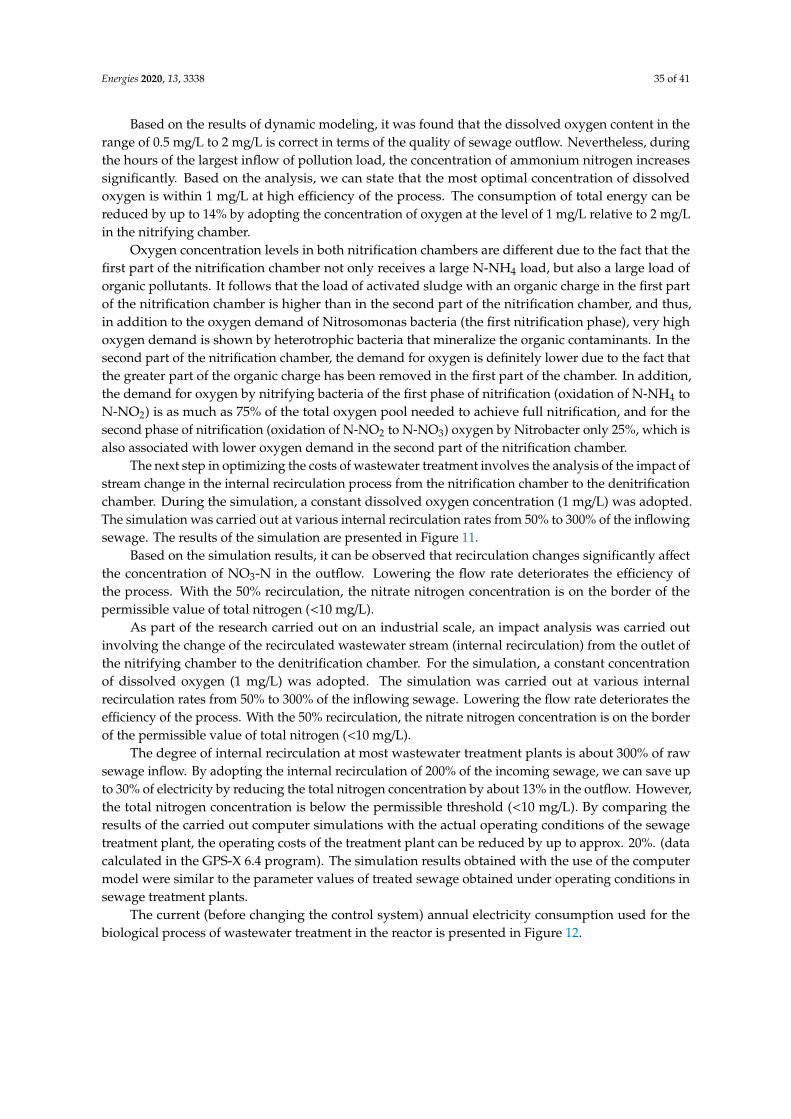
Energies 2020, 13, 3338 35 of 41
Based on the results of dynamic modeling, it was found that the dissolved oxygen content in therange of 0.5 mg/L to 2 mg/L is correct in terms of the quality of sewage outflow. Nevertheless, duringthe hours of the largest inflow of pollution load, the concentration of ammonium nitrogen increasessignificantly. Based on the analysis, we can state that the most optimal concentration of dissolvedoxygen is within 1 mg/L at high efficiency of the process. The consumption of total energy can bereduced by up to 14% by adopting the concentration of oxygen at the level of 1 mg/L relative to 2 mg/Lin the nitrifying chamber.
Oxygen concentration levels in both nitrification chambers are different due to the fact that thefirst part of the nitrification chamber not only receives a large N-NH4 load, but also a large load oforganic pollutants. It follows that the load of activated sludge with an organic charge in the first partof the nitrification chamber is higher than in the second part of the nitrification chamber, and thus,in addition to the oxygen demand of Nitrosomonas bacteria (the first nitrification phase), very highoxygen demand is shown by heterotrophic bacteria that mineralize the organic contaminants. In thesecond part of the nitrification chamber, the demand for oxygen is definitely lower due to the fact thatthe greater part of the organic charge has been removed in the first part of the chamber. In addition,the demand for oxygen by nitrifying bacteria of the first phase of nitrification (oxidation of N-NH4 toN-NO2) is as much as 75% of the total oxygen pool needed to achieve full nitrification, and for thesecond phase of nitrification (oxidation of N-NO2 to N-NO3) oxygen by Nitrobacter only 25%, which isalso associated with lower oxygen demand in the second part of the nitrification chamber.
The next step in optimizing the costs of wastewater treatment involves the analysis of the impact ofstream change in the internal recirculation process from the nitrification chamber to the denitrificationchamber. During the simulation, a constant dissolved oxygen concentration (1 mg/L) was adopted.The simulation was carried out at various internal recirculation rates from 50% to 300% of the inflowingsewage. The results of the simulation are presented in Figure 11.
Based on the simulation results, it can be observed that recirculation changes significantly affectthe concentration of NO3-N in the outflow. Lowering the flow rate deteriorates the efficiency ofthe process. With the 50% recirculation, the nitrate nitrogen concentration is on the border of thepermissible value of total nitrogen (<10 mg/L).
As part of the research carried out on an industrial scale, an impact analysis was carried outinvolving the change of the recirculated wastewater stream (internal recirculation) from the outlet ofthe nitrifying chamber to the denitrification chamber. For the simulation, a constant concentrationof dissolved oxygen (1 mg/L) was adopted. The simulation was carried out at various internalrecirculation rates from 50% to 300% of the inflowing sewage. Lowering the flow rate deteriorates theefficiency of the process. With the 50% recirculation, the nitrate nitrogen concentration is on the borderof the permissible value of total nitrogen (<10 mg/L).
The degree of internal recirculation at most wastewater treatment plants is about 300% of rawsewage inflow. By adopting the internal recirculation of 200% of the incoming sewage, we can save upto 30% of electricity by reducing the total nitrogen concentration by about 13% in the outflow. However,the total nitrogen concentration is below the permissible threshold (<10 mg/L). By comparing theresults of the carried out computer simulations with the actual operating conditions of the sewagetreatment plant, the operating costs of the treatment plant can be reduced by up to approx. 20%. (datacalculated in the GPS-X 6.4 program). The simulation results obtained with the use of the computermodel were similar to the parameter values of treated sewage obtained under operating conditions insewage treatment plants.
The current (before changing the control system) annual electricity consumption used for thebiological process of wastewater treatment in the reactor is presented in Figure 12.
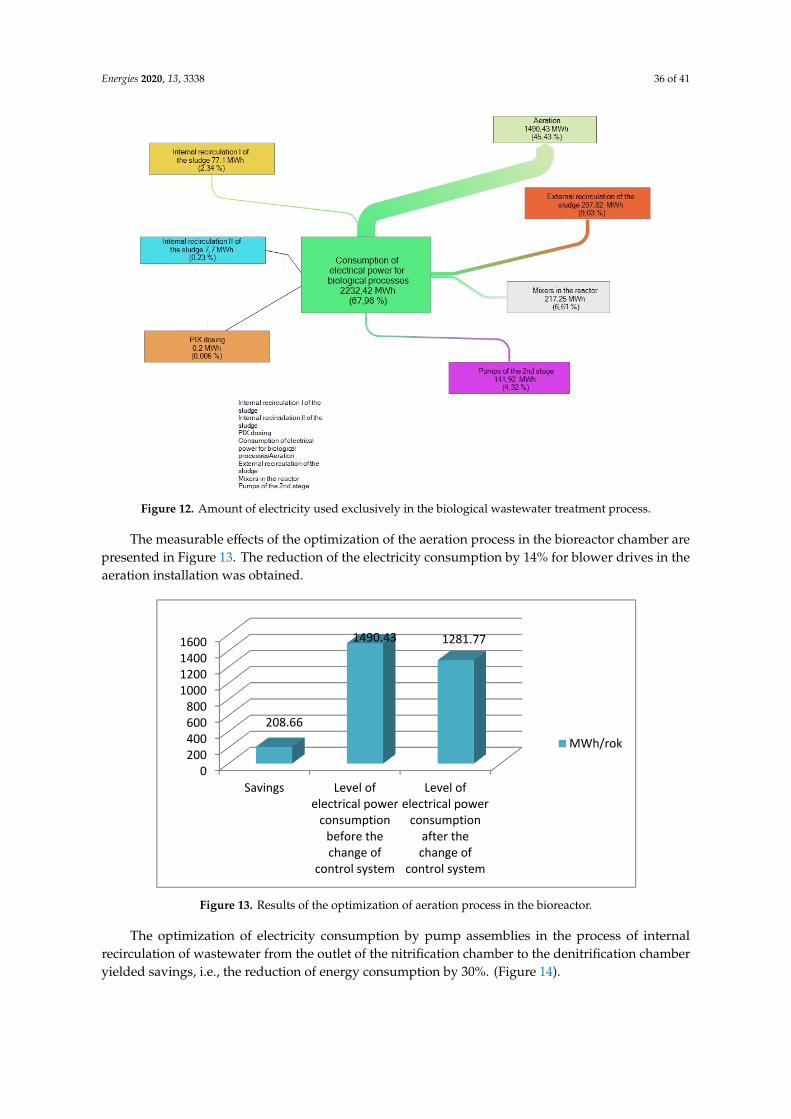
Energies 2020, 13, 3338 36 of 41
Energies 2020, 13, x FOR PEER REVIEW 36 of 41
approx. 20%. (data calculated in the GPS-X 6.4 program). The simulation results obtained with the use of the computer model were similar to the parameter values of treated sewage obtained under operating conditions in sewage treatment plants.
The current (before changing the control system) annual electricity consumption used for the biological process of wastewater treatment in the reactor is presented in Figure 12.
Figure 12. Amount of electricity used exclusively in the biological wastewater treatment process.
The measurable effects of the optimization of the aeration process in the bioreactor chamber are presented in Figure 13. The reduction of the electricity consumption by 14% for blower drives in the aeration installation was obtained.
Figure 13. Results of the optimization of aeration process in the bioreactor.
0200400600800
1000120014001600
Savings Level ofelectrical power
consumptionbefore thechange of
control system
Level ofelectrical power
consumptionafter thechange of
control system
208.66
1490.43 1281.77
MWh/rok
Figure 12. Amount of electricity used exclusively in the biological wastewater treatment process.
The measurable effects of the optimization of the aeration process in the bioreactor chamber arepresented in Figure 13. The reduction of the electricity consumption by 14% for blower drives in theaeration installation was obtained.
Energies 2020, 13, x FOR PEER REVIEW 36 of 41
approx. 20%. (data calculated in the GPS-X 6.4 program). The simulation results obtained with the use of the computer model were similar to the parameter values of treated sewage obtained under operating conditions in sewage treatment plants.
The current (before changing the control system) annual electricity consumption used for the biological process of wastewater treatment in the reactor is presented in Figure 12.
Figure 12. Amount of electricity used exclusively in the biological wastewater treatment process.
The measurable effects of the optimization of the aeration process in the bioreactor chamber are presented in Figure 13. The reduction of the electricity consumption by 14% for blower drives in the aeration installation was obtained.
Figure 13. Results of the optimization of aeration process in the bioreactor.
0200400600800
1000120014001600
Savings Level ofelectrical power
consumptionbefore thechange of
control system
Level ofelectrical power
consumptionafter thechange of
control system
208.66
1490.43 1281.77
MWh/rok
Figure 13. Results of the optimization of aeration process in the bioreactor.
The optimization of electricity consumption by pump assemblies in the process of internalrecirculation of wastewater from the outlet of the nitrification chamber to the denitrification chamberyielded savings, i.e., the reduction of energy consumption by 30%. (Figure 14).
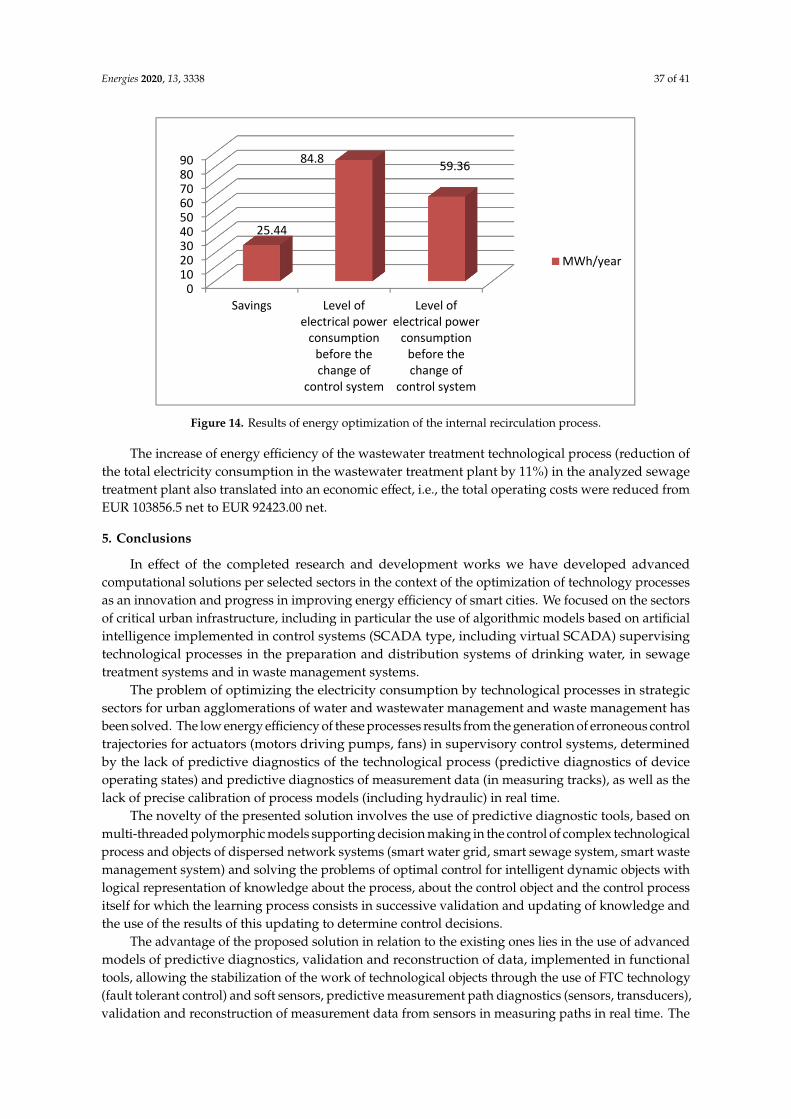
Energies 2020, 13, 3338 37 of 41
Energies 2020, 13, x FOR PEER REVIEW 37 of 41
The optimization of electricity consumption by pump assemblies in the process of internal recirculation of wastewater from the outlet of the nitrification chamber to the denitrification chamber yielded savings, i.e., the reduction of energy consumption by 30%. (Figure 14).
Figure 14. Results of energy optimization of the internal recirculation process.
The increase of energy efficiency of the wastewater treatment technological process (reduction of the total electricity consumption in the wastewater treatment plant by 11%) in the analyzed sewage treatment plant also translated into an economic effect, i.e., the total operating costs were reduced from EUR 103856.5 net to EUR 92423.00 net.
5. Conclusions
In effect of the completed research and development works we have developed advanced computational solutions per selected sectors in the context of the optimization of technology processes as an innovation and progress in improving energy efficiency of smart cities. We focused on the sectors of critical urban infrastructure, including in particular the use of algorithmic models based on artificial intelligence implemented in control systems (SCADA type, including virtual SCADA) supervising technological processes in the preparation and distribution systems of drinking water, in sewage treatment systems and in waste management systems.
The problem of optimizing the electricity consumption by technological processes in strategic sectors for urban agglomerations of water and wastewater management and waste management has been solved. The low energy efficiency of these processes results from the generation of erroneous control trajectories for actuators (motors driving pumps, fans) in supervisory control systems, determined by the lack of predictive diagnostics of the technological process (predictive diagnostics of device operating states) and predictive diagnostics of measurement data (in measuring tracks), as well as the lack of precise calibration of process models (including hydraulic) in real time.
The novelty of the presented solution involves the use of predictive diagnostic tools, based on multi-threaded polymorphic models supporting decision making in the control of complex technological process and objects of dispersed network systems (smart water grid, smart sewage system, smart waste management system) and solving the problems of optimal control for intelligent dynamic objects with logical representation of knowledge about the process, about the control object and the control process itself for which the learning process consists in successive validation and updating of knowledge and the use of the results of this updating to determine control decisions.
The advantage of the proposed solution in relation to the existing ones lies in the use of advanced models of predictive diagnostics, validation and reconstruction of data, implemented in functional tools, allowing the stabilization of the work of technological objects through the use of FTC
0102030405060708090
Savings Level ofelectrical power
consumptionbefore thechange of
control system
Level ofelectrical power
consumptionbefore thechange of
control system
25.44
84.8 59.36
MWh/year
Figure 14. Results of energy optimization of the internal recirculation process.
The increase of energy efficiency of the wastewater treatment technological process (reduction ofthe total electricity consumption in the wastewater treatment plant by 11%) in the analyzed sewagetreatment plant also translated into an economic effect, i.e., the total operating costs were reduced fromEUR 103856.5 net to EUR 92423.00 net.
5. Conclusions
In effect of the completed research and development works we have developed advancedcomputational solutions per selected sectors in the context of the optimization of technology processesas an innovation and progress in improving energy efficiency of smart cities. We focused on the sectorsof critical urban infrastructure, including in particular the use of algorithmic models based on artificialintelligence implemented in control systems (SCADA type, including virtual SCADA) supervisingtechnological processes in the preparation and distribution systems of drinking water, in sewagetreatment systems and in waste management systems.
The problem of optimizing the electricity consumption by technological processes in strategicsectors for urban agglomerations of water and wastewater management and waste management hasbeen solved. The low energy efficiency of these processes results from the generation of erroneous controltrajectories for actuators (motors driving pumps, fans) in supervisory control systems, determinedby the lack of predictive diagnostics of the technological process (predictive diagnostics of deviceoperating states) and predictive diagnostics of measurement data (in measuring tracks), as well as thelack of precise calibration of process models (including hydraulic) in real time.
The novelty of the presented solution involves the use of predictive diagnostic tools, based onmulti-threaded polymorphic models supporting decision making in the control of complex technologicalprocess and objects of dispersed network systems (smart water grid, smart sewage system, smart wastemanagement system) and solving the problems of optimal control for intelligent dynamic objects withlogical representation of knowledge about the process, about the control object and the control processitself for which the learning process consists in successive validation and updating of knowledge andthe use of the results of this updating to determine control decisions.
The advantage of the proposed solution in relation to the existing ones lies in the use of advancedmodels of predictive diagnostics, validation and reconstruction of data, implemented in functionaltools, allowing the stabilization of the work of technological objects through the use of FTC technology(fault tolerant control) and soft sensors, predictive measurement path diagnostics (sensors, transducers),validation and reconstruction of measurement data from sensors in measuring paths in real time. The
Energies 2020, 13, 3338 38 of 41
solution comprises two modules implementing validation methods based on the so-called qualitylevels to detect anomalies and missing data, and the data reconstruction method based on the methodof space time series analysis used to estimate the missing/incorrect data.
The superiority of the discussed systems in relation to the existing ones lies, among others, in theapplication of MPC predictive control model, which is integrating the knowledge base on control objectsand technological processes, models of state and event space. By using evolutionary strategies, theMPC is less sensitive to signal errors, and by the application of soft sensors and Performance AnalysisDiagnostics & Optimization (PADO) and Complex Event Processing (CEP) technologies, it allows togenerate optimal control trajectories for the supervisory control layer. The dedicated tools (IntelligentReal Time Diagnostic System− iRTDS) built into the system of a hierarchical, multi-threaded optimizingcontrol system of SCADA system allow for advanced diagnostics of technological processes in real timeusing the HPC technology. By the application ofthe proprietary iRTDS tool, we can obtain a significantincrease of energy efficiency of technological processes in key sectors of the economy, which in globalterms, e.g., urban agglomeration, improves the economic efficiency. The application programminginterface (API, for the needs to expand SCADA system) is delivered in the form of compiled .NETlibraries as files (.dll), as the dedicated tools for control systems supervising technological processes inmany industries, including in particular network companies in the energy, water and sewage and wastemanagement sectors. The set of these tools comprises in particular the following, e.g., for such sectorsas SMART Water Grid or SMART Sewage Grid, including the SMART Wastewater treatment plant:
1. Dedicated tool—Diagnostics and optimization of electricity consumption in network objects(pumps rooms, pumping stations, hydrophore rooms).
2. Dedicated tool—Validation and reconstruction of process data (Sensor Data Validationand Reconstruction).
3. Dedicated tool—Identification and diagnostics of errors (in real time) of measurement parametersin the hydraulic model and in the monitoring and control systems.
4. Dedicated tool—Current (in real time) control of the performance characteristics and load profileof pump units.
5. Dedicated tool—Diagnostics (in real time) of the operating point of pump units.6. Dedicated tool—Optimization (in real time) of the efficiency of pump units, including motors,
inverters, regulation systems.7. Dedicated tool—Diagnostics (in real time) of error detection in the measuring paths of
SCADA system.8. Dedicated tool—Diagnostics and optimization of the control quality indicator.9. Dedicated tool—Diagnostics and updating of pipeline characteristics.
The models presented in the article are available in the form of API, and thus they can beimplemented in monitoring and control systems, providing advanced tools to expand the environmentof SCADA systems with a thread optimizing the control of process parameters and thus to generatesignificant economic benefits.
In the case of the presented system supporting the production process of fuels (Section 4.1), asignificant rise of economic efficiency was obtained for the company dealing with waste managementin the town area. Another factor of key importance is that the potential of energy production fromwastes has increased, leading to a significant reduction in the share of fuels from non-renewable sourceson the energy production market.
The implementation of specialized solutions in the wastewater treatment plant (Section 4.2) hasoptimized the consumption of electricity in the process of biological treatment of municipal wastewaterusing multi-threaded polymorphic control systems.
Further research and development works are aimed at extending the precision and functionality ofthe methods of damage detection in measuring tracks and reduction of calibration errors of predictivemodels (including hydraulic and hydrodynamic in water and sewage systems) and reduction of

Energies 2020, 13, 3338 39 of 41
prediction errors in control signal trajectories for executive devices controlled by freely programmablePLC controllers in SCADA systems, determining the increase in the quality indicator of technologicalprocesses control and the increase in energy efficiency of these processes.
Author Contributions: Conceptualization, K.G., A.G.; methodology, K.G.; validation, A.G., data curation, A.G.;writing—original draft preparation, K.G.; writing—review and editing, A.G.; supervision, K.G. and A.G. fundingacquisition, K.G. All authors have read and agreed to the published version of the manuscript.
Funding: The work was performed in the framework of the national operational program project “publicationsupported within the Rector’s Professor’s Grant; Silesian University of Technology, 08/040/RGP19/0123”.
Acknowledgments: The authors wish to thank the employees of Water Company in Nowy Sacz (Poland) andENCO Company for the authorization to conduct the tests and for their assistance in performing them and theirprofessionality and availability.
Conflicts of Interest: The authors declare no conflicts of interest. The funders had no role in the design of thestudy; in the collection, analyses or interpretation of data; in the writing of the manuscript or in the decision topublish the results.
Abbreviations
ICT Information and communications technologySCADA Supervisory Control And Data AcquisitionFTC Fault Tolerant ControlHPC High Performance ComputingMPC Model Predictive ControliRTDS intelligent Diagnostic System in Real TimeCEP Complex Event ProcessingOPC UA Open Platform Communications—Unified ArchitecturePLC Programmable Logic ControllerPADO Performance Analysis Diagnostics & OptimizationSVM Support Vector MachineMCSVM Multi-Class Support Vector MachineFPGA Field Programmable Gate ArraysASIC Application-specific Integrated Circuit
References
1. Nitivattananon, V.; Sadowsky, E.; Quimpo, R.G. Optimization of water supply system operation. J. WaterResour. Plan. Manag. 1996, 122, 374–384. [CrossRef]
2. Tu, M.Y.; Tsai, F.T.C.; Yeh, W.W.G. Optimization of water distribution and water quality by hybrid geneticalgorithm. J. Water Resour. Plan. Manag. 2005, 131, 431–440. [CrossRef]
3. Westphal, K.S.; Vogel, R.M.; Kirschen, P.; Chapra, S.C. Decision support system for adaptive water supplymanagement. J. Water Resour. Plan. Manag. 2003, 129, 165–177. [CrossRef]
4. Brdys, M.A.; Ulanicki, B. Operational Control of Water Systems: Structures, Algorithms and Applications;Prentice-Hall International: New York, NY, USA, 1994.
5. Butler, D.; Memon, F.A. Water Demand Management; IWA Publishing: London, UK, 2006.6. Cembrano, G.; Wells, G.; Quevedo, J.; Pérez, R.; Argelaguet, R. Optimal control of a water distribution
network in a supervisory control system. Control Eng. Pract. 2000, 8, 1177–1188. [CrossRef]7. Maksimovic, C.; Butler, D.; Memon, A.F.A.K. Advances in Water Supply Management. In Proceedings of the
International Conference on Computing and Control for Water Industry, London, UK, 15–17 September 2003.8. Brdys, M.A.; Grochowski, M.; Gminski, T.; Konarczak, K.; Drewa, M. Hierarchical predictive control of
integrated wastewater treatment systems. Control Eng. Pract. 2008, 16, 751–767. [CrossRef]9. Ocampo-Martínez, C. Model Predictive Control of Wastewater Systems; Springer: London, UK, 2010.10. Ocampo-Martínez, C.; Ingimundarson, A.; Puig, V.; Quevedo, J. Objective prioritization using lexicographic
minimizers for MPC of sewer networks. IEEE Trans. Control Syst. Technol. 2008, 16, 113–121. [CrossRef]
Energies 2020, 13, 3338 40 of 41
11. Pascual, J.; Romera, J.; Puig, V.; Creus, R.; Minoves, M. Operational predictive optimal control of Barcelonawater transport network. In Proceedings of the 18th world congress of the International Federation ofAutomatic Control, IFAC’2011, Milano, Italy, 28 August–2 September 2011; pp. 10571–10578.
12. Gaska, K.; Generowicz, A.; Zimoch, I. A high-performance computing (HPC) based integrated multithreadedmodel predictive control (MPC) for water supply networks. Arch. Civ. Eng. Environ. 2017, 10, 141–151.[CrossRef]
13. Koseki, H. Evaluation of Various Solid Biomass Fuels Using Thermal Analysis and Gas Emission Tests.Energies 2011, 4, 616–627. [CrossRef]
14. Guerrero, L.A.; Maas, G.; Hogland, W. Solid waste management challenges for cities in developing countries.Waste Manag. 2013, 33, 220–232. [CrossRef]
15. Jewiarz, M.; Mudryk, K.; Wróbel, M.; Fraczek, J.; Dziedzic, K. Parameters Affecting RDF-Based Pellet Quality.Energies 2020, 13, 910. [CrossRef]
16. Antizar-Ladislao, B.; Turrion-Gomez, J.L. Decentralized Energy from Waste Systems. Energies 2010, 3, 194.[CrossRef]
17. Brunner, P.; Rechberger, H. Waste to energy—Key element for sustainable waste management. Waste Manag.2014, 1, 1–10. [CrossRef]
18. Czop, M.; Poranek, N.; Czajkowski, A. Energetic usability and nuisance to the environment of selected fuelsmade of wastes. Przem. Chem. 2018, 97, 1460–1462.
19. Gaska, K.; Generowicz, A.; Lobur, M.; Jaworski, N.; Ciuła, J.; Vovk, M. Advanced algorithmic model forpoly-optimization of biomass fuel production from separate combustible fractions of municipal wastes as aprogress in improving energy efficiency of waste utilization. E3S Web Conf. 2019, 122, 01004. [CrossRef]
20. Gaska, K.; Wandrasz, A.J. Mathematical modeling of biomass fuels formation process. Waste Manag. 2008,28, 973–985. [CrossRef] [PubMed]
21. Longo, S.; d’Antoni, B.M.; Bongards, M.; Chaparro, A.; Cronrath, A.; Fatone, F. Monitoring and diagnosisof energy consumption in wastewater treatment plants. A state of the art and proposals for improvement.Appl. Energy 2016, 179, 1251–1268. [CrossRef]
22. Daw, J.; Hallett, K.; Dewolfe, J.; Venner, I. Energy Efficiency Strategies for Municipal Wastewater TreatmentFacilities; National Renewable Energy Laboratory: Golden, CO, USA, 2012.
23. Di Matteo, U.; Nastasi, B.; Albo, A.; Astiaso Garcia, D. Energy Contribution of OFMSW (Organic Fraction ofMunicipal Solid Waste) to Energy-Environmental Sustainability in Urban Areas at Small Scale. Energies 2017,10, 229. [CrossRef]
24. Brdys, M.A.; Chang, T.; Konarczak, K. Estimation of wastewater treatment plant state for model predictivecontrol of N-P removal at medium time scale. In Proceedings of the IFAC 10th Symposium Large ScaleSystems: Theoryand Applications, Osaka, Japan, 26–28 July 2004.
25. Suchodolski, T.; Brdys, M.A.; Piotrowski, R. Respiration rate estimation for model predictive control ofdissolved oxygen in wastewater treatment plant. In Proceedings of the 11th IFAC Symposium on LargeScale Systems: Theory and Applications, Gdansk, Poland, 23–25 July 2007; Elsevier: Laxenburg, Austria,2008; Volume 11.
26. Gaska, K.; Generowicz, A.; Lobur, M.; Jaworski, N.; Ciuła, J.; Mzyk, T. Optimization of Biological WastewaterTreatment Process by Hierarchical Adaptive Control. In Proceedings of the IEEE XVth InternationalConference on the Perspective Technologies and Methods in MEMS Design (MEMSTECH), Polyana, Ukraine,22–26 May 2019; pp. 119–122. [CrossRef]
27. Dellana, S.; West, D. Predictive modeling for wastewater applications: Linear and nonlinear approaches.Environ. Model. Softw. 2009, 24, 96–106. [CrossRef]
28. Dudley, J.; Buck, G.; Ashley, R.; Jack, A. Experience and extensions to the ASM2 family of models. Water Sci.Technol. 2002, 45, 177–186. [CrossRef]
29. Rosen, C.; Larsson, M.; Jeppsson, U.; Yuan, Z. A framework for extreme-event control in wastewatertreatment. Water Sci. Technol. 2002, 45, 299–308. [CrossRef]
30. Yamashita, T.; Shiraishi, M.; Yokoyama, H.; Ogino, A.; Yamamoto-Ikemoto, R.; Osada, T. Evaluation of theNitrous Oxide Emission Reduction Potential of an Aerobic Bioreactor Packed with Carbon Fibres for SwineWastewater Treatment. Energies 2019, 12, 1013. [CrossRef]
31. Smol, M.; Włodarczyk-Makuła, M. Effectiveness in the Removal of Polycyclic Aromatic HydrocarbonsFromIndustrial Wastewater by Ultrafiltration Technique. Arch. Environ. Prot. 2013, 38, 49–58. [CrossRef]

Energies 2020, 13, 3338 41 of 41
32. Drewnowski, J.; Remiszewska-Skwarek, A.; Duda, S.; Łagód, G. Aeration Process in Bioreactors as theMain Energy Consumer in a Wastewater Treatment Plant. Review of Solutions and Methods of ProcessOptimization. Processes 2019, 7, 311. [CrossRef]
33. Santos-Clotas, E.; Cabrera-Codony, A.; Castillo, A.; Martín, M.J.; Poch, M.; Monclús, H. EnvironmentalDecision Support System for Biogas Upgrading to Feasible Fuel. Energies 2019, 12, 1546. [CrossRef]
34. Godo-Pla, L.; Emiliano, P.; Valero, F.; Poch, M.; Sin, G.; Monclús, H. Predicting the oxidant demand infull-scale drinking water treatment using an artificial neural network: Uncertainty and sensitivity analysis.Process Saf. Environ. 2019, 125, 317–327. [CrossRef]
35. Garrido-Baserba, M.; Reif, R.; Hernández, F.; Poch, M. Implementation of a knowledge-based methodology ina decision support system for the design of suitable wastewater treatment process flow diagrams. J. Environ.Manag. 2012, 112, 384–391. [CrossRef]
36. Drewnowski, J. Advanced supervisory control system implemented at full-scale WWTP—A case study ofoptimization and energy balance improvement. Water 2019, 11, 121. [CrossRef]
© 2020 by the authors. Licensee MDPI, Basel, Switzerland. This article is an open accessarticle distributed under the terms and conditions of the Creative Commons Attribution(CC BY) license (http://creativecommons.org/licenses/by/4.0/).
Related Documents