© Hitachi, Ltd. 2018. All rights reserved. Smart and sustainable urban transportation for ASEAN region Hitachi India Pvt. Ltd. Nov. 27 th 2018 Dr. Ritesh Kumar Kalle

Welcome message from author
This document is posted to help you gain knowledge. Please leave a comment to let me know what you think about it! Share it to your friends and learn new things together.
Transcript
© Hitachi, Ltd. 2018. All rights reserved.
Smart and sustainable urban
transportation for ASEAN region
Hitachi India Pvt. Ltd.
Nov. 27th 2018
Dr. Ritesh Kumar Kalle

© Hitachi, Ltd. 2018. All rights reserved.
Contents
1
1. Introduction
2. Research Focus and Key Technologies
3. Public Transport Optimization
4. Video Analytics for City Traffic Control
5. Conclusion

© Hitachi, Ltd. 2018. All rights reserved.
1-1. Introduction
Contribute to ASEAN and India by developing smart and sustainable urban transportation
2
© Hitachi, Ltd. 2018. All rights reserved.
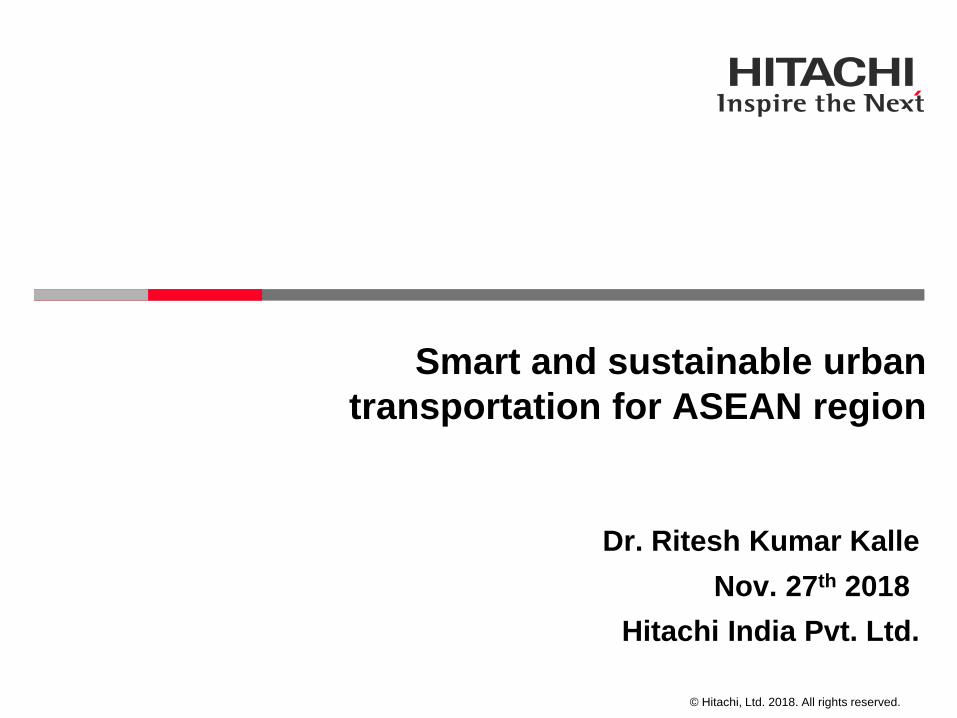
2-1. Research Focus and Key Technologies
3
CameraGPS
SENSIN
G
a b c d
IoT Data Sources
GPS
GPS devices
GPS
SmartphoneApp
CameraVideo dataCDR
GPS
Traffic congestion info.
ANA
LYSIS
Person trip analysisIn-bus crowd analysis Bus Schedule SimulationBus Operation analysisVehicle type classification
1. Visualize: Intuitive visualization of bus operations through IoT analytics combining
traffic congestion, people mobility and spatio-temporal demand variations.
2. Analyze: Analytics on heterogenous information sources such as in-vehicle video,
roadside camera, Automatic Fare Collection System (AFCS), road quality
information, GPS and trip schedules to generate Key Performance Indicators (KPI)
3. Optimize: Impact assessment of traffic events, modeling and simulation of route
networks to generate optimal schedules.
© Hitachi India Pvt. Ltd. 2018. All rights reserved.
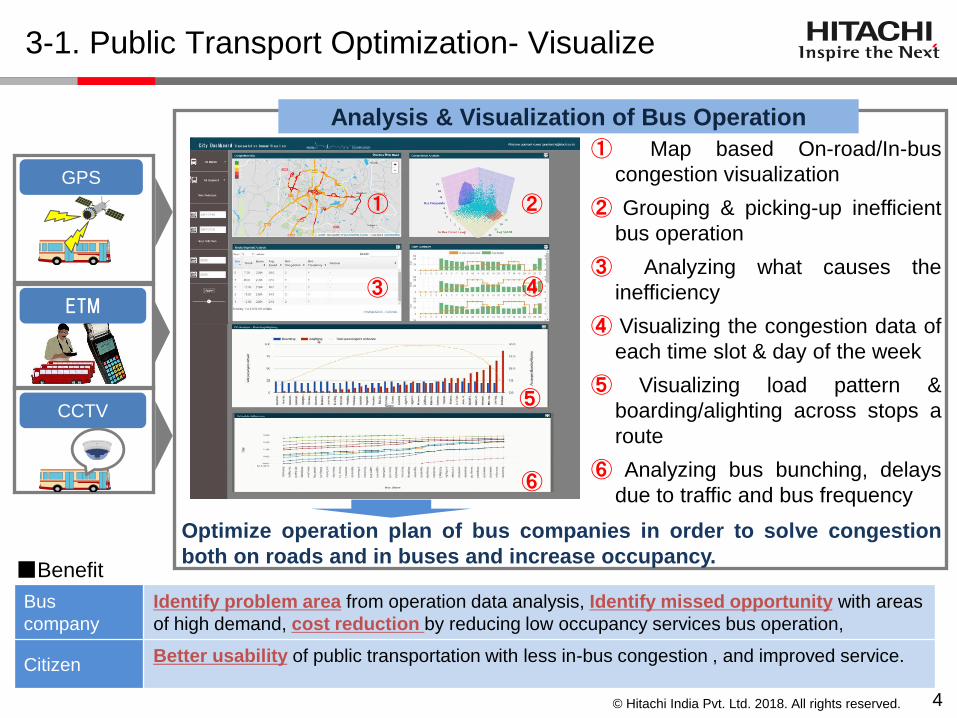
3-1. Public Transport Optimization- Visualize
Bus
company
Identify problem area from operation data analysis, Identify missed opportunity with areas
of high demand, cost reduction by reducing low occupancy services bus operation,
CitizenBetter usability of public transportation with less in-bus congestion , and improved service.
■Benefit
GPS
CCTV
① Map based On-road/In-bus
congestion visualization
② Grouping & picking-up inefficient
bus operation
③ Analyzing what causes the
inefficiency
④ Visualizing the congestion data of
each time slot & day of the week
⑤ Visualizing load pattern &
boarding/alighting across stops a
route
⑥ Analyzing bus bunching, delays
due to traffic and bus frequency
① ②
③ ④
Analysis & Visualization of Bus Operation
Optimize operation plan of bus companies in order to solve congestion
both on roads and in buses and increase occupancy.
ETM
⑥
⑤
4
© Hitachi India Pvt. Ltd. 2018. All rights reserved. 5
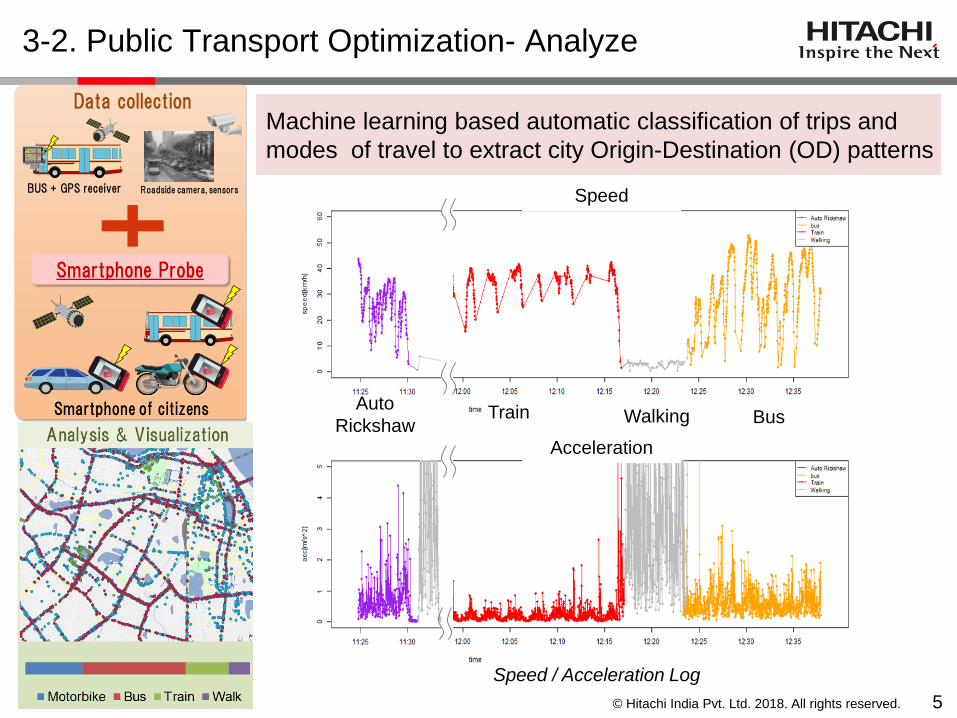
3-2. Public Transport Optimization- Analyze
9
Roadside camera, sensors
Data collection Analysis & Visualization
BUS + GPS receiver
Smartphone of citizens
Smartphone Probe
Motorbike Bus Train Walk
Speed / Acceleration Log
Acceleration
Speed
Auto
RickshawTrain BusWalking
Machine learning based automatic classification of trips and
modes of travel to extract city Origin-Destination (OD) patterns

© Hitachi India Pvt. Ltd. 2018. All rights reserved. 6
3-3. Public Transport Optimization- Crowd Analysis
❑ Solution:
▪ Train an Image Classification CNN to classify input image to one of 5 levels
▪ Resultant density level is useful for planning, optimization of routes
❑ Evaluation:
▪ Accuracy - We achieved on an average 80% and above on real world city
bus services videos
Input image Trained CNN for Classification
L1: Empty or few passengerL2: Few occupied seatsL3: Few standingL4: Fully occupied, standingL5: Heavily crowded
Results Computed on Server
Passenger density analysis with deep learning to analyze spatio-temporal ridership
CNN: Convolutional Neural Network

© Hitachi India Pvt. Ltd. 2018. All rights reserved. 7
3-4. Public Transport Optimization- Passenger counting
Idea: Light weight algorithm
Deploy on OBU (i.e., on-board unit in bus)
To detect and count passenger in-flow and out-flow i.e., boarding, alighting at each stop.
Cam1 Cam2
Day & night time cases
Single/multiple boarding alighting
Includes reflection, shadow, occlusion …
Typical test scenarios considered are:
Accuracy range 75~90% tested over 90+ videosFixed analog
CCTVResolution 352x28812 fps framerateCCD image sensor PAL video formatDay/Night colour camera
❑ Solution: To detect and count passenger in-flow and out-flow i.e., boarding and
alighting at each bus stop. Portion of image focused at door will be analysed.
Input image
Computer Vision based passenger count measurement
Passenger In-flow & Out-flow count value
MotionDetection &Blob Extraction
Motion Tracking &
Counting Decision
© Hitachi India Pvt. Ltd. 2018. All rights reserved.
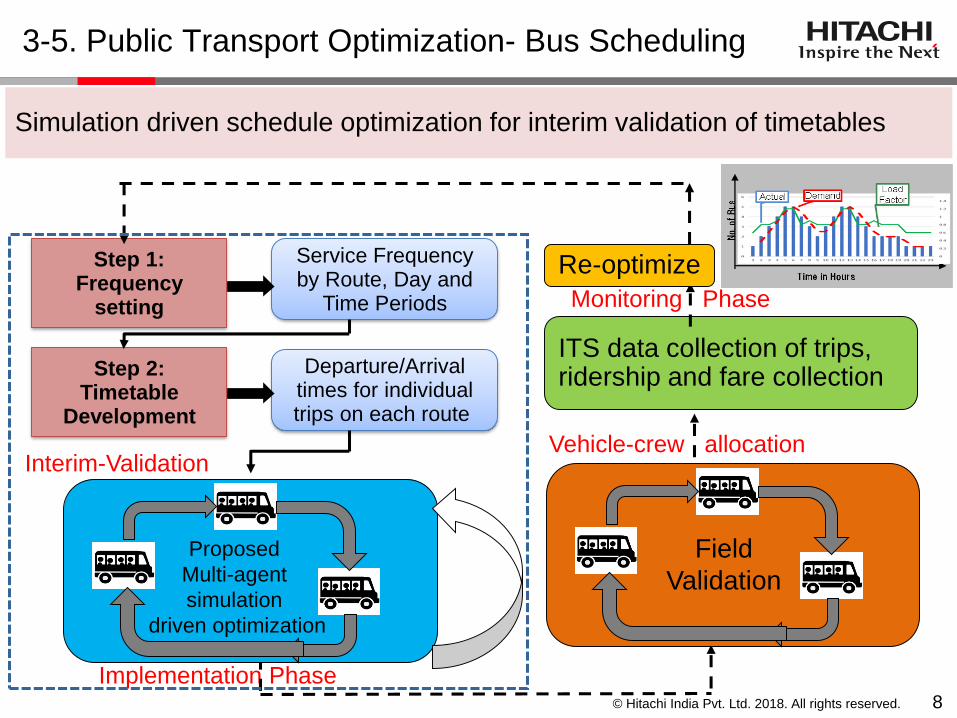
3-5. Public Transport Optimization- Bus Scheduling
8
Simulation driven schedule optimization for interim validation of timetables
Step 1: Frequency
setting
Step 2: Timetable
Development
Service Frequency by Route, Day and
Time Periods
Departure/Arrival times for individual trips on each route
Implementation Phase
Field
Validation
ITS data collection of trips, ridership and fare collection
Monitoring Phase
Re-optimize
Proposed
Multi-agent
simulation
driven optimization
Interim-ValidationVehicle-crew allocation
© Hitachi India Pvt. Ltd. 2018. All rights reserved. 9
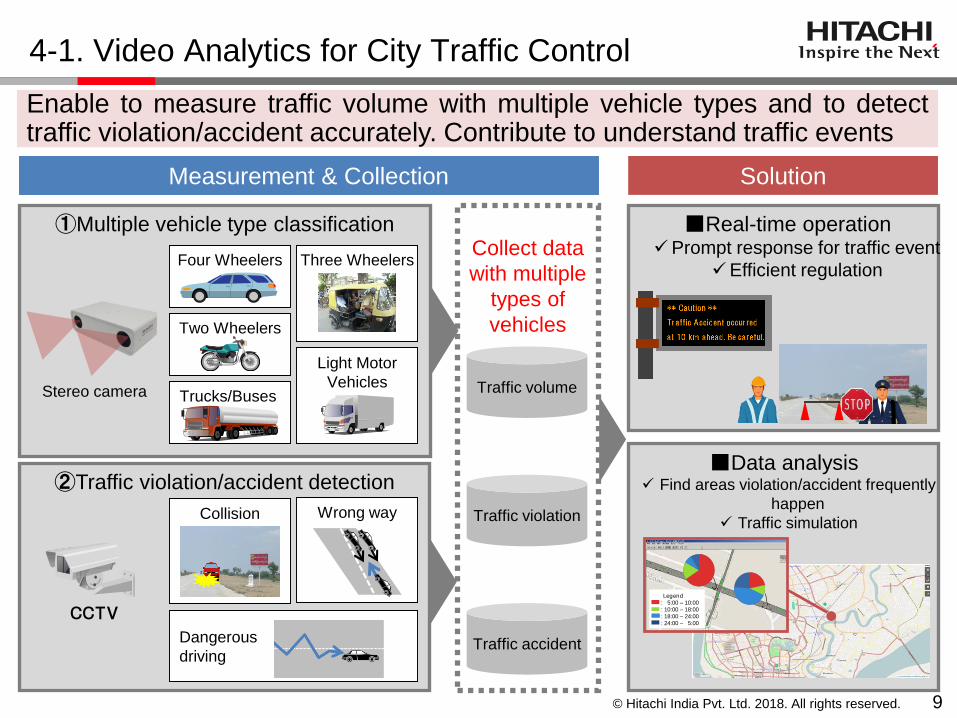
4-1. Video Analytics for City Traffic Control
Enable to measure traffic volume with multiple vehicle types and to detecttraffic violation/accident accurately. Contribute to understand traffic events
Solution
①Multiple vehicle type classification
②Traffic violation/accident detection
Measurement & Collection
Traffic volume
Traffic violation
Traffic accident
Collect data
with multiple
types of
vehicles
■Real-time operation✓Prompt response for traffic event
✓Efficient regulation
■Data analysis✓ Find areas violation/accident frequently
happen
✓ Traffic simulation
Four Wheelers Three Wheelers
Two Wheelers
Light Motor
VehiclesTrucks/Buses
Collision Wrong way
Dangerous
driving
Stereo camera
CCTV
Legend
: 5:00 – 10:00
: 10:00 – 18:00
: 18:00 – 24:00
: 24:00 – 5:00
© Hitachi India Pvt. Ltd. 2018. All rights reserved. 10
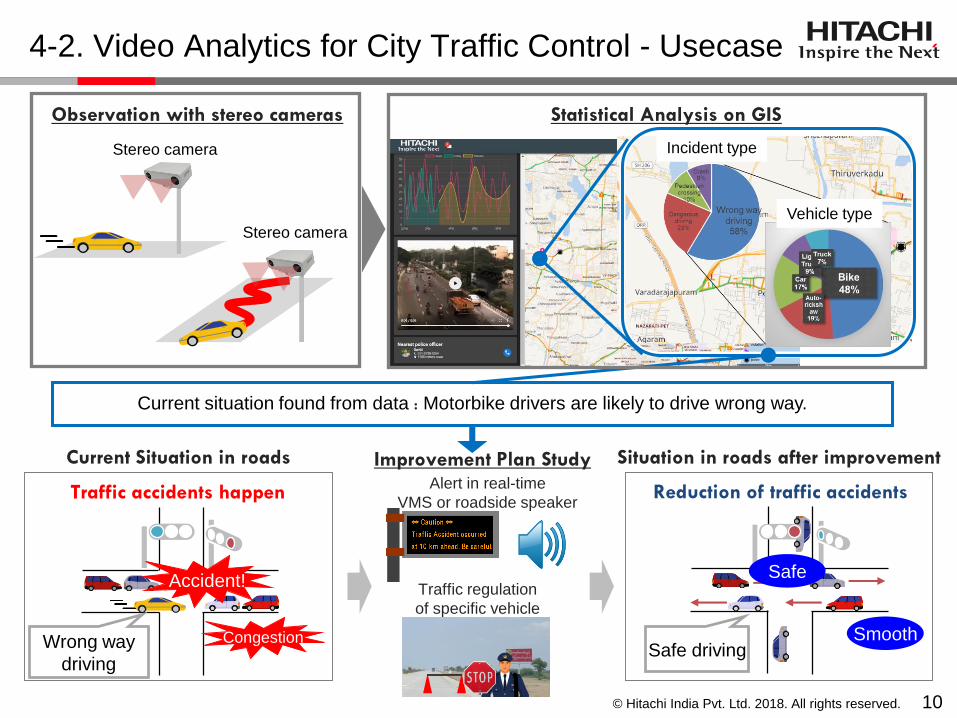
Statistical Analysis on GISObservation with stereo cameras
Stereo camera
Current situation found from data : Motorbike drivers are likely to drive wrong way.
Congestion Smooth
Improvement Plan StudyCurrent Situation in roads Situation in roads after improvement
Stereo camera
Wrong way
driving
SafeAccident!
Safe driving
Incident type
Vehicle type
Alert in real-time
VMS or roadside speaker
Traffic regulation
of specific vehicle
Reduction of traffic accidentsTraffic accidents happen
4-2. Video Analytics for City Traffic Control - Usecase
© Hitachi India Pvt. Ltd. 2018. All rights reserved.
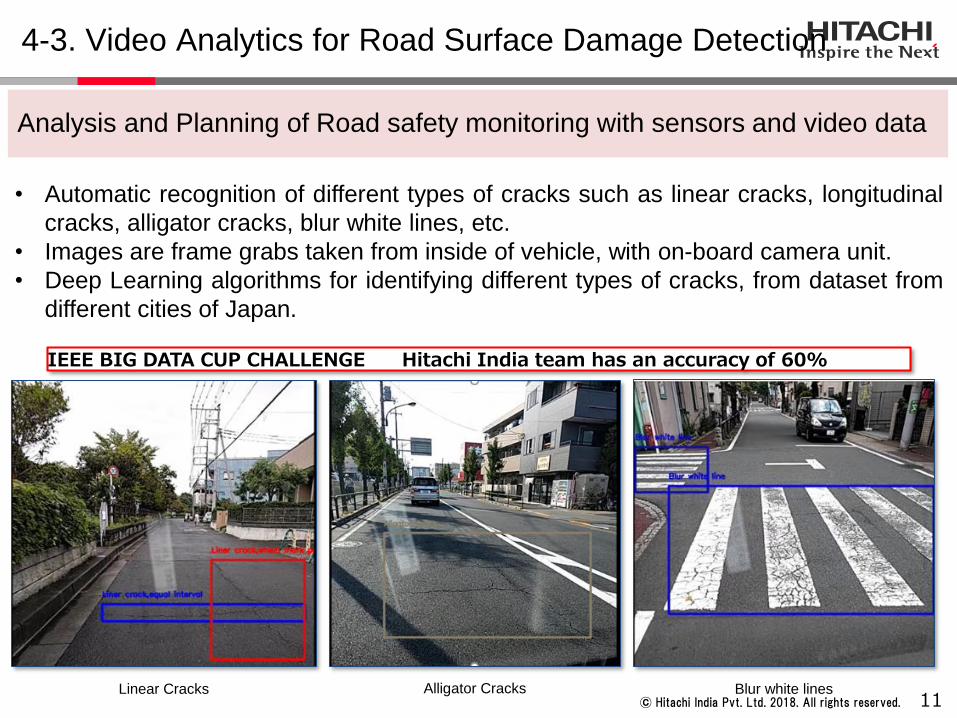
4-3. Video Analytics for Road Surface Damage Detection
11
Analysis and Planning of Road safety monitoring with sensors and video data
• Automatic recognition of different types of cracks such as linear cracks, longitudinal
cracks, alligator cracks, blur white lines, etc.
• Images are frame grabs taken from inside of vehicle, with on-board camera unit.
• Deep Learning algorithms for identifying different types of cracks, from dataset from
different cities of Japan.
Linear Cracks Alligator Cracks Blur white lines
IEEE BIG DATA CUP CHALLENGE Hitachi India team has an accuracy of 60%
© Hitachi India Pvt. Ltd. 2018. All rights reserved.
5. Conclusion
12
• Hitachi’s technologies for smart, sustainable urban transportation
including visualization and optimization are introduced.
• City traffic and road video analytics to monitor passenger flow in
vehicles and on-road incident analysis.
• Through collaboration and proof of concept (PoC) opportunities
we hope to expand research and development activities in urban
transport for ASEAN region.

Related Documents