ETHIOPIAN DEVELOPMENT RESEARCH INSTITUTE Smallholders and upstream transformation in global value chains: The case of coffee producers in Ethiopia Bart Minten, Mekdim Dereje, Ermias Engida, and Tadesse Kuma Ethiopian Development Research Institute May 29th, 2015 1

Smallholders and upstream transformation in global value chains: The case of coffee producers in Ethiopia
Jul 25, 2015
Welcome message from author
This document is posted to help you gain knowledge. Please leave a comment to let me know what you think about it! Share it to your friends and learn new things together.
Transcript
ETHIOPIAN DEVELOPMENT RESEARCH INSTITUTE
Smallholders and upstream transformation in global value chains:
The case of coffee producers in Ethiopia
Bart Minten, Mekdim Dereje, Ermias Engida, and Tadesse Kuma
Ethiopian Development Research Institute May 29th, 2015
1
2
Outline
1. Introduction2. Background coffee sector3. Data4. Changes in production practices5. Changes in harvest and post-harvest practices6. Changes in marketing7. Changes in processing8. Improved practices and prices9. Drivers and constraints to change10. Conclusions
3
1. Introduction
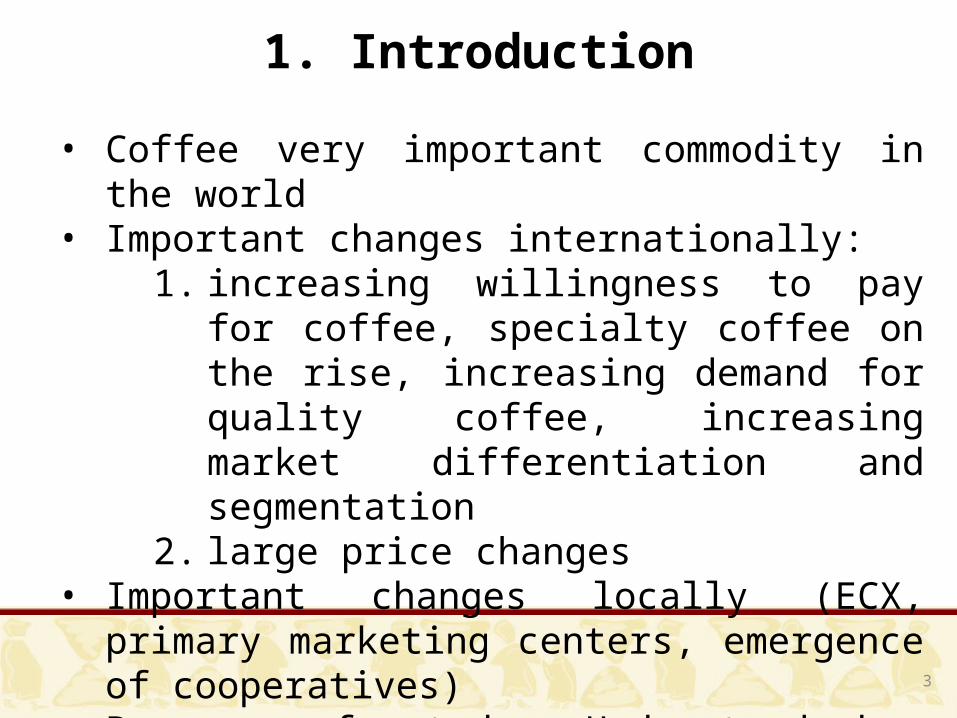
• Coffee very important commodity in the world• Important changes internationally:
1. increasing willingness to pay for coffee, specialty coffee on the rise, increasing demand for quality coffee, increasing market differentiation and segmentation
2. large price changes • Important changes locally (ECX, primary marketing
centers, emergence of cooperatives) • Purpose of study: Understand how production and
and marketing is changing upstream locally
4
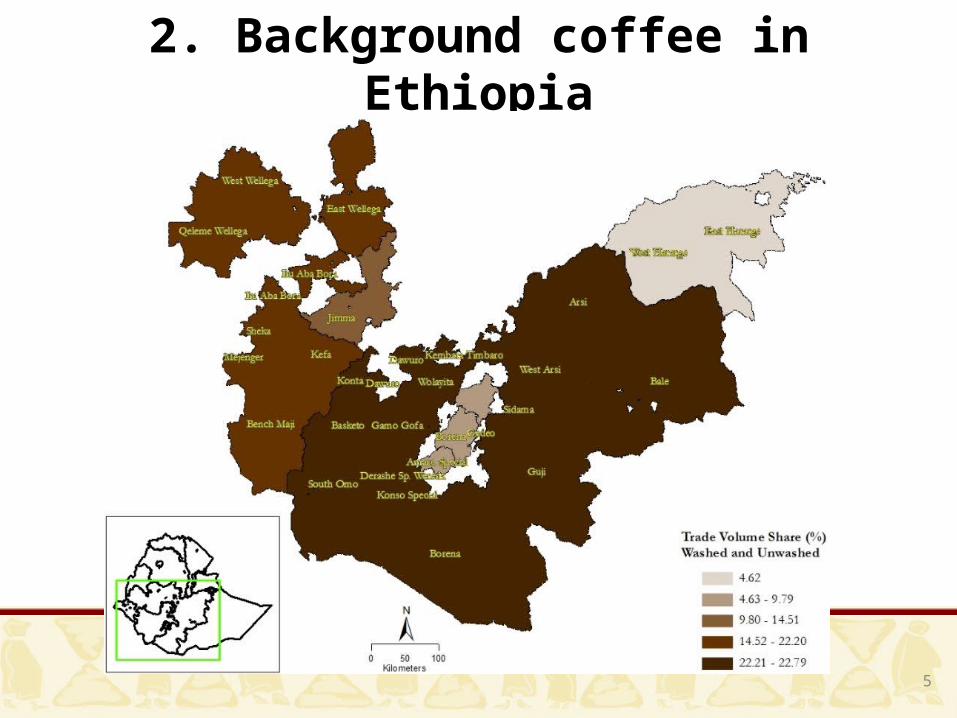
2. Background coffee in Ethiopia
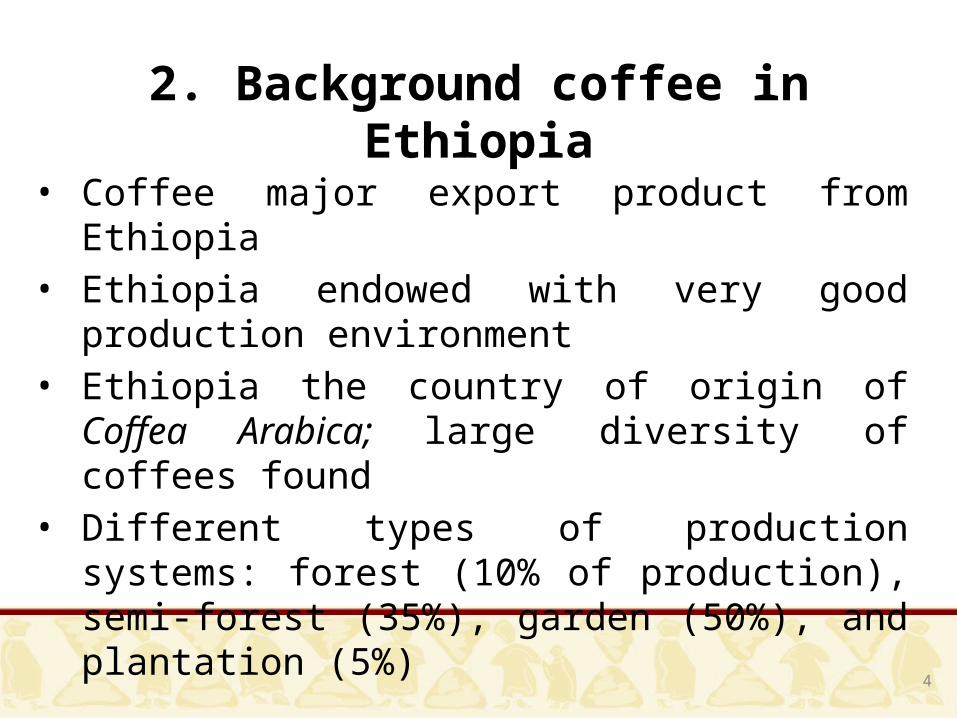
• Coffee major export product from Ethiopia• Ethiopia endowed with very good production
environment • Ethiopia the country of origin of Coffea Arabica; large
diversity of coffees found• Different types of production systems: forest (10% of
production), semi-forest (35%), garden (50%), and plantation (5%)
5
2. Background coffee in Ethiopia
6
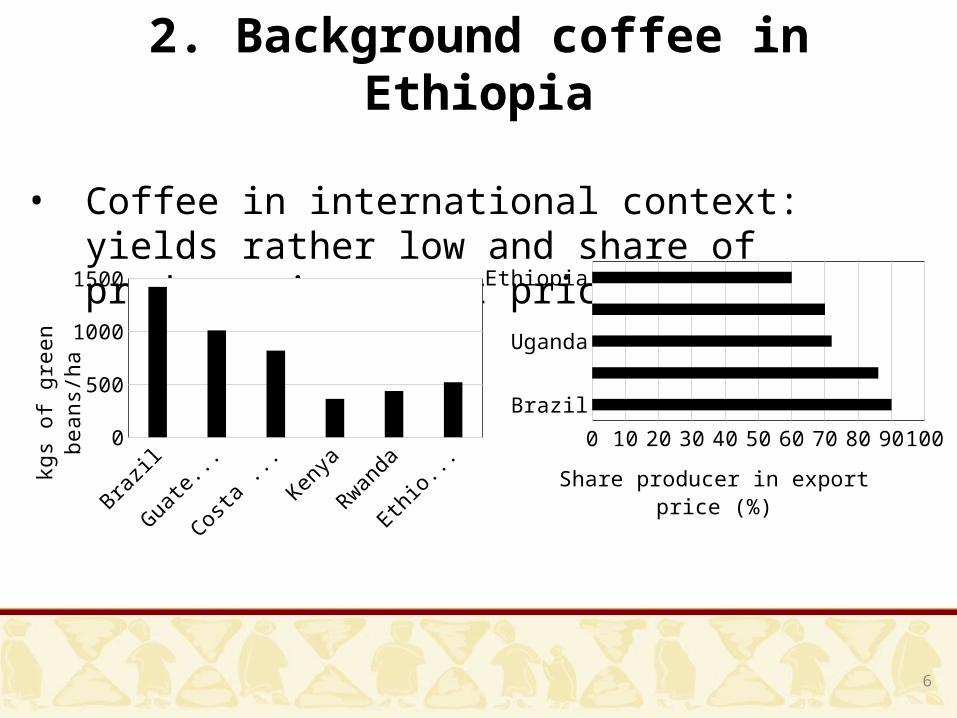
2. Background coffee in Ethiopia
• Coffee in international context: yields rather low and share of producer in export price also low
Brazil
Guatemala
Costa Rica
Kenya
Rwanda
Ethiopia
0
500
1000
1500
kgs o
f gre
en b
eans
/ha
Brazil
Columbia
Uganda
Kenya
Ethiopia
0 10 20 30 40 50 60 70 80 90 100
Share producer in export price (%)
7
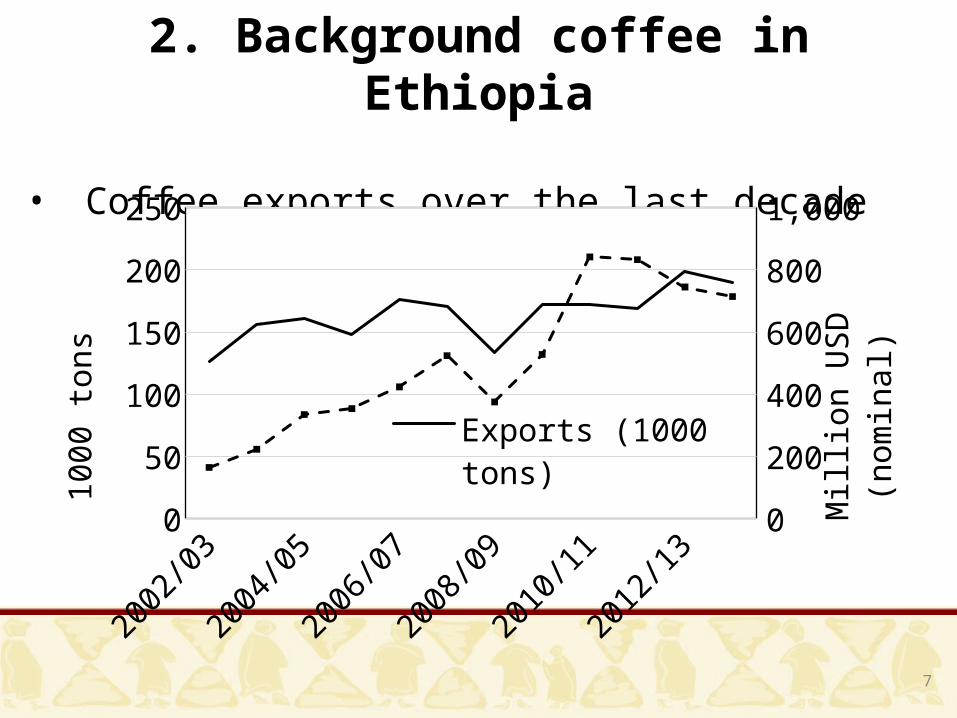
2. Background coffee in Ethiopia
• Coffee exports over the last decade
2002/03
2003/04
2004/05
2005/06
2006/07
2007/08
2008/09
2009/10
2010/11
2011/12
2012/13
2013/14
0
50
100
150
200
250
0100200300400500600700800900
Exports (1000 tons)Value exports (million USD)
1000
tons
Mill
ion
USD
(nom
inal
)
8
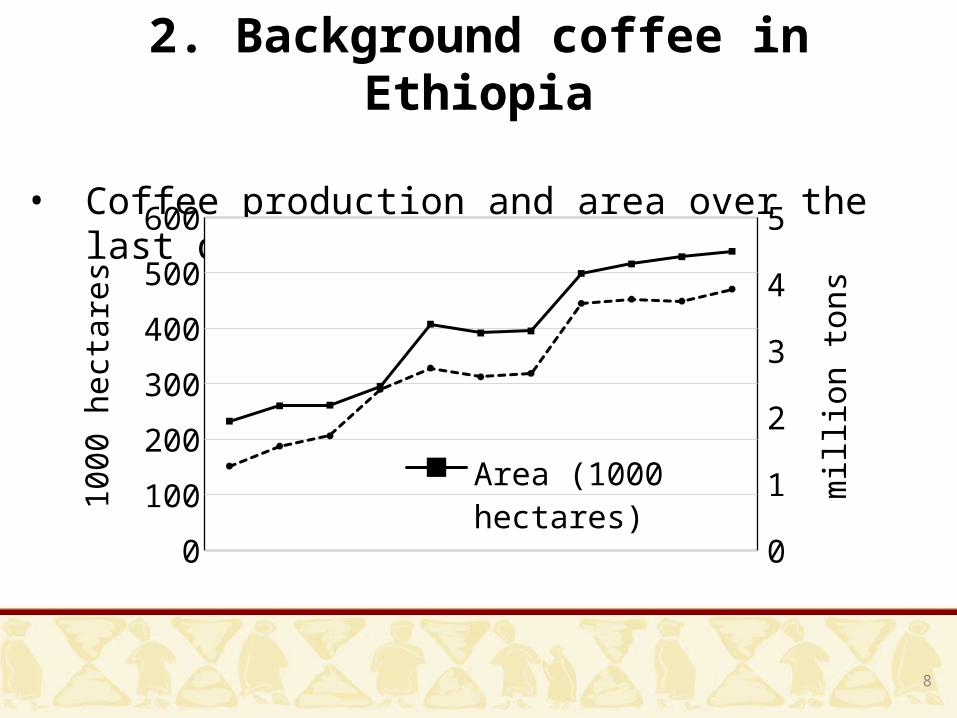
2. Background coffee in Ethiopia
• Coffee production and area over the last decade
2003/04
2004/05
2005/06
2006/07
2007/08
2008/09
2009/10
2010/11
2011/12
2012/13
2013/14
0
100
200
300
400
500
600
00.511.522.533.544.5
Area (1000 hectares)Production (million tons)10
00 h
ecta
res
mill
ion
tons
9
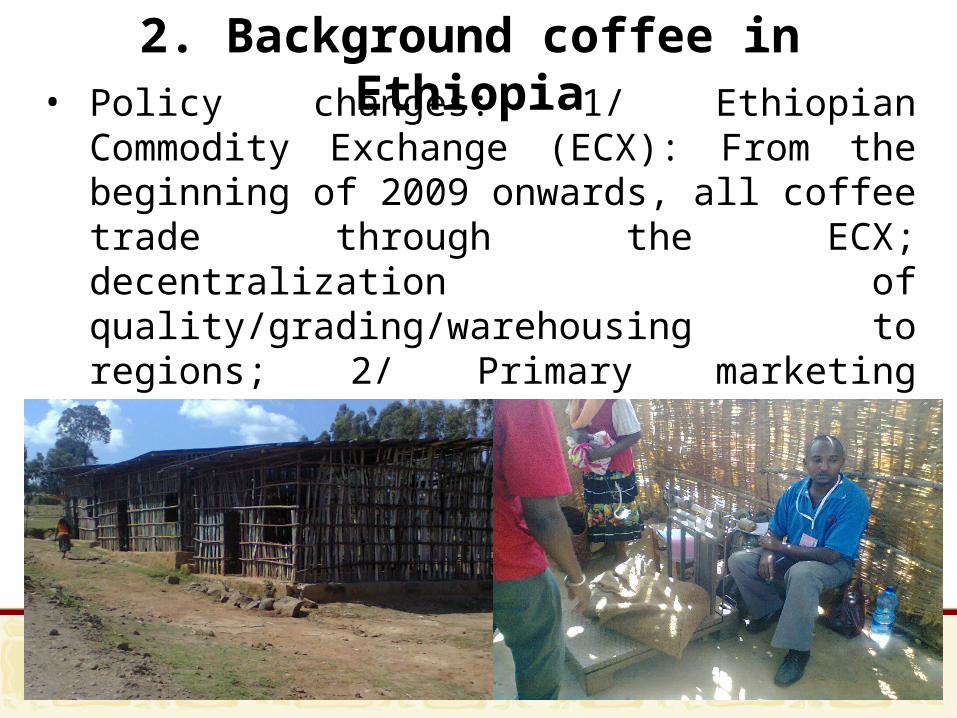
2. Background coffee in Ethiopia• Policy changes: 1/ Ethiopian Commodity Exchange
(ECX): From the beginning of 2009 onwards, all coffee trade through the ECX; decentralization of quality/grading/warehousing to regions; 2/ Primary marketing (transaction) centers: All coffee should be traded on these centers (only licensed agents, fenced markets, sheds for different buyers)

3. Data • Focus on the major 12 coffee producing zones. 5
strata based on the 5 coffee varieties of Ethiopia, i.e. Sidama (Sidama/Borena), Yirgachefe (Guji/Gideo), Jimma (Jimma/IluAbaBora/Bench Maji/Sheka), Nekemte (West/Qeleme Wollega) and Harar (West/East Hararge)
• 16 kebeles from each variety (total of 80 kebeles) randomly selected
• Total of 1600 coffee farmers and 206 processors were randomly sampled with an even distribution among each variety (320 farmers each strata)
• Survey fielded in February 2014

3. Data
% of farmers Sidama Yirga-chef.
Jimma Nekemte Harar Total
Number interviewed 320 320 318 320 320 1,598
Total income (Birr/year) 26,118 32,221 25,796 16,445 24,004
25,577 Total agricultural income (Birr/year) 21,971 24,855 19,237 13,447 19,879
20,540
Total coffee income (Birr/year) 12,893 12,137 9,517 6,538 7,099 9,637Off-farm income (Birr/year) 4,147 7,366 6,560 2,998 4,125 5,037Total land owned in hectares 1.70 1.99 2.25 1.68 0.95 1.79Coffee area owned in hectares 0.98 1.09 1.08 0.86 0.33 0.92Cultivated coffee area in hectares 1.01 1.10 1.08 0.88 0.33 0.93
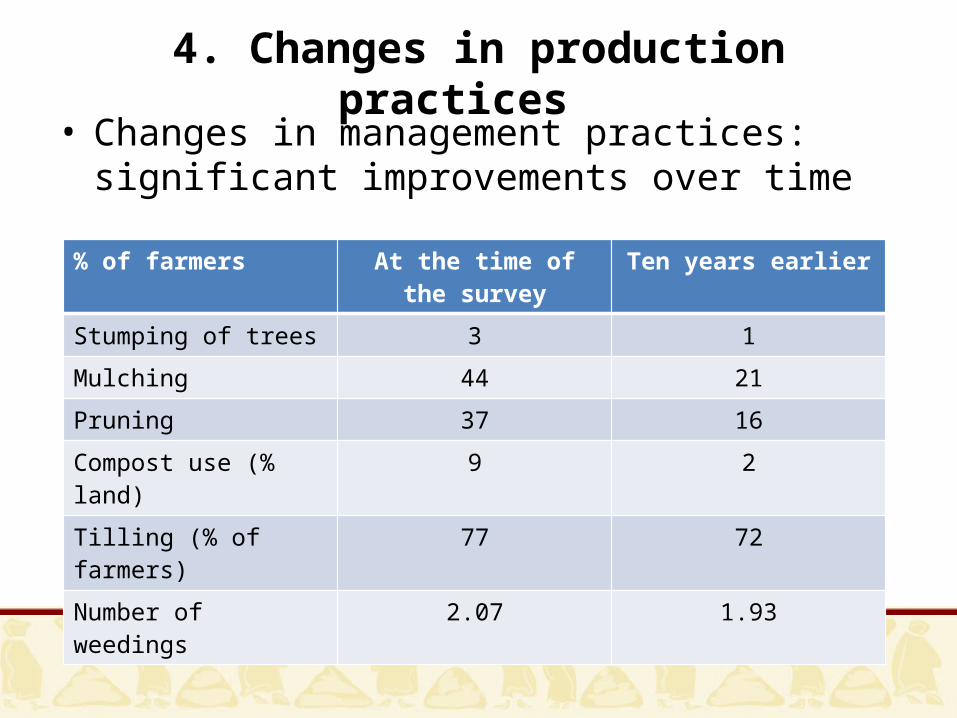
4. Changes in production practices
• Changes in management practices: significant improvements over time
% of farmers At the time of the survey Ten years earlierStumping of trees 3 1Mulching 44 21Pruning 37 16Compost use (% land) 9 2Tilling (% of farmers) 77 72Number of weedings 2.07 1.93
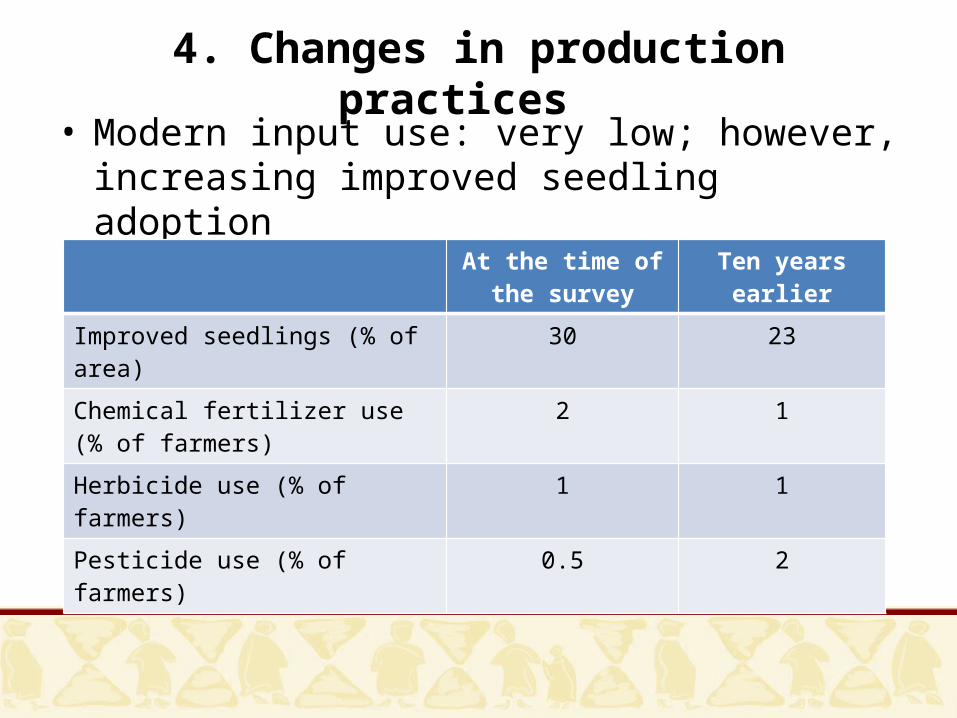
4. Changes in production practices
• Modern input use: very low; however, increasing improved seedling adoption
At the time of the survey
Ten years earlier
Improved seedlings (% of area) 30 23Chemical fertilizer use (% of farmers) 2 1Herbicide use (% of farmers) 1 1Pesticide use (% of farmers) 0.5 2

4. Changes in production practices
• Despite adoption of improved practices, we see few changes in yields (and strong declines in Nekemte and Harar)
Yields in whole dried cherries per hectare
At the time of the survey Ten years earlier
Sidama 8.2 7.2Yirgacheffe 6.9 6.6Jimma 10.7 10.5Nekemte 5.7 11.1Harar 6.9 11.9
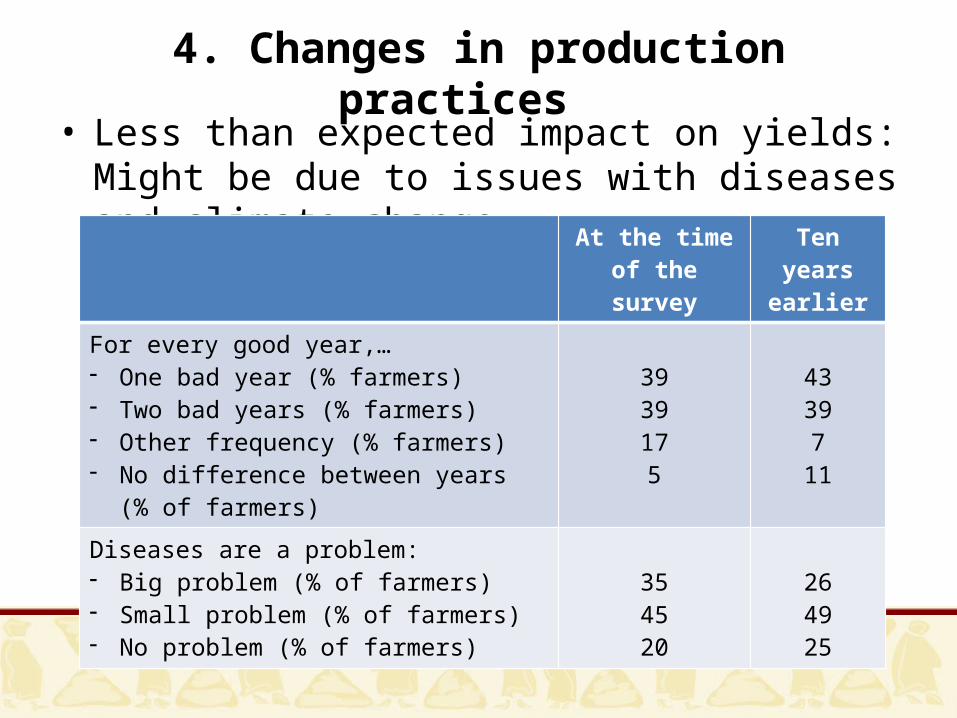
4. Changes in production practices
• Less than expected impact on yields: Might be due to issues with diseases and climate change
At the time of the survey
Ten years earlier
For every good year,…- One bad year (% farmers)- Two bad years (% farmers)- Other frequency (% farmers)- No difference between years (% of farmers)
3939175
43397
11
Diseases are a problem:- Big problem (% of farmers)- Small problem (% of farmers)- No problem (% of farmers)
354520
264925
4. Changes in production practices
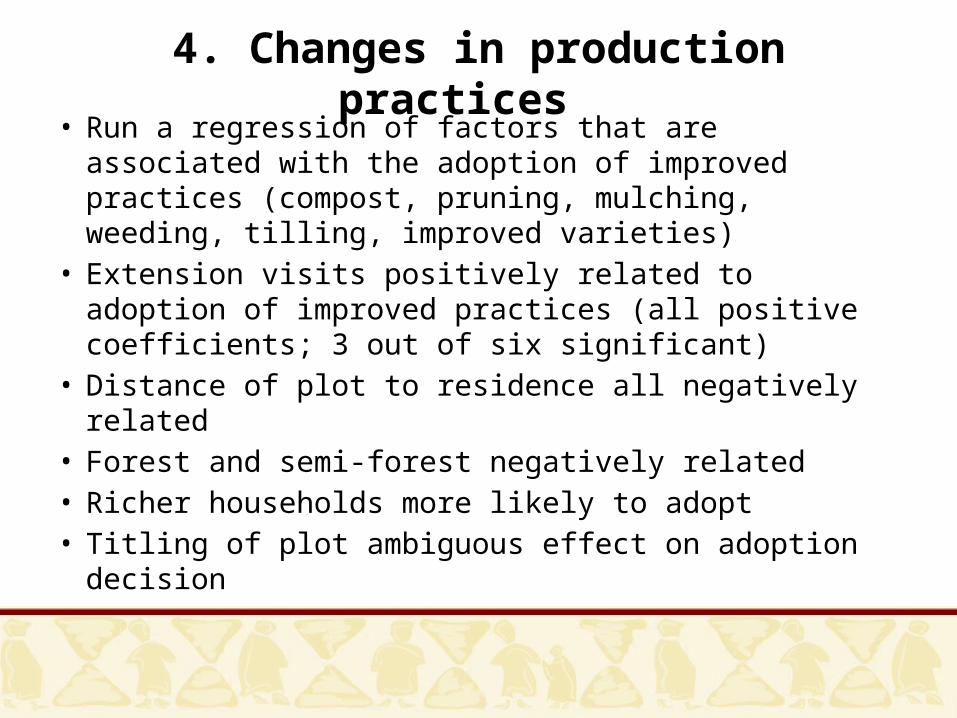
• Run a regression of factors that are associated with the adoption of improved practices (compost, pruning, mulching, weeding, tilling, improved varieties)
• Extension visits positively related to adoption of improved practices (all positive coefficients; 3 out of six significant)
• Distance of plot to residence all negatively related• Forest and semi-forest negatively related• Richer households more likely to adopt• Titling of plot ambiguous effect on adoption decision
4. Changes in production practices
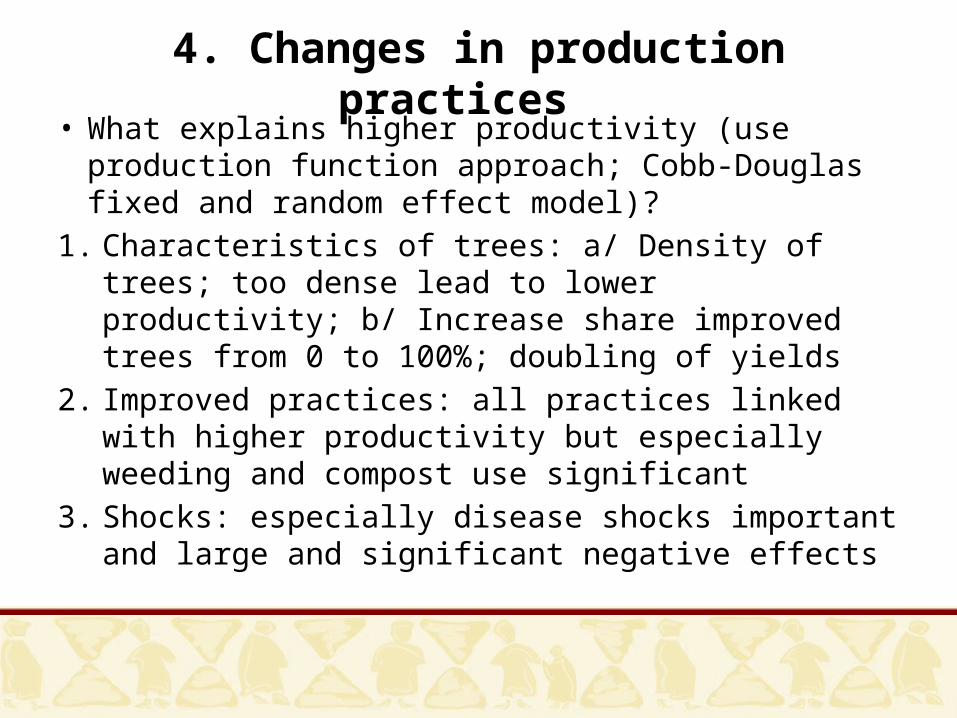
• What explains higher productivity (use production function approach; Cobb-Douglas fixed and random effect model)?
1. Characteristics of trees: a/ Density of trees; too dense lead to lower productivity; b/ Increase share improved trees from 0 to 100%; doubling of yields
2. Improved practices: all practices linked with higher productivity but especially weeding and compost use significant
3. Shocks: especially disease shocks important and large and significant negative effects
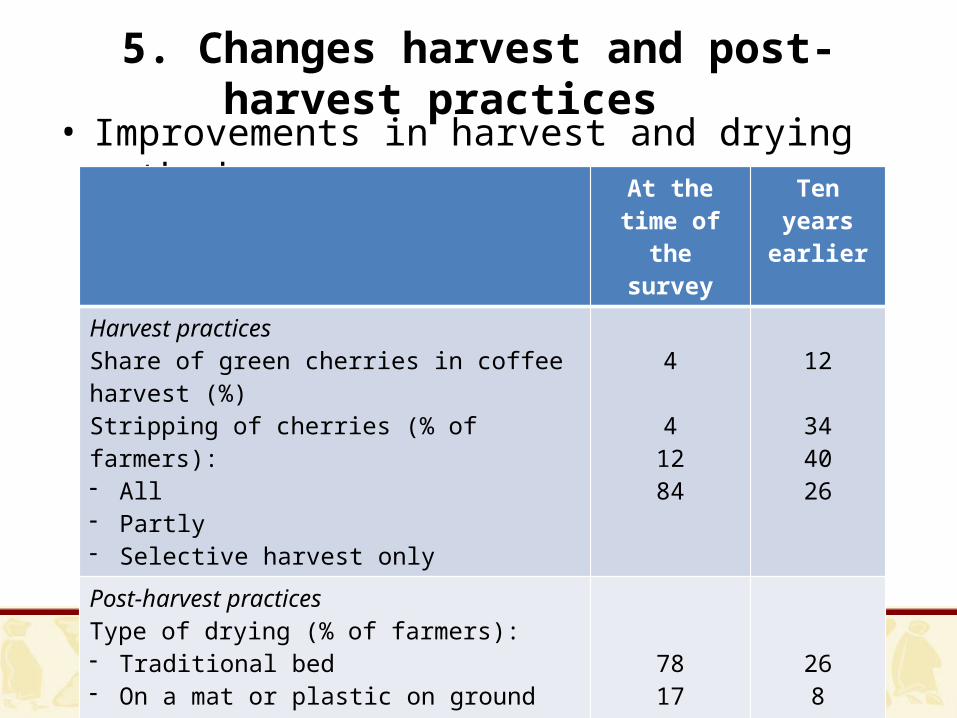
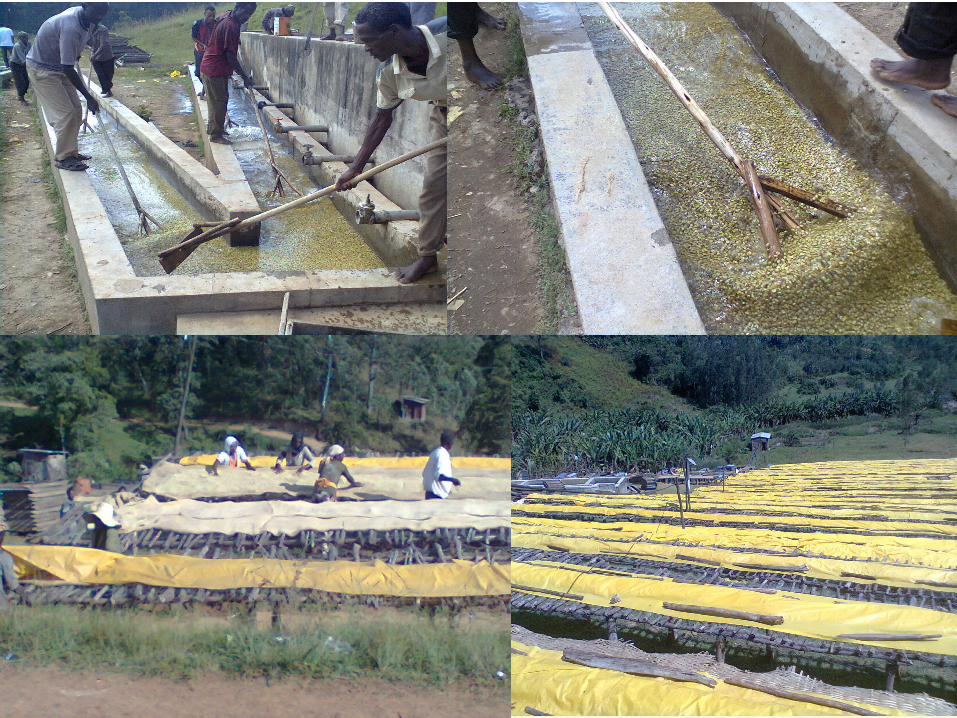
5. Changes harvest and post-harvest practices
• Improvements in harvest and drying methods At the time of
the surveyTen years
earlier
Harvest practicesShare of green cherries in coffee harvest (%)Stripping of cherries (% of farmers): - All- Partly- Selective harvest only
4
41284
12
344026
Post-harvest practicesType of drying (% of farmers):- Traditional bed- On a mat or plastic on ground- On bare ground- Other
781723
268
624
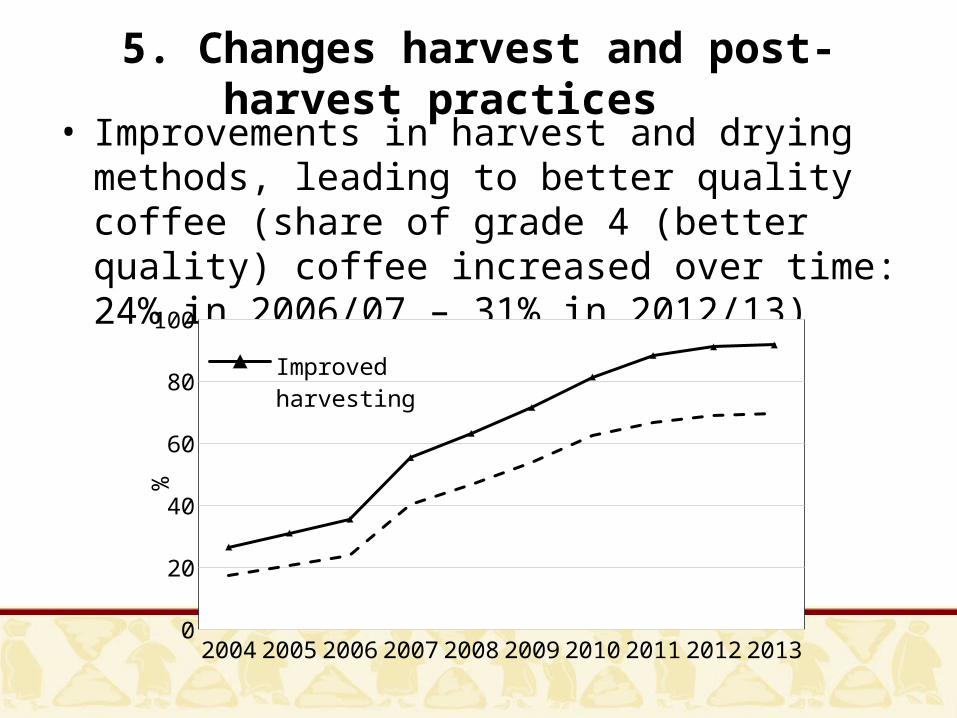
5. Changes harvest and post-harvest practices
• Improvements in harvest and drying methods, leading to better quality coffee (share of grade 4 (better quality) coffee increased over time: 24% in 2006/07 – 31% in 2012/13)
2004 2005 2006 2007 2008 2009 2010 2011 2012 20130
102030405060708090
100Improved harvestingImproved dry-ing
%

6. Changes in marketing
• Uneven implementation of policy of primary market centers: large differences by regions and coffee type
At the time of the survey
Primary marketing centers as place of sale of sales red cherries (%): - Sidama- Yirgacheffe- Jimma- Nekemte - Harar
80781400
Primary marketing centers as place of sale of sales (%): - Red cherries- Dry cherries
5621
6. Changes in marketing
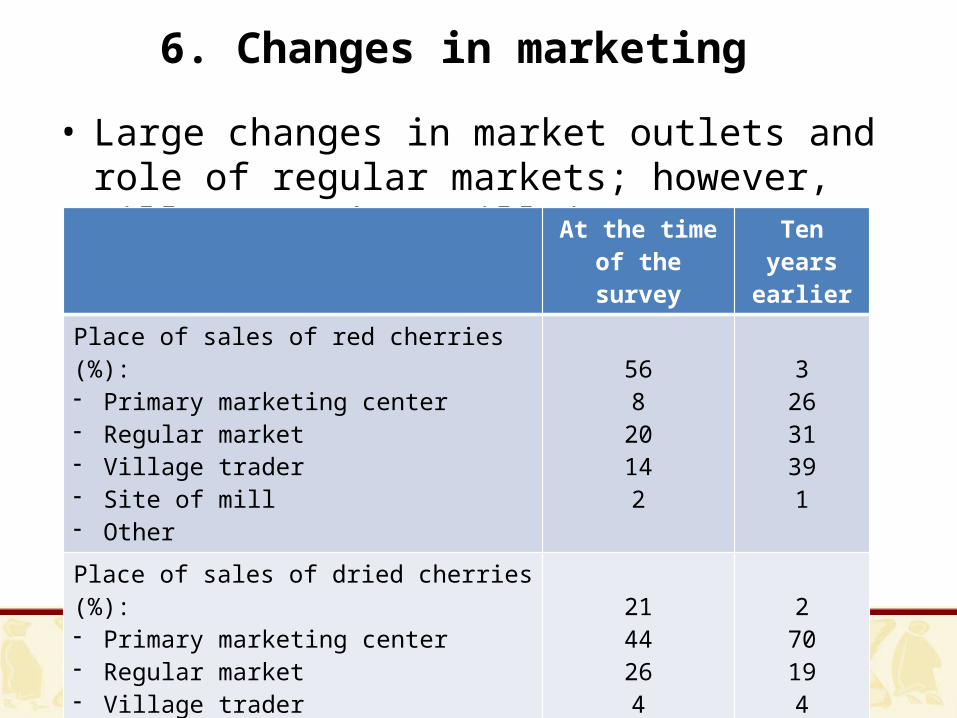
• Large changes in market outlets and role of regular markets; however, village trader still important
At the time of the survey
Ten years earlier
Place of sales of red cherries (%):- Primary marketing center- Regular market - Village trader- Site of mill- Other
568
20142
32631391
Place of sales of dried cherries (%):- Primary marketing center- Regular market - Village trader- Site of mill- Other
21442644
2701945

6. Changes in marketing
• Improvements in markets overall: farmers trust weighing traders more; have to walk less far; and have option of red berries sales
At the time of the survey
Ten years earlier
Average distance walked (in minutes) to sell:- Red cherries- Dried cherries
2760
4284
Farmer trust the weighing of the trader (%) 55 43
6. Changes in marketing
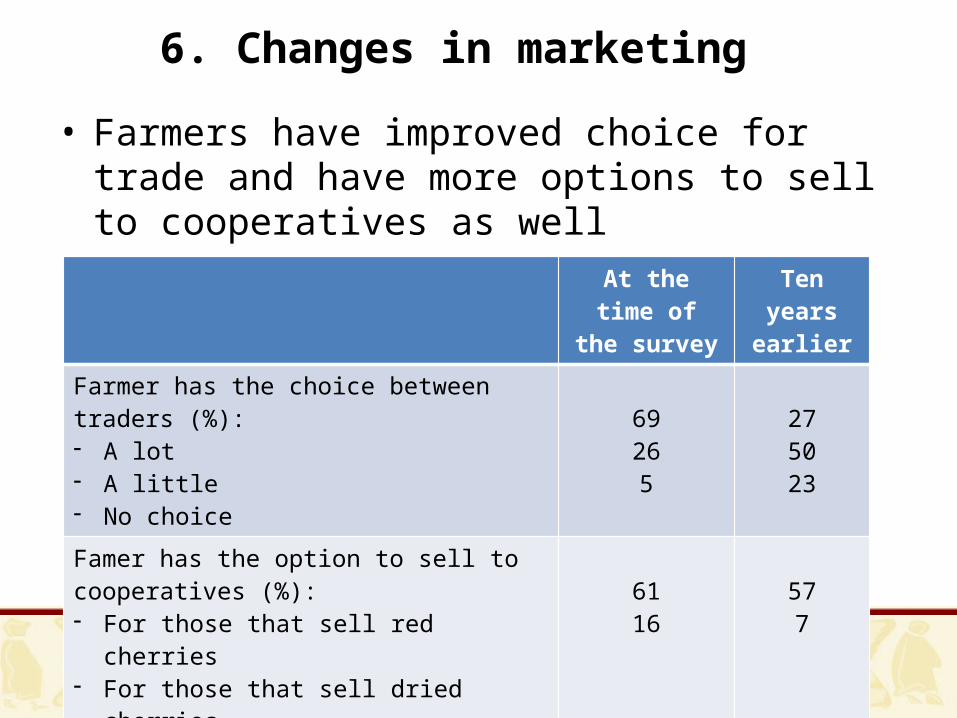
• Farmers have improved choice for trade and have more options to sell to cooperatives as well
At the time of the survey
Ten years earlier
Farmer has the choice between traders (%):- A lot- A little- No choice
69265
275023
Famer has the option to sell to cooperatives (%):- For those that sell red cherries - For those that sell dried cherries
6116
577
Share of cooperatives in total sales 11 7

6. Changes in marketing
• Price information has improved; however, few farmers have access to ECX information; price information does not lead to quality premiums
At the time of the survey
Ten years earlier
Price information- Farmer has access to price information from
radio (%) - Farmer has access to price information from
auction/ECX (%)
67
20
47
11
“Better quality coffee gets a premium”:- A lot (% of farmers)- A little (% of farmers)- No premium (% of farmers)
47
89
25
93

7. Changes in processing
• Washed coffee leads to higher export prices; increasing investments in wet mills over time
Number of wet mills in Sidama zone
19721975
19771979
19811983
19851987
19891991
19931995
19971999
20012003
20052007
20092011
0
50
100
150
200
250
300
350
cooperative Private PLC

7. Changes in processing
• Households have more options to sell to wet millsShare of households with option to sell to wet mills
2004 2005 2006 2007 2008 2009 2010 2011 2012 20130
102030405060708090
100
Yirgacheffe Jimma Nekempt Sidama
% o
f hou
seho
lds
7. Changes in processing
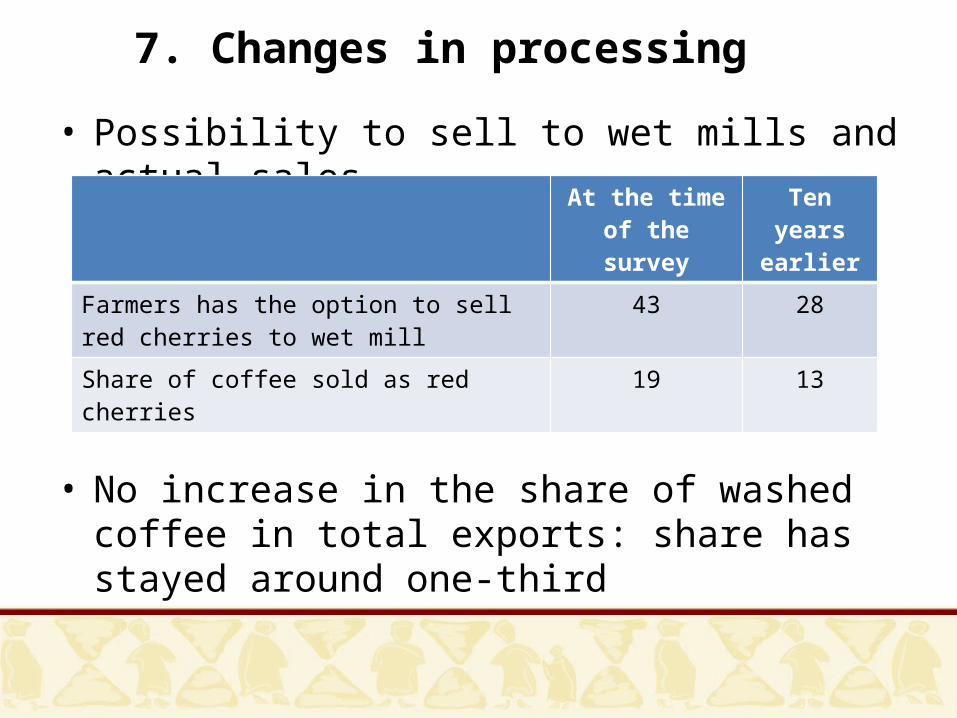
• Possibility to sell to wet mills and actual sales
• No increase in the share of washed coffee in total exports: share has stayed around one-third
At the time of the survey
Ten years earlier
Farmers has the option to sell red cherries to wet mill
43 28
Share of coffee sold as red cherries 19 13

8. Improved practices and prices
• Determinants of adoption of improved post-harvest practices (Selective harvesting; improved drying; share red cherries): 1/ Extension visits; 2/ Remoteness of the household; 3/ Distances to wet mills.
• Impact on prices (pooled regressions):- No impact of quantities sold on price- Red cherries: if mostly green, price is 10% lower- 7% lower price if dried on bare ground- Farmers with choice between traders 11% higher price- Lower prices for red cherries sold at the roadside; higher
prices for those sold at place of akrabi or cooperative; no significant difference in price between PMC and farmgate
9. Drivers and constraints to change
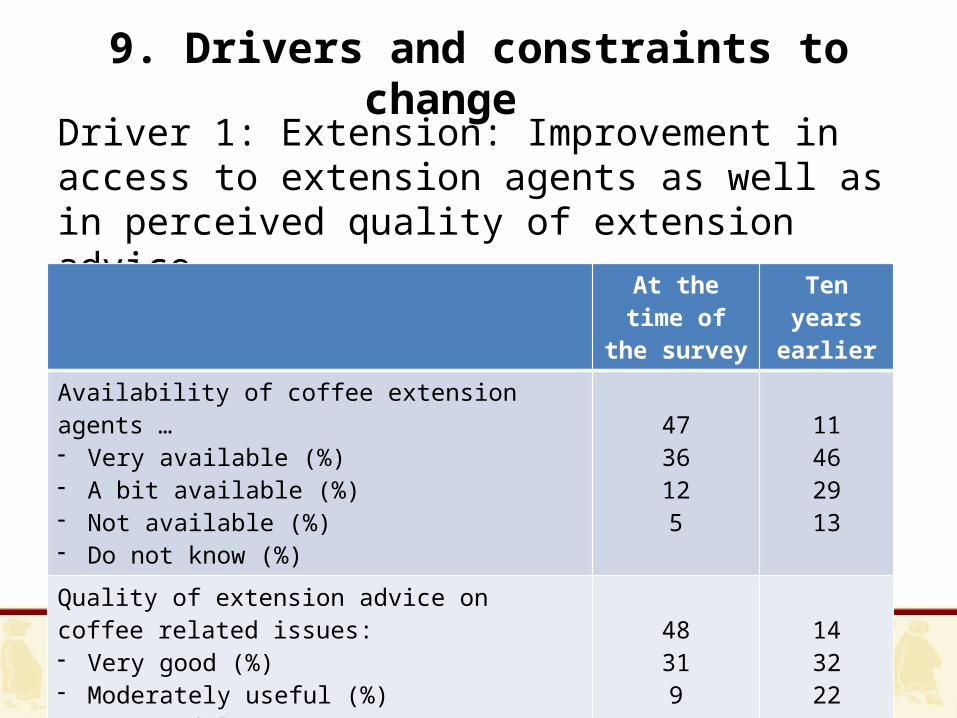
Driver 1: Extension: Improvement in access to extension agents as well as in perceived quality of extension advice
At the time of the survey
Ten years earlier
Availability of coffee extension agents …- Very available (%)- A bit available (%)- Not available (%)- Do not know (%)
4736125
11462913
Quality of extension advice on coffee related issues:- Very good (%)- Moderately useful (%)- Not useful (%)- Do not know (%)
48319
11
14322231
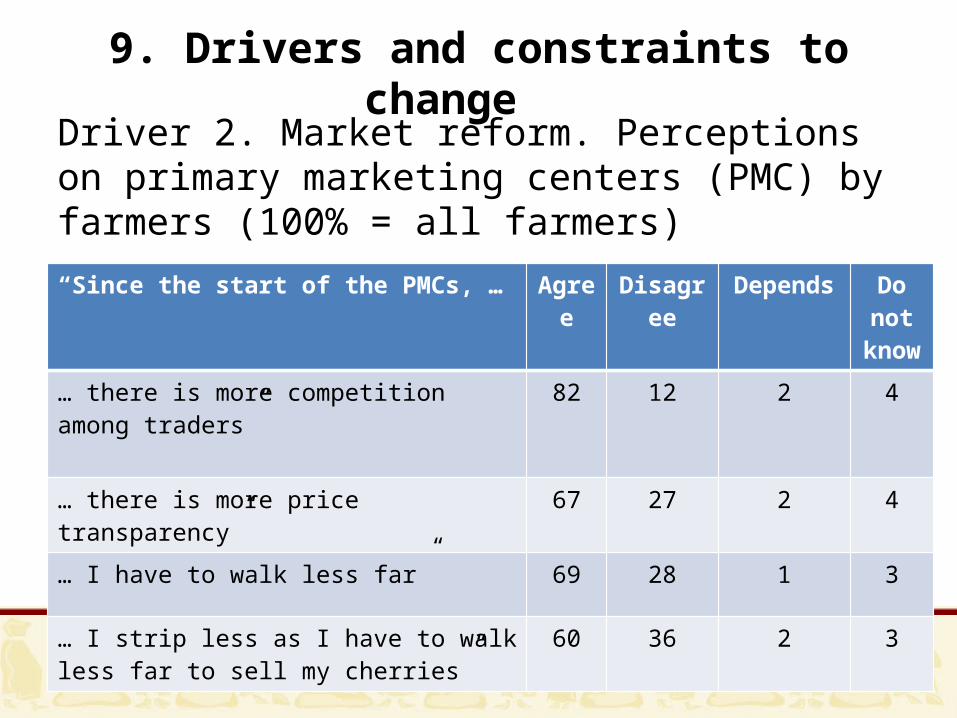
9. Drivers and constraints to change
Driver 2. Market reform. Perceptions on primary marketing centers (PMC) by farmers (100% = all farmers)“Since the start of the PMCs, … Agree Disagree Depends Do
not know
… there is more competition among traders” 82 12 2 4
… there is more price transparency” 67 27 2 4
… I have to walk less far” 69 28 1 3
… I strip less as I have to walk less far to sell my cherries”
60 36 2 3

9. Drivers and constraints to change
Driver 2. Market reform. However, some processors not happy
“Since the start of the PMCs, … Yes No Do not know
… the quality of procured red cherries has declined” 34 64 2
If yes, this is due to ….… The agents I use are not very capable in assessing the quality of coffee”
51
… The quality of cherries deteriorates during storage at the market”
60
… The quality of cherries deteriorates during transport to/from market”
69
… The time between procurement and processing is too long” 62
… Because of increased competition between akrabis, I am obliged to buy lower quality”
87

9. Drivers and constraints to change
Driver 3. Large price improvements over time
2004 2005 2006 2007 2008 2009 2010 2011 2012 2013 20140
50
100
150
200
250
300
producerexportNY/London price
year
US
cent
s per
lb.

9. Drivers and constraints to change
Driver 3. Price changes. Because of high prices, farmers consume less coffee themselves.
“When prices of coffee go up … Agree Disagree Depends Do not
know… I consume less coffee” 46 52 1 1
… I use coffee husks more to prepare coffee drinks”
35 63 1 0
… I use coffee leaves more” 15 85 1 0

9. Drivers and constraints to change
Constraint 1. Access to improved seedlings. Despite efforts, access to improved seedlings an issue.
Agree Disagree Depends Do not
know“Improved coffee varieties have higher yields than traditional varieties”
86 11 2 1
“ I do not trust the improved seedlings sold by the BoA”
24 73 1 2
“It is hard to find reliable improved coffee seedlings”
47 51 1 1
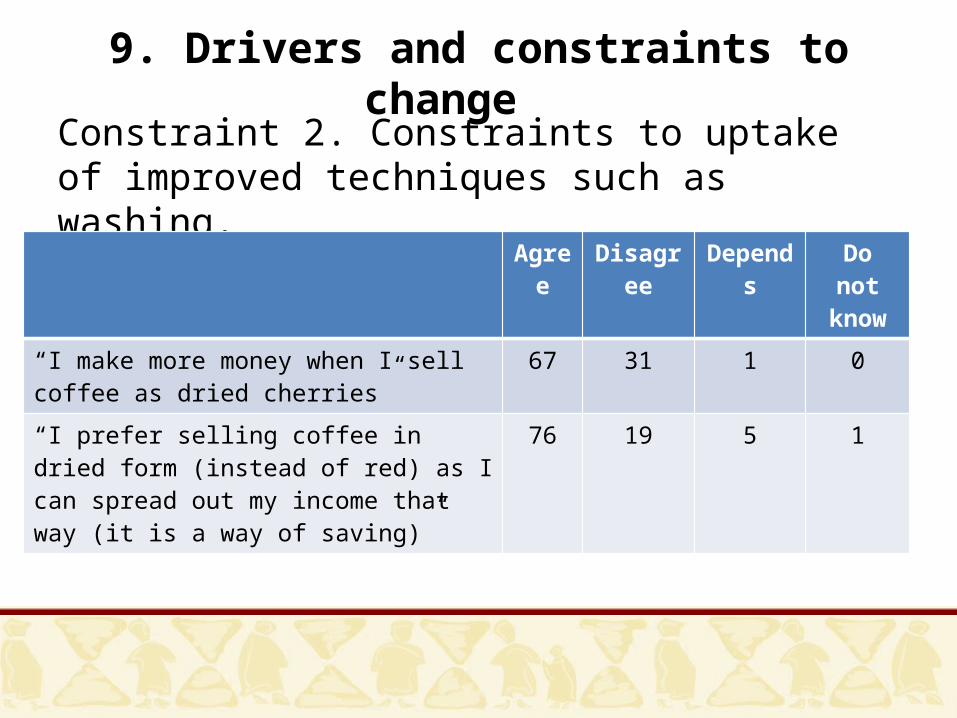
9. Drivers and constraints to change
Constraint 2. Constraints to uptake of improved techniques such as washing.
Agree Disagree Depends Do not know
“I make more money when I sell coffee as dried cherries”
67 31 1 0
“I prefer selling coffee in dried form (instead of red) as I can spread out my income that way (it is a way of saving)”
76 19 5 1
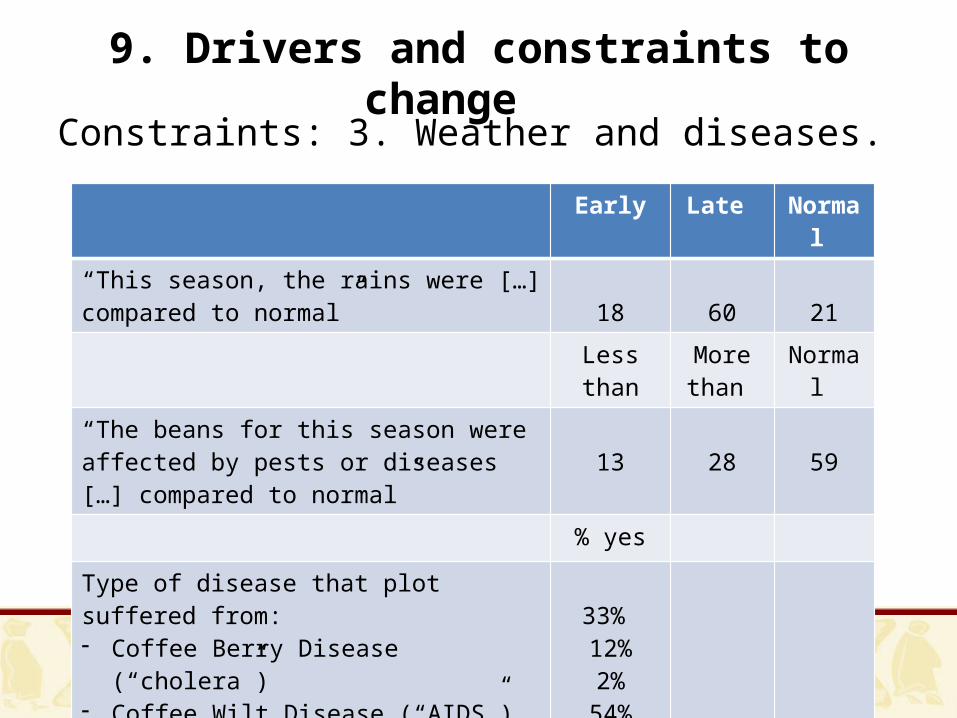
9. Drivers and constraints to change
Constraints: 3. Weather and diseases.
Early Late Normal “This season, the rains were […] compared to normal” 18 60 21
Less than More than
Normal
“The beans for this season were affected by pests or diseases […] compared to normal” 13 28 59
% yes
Type of disease that plot suffered from:- Coffee Berry Disease (“cholera”)- Coffee Wilt Disease (“AIDS”)- Other- None
33% 12%2%
54%

10. Conclusions
• Important changes are happening in the Ethiopian coffee sector
• At the production level, increasing adoption of improved practices for production inputs, improved good access to extension agents and better harvest and post-harvest practices; however, no major effect on production possibly due to disease problems and climate change
10. Conclusions
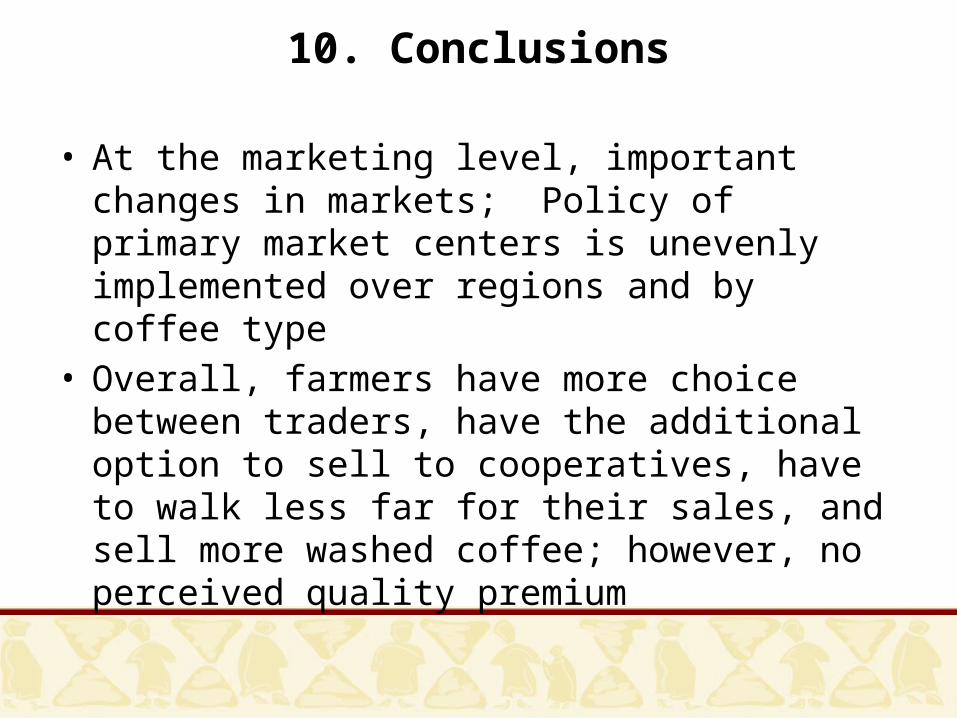
• At the marketing level, important changes in markets; Policy of primary market centers is unevenly implemented over regions and by coffee type
• Overall, farmers have more choice between traders, have the additional option to sell to cooperatives, have to walk less far for their sales, and sell more washed coffee; however, no perceived quality premium
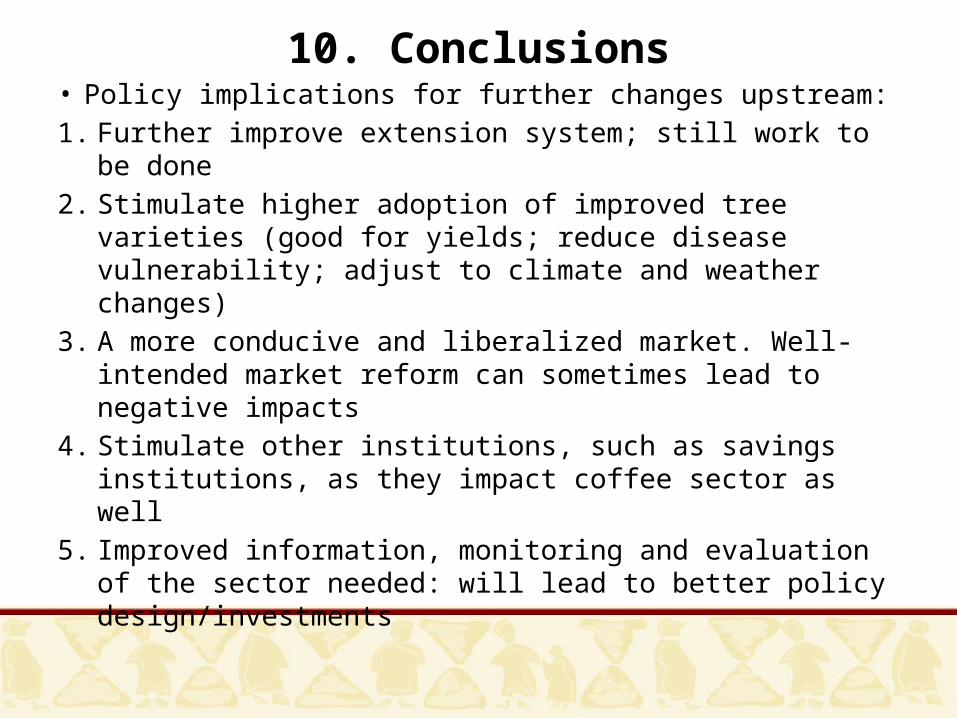
10. Conclusions• Policy implications for further changes upstream:1. Further improve extension system; still work to be done2. Stimulate higher adoption of improved tree varieties
(good for yields; reduce disease vulnerability; adjust to climate and weather changes)
3. A more conducive and liberalized market. Well-intended market reform can sometimes lead to negative impacts
4. Stimulate other institutions, such as savings institutions, as they impact coffee sector as well
5. Improved information, monitoring and evaluation of the sector needed: will lead to better policy design/investments
Related Documents