Small-scale versus large-scale cocoa farming in Cameroon Which farm type is more ready for the future? Chi Bemieh Fule Master’s thesis · 30 hec · Advanced level European Erasmus Mundus Master Program: Agricultural Food and Environmental Policy Analysis (AFEPA) Degree thesis No 829 · ISSN 1401-4084 Uppsala 2013

Welcome message from author
This document is posted to help you gain knowledge. Please leave a comment to let me know what you think about it! Share it to your friends and learn new things together.
Transcript

Small-scale versus large-scale cocoa farming in Cameroon Which farm type is more ready for the future? Chi Bemieh Fule
Master’s thesis · 30 hec · Advanced level European Erasmus Mundus Master Program: Agricultural Food and Environmental Policy Analysis (AFEPA) Degree thesis No 829 · ISSN 1401-4084 Uppsala 2013
iiii
Small-scale versus large-scale cocoa farming in Cameroon: which farm type is more ready for the future?
Chi Bemieh Fule Supervisor: Sebastian Hess, Swedish University of Agricultural Sciences, Department of Economics Assistant supervisor: Frederik Gaspart, Université Catholique de Louvain, Department of Agricultural Economics Examiner: Ing-Marie Gren, Swedish University of Agricultural Sciences, Department of Economics Credits: 30 hec Level: A2E Course title: Degree Project in Economics Course code: EX0537 Programme/Education: European Erasmus Mundus Master Program: Agricultural Food and Environmental Policy Analysis (AFEPA) Faculty: Faculty of Natural Resources and Agricultural Sciences Place of publication: Uppsala Year of publication: 2013 Cover picture: Chi Bemieh Fule (field study) Name of Series: Degree project/SLU, Department of Economics No: 829 ISSN 1401-4084 Online publication: http://stud.epsilon.slu.se Key words: Cameroon, cocoa, large-scale farming, small-scale farming
iiii

Acknowledgements Thank God Almighty for seeing me through this academic process. I am also highly indebted
to the prestigious Erasmus Mundus Scholarship Scheme as well as the European Master
programme in Agricultural, Food and Environmental Policy Analysis (AFEPA) for granting
me the financial support and the opportunity for a quality graduate education.
My sincere gratitude goes to all my tutors at Université Catholique de Louvain (UCL) and the
Swedish University of Agricultural Sciences (SLU) for the sound package, without which this
work would not have been possible. Most especially I am grateful to my thesis supervisor, Dr.
Sebastian Hess for his orientation throughout this exercise, especially before and during my
field work, and also for reading and making insightful comments to the write-up.
I extend special appreciation to Mr. Mekoulou Joseph of the divisional delegation of the
Ministry of Agriculture and Rural Development in Cameroon for mobilizing his staff to
facilitate my field study and especially to the interviewees for their time.
Finally and most importantly, my heartfelt appreciation goes to my entire family (and friends)
especially to my cherished husband, my parents and kids for their perseverance,
encouragements, moral and material support, and prayers.
iii

Abstract
Smallholding in the cocoa sector has been seen as a hindrance to production and productivity
growth due to the ageing of the cocoa farmers, limited access to credit, low level of education
and low adoptability of innovations. In order to curb this, policy makers have resorted to
implementing policy instruments that encourage the extension of small rural farms into larger
farms, thereby undermining the challenges that large-scale farmers might have to deal with.
This study was aimed at measuring the relative economic performances of small-scale and
large-scale cocoa farmers. Constrained by the on-going policy debates and the nature of the
data, the criteria used for comparison were land productivity, cost of production, marketing
strategies and profitability; as well as the factors affecting them. The analysis was based on
primary cross-sectional data obtained from cocoa farmers in the Nyong and Mfoumou
Division of the Centre Region of Cameroon.
Results reveal that smallholders have higher yield and higher profit margins than large-
holders, but that they are less efficient in marketing their produce, and that they incur equal
costs on average. Smallholders and large-scale farmers were also observed to have similar
socio-economic characteristics except for their household sizes; that is, smallholders have
small families of 5 persons as opposed to 11 persons for large-scale farms. The most
prominent socioeconomic factors determining farmer’s economic performance include
household size and experience in cocoa farming. The most common marketing strategy
adopted predominantly by large-scale farmers was group selling, hence no statistical
difference between their selling prices.
Therefore operating large cocoa farms is neither an efficient nor a sustainable method of
raising cocoa production and family income. However the co-existence of both farmer
categories is encouraged. Thus the study proposes that policy debates should address issues
like the optimal size of a cocoa farm in Cameroon and the effective farming system required
to achieve higher efficiency and sustainability of cocoa farms.
iv

Table of Contents ACKNOWLEDGEMENTS ................................................................................................................................ III
ABSTRACT ......................................................................................................................................................... IV
TABLE OF CONTENTS ...................................................................................................................................... V LIST OF FIGURES ............................................................................................................................................ VI
LIST OF TABLES ............................................................................................................................................ VII
1. INTRODUCTION ......................................................................................................................................... 1 1.1 PROBLEM BACKGROUND .......................................................................................................................... 1 1.2 PROBLEM ................................................................................................................................................. 3 1.3 AIM AND DELIMITATIONS ......................................................................................................................... 4 1.4 OUTLINE .................................................................................................................................................. 5
2. THEORETICAL PERSPECTIVE AND LITERATURE REVIEW ........................................................ 6 2.1. THE ECONOMICS OF FARM SIZE ................................................................................................................ 6 2.2. YIELD OR LAND PRODUCTIVITY ............................................................................................................... 8 2.3. COST ADVANTAGE ................................................................................................................................. 10 2.4. MARKETING STRATEGIES ....................................................................................................................... 11 2.5. PROFITABILITY ...................................................................................................................................... 12
3. METHOD .................................................................................................................................................... 15 3.1. PRESENTATION OF THE STUDY AREA ...................................................................................................... 15 3.2. MATERIALS USED ................................................................................................................................... 17 3.3. METHOD EMPLOYED .............................................................................................................................. 17
4. BACKGROUND FOR THE EMPIRICAL STUDY ................................................................................ 21 4.1. THE COCOA MARKET............................................................................................................................. 21 4.2. THE HISTORY OF COCOA PRODUCTION IN CAMEROON ............................................................................ 23 4.3. THE AGRO-ECOLOGICAL AND ECONOMIC CLIMATE OF CAMEROON ........................................................ 24
5. THE EMPIRICAL STUDY AND RESULTS ........................................................................................... 26 5.1. DATA PREPARATION .............................................................................................................................. 26 5.2. DATA PRESENTATION ............................................................................................................................. 27
5.2.1. Overall presentation of data ......................................................................................................... 27 5.2.2. Data presentation according to farm categories ........................................................................... 31 5.2.3. Regression Results ........................................................................................................................ 36 5.2.4. Sensitivity analysis ........................................................................................................................ 38
6. ANALYSIS AND DISCUSSION................................................................................................................ 39
7. CONCLUSIONS ......................................................................................................................................... 42 7.1. SYNTHESIS OF RESULTS ......................................................................................................................... 42 7.2. RECOMMENDATIONS .............................................................................................................................. 43 7.3. LIMITATIONS AND FUTURE RESEARCH .................................................................................................. 44
8. BIBLIOGRAPHY ....................................................................................................................................... 45 9. APPENDICES ............................................................................................................................................. 51
QUESTIONNAIRE ................................................................................................................................................ 51 FIELD PICTURES ................................................................................................................................................. 54
v

List of figures
FIGURE 2.1. SCALE EFFICIENCY (COELLI ET AL. 2005, PAGE 61). .............................. 7
FIGURE 2.2. TECHNICAL AND ALLOCATIVE EFFICIENCIES (COELLI ET AL. 2005, PAGE 52). ........ 8
FIGURE 3.1. MAP OF CAMEROON SHOWING THE COCOA-PRODUCING ZONES (A) AND THE MAP OF THE CENTRE REGION OF CAMEROON SHOWING THE ADMINISTRATIVE DIVISIONS (B) ..................................................................................................................... 16
FIGURE 4.1. COUNTRIES’ SHARES IN COCOA PRODUCTION (OWN VERSION WITH DATA FROM ICCO QUARTERLY BULLETIN OF COCOA STATISTICS, VOL.XXXVIII, NO.3, COCOA YEAR2011/12) .......................................................... 21
FIGURE 4.2. THE EVOLUTION OF COCOA PRODUCTION (OWN VERSION WITH DATA FROM WWW.FAOSTAT.ORG) .......................................................................... 22
FIGURE 4.3. EVOLUTION OF COCOA PRICES (OWN VERSION WITH DATA FROM WWW.FAOSTAT.ORG) .................................................................................................. 23
FIGURE 5.1 ANNUAL OUTPUT ............................................................................................. 28
FIGURE 5.2 INPUT SHARES IN TOTAL EXPENDITURES ................................................. 30
FIGURE 5.3. RELATIONSHIP BETWEEN FARM SIZE AND HOUSEHOLD SIZE (A) AND FARM SIZE AND HOUSEHOLD SIZE PER HECTARE (B) .............................. 33
FIGURE 5.4. THE INPUT SHARES IN TOTAL EXPENDITURES BASED ON FARM CATEGORIES .................................................................................................................. 34
vi

List of tables TABLE 5.1 ECONOMIC LIFESPAN OF FARM EQUIPMENT 26
TABLE 5.5.2. SOCIOECONOMIC CHARACTERISTICS OF FARMERS 27
TABLE 5. 5.3. PRODUCTION CHARACTERISTICS ACCORDING TO FARM SIZE 29
TABLE 5.5.4. CATEGORIZATION ACCORDING TO FARM SIZES 31
TABLE 5.5.5. THE SOCIOECONOMIC CHARACTERISTICS OF FARMERS ACCORDING TO FARMER CATEGORIES 32
TABLE 5.5.6. THE PRODUCTION CHARACTERISTICS OF FARMS ACCORDING TO FARM CATEGORIES 35
TABLE 5.7 REGRESSION RESULTS FOR FACTORS AFFECTING FARM YIELD (R-SQUARED = 0.60) 37
TABLE 5.8 REGRESSION RESULTS FOR FACTORS AFFECTING AVERAGE COST (R-SQUARED = 0.50) 37
TABLE 5.9 REGRESSION RESULTS FOR FACTORS AFFECTING PROFIT (R-SQUARED = 0.65) 38
vii

viii

1. Introduction This first section describes the context in which the research is carried out, presents the
objectives of the research, research questions, hypotheses and the limitations of the study.
1.1 Problem background
Although smallholding is an old concept, capitalising on smallholders as a means to achieve
food security, poverty alleviation, economic growth and sustainable development, became
plausible only after the Green Revolution in Asian countries (Lipton, 2005; FAO, 2010).
However some policies continue to encourage large-scale farming in sectors dominated by
manual labour. A comparative study of the relative performance of small-scale and large-scale
farmers may provide an insight to the effectiveness of such policies.
Smallholder agriculture was initiated in Sub Saharan Africa in 1910 when the indigenous
people gained access to cropping opportunities otherwise reserved for colonial farmers,
thanks to the commercialization-via-cash-cropping paradigm that consisted in raising
productivity in areas with comparative advantage (Delgado, 1995). As of 2005, Africa had 33
million small farms (8% of total) while small farms in Asia accounted for 87% of total farms
(Nagayets, 2005). It was also estimated in 2004 that smallholdings were home to
approximately 450 million households or 2 billion people; corresponding to 92% of the
world’s 1.1 billion “dollar-poor” (IFAD, 2010; Lipton, 2005). Despite their resource
constraint in Sub-Saharan Africa they contribute to 70% of total employment, with a total
40% share in merchandise exports and 33% of GDP on average, though heterogeneous across
countries. They also supply agricultural raw materials to the manufacturing sector which
contributes one-third to two-thirds of value added (Delgado, 1997; World Bank, 2007).
Dixon et al. (2004) define a smallholder as a farmer with limited resource endowment
compared to other farmers in the same sector; and may differ between countries, agro-
ecological zones, while resource could be in terms of land, capital or skill. Synonymous to
‘family farms’ Lipton (2005) suggests that farm labour and entrepreneurship in smallholdings
are supplied by the family. Smallholders according to IFAD (2011) may also differ across
time and according to the significance attributed to smallholder agriculture in societies.
Therefore in most Asian and African countries for instance a smallholder may have farm size
of 2 hectares and less as opposed to smallholders in Brazil with up to 50 hectares of farmland
while smallholders in USA are farmers whose total volume of sales does not exceed $250,000
1
(HLPE, 2012). Based on the nature of agricultural markets, assets of farm enterprise and
institutional and policy context, and the interaction between these three criteria HLPE
identified eight smallholder categories varying from the stable, productive and inherited land
type (yeoman type) to the landless poverty- and hunger-stricken farmer type described by
Frantz Fanon in ‘les damnés de la terre’.
Generally speaking smallholders in Sub-Saharan Africa practice rain-fed agriculture, have
limited access to conventional input, credit and output markets, incur high transaction costs
hence input and output market failures, and have less skill (Delgado, 1997; Jayne et al.,
2010). In spite of these drawbacks, they have proven to be efficient in resource use, and are
highly motivated in devoting their time and money to their family enterprises. They also have
the characteristic of diversification of income sources and crops, averseness to risk and the
effective use of land and labour, and use environmentally friendly methods in farming
(Schultz, 1964). It is thanks to these qualities, in addition to their ability to organise as a
political force (and collective action thanks to low transaction costs) that the Chinese
economy for instance achieved 10% rise in rural household income per capita from 1980 –
2007 through a technological revolution, migration of workers from agriculture to the
industrial sector and a price revolution (OECD, 2009; Birner and Resnik, 2010; Timmer,
2012).
Timmer further describes China’s strategy as “the Holy Grail of development assistance,
which has struggled to successfully move from bureaucratically-driven local projects to
institutionally-driven programs and from there to market-driven policies with economy-wide
impact”. Most economists like Lipton (2005) and HLPE (2012) think that much still needs to
be done in Africa to achieve a similar outcome. They include raising total factor productivity,
recognising farmer land rights that could stimulate long-term investment, easing access to
credit and extension facilities, among others. In addition to these challenges are policies that
do not always favour smallholding like the discriminative distribution of land to exploit
economies of scale and to efficiently use lumpy inputs like farm machinery leading to the
emergence of large-scale farming (Eastwood et al, 2008; Delgado, 1997).
The performance of this new farm type is however mixed: higher productivity and
profitability was recorded for cereals and sugarcane while the reverse was true for cocoa.
Their success was also attributed to upstream and downstream economies of scale when
accessing finance, purchasing inputs and selling outputs (HLPE, 2011). Alternatively lower
2

performance for large cocoa and oil palm farms or perennials in general was attributed to their
high dependence on manual labour (constant returns-to-scale technology). Hence they are
expected to do better on small size farms because of the absence of high transaction costs,
monitoring and enforcement costs associated with hiring workers (de Janvry et al., 2001;
Vermeulen and Goad, 2006).
1.2 Problem By 2000, Cameroon’s cocoa sector was still dominated by smallholding with an average size
of 1-3 hectares while 50% of cocoa trees had an average age of 40 years, low yield (300
kg/ha), advanced age of the household heads due to rural exodus, low use of improved breed
and pesticides hence high disease prevalence causing a loss of over 100 billion CFA F each
year. In order to address these issues a “modernisation” policy reform (fuelled by increasing
prices and negative balance of trade) was designed with the goal of raising production from
137,000 tonnes to 300,000 tonnes by 2015. The strategy employed first consisted in attracting
a “younger, more financially viable and more educated” generation of farmers into the sector,
secondly in facilitating (and even distributing) new farmer’s access to vast extensions of land
from 4 hectares and above and finally producing and distributing cocoa hybrid species to
farmers accompanied by training (DSDR, 2005).
A re-launch program began in 2006 under the name ‘Professionnalisation Agricole et
Renforcement Institutionnel’ (PARI) and was aimed at creating awareness and attracting local
investors into the sector. It was led by the Ministry of Agriculture and Rural Development
(MINADER) and by the Sustainable Tree Crop Program (STCP) driven by the International
Institute of Tropical Agriculture (IITA). Its activities included but were not limited to
selecting and distributing improved cocoa varieties, diffusing better cultural practises
including agroforestry, improving infrastructures, organizing farmers into cooperatives to
ease marketing, and facilitating their access to farm inputs, information and credit (Kamdem,
2011; Ndoping, 2011). Other associated projects include the Projet d’Appui à l’Insertion des
Jeunes en Agriculture (PAIJA), Projet Semencier Cacao-Café (PSCC) charged with
multiplying and distributing improved cocoa varieties that have a higher yield and that are
more resistant to pest attacks, Projet d’Appui à la Production et la Commercialisation des
Cultures Pérennes and the Fonds de développement du Cacao et Café (FODECC), just to
name a few.
3

The fact that this reform encourages both old and new farmers to increase in the surface area
of their cocoa farms raises concerns about the effectiveness and the efficiency of the policy.
As earlier mentioned, anterior studies have demonstrated that cocoa farming employs constant
returns to scale technology, meaning that there is no economies of scale. Therefore a study
investigating the ability of larger cocoa farms to be more productive than smaller cocoa
farms, the efficiency in resource use to grow their crops and the ability of this activity to raise
the revenu of both farmer categories is necessary.
1.3 Aim and delimitations
The aim of this study is to measure the economic performances of small-scale and large-scale
cocoa farmers based on their yield, costs of inputs, selling price and profitability; and
determine the factors affecting them. The analysis shall be based on primary cross-sectional
data gathered from cocoa farmers in the Nyong and Mfoumou division in Cameroon in March
2013.
The study will attempt to answer the following questions like (1) Which farm category has
higher yield? (2) Which of them has a cost advantage? (3) Which marketing strategies does
each farmer category use? (4) Which of the farms is more profitable to operate? Small or
large-scale farms? (5) What factors affect farm yield and profitability?
Based on the above-mentioned research questions, three hypotheses will be tested:
1) Small-scale farms have higher yield compared to large-scale farms.
2) Small-scale farmers have a cost advantage over large-scale farmers.
3) Small-scale farms are more profitable to operate than large-scale farms.
The term ‘smallholder’ shall be referring to farmers operating on 2 hectares of farmland and
less since this has been cited severally in the literature as the average size of smallholder
farms in Cameroon (Dixon et al., 2004; Nagayets, 2005; HLPE, 2012). Alternatively, farm
sizes of 5 hectares and above shall be considered as large-scale farms because it is the official
nomenclature used by the Cameroon government, besides the fact that such category of
farmers usually have a higher social status. Consecutively farms lying strictly between 2 and
5 hectares shall be considered as medium-scale farms.
The study was limited to cocoa farmers in the Nyong and Mfoumou division, one of the six
divisions of the Centre Region of Cameroon. A sample of forty farmers was examined based
4

on the fact that their cocoa trees had attained physical maturity and that the farmers had
already started harvesting and selling their produce, thereby ensuring experience and data
availability. The econometric analysis encompasses a comparative study based on input costs
and profits, marketing strategies and land productivity; but precludes labour productivity and
efficiency measures.
1.4 Outline
The remaining paper is organised as follows: Chapter two discusses the economic theory of
farm size, yield, cost advantage, marketing strategies and profitability, as well as the method
used in the analysis. In chapter three the cocoa economy both at the global and at the national
level are discussed including the policies that have defined the history of cocoa production in
Cameroon. Chapter four makes a brief presentation of the study area (Nyong and Mfoumou
sub - division), it also presents the material used to collect data, the treatment of the data and
the data itself. The fifth chapter discusses the results based on the objectives and hypotheses
defined and chapter six present a summary of the results, recommendations, limitations of the
study and the possibility for future study.
5

2. Theoretical perspective and literature review
This section discusses the farm size theory and the concepts of yield, profitability, cost
advantage and marketing strategies, as well as the factors affecting yield and profitability. We
also present the methods used for each concept mentioned.
2.1. The economics of farm size
The theory of farm size as described by Eastwood, Lipton and Newell (2008) suggests that
households with heterogeneous endowment in capital and labour (amidst other factors like
relative prices of inputs, land tenancy, level of development and technology) will end up
having different farm sizes and farm organizations. The efficient farm size increases with
household size (number of members of working age) in the presence of high transaction or
agency or information costs (that is, cost in searching, screening, training and supervising
labourers) for households with no capital endowment. Meanwhile the efficient scale of farm
operation would decrease with transport cost and technical scale economies in transport and
marketing. Efficiency here is considered to be the maximum expected return to the household
when exogenous risk is neglected. About four types of efficiencies exist in production
economics: scale efficiency, allocative efficiency, technical efficiency and cost efficiency
which is just the combination of allocative and technical efficiencies.
Diagrammatically, Scale efficiency is shown to be achieved when the size of a firm enables it
to make a mix of inputs at constant returns to scale (that is, proportionate change in inputs
leads to a proportionate change in quantity supplied); but will achieve decreasing returns to
scale when it is too large and increasing returns to scale when it is too small (Coelli et al.,
2005). The gradients of the three rays passing through the origin in Figure 2.1 represent the
productivities (output-input ratio), with the highest being the ray labeled as constant returns to
scale (CRS). For a fixed level of output, G, the productivity of a firm can be raised from point
D to E and eventually to F. Therefore the optimum size of a firm is achieved when it is
employing constant returns to scale technology as summarized by the following relation:
Scale efficiency = 𝑇𝐸𝐶𝑅𝑆𝑇𝐸𝑉𝑅𝑆
= 𝐺𝐹𝐺𝐷
/ 𝐺𝐸𝐺𝐷
= 𝐺𝐹𝐺𝐸
Therefore scale efficiency is the ratio of technical efficiency at constant returns to scale to
technical efficiency at variable returns to scale.
6

Figure 2.1. Scale efficiency (Coelli et al. 2005, page 61).
Farrell (1957) considers a firm to be technically efficiency (TE) if it is capable of achieving
maximum output using a given set of inputs while it is said to achieve allocative efficiency if
it is capable of mixing inputs in an optimal way given their respective price and technology.
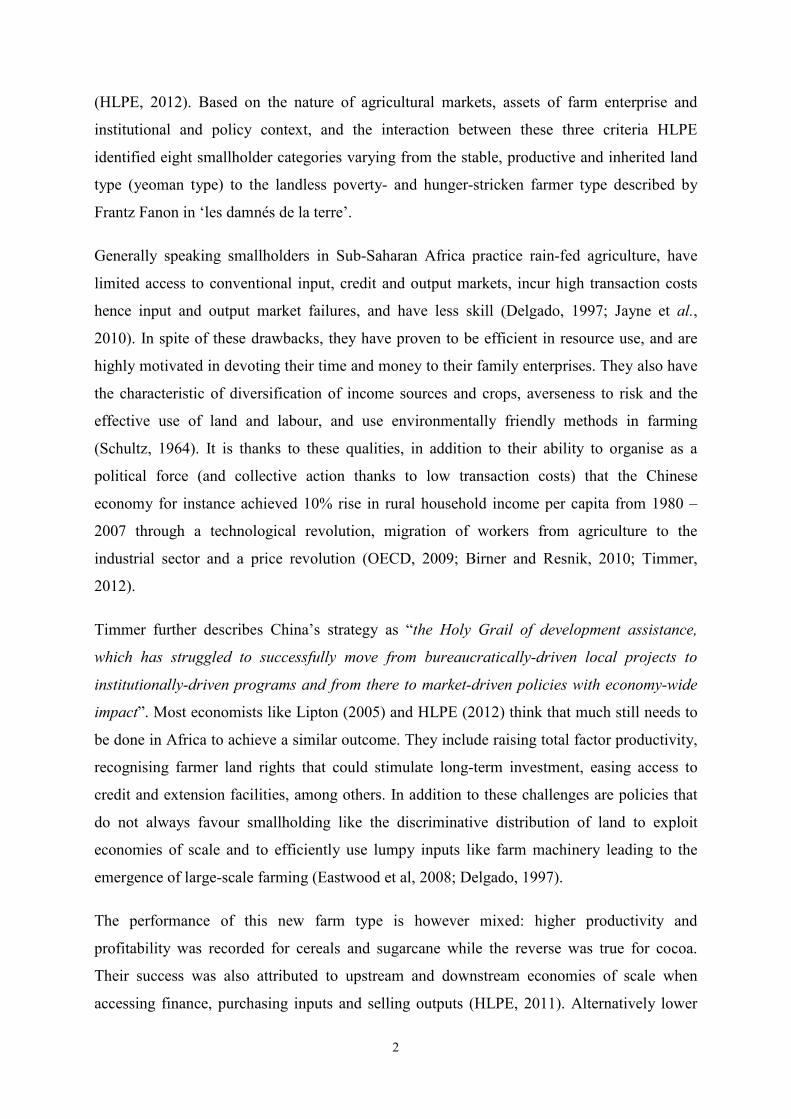
Therefore a firm could be technically efficient but still improve its productivity by exploiting
scales economies. A schematic representation of these concepts according to (Coelli et al.
2005, page 52) can be seen in figure 2.2 supposing that a firm transforms its inputs X1 and X2
into output q using a constant returns to scale technology, which also represents the
substitutability of inputs X1 and X2; the gradient of the ray OP measures the productivity of
the firm, that is, Y/(X1 + X2) while the line AA’ represents the isocost line or input price ratio.
Firms producing at point Q are technically efficient but allocatively inefficient, while those
producing at point Q’ are both technically and allocatively efficient, corresponding to the
optimum firm ensuring cost minimization.
The distance function is used to measure efficiency, and takes values from zero to one. The
value of the distance function for a firm producing at level P using inputs X1 and X2 is given
by OP/OQ.
𝑋𝐷 𝑋𝐸 𝑋𝐹 0
Output
F E D
B
Input
G
VRS Frontier CRS Frontier
7
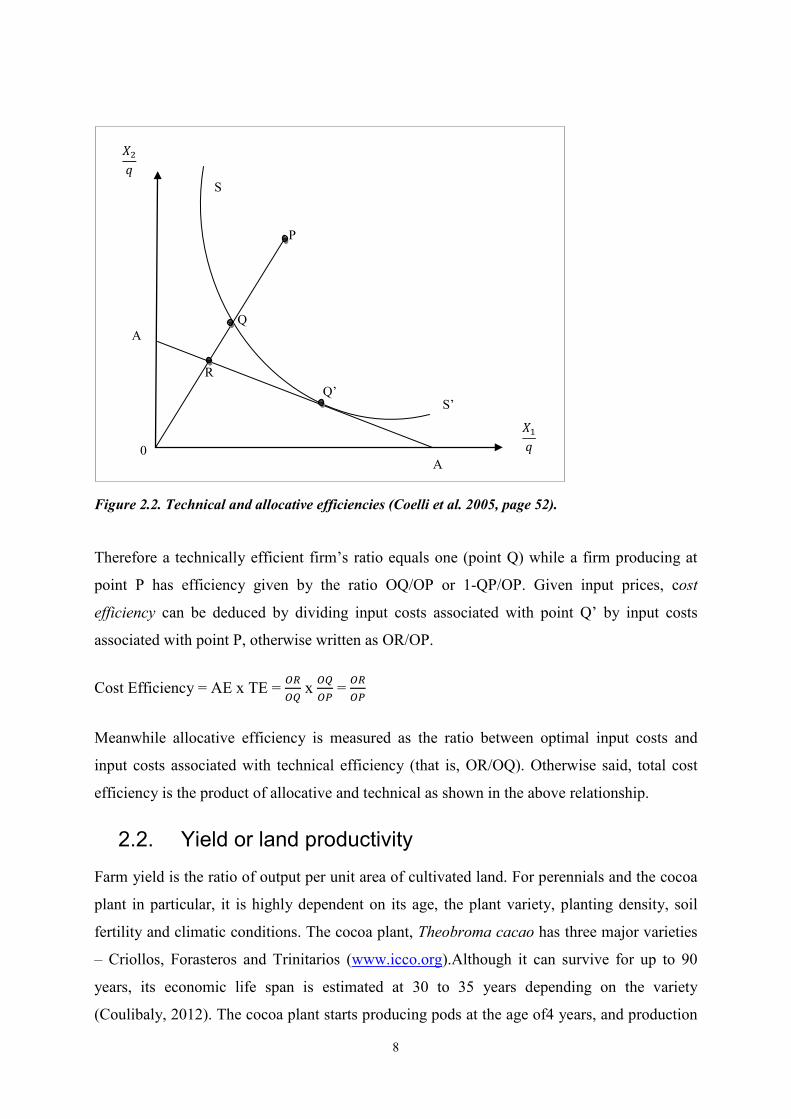
Figure 2.2. Technical and allocative efficiencies (Coelli et al. 2005, page 52).
Therefore a technically efficient firm’s ratio equals one (point Q) while a firm producing at
point P has efficiency given by the ratio OQ/OP or 1-QP/OP. Given input prices, cost
efficiency can be deduced by dividing input costs associated with point Q’ by input costs
associated with point P, otherwise written as OR/OP.
Cost Efficiency = AE x TE = 𝑂𝑅𝑂𝑄
x 𝑂𝑄𝑂𝑃
= 𝑂𝑅𝑂𝑃
Meanwhile allocative efficiency is measured as the ratio between optimal input costs and
input costs associated with technical efficiency (that is, OR/OQ). Otherwise said, total cost
efficiency is the product of allocative and technical as shown in the above relationship.
2.2. Yield or land productivity
Farm yield is the ratio of output per unit area of cultivated land. For perennials and the cocoa
plant in particular, it is highly dependent on its age, the plant variety, planting density, soil
fertility and climatic conditions. The cocoa plant, Theobroma cacao has three major varieties
– Criollos, Forasteros and Trinitarios (www.icco.org).Although it can survive for up to 90
years, its economic life span is estimated at 30 to 35 years depending on the variety
(Coulibaly, 2012). The cocoa plant starts producing pods at the age of4 years, and production
𝑋1𝑞
𝑋2𝑞
Q’
P
Q
R
A
A
S
S’
0
8

increases gradually to its optimum at 10 years and begins to drop again (www.chocolate.org),
hence a bell-shaped production life cycle. The planting density largely depends on the
disposition or spacing: random (can attain up to 1800 trees per hectare), square (1111 trees
per hectare) or diagonal (1200 trees per hectare) (fact from field interview).
The cocoa plant grows best on high nutrient content coarse soil with a depth of 1.5m allowing
for good root development, water retention and drainage. A pH of 5.0 – 7.5 with 3.5% of
organic matter in the top 15 centimetres and nitrogen/total phosphorus ratio of 1.5 are
necessary for optimal growth. The optimum weather requirements for high cocoa yield
include heavy and evenly distributed rainfall across the year ranging between 1500mm and
2000mm; high temperatures with a maximum annual average of 30 – 32 degrees Celsius and
a minimum of 18 – 21 degrees Celsius; hot and humid atmosphere with relative humidity
ranging from 70-80% at night to 100% in the day time. Adequate sunlight of approximately
1800 hours per year, controlled by forest tree shade (10 large or 15 medium trees per hectare)
is conducive for the prevention of attacks from pests, diseases and plant dehydration. Among
these climatic factors, rainfall is the most crucial determinant of cocoa yield and dry
conditions of 100mm of rainfall must not exceed three months (Ibid, and Coulibaly, 2012).
Apart from the biotic and abiotic factors mentioned are the farming systems being practiced.
They are the extensive system (little or no pesticide and fertilizer input use, and cocoa grown
under the forest canopy), the semi-intensive system includes agroforestry approach, full
lighting and alley cropping systems in association with banana/plantains and coco yams,
while the intensive system is characterised by the intensive use of fertilizer, pesticides and
improved or crossbreeds (Coulibaly, 2012).
A healthy adult cocoa tree would produce 25 pods or 1 kilogram of dry cocoa per year (Asare
and Sonii, 2010), corresponding to an estimated annual yield that progresses from 300 up to
2500 kg/ha (Coulibaly, 2012).In 2008/2009 in Cameroon, average yield stood at 485 kg/ha
while yield of improved cocoa varieties attained 1200 kg/ha (Afari-Sefa et al., 2009). They
equally observed high yield (528 kg/ha) for trees below 30 years of age, but dropped by 18%
for trees that were 40 years and older. Also farm yield was found to have a positive
relationship with planting density while high shade considerably hampered yield. The major
factors that constrained yield were high pest prevalence (Phytophtora sp., mirids and swollen
shoot), ageing cocoa farms and farmers, decline in rainfall level, limited use of pesticides and
high shade.
9

In spite of the effects that physical factors (usually beyond human control) have on yield, the
concept is important to compare the performance of small and large farms; which inherently
provides information about the appropriateness of the farming techniques used.
2.3. Cost advantage
The concept of cost advantage is used to describe a firm’s ability to minimize cost below the
average cost of the industry (Porter, 1985). While most policy makers (DSDR, 2005) and
economists like Nkamleu and Coulibaly (2000) attribute the low adoption of the integrated
crop-pest management technology to advanced age and low level of education of cocoa
farmers, Freud at al. (1996) and Alary (1996) suggest that farmers are rational and risk averse,
so maintaining costs as low as possible is their strategy to cope with low selling prices on
which they have no control. Strategies consisting in minimizing costs were adopted by cocoa
farmers in Cameroon after the liberalization of the sector, and was comprised of reducing tree
and farm maintenance while spending more time on other lucrative activities like the
cultivation of food crops and off-farm activities, minimizing the use of fertilizers, and
substituting pesticides with agroforestry practices and the use of traditional tree backs (Bamou
and Masters, 2007).
Costs are mostly incurred in the procurement of phytosanitary products, farm equipment,
labour and land. Being a labour-intensive activity, the highest expenditure is incurred on
wages especially by farmers who are old, those who have large farms and non-peasants.
Alternatively, family labour is the major source of labour on the cocoa farms. Manpower is
required for weeding the farm, managing the nursery, transplanting, pruning, treatment, for
fertilizer application and harvesting. Meanwhile post-harvest services are required to break
the pods, ferment, dry and roast the cocoa beans. Very little or no machinery is used to
substitute for mechanical labour. Based on a report at the delegation of agriculture for
NyongetMfoumou, labour is very scarce and expensive due to rural-urban exodus and youth’s
involvement in non-farm activities like the “ben-skin” business, hence higher opportunity cost
for family labour.
The second most expensive input is fertilizer and pesticides. Their costs depend on their
quality and frequency of use. Fungicides and insecticides are used to fight the Phytophthora
sp., black and brown pod rot, a fungal disease that can lead to 44% loss in global production;
cocoa capsid (Distinthiellatheobromae) that can cause up to 75% loss in production, and
10

cocoa swollen shoot that can cause a loss in yield by 15% (PAN-UK, 2001). Meanwhile the
equipment used vary from rudimentary tools like machetes, wheelbarrows, dibbles, etc to
modern equipment like motorised sprayers and vehicles (Tita and Nkamgnia, 2012). Most
indigenes usually acquire land through heritage while migrants always tend to buy land from
the indigenes. Regarding the cost of land, it depends whether it is a virgin forest or already
cleared land and can vary from 100,000 CFA F per hectare to 400,000 CFA F (first-hand
information from the field).
Observations was made by Zyl et al. (1995) in the South African grain sector revealed that
commercial farms were less efficient due to their more capital-intensive methods used in
production as opposed to labour-intensive methods used by small scale farmers. The Platform
Policy Brief (2005) also acknowledged the fact that small-scale farmers have an overall cost
leadership thanks to their ability to employ family labour, which has a low opportunity cost
and better knowledge of conditions on the farm. Cocoa farming being essentially a labour-
intensive activity, we would expect small-scale farmers to have a cost advantage over large-
scale farmers since the risk of a moral hazard problem is less likely to occur (Eswaran and
Kotwal, 1986). From a more general perspective, Eastwood et al. (2008) concluded that
efficient farm size would rise if transaction cost were not as important as labour supervision
cost for households endowed with labour but limited capital.
2.4. Marketing strategies The cocoa market in Cameroon was liberalised since the 80s to allow for competition. The
marketing chain is composed of producers, retailers (mainly door-to-door retailers or
‘coxeurs’), wholesalers and exporters. The producer price is determined at the farm gate (and
correlated with the free-on –board price) depending on the bargaining power of the seller
relative to the buyer, and a subjective examination of the cocoa quality which is very often
biased, hence asymmetry of information on cocoa quality and market price causing farmers to
be price takers, receiving low prices (Alain, 2008; Kamdem et al., 2010).
Olson (2004) defines a strategy as a set of actions used by a farmer to accomplish goals and
objectives. When the goals and objectives involve profit maximization, attracting higher
selling price and turn-over, we would be referring to marketing strategies. According to the
Platform Policy Brief (2005), large-scale farmers generally have a higher transaction cost
advantage over small-scale farmers which include higher managerial skills, more access to
11

reliable and timely market information, and better techniques, economies of scale in
purchasing inputs and selling produce, easier access to financial markets, registering land,
assuring traceability and quality of produce, and higher abilities to manage risks. This was
ascertained by Nyemeck et al. (2007) who showed that relaxing the credit constraint could
raise cocoa production in Cameroon by 9% and cause a 14% positive spill over effect on
production.
In order to raise their bargaining power and selling price, gain access to reliable information
at lower cost, establish contracts with potential buyers before harvest and buy farm inputs at a
cheaper rate, most farmers resorted to joining farmer groups and cooperatives (Markelova et
al, 2009; Wilcox and Abbott, 2006). Kamdem and Melachio (2011) actually revealed that
collective action could raise cocoa farmer’s price by 8% in Cameroon, though these farmer
groups face numerous challenges like low managerial skills, among others hence low
commercial efficiency of about 0.57. Due to their failure to deliver to desired good, including
the exclusion of smaller farmers from the decision-making process (Bernard and Spielman,
2008) small farmers may not always have the incentive for collective action. Such a scenario
may give large-scale farmers the upper hand.
2.5. Profitability One of the mathematical methods used to describe firm’s behaviour in maximizing profit is
that described by Mundlak (2001). His approach is based on a Cobb-Douglas production
function:
𝑌 = 𝐴𝑋𝛽𝑒𝑚0+𝜇0 (2.1)
𝑚0is the firm – specific factor (or management effect) known only to the firm – private
information and 𝜇0 is a random term whose value is unknown at the time the production
decision is made. The conditional expectation of output given the input of firm i is
𝑌𝑖𝑒 ≡ 𝐸�𝑌 ∣𝑋𝑖� ≅ 𝐴𝑋𝑖𝛽𝑒𝑚0𝑖 (2.2)
Assuming that the price is known, the firm chooses the input so as to maximize the expected
profit:
𝑋𝑋𝑖𝑚𝑎𝑥 ∣𝑊,𝑃,𝑖= 𝑃𝑌𝑖𝑒 −𝑊𝑋𝑖 (2.3)
12

Where P is output price and W is input price. The first order condition to be met by the
stochastic terms 𝑚1 and 𝜇1 is given by:
𝛽𝐴𝑋𝛽−1 = 𝑊′𝑃′𝑒𝑚1+𝜇1 (2.4)
Where 𝑚1 is known to the firm but not to the econometrician and 𝜇1 is a transitory
component. The term 𝑚1 reflects the firm’s expectation formation and its utility function.
Where P’ is real output price in input units and W’ is the wage in output units. While the
profit margin may provide information about a firm’s turnover, the profitability ratio or index
is more
Usually the net present value (NPV) is used to measure farmers’ profitability for instance
Boateng (1998) applied this approach using time-series data from cocoa famers in Ghana. But
since the data involved in this paper is cross-sectional, the relative profit margin of cocoa
farmers is captured by dividing the revenue proceeding from the sales of cocoa beans by total
cost incurred during a particular year (excluding discount rate). The financial success in
establishing a cocoa farm depends on quick returns from the initial investment and increasing
yields to curtail unit costs (www.icco.org; Freud at al., 1996).
Although the concepts of productivity, technical and scale efficiency, economies of size and
scale, returns to scale have been used extensively in the literature to compare the performance
of small-scale and large-scale production, they shall not be used in this research due to the
nature of our data. However the results accruing from their analysis is of prime importance to
us. For instance the findings of Zyl et al. (1995) were based on scale efficiency, meanwhile
Kislev and Perterson (1991), Johnson and Ruttan (1994), Binswanger et al. (1995) and
Townsend et al.(1998) concluded that constant returns to scale exist in the agricultural sector
and ruled out the assumption that larger farmers were more efficient. Conversely Dorward
(1999) observed a positive relationship between farm size and productivity in the Malawan
smallholder agriculture. Conclusively, the direction and magnitude of the relationship
between farm size and economic efficiency depends not only on the crop type and technology
as already highlighted but to a greater extend on the relative abundance of the factors of
production like land, labour and capital, cost of labour supervision and transaction costs (Ibid;
Eastwood et al., 2008).
13

The strategies adopted by farmers are very often in response to policy and price incentives.
Cameroon being the fifth largest cocoa producer and cocoa being the second export crop after
cotton, it will be fair enough to present the global cocoa sector, and the policies that have
shaped the cocoa sector since colonization (and farmer’s responses).
14

3. Method
This chapter presents our study area, the sampling technique and materials used to collect
data.
3.1. Presentation of the study area
The main cocoa-producing zones in Cameroon as shown in figure 3.1a include the South
West, the Centre and South regions of Cameroon. NyongetMfoumou, one of the ten
administrative divisions in the Centre region (shown in figure 3.1b), was chosen for the study
due to the presence of technical support from the delegation of MINADER in the zone. The
Nyong et Mfoumou division is further divided into five administrative sub-divisions which
include Akonolinga, Ayos, Endom and Mengang and Nyakokombo. It is situated about 180
kilometres from Yaounde, the capital of Cameroon, and has a surface area of 6170 square
kilometres. The population in 2007 was estimated at 153,402 inhabitants corresponding to a
density of 24.85 per Km2 (INS, 2008; INS, 2011).
However based on a report obtained from the delegation of MINADER during my field work,
the population was 79,870 inhabitants for three of the five sub-divisions, that is, Akonolinga,
Ayos and Endom. The surface area covered by cocoa trees in 2012 was estimated at 23,864
hectares (approximately 4% of total surface area) and was shown to have risen by 7% from
2010 to 2012 accompanied by a rise in output from 3374 tonnes to 3579 tonnes during the
same period. The number of cocoa farmers was also observed to have risen by 16% during the
same period to 3595 cocoa farmers (corresponding to approximately 4% of the total
population).
Apart from the cocoa, the land is also allocated for the cultivation of banana-plantains, coffee,
oil palm (relatively new crop in the area) and pineapple, for commercial purposes meanwhile
crops like cassava, coco yams, groundnuts and maize are produced essentially for
consumption while their surplus is marketed both on the local market and the urban city
(Achancho, 2006). Apart from crop production, other income-generating activities for the
population include fishing from the River Nyong and hunting in the vast Equatorial forest.
15
(b)
(a)
Figure 3.1. Map of Cameroon showing the cocoa-producing zones (a) and the Map of the Centre region of Cameroon showing the administrative Divisions (b)
16

3.2. Materials used A questionnaire was designed into three main sections- farmers’ socio-economic
characteristics, production and marketing characteristics. Both quantitative and qualitative
variables were included. The quantitative variables required to determine the socioeconomic
characteristics of the respondents include age (years), household size referring to the number
of people above the age of 12 years living for at least six months with the farmer, number of
years in formal education, and number of years practicing cocoa production (or experience).
The qualitative variables for this analysis included that marital status, sex, and training of
farmer.
Regarding the variables required to assess their production performance, surface area of cocoa
farm (hectares), annual output quantities (kilograms), expenditures in inputs such as
phytosanitary products (fungicides, insecticides and pesticides), labour, planting materials,
farm equipment, and the purchase of land were collected.
A list of cocoa farmers was gotten from the divisional delegation of the Ministry of
Agriculture and Rural Development (MINADER) providing me with a population size of
approximately 820 farmers. Based on the availability of the farmers, accessibility, time and
eligibility constraints, we administered forty valid questionnaires in four (Akonolinga, Ayos,
Endom and Mengang) of the five sub-divisions. Only cocoa farmers who had started
marketing their cocoa were randomly retained among the lot. Information was obtained on
input use, output level, marketing and socio-economic characteristics. In March 2013, 40
valid questionnaires were administered in four of the five subdivisions: 9 respondents were
from Endom (22.5%) while 11, 9 and 11 from Mengang (27.5%), Akonolinga (22.5%) and
Ayos (27.5%), respectively.
3.3. Method Employed Four major criteria were used to assess the relative economic performances of small and large
cocoa farmers, which permitted the three hypotheses already mentioned to be tested.
Hypothesis 1: Small-scale farms have higher yield compared to large-scale farms.
The null hypothesis (H0) states that small-scale and large-scale farms have equal yield against
the alternate hypothesis (H1) that small-scale farms have a higher yield than large-scale
farmers.
17

Farm yield is measured for each farmer and is given by:
𝑌𝑖 = 𝑞𝑖 𝑥𝑖⁄ (2.5)
where 𝑌𝑖 is the yield for each farm, 𝑞𝑖 is the quantity of dried cocoa beans harvested each year
in kilograms and 𝑥𝑖 is the surface area of all cocoa farms (in hectares) owned by the farmer,
with i = 1,..., 40 for the farms in the sample.
To test the first hypothesis, the following regression was run:
𝑙𝑛𝑌𝑖 = 𝛼0 + 𝛼1𝑙𝑛(𝑡𝑟𝑒𝑒𝑎𝑔𝑒) + 𝛼2𝑙𝑛(𝑑𝑒𝑛𝑠𝑖𝑡𝑦) + 𝛼3 𝑙𝑛(𝑓𝑎𝑟𝑚𝑠𝑖𝑧𝑒) + ∑𝛼𝑗 𝑙𝑛𝑉 + 𝜀
(2.6)
Where Tree age = average age of the trees on the farm (years), Density = planting density
(trees per hectare), farmsize = the surface area of the cocoa farm in hectares, while the alphas
are the parameters to be estimated and ε is the error term. In addition to these factors are
socio-economic factors that could influence the techniques employed in production such as
farmers age, household size, level of education, profession, experience, etc denoted by V. In
addition to these factors are socio-economic factors that could influence the techniques
employed in production such as farmers age, household size, level of education, profession,
experience, etc denoted by V.
Hypothesis 2: Small-scale farmers have a cost advantage over large-scale farmers.
The H0 states that small-scale farmers incur the same costs on average as large-scale farmers
while the alternate hypothesis (H1) states that the small farmers have a lower average cost
than the large-scale farmers.
The formula for deriving average costs is given by:
𝑍𝑖 = ∑𝑤𝑖𝑘𝑥𝑖
(2.7)
Where 𝑤𝑖𝑘 represents expenditures in CFA F, while k stands for wages, equipment, fertilizers,
and land, while i stands for each of the forty observations and 𝑍𝑖 represents total average cost.
The costs here represent actual expenditures on farm inputs. It is assumed that the opportunity
cost of family labour and land are zero because there is abundant land in the region covered
by forest trees, which would otherwise be unexploited. In addition cocoa farms which are not
18

maintained are very often allowed to fallow. It is therefore rare to find land that was initially
covered by cocoa trees, reallocated to the cultivation of a different crop since these trees
would serve for boundary marks and proof of land propriety in the future. Regarding family
labour, family heads as well as other members of the households partaking in the cocoa farm
operations seldom indulge in non-farm activities, hence a negligible opportunity cost of
family labour.
In order to test the second hypothesis, the following regression was run:
𝑙𝑛(𝑍𝑖) = 𝛿0 + 𝛿1 𝑙𝑛(𝑓𝑎𝑟𝑚𝑠𝑖𝑧𝑒) + 𝛿2 ln(𝑝ℎ𝑦𝑡𝑜) + 𝛿3 𝑙𝑛(𝑒𝑞𝑢𝑖𝑝𝑡) + 𝛿3 𝑙𝑛(𝑙𝑎𝑏𝑜𝑢𝑟) +
∑𝛿𝑗 𝑙𝑛𝑉 + 𝜀 (2.8)
Where Phyto = annual expenditures on phytosanitary products (CFA F), Equipt = annual
expenditures on farm equipment (CFA F), labour = annual expenditures on the wages (CFA
F) and the deltas are the parameters to be estimated. Meanwhile the socio-economic
characteristics (V) of each farmer are controlled.
Hypothesis 3: Small-scale farms are more profitable to operate than large-scale farms.
The H0 states that both farm types have equal profit margins against that H1 which states that
small-scale farms are more profitable. This is because we expect that cocoa farming is a
labour-intensive activity and that small-scale farmers derive means to curb marketing
challenges by collective action and mutual assistance.
Profitability is measured for each farmer as
𝑃𝑖 = 𝑝𝑖𝑞𝑖∑𝑤𝑖𝑘
(2.9)
Where 𝑃𝑖 stands for the profitability of each farm, 𝑝𝑖 and𝑞𝑖 denote the price (CFA F) and
quantity (kilograms) of cocoa bean respectively. In order to test the third hypothesis, the
following regression model was run:
𝑙𝑛𝑃𝑖 =
𝛽0 + 𝛽1𝑙𝑛(𝑙𝑎𝑏𝑜𝑢𝑟) + 𝛽2𝑙𝑛(𝑙𝑎𝑛𝑑) + 𝛽3𝑙𝑛(𝑃ℎ𝑦𝑡𝑜) + 𝛽4𝑙𝑛(𝑃𝑙𝑡.𝑚𝑎𝑡) + 𝛽5𝑙𝑛(𝐸𝑞𝑢𝑖𝑝𝑡) +
𝛽6 𝑙𝑛(𝑓𝑎𝑟𝑚𝑠𝑖𝑧𝑒) + ∑𝛼𝑗 𝑙𝑛𝑉 + 𝜀 (2.10)
19

Where Land = annual expenditures on land (CFA F) and Plt.mat = annual expenditures on
planting materials (CFA F). The betas are the parameters to be estimated while ε is the
stochastic term. The Gretl software was used to run the regression models.
20

4. Background for the empirical study
This chapter presents an overview of the global cocoa economy with emphasis on cocoa
production in Cameroon, the evolution of policies that have been affecting the cocoa sector
and an overview of the Cameroon economy today.
4.1. The Cocoa Market Originally from Latin America, cocoa (Theobroma cacao) is a crop consumed worldwide but
only grown in specific regions, lying within 10ºN and 10ºS of the Equator, although it has
been grown successfully in India at 14ºN and has also been attempted in Brazil at 24ºS1. For
these reasons the plant is grown by a very few countries, a majority of which are located in
Africa. Africa alone supplies 75% of world cocoa, with the highest producer in the region
being Côte d’Ivoire providing 35% to total production while Cameroon comes fifth on the list
with a 5,3% share in total production as shown in figure 4.1.
Figure 4.1. Countries’ shares in cocoa production (own version with data from ICCO Quarterly Bulletin of Cocoa Statistics, Vol.XXXVIII, No.3, Cocoa year2011/12)
Global cocoa production has been on a steady rise since 2002 as well as in Cameroon as
shown in figure 4.2. This can be attributed to the effort made by governments to raise
production and productivity. However the rise has not been homogenous along the years.
From 2008 to 2010 there was a fall in cocoa production in Africa by 6.7% due to the political
unrest in la Côte d’Ivoire. Recently in 2011/12 also dry weather patterns were perceived
across West Africa leading to a drop in production by 8.9%. Cocoa production in Cameroon
1www.iita.org
0 500 1000 1500 2000
CameroonCôte d'Ivoire
GhanaNigeria
Other African countriesBrazil
EcuadorOther American countries
IndonesiaPapua New Guinea
Other Asian and Ocean…
Production in 2011/2012 (000 tonnes)
Quantity (thousandtonnes)
21
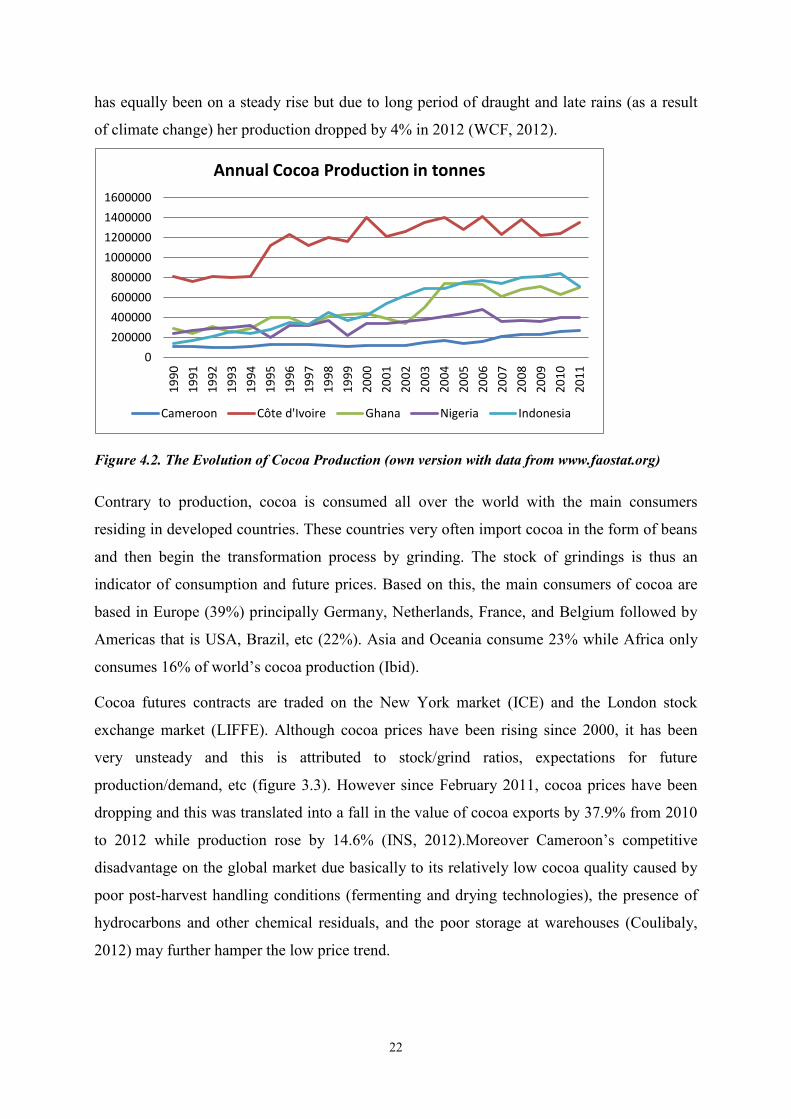
has equally been on a steady rise but due to long period of draught and late rains (as a result
of climate change) her production dropped by 4% in 2012 (WCF, 2012).
Figure 4.2. The Evolution of Cocoa Production (own version with data from www.faostat.org)
Contrary to production, cocoa is consumed all over the world with the main consumers
residing in developed countries. These countries very often import cocoa in the form of beans
and then begin the transformation process by grinding. The stock of grindings is thus an
indicator of consumption and future prices. Based on this, the main consumers of cocoa are
based in Europe (39%) principally Germany, Netherlands, France, and Belgium followed by
Americas that is USA, Brazil, etc (22%). Asia and Oceania consume 23% while Africa only
consumes 16% of world’s cocoa production (Ibid).
Cocoa futures contracts are traded on the New York market (ICE) and the London stock
exchange market (LIFFE). Although cocoa prices have been rising since 2000, it has been
very unsteady and this is attributed to stock/grind ratios, expectations for future
production/demand, etc (figure 3.3). However since February 2011, cocoa prices have been
dropping and this was translated into a fall in the value of cocoa exports by 37.9% from 2010
to 2012 while production rose by 14.6% (INS, 2012).Moreover Cameroon’s competitive
disadvantage on the global market due basically to its relatively low cocoa quality caused by
poor post-harvest handling conditions (fermenting and drying technologies), the presence of
hydrocarbons and other chemical residuals, and the poor storage at warehouses (Coulibaly,
2012) may further hamper the low price trend.
0200000400000600000800000
1000000120000014000001600000
1990
1991
1992
1993
1994
1995
1996
1997
1998
1999
2000
2001
2002
2003
2004
2005
2006
2007
2008
2009
2010
2011
Annual Cocoa Production in tonnes
Cameroon Côte d'Ivoire Ghana Nigeria Indonesia
22

Figure 4.3. Evolution of Cocoa Prices (own version with data from www.faostat.org)
One major course for concern in the global economy is the shifting demand for cocoa from
Europe and America to Asia. CTA (2013) also remarked on the rising demand from Asia (for
instance Chinese cocoa imports increased by 101% between 2011 and 2012) due basically to
the increased income level, changing patterns in consumption and demand from factories,
which in my opinion will raise cocoa prices in the future.
4.2. The history of cocoa production in Cameroon Cocoa was introduced in the Mount Fako region of Cameroon in 1886-1887 by the German
colonial occupiers who managed its production and exportation as raw materials for their
home industries. After the overthrow of the Germans by the French and British in 1922,
management shifted to the French in the Littoral, Centre and South regions and to the British
in the South West Region. Later in 1956 the Produce Marketing Board was set up in the south
West region and the Caisse de Stabilization in the Centre-South region. While the former was
charged with providing farmers with subsidised farm inputs and marketing their products, the
latter was a policy instrument served to stabilize prices thereby raising revenue for
government spending. During this period many private farms began to emerge in other
regions of the country characterized by a patriarchal management approach while the
management of state-owned farms gradually shifted from an autocratic to a landowner-farmer
contract system, accompanied by privatization (Laan and Haaren, 1990; Alary, 2000).
After independence in the 60s, young governments took over the management of these
structures and merged them together to form the ONCPB (Office National de
Commercialization des Produits de Base). This parastatal, multi-commodity institution was
00,5
11,5
22,5
3
Producer Price in dollars per kilogram
Price in CFA F
23
charged with setting farm gate prices and export prices, providing farmers with farm inputs.
The surplus generated from the excess of world price over farm gate price continued to serve
for government expenditures such as government projects and salaries to civil servants. But
this structure did not last for long due to mismanagement and embezzlement, exacerbated by
the fuel and the dollar crisis in 1973. The crisis marked the beginning of an unsteady
environment for the cocoa sector (Ibid).
Economies depending on petroleum trade like Cameroon and Nigeria saw a decline in
government revenue. After their inability to revamp the economy with technical and financial
support from the IMF, she resorted to proposing market liberalisation in 1989 as the ultimate
solution through the structural adjustment program. This essentially required that
governments reduced public expenditure and stopped their intervention in the market so as to
achieve competition and hence efficiency in the marketing system and higher welfare for all
economic agents. Soon after this change was the devaluation of the F CFA by 100% in 1994
(Coleman et al., 1993; Alary, 1996). On the one side, market liberalization is being held
responsible for welfare loss with the manufacturing sector benefiting at the expense of the
cash crop sector (Devarajan and Rodrik, 1989), for the outsourcing of farm labour to non-
farm activities (Bamou and Masters, 2007), for the deterioration of producer’s share in the
value chain (Haque, 2004), and for the fall in cocoa quality (Gilbert and Tollens, 2002).
Meanwhile Coleman et al. (1993) give credit to market liberalization for having raised cocoa
prices and producer’s profit margin in nominal terms. The end result was a stagnation of
economic activities in the rural sector which gave rise to the necessity for a policy reform.
4.3. The agro-ecological and economic climate of Cameroon
Located 6°N and 12°E at the heart of Africa, Cameroon has a surface area of 475,650 km2
(12.5% arable, 2.5% permanent crops). The heterogeneous climate across the national
territory confers it five agro-ecological zones which include the soudano-sahelian, the high
Guinea Savanna, the High Western Plateau, the Humid Forest zone with high monomodal
rainfall and the Forest zone with bimodal rainfall (DSDR, 2005). This favours the cultivation
of a wide variety of crops ranging from cotton, millet and onions in the North to cocoa,
potatoes and yams in the south. The major cash crops include cotton, cocoa, rubber, coffee,
palm oil, and banana. Cocoa is grown in eight out of the ten regions of Cameroon, occupying
an estimated area of 450,000 hectares (www.icco.org).
24

Approximately 20 million people live in Cameroon, growing at 2.6% annually, accompanied
by a population density of 46.3 inhabitants per square kilometre. Over 48% of her population
live in the rural area, plagued with a poverty rate of 48% across the national territory (INS,
2011). With an unemployment rate of 30%, the agricultural sector employs 70% of her labour
force corresponding to 7.836 million people (www.economywatch.com), while approximately
5 million people are involved directly or indirectly in the cocoa sector with 600,000 of them
being cocoa producers (www.icco.org).
Cameroon is a low middle income country with a GDP of 25.24 billion USD in 2011,
growing at 4.2% ( www.data.worldbank.org) and GNI per capita or purchasing power parity
is estimated at $2,330 in current international dollars. In the same year, agriculture
contributed 16.7% to the nominal GDP, forestry and livestock made a 5.5% contribution
while the tertiary, manufacturing, and oil &mining sectors contributed to 47.6%, 16.7% and
8.6% respectively, with the rest being accounted for by construction and utilities (IMF, 2012).
At the level of foreign exchange, cocoa exports accounted for 12% of total exports in the
same year while oil (the principal source of foreign earnings) accounted for 50%. Other
sources of non-agricultural commodities include minerals like aluminium, bauxite and iron,
manufactures and services. However a negative balance of trade of 1 billion was recorded and
is expected to rise by 4% each year until 2013 (KPMG, 2012); a reason for which policy
makers have been directing efforts to raise the production and productivity of cash crops to
curtail this deficit.
25
5. The empirical study and Results This chapter presents the methods used to manipulate the data collected, a descriptive
statistics of the data and a presentation of the regression results.
5.1. Data preparation
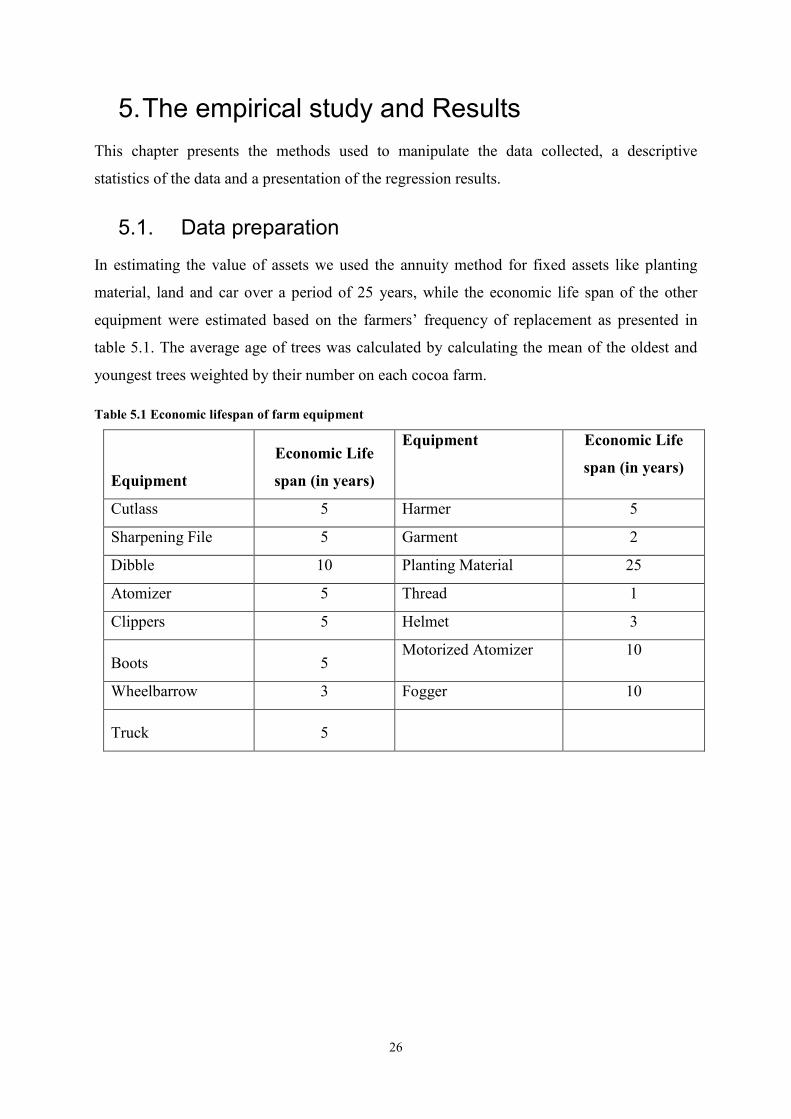
In estimating the value of assets we used the annuity method for fixed assets like planting
material, land and car over a period of 25 years, while the economic life span of the other
equipment were estimated based on the farmers’ frequency of replacement as presented in
table 5.1. The average age of trees was calculated by calculating the mean of the oldest and
youngest trees weighted by their number on each cocoa farm.
Table 5.1 Economic lifespan of farm equipment
Equipment
Economic Life
span (in years)
Equipment Economic Life
span (in years)
Cutlass 5 Harmer 5
Sharpening File 5 Garment 2
Dibble 10 Planting Material 25
Atomizer 5 Thread 1
Clippers 5 Helmet 3
Boots 5 Motorized Atomizer 10
Wheelbarrow 3 Fogger 10
Truck 5
26

5.2. Data presentation
The general characteristics of the farmers include their socio-economic characteristics, the
production characteristics of their farms and the marketing characteristics.
5.2.1. Overall presentation of data
In this sub-section we present farmers’ characteristics without making any distinction in the
farm sizes.
5.2.1.1 Socioeconomic characteristics
The average age of the farmers was 52 years, with an average household size of 7 members
per household. They had approximately 8years of formal education and 15 years of
experience in cocoa farming. Details can be seen in table 5.2.
Table 5.5.2. Socioeconomic characteristics of farmers
Variable Mean Std. Dev. Minimum Maximum
Age (years) 51.8 10.3 29.0 70.0
Household size 7.0 6.0 1.0 37.0
Education (years) 7.8 4.9 0.0 20.0
Experience (years) 15.5 16.4 0.0 76.0
Similarly, most of the farmers (82.5%) were married, while 10% were single and 7.5% were
widowers; all of whom were males except one that was female. Over 85% of the farmers were
peasants, 12.5% were civil servants and 2.5% were self-employed, carrying on petit
businesses alongside agriculture. The major agricultural activities in the zone include the
growing of cash crops which are essentially cocoa and coffee (51.4%), the growing of food
crops like coco yams, plantains, cassava, etc (25.7%) and fishing and hunting together
amounting to 22.9%. Finally 67.5% of the farmers had received training as opposed to 32.5%
without any training in cocoa farming. The major trainers were the Ministry of Agriculture,
IITA through the Sustainable Crop Tree Program and SODECAO.
27

5.2.1.2 Production characteristics
The mean farm size was 4.2 hectares, each farm containing 1298 trees per hectare on average
while the average age of the cocoa trees was 31.2 years. The average annual output was 1654
kilograms with a very high variability due to differences in the age of the trees, soil fertility,
pest attacks, wind disaster, etc. For instance, the low level of output for the 6.0 hectares was
due to the fact that the cocoa trees were very young – the farmer had just performed his first
harvest. Usually cocoa trees’ bearing capacity increase gradually as they get older and attain
their maximum at about 5 to 10 years of age depending on the cocoa variety. The 20 ha farm
on its part was under maintenance, that is, replanting of new trees and pruning of the existing
old trees. The high performance of the 12 hectare cocoa farm could be attributed to the
maturity of the cocoa trees, and the perfect knowledge in cocoa production techniques since
this farmer is an agricultural extension officer (see figure 5.1).
Cocoa is planted in association with other crops such as banana/plantains, cocoa yams and
fruit trees. Although fruit trees may remain in association with the cocoa trees all through
their life, this may not be the case for the food crops as the cocoa trees tend to completely
shade the farm at maturity; thereby reducing the chances for lower crops to grow.
Figure 5.1 Annual Output
Most of the phytosanitary products were fungicides, insecticides and herbicides used to fight
the cocoa brown rot and capsids. Their use depended greatly on the prevalence of disease
invasion and the age of the trees. It is worth noting that trees below the age of 4 years are not
0,00
2000,00
4000,00
6000,00
8000,00
10000,00
12000,00
14000,00
16000,00
Out
put
Total Physical Product
Y
28

normally treated with any of these chemicals. Labour in this region is basically provided by
the family (57.0%), while the rest (43.0%) is hired. There are various forms of hired labour,
ranging from community work (members of a particular group help out each member on his
farm), seasonal labourers (usually needed for clearing, pruning and harvesting) to permanent
labourers (recruited as farm managers). The standard wages include 30,000 CFA F/hectare for
clearing, 60,000 CFA F per hectare for cutting down trees and 60,000 CFA F per hectare for
staking. Details can be viewed in table 5.3.
Table 5. 5.3. Production characteristics according to farm size
Variable Mean Std. Dev. Minimum Maximum Farm size (ha) 4.17 3.71 0.25 20.00 Age of trees (years) 31.24 22.35 3.00 80.00 Planting density ( /ha) 1297.7 282.7 900.0 2,500.0 Output (kg) 1,654.2 2,594.1 5.0 15,000.0 Exp. on phytosanitary prdts (CFA F) 71,038.0 86,939.0 9,438.8 477,750.0 Exp. on Labour (CFA F) 19,8720.0 1,020,600 0.00000 6,480,000.0 Exp. on farm equipment (CFA F) 71,038.0 86,939.0 9,438.8 47,7750.0 Exp. on land (CFA F) 2,917.5 12,289.0 0.00000 72,000.0
Most of the farmland (87.5%) was acquired through heritage while 7.5% was bought and
5.0% was donated by the state to young farmers within the framework of the PAIJA project.
Actually, there is a minimum set of tools that each farmer possesses including machetes, file,
and atomiser to a lesser extent, but they tend to borrow extra tools like the motorised
atomiser, wheelbarrow from neighbours, thereby minimising cost. The large-scale farmers
tend to be fully furnished with rain boots, garments, and even cars which may not be cost
effective, hence higher average cost.
29

Figure 5.2 Input shares in total expenditures
Figure 5.2 shows that annual expenditures is highest on labour, followed by expenditures on
phytosanitary products, next by expenditures on the procurement of farmland and last by
expenditures on farm equipment and planting material. This confirms the fact that cocoa
farming is a labour-intensive activity.
5.2.1.3 Marketing characteristics
Most of the farmers (70%) were members of a farmer group. However not all market their
cocoa through the group – 25 (62.5%) practice group selling, while 12 (30%) sell individually
and 3 (7.5%) use both media to market their produce. Their reasons of choice are diversified -
over 37% of the farmers think that group marketing is not a advantageous either because they
do not benefit from any improvement in price or because the selling schedule doesn’t match
the period of farmer’s need for cash. Meanwhile the majority think that group marketing is
beneficial for several reasons - 35% of the farmers target high selling prices thanks to a higher
bargaining power, 12% of them channel their goods via the group because they find the
selling point accessible and do not have any incentive to sell at their individual residences
since it also permits them to socialize and increase the range of buyer prices; 10% of them
were constrained by their indebtedness to the group since it provided them with farm inputs
on credit at the beginning of the farming season, and 5% attributed their choice to internal
rules and regulations of their groups restricting them from selling outside their association.
The advice from the agricultural field workers discouraging the sale of cocoa to door-to-door
buyers also accounts for the high rate of group selling.
30

The farmer’s choice of selling medium determines the exact place where he sells his produce
– 62.5% sell at the site designed by the group (usually at a member’s residence or at the
regular meeting place in the neighbourhood of the majority of its members), 27% sell at their
individual residences, 5% sell at either of them and the rest may convey their produce to the
village market place or along the road side.
Apart from two, no other farmer keeps records of farm expenditures and other farm operations
hence none considers the unit cost of production before fixing a price for their produce;
though some argued that it would be in vain since their ability to determine the selling price
was very minimal – in other words they are price takers. Therefore selling price was
determined on the basis of the free on board price (32.5%), neighbouring district markets
(27.5%), farmer group for members (22.5%) and 15% negotiate with the buyer based on his
proposal without considering prevailing prices. The selling prices vary as much as the selling
medium and sales point.
5.2.2. Data presentation according to farm categories
Based on farm sizes, our sample can be grouped into 3 categories – small-scale farms,
medium-scale farms and large-scale farms. Overall, farms with surface area less than 2
hectares inclusive were considered as small-scale farms while medium-scale farms lie strictly
between 2ha and 5ha, and large-scale farms are considered to be equal to or greater than 5
hectares. Table 5.4 presents both nomenclatures.
Table 5.5.4. Categorization according to farm sizes
Category Range of farm size Frequency Percentage
Small-scale 0.25 – 2.00 ha 15 37.5%,
Medium-scale 2.50 – 4.00 ha 11 27.5%
Large-scale 5.00 – 25.00 ha 14 35.0%
The categorisation of farms based on their maturity at production and marketing tends to
exclude a good portion of farmland owned by the individual farmers. As a matter of fact, 19
farms would fall under a different farm category if the selection criteria were not applied.
That is, we would have 6 farms less in the small-scale category and 6 farms more in the large-
scale farm category. In a nutshell, close to 50% of the farmers had young cocoa plantations,
and only 22% of our sample size actually have surface area inferior to 2 hectares.
31

5.2.2.1. Socioeconomic characteristics according to farmer categories
Table 5.5 shows that small-scale farmers have an average age of 48.7 years (ranging between
32 and 62 years). Exactly 80% were married, 6% unmarried and 13% widowers; and all
smallholders were practicing agriculture as major occupation. They have a relatively smaller
household size of 5 (ranging from 2 to 8 people), the least educated with an average of 7 years
of formal education (varying from 0 to 10 years), having the least experience in cocoa
farming of 10 years (which is also highly variant ranging from 0 to 38 years) but 53% of them
had received training in cocoa farming, which is the lowest among the three groups.
Table 5.5.5. The socioeconomic characteristics of farmers according to farmer categories
Variable Small-scale Medium-scale Large-scale
Age of farmer (years) 48.7 (9.1) 52,7 (12,63) 54,5 (9,48)
Household size 5 (1.87) 5 (3,25) 11 (9,16)
Education (years) 7 (4.0) 8 (4,47) 9 (6,06)
Experience (years) 10 (9,7) 15,5 (15,5) 21,28 (21,31)
Training 8 (53.3%) 7 (63.6%) 12 (85.7%)
Medium scale farmers on the other hand were older than the small-scale farmers with an
average age of 53 years and ranging between 29 and 69 years. Contrary to the small-scale
farmers, 18% were not married as opposed to 73% married and 9% widowers. The average
household size was 5 (ranging from 1 to 7 members per household). The average level of
education of these farmers was slightly higher (8 years, ranging between 0 and 16 years). The
majority (91%) had agriculture as major occupation while only 9% of them were civil
servants. Experience in cocoa farming was higher on average (15 years) with a wide range of
0 to 45 years.
The large-scale farmers fall among the older age group with an average age of 54 years
(interval: 38-70 years), the majority were married 85% as opposed to 5% unmarried and 10%
cases of widow. They had the largest household size of 11 members per household ranging
from 2 to 37 persons and the highest level of education corresponding to 9 years on average
(ranging between 0 and 20 years). Although the majority (75%) had agriculture as major
occupation, up to 25% of them were civil servants. Also the most of the farmers (85.7%) had
32

received training in cocoa farming as opposed to 24.3% who had not received any training,
and they equally had experience in cocoa farming than all other groups.
Correlation Analysis of socioeconomic characteristics and farm size
A positive correlation coefficient was observed between farm size and household size of 0.47,
farm size and education of 0.43, farm size and farmer’s age of 0.16, and farm-size and
experience in cocoa farming of 0.07. Based on a 5% significance level with critical value of
0.312 (two - tailed test), only household size and education are significant. However the only
characteristic that was observed to be statistically significantly different across the farmer
categories was the household size. The positive coefficient for household size can be
explained by the fact that having a large household size gives an incentive to farmers to
expand their farms, and this family labour serves more for coordinating and supervising farm
operations (this is why larger famers would spend at least 3 times more on labour as shown in
figure 5.3 despite available family labour) – hence minimising the risk of moral hazard
associated with hired labour and the high cost of supervision.
(a) (b)
Figure 5.3. Relationship between farm size and household size (a) and farm size and household size per hectare (b)
Therefore raising household size may increase with farm size (figure 5.3a) but family labour
may not be sufficient enough to meet the labour needs of the larger farms since household per
hectare is shown to decline (figure 5.3b).
Our analysis also reveals that experience in cocoa farming is positively correlated with
farmer’s age (correlation coefficient = 0.64) but negatively correlated with the level of
education (correlation coefficient = 0.55). This implies that those who have been growing
cocoa before the millennium policy are actually advanced in age and have a lower level of
33

education than the relatively new cocoa farmers as stipulated by DSDR (2005). Contrary to
their report the higher the farmers’ experience in cocoa farming the larger their farms
(correlation coefficient of 0.07), therefore large-scale farmers are not new in the sector. This
can be partly explained by the fact that the already existing cocoa farmers expanded their
farms after the policy incentive, and also by the fact that the new generation farmers (mostly
the small-scale farmers) started by exploiting small parcels of land, but intend to expand the
sizes of their farms progressively. This is especially true because about 50% of the farmers
had young plantations which were excluded from our sample.
5.2.2.2. Production characteristics according to farmer category
The small-scale farms have a mean size of 1.35 hectares, carrying the youngest trees (28 years
on average) with the highest planting density of 1392 trees per hectare and the average age of
trees is 30 years. Small-scale farmers do not incur any expenses for the procurement of their
land since it is obtained through heritage. Meanwhile approximately 10% of the medium-
scale and large-scale farmers purchased their land while the rest was inherited and about 18%
of the medium-scale farmers received the land in the form of a gift from the government. The
greater share of the small-scale farmer’s budget is spent on the purchase of phytosanitary
products (36%) while 27% is spent on the purchase of planting materials, 22% for farm
equipment and 15% on labour as shown in figure 5.4.
Figure 5.4. The input shares in total expenditures based on farm categories
0%
39%
13% 15% 17%
51%
36%
17% 20%
27%
13% 8%
22%
14% 9%
0%
10%
20%
30%
40%
50%
60%
Small-scale Medium-scale Large-scale
Land Labour Phyto Plt.mat. Equipt
34

Meanwhile the medium-scale farmers spend most on the acquisition of land (39%),
approximately same expenditure on labour and phyotosanitary products (17% respectively)
and least on equipment and planting material (14% and 13% respectively). The planting
density on medium farms is lower (1301 trees per hectare) and the trees are older (29 years on
average). The large-scale farmers incur high costs on hiring labour (51%) followed by
phytosanitary products (20%), land (13%), equipment (9%) and least on planting material
(8%). Their cocoa trees are sparsely populated (1193 plants per hectare) and are the oldest (36
years) of the three categories as shown in table 5.6.
Table 5.5.6. The production characteristics of farms according to farm categories
Variable Small-scale Medium-scale Large-scale Actual farm size in production (ha) 1.35 (0.51) 3.41 (0.73) 7.78 (4.10)
Total cocoa farm size (ha) 2.55 (1.63) 5.00 (2.50) 10.00 (6.14)
Average age of trees (years) 27.9 (21.03) 29.2 (25.9) 36.4 (21.4)
Planting density (no. plants per ha) 1392 (224.92) 1301 (426.11) 1193 (153.76)
Group selling price (CFA F/ Kg) 877.5 (431.7) 995.0(506.4) 917.5(432.3)
Individual selling price (CFA F/ Kg) 735.7 (405.8) 818.7 (414.2) 735.0 (403.7)
The relatively low expenditures on labour by small-scale farmers is explained by the fact that
their household size is sufficiently large enough to provide labour that they do not require any
external supply of labour. In the case of large-scale farmers, they have large households but
do not supply enough labour needed on their farms, so they hire extra labour to fill the gap.
The higher planting density observed for small-scale farmers is as a result of many factors:
the random spacing method gives room for more trees to be planted than the square or
diagonal spacing method; secondly most large farms were being rejuvenated and only the
mature trees were counted; thirdly some trees were lost to a storm last year, this reduced the
population of trees in the Abem locality of Akonolinga sub-division.
35

Correlation analysis of production characteristics and farm size
Tree age was observed to be positively correlated with farm size (0.18) while density as
already mentioned declined with farm size (-0.14). This is consistent with the fact that
experience and farm size are positively correlated.
Information about the correlation between average input cost (measured in CFA F per
hectare) and farm size appears to be more interesting. It was observed that farm size was
positively correlated with average expenditures on hired labour (0.07 points) and expenditures
on phytosanitary products (0.07 points) though the correlation coefficients are not statistically
significant. The positive correlation sign for phytosanitary products could be explained by the
fact that older trees require more use of pesticides than the younger trees (and tree age was
observed to increase with farm size). In the same line of reasoning, larger farms require more
labour, though expenditures on these two inputs increase less proportionately with farm size.
On the other hand, average expenditures on land, planting material and equipment were
observed to decline with farm size. That is, they had correlation coefficients of -0.0764, -
0.1474 and -0.0502 respectively (but not statistically significant at 10% significant level).
This can be attributed to economies of scale associated with bulk buying.
5.2.3. Regression Results
This section presents the results based on the objectives outlined at the beginning of our work,
that is, a description of farm yield, costs, profitability and marketing strategies used by
farmers as well as the tests of the three hypotheses earlier mentioned.
Farm Yield: Farm yield was observed to take values from 0.8 to 800 kilograms per hectare,
with a mean of 131.4 kilograms per hectare (standard deviation was 155.3). This level of
production is far below the level of cocoa productivity in Cameroon which was estimated at
485 kg per hectare in 2008/2009. Estimation results from the OLS estimator with
heteroskedasticity-robust standard errors (HC1) are presented in Table 5.7.
36

Table 5.7 Regression results for factors affecting Farm Yield (R-squared = 0.60)
Coefficient Std. Error t-ratio p-value const 10.4945 5.14693 2.0390 0.04953** l_Farm_Size -1.20196 0.180218 -6.6695 <0.00001*** l_Density -1.05147 0.721836 -1.4567 0.15466 l_Treeage -0.00321685 0.216425 -0.0149 0.98823 l_educ -0.223278 0.206748 -1.0800 0.28799 l_Experience 0.435367 0.236569 1.8403 0.07473* l_hhsize 1.10956 0.245538 4.5189 0.00008***
Table 5.7 shows that the estimated elasticity of a 1% change in farm size with respect to yield
is -1.2% (one-tailed p-value is 1.4 x 10⁻⁷) decline in yield.
Cost advantage: This section analyses the average costs incurred by the farmers each year
and tests the second hypothesis (model 3). On average, approximately 80,300 CFA F per
hectare was spent by a cocoa farmer each year. In the sample, average costs range from
12,000 CFA F per hectare (minimum) to 1,178,933 CFA F per hectare (maximum) each year.
Table 5.8 Regression results for factors affecting average cost (R-squared = 0.50)
Coefficient Std. Error t-ratio p-value const 5.41522 2.72932 1.9841 0.05588 * l_Farm_Size -0.297205 0.1777 -1.6725 0.10417 l_age 0.772879 0.600127 1.2879 0.20703 l_hhsize -0.158212 0.155881 -1.0150 0.31774 l_Experience -0.3324 0.156251 -2.1273 0.04119 ** l_Labour 0.0451536 0.024417 1.8493 0.07368 * l_Phyto 0.0515742 0.0244207 2.1119 0.04259 ** l_Equipt 0.324557 0.159397 2.0362 0.05008 *
The OLS regression results are presented in Table 5.8 using heteroskedasticity-robust
standard errors, variant (HC1).
Marketing strategy: This section describes the methods used by the farmers to market their
products. The variables examined here include the medium (or channel) by which farmers sell
their produce (group selling or individually), the reasons for their choice, their knowledge
about market price, the source of this information and the effective selling price.
Of the 25 farmers who practised group marketing, 36% were small-scale farmers, while 36%
were large-scale farmers and the rest of the 28% were medium-scale farmers. The majority of
those who sold individually (41%) were small-scale farmers as opposed to 33% large-scale
farmers. Alternatively most of those who sell their cocoa in isolation are the small-scale
37

farmers (33.3%) followed by the large-scale (28.6%) and the medium-scale (27.3%) farmers
while the rest (25%) were middle-holders. Although the proportion of small-scale farmers
selling in group was same as the large-scale holders, their reasons for this choice differ.
Profitability: In this section the profit margins of farmers are estimated as well as the test of
the third hypothesis discussed in section 4.3. Farmers’ profitability ranged from 0.003 to 9.7,
with a mean value of 2.2 (standard deviation was 2.4). The OLS regression analysis for model
6 is summarised in table 5.9, using heteroskedasticity-robust standard errors, variant (HC1).
Table 5.9 Regression results for factors affecting profit (R-squared = 0.65)
Coefficient Std. Error t-ratio p-value const 3.6412 4.93691 0.7375 0.46634 l_Farm_Size -1.2392 0.329397 -3.7620 0.00070 *** l_age -1.68323 1.30516 -1.2897 0.20670 l_hhsize 1.27074 0.363028 3.5004 0.00143 *** l_Experience 1.05362 0.442098 2.3832 0.02347 ** l_Labour -0.0355713 0.0429691 -0.8278 0.41409 l_Phyto -0.0234173 0.0483053 -0.4848 0.63124 l_Equipt 0.0390457 0.254081 0.1537 0.87886 l_educ -0.27917 0.270442 -1.0323 0.30993
5.2.4. Sensitivity analysis
Among over 100 alternative regression equations run, only the ones discussed above were
retained after ensuring non-collinearity among independent variables and the robustness of
the standard errors using heteroskedasticity-robust standard errors, variant (HC1). Other
criteria used for selection was the Akaike Information Criterion (AIC) and the R-squared
values.
38
6. Analysis and discussion
FARM YIELD: The null hypothesis is therefore rejected implying that small farmers have
higher yield on average. Furthermore the results show that the density and age of the trees are
statistically significant with respect to their effects on farm yield.
The most important socioeconomic factors affecting yield include household size and
experience in cocoa farming. The signs of the elasticities are analogous to their relationship
with farm size. This implies that large farm families are more effective in the supervision of
farm operations thereby minimising the risk of moral hazard and waste, since most farm
operations like pest management and harvesting require good timing and tact.
The negative elasticity for education could be attributed to the fact that education is associated
with higher off-farm income hence high opportunity cost of time on cocoa farm – this is
especially true because 25% of the large-scale farmers were civil servants and their farms
managed by hired workers on permanent salaries (see section 4.4.2). Other human skills that
could be more determining for yield include experience and training. However smallholdings
which have higher yield are owned by farmers with less training and less experience in cocoa
farming. Based on the analysis, this implies that human ability has very little influence on
output per unit area of land cultivated.
Although the model explains factors affecting yield fairly well (that is R2=0.6), other more
determining factors like disease prevalence, farm management (timeliness in weeding,
pruning and treatment), soil fertility, amount of shade or sunlight, climate, etc. could also be
included if observable.
AVERAGE COST: Results in table 2 show a negative elasticity of -2.9 (one-sided p-value of
0.104). Therefore at a 5% significance level we fail to reject the null hypothesis that small
scale farmers and large-scale farmers incur the same costs. Hence it cannot be concluded that
large farms have a cost advantage over small farms.
Average cost is equally affected by farmer’s experience in cocoa farming, expenditures on
labour, phytosanitary products and farm equipment as summarised. The positive elasticities
for expenditures on all three farm inputs are as expected, with expenditures on farm
equipment affecting costs the most. Interestingly, most small-scale farmers have derived a
39

strategy of curbing high expenditures on farm equipment by lending out and borrowing their
farm tools with their neighbours. Experience in cocoa farming is observed to affect costs
negatively. Consistent with prior interpretation, household size has no significant effect on
costs since family labour is generally not rewarded but rather employed for the supervision of
hired labourers.
MARKETING STRATEGY: The major reason of practicing group selling was to raise their
bargaining power hence higher selling price; among this group, 50% were large-holders, only
28% were smallholders and the rest 21% were middle-holders. Some other reasons advanced
by the smallholders were the benefits from credit (20%) while the rest attributed their choice
to the conformation to the rules and regulations of the organization and other social reasons.
The large farmers were also noticed to be the ones governing the farmer organizations. Those
who sold individually had many reasons for doing so. Some small-scale farmers explained
that they preferred to sell at their homes because they felt that they were being cheated by the
members in charge of marketing within their farmer groups. Another reason for preferring not
to sell through the cooperative was the fact that the schedule drawn up by the cooperative did
not always coincide with the period when the famer needed cash, including the possibility of
selling to door-to-door retailers at no cost.
As a result of their higher bargaining power, group prices are high (923 CFA F per kilogram)
compared to 756 CFA F per kilogram when sold individually with a mean selling price of 622
CFA F per kilogram of dry cocoa beans. Also, a positive correlation was observed between
farm size and average selling price of 0.05 but we fail to reject the null of no correlation at 5%
significant level. This implies that statistically, large-scale farmers have the same selling price
on average like the small-scale farmers. This may suggest that there is a spillover effect in
market prices. This is plausible because farmer organizations are heterogeneously made up of
both large-scale and small-scale farmers; a unique selling price is applied to all members of
the same farmer organization, especially for groups which provide loans to their members and
those which sum up all members’ produce tend to be rigorous about the quality. This gives
little room for price differentiation according to cocoa quality and individual volume of
produce. However there is a possibility for price differentiation according to difference in
quality for farmers selling through farmer organizations and those selling individually.
Unfortunately the measure of cocoa quality is very subjective and buyers always tend to rely
on poor quality to tax low prices on farmers’ produce.
40

PROFITABILITY: Results show that 1% change in farm size will cause a decline in farmer’s
profit by -1.2% (one-sided p-value of 0.0007), hence we reject the null that both farms are
equally profitable. Therefore small-scale farms are more profitable than larger ones. This
inverse relationship can be attributed to the fact that the high yield observed by smallholders
offsets their cost and price disadvantage. Again, household size which was the major
determining factor for yield, and experience for average cost resurface here - they affect profit
positively.
41

7. Conclusions This section presents a summary of the results discussed in the previous chapter and the
proposition of some recommendations.
7.1. Synthesis of Results
The analysis of the data reveals that:
Cocoa farming in the Nyong and Mfoumou division is still being practiced by the
indigenes. The smallholders and large-holders have similar socioeconomic characteristics
except for household size, with the large-scale farmers having larger households.
Moreover the fact that 50% of farmers had young (immature) cocoa plantations leads us to
believe that the new policy provided an incentive for farmers to expand their farms, more
than it did to attract new farmers into the sector.
Small-scale farms have higher yield than large-scale farms. More experience in cocoa
farming and larger farm families appear to be primordial for high yield. This is because
available family labour would imply low costs of supervision, hence low risk of moral
hazard and pre- and/or post-harvest loss.
None of the farmers had a cost advantage. This is so because expenditures on hired
labour, phytosanitary products and equipment raise average cost. Large-scale farmers
incur higher costs on average for these inputs, but their higher experience in cocoa
farming enables them to use their resources more efficiently thereby conferring them
lower average costs (though statistically insignificant).
Large-scale farmers are more business-oriented as they are observed to participate more in
collective marketing, organise sales and sort reliable information about the free-on-board
prices. Although their selling prices were observed to be slightly higher than those of
smallholders, the difference was not statistically significant.
Based on actual expenditures, it can be concluded that large-scale farms are less profitable
than small-scale farms. This can be attributed to the fact that their slightly higher market
prices and lower costs are not enough to offset the effect of the low yields observed. Also
large family farms and higher experience in cocoa farming are suitable for higher profit.
42

The major goal of this study was to investigate if there is any economic benefit to farmers
cultivating cocoa on a large scale. The starring point revealed by this thesis is that it is
relatively less efficient to produce cocoa on extensive farmlands as larger farms have been
observed to have lower yield and profit on average. The family size and experience in cocoa
farming are necessary to raise this efficiency. Furthermore, high level of education is not
warranted for high economic performance in cocoa production, but rather experience in cocoa
farming.
7.2. Recommendations
Although large-scale farms are less efficient, it may be noted that large-scale cocoa farmers
present more of an opportunity than a threat to smallholders. In their optimistic view of the
future of small-scale farmers, Zulauf and Irwin (1998), state that “crop producers who survive
will be those with the lowest cost of production because efforts to improve revenue through
better marketing will have limited success”. Based on results in this paper whereby a negative
(but insignificant) relationship was captured between costs and farm size, this leads to the
thought that small-scale farmers will be experiencing high competition from their
counterparts. Their competitiveness could be raised by subsidising farm inputs, especially
farm equipment.
The co-existence of both farmer categories could be encouraged. Collier and Dercon (2009)
suggest that policies fostering their co-existence and interaction will possibly lead to a
spillover effect from on-farm observations (learning), experience sharing and a joint strategy
to curb the risks imposed by climate change. This is plausible because the current study
reveals that large-scale farmers manage the farmer organizations and attract high selling
prices which tend to benefit the entire community. The government is therefore advised to
strengthen and institutionalize the marketing cooperatives.
The fact that most farmers have young cocoa plantations leads to the conclusion that
government’s effort to modernise the cocoa sector has given both the old and new farmers the
incentive to expand their farms. Larger farms may have a higher bargaining power on output
prices but tend to lose this advantage due to high transaction costs when working with a hired
labor. Moreover cocoa farming is a labour-intensive activity amid labour scarcity in the
region studied, leads to the conclusion that the policy is not sustainable. It is expected that in
the long run large plantation owners will partition their farms into smaller units and rent them
out to small farmers, thereby introducing a new form of farming system, which very often
43

results to disputes. In the absence of potential tenants, they could simply abandon the farms.
To curb this, the government is advised to place an upper limit to the sizes of cocoa
plantations.
Other important areas of intervention by the government is to encourage the processing of
cocoa at the cooperative level to add value hence the profit margin of the farmers, encourage
organic cocoa farming and product certification to attract a premium on their products.
7.3. Limitations and Future Research
The analysis presented in this thesis has been constraint by the data on farm inputs which
were in monetary terms rather than in physical (quantitative) terms like labour and pesticide
use. Therefore a field study providing this information would allow for more rigorous
analyses like measuring technical and scale efficiency, and total factor productivity.
Secondly the timing of the field study did not permit the involvement of many ‘new’ cocoa
farmers in the sample, due to the selection criteria used. Therefore a similar field work in
subsequent years may allow for the participation of this class of farmers in our survey.
Thirdly the fact that farmers only guessed or provided approximate figures about their farm
size, expenditures on inputs could be potential sources of inaccuracy of the analysis.
Therefore for effective policy needs, it would be necessary to actually do these calculations
and measurements with the farmers using ideal tools and instruments like the global
positioning system (GPS).
Finally it is recommended that future research considers the opportunity costs of family
labour and inherited farmland, for a more rigorous economic analysis. It should focus on labor
productivity in relation to socioeconomic factors, non-cocoa income sources and the role of
agricultural education and extension in order to improve the competitiveness of Cameroonian
cacao smallholders.
It is hoped that this study contributes to the current debate about the optimal size of cocoa
farms, since it is revealed that farm size alone is of little relevance for a highly labour-
intensive crop but instead market access, negotiation power and cost effectiveness matter
more for competitiveness.
44

8. Bibliography Achancho, V., 2006. Café et Cacao au Sud Cameroun : Evolutions et Contrastes Sociaux.
Grain de Sel, No 34-35, Mars-Aôut 2006.
Afari-Sefa, V., Keladoue, D. F., Gockowski, J., Lapbim J., Yeanue, D., and Oguntade, A.,
2009. The productivity of cocoa systems in West Africa. 7th regional executive
Committee meeting Accra, Ghana. STCP/IITA Oct 25-28, 2009
Alain Bernard, 2008. Une organisation interprofessionnelle du café cacao au Cameroun, pour
quels services et au bénéfice de qui ? Conseil Technique pour l’Agriculture, CTA
Alary V., 1996. La Libéralisation de la Filière cacaoyère vue et vécue par les planteurs du
Cameroun
Alary, V., 2000. Les Cacaoculteurs Camerounais Face aux Risques. L’Hamattan. 236 pages
Asare, R. and Sonii, D., 2010. Planting and replanting and tree diversification in cocoa
systems.A Guide for Participatory farmer training. Forest and Landscape Denmark,
Development and Environment No. 13-2010
Bamou, E. and Masters, W., 2007.Distortions to agricultural incentives in Cameroon.
Agricultural Distortions Working Paper 42, December 2007
Bernard & Spielman, 2008. Reaching the rural poor via rural producer org (RPO)? A study of
agricultural marketing cooperatives in Ethiopia
Binswanger, H.P., Deininger, K., Feder, G., 1995. Power, Distortions, Revolt and Reform in
Agricultural Land Relations. In: Behrman, J., Srinivasan, T.N. (Eds.), Handbook of
Development Economics, Vol. IIIB, Elsevier, Amsterdam, 2659-2772.
Birner, R and Resnick, D., 2010. The Political Economy of Policies for Smallholder
Agriculture.World Development Vol. 38, No. 10, pp. 1442-1452, 2010.
Boateng, M., Rachford, B. and Blase, M., 1986. Profitability studies of a farming system in
Africa. Agricultural Systems 24 (1987) 81-93
Coelli, T., Rao, P., O’Donnell, C. and Battesse, G., 2005.An Introduction to Efficiency and
Productivity Analysis.Second ed. Springer.
Coleman J. R., Akiyama T. and Varangis P. N., 1993. How Policy Changes affected cocoa
sectors in sub Saharan African countries. Policy Research, WPS 1129
Collier, P. and Dercon, S., 2009. African Agriculture in 50 Years: Smallholders in a Rapidly
Changing World? Expert Meeting on How to Feed the World in 2050. Food and
Agricultural Organization of the United Nations and Economic and Social
Development Department
45

Conway, G., 2011. On being a smallholder. Conference on new directions for smallholder
agriculture, 24-25 January, 2011.
Coulibaly, N., 2012. Faire de la Cacaoculture une activité Rentable. Conférence Mondiale du
Cacao en Côte d’Ivoire. 19-23 novembre 2012
De Janvry, A., Platteau, J.F., Gordillo, G., Sadoulet, E. (2001). ―Access to land and land
policy reforms‖, in De Janvry, A., Platteau, J.F., Gordillo, G., and Sadoulet, E. (Eds),
Access to Land,Rural Poverty, and Public Action, Oxford, Oxford University Press.
Debertin, D., 1986. Agricultural Production Economics. Collier Macmillian Publishers
Delgado, C. L., 1995. Africa’s Changing Agricultural Development Strategies: Past and
Present paradigms as a guide to the future. Food, Agriculture and the Environment
discussion paper 3 (IFPRI, 1995)
Delgado, C. L., 1997. The role of smallholder income generation from agriculture in sub-
saharan Africa inAchieving food security in southern Africa: new challenges, new
opportunities. IFPRI
Devarajan & Rodrik, 1989. Pro-competitive effects of Trade reform.
Dixon, J., Taniguchi, K., Wattenbach, H. and Tanyere-Arbur, A., 2004.Smallholders,
globalization and Policy Analysis.FAO, 2004.
Document de Strategie de Developpement du Secteur Rural (DSDR), 2005.
Dorward, A., 1999. Farm size and productivity in Malawian smallholder agriculture, The
Journal of Development Studies, 35:5, 141-161
Eastwood, R., Lipton, M. and Newell, A., (2008) “Farm Size”, Chapter 5 of R. Evenson and
P. Pingali (eds) Handbook of Agricultural Economics, vol. III., North Holland.
Ellis, F. 2005. ‘Small-Farms, Livelihood Diversification and Rural–Urban Transitions:
Strategic Issues in Sub-Saharan Africa. Paper presented at the Research Workshop on
the Future of Small Farms, organised by IFPRI, Imperial College and ODI, Wye, June
2005.
Elong, J. G., 2011. L’elite urbaine dans le projet de la relance de la cacaoculture par la
SODECAO dans le Cameroun forestier in L’elite Urbain dans l’Espace Agricole
Africaine. L’Harmattan
Eswaran, M. and A.Kotwal, (1986), “Access to capital and agrarian production organization”,
Economic Journal, 96, pp. 482-498 Evidence.Staff Paper P91-43, Department of
Agricultural and Applied Economics, University of Minnesota, St. Paul.
FAO, 2010. Policies and Institutions to support smallholder agriculture
46

Farrell, M., 1957.The measurement of productive efficiency Journal of the Royal Statistical
Society. Series A (General), Vol. 120, No. 3 (1957), 253 - 290.
Freud, P., Petithuguenin, P. and J. Richard, 1996. Innovation in West African smallholder
cocoa: some conventional and nonconventional measures of success. Unité de
recherche économie des filières. No 26 - Janvier 1996
Gilbert &Tollens, 2002. Does Market Liberalization Jeopardize Export Quality? Cameroonian
Cocoa, 1995-2000
Haque, I., 2004. Commodities under neoliberalism: the case of cocoa. G-24 Discussion Paper
Series, UNCTAD No 1, 2004
HLPE, 2011.Report 2: Land tenure and international investments in agriculture.High Level
Panel of Experts on Food Security and Nutrition. July 2011
HLPE, 2012. Report 3: Food Security and Climate Change. High Level Panel of Experts on
Food Security and Nutrition. June 2012
IFAD, 2010. Rural poverty report 2011. International Fund for Agricultural Development,
Rome.
IFAD, 2011.Proceedings. International Fund for Agricultural Development Conference on
New Directions for Smallholder Agriculture, 24–25 January 2011. Rome.
International Monetary Fund, 2012. Cameroon: 2012 Article IV consultation. IMF Country
Report No.12/237
INS, 2008. Annuaire Statistiques du Cameroun. Institut National des Statistiques du
Cameroun
INS, 2011. Chapitre 4. Caractéristiques de la population in Annuaire Statistique du Cameroun
Janin Pierre, 1999. L’avenir des planteurs camerounais: resister ou soumettre au marché ???
Jayne, T. S., Isaac, J. Minde, and Gem Argwings-Kodhek, 2002. Perspectives on Agricultural
Transformation: A View from Africa. ISBN: 1-59033-344-6
Jayne, T. S., Mather, D. and Mghenyi, E., 2010. Principal Challenges Confronting
Smallholder Agriculture in Sub-Saharan Africa.World DevelopmentVol. 38, No. 10,
pp. 1384–1398, 2010
Johnson, N.L. and Ruttan, V.W. (1994). Why are Farms so Small? World Development,
22(5): 691-706.
Kamdem B, 2012. The determinants of market efficiency of cocoa farmer organizations in
Cameroon
Kamdem, B., Galtier F., Gockaowski, J., David-Benz, H., Egg, J. and Kamgnia, B., 2010.
What determines the price received by farmers? The case of cocoa in
47

Cameroon.Africqn Journal of Agricultural and Resource Economics Vol 6, No 1
December 2010
Kamdem, C. and Melachio, T., 2011.Impact of collective marketing by cocoa farmer’s
organizations in Cameroon. Paper presented at the Centre for the Study of African
Economics 2012 Conference
Kazianga& Masters, 2002. Property rights, production technology & deforestation: cocoa in
West Africa. Agricultural Economics 35 (2006) 19–26
Kislev, Y. and Peterson, W., 1991. Economies of scale in agriculture: a re-examination of the
existence. Department of agricultural and applied economics. Staff Paper p91-43
KPGM, 2012. Cameroon snapshot: 2012 Quarter 3
Laan, H. L., and Haaren, W.T.M., 1990. African Marketing Boards under Structural
Adjustment: the experience of Sub-Saharan africa during the 1980s. African Studies
Centre Leiden, Working paper No 13/1990.
Lipton, M. (2005). Crop science, poverty, and the family farm in aglobalizing world. 2020
Discussion paper 40.International FoodPolicy Research Institute, Washington, DC.
López and Islam, 2008.When Government Spending Serves the Elites: Consequences for
Economic Growth in a Context of Market Imperfections
Markelova, H., Meinzen-Dick, R., Hellin, J. and Dohrn, S., 2008. Collective action for
smallholder market access.Food Policy, 34 (2009) 1–7
Mundlak, Y., 2001. Chapter 1 Production and supply, In: Bruce L. Gardner and Gordon C.
Rausser, Editor(s), Handbook of Agricultural Economics, Elsevier, 2001, Volume 1,
Part A, Pages 3-85,
Nagayets, O., 2005. Small farms: current status and key trends. Research workshop on future
of small farms June26-29, 2005
Ndoping M., 2011. Cocoa and Coffee Risk Management in Cameroon: Point of view of
NCCB Cameroon in developing su-regional commodities exchanges. Global
commodities forum
Nkamleu, G. M and Coulibaly, O. M., 2000.Le choix des méthodes de lutte contre les pestes
dans les plantations de cacao et de café au Cameroun. Economierurale.N°259, 2000.
pp. 75-85.
Nyemeck, J. B., Gockowski J. &Nkamleu,G. B., 2007.The role of credit access in improving
cocoa production in West African countries. AAAE Conference Proceedings (2007)
215 - 224
OECD, 2009. Rural Policy News: China in Policy Brief. March 2009
48
Olson, K. D., 2004. Farm management: Principles and strategies. Iowa state Press. 421p
Pesticide action Network UK (PAN-UK), 2001. Sustainable cocoa production systems. Pest
management notes No 12
Peteraf, M., 1993. The Cornerstones of Competitive Advantage: A Resource-based view.
Strategic Management Journal, Vol 14, 179-191 (1993).
Porter, M., 1985. Competitive Advantage: Creating and Sustaining superior performance
Schultz, T.W. (1964), Transforming Traditional Agriculture. New Haven: Yale University
Press
Technical Centre for Agricultural and Rural Cooperation (CTA), 2013.Shifting demand for
cocoa and corporate repositioning.Agritrade 09 Sept 2012
The Platform Policy Brief, 2008.The future of smallholder agriculture. No2 October 2008
Timmer, P., 1988. Chapter 8: The Agricultural Transformation in Handbook of Development
Economics. Vol 1. 1988, Pages 275-331.
Timmer, P., 2012. Agricultural Transformation in East Asia Forum. Vol. 4 October-december
2012
Tita, D. and Nkamgnia, E., 2012. Cocoa and maize value chains analysis in five regions of
Cameroon. Consultancy report for SNV, Netherlands Development Organisation
Townsend, R.F., Kirsten, J. and Vink, N., 1998. Farm size, productivity and returns to scale in
agriculture revisited: a case study of wine producers in South Africa. Agricultural
Economics 19 (1998) 175-180
Vermeulen, S. and Cotula, L., 2010.Making the Most of agricultural Investment: a survey of
business models that provide opportunities for smallholders.IIED/FAO/IFAD/SDC,
London/Rome/Bern.
Vermeulen, S. and Goad, N. 2006.Towards better practice in smallholder palm oil
production.Natural Resource Issues Series No. 5.International Institute for
Environment and Development. London, UK.
Wilcox & Abbott, 2006. Can cocoa farmer organizations counterveil buyer market power?
World Bank, 2007. World Development Report 2008: Agriculture for development.
World Cocoa Foundation, 2012.
Zambo, B. J., Manga, J. and Manirakiza, D., 2011. L’activisme agricole des Elites urbaines au
Cameroun : socioanalyse d’une pratique en plain essor in L’elite Urbain dans l’Espace
Agricole Africaine. L’Harmattan
Zulauf, C. and Irwin, S., 1998. Market efficiency and marketing to enhance income of crop
producers. Review of agricultural economics Vol 20, No 2, pp 308-331
49

Zyl, J., Binswanger, H. and Thirtle, C., 1995. The Relationship between farm size and
efficiency in south African agriculture. Policy Research working paper 1548
Internet sources
http://agritrade.cta.int/
www.chocolate.org
www.faostat.org
www.icco.org
50

9. Appendices Questionnaire
Research Title: The productivity of large-scale cocoa farmers in Cameroon Researcher: Chi BemiehFule, SLU Supervisor: Dr. Sebastian Hess, SLU Assistant: Frederick Gaspart, UCL
Questionnaire
Preamble: In an attempt to measure their competitiveness based on farm productivity, we choose to administer this questionnaire to cocoa farmers producing on a large scale in Cameroon. The study is a partial fulfillment of the requirement of the European Masters in Agricultural, Food and Environmental Policy Analysis (AFEPA), under the auspices of the UniversitéCatholique de Louvain (UCL) and the Swedish university of Agriculture (SLU). We will appreciate your availability and promise to keep your response absolutely confidential! Results will be published after statistical analysis such that it will be impossible to trace a specific farm or region.
1. Code: 2. Date: 3. Heure:
A. Caractéristiques Socio-économiques 9. Identité: Propriétaire…. Employé…… Autre…. 10. Age: 11. Sexe: Femelle….. Male…… 12. Etat civil: Célibataire….. Marié…. Divorcé…… 13. Nombre d’enfants de moins de 18ans….. 14. Nombre de dépendants dans le foyer…… 15. Nombre d’années en éducation formelle…….. 16. Profession: Paysan…. Fonctionnaire….. Autre…… 17. Occupation principal: Agriculture….. Auto-employé.…. Employé…..
B. Caractéristiques de l’exploitation 18. Superficie de l’exploitation (en hectares): 19. A qui appartiens la terre? 20. Quand est-ce que vous avez obtenu ce terrain? 21. Les cacaoyères datent depuis combien de temps? 22. Combien d’arbres à l’hectare? 23. Quand aviez-vous effectué votre première récolte?
4. Région: 5. Département: 6. Arrondissement : 7. Localité : 8. Nom de l’entreprise :
51

24. Quelle est votre production de cacao à l’hectare par an (en Kg)? 25. Combien de fois récoltez-vous le cacao par an? 26. Quelles cultures produisez-vous en association avec le cacao? 27. Combien de fois récoltez-vous cette culture par an? 28. Quelle est votre production d’autres cultures à l’hectare par an (en Kg)?
C. Intrants et coût de production
29. Comment aviez-vous acquis votre terrain? (héritage…, Location….., Contractuel……., Achat…) Si vous êtes propriétaire,
30. Combien cette terre vous a couté? 31. Combiens d’employés embauchez-vous par année……. et par saison……..? 32. Quel salaire pour les employés permanents………….. et les employés
saisonniers…………….? 33. Si vous êtes employé, votre salaire est-il permanent ou saisonnière? 34. Quelle quantité d’engrais utilisez-vous par hectare et par an (en Kg)? 35. Combien de fois appliquez-vous de l’engrais par an ? 36. Quel type d’engrais s’agit-il ? 37. Combien coûte l’engrais par kg? 38. Quelle quantité de fongicide………, herbicide………… et insecticide……………
utilisez-vousappliquez-vous par hectare et par an? 39. Quels prix unitaires pour le fongicide……………, herbicide…………….. et insecticide? 40. Quelles autres dépenses couvrez-vous dans votre exploitation ?
Machines…..……., Sillon de fermentation…..……..
D. Coût de Transaction 41. Quelle quantité de fève de cacao vendez-vous à la fois (en Kg)? 42. Quelle quantité de cabosse vendez-vous à la fois (en Kg)? 43. Combien de vente par an? 44. Le vendez-vous en groupe, par exemple en coopérative ou individuellement? 45. Pourquoi préférez-vous la vente en groupe? 46. Pensez-vous que la vente à travers la coopérative est pénible? Si oui, de combien faudrait-
il augmenter le prix de vente pour rendre la coopérative plus attirante? 47. Vente en groupe (………….F CFA/kg): 48. Vente individuelle (………….F CFA/kg): 49. Point de vente: 50. Pourquoi préférez-vous ce point de vente? 51. Quand décidez-vous de vendre? 52. Pourquoi en ce moment? 53. D’où viennent les acheteurs? 54. Quel type de contrat avez-vous avec les acheteurs? 55. Comment déterminez-vous le prix? 56. Considérez-vous la qualité de fève en déterminant le prix? 57. Quels prix sont alloués aux qualités?
Grade 1:…….. Grade 2:…… Hors standard….. 58. Discutez-vous sur le prix de vente? 59. Sur base de quels critères? 60. Avez-vous un prix de réserve? 61. Comment déterminez-vous le prix de réserve?
52

62. Comment informez-vous du prix de marché: Internet…… , Téléphone……. , Coopérative…….. Journal……… Agent public (spécifiez)……….. Autre……….
E. Autres (infrastructure, présence d’un marché communautaire, formation, etc)
63. Quel distance entre votre champs et le marché de cacao le plus proche (…………Km) ? 64. Vendez-vous votre cacao dans ce marché? 65. Combien de fois par an? 66. Pourquoi préférez-vous de vendre ou non sur ce marché? 67. Comment sont formés les prix sur le marché? 68. A quels prix sont vendues les différentes qualités?
Grade 1: Grade 2: Hors Standard 69. Coût de transport? 70. Autre coût de transaction (taxe…………, location………… , autre…………? 71. Avez-vous suivi de formation en cacaoculture ? 72. Si oui, quand ………………………….. et par
qui…………………………………………? 73. De quoi s’agissait-il ?
Merci pour votre temps! Veuillez nous tenir informé de votre intérêt aux résultats de ce travail. Ce sera notre plaisir de le partager avec vous.
53
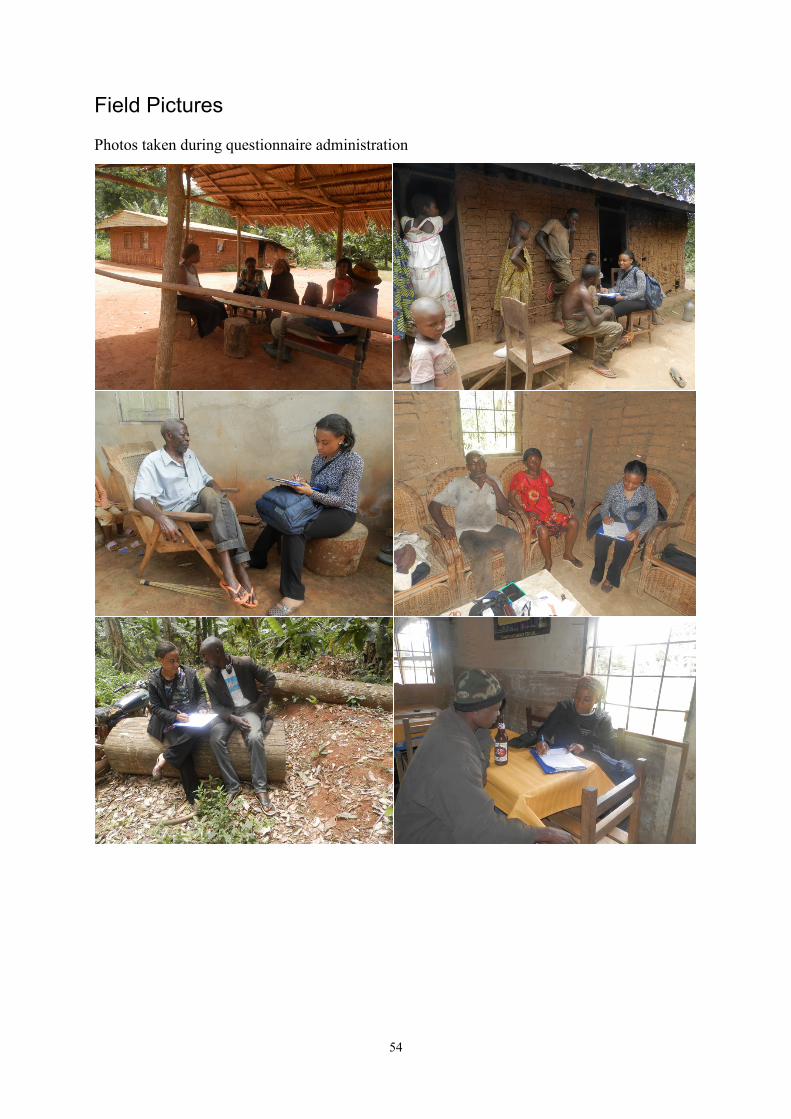
Field Pictures Photos taken during questionnaire administration
54
Related Documents