SURYA PHARMACEUTICAL LIMITED | ANNUAL REPORT, 2010-11 SMALL IS LARGE SURYA PHARMACEUTICAL LIMITED 911, 9th Floor, Surya Kiran Building, 19 K.G. Marg, Connaught Place, New Delhi www.suryapharma.com

Welcome message from author
This document is posted to help you gain knowledge. Please leave a comment to let me know what you think about it! Share it to your friends and learn new things together.
Transcript

S U R Y A P H A R M A C E U T I C A L L I M I T E D | A N N U A L R E P O R T , 2 0 1 0 - 1 1S M A L L I S L A R G E
SURYA PHARMACEUTICAL LIMITED
911, 9th Floor, Surya Kiran Building, 19 K.G. Marg, Connaught Place, New Delhi
www.suryapharma.com

SAFE-HARBOUR STATEMENT In this Annual Report wehave disclosed forward-looking information to enableinvestors to comprehend our prospects and take informedinvestment decisions. This report and other statements -written and oral - that we periodically make contain forward-looking statements that set out anticipated results based onthe management’s plans and assumptions. We have triedwherever possible to identify such statements by using wordssuch as ‘anticipates’, ‘estimates’, ‘expects’, ‘projects’,‘intends’, ‘plans’, ‘believes’ and words of similar substance inconnection with any discussion of future performance. Wecannot guarantee that these forward looking statements willbe realized, although we believe we have been prudent inassumptions. The achievement of results is subject to risks,uncertainties and even inaccurate assumptions. Shouldknown or unknown risks or uncertainties materialize, orshould underlying assumptions prove inaccurate, actualresults could vary materially from those anticipated,estimated or projected. Readers should bear this in mind. Weundertake no obligation to publicly update any forward-looking statements, whether as a result of new information,future events or otherwise.
T O N N E S T O
MI L L IB U L K T O
F I X EDC O R P O R A T E T O
C U S TW A R E H O U S E T O
SHELFA PRODUCT

G R A M SDOSAGEO M E RS P A C E
CAN YOU CONNECT THE DOTS?

32
F O R M U L A T I O N S !(JUST WHAT THE DOCTOR PRESCRIBES…)A T S U R Y A , S M A L L I S T H E N E W L A R G E .
. . . T H A T W I L L D E L I V E R L A R G E R E T U R N S .
WHAT YOU WILLF I N D I N S I D E
14 Surya – the Corporate
16 Highlights 2010-11
18 Chairman’s statement
20 Competitive advantage
24 Leading brands
27 Creating shelf space
30 Managment discussion and analysis
49 Corporate Information
50 Directors’ Report
57 Corporate Governance Report
67 Standalone Accounts
87 Consolidated Accounts

54
SMALL OUTPUTL A R G E I N F R A S T R U C T U R E
SURYA EXPECTS TO INVEST `150 CROREIN A DEDICATED NON-ANTIBIOTIC
FORMULATIONS MANUFACTURING FACILITY.
Surya Pharmaceutical reinforced its formulations infrastructure
across five years through the following business-strengthening
initiatives:
Created large world-class formulation facilities (972 million
capsules, 630 million tablets and 18 million bottles of dry
powder)
Commissioned our US FDA-compliant API and injectables
facility at Jammu, paving the way for an entry into regulated
markets
Created a dedicated, world-class R&D facility to develop
formulations to establish a global market presence
Upgraded the Baddi and Banur plants as per global regulatory
standards
Drew out a blueprint to invest `650 crore in a world-class,
non-antibiotic API facility – sine qua non to establish a strong
presence in the high-growth, non-antibiotic formulations space
The result: We executed our first bulk overseas contract with a
leading global pharmaceutical player and entered into an
agreement with a leading domestic pharmaceutical major to
manufacture five generic Beta-lactum products (to be scaled to
16 multiple strengths and dosage forms).

SMALL PRODUCT L A R G E B A S K E TSurya Pharmaceutical leveraged ingenious research to create a
large product basket (each product with multiple strengths and
dosage forms), covering diverse therapeutic segments.
The Company established a significant pan-India presence
through the following initiatives:
Created dedicated divisions (more than 600+ on-board
salesforce) to market ethical (Alexus) and generic (Aegis)
formulations across India
Launched 12 products (32 SKUs) through Alexus division in
the antibiotic, PPI, cough and cold remedy, calcium and multi-
vitamin supplement, anti-infective, anti-allergic, NSAID and
gastrointestinal spaces
Launched a new gynaecology-focused ethical division (Adonia),
marketing 15 SKUs through 200+ pan-India salesforce
Enhanced brand recall across more than 100,000 doctors and
60,000 retail outlets and chemists
Plans to launch dedicated dermatology (Auskin) and neuro-
psychiatry divisions during 2011-12
Charted a three-year road map to enhance market presence
through dedicated divisions in the respiratory, oncology,
diabetology and cardiac care therapeutic segments
The result: The formulations division registered a topline of `15 crore in the first full year of operation and expects togenerate `65 crore revenue in 2011-12.
76
SURYA PLANS TO LAUNCH A BASKET OF 50 FORMULATIONS (INCLUDING
INJECTABLES) IN 2011-12.

98
SMALL INITIATIVES L A R G E I M P L I C A T I O N S
US$ 20 MILLION IS ACTIVON’S PROJECTEDANNUAL SALES IN TWO YEARS
Surya Pharmaceutical is strengthening its global recall through the
following initiatives:
Acquired US-based Amershire Investment Corporation and Herkules
Capital Management Ltd, thereby the sales and ownership of brand
ActivOn, a leading pain management therapy, envisaged investment of
US$ 22 million through our wholly-owned subsidiary Surya
Pharmaceutical (Singapore) Pte Ltd.
Acquired US-registered OTC Pharma brands (PreferOn, RenewIn and
FirstOn) that will be marketed in India and the world
Acquired the non-US, marketing rights for HeadOn (headache
management) in global markets
Provides an opportunity to leverage relationships of these retailers
like WalMart, CVS, Walgreens and Rite Aid to launch new products.
The result: These acquisitions will enhance our global footprint,
volumes and a platform for launching new products. The ActivOn
brand alone reported revenues of US$ 8.5 million (2010) with a
30%-plus EBIDTA margin.

1110
SMALL ENDORSEMENTSL A R G E R E C A L LSurya Pharmaceutical (through the Surya Care division) intends to enrich a consumer’s
retail experience through a wide array of international merchandise.
Surya Care undertook the following initiatives:
Entered into an exclusive alliance with Crocs to distribute Crocs Rx medical footwear in
India, China, South East Asia and SAARC countries
Entered into an exclusive alliance with Royal Industries, Thailand in the baby care
segment to market baby feeding products and accessories under the brand Nursa in India
Entered into an agreement with QNT to market sports nutrition products and dietary
supplements in India
Entered into an alliance with E.T. Browne Drug Co of US for an exclusive licence of
Palmer’s brand, renowned for premium beauty, skin and cosmetic cocoa butter-based
products
Launched FastAid, an umbrella brand for pharmaceutical OTC products – India’s first
branded emergency first-aid kit and a topical pain management product. The first few
products under FastAid comprised cotton buds, cotton balls, bandages, antiseptic lotions
and emergency first-aid kit; the product basket will increase to about 25 SKUs by March
2012
Launched BASICS brand, in the personal care range comprising skincare, hair care and
body care; the brand’s offering will expand to 25 SKUs by March 2012
Negotiating with global corporates to introduce new international brands to India.
The result: These endorsements will lead to a differentiated transformation (from achemist shop into a high-end FMCG store) drawing aspirational consumers, increasingfootfalls and generating attractive revenues.
SURYA CARE DIVISION IS OPTIMISTIC OF ACHIEVING A TOPLINE OF
` 600 CRORE IN 2014.

SMALL PACKETS L A R G E S H E L F S P A C E
SURYA’S PROJECTED RETAIL STORESTRENGTH BY MARCH 31, 2014
12 13
Surya Pharmaceutical (through subsidiary Surya Healthcare
Ltd) invested in wider proprietary (company-owned and
company-operated) shelf space to enhance offtake and
profitability.
The Company embarked on the following initiatives:
Set up in a record 27 months, 186 outlets (as of August
2011) of the pharmacy retail chain (the VIVA and
MEDIMART brands) across 22 cities in Delhi NCR, Punjab,
Haryana, Maharashtra, Andhra Pradesh, Uttar Pradesh and
Chandigarh Tricity.
As of August 2011, the stores enjoy the loyalty of more
than 150,000 customers and more than 300,000
customers walk into the stores every month
Acquired for an investment of `10.50 crore, Medimart
India Pvt Ltd (revenues of `11 crore in 2010-11), a
pharmaceutical retail company with 42 Hyderabad stores
The result: The Company emerged among a few Indianpharmaceutical players with a retail shelf space as well.
1514
SURYA PHARMACEUTICAL LIMITED.FLAGSHIP OF THE ` 17 BILLIONSURYA GROUP. AMONG THE TOP FIVECOMPANIES IN INDIA’S BETALACTAMAND ORAL CEPHALOSPORIN RANGEOF ANTI-INFECTIVES.
1700F L A G S H I PO F T H E `
C R O R ESURYA GROUP
The Company’s product and service
portfolio comprises active pharmaceutical
ingredients (API), intermediates,
formulations, phytopharmaceuticals,
contract research and manufacturing
facilities.
The Company is an ISO 9001-2008,
ISO 22000:2005 certified organisation
having approved Drug Master Files (DMF
s) in Europe, Turkey and Korea, whose
products and services are marketed
across the globe. Surya Pharmaceutical
has a global footprint across 90 nations,
supported by overseas offices in China,
Singapore and the US as well as state-
of-the-art R&D centres in Banur and
Panchkula (India).
The Company has six state-of-the-art
manufacturing facilities across North
India and its shares are listed on the
Luxembourg, Bombay and National
Stock Exchanges.
SURYA PHARMACEUTICAL LIMITED
(INCORPORATED 1992) IS A
CHANDIGARH-BASED
PHARMACEUTICAL COMPANY
PRESENT ACROSS THE
PHARMACEUTICAL VALUE CHAIN.
BUSINESS DIVISIONS
Surya Life: Markets APIs and Bulk Drugs
Surya Naturals: Markets menthol/mint derivatives,
essential oils and flavour chemicals
Alexus and Aegis: Markets ethical and generic formulations
Altair: Diagnostic and medical equipment division
Surya Care: Markets OTC & FMCG products
for institutional and home use
Eureka: Contract/custom research
and manufacturing services
Alliances: Exclusive agreement with Crocs for marketing
their therapeutic products in India and SAARC nations
CERTIFICATIONS
ISO 9001:2008
ISO 22000-2005
R&D centres approved and recognised by DSIR
GMP certified facilities
USFDA registered for mint products
Halal Certificate for mint products
Star Kosher Certificate for mint products
Trading House Status granted by Government of India
Korean FDA approval for Banur plant
European DMF for Cefixime
Korean DMF for Cefaclor
VISIONWe will endeavour to emerge as a
leader in the integrated
pharmaceuticals business by
continually achieving and surpassing
the highest standards in quality-driven
manufacturing and sustainable
development through environment-
friendly practices.
At Surya Pharmaceutical, we will
continuously provide value to all
stakeholders of the organisation with a
focus on innovation and core values
towards achieving excellence across all
operations.
MISSIONOur determined commitment to our
values in integrity, transparency and
responsible corporate citizenship along
all facets of our value chain.
A continuous focus on achieving
excellence and leadership through the
highest standards of quality across all
functions of our organisation.
Ensuring a safe and healthy
environment for all personnel and
maintaining harmony with the natural
environment.
Recruiting, training and retaining
the highest calibre of professionals in
the industry.
To ensure the well-being of the
community by effectively fulfilling
social responsibilities.
CORE VALUESTo demonstrate the utmost
INTEGRITY and TRANSPARENCY to
all Company stakeholders to ensure
consistent value creation over long-
term associations
To INSPIRE TRUST through
example-driven LEADERSHIP across
all aspects of the Company’s
management
To pursue EXCELLENCE through a
continued focus on QUALITY and
INNOVATION
To emerge as an EMPLOYER OF
CHOICE through the best human
resource practices
INVEST IN HUMAN CAPITAL over
the long-term

1716
G R E W E X I S T I N G P R E S E N C E .E N T E R E D N E W V E R T I C A L S .
FINANCIAL PERFORMANCE
41.10%
H I G H L I G H T S , 2 0 1 0 - 1 1
`
1,157.53CRORE
2009-10
`
1,633.27CRORE
2010-11
53.43%`
173.38CRORE
2009-10
`
266.02CRORE
2010-11
31.69%`
76.06CRORE
2009-10
`
100.16CRORE
2010-11
38.69%`
96.24CRORE
2009-10
`
133.48CRORE
2010-11
IMPROVEMENT IN PROFITABILITY
86BPS 3BPS 58BPS
OPERATIONAL EFFICIENCYInitiated implementing the ERP
management system organisation-wide
PROJECT MANAGEMENT Commissioned two API units and a
state-of-the-art formulation unit at Samba
(Jammu) for an investment of `320 crore
Modernised the Banur and two Baddi
units in line with global regulatory
standards
INNOVATION EXCELLENCECommercialised 250+ new products
Launched two own brands, FastAid for
pharma OTC products and Basics for
FMCG products
MARKETINGReceived DMF approvals from Turkey
for two API products, namely Cefaclor
and CPDP, and from Korea for Cefaclor.
Filed 11 DMFs in regulated markets
and 90 DMFs in semi-regulated and
non-regulated markets
Launched 250+ new formulations in
the domestic market through three
divisions – Alexus, Aegis and Adonia
Established a marketing footprint in 90
nations
Received the first export order for
betalactam formulations
NEW AVENUESSuccessfully underwent Korean FDA
inspection and an audit approval from aleading Indian pharmaceutical companyfor our Banur facility
Formulation unit at Baddi wassuccessfully inspected by WHO-GMP(certification expected)
Collaborated with Royal IndustriesInc., Thailand, to introduce a range ofbaby feeding products and accessoriesin India under the Nursa brand
Entered into alliances to exclusivelydistribute and market QNT and Palmer’sproducts in India
Entered into an exclusive alliancewith Crocs to distribute Crocs Rxmedical footwear in India, China, SouthEast Asia and the SAARC countries
VALUE-ADDED BUSINESSESLaunched/acquired 130 retail stores
under the Viva and Medimart brands(through subsidiary Surya Healthcare),taking the tally to 155 stores at the endof 2010-11
Launched the phyto-pharmaceutical
business vertical; commenced
production; product samples received
approvals from domestic and
international clients
INORGANIC INITIATIVESAcquired US-based Over-the-Counter
(OTC) analgesic drug brand ActivOn for
an envisaged investment of US$ 22
million through the acquisition of
Amershire Investment Corp and
Herkules Capital Management Ltd
Acquired Medimart India Pvt. Ltd.
(42-outlet retail pharmacy chain
in Hyderabad) for an investment of
`10.50 crore
BOARD ROOM DECISIONS Mobilised US$ 25 million though a
global depository receipt (GDR) issue
and listed on Luxembourg Stock
Exchange on 12th October, 2010
Split the stock from a face value of
`10 to Re. 1
RESPECTABLE POSITION! Received ‘Crown of Brilliance for Innovation’ by Shimadzu, Japan
Ranked 20th-largest pharmaceutical company in India
Positioned 398 in the prestigious Fortune India 500 list
Ranked 417 out of top ET 500 companies
14.85%2009-10
15.71%2010-11
7.75%2009-10
7.78%2010-11
17.30%2009-10
17.88%2010-11
NET SALESGROWTH
EBIDTAGROWTH
PROFIT AFTER TAXGROWTH
CASH PROFITGROWTH
PBTMARGIN
EBIDTA MARGIN
RETURN ONCAPITAL
EMPLOYED

1918
FROM THE CHAIRMAN’S DESK
ALL OBJECTIVES DRAWN UP IN APRIL 2010 WERE SUCCESSFULLY
ACCOMPLISHED DURING THE YEAR UNDER REVIEW, WHICH RESULTED IN
BETTER NUMBERS, BUSINESS EXPANSION, INORGANIC GROWTH AND
GEOGRAPHIC DIVERSIFICATION.
THE RESULT: WE CROSSED `1,600-CRORE REVENUES, SUSTAINED 46%
GROWTH (5-YEAR AVERAGE) ON A GROWING REVENUE BASE, AND PROFITS
ACCELERATED AT A HEALTHY PACE (NET PROFIT GREW 31.69% FROM
`76.06 CRORE IN 2009-10 TO `100.16 CRORE IN 2010-11). OUR EXPORTS
GREW FROM `341.22 CRORE TO `422.78 CRORE AT A SLOWER CLIP OF 23.9%
DURING THE SAME PERIOD.
Dear shareholders,
CROS
SEDR
S 1,60
0-CRO
RERE
VENU
ES, S
USTA
INED
46%
GROW
TH,P
ROFIT
GRE
W31
.69%
PHARMACEUTICALBUSINESS At Surya, the pharmaceutical business
accounted for 53% of our revenues in
2010-11. We see a growing scope for
this business for the following reasons:
Growing urbanisation, leading to an
increasing incidence of medical ailments
Increasing per capita income and
penetration of health insurance, growing
the demand for pharmaceutical products
India being positioned as a preferred
destination for medical tourism, which
is expected to grow the demand for
healthcare services and formulations
Over $267 billion worth of sales are
at risk from patent expirations between
2011-16
Increasing role of generics being
played out in developed countries by
insurance and healthcare providers
We embarked on the following
initiatives in 2010-11 to grow our API
business:
Approvals: Our Banur facility received
the Korean FDA approval, a big
achievement. South Korea is a large
market, estimated to grow at a 7-10%
CAGR over the medium term,
strengthening our prospects. Large
domestic pharmaceutical players
audited the Banur facility, resulting in
the prospect of enhanced volumes from
within the country from the current year
onwards.
Capacity enhancement: We liberated
our manufacturing capacity through the
de-bottlenecking and modernisation of
the Baddi and Banur units, resulting in
superior asset sweating.
Filings: We filed for Certificate of
Suitability for 11 products with
European regulatory authorities, which
will result in the audit of our Banur
facility. These audits will allow us to
extend our presence in regulated
markets, enhancing revenues. We also
filed around 90 DMFs in semi-regulated
markets, some of which could receive
regulatory clearances in 2011-12,
opening new markets (like Turkey).
Product expansion: We planned a `6.5
billion capital investment, comprising
the setting up of a new API facility near
Chandigarh. The proposed unit will
manufacture the entire range of APIs
(cardiovascular products, CNS products,
hormonal products and steroids, among
others) and we expect this initiative to
contribute to the Company’s earnings
from 2012-13 onwards.
OUR FORAY INTOREGULATED MARKETSWe intend to establish our presence in
the regulated markets, especially US
and Europe.
Relevance of the US pharma market:
The US market is becoming increasingly
relevant for global generic players like
us on account of its genericisation.
W E P L A N N E D A `
C R O R E CAPITAL INVESTMENT
OUR SMALL INITIATIVES WILL DELIVER
L A R G E R E T U R N S .Mr. Rajiv Goyal, Chairman and Managing Director, highlights the Company’s strategy

2120
Drugs worth US$ 68 billion are likely
to lose their patent status in the US in
the next two years, higher than the
average annual patent expiry of US$ 16
billion over CY06-10.
The US administration’s healthcare
bill assures affordable healthcare to
about 32 million hitherto uninsured
Americans, implying an increase in
generic drug use.
For every 2% increase in generics
utilisation, the nation’s Medicaid
programme can potentially save US$1
billion annually (Source: GPhA).
Indian companies account for 15.4%
(November 2010 IMS data) of the US
generics market, while incremental
prescription market share is estimated
at 33.7%, a trend which is expected to
accelerate in the coming years, keeping
with India’s low-cost advantage.
Our preparedness: Surya embarked on
multiple initiatives to establish a strong
presence in the US market. The
Company commissioned its `320 crore
USFDA-compliant Jammu facility,
which manufactures sterile and non-
sterile APIs and injectables, paving the
way for an entry into the regulated
markets. The Company acquired
Herkules Capital Management Ltd and
its subsidiary, Family First
Pharmaceuticals Inc. (marketing
ActivOn) and Amershire Investment
Corporation (owner brand ActivOn),
adding the world famous Analgesic and
four other pharma OTC brands like
HeadOn, PreferOn, FirstOn and
RenewIn. This acquisition will entitle us
to ready shelf space and help forge
relationships with leading US retailers,
resulting in the launch of proprietary
OTC and FMCG products in these
markets (already launched a range of
OTC and FMCG brands like FastAid and
Basics in India).
MENTHOL AND MINTDERIVATIVESThe prospects of our menthol business
appear attractive as the market is large,
shortages perpetual and the prospect of
menthol being used in every
food/fragrance product high.
The Company expects to capitalise on
this reality through additional global
certifications, product development and
the fact that out of the top 10 global
flavour and fragrance companies, we
enjoy business alliances with a large
number.
At Surya, the menthol business
accounted for 46% of our revenue in
2010-11. We added a number of large
international menthol consumers with
long-term offtake plans. We plan to
double our existing capacity and
capitalise on prospects arising from
numerous by-products.
PHARMACY RETAILThe Company’s extension into
healthcare retail (through our subsidiary
Surya Healthcare Limited) appears
optimistic on account of its size
(`40,000 crore) and minimal (3%)
organised presence, which is expected
to increase to almost 10% by 2015.
In 2010-11, the Company expanded its
VIVA and Medimart retail network from
25 to 155 outlets towards the end of
year, including acquisition of 42-store
Hyderabad-based Medimart India Pvt.
Ltd to extend deeper into South India.
We are engaged in appraising
opportunities to extend into West and
East India as well, creating a pan-India
footprint by 2014.
This growth is not expected to be only
numerical; the Company expects to
transform a mundane pharmacy store
into an upmarket FMCG outlet,
providing complete pharmacy solutions
encompassing products (formulations)
and services (diagnostics and primary
healthcare) through marketing alliances
with global players. The Company also
expects to launch about 50+
formulations, 150+ OTC products
(judicious medley of allopathic, herbal
and ayurvedic products).
MESSAGE TOSHAREHOLDERS At Surya Pharmaceutical, a number of
initiatives will deliver superior returns
from 2011-12 onwards. The
Company’s mature business verticals
will capitalise on emerging
opportunities; new business verticals
will report their first full year of
operations.
In doing so, the Company expects to
graduate from a domestic
pharmaceutical player to a global
pharmaceutical brand, strengthening
value for shareholders.
Rajiv Goyal
Chairman and Managing Director
IN 2010-11, THECOMPANY EXPANDEDITS VIVA ANDMEDIMART RETAILNETWORK FROM 25 TO
155OUTLETS TOWARDS THE END OF YEAR,INCLUDINGACQUISITION OF 42-STORE HYDERABAD-BASED MEDIMARTINDIA PVT. LTD TOEXTEND DEEPER INTOSOUTH INDIA.
T H E C O M P A N YCOMMISSIONED ITS `
C R O R E USFDA-COMPLIANTJ A M M U F A C I L I T Y
US$1 BILLIONFor every 2% increase in generics utilisation, the nation’s Medicaid programme can potentiallysave US$1 billion annually.
PHAR
MACY
RETA
ILSU
RYA H
EALTH
CARE
150+
OTC P
RODU
CTSME
DIMA
RT IN
DIA
FMCG OUTLETAYURVEDIC
2322
D R I V E R S O FC O M P E T I T I V E
ADVANTAGE Experience: The promoters possess
more than 18 years of rich domain
experience in the pharmaceutical sector.
They are assisted by a professional
management team with an average
30+ year experience in pharmaceutical
and other sectors.
Business model: The Company has a
balanced business model comprising
pharmaceutical and related pharma
sectors (menthol, CRAMS and phyto-
products) with a wide geographical
presence in 90 countries (including an
emerging presence in the US OTC
pharma market) which de-risks business
growth from a downturn in any
particular sector.
Integration: The Company is present
across the pharmaceutical value chain –
intermediate, formulation and CRAMs
services – enabling it to captialise on
opportunities in the pharmaceutical
space. SPL’s integrated operations
facilitate profitable growth despite
significant competitive forces.
Manufacturing infrastructure: The
Company continuously invested in
business earnings to increase and
modernise its operating infrastructure.
Surya Pharmaceutical has six
manufacturing facilities, with ISO
9001:2008 and ISO 22000:2005
certifications. Its Jammu facility is
USFDA-compliant.
Research capability: The Company has
two DSIR-approved research facilities in
India (Panchkula and Banur). These
units possess sophisticated equipment
and are managed by scientists, enabling
the Company to undertake process and
product development.
Operations: The Company’s operations
strictly adhere to Good Manufacturing
Practices (GMP), providing superior
quality and pharmacopeia-compliant
products.
Reach: The Company’s market reach
comprises domestic and international
markets. The Company’s global footprint
extends across 90 nations, growing in
regulated markets. The Company’s
domestic clients comprise leading Indian
pharmaceutical companies.
People: The Company’s intellectual
capital comprises skilled and
experienced scientists, engineers, lab
technicians, production heads and
functional managers. Its multicultural
and multidisciplined workforce facilitates
customer satisfaction.
Vindication of our strategy
STRENGTHENINGL E A D E R S H I PThe Company is one of the
largest manufacturers and
exporters of menthol and
derivatives. The Company is
expanding capacities to
manufacture menthol
crystals, flakes and menthol
derivatives.
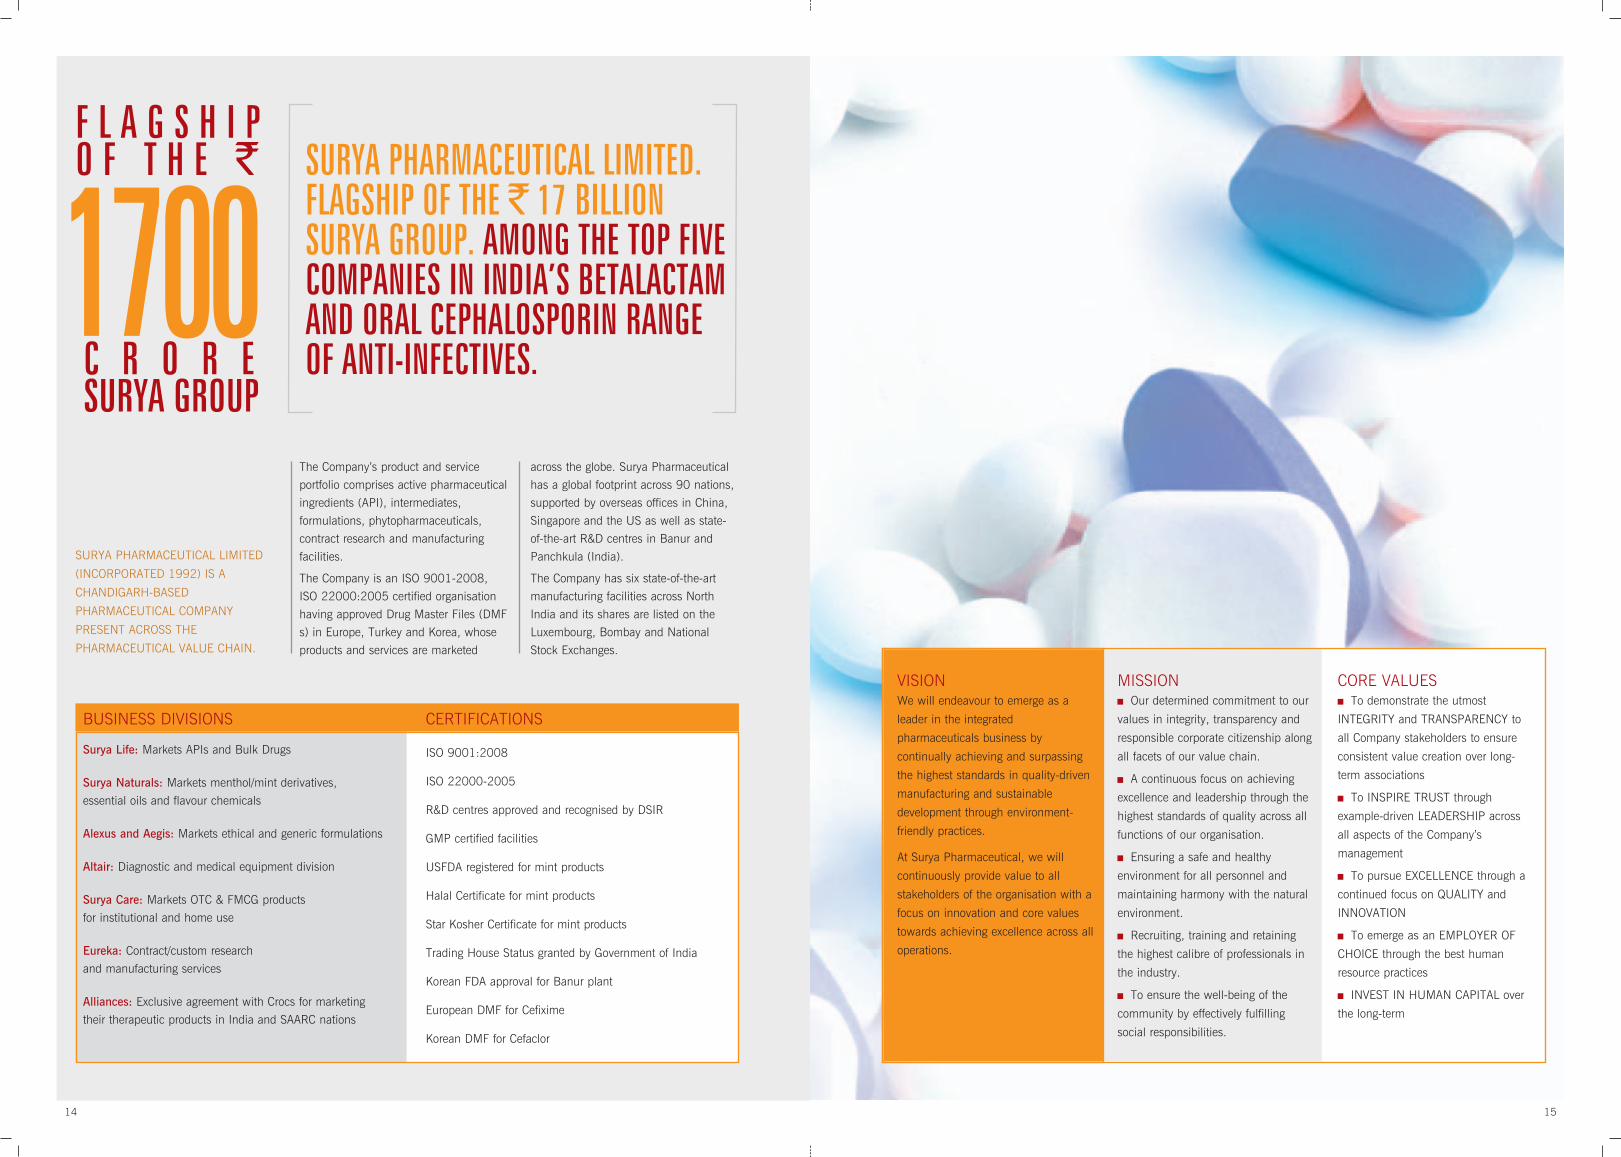
91.5
920
07-0
8
121.
320
08-0
9
173.
3820
09-1
0
2010
-11
266.
02
32%
43%
53%
EBIDTA(` crore)
12.2
920
07-0
8
15.8
520
08-0
9
20.8
120
09-1
0
2010
-11
26.9
0
29%
29%
31%
BOOK VALUE PERSHARE* (`)
41.7
120
07-0
8
56.1
320
08-0
9
76.0
620
09-1
0
2010
-11
100.
16
PROFIT AFTERTAX (` crore)
AN ILLUSTRIOUS
JOURNEY
512.
9720
07-0
8
751.
5320
08-0
9
1,15
7.53
2009
-10
2010
-11
1,63
3.27
47%54%
41%
GROSS SALES (` crore)
53.0
620
07-0
8
73.1
620
08-0
9
96.2
420
09-1
0
2010
-11
133.
48
38% 32%39%
CASH PROFIT (` crore)
177.
8820
07-0
8
229.
2720
08-0
9
301.
1320
09-1
0
2010
-11
518.
52
29%
31%
72%
NET WORTH(` crore)
REVENUE
44.67% 5-YEAR
CAGR UPTO 2010-11
EBIDTA
36.47% 5-YEAR
CAGR UPTO 2010-11
PROFIT AFTER TAX
35.45% 5-YEAR
CAGR UPTO 2010-11
CASH PROFIT
34.58%5-YEAR
CAGR UPTO 2010-11
RESERVES AND SURPLUS
44.03% 5-YEAR
CAGR UPTO 2010-11
32% 36%35%
* After adjusting for change in the facevalue of shares from `10 to Re. 1ISO
2200
0:200
5 JAM
MU FA
CILITY
USFD
ACO
MPLIA
NT RI
CHDO
MAIN
EXPE
RIEN
CEDS
IR-AP
PROV
EDMU
LTIDIS
CIPLIN
EDWO
RKFO
RCE
2524
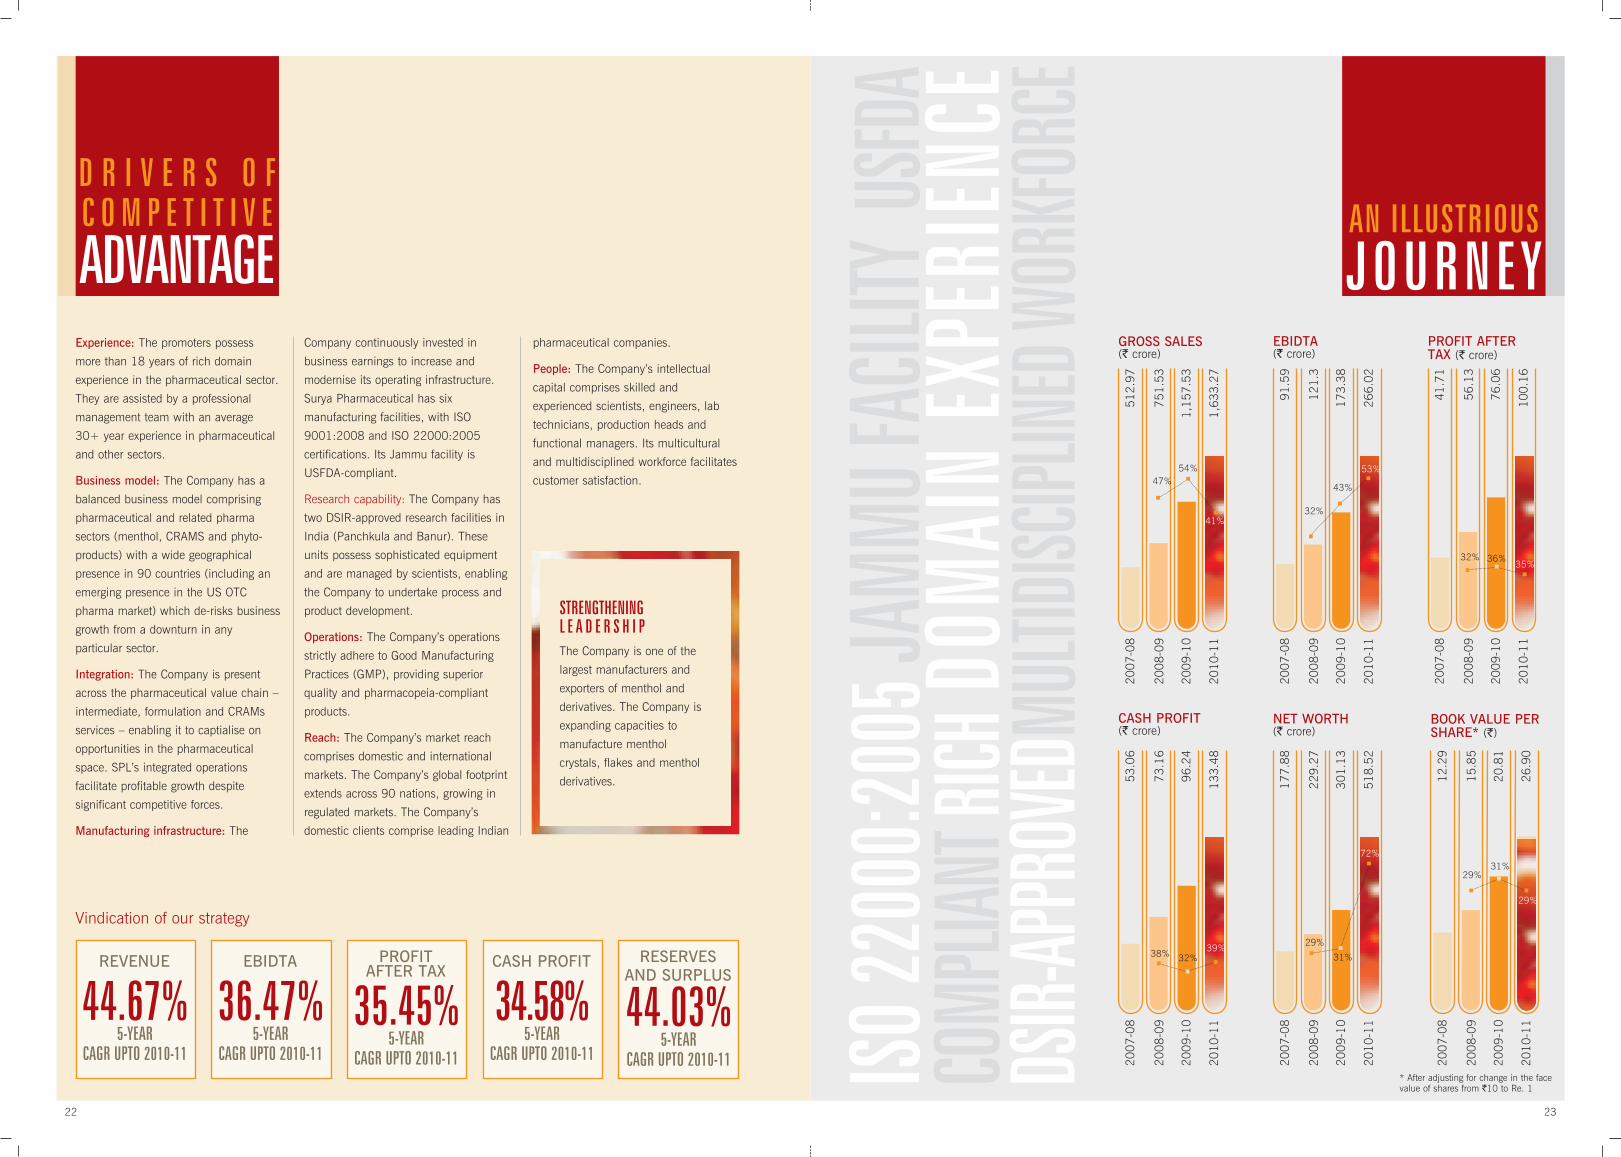
L E A D I N G B R A N D S .
STRONG RECALL.
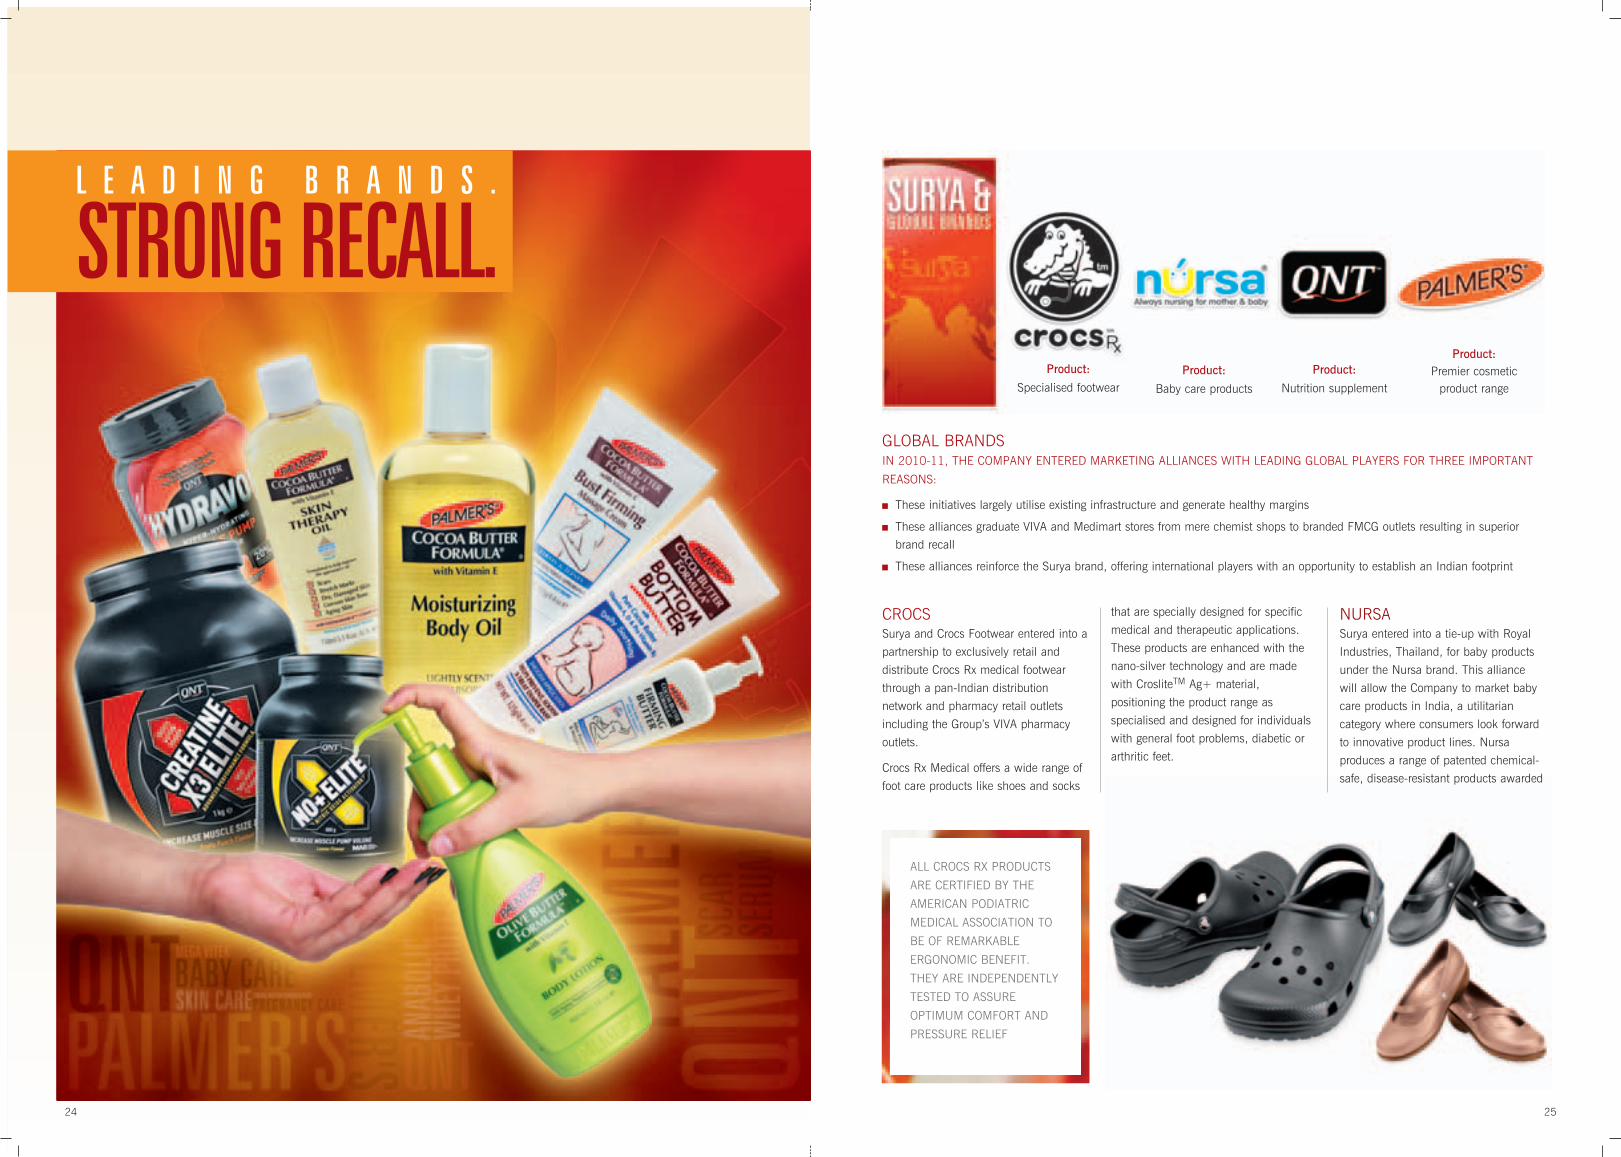
CROCSSurya and Crocs Footwear entered into a
partnership to exclusively retail and
distribute Crocs Rx medical footwear
through a pan-Indian distribution
network and pharmacy retail outlets
including the Group’s VIVA pharmacy
outlets.
Crocs Rx Medical offers a wide range of
foot care products like shoes and socks
that are specially designed for specific
medical and therapeutic applications.
These products are enhanced with the
nano-silver technology and are made
with CrosliteTM Ag+ material,
positioning the product range as
specialised and designed for individuals
with general foot problems, diabetic or
arthritic feet.
NURSASurya entered into a tie-up with Royal
Industries, Thailand, for baby products
under the Nursa brand. This alliance
will allow the Company to market baby
care products in India, a utilitarian
category where consumers look forward
to innovative product lines. Nursa
produces a range of patented chemical-
safe, disease-resistant products awarded
GLOBAL BRANDSIN 2010-11, THE COMPANY ENTERED MARKETING ALLIANCES WITH LEADING GLOBAL PLAYERS FOR THREE IMPORTANT
REASONS:
These initiatives largely utilise existing infrastructure and generate healthy margins
These alliances graduate VIVA and Medimart stores from mere chemist shops to branded FMCG outlets resulting in superior
brand recall
These alliances reinforce the Surya brand, offering international players with an opportunity to establish an Indian footprint
Product:
Specialised footwearProduct:
Baby care products
Product:
Nutrition supplement
Product:Premier cosmetic
product range
ALL CROCS RX PRODUCTS
ARE CERTIFIED BY THE
AMERICAN PODIATRIC
MEDICAL ASSOCIATION TO
BE OF REMARKABLE
ERGONOMIC BENEFIT.
THEY ARE INDEPENDENTLY
TESTED TO ASSURE
OPTIMUM COMFORT AND
PRESSURE RELIEF

2726
and certified for their world-class quality.
This alliance has added 18 SKUs to the
shelf-space of the VIVA network and
allied distributors.
India is emerging as one of the world’s
fastest-growing baby care markets
catalysed by India’s large young and
working-age population. Besides, the
estimated birth rate in India by 2011
will be 20.97/1,000.
Even in a tough post recessionary
scenario, the industry continued to
report strong year-on-year growth. Our
projections indicate that the industry will
continue to experience strong traction
and a CAGR of 11.3% during 2010-13.
QNTQuality Nutrition Technology (QNT), a
privately-owned company headquartered
in Brussels, Belgium (Europe), is
recognised as one of the premier
nutrition supplement brands distributed
in over 30 countries across Europe, the
Middle East, Asia and North America.
Under a recent tie-up, Surya attained
exclusive and permanent marketing
rights for sports nutrition products and
supplements in India. The alliance
involves marketing 14 products (in
multiple SKUs) on a pan-India basis
through VIVA retail pharmacies,
authorised distribution channels and
other modern retail pharmacies.
PALMER’SSurya entered into a marketing
agreement with Palmer’s, the number
one cosmetics brand in its category in
the US.
Having launched the revolutionary brand
Palmer’s Cocoa Butter Formula™,
Palmer’s expanded its product basket to
include brands namely Skin Success,
Shea Butter Formula, Olive Butter
Formula, Coconut Oil Formula, Olive Oil
Formula and Hair Success. This
provides Palmer’s a strong presence in
important market segments such as skin
care, pregnancy, skin fade care and hair
care. Palmer’s products are available in
over 80 countries. Surya will market the
entire Palmer’s skin and cosmetic
product range through its OTC and
FMCG divisions.
OWN BRANDS FastAid The FastAid brand is an innovative and
empowering platform for self-prescribed
medications and medicines and self-
application of surgical cotton and
dressing at the scene of distress to
provide quick relief in an emergency
before a doctor arrives.
FastAid is the first branded emergency
first-aid kit in India. Its USP is the high
quality and safety of its products,
ergonomic packaging, portability
quotient and ease of use for the entire
family. The other products of FastAid
include cotton balls, cotton buds,
bandages and antiseptic lotion.
FastAid is an umbrella Surya brand of
OTC medicines available pan-India
through traditional and modern trade,
particularly through the VIVA chain of
pharmacy and wellness stores.
BASICSThe Basics brand caters to the theme
‘Back to the Basics’, wherein the daily
physical wear and tear of the skin, hair,
eyes, arms, feet and various body parts
creates a need for special conditioning,
nourishment and protection. The
products launched under Basics include
Facewash in variants of orange, neem
and lemon, and Face Scrub in variants
of apricot and neem.
The psyche map of Basics includes
qualities like beautiful, agreeable,
sparkling, ignited, colorful and savvy.
The Basics brand comprises a product
portfolio in skincare, hair care and body
care from Surya for all Indian consumers
through traditional and modern trade
outlets, particularly the VIVA chain of
pharmacy and wellness stores.
C R E A T I N G
SHELF SPACESURYA IS AMONG THE TOP FOUR BRANDS IN THE ORGANISED RETAIL PHARMACY SPACE WITH186 OUTLETS IN NORTH, WEST AND SOUTH INDIA.
HIGHLIGHTS, 2010-11Surya Healthcare Ltd acquired
Medimart India Pvt. Ltd., possessing a
42-store retail pharmacy network across
Hyderabad, for an investment of
`10.50 crore. Medimart generated
a topline of about `11 crore in
2010-11. This acquisition gives Surya
an immediate entry into the Hyderabad
market (from the pharmacy point of
view) with an entry point into South
India.
Surya added 88 VIVA stores in
2010-11 across five states and 22
cities, marking its entry into Delhi,
Gurgaon, Ghaziabad, Noida,
Chandigarh, Panchkula, Mohali,
Ludhiana, Patiala, Zirakpur, Rajpura,
Jallandhar, Amritsar, Ambala, Kalka,
Pinjore, Karnal, Kurukshetra, Panipat,
Sonepat and Mumbai.
OVERVIEWVIVA is a pharmacy retail brand of Surya
Pharmaceutical. VIVA was established in
2009 under its wholly-owned subsidiary
Surya Healthcare Ltd with an objective
to achieve a dominant position in the
health and wellness retail space.
NETWORK Surya Healthcare possesses a
combination of formats from pure
pharmacies to large formats with
medicines, FMCG, health and
prevention products as its core offering
along with value-added services in
context to consumers’ buying behaviour.
This strategy will facilitate critical mass,
economies of scale and extend the
Company’s reach to local and premium
neighborhoods. This will allow the
Company to achieve a dominant
position in the healthcare retail space.
The network comprised outlets in three
distinct formats namely large, mid and
express in offering products and services
for individuals as well as society.
As of August 2011, the VIVA and
Medimart network comprises 186
outlets covering six states and 22 cities
across India and is the fastest growing
Indian Pharmacy retail network chain.
COMPETITIVE ADVANTAGEAll stores possess an attractive, easy-to-
locate layout and convenient 'touch and
feel' displays designed to maximise
visual appeal. All outlets are centrally
air-conditioned and stringently follow
'cold chain' requirements – of
maintaining specific temperatures for
specialised medicines, vaccinations and
FASTAID IS THE FIRST
BRANDED EMERGENCY
FIRST-AID KIT IN INDIA. ITS
U.S.P. IS A HIGH QUALITY
AND SAFETY, ERGONOMIC
PACKAGING, PORTABILITY
QUOTIENT AND EASE OF
USE FOR THE ENTIRE
FAMILY.
2928
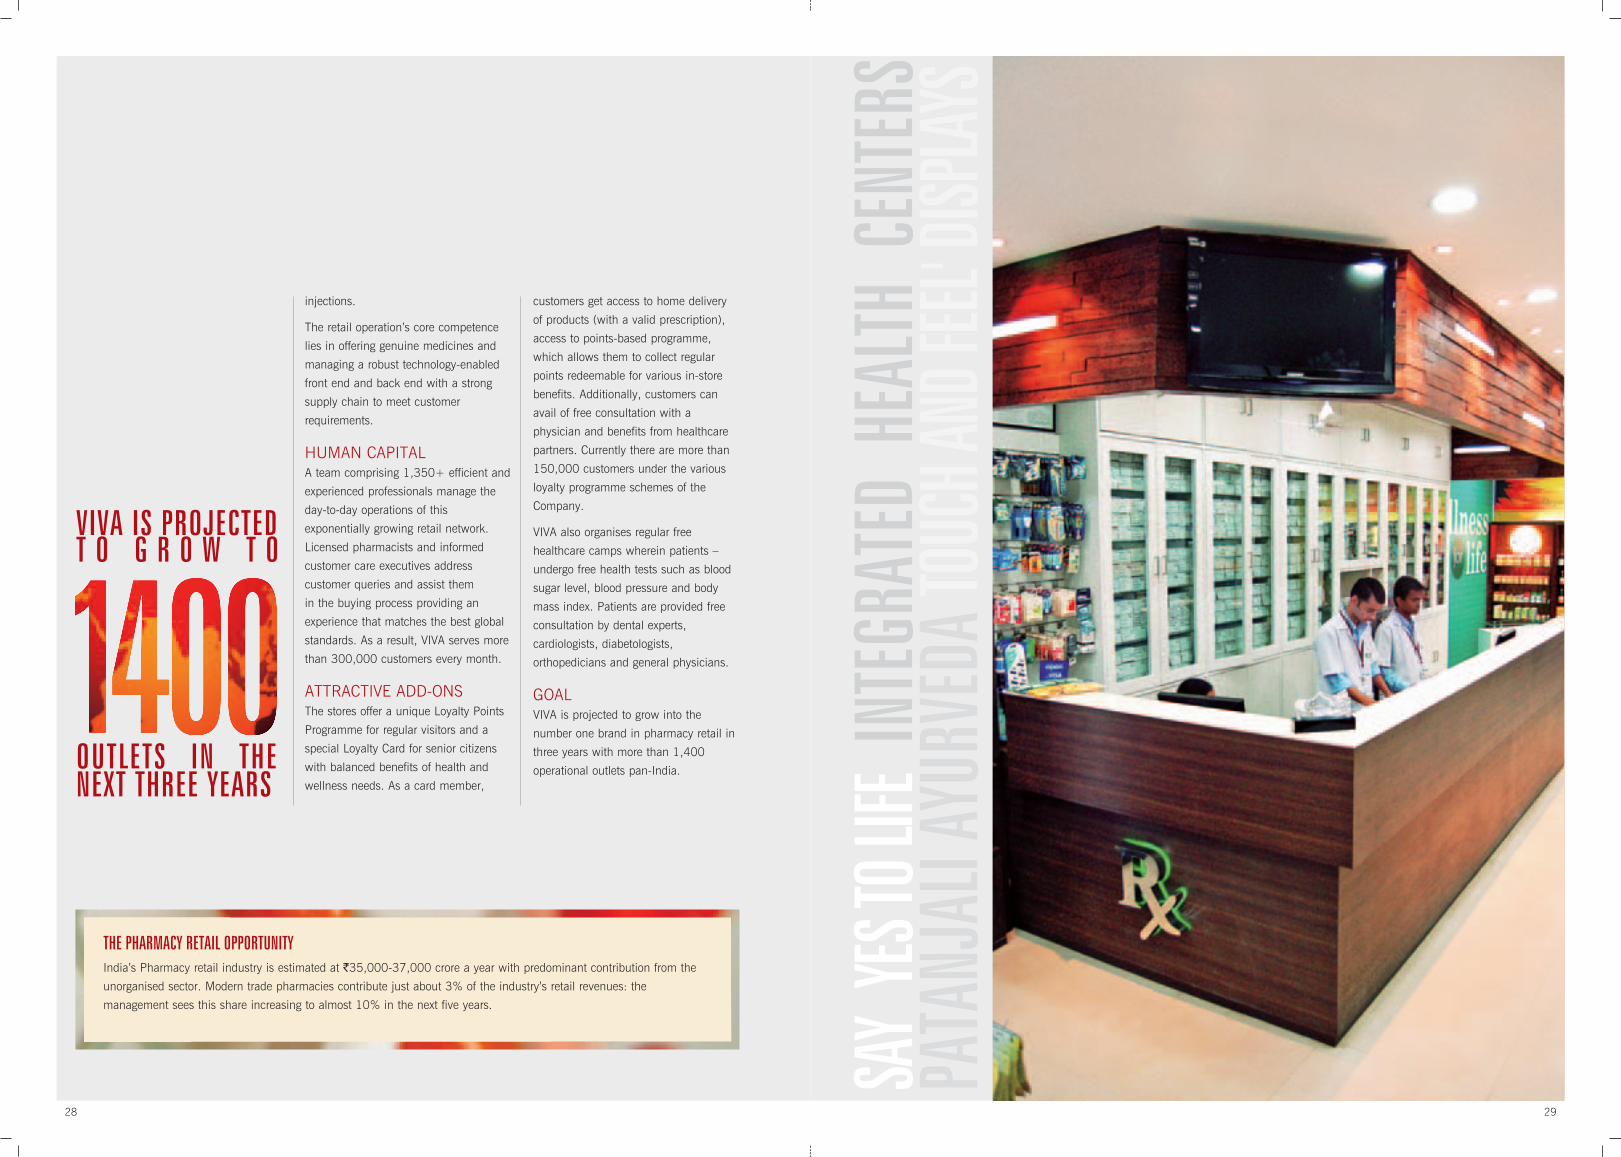
injections.
The retail operation’s core competence
lies in offering genuine medicines and
managing a robust technology-enabled
front end and back end with a strong
supply chain to meet customer
requirements.
HUMAN CAPITALA team comprising 1,350+ efficient and
experienced professionals manage the
day-to-day operations of this
exponentially growing retail network.
Licensed pharmacists and informed
customer care executives address
customer queries and assist them
in the buying process providing an
experience that matches the best global
standards. As a result, VIVA serves more
than 300,000 customers every month.
ATTRACTIVE ADD-ONSThe stores offer a unique Loyalty Points
Programme for regular visitors and a
special Loyalty Card for senior citizens
with balanced benefits of health and
wellness needs. As a card member,
customers get access to home delivery
of products (with a valid prescription),
access to points-based programme,
which allows them to collect regular
points redeemable for various in-store
benefits. Additionally, customers can
avail of free consultation with a
physician and benefits from healthcare
partners. Currently there are more than
150,000 customers under the various
loyalty programme schemes of the
Company.
VIVA also organises regular free
healthcare camps wherein patients –
undergo free health tests such as blood
sugar level, blood pressure and body
mass index. Patients are provided free
consultation by dental experts,
cardiologists, diabetologists,
orthopedicians and general physicians.
GOALVIVA is projected to grow into the
number one brand in pharmacy retail in
three years with more than 1,400
operational outlets pan-India.
SAY
YES TO
LIFE
INTE
GRAT
ED H
EALTH
CEN
TERS
PATA
NJAL
I AYU
RVED
A TOU
CH AN
D FEEL
' DISP
LAYS
THE PHARMACY RETAIL OPPORTUNITY India’s Pharmacy retail industry is estimated at `35,000-37,000 crore a year with predominant contribution from the
unorganised sector. Modern trade pharmacies contribute just about 3% of the industry’s retail revenues: the
management sees this share increasing to almost 10% in the next five years.
VIVA IS PROJECTEDT O G R O W T O
OUTLETS IN THE NEXT THREE YEARS
3130
ECONOMIC REVIEW Global economic overview: The
global economy rebounded with 5.1%
growth in 2010 against (0.5%) in
2009, facilitated by strong private
consumption in advanced economies,
private demand, accommodative policy
stances and resurgent capital inflows in
emerging economies.
Pockets of vulnerability persisted; real
estate markets and household income
remained weak in some major advanced
economies. Financial turbulence re-
emerged in the periphery of the Euro
area in the last quarter of 2010. One
key difference was the limited financial
market spillover to other countries.
Natural global disasters posed a
significant challenge for global economic
growth, taking a massive toll on human
life and wealth. Political turmoil in the
Middle East and North Africa contributed
to a modest deceleration in global
industrial production and trade.
Indian economic overview: India
retained its position as the second
fastest-growing nation with 8.5% growth
in 2010-11. The highlight was robust
agricultural sector growth at 5.4% in
2010-11 against 0.4% growth in 2009-
10.
Even as macroeconomic numbers
remained robust, they were marked by
volatility, primarily driven by global clues
and policy responses to address
inflation.
Headline inflation witnessed a relentless
rise in 2010-11. Despite government
intervention through large scale
monetary policy tightening, inflation
continued to remain close to the
double digit mark. Rising inflation and
moderate demand are expected to limit
India’s economic growth below 8% in
2011-12.
GLOBAL ECONOMYH E A D L I N EINFLATION
ANALYSISSTRONG PRIVATE CONSUMPTION IN ADVANCED ECONOMIES
LARGE SCALE MONETARY POLICY TIGHTENING
I N D I A T H E S E C O N DFASTEST-GROWING NATION
RESURGENT CAPITAL INFLOWSIN EMERGING ECONOMIES
NATURAL GLOBAL DISASTERS
GD
PECONOMY
FINANCIAL TURBULENCE RE-EMERGED IN THE PERIPHERY OF THE EURO AREA
MANAGEMENT DISCUSSION AND
A N A L Y S I SA) THE PHARMACEUTICALINDUSTRY
Global pharmaceutical sectorThe global pharmaceutical market is
expected to grow 5-7% in 2011 (4-5%
in 2010) and reach
US$ 880 billion. The market is expected
to grow at a 4-7% CAGR till 2013 to
US$ 975 billion. Growing economies
with several innovative treatment options
will contribute significantly towards this
growth as against developed markets,
which face constraints like major patent
expiries and payer mechanisms that
limit drug spending.
The 17 emerging pharmaceutical
countries are expected to record a
growth of 15-17% in 2011 to reach
US$ 170-180 billion, with China
growing 25-27% into a market worth
US$ 50 billion. This growth will be
boosted by increased government
expenditure on healthcare and broader
private healthcare funding.
The Asia-Pacific market will grow at a
CAGR of 12.6% during 2010-12, owing
to increased R&D activities in the region,
low costs and a favourable regulatory
environment.
Among the developed countries, Japan
is likely to grow 5-7%. The US is likely
to remain the single largest market with
a growth of 3-5% to US$ 320-330
billion. The five major European markets
(Germany, France, Italy, Spain and the
U.K.) will collectively grow at 1-3%
[Source: IMS Health].
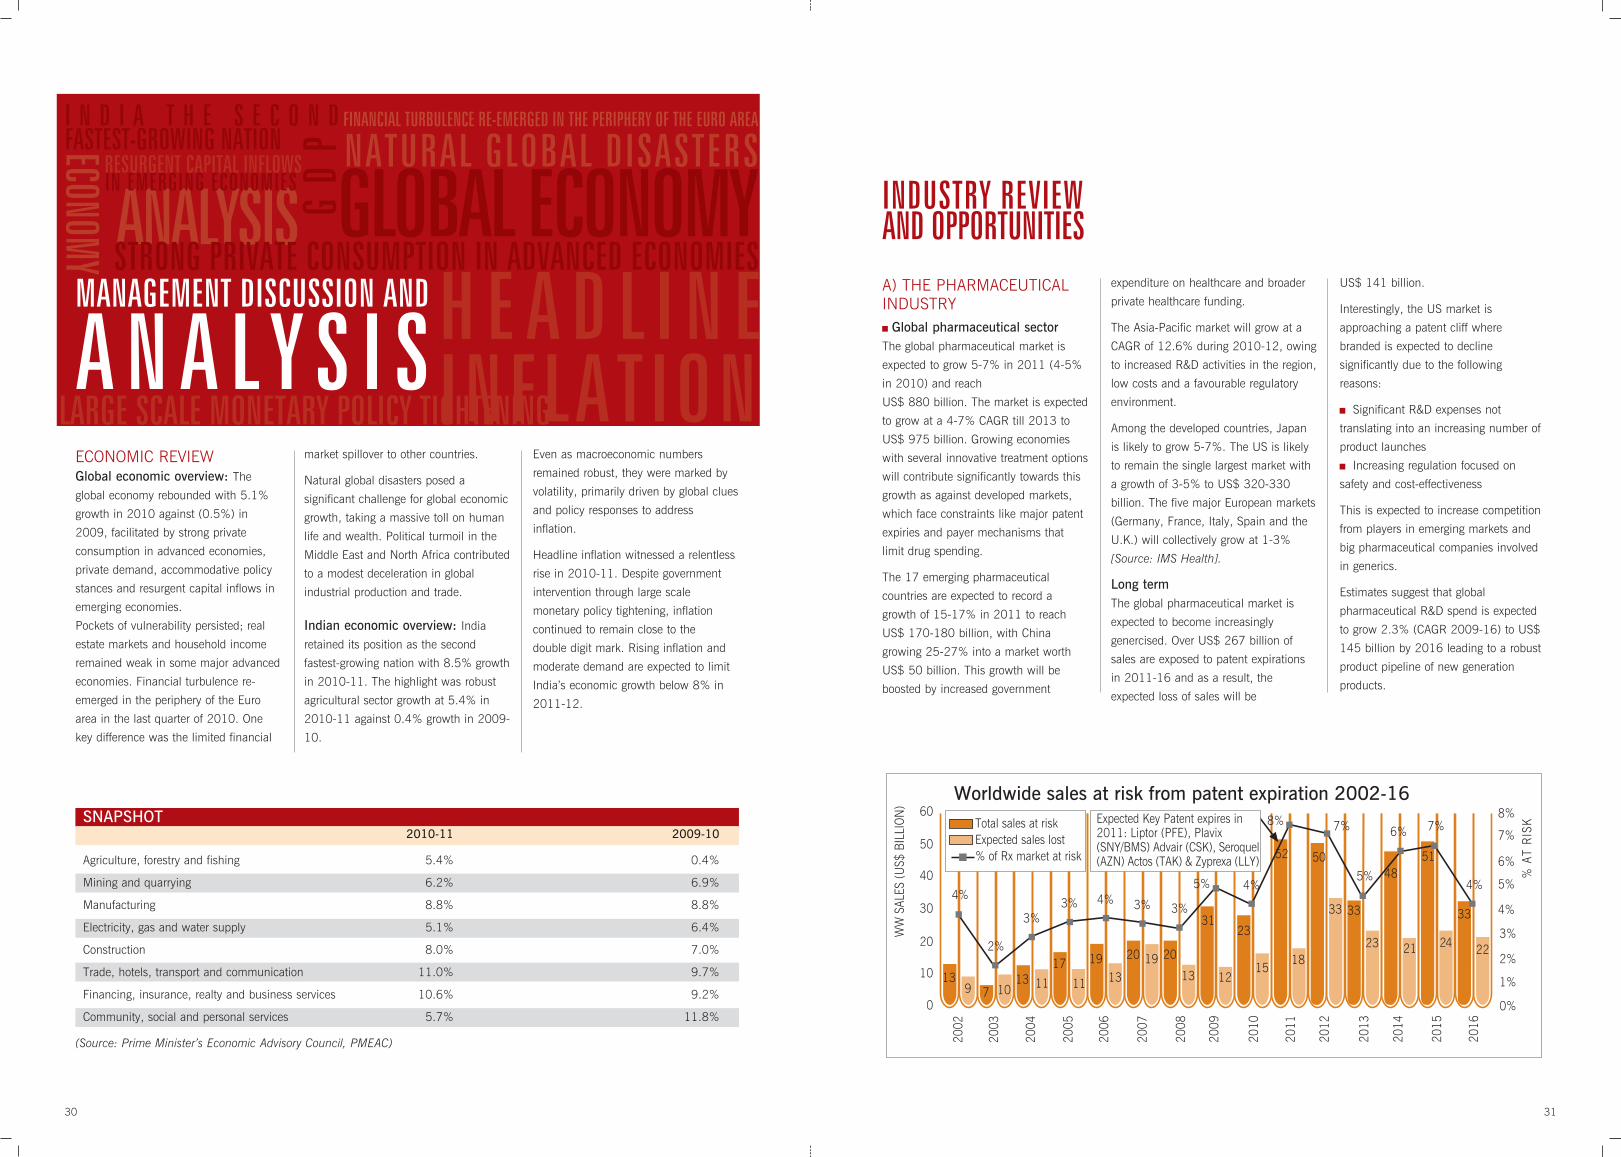
Long term The global pharmaceutical market is
expected to become increasingly
genercised. Over US$ 267 billion of
sales are exposed to patent expirations
in 2011-16 and as a result, the
expected loss of sales will be
US$ 141 billion.
Interestingly, the US market is
approaching a patent cliff where
branded is expected to decline
significantly due to the following
reasons:
Significant R&D expenses not
translating into an increasing number of
product launches
Increasing regulation focused on
safety and cost-effectiveness
This is expected to increase competition
from players in emerging markets and
big pharmaceutical companies involved
in generics.
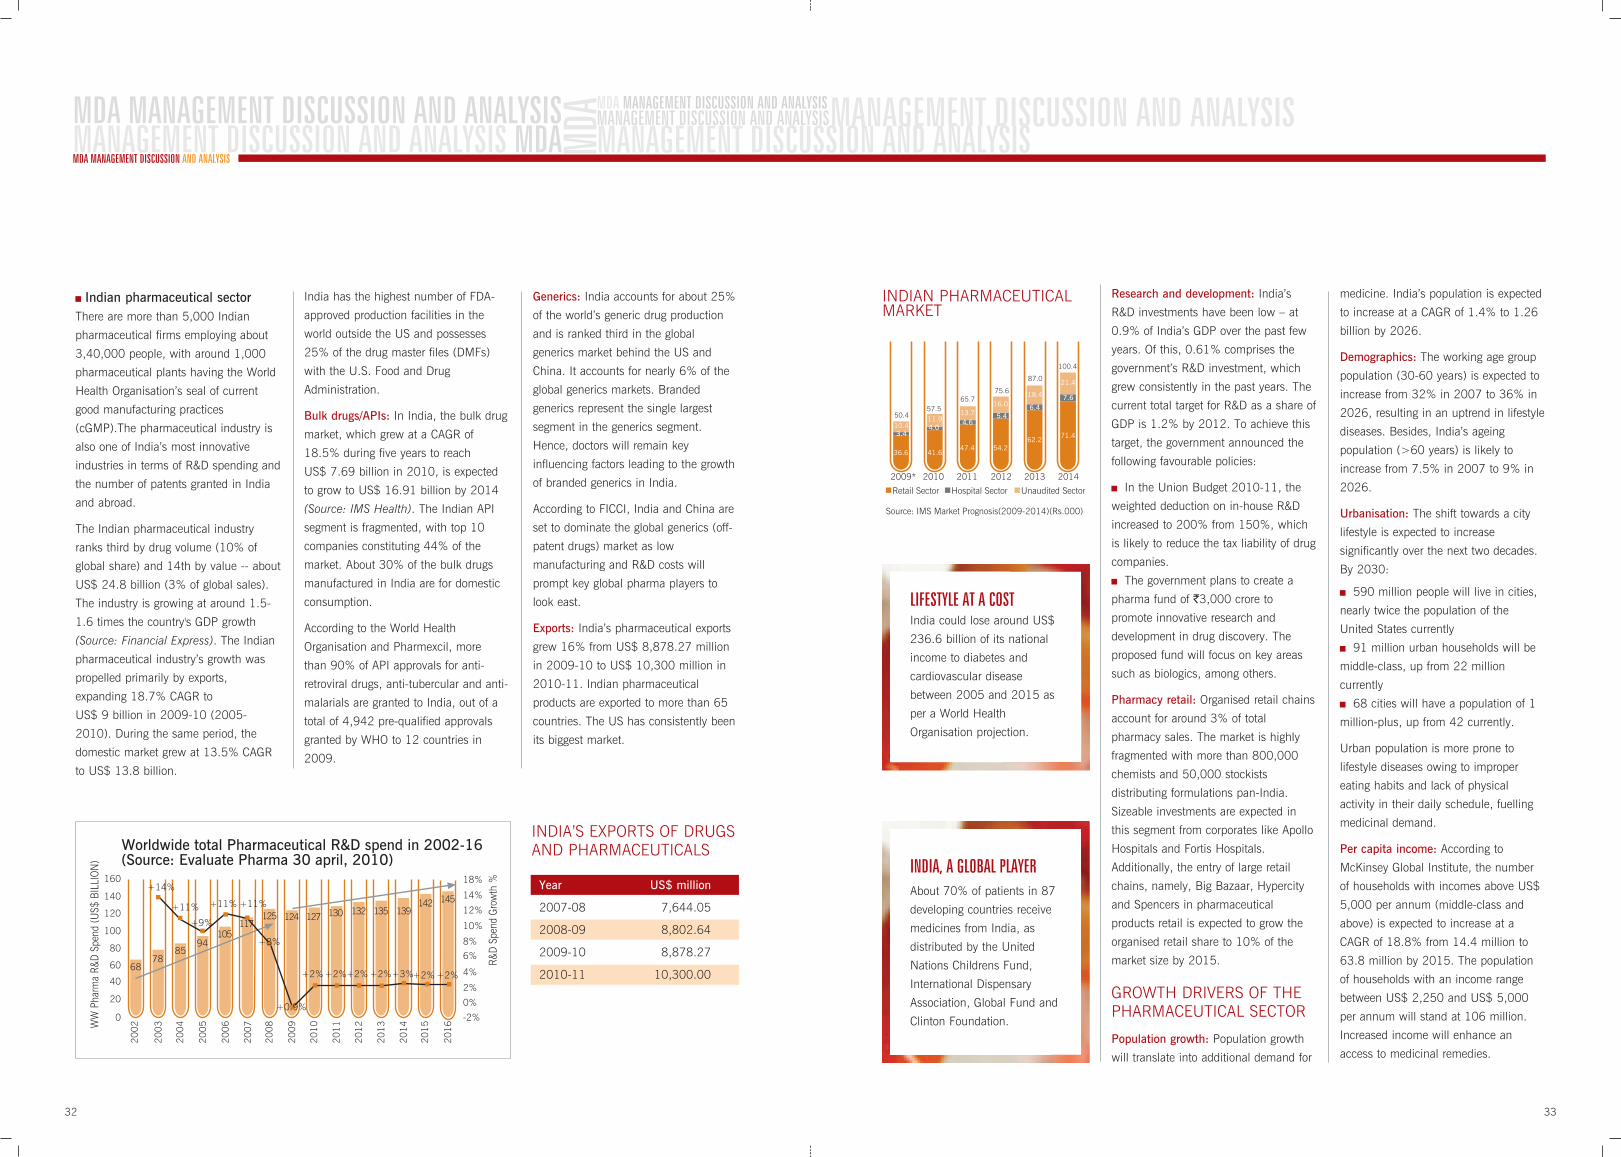
Estimates suggest that global
pharmaceutical R&D spend is expected
to grow 2.3% (CAGR 2009-16) to US$
145 billion by 2016 leading to a robust
product pipeline of new generation
products.
INDUSTRY REVIEWAND OPPORTUNITIES
SNAPSHOT2010-11 2009-10
Agriculture, forestry and fishing 5.4% 0.4%
Mining and quarrying 6.2% 6.9%
Manufacturing 8.8% 8.8%
Electricity, gas and water supply 5.1% 6.4%
Construction 8.0% 7.0%
Trade, hotels, transport and communication 11.0% 9.7%
Financing, insurance, realty and business services 10.6% 9.2%
Community, social and personal services 5.7% 11.8%
(Source: Prime Minister’s Economic Advisory Council, PMEAC)
3332
MDA MANAGEMENT DISCUSSION AND ANALYSIS MDA MANAGEMENT DISCUSSION AND ANALYSIS
MDA MANAGEMENT DISCUSSION AND ANALYSIS MANAGEMENT DISCUSSION AND ANALYSIS MANAGEMENT DISCUSSION AND ANALYSIS
MANAGEMENT DISCUSSION AND ANALYSIS MANAGEMENT DISCUSSION AND ANALYSIS MDA MD
A
Indian pharmaceutical sectorThere are more than 5,000 Indian
pharmaceutical firms employing about
3,40,000 people, with around 1,000
pharmaceutical plants having the World
Health Organisation’s seal of current
good manufacturing practices
(cGMP).The pharmaceutical industry is
also one of India’s most innovative
industries in terms of R&D spending and
the number of patents granted in India
and abroad.
The Indian pharmaceutical industry
ranks third by drug volume (10% of
global share) and 14th by value -- about
US$ 24.8 billion (3% of global sales).
The industry is growing at around 1.5-
1.6 times the country's GDP growth
(Source: Financial Express). The Indian
pharmaceutical industry’s growth was
propelled primarily by exports,
expanding 18.7% CAGR to
US$ 9 billion in 2009-10 (2005-
2010). During the same period, the
domestic market grew at 13.5% CAGR
to US$ 13.8 billion.
India has the highest number of FDA-
approved production facilities in the
world outside the US and possesses
25% of the drug master files (DMFs)
with the U.S. Food and Drug
Administration.
Bulk drugs/APIs: In India, the bulk drug
market, which grew at a CAGR of
18.5% during five years to reach
US$ 7.69 billion in 2010, is expected
to grow to US$ 16.91 billion by 2014
(Source: IMS Health). The Indian API
segment is fragmented, with top 10
companies constituting 44% of the
market. About 30% of the bulk drugs
manufactured in India are for domestic
consumption.
According to the World Health
Organisation and Pharmexcil, more
than 90% of API approvals for anti-
retroviral drugs, anti-tubercular and anti-
malarials are granted to India, out of a
total of 4,942 pre-qualified approvals
granted by WHO to 12 countries in
2009.
Generics: India accounts for about 25%
of the world’s generic drug production
and is ranked third in the global
generics market behind the US and
China. It accounts for nearly 6% of the
global generics markets. Branded
generics represent the single largest
segment in the generics segment.
Hence, doctors will remain key
influencing factors leading to the growth
of branded generics in India.
According to FICCI, India and China are
set to dominate the global generics (off-
patent drugs) market as low
manufacturing and R&D costs will
prompt key global pharma players to
look east.
Exports: India’s pharmaceutical exports
grew 16% from US$ 8,878.27 million
in 2009-10 to US$ 10,300 million in
2010-11. Indian pharmaceutical
products are exported to more than 65
countries. The US has consistently been
its biggest market.
Research and development: India’s
R&D investments have been low – at
0.9% of India’s GDP over the past few
years. Of this, 0.61% comprises the
government’s R&D investment, which
grew consistently in the past years. The
current total target for R&D as a share of
GDP is 1.2% by 2012. To achieve this
target, the government announced the
following favourable policies:
In the Union Budget 2010-11, the
weighted deduction on in-house R&D
increased to 200% from 150%, which
is likely to reduce the tax liability of drug
companies.
The government plans to create a
pharma fund of `3,000 crore to
promote innovative research and
development in drug discovery. The
proposed fund will focus on key areas
such as biologics, among others.
Pharmacy retail: Organised retail chains
account for around 3% of total
pharmacy sales. The market is highly
fragmented with more than 800,000
chemists and 50,000 stockists
distributing formulations pan-India.
Sizeable investments are expected in
this segment from corporates like Apollo
Hospitals and Fortis Hospitals.
Additionally, the entry of large retail
chains, namely, Big Bazaar, Hypercity
and Spencers in pharmaceutical
products retail is expected to grow the
organised retail share to 10% of the
market size by 2015.
GROWTH DRIVERS OF THEPHARMACEUTICAL SECTOR
Population growth: Population growth
will translate into additional demand for
medicine. India’s population is expected
to increase at a CAGR of 1.4% to 1.26
billion by 2026.
Demographics: The working age group
population (30-60 years) is expected to
increase from 32% in 2007 to 36% in
2026, resulting in an uptrend in lifestyle
diseases. Besides, India’s ageing
population (>60 years) is likely to
increase from 7.5% in 2007 to 9% in
2026.
Urbanisation: The shift towards a city
lifestyle is expected to increase
significantly over the next two decades.
By 2030:
590 million people will live in cities,
nearly twice the population of the
United States currently
91 million urban households will be
middle-class, up from 22 million
currently
68 cities will have a population of 1
million-plus, up from 42 currently.
Urban population is more prone to
lifestyle diseases owing to improper
eating habits and lack of physical
activity in their daily schedule, fuelling
medicinal demand.
Per capita income: According to
McKinsey Global Institute, the number
of households with incomes above US$
5,000 per annum (middle-class and
above) is expected to increase at a
CAGR of 18.8% from 14.4 million to
63.8 million by 2015. The population
of households with an income range
between US$ 2,250 and US$ 5,000
per annum will stand at 106 million.
Increased income will enhance an
access to medicinal remedies.
INDIA, A GLOBAL PLAYER About 70% of patients in 87
developing countries receive
medicines from India, as
distributed by the United
Nations Childrens Fund,
International Dispensary
Association, Global Fund and
Clinton Foundation.
LIFESTYLE AT A COST India could lose around US$
236.6 billion of its national
income to diabetes and
cardiovascular disease
between 2005 and 2015 as
per a World Health
Organisation projection.
INDIA’S EXPORTS OF DRUGSAND PHARMACEUTICALS
Year US$ million
2007-08 7,644.05
2008-09 8,802.64
2009-10 8,878.27
2010-11 10,300.00
INDIAN PHARMACEUTICALMARKET

3534
MDA MANAGEMENT DISCUSSION AND ANALYSIS MDA MANAGEMENT DISCUSSION AND ANALYSIS
MDA MANAGEMENT DISCUSSION AND ANALYSIS MANAGEMENT DISCUSSION AND ANALYSIS MANAGEMENT DISCUSSION AND ANALYSIS
MANAGEMENT DISCUSSION AND ANALYSIS MANAGEMENT DISCUSSION AND ANALYSIS MDA MD
A
Healthcare insurance: The health
insurance market represents one the
fastest growing and second-largest non-
life insurance segment. This growth is
accelerated by favourable government
policies: the Rashtriya Swasthya Bima
Yojna (RSBY), a health insurance
scheme launched in April 2008, will
provide health insurance coverage to
about 30 crore individuals below-the-
poverty-line (BPL) by 2012-13. The
Indian health insurance market is
expected to grow at a CAGR of over
25% from 2009-10 to 2013-14.
Medical tourism: India will account
for a 3% share in the global medical
tourism industry by 2013, generating
revenues of US$ 3 billion, growing at a
CAGR of around 26% during 2011–
2013. During this period, the number of
medical tourists are expected to grow at
a CAGR of over 19% to 1.3 million.
CREDIBLE ESTIMATES India and China are expected to
propel the global pharma market to US$
1.1 trillion by 2014 [Source: Money
Control].
The Indian pharmaceutical industry
is expected to record a compound
annual growth rate (CAGR) of 14.2% to
US$ 50 billion by 2015-16.
By 2015, India is expected to rank
among the top 10 global pharmaceutical
markets, with the industry growing at
around 1.6 times the country's GDP
growth (Source: The Financial Express).
B) MINT/MENTHOLSEGMENT India produces about 75-80% of the
world’s mentha oil production, the
balance contributed by China, Brazil and
the US.
Mentha oil is used for making mint
products, namely mint oils, menthol
crystals and menthol powder. In India,
about 32.5 million kgs mentha leaves
are farmed across 1,25,000 hectares.
The domestic demand for mentha oil is
about 8,000-10,000 tonnes, whereas
exports account for 18,000-22,000
tonnes, growing by 10-12% annually.
Export of mint products is increasing,
covering menthol powder, flakes,
crystals and mint oils. Menthol powder
is the single largest exported product
group.
In 2010-11, Indian exports of mint
products increased significantly, largely
owing to a resurgence in demand from
the US and Europe.
C) CRAMS BUSINESS 1) Global CRAMs opportunity The global pharmaceutical outsourcing
market is estimated at US$ 67 billion in
2010 and was expected to grow at a
14% CAGR (2007–2012) to US$ 85
billion by 2012.
2) Indian CRAMS sectorThe CRAMS opportunity in India is large
as US companies have reduced their
R&D expenditure in the recent past.
These companies are outsourcing their
R&D, primarily to reduce their operating
expenses and move to low-cost
destinations like China and India that
possess high chemistry skills.
The Indian pharmaceutical companies
are capable of providing late stage
discovery (research chemistry) and drug
development services. However, they are
in the process of building research
biology skills to facilitate early stage
discovery.
The Indian contract research industry
grew at a 65% CAGR (2007-10) to
around US$ 1.5 billion in 2010,
outpacing the 15% growth in the global
contract research market over the same
period (the global market stood at US$
25 billion in 2010).
Contract manufacturing operations are
the largest contributors (more than
60%) to CRAMS earnings. India has
earned the reputation of being a master
at value-engineering products similar to
patented products in a non-infringing
manner, strengthening its expertise to
challenge patents in the US FDA, which
was perceived as a threat to global
companies. However, the Indian Patent
Protection Amendment Act 2005
addresses these threats and opens larger
opportunities for contract research
operations from regulated markets.
The global outsourcing business will
witness a major shift from North
American and European markets to Asia
(mainly India and China), given the low
R&D productivity and intense pressure
on global innovators to catalyse growth.
India is on the threshold of a big
opportunity, with its market share in the
global contract manufacturing business
likely to more than double to 7% by
2012, indicating better prospects for
established CRAMS players.
KEY GLOBAL GROWTH DRIVERS
Patent expiries Expected sales lost in 2002-10 due to patent expiries were US$ 114 billion while in
coming years 2011-16, the expected sales lost will be US$ 141 billion
New launches not enough to justify loss of existing blockbuster drugs going off-patent
Falling R&D productivity Sales generated by new approvals have seen declining trends over the last few years
despite an increase in R&D budgets
Average R&D cost increased to US$ 1.3 billion per NME; rising intolerance to side
effects of new drugs reduces research productivity
Focus on generics/branded generics Increasing role of generics in developed countries by insurance and healthcare providers
Foray into the branded generics segment of emerging markets to boost dwindling global
revenues and profitability
Cost pressures Falling R&D productivity coupled with pricing pressure led to margin contraction
Increase in raw material and wage inflation to further impact bottomline
Source: ICRA report (June 2011)
INDIAN CRAMS MARKET (US$ BILLION) GLOBAL CRAMS MARKET (US$ BILLION)

3736
Surya Pharmaceutical Ltd is not only recording impressive growth in sales and profits, but is undergoing a makeover from
conventional businesses that manufacture (antibiotic APIs, finished dosage forms, menthol and mint derivatives, phyto-
pharmaceuticals), market domestically and abroad and offer CRAMs solutions to new generation businesses that also develop
and market own medicine, OTC and consumer product brands.
HIGHLIGHTSGross sales increased 16.4% from
`741.9 crore in 2009-10 to `863.4
crore in 2010-11.
Exports grew 34.5% from `225.5
crore in 2009-10 to `303.22 crore in
2010-11
The division received Drug Master file
approvals for Cefaclor from the Korean
FDA and for Cefaclor and CPDP from
Turkey opening a sizeable opportunity.
OVERVIEWSuryaLife, the Pharmaceutical
division, is predominantly an antibiotics
and herbal API manufacturer in addition
to making finished dosage forms; the
business segment contributes about
53% to the Company’s topline.
Its products are manufactured at three
facilities, namely Banur, Baddi and
Jammu, with a manufacturing capacity
of 3,112 tonnes. The fourth facility at
Panchkula is an R&D facility.
The units manufacture more than 40
products and intermediates in beta-
lactams, cephalosporins and
carbapenems.
The Company’s products find
acceptance among more than 600
customers – domestic and international;
some of its marquee clients include
Biesterfeld, Indoco, Glaxo Smithkline,
Zydus, Cipla, FDC and Ranbaxy; about
150 customers source more than a
single product.
The Company invested more than
`50 crore in two years to modernise and
upgrade the Banur facility,
benchmarking it with the requirements
of global regulatory authorities.
The Company invested `320 crore in
setting up the Jammu facility in line
with USFDA standards comprising five
operating units (sterile and non-sterile
APIs and sterile formulations).
This state-of-the-art facility houses
imported equipment with complete
automation, and is capable of clearing
international regulatory audits.
KOREAN FDACONSUMERPRODUCTS
JAMMUACTIVE PHARMACEUTICAL INGREDIENTS (APIS)
FINISHED DOSAGE FORMS BANUR
A N T I B I O T I C S A P I SCRAMS SOLUTIONS 80 COUNTRIES
GROSS SALES INCREASED 16.4% PHYTO-PHARMACEUTICALS
OT
C BADDI
OTC PRODUCTS
N E W G E N E R A T I O N B U S I N E S S E S L I K EDEVELOPING AND MARKETING OWN BRANDS
B U S I N E S S
OPERATIONS ACTIVE PHARMACEUTICAL INGREDIENTS(APIS) AND FINISHED DOSAGE FORMS
BUSINESS DIVISION
API FACILITIES AT JAMMU
PLANT 3Two products (non-sterile)
SALE
PLANT 1& 2Converts non-sterile API to
sterile API for making FDFs
PLANT 4Manufactures FDFs
(injectables)
PLANT 5Four products (non-sterile); Two sold directly, Two to be
converted to sterile API

3938
MDA MANAGEMENT DISCUSSION AND ANALYSIS MDA MANAGEMENT DISCUSSION AND ANALYSIS
MDA MANAGEMENT DISCUSSION AND ANALYSIS MANAGEMENT DISCUSSION AND ANALYSIS MANAGEMENT DISCUSSION AND ANALYSIS
MANAGEMENT DISCUSSION AND ANALYSIS MANAGEMENT DISCUSSION AND ANALYSIS MDA MD
A
OPERATIONS SNAPSHOTLocation Certifications Capacity
Baddi ISO:9000; GMP 1,680 TPA
Banur ISO 9000-2008, 660 TPA
GMP, KFDA approved
and R&D approved
by DSIR
Jammu USFDA compliant 772 TPA
Panchkula R&D approved by DSIR R&D
REVENUE(` crore)
572.
4720
08-0
9
741.
9720
09-1
0
2010
-11
863.
40
DOMESTIC SALES (` crore)
395.
1920
08-0
9
516.
4920
09-1
0
2010
-11
560.
18EXPORTS(` crore)
177.
2820
08-0
9
225.
4820
09-1
0
2010
-11
303.
22
CORE COMPETENCERanked among the top five in India in
Beta lactams and oral Cephalosporins
range of anti-infectives.
Achieved segment domination and
cost leadership in oral, crystalline, non-
sterile Beta lactams and Carbapenems.
Manufactures 90% of the
intermediates used to make APIs,
strengthening its competitive edge – the
in-house process provides complete
control on product quality, consistency
and cost; additionally, marketing
intermediates allows the Company a toe-
hold in global markets before regulatory
clearances are received.
Skilled scientists and state-of-the-art
R&D facilities provide a product
pipelines; quality assurance initiatives
improve plant utilisation.
Benchmarked multiple plants to
international standards; provides the
flexibility to cater to shift products
between operating units to capitalise on
opportunities.
Greater emphasis on regulatory which
will positively impact sales and margins.
Stablilised the marketing team,
strengthening client confidence; adopted
a region-centric marketing approach
with dedicated teams for each region,
allowing for a better conversion of
opportunities into business realities.
KEY INITIATIVES 1) At the shop floor, Baddi
Increased manufacturing capacity by
about 20% for some products by
connecting a DEX system in the new
8KL reactor
Added product-wise partitions to
avoid cross contamination and process
isolation
Introduced new SS tray dryers for
drawing facility for the Cloxa section
Invested in sophisticated microbiology
laboratory equipped with best-in-class
facilities
Invested in warehouses covering
1,213 sq. mtr. (G+2) for material
storage in a controlled environment
(cGMP and WHO GMP-compliant)
Replaced the small capacity DG set
with a new 1,000 KVA DG set,
strengthening in-house power generation
capability
Installed a new DEX system to
optimise production costs
Added one GC In Quality Control Lab
At the shop floor, BanurDeveloped alternative processes for 5-
6 products, reducing manufacturing
cycle time and costs
Increased manufacturing capacity by
about 30-40% for some products by de-
bottlenecking operations, adding
modules and undertaking certain
processes in isolation
Introduced the spray drying facility for
developing amorphous product variants,
strengthening the value-addition quotient
Created oxygen-generating units to
replace liquid oxygen in the ozonator
Invested in large warehouses which
are cGMP-compliant to store material in
a controlled environment
Added a refrigeration unit which
eliminated liquid nitrogen purchases for
cryogenic reaction optimising
manufacturing costs
Altered refrigeration plant operations,
which eliminated the need for a pump,
saving electricity
Reduced boiler and the compressed
air pressure, optimising energy
consumption
At the shop floor, JammuCommissioned Plant 3 and Plant 5
dedicated to non-sterile APIs;
commissioned Plant 4 (manufacturing
sterile FDFs) by outsourcing inputs
Commenced manufacture of 10
products at the Jammu API plant
Transferred four products from the
Banur facility to the Jammu API plant
2) Market place Expanded domestic base by about
45-50 customers in 2010-11.
Showcased products and capabilities
in CPHI Europe, CPHI China and CPHI
India, the biggest exhibition for the
pharmaceutical sector (especially APIs).
Global footprint extended across 80+
nations as on March 31, 2011.
ROAD AHEAD Commercialise three APIs in the
herbal segment – colchicine, quinine
sulphate and thiocolchicoside.
Commence work on creating an API
manufacturing facility near Chandigarh
for non-antibiotic APIs.
Stabilise operations at the Jammu
facility; add about 5-6 products to the
Jammu units; obtain USFDA and other
international regulatory approvals for the
unit.
Capitalise on opportunities emerging
from the KFDA approval; increase
supplies to large domestic
pharmaceutical companies following
their approval of our plant, processes
and products.
HIGHLIGHTS The Baddi 87 formulation unit was
successfully inspected by WHO GMP,
facilitating entry into global markets.
Endorsed an agreement with a
leading Indian pharmaceutical major to
manufacture five generic Beta lactam
products which will gradually be scaled
to 16 dosage forms
Received the first bulk overseas order,
creating a global entry.
OVERVIEWSurya Pharmaceutical Ltd has a
formulations presence in two
manufacturing locations, Baddi and
Jammu. The Company has a state-of-
the-art formulations facility at Baddi
with a capacity to manufacture 972
million capsules, 630 million tablets
and 18 million bottles of dry powder.
It was successfully audited by the
Central Drug Authority, as per WHO
norms.
The Company entered the injectables
space with the commissioning of its
injectable unit (Plant 4) at Jammu,
equipped with an automated filling line
imported from Mekafor, Italy, among the
leading global pharmaceutical
equipment manufacturers.
KEY INITIATIVES Commissioned the third and fourth
plants at Jammu; this state-of-the-art
facility complies with USFDA standards
and will cater to regulated markets, like
the US and Europe.
Commenced operations at the
injectables unit at Jammu, utilising
outsourced APIs; produced vials which
are being validated.
ROAD AHEADLaunch about 50 products including
injectable formulations from the Jammu
facility.
Establish a strong presence in the
injectables sphere.
SURYALIFE - FINISHED DOSAGE FORMS
SUCCESSFUL AUDIT The Banur facility was successfully audited
by Ranbaxy and is expected to generate
revenues from 2011-12.

4140
HIGHLIGHTSIncreased gross sales of menthol and
mint derivatives by 82% from `414.7
crore in 2009-10 to `755 crore in
2010-11
Increased export of menthol and mint
derivatives by 21% from `153.5 crore
to `185.7 crore
Added large domestic customers like
Emami and Dabur and international
customers like Colgate Palmolive, A.M.
Todd, Frutorom.
OVERVIEWSurya, with 18 years of hands-on
experience in the chemical synthesis of
Beta lactams and Cephalosporins,
mastered herbal processing and
successfully emerged as one of India’s
leading player in menthol and mint
products within four years of initiating
this business vertical.
Surya is India’s second-largest exporter
of menthol; its products are exported to
90 countries, especially regulated
markets like the US, Europe and other
markets as per USFDA certification,
Halal certification, and ISO 22000-
2005. This division accounts for about
46% of the Company’s turnover.
The Company has two manufacturing
facilities for menthol products – one at
Jharimajra, Baddi for menthol and its
derivatives and another at Banur for
processing Demethylated Oil.
The Company manufactures about 15+
derivatives; menthol flakes and crystals
are sold in bulk to tobacco, chewing
gum, gutka, confectionaries and oral
hygiene players.
COMPETITIVE ADVANTAGEProximity: The Company’s facility is
located in Baddi (North India),
proximate to the mentha leaf cultivation
area.
Position: The Company is the second-
largest Indian exporter of menthol and
its derivatives – a position that draws
menthol users, to the corporate brand.
Products: The Company’s large product
portfolio enables it to capitalise on
growth opportunities from diverse user
segments.
Certification: The Company’s facilities
have been awarded the USFDA
registration, which allows them to
market products to regulated markets
and cater to the large global flavour and
fragrance companies.
Acceptance: The Company’s huge client
list and expansive global presence de-
risks it from an excessive dependence
on a single client or geography.
KEY INITIATIVES Initiated the marketing of cis-3-
Hexenol, a high value-added product to
domestic and international clients.
Commenced production of methyl
acetate at one of the facilities.
Adopted the policy of taking orders
that provide long-term revenue visibility
– this enabled better planning and
efficient capacity sweating.
Filed for regulatory clearance in
Europe for menthol products.
Improved operational parameters at
the Banur facility, reducing process loss
by about 200 basis points.
ROAD AHEADThe Company has drawn a blueprint for
doubling capacity of menthol and
derivatives, which should commence
operations by 2013-14.
MENTHOL AND MINT DERIVATIVESBUSINESS DIVISION
PRODUCT MATRIXProduct Capacity (MT)
Mentha oil 12,000
Menthol crystals 3,600
Menthol powder 4,500
Dementholised
Peppermint oil 2,800
Essential oils –
Other products –
SUCCESSFUL AUDIT Lamivudine, an anti-
retroviral product, consumes
a large amount of menthol –
1 tonne of Lamivudine
requires 1 tonne of menthol.
This product is a must for all
HIV-positive patients with a
huge market in Africa and
Latin America.
VARIEGATED USES OF MENTHOL AND MINT PRODUCTSProduct Uses
Oral Toothpaste, mouthwashes and oral sprays
Pharmaceutical Drugs, compresses, medicated oils,
analgesic balms and rubbing alcohol
Confectionery Chewing gum, hard candies, cough drops,
lozenges and licorice
Tobacco Regular cigarettes, menthol cigarettes, pipe tobacco
and chewing tobacco
Perfumed Lotions, shaving lotions, handkerchiefs, footsprays,
shampoos, refreshing towels and cooling gels
Peppermint oils
REVENUE(` crore)
179.
0620
08-0
9
414.
6620
09-1
0
2010
-11
755.
00
EXPORTS(` crore)
82.5
420
08-0
9
153.
4620
09-1
0
2010
-11
185.
69
DOMESTIC SALES (` crore)
96.5
220
08-0
9
261.
220
09-1
0
2010
-11
569.
31

4342
OVERVIEWThe Company divided its formulations
marketing into two divisions – ethical
formulations division (Alexus) and the
generic formulations divisions (Aegis).
These divisions cumulatively manage
232 SKUs, which are marketed by a
600+ salesforce with pan-India
distribution. The business vertical’s
contribution was miniscule in 2010-11
– 1% of the Company’s net sales; this
share is expected to grow.
Altair is the diagnostic and medical
equipment division with three products
(five SKUs) namely BP-alert monitors,
fever-alert, gluco-alerts and gluco-alert
strips.
CORE COMPETENCEIn-house APIs: Internal API sources
provide a consistent supply of quality
inputs; this allows the team to develop
novel therapies.
Relationships: Established brand
awareness across more than 1,00,000
doctors over India and strong
relationships with more than 60,000
stockists and chemists, facilitating
seamless product distribution.
Large team: A strong marketing team
comprising 500+ marketing
representatives and more than 100 area
managers enhance product availability.
Robust front-end: Organised retail
through the VIVA network provides a
robust marketing base.
KEY INITIATIVES Launched Neoclonazole, a topical
anti-bacterial/anti-fungal ointment under
the Aegis division, catering to a market
estimated at `200 crore and growing at
22% y-o-y.
Launched Aegicoff (anti-cough
preparation) and Aegicold (anti-cold
preparation) syrups under the Aegis
division.
Established a pan-India presence for
the ethical formulations business;
launched new products including
appetisers and PPIs, antibiotics (Agicin
100 mg, 250 mg and 500 mg),
alkalisers (Rycitral), along with infusions
including Metrogis, Yaflox and Aegicip in
FFs packs.
ROAD AHEADLaunch the dermatology and neuro-
psychiatry division in the current
financial year.
Establish a presence in high-growth
therapeutic segments, namely
respiratory, oncology neuropsychiatry,
diabetology and cardiac care.
The Altair division expects to add 10
new products in 2011-12.
FORMULATIONS MARKETINGE T H I C A L A N D G E N E R I C
BUSINESS DIVISION
MARKETING SETUPName Product category Team Products
Alexus Ethical formulation division 32 SKUs and 400+ marketing Antibiotics, PPIs, cough and cold
representatives pan-India distribution remedies, calcium and multi-vitamin
supplements
Aegis Generic formulation division 200 SKUs pan-India distribution Anti-infectives, anti-allergics,
NSAIDS and gastrointestinal
Adonia Gynaecology focused 15 SKUs and 200+ marketing Injectables, soft gels and tablets for
formulation division representatives distribution across feminine care
North, West and South India
Altair Diagnostic and medical 5 SKUs pan-India distribution BP Monitor, glucometer and digital
equipment thermometer
ALEXUS - BLOCKBUSTERSIN THE MAKING
Brand name Therapy area
FastAid Topical analgesic
Suryamox Antibiotic
LMG Antibiotic
Merycef Antibiotic
Anticold Anti-flu
ADONIA - BLOCKBUSTERSIN THE MAKING
Brand name Therapy area
Dronia Musculo-skeletal
Aronia Supplements
Adofert Supplements
AEGIS - BLOCKBUSTERS IN THE MAKING
Brand name Therapy area
Suryamox Antibiotic
Yaceff Antibiotic
Aegicoff Anti-bronchitis
Proad Nutraceutical
NEW DIVISION Surya launched a gynaecology-
focused ethical division, Adonia;
launched in May 2011 with 15
SKUs and 200+ marketing
representatives across three
Indian zones.
PRODUCTS (SKUs)
NA
2008
-09
3220
09-1
0
2010
-11
32
REVENUE(` crore)
NA
2008
-09
0.9
2009
-10
2010
-11
14.8
6

4544
HIGHLIGHTSEntered into an agreement with Crocs
Footwear of exclusively retail and
distribute of Crocs Rx medical footwear
across India and SAARC countries.
Acquired US-based over-the-counter
(OTC) analgesic drug brand ActivOn; the
deal provides global marketing rights.
The deal also adds to the Company’s
portfolio, other brands, namely Preferon,
FirstOn and RenewIn and global
marketing rights (except the US) for
HeadOn, another leading brand.
Tied up with E.T. Browne Drug Co. to
exclusively market and distribute of
Palmer’s, renowned for their premium
beauty, skin and cosmetic range of
cocoa butter-based products in India.
Collaborated with Royal Industries
Inc., Thailand to markete a new range
of quality baby feeding products and
accessories under the brand Nursa.
Attained exclusive and permanent
marketing rights for sports nutrition
products and supplements from QNT
in India.
OVERVIEWSurya’s consumer product vertical is a
recent addition. The business vertical is
divided into three distinct divisions,
which primarily deal in outsourced
products marketed under the Surya
brand. The product basket comprises
diagnostic and medical equipment, OTC
products and personal care and hygiene
products. Additionally, this vertical will
market products of global business
partners namely CROCS, QNT, Palmer’s
and Nursa.
The consumer products division was
launched to address a variety of
innovative healthcare and FMCG
products for institutional and home use.
The OTC products were launched under
the registered trademark of FastAid.
KEY INITIATIVES Launched a new range of products
under Basics which includes a range of
face washes and face scrubs.
Introduced a novel first aid kit under
the brand FastAid; separate formats
were launched for vehicle, home,
industrial and institutional use,
addressing a wide customer base.
ROAD AHEADAbout 50+ SKUs are expected to be
launched in 2011-12, comprising a
judicious mix of allopathic, herbal and
ayurvedic products sourced from
domestic and international partners.
Plan to launch products that address
diabetes, cardiovascular, migraine,
impaired immune and nervous system
as well as hepatitis.
CONSUMER PRODUCTS BUSINESS DIVISION
CORPORATE STRATEGYSHAREHOLDER VALUE
NEW PRODUCTS GENERATED POSITIVE FEEDBACK
EXISTING PRODUCTS ARE GAINING ACCEPTANCE
AVERAGE UNIT REALISATIONS INCREASED FROM RS 6,070
G L O B A L A L L I A N C E S ACQUIRED GLOBAL BRANDS
ROBUSTNESS OF THE BUSINESS MODEL
EBID
TA
ECONOMY
INCREASED FOCUS ON EXPORTS OVER THE YEARS
ANALYSIS OF FINANCIAL
STATEMENTSTHE COMPANY REGISTERED ROBUST GROWTH IN 2010-11, WHEREIN PROFITABILITY ACCELERATED FASTER THANTHE 41%+ REVENUE GROWTH, VINDICATING THE EFFECTIVENESS OF STRATEGY AND BUSINESS MODEL.
THE HIGHLIGHT
SNAPSHOT2010-11 2009-10 % growth Implication for the reader
(` crore) (` crore)
Gross sales 1,633.27 1,157.53 41.10 Existing products are gaining acceptance;
new products generated positive feedback
EBITDA 266.01 173.38 53.43 Establishes the ability of the team to
optimise costs
PBT 131.72 90.46 45.60 Highlights the profitable business of the Company
PAT 100.16 76.06 31.68 Ability of the management to grow shareholder value
Cash profit 133.48 96.24 38.69 Liquidity enables the management to capitalise
on opportunities
53.43% EBIDTA GROWTH
OVER THE PREVIOUSYEAR
ANALYSISD E B T - E Q U I T Y
41.10% TOTAL INCOME
GROWTH OVER THEPREVIOUS YEAR
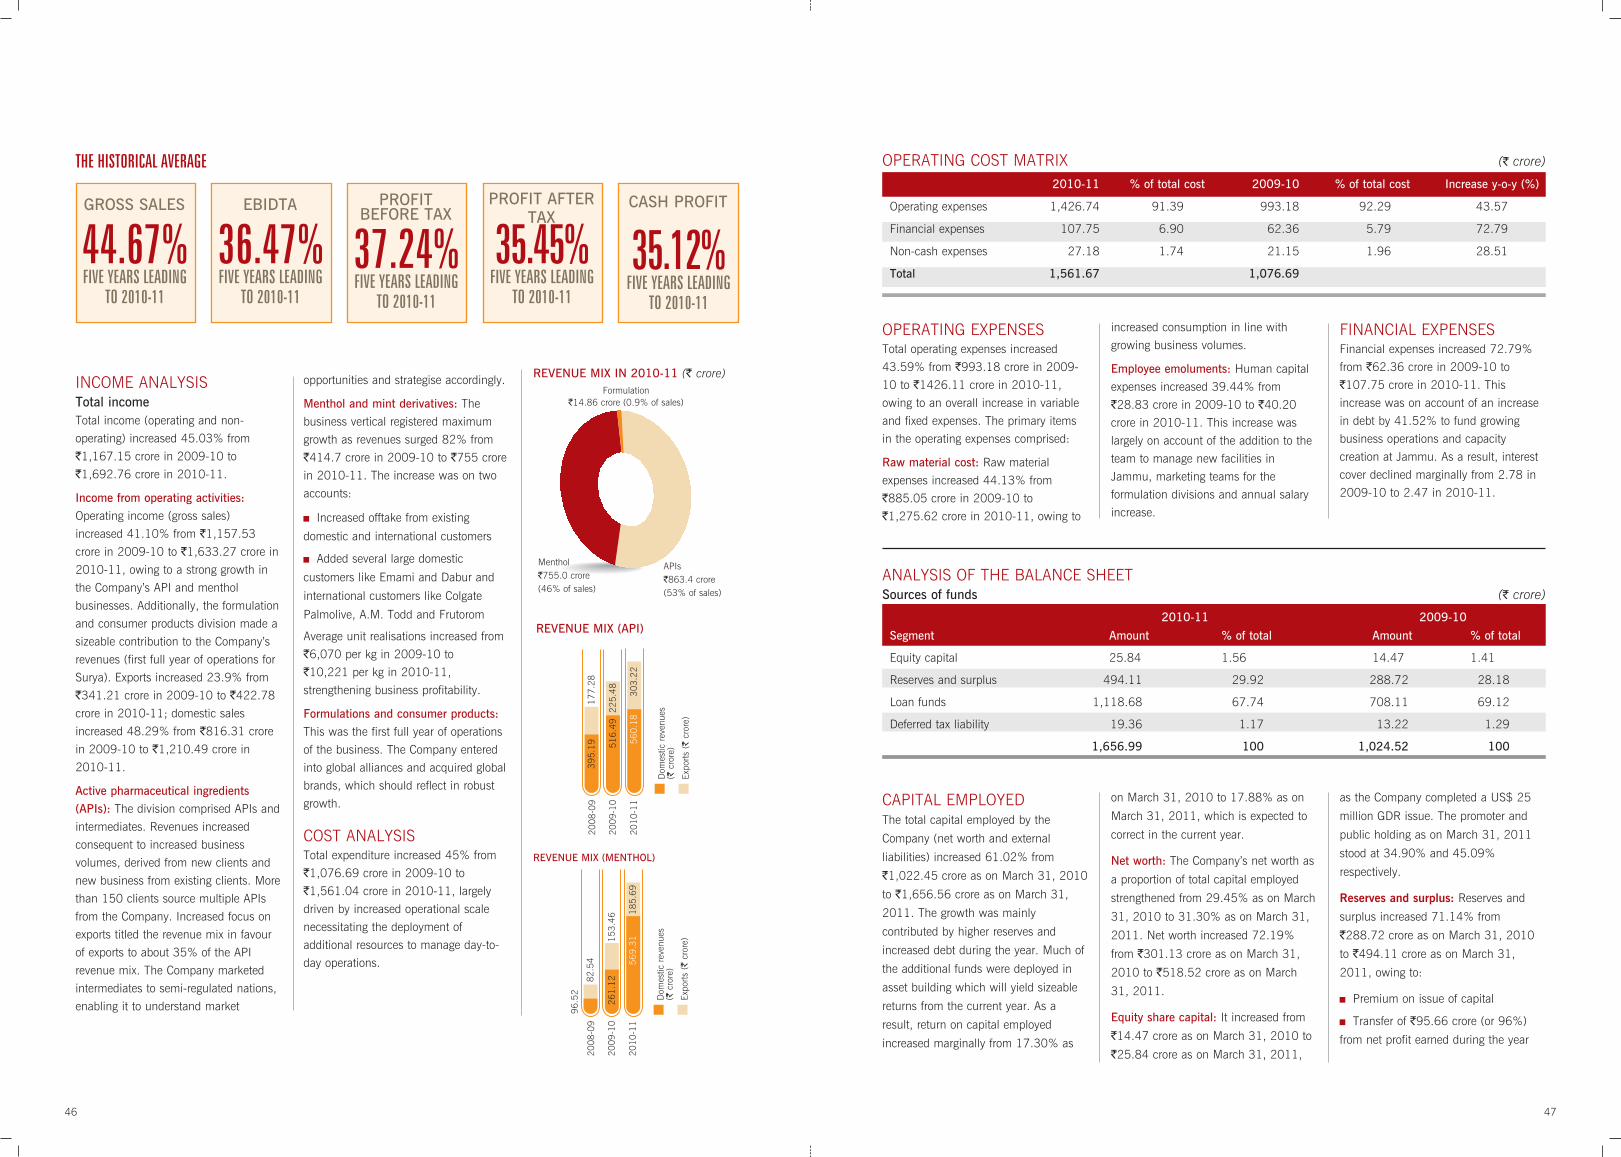
4746
INCOME ANALYSISTotal incomeTotal income (operating and non-
operating) increased 45.03% from
`1,167.15 crore in 2009-10 to
`1,692.76 crore in 2010-11.
Income from operating activities:
Operating income (gross sales)
increased 41.10% from `1,157.53
crore in 2009-10 to `1,633.27 crore in
2010-11, owing to a strong growth in
the Company’s API and menthol
businesses. Additionally, the formulation
and consumer products division made a
sizeable contribution to the Company’s
revenues (first full year of operations for
Surya). Exports increased 23.9% from
`341.21 crore in 2009-10 to `422.78
crore in 2010-11; domestic sales
increased 48.29% from `816.31 crore
in 2009-10 to `1,210.49 crore in
2010-11.
Active pharmaceutical ingredients
(APIs): The division comprised APIs and
intermediates. Revenues increased
consequent to increased business
volumes, derived from new clients and
new business from existing clients. More
than 150 clients source multiple APIs
from the Company. Increased focus on
exports titled the revenue mix in favour
of exports to about 35% of the API
revenue mix. The Company marketed
intermediates to semi-regulated nations,
enabling it to understand market
opportunities and strategise accordingly.
Menthol and mint derivatives: The
business vertical registered maximum
growth as revenues surged 82% from
`414.7 crore in 2009-10 to `755 crore
in 2010-11. The increase was on two
accounts:
Increased offtake from existing
domestic and international customers
Added several large domestic
customers like Emami and Dabur and
international customers like Colgate
Palmolive, A.M. Todd and Frutorom
Average unit realisations increased from
`6,070 per kg in 2009-10 to
`10,221 per kg in 2010-11,
strengthening business profitability.
Formulations and consumer products:
This was the first full year of operations
of the business. The Company entered
into global alliances and acquired global
brands, which should reflect in robust
growth.
COST ANALYSISTotal expenditure increased 45% from
`1,076.69 crore in 2009-10 to
`1,561.04 crore in 2010-11, largely
driven by increased operational scale
necessitating the deployment of
additional resources to manage day-to-
day operations.
OPERATING EXPENSESTotal operating expenses increased
43.59% from `993.18 crore in 2009-
10 to `1426.11 crore in 2010-11,
owing to an overall increase in variable
and fixed expenses. The primary items
in the operating expenses comprised:
Raw material cost: Raw material
expenses increased 44.13% from
`885.05 crore in 2009-10 to
`1,275.62 crore in 2010-11, owing to
increased consumption in line with
growing business volumes.
Employee emoluments: Human capital
expenses increased 39.44% from
`28.83 crore in 2009-10 to `40.20
crore in 2010-11. This increase was
largely on account of the addition to the
team to manage new facilities in
Jammu, marketing teams for the
formulation divisions and annual salary
increase.
FINANCIAL EXPENSESFinancial expenses increased 72.79%
from `62.36 crore in 2009-10 to
`107.75 crore in 2010-11. This
increase was on account of an increase
in debt by 41.52% to fund growing
business operations and capacity
creation at Jammu. As a result, interest
cover declined marginally from 2.78 in
2009-10 to 2.47 in 2010-11.
CAPITAL EMPLOYEDThe total capital employed by the
Company (net worth and external
liabilities) increased 61.02% from
`1,022.45 crore as on March 31, 2010
to `1,656.56 crore as on March 31,
2011. The growth was mainly
contributed by higher reserves and
increased debt during the year. Much of
the additional funds were deployed in
asset building which will yield sizeable
returns from the current year. As a
result, return on capital employed
increased marginally from 17.30% as
on March 31, 2010 to 17.88% as on
March 31, 2011, which is expected to
correct in the current year.
Net worth: The Company’s net worth as
a proportion of total capital employed
strengthened from 29.45% as on March
31, 2010 to 31.30% as on March 31,
2011. Net worth increased 72.19%
from `301.13 crore as on March 31,
2010 to `518.52 crore as on March
31, 2011.
Equity share capital: It increased from
`14.47 crore as on March 31, 2010 to
`25.84 crore as on March 31, 2011,
as the Company completed a US$ 25
million GDR issue. The promoter and
public holding as on March 31, 2011
stood at 34.90% and 45.09%
respectively.
Reserves and surplus: Reserves and
surplus increased 71.14% from
`288.72 crore as on March 31, 2010
to `494.11 crore as on March 31,
2011, owing to:
Premium on issue of capital
Transfer of `95.66 crore (or 96%)
from net profit earned during the year
THE HISTORICAL AVERAGE
GROSS SALES
44.67% FIVE YEARS LEADING
TO 2010-11
EBIDTA
36.47% FIVE YEARS LEADING
TO 2010-11
PROFIT BEFORE TAX
37.24% FIVE YEARS LEADING
TO 2010-11
PROFIT AFTERTAX
35.45% FIVE YEARS LEADING
TO 2010-11
CASH PROFIT
35.12% FIVE YEARS LEADING
TO 2010-11
REVENUE MIX IN 2010-11 (` crore)
APIs`863.4 crore(53% of sales)
Menthol`755.0 crore(46% of sales)
Formulation `14.86 crore (0.9% of sales)
OPERATING COST MATRIX (` crore)
2010-11 % of total cost 2009-10 % of total cost Increase y-o-y (%)
Operating expenses 1,426.74 91.39 993.18 92.29 43.57
Financial expenses 107.75 6.90 62.36 5.79 72.79
Non-cash expenses 27.18 1.74 21.15 1.96 28.51
Total 1,561.67 1,076.69
ANALYSIS OF THE BALANCE SHEETSources of funds (` crore)
2010-11 2009-10
Segment Amount % of total Amount % of total
Equity capital 25.84 1.56 14.47 1.41
Reserves and surplus 494.11 29.92 288.72 28.18
Loan funds 1,118.68 67.74 708.11 69.12
Deferred tax liability 19.36 1.17 13.22 1.29
1,656.99 100 1,024.52 100
REVENUE MIX (API)
2008
-09
Dom
estic
rev
enue
s(`
cror
e)
Expo
rts (
`cr
ore)
2009
-10
2010
-11
560.
18
516.
4922
5.48
177.
2839
5.19
303.
22
REVENUE MIX (MENTHOL)
2008
-09
Dom
estic
rev
enue
s(`
cror
e)
Expo
rts (
`cr
ore)
2009
-10
2010
-11
569.
31
261.
1215
3.46
82.5
4
96.5
2
185.
69

4948
Free reserves stood at `494.11 crore as
on March 31, 2011, providing a solid
foundation for undertaking future growth
initiatives.
Loan funds: Total loan funds increased
57.98% from `708.11 crore as on
March 31, 2010 to `1,118.68 crore as
on March 31, 2011. Despite an
increase in external funds, debt-equity
ratio strengthened from 2.35 as on
March 31, 2010 to 2.16 as on March
31, 2011, reflecting the strength in the
Company’s Balance Sheet. The
Company increased its reliance on
unsecured loans; its proportion in the
total debt increased from 3.90% as on
March 31, 2010 to 13.91% as on
March 31, 2011.
APPLICATION OF FUNDSGross block: The gross block increased
45.54% from `512.95 crore as on
March 31, 2010 to `746.54 crore as
on March 31, 2011. This was primarily
due to the commissioning of capacity
enhancement initiatives at its various
operating sites. The commissioning of
the Jammu facility was the most
significant contribution to the gross
block in 2010-11.
Investments: The investment portfolio
increased more than five-fold – from
`5.49 crore as on March 31, 2010 to
`25.81 crore as on March 31, 2011.
The increase was on account of:
Investment in mutual funds
Investment in subsidiaries namely
Surya Healthcare, Surya Eduquest and
Surya Biopharma and Surya
Pharmaceutical (Singapore) Pte Ltd
Of the total investments, long-term
investments stood at `20.61 crore and
current investments (largely mutual
funds) stood at `5.20 crore which can
be liquidated for funding capex
initiatives.
Net current assets: Net current assets
increased 69.06% from `588.98 crore
as on March 31, 2010 to `995.73
crore as on March 31, 2011; signifying
increased financial commitment to
support the growing operational scale.
The current ratio and quick ratio of the
firm increased from 2.63 and 0.81
respectively as on March 31, 2010 to
2.96 and 0.91 respectively as on March
31, 2011. Working capital as a
proportion of capital employed stood at
60.11% as on March 31, 2011.
TAXATIONThe Company’s current tax liability
increased 70.80% from `15.37 crore in
2009-10 to `26.25 crore in 2010-11,
owing to an increase in profit before tax
by 45.60%. The Company’s average tax
rate increased from 16.99% in 2009-
10 to 19.93% in 2010-11.
INTERNAL CONTROLSYSTEMS The Company has sound internal control
systems commensurate to its size,
business scale and operational
complexity. Clearly defined policies and
procedures and inbuilt checks and
controls supplement the internal control
procedures. A well-established and
empowered system of internal audits
and control procedures independently
review the financial and operational
controls and report deviations, if any, to
the senior management and facilitate
course correction when required. The
Company constantly engages in
practicing best financial and operational
control systems as per international
practices and standards.
The Company’s internal audit team
carried out extensive audits throughout
the year across all functional areas and
submits its report to the Audit
Committee of the Board of Directors.
The Audit Committee addresses
significant issues raised by the internal
and statutory auditors.
INDUSTRIAL RELATIONSAND HUMAN RESOURCEDEVELOPMENTThe Company remains committed and
focused on its most valuable resource –
its people. The Company believes that
people play a pivotal role in driving
performance and has effectively
empowered them. In pursuance of the
Company’s commitment to retain and
develop best available talent, several
programmes are conducted at various
levels on a regular basis. Employee
relations continue to be cordial and
harmonious at all Company levels and
units.
RISK MANAGEMENT Every business is susceptible to risks.
The Company relentlessly endeavours
not only to minimise risks but convert
them into business opportunities that
allow it to maximise returns for
shareholders from diverse situations.
The Company’s risk conversion
approach is built on a comprehensive
and integrated framework, leveraging its
strengths to create growth opportunities,
institutionalising prudent norms,
structured reporting and control. This
approach ensures that risk management
and growth creation discipline are
centrally initiated but efficiently
decentralised across the organisation.
The Company believes in constant
monitoring and decision-making to
balance risks and rewards to translate
into a perfect parity between revenue-
generating initiatives and risks taken.
Mr. Rajiv Goyal, Chairman & Managing Director
Ms. Alka Goyal, Executive Director
Mr. Anil Arya, Director
Mr. Abhishek Arya, Director
Mr. Ashwani K. Aggarwal, Nominee Director Of IDBI
Dr. H.B.L. Vohra, Director
Mr. Devinder Pal, Director
Dr. R.K. Gupta, Additional Director
BANKERSState Bank of India
Punjab National Bank
IDBI Bank
Bank of Baroda
Punjab and Sind Bank
Export and Import Bank of India
Allahabad Bank
Corporation Bank
Federal Bank
Catholic Syrian Bank
PLANTSPlot No. 85, HPSIDC, Industrial Area, Baddi-173 205
Distt. Solan (H.P.)
Plot No. 87, HPSIDC, Industrial Area, Baddi-173 205
Distt. Solan (H.P.)
Plot No. 383, Industrial Area, Phase I, Panchkula
(Haryana)
Plot No. 50 -51, EPIP, Phase I, Jharmajiri, Baddi
Village Banur, Tehsil Rajpura, Distt. Patiala (Punjab)
Industrial Growth Center-II, Samba, District Jammu (J&K)
REGISTERED OFFICESURYA PHARMACEUTICAL LTD.
911, 9th Floor, Surya Kiran Building, 19 K.G. Marg,
Connaught Place, New Delhi
CORPORATE OFFICESURYA PHARMACEUTICAL LTD.
SCO 164-165, SECTOR 9-C, MADHYA MARG,
CHANDIGARH - 160 009
AUDITORSM/S. AAD & ASSOCIATES
Chartered Accountants
# 1595, Sector 33D
Chandigarh
COMPANY SECRETARY & COMPLIANCE OFFICERMr. Rajansh Thukral
Surya Pharmaceutical Ltd.
S.C.O. 164-165, Sector 9-C,
Madhya Marg,
Chandigarh-160 009
COMPANY’S REGISTRAR AND SHARE TRANSFER AGENTSM/S. BIGSHARE SERVICES PVT. LTD.,
E-2/3, Ansa Industrial Estate, Sakivihar Road, Saki Naka,
Andheri (E), Mumbai-400 072
Tel:022-28470652/53, 40430200
CORPORATE INFORMATION
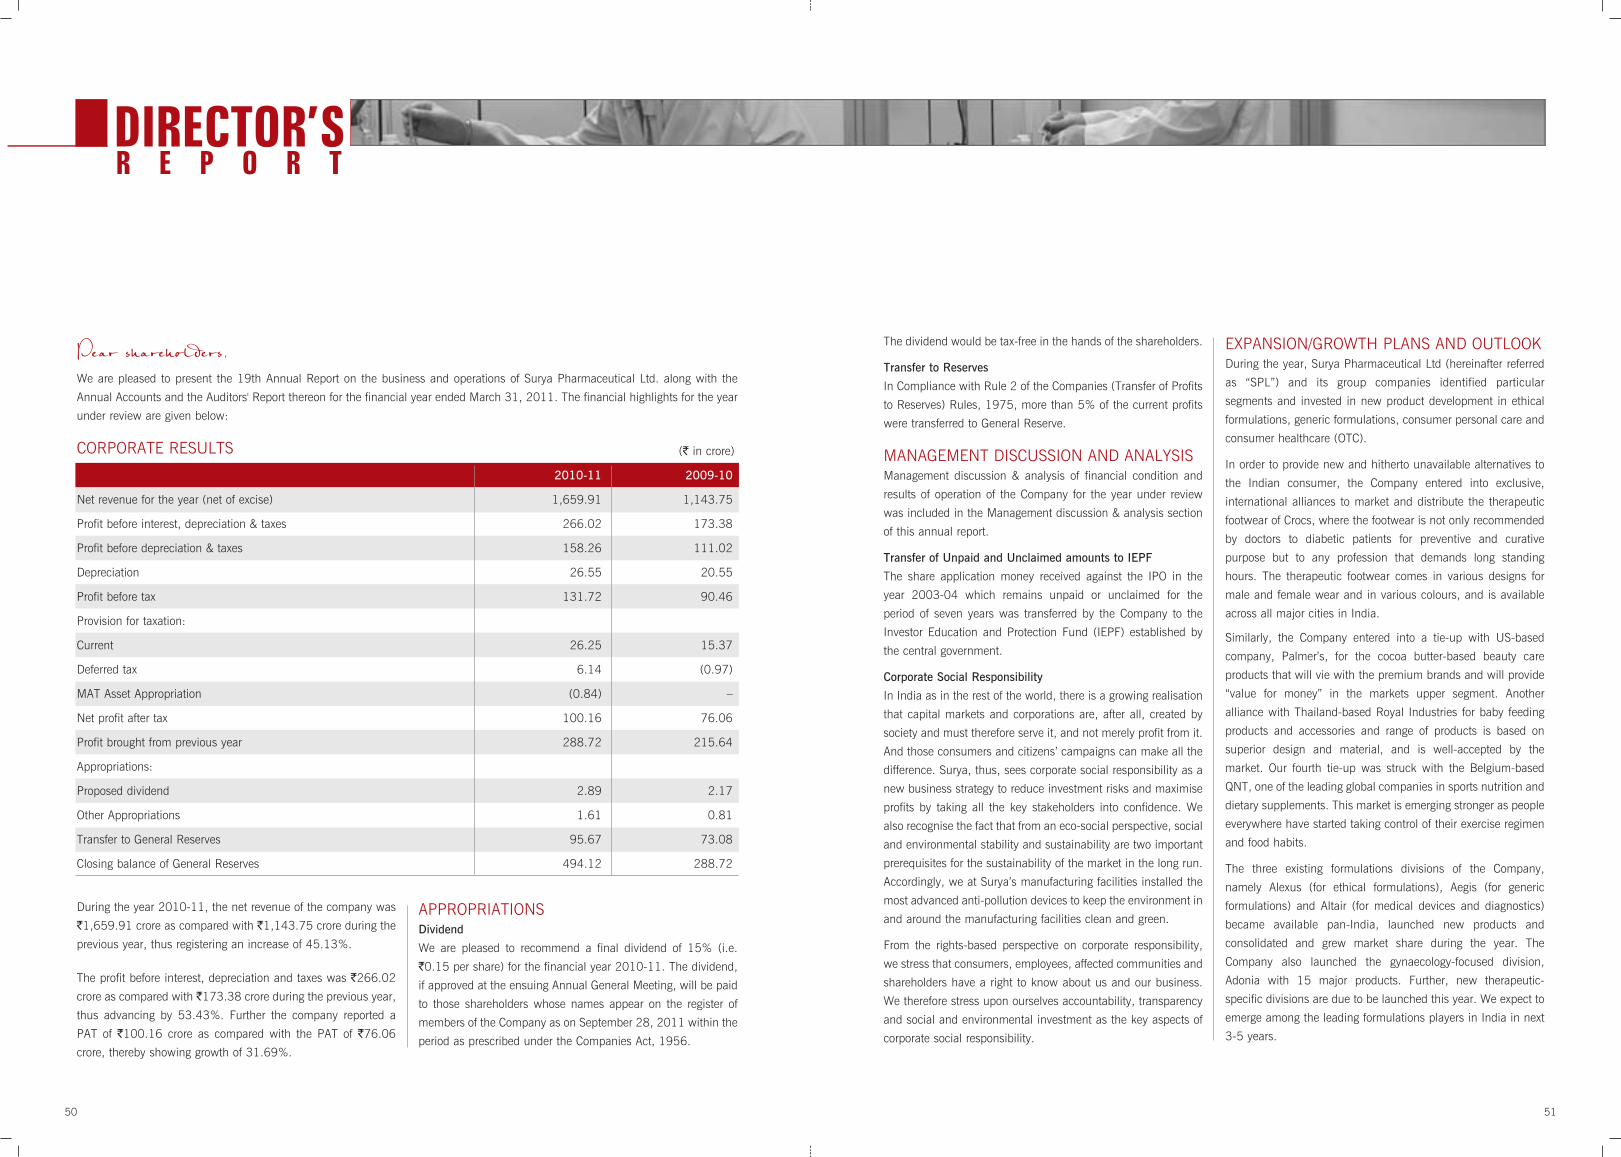
51
The dividend would be tax-free in the hands of the shareholders.
Transfer to Reserves
In Compliance with Rule 2 of the Companies (Transfer of Profits
to Reserves) Rules, 1975, more than 5% of the current profits
were transferred to General Reserve.
MANAGEMENT DISCUSSION AND ANALYSISManagement discussion & analysis of financial condition and
results of operation of the Company for the year under review
was included in the Management discussion & analysis section
of this annual report.
Transfer of Unpaid and Unclaimed amounts to IEPF
The share application money received against the IPO in the
year 2003-04 which remains unpaid or unclaimed for the
period of seven years was transferred by the Company to the
Investor Education and Protection Fund (IEPF) established by
the central government.
Corporate Social Responsibility
In India as in the rest of the world, there is a growing realisation
that capital markets and corporations are, after all, created by
society and must therefore serve it, and not merely profit from it.
And those consumers and citizens’ campaigns can make all the
difference. Surya, thus, sees corporate social responsibility as a
new business strategy to reduce investment risks and maximise
profits by taking all the key stakeholders into confidence. We
also recognise the fact that from an eco-social perspective, social
and environmental stability and sustainability are two important
prerequisites for the sustainability of the market in the long run.
Accordingly, we at Surya’s manufacturing facilities installed the
most advanced anti-pollution devices to keep the environment in
and around the manufacturing facilities clean and green.
From the rights-based perspective on corporate responsibility,
we stress that consumers, employees, affected communities and
shareholders have a right to know about us and our business.
We therefore stress upon ourselves accountability, transparency
and social and environmental investment as the key aspects of
corporate social responsibility.
EXPANSION/GROWTH PLANS AND OUTLOOKDuring the year, Surya Pharmaceutical Ltd (hereinafter referred
as “SPL”) and its group companies identified particular
segments and invested in new product development in ethical
formulations, generic formulations, consumer personal care and
consumer healthcare (OTC).
In order to provide new and hitherto unavailable alternatives to
the Indian consumer, the Company entered into exclusive,
international alliances to market and distribute the therapeutic
footwear of Crocs, where the footwear is not only recommended
by doctors to diabetic patients for preventive and curative
purpose but to any profession that demands long standing
hours. The therapeutic footwear comes in various designs for
male and female wear and in various colours, and is available
across all major cities in India.
Similarly, the Company entered into a tie-up with US-based
company, Palmer’s, for the cocoa butter-based beauty care
products that will vie with the premium brands and will provide
“value for money” in the markets upper segment. Another
alliance with Thailand-based Royal Industries for baby feeding
products and accessories and range of products is based on
superior design and material, and is well-accepted by the
market. Our fourth tie-up was struck with the Belgium-based
QNT, one of the leading global companies in sports nutrition and
dietary supplements. This market is emerging stronger as people
everywhere have started taking control of their exercise regimen
and food habits.
The three existing formulations divisions of the Company,
namely Alexus (for ethical formulations), Aegis (for generic
formulations) and Altair (for medical devices and diagnostics)
became available pan-India, launched new products and
consolidated and grew market share during the year. The
Company also launched the gynaecology-focused division,
Adonia with 15 major products. Further, new therapeutic-
specific divisions are due to be launched this year. We expect to
emerge among the leading formulations players in India in next
3-5 years.
50
DIRECTOR’SR E P O R T
We are pleased to present the 19th Annual Report on the business and operations of Surya Pharmaceutical Ltd. along with the
Annual Accounts and the Auditors' Report thereon for the financial year ended March 31, 2011. The financial highlights for the year
under review are given below:
CORPORATE RESULTS (` in crore)
2010-11 2009-10
Net revenue for the year (net of excise) 1,659.91 1,143.75
Profit before interest, depreciation & taxes 266.02 173.38
Profit before depreciation & taxes 158.26 111.02
Depreciation 26.55 20.55
Profit before tax 131.72 90.46
Provision for taxation:
Current 26.25 15.37
Deferred tax 6.14 (0.97)
MAT Asset Appropriation (0.84) –
Net profit after tax 100.16 76.06
Profit brought from previous year 288.72 215.64
Appropriations:
Proposed dividend 2.89 2.17
Other Appropriations 1.61 0.81
Transfer to General Reserves 95.67 73.08
Closing balance of General Reserves 494.12 288.72
During the year 2010-11, the net revenue of the company was
`1,659.91 crore as compared with `1,143.75 crore during the
previous year, thus registering an increase of 45.13%.
The profit before interest, depreciation and taxes was `266.02
crore as compared with `173.38 crore during the previous year,
thus advancing by 53.43%. Further the company reported a
PAT of `100.16 crore as compared with the PAT of `76.06
crore, thereby showing growth of 31.69%.
APPROPRIATIONSDividend
We are pleased to recommend a final dividend of 15% (i.e.
`0.15 per share) for the financial year 2010-11. The dividend,
if approved at the ensuing Annual General Meeting, will be paid
to those shareholders whose names appear on the register of
members of the Company as on September 28, 2011 within the
period as prescribed under the Companies Act, 1956.
5352
During the year under review, your Company achieved new
milestones for cost improvement and technology leadership. The
state-of-the-art cGMP-compliant, Jammu plant commissioned
two units in 2009-10, underwent further validation trials and
commercial production started in two new units during
2010-11. The Jammu plant can manufacture sterile and non-
sterile cephalosporin APIs and formulations for the regulated
markets. Among other developments, your Company‘s Banur
plant, the largest plant location among the six locations,
underwent successful audits with Korean FDA as well as large
Indian buyers. The cephalosporin formulations plant in Baddi
also successfully and deservedly underwent the CDSCO
inspection. Many technological improvements were
implemented in the plants to secure efficiency and compliances.
Your Company will continue to invest in modern technology in
the plants.
Within pharmaceuticals, the regulatory filings in terms of
marketing dossiers and drug master files gained momentum,
and during the year, the Company obtained drug master files for
Cefaclor and CPDP. New regulatory filings for Europe and the
US are in the pipeline. In menthol and mint derivatives, the
Company continues to enjoy the confidence of some of the
world’s largest buyers in consumer goods and flavours and
fragrances. The R&D division continued to focus on process
improvement, product development and added new dimensions
in the form of R&D formulations during the year. Phytochemicals
and CRAMS plan to exploit their strategic advantages in the
future.
Talent acquisition and retention has become one of the top
priorities, given that new businesses have been started with
experienced professionals, and your Company strengthened the
middle management ranks during the year. We aspire to
become the first choice employer for all professions in the Indian
economy. Your Company also moved its registered office from
Himachal Pradesh to New Delhi in order to acquire and retain
professionals from more diverse backgrounds.
SUBSIDIARY COMPANIESWith a track record of manufacturing excellent APIs and serving
customers across 90 countries in the last nineteen years, the
Company started exporting its formulations as well during 2010-
11, manufactured at its Baddi formulations facility. Your
Company incorporated a wholly- owned subsidiary in Singapore,
Surya Pharmaceutical Singapore Pte Ltd for the purpose of
trading in API s and raw materials for the Indian manufacturing
plants and also for launching Crocs therapeutic footwear in the
South East Asian market. While these business activities were
still under implementation, the US pharmaceutical OTC market
studded with prominent brands offered us an M&A opportunity
and we acquired ActivOn, the leading topical analgesic brand in
the US and four other brands, HeadOn, FirstOn, RenewIn and
PreferOn. The company in US, Family First Pharmaceuticals Inc
which managed the outsourced manufacturing, logistics and
distribution, was also acquired within the transaction. The value
of the deal was US$ 22 million.
The Company’s other subsidiary, Surya Healthcare Ltd,
launched 88 Viva stores during 2010-11 and also acquired
Hyderabad-based Medimart India Pvt Ltd for its 42 stores in
Hyderabad. The range of medicines, beauty care, everyday
essentials and consumer healthcare products gained
acceptance, and the Company added more than 100,000
customers to its loyalty programme. The stores are now present
in 25 cities across six states. The products are made available
through international tie-ups of the parent company helped Viva
to attract all segments of people, being a neighbourhood store
and by offering a touch and feel display, air conditioning and the
promise of safe and genuine medicines.
The Company has four subsidiaries as on March 31, 2011.
As per Section 212 of the Companies Act, 1956, we are
required to attach the Directors’ Report, Balance Sheet and Profit
and Loss Account of our subsidiaries to our annual report.
The Ministry of Corporate Affairs, Government of India vide its
circular no. 2/2011 dated February 08, 2011 provided an
exemption to companies from complying with Section 212,
provided such companies publish the audited consolidated
financial statements in the annual report. Accordingly, the
annual report 2010-11 does not contain the financial
statements of our subsidiaries. The audited annual accounts and
related information of our subsidiaries, where applicable, will be
made available for inspection during business hours at our
registered office in Delhi, India. The same will also be published
on our website, www.suryapharma.com.
The consolidated financial statements, in terms of Clause 32 of
the Listing Agreement and prepared in accordance with
Accounting Standard 21 as specified in Companies (Accounting
Standards) Rules, 2006 also forms part of this annual report.
The members, if desire, may write to the Company Secretary at
Registered Office of Surya Pharmaceutical Limited, to obtain a
copy of the financials of the subsidiary companies.
CAPITAL STRUCTUREDuring the year under review, the Company sub-divided the face
value of its equity shares from `10 each to `1 each. The
Authorised Share Capital increased from `50 crore to
`100 crore and the paid-up share capital of the Company
increased from `14,46,83,380 to `19,27,52,380 after issue of
Global Depository Receipts and conversion of 9,50,000 out of
47,00,000 Share Warrants during the year. Subsequently,in the
current year, the promoters have exercised 10,00,000 Share
Warrants thereby increasing the Paid up Capital to
`20,27,52,380.
DIRECTORSDuring the year under review, Mr. Abhishek Arya and Mrs. Alka
Goyal, Directors of the Company, retire by rotation at the
ensuing Annual General Meeting of the Company and being
eligible, offer themself for reappointment. The Board
recommends their reappointment.
In accordance with the provisions of the Companies Act, 1956
and the Articles of Association of the Company, Dr. R. K Gupta,
was appointed as Additional Director of the Company whose
term expires at this Annual General Meeting of the Company. It
is proposed to appoint him as Director of the Company liable to
retire by rotation.
The details of their reappointment together with nature of their
expertise in specific functional areas and names of the
companies in which they hold office as Director and/or the
Chairman/ Membership of Committees of the Board, are
provided in the Notice of this Annual General Meeting.
DIRECTOR’S RESPONSIBILITY STATEMENTPursuant to the requirement under Section 217(2AA) of the
Companies Act, 1956, with respect to Director’s Responsibility
Statement, it is hereby confirmed that:
i) In the preparation of the annual accounts, the applicable
accounting standards have been followed;
ii) The Directors have selected such accounting policies and
applied them consistently and made judgments and
estimates that are reasonable and prudent so as to give a
true and fair view of the state of affairs of the Company as at
March 31, 2011 and of the profit of the Company for the
year ended on that date.
(iii) The Directors have taken proper and sufficient care for the
maintenance of adequate accounting records in accordance
with the provisions of the Companies Act, 1956 for
safeguarding the assets of the Company and for preventing
and detecting fraud and other irregularities; and
iv) The Directors have prepared the annual account of the
Company on a ‘going concern’ basis.
AUDITORS AND THEIR REPORTM/s. AAD & Associates, Chartered Accountants, the statutory
auditors of the Company holds office until the conclusion of the
ensuing Annual General Meeting and are eligible for
reappointment. The Company has received their consent letter
under Section 224 (1-B) of the Companies Act, 1956 to the
effect that their appointment, if made, would be within the
prescribed limit and that they are not other wise disqualified
within the meaning of Section 226 (3) of the Companies Act,
1956 for such appointment. The Board recommends their
reappointment as Auditors of the Company for the financial year
2011-12.
The notes to the accounts referred to in the Auditors Report are
self explanatory and therefore do not call for any further
comments.
INDUSTRIAL RELATIONSThe Company maintained healthy, cordial and harmonious
industrial relations at all levels. The enthusiasm and unstinting
efforts of employees have enabled the Company to gain present
level of growth.
CORPORATE GOVERNANCEThe Company is committed to maintain the highest standards of
Corporate Governance and adhere to the Corporate Governance
requirements set out by SEBI. The Company complied with the
applicable provisions of Corporate Governance under Clause 49
of the Listing Agreement with the stock exchanges.
A Report on Corporate Governance as stipulated under Clause
49 of the Listing Agreement forms part of the annual report.
The requisite Certificate from the Auditors of the Company
confirming compliance with the conditions of Corporate
Governance as stipulated under the aforesaid Clause 49, is
attached to this report.
SECRETARIAL AUDITFor each quarter of the financial year 2010-11, a qualified
practicing Company Secretary carried out audits to reconcile the
total admitted share capital with NSDL and CDSL, total issued
and listed share capital. The reports confirm that the total
issued/paid-up share capital is in agreement with the total
DIRECTOR’S REPORT

5554
number of shares in physical form and the total number of
dematerialised shares held with NSDL and CDSL.
COST AUDITPursuant to Section 233B of the Companies Act, 1956, the
central government has prescribed cost audit of the Company’s
bulk drug division and formulation division. Based on the
recommendations of the Audit Committee, and subject to the
approval of the Central Government the Board of Directors had
appointed M/s. J. Verma & Associates as Cost Auditors of the
Company for the financial year 2010-11 and 2011-12. The
cost audit report will be filed with the central government as per
the timeline.
ENERGY CONSERVATION, TECHNOLOGYABSORPTION AND FOREIGN EXCHANGEEARNINGS AND OUTGOThe information relating to energy conservation, technology
absorption, foreign exchange earnings and outgo required to be
disclosed under the Companies (Disclosure of Particulars in the
Report of Board of Directors) Rules, 1988 is given in Annexure-
B forming part of this report.
PARTICULARS OF EMPLOYEESParticulars of Employees in accordance with the provisions of
Section 217(2A) of the Companies Act, 1956 read with
Companies (Particulars of Employees) Rules, 1975, as
amended, forms part of this report and are given in Annexure-A
attached with the Director’s Report.
APPRECIATIONS AND ACKNOWLEDGEMENTSYour Directors express their gratitude to State Bank of India,
Punjab National Bank, Industrial Development Bank of India
Limited, Federal Bank Limited, Punjab & Sind Bank, Exim
Bank, Allahabad Bank, Bank of Baroda, Corporation Bank,
Catholic Syrian Bank and all other Banks and Financial
Institutions who have directly or indirectly supported the
Company for meeting short-term, long-term and working capital
financial needs of the Company’s expanding operations.
Your Directors place on record their sincere thanks to the central
and state governments of Punjab, Haryana, Himachal Pradesh
and the state of J & K for their continued support to the
Company. The Board also places on record the appreciation for
the support provided by the customers, suppliers, equipment
vendors and others to the Company.
Your Directors also wish to place on record their sincere thanks
and appreciation for the continuing support of the esteemed
shareholders of the Company.
The Board expresses its appreciations of the commitment,
contribution and support of all employees of the Company for
attaining the present level of growth.
For & on behalf of the Board
For Surya Pharmaceutical Limited
Sd/-
Place: Chandigarh Rajiv Goyal
Date: August 13, 2011 (Chairman & Managing Director)
PARTICULARS OF CONSERVATION OF ENERGY,
TECHNOLOGY ABSORPTION AND FOREIGN EXCHANGE
EARNINGS AND OUTGO AS PER SECTION 217 (1)(e) OF
THE COMPANIES ACT, 1956 AND THE RULES MADE
THEREUNDER AND FORMING PART OF THE DIRECTORS
REPORT FOR THE YEAR ENDED MARCH, 2011.
I. CONSERVATION OF ENERGY: The Company established various plant and machinery
segments and has put in place various systems with a specific
focus on the Company’s philosophy on conservation of energy.
The Company has always resorted to various energy-saving
tactics including optimisation of all energy generating and
consuming resources. Although the products manufactured by
the Company are material-intensive, the Company has been
continuously striving for cost reduction through various means
including energy conservation to stay competitive by saving on
costs in various operations.
Some of the steps taken by the Company for conservation of
energy are as under:-
1. Strict adherence to contract demand of State Electricity
Board Power Supply.
2. Stabilisation of manufacturing processes for better
productivity.
3. Emphasis on awareness for energy saving by control and
process upgradation, better house keeping, preventing
wastages among others.
4. Preventive maintenance inspections and checks at regular
intervals.
5. Optimisation of chilling system and chiller compressors.
6. Energy audit.
The power and fuel consumption is as under:-
Year ended Year ended
31.03.2011 31.03.2010
1 ELECTRICITY
a) Purchased:
Units 1,32,12,765 92,99,538
Total Amount (` lacs) 584.51 464.46
Rate per unit (`) 4.42 4.99
b) Own Generation:
Through Diesel Generator:
Units 33,53,451 27,55,654
Units per liter of Diesel Oil 3.05 3.36
Cost per unit (Rupees) 10.77 8.55
2A FURNACE OIL
Quantity (K litres) 885.10 314.17
Total Cost (` lacs) 270.21 79.31
Average rate (` per K litres) 30.53 25.25
2B LIGHT DIESEL OIL
Quantity (K litres) NIL NIL
Total Cost (` lacs) NIL NIL
Average rate (` per K litres) NIL NIL
2C HIGH SPEED DIESEL
Quantity (K litres) 2,974.26 1,536.78
Total Cost (` lacs) 1,046.04 441.66
Average rate (` per K litres) 35,170 28,739
3 PETCOKE
Details:
Quantity (In Tonnes) 375.15 1,341.66
Rate per Ton (`) 6,820.96 6,692.64
3A RICE HUSK
Quantity (In Tonnes) 25,238.67 14,214.49
Total Cost (` lacs) 1,038.88 465.93
Rate per Ton (`) 4,116.22 3,277.85
ANNEXURE-BTO THE DIRECTORS REPORT
ANNEXURE-ATO THE DIRECTORS REPORT
Sr. No. Name Age Existing Gross Qualifications Total Date of Previous
Designation Remuneration Experience Joining Employment
(` in Lacs) (p.a.)
1 Mr. Rajiv Goyal 48 years Chairman & `419.43 MBA 28 years 25.03.1992 NIL
Managing Director
2 Mrs. Alka Goyal 46 years Executive Director `419.43 Post Graduate 25 years 24.08.1996 NIL
Note: Mr. Rajiv Goyal, Chairman and Managing Director and Mrs. Alka Goyal, Executive Director of the Company are related to
each other.

5756
II TECHNOLOGY ABSORPTIONResearch and Development (R&D)
Key areas in which R&D was carried by the Company:
1. Process development and further improvement in products
like Cephachlor, Cefixime, Cefidinir, Cephalexin, Cefadroxil,
Cefradine, Ciprofloxacillin, Dicloxacillin, Flucloxacillin,
Cefuroxime Axetil & 7ANCA, among others.
2. Company started a new category of antibiotics named as
Carbapenems viz Imipenem, BCK.
3. Trial production for Oxocepham intermediates viz Flomoxef.
4. Process improvement of existing products and processes for
improved quality, yields and lower production costs.
5. Development of safe and environmental conservation
methods, effective and better solvent recycling.
Benefits:
During the year under review, the Company filed four
national/international patents for the Cephalosporins and
established CRAMS business.
1. Accelerated new process development.
2. Process improvement of products like Cephachlor,
Cefuroxime, Cefidinir and Cefixime, Desloratadine
(advanced version of Loratadine), a non-sedative anti-
histamine to achieve better results.
3. Development of efficient third generation Penicillin-based
Cephalosporin.
4. Development of new products as anti-hypoglycemic agents
Glimpride.
5. Improved waste recovery, translating into attractive cost
savings.
6. Product movement (API/Intermediates) in regulated markets
worldwide.
7. To open new business opportunities with market leaders.
III EXPENDITURE ON R&DThe R&D outlay is as follows:-
(` In lacs)
Year ended Year ended
31.03.2011 31.03.2010
a) Capital 1,580.15 897.47
b) Recurring - -
c) Total 1,580.15 897.47
d) Total R&D expenditure as a
percentage of total turnover
and operating income 0.97 0.78
IV TOTAL FOREIGN EXCHANGE EARNINGS &OUTGO (` In lacs)
Year ended Year ended
31.03.2011 31.03.2010
1 Earnings in foreign exchange
during the year (F.O.B. value
of Exports) 42,278.06 34,121.95
2 C.I.F. Value of Imports
(on cash basis)
Raw materials 32,958.63 20,998.06
Capital goods
Spare parts, components and
consumables 2,846.45 1,384.46
3 Expenditure in foreign currency
during the year (on cash basis)
Traveling expenses 55.47 32.04
Interest and bank charges NIL NIL
Technical know-how fees NIL NIL
Consultancy fees NIL NIL
Others 250.95 310.56
4 Total Foreign Exchange
used (2+3) 36,111.58 22,725.12
CORPORATEGOVERNANCE REPORT
The detailed report on Corporate Governance as per Clause 49
of the Listing Agreement is set out below:
1) COMPANY’S PHILOSOPHY ONCORPORATE GOVERNANCEAt Surya Pharmaceutical, we firmly believe in the importance of
pursuing the highest standards in best practices towards good
Corporate Governance. Our policies and procedures exemplify
our core values in utmost transparency, professionalism and
accountability across all functions of our organisation. The
Company has, and will, continually endeavour to improve
corporate practices, methodologies, and procedures to ensure
that long-term value is realised for all stakeholders of our
organisation. We aim to consistently offer our shareholders,
customers, employees, vendors and the larger community
mutually beneficial value through transparency in our
associations, quality in our products and services, and integrity
in our relationships.
Our Corporate Governance philosophy is driven by the following
principles:
• To fulfill and comply by the spirit of law and further pursue
initiatives that determine paramount value to all associated
with our organisation.
• To ensure transparency and openness about all facets of our
operations, at all times.
• To be driven by integrity and core values and co-operate at
all times in providing a clear and true image of our
organisation.
• To understand and comply with the written and unwritten
laws of all companies in which we operate.
• To ensure that our corporate structure fosters clear
communication channels and lines of command at all times.
• To continually enhance shareholder value at all times.
• To endeavour to do the best we can to ensure and improve
the preservation of communities and the environment.
The Company implemented all mandatory requirements. The
Company has a sound control and risk management.
BOARD OF DIRECTORSi) Composition
The Board of Directors of the Company comprise of eight Directors.
A brief resume and profile of the Directors eligible for reappointment at the ensuing Annual General Meeting of the Company is given
in Annexure-A to the Notice annexed to this Annual Report.
ii) Meetings and attendance record of Directors and other Directorships
During the financial year ended on March 31, 2011, the Board of Directors met fifteen times on April 22, 2010, May 11, 2010,
May 27, 2010, June 10, 2010, July 30, 2010, August 14, 2010, August 27, 2010, October 07, 2010, October 12, 2010,
Name of the Director Office/Designation Executive/Non Executive Independent/Non- Independent
Sh. Rajiv Goyal Chairman-cum- Managing Director Executive Non-Independent
Smt. Alka Goyal Executive Director Executive Non-Independent
Sh. Anil Arya Director Non-Executive Independent
Sh. Abhishek Arya Director Non-Executive Independent
Dr. H. B. L. Vohra Director Non-Executive Independent
Sh. Ashwani K. Agarwal Nominee Director Non-Executive Independent
Dr. R. K. Gupta Additional Director Non-Executive Independent
Mr. Devinder Pal Director Non-Executive Independent

5958
November 03, 2010 , December 06, 2010, December 24, 2010, February 03, 2011, March 28, 2011 and March 31, 2011. The
composition of the Board of Directors, their attendance at the Board Meetings during the year and at the last Annual General Meeting
together with the number of directorship in other companies are given below:
iii) Detail of Directorship in other Companies
The detail of directorships of the Company's Directors in other companies as on March 31, 2011 are given below:
Name of the Director Name of the company/firm Nature of interest
Sh. Rajiv Goyal Surya Envirotech limited Director
Surya Healthcare Limited Director
Futuristics Garments Pvt. Ltd Director
Kala Infra Pvt. Ltd Director
Emm Bee Fincap Pvt. Ltd Director
Surya Hi Tech Communications Limited Director
Surya Hi Tech Infrastructure Limited Director
Ess Ess Exim Pvt. Ltd Director
Mediwell Healthcare Pvt. Ltd Director
Malik & Malik Pharma Pvt. Ltd Director
Surya Softedge Limited Director
Surya Eduquest Limited Director
Raja Forgings & Gears Ltd Director
Medi Mart India Pvt. Ltd Director
Kala Realtech Ltd Director
Kala Buildwell Ventures Ltd Director
Surya Tradewings Pvt Ltd Director
Surya Healthway Ltd Director
Shree Krishna Agents Pvt Ltd Director
* This excludes directorship in Indian Private Limited companies/private companies with unlimited liability and firms.
** Mr. Ashwani K. Agarwal was appointed in place of Sh. K. K Upadhyay w.e.f. December 24, 2010 as nominee Director of IDBI
*** Sh. S. P Sharma resigned from the directorship w.e.f. October 19, 2010.
****Dr. R. K.Gupta was appointed as Additional Director w.e.f. August 13, 2011 and Dr. M. L. Sharma resigned from directorship w.e.f July 23, 2011.
Name of the Director No. of Board meetings attended Attendance at the last AGM No. of other directorships *
Sh. Rajiv Goyal 15 YES 9
Smt. Alka Goyal 15 YES 9
Sh. Anil Arya 5 - 1
Sh. Abhishek Arya 5 - 1
Sh. Ashwani K. Agarwal** 3 -
Sh. K. K Upadhyay** 7 - 1
Dr. H. B. L. Vohra 13 - -
Dr. M. L. Sharma**** 10 - -
Mr. Devinder Pal 1 - -
Sh. S. P Sharma*** 5 -
Dr. R. K. Gupta**** - - 1
Name of the Director Name of the Indian Public Limited Company Nature of the Committee Member/Chairman
Sh. Rajiv Goyal Surya Pharmaceutical Ltd Audit Committee Member
Investor Grievances Committee Member
Smt. Alka Goyal Surya Pharmaceutical Ltd Investor Grievances Committee Member
Sh. Anil Arya Surya Pharmaceutical Ltd Audit Committee Chairman
Investor Grievances Committee Chairman
Remuneration Committee Chairman
Sh. Abhishek Arya Surya Pharmaceutical Ltd Audit Committee Member
Remuneration Committee Member
Sh. K. K. Upadhyay NIL NIL NA
Dr. H. B. L. Vohra NIL NIL NA
Sh. S. P. Sharma NIL NIL NA
Dr. R. K. Gupta NIL NIL NA
Mr. Devinder Pal NIL NIL NA
Sh. Ashwani K. Agarwal NIL NIL NA
Name of the Director Name of the company/firm Nature of interest
Smt. Alka Goyal Surya Envirotech limited DirectorSurya Healthcare Limited DirectorFuturistics Garments Pvt. Ltd DirectorKala Infra Pvt. Ltd DirectorEmm Bee Fincap Pvt. Ltd DirectorSurya Hi Tech Communications Limited DirectorSurya Hi Tech Infrastructure Limited DirectorEss Ess Exim Pvt. Ltd DirectorMediwell Healthcare Pvt. Ltd DirectorMalik & Malik Pharma Pvt. Ltd DirectorSurya Softedge Limited DirectorSurya Eduquest Limited DirectorRaja Forgings & Gears Ltd DirectorMedi Mart India Pvt. Ltd DirectorKala Realtech Ltd DirectorKala Buildwell Ventures Ltd DirectorSurya Tradewings Pvt. Ltd DirectorSurya Healthway Ltd DirectorShree Krishna Agents Pvt. Ltd Director
Sh. Anil Arya Acumen Education Limited DirectorAstaberry Biosciences India Pvt. Ltd Director
Sh. Abhishek Arya Acumen Education Limited DirectorAstaberry Biosciences India Pvt. Ltd Director
Sh. Ashwani K. Agarwal - -Dr. H. B. L. Vohra - -Dr. R. K. Gupta Ludhiana Stock Exchange Limited DirectorSh. Devinder Pal - -
iv) Detail of membership/chairmanship of Directors in Board Committee
C O R P O R A T EG O V E R N A N C E R E P O R T

6160
v) Certificate on Code of ConductAs provided under Clause 49 of the Listing Agreement with thestock exchanges, the Board members and the seniormanagement personnel have confirmed compliance with theCode of Conduct and Ethics for the year ended March 31, 2011.
For Surya Pharmaceutical Limited
Sd/-Rajiv Goyal
Delhi, 13.08.2011 Chairman & Managing Director
CEO/CFO CERTIFICATIONAs required by sub clause V of Clause 49 of the listingAgreement with the Stock Exchange, we have certified to theBoard that for the financial year ended March 31, 2011 theCompany has complied with the requirements of the said sub-clause.
For Surya Pharmaceutical Limited
Sd/- Sd/-B.B. Jain Rajiv GoyalGM, Finance Chairman & Managing Director
3. AUDIT COMMITTEEThe following are the current members of the Audit Committee:
1. Mr. Anil Arya: Chairman (Independent and Non-Executive)
2. Mr. Abhishek Arya: Member (Independent and Non-Executive)
3. Mr. Rajiv Goyal: Member (Executive)
The terms of reference to the Audit Committee as contained inClause 49 of the Listing Agreement as well as under Section292A of Companies Act, 1956 are as under:-
1. Oversight of the Company’s financial reporting process andthe disclosure of its financial information to ensure that thefinancial statement is correct, sufficient and credible.
2. Recommending the appointment and removal of externalauditor, fixation of audit fee and also approval for paymentfor any other services.
3. Reviewing with management the annual financial
statements before submission to the Board, focusing
primarily on;
i. Any changes in accounting policies and practices.
ii. Major accounting entries based on exercise of judgment
by management.
iii. Qualifications in draft audit report.
iv. Significant adjustments arising out of audit.
v. The going concern assumption.
vi. Compliance with accounting standards.
vii. Compliance with stock exchanges and legalrequirements concerning financial statements.
viii.Any related party transactions i.e. transactions of theCompany of material nature, with promoters or themanagement, their subsidiaries or relatives, amongothers, that may have potential conflict with the interestsof Company at large.
4. Reviewing with the management, external and internalauditors, the adequacy of internal control systems.
5. Reviewing the adequacy of internal audit function, includingthe structure of the internal audit department, staffing andseniority of the official heading the department, reportingstructure coverage and frequency of internal audit.
6. Discussion with auditors, any significant findings and followup there on.
7. Reviewing the findings of any internal investigations by theauditors into matters where there is suspected fraud orirregularity or a failure of internal control systems of amaterial nature and reporting the matter to the Board.
8. Discussion with external auditors before the auditcommences, about the nature and scope of audit as well aspost-audit discussion to ascertain any area of concern.
9. Reviewing the Company’s financial and risk managementpolicies.
10.To look into the reasons for substantial defaults in thepayment to the depositors, debenture holders, shareholders(in case of non-payment of declared dividends) andcreditors.
11.Investigate into any matter in relation to the items specifiedin Section 292A of the Companies Act, 1956.
Meetings and attendance during the financial year endedMarch 31, 2011
Name No. of No. of meetingsmeetings held attended
Mr. Anil Arya 4 4Mr. Abhishek Arya 4 4Mr. Rajiv Goyal 4 4
During the year 2010-11, the Audit Committee met four timeson May 11, 2010, August 14, 2010, November 03, 2010 andFebruary 03, 2011. Meetings were also attended by theStatutory Auditors and certain senior Financial Executives of theCompany. The Company Secretary acted as Secretary of theAudit Committee.
The Committee reviewed the financial results of the Companyand recommended the same to the Board of Directors for theiradoption.
4. REMUNERATION COMMITTEERemuneration Committee meeting was held on November 03,2010 during the year to recommend the remuneration of Sh.Suhail Goyal, Associate Director of the Company. However,later, he did not join the Company.
5. INVESTORS GRIEVANCE COMMITTEEThe Investors Grievance Committee comprises three Directorsnamely Mr. Anil Arya - Chairman, Mrs. Alka Goyal - Memberand Mr. Rajiv Goyal - Member. This committee oversees andreviews all matters connected with redressal of investor
grievances and complaints. The transfer of shares is undertakenby M/s. Bigshares Services Private Limited, Mumbai and theyare fully equipped to deal with transfers and all relatedcomplaints of investors.
Meeting and attendance during the financial year ended March31, 2011:
Name No. of No. of meetingsmeetings held attended
Sh. Anil Arya 4 4Smt. Alka Goyal 4 4Sh. Rajiv Goyal 4 4
The Board has also constituted a Share Transfer Committee toattend share transfer formalities, as and when required. Notransfers during the year under review.
Compliance Officer Sh. Rajansh Thukral, Chief Company Secretary of the Companyhas been designated as Compliance Officer under the SEBI(Issue of Capital and Disclosure Requirements) Regulations,2009 for overseeing/addressing the investor complaints.
Nature of complaint Opening balance No. of complaints No. of complaints No. of complaintsreceived resolved pending
Non-receipt of exchange share certificates 0 1 1 0
Non-receipt of annual report 0 1 1 0
Non-receipt of dividend warrant 0 2 2 0
Stock exchange 0 3 3 0
Total 0 7 7 0
Detail of shareholder complaints for the period 2010-11
All complaints were resolved to the satisfaction of the shareholders and no complaints remained unattended/pending.
Financial Year Location of the Meeting Type of Meeting Date Time
2009-10 Registered Office: 85, HPSIDC, Industrial Area, Baddi, Distt. Solan, H.P. AGM 30/09/09 11.00 A.M.
2009-10 Registered Office: 85, HPSIDC, Industrial Area, Baddi, Distt. Solan, H.P. EOGM 30/06/10 11.00 A.M.
2010-11 Registered Office: 85, HPSIDC, Industrial Area, Baddi, Distt. Solan, H.P. EOGM 06/12/10 11.00 A.M
6. GENERAL BODY MEETINGSThe last three General Body Meetings of the members of the Company were held as per the following details:-
No resolution was passed through postal ballot during the year under review.
C O R P O R A T EG O V E R N A N C E R E P O R T

6362
7. DISCLOSURESDisclosures on materially significant related party transactions i.e. transactions of the Company of material nature, with its promoters,
the Directors or the management, their subsidiaries or relatives, among others, that may have potential conflict with the interests of
Company at large. Further details of related party transactions are presented in Note G in Schedule XXI to the Accounts.
The Company has entered into an agreement with M/s Nova Machino Fabrik, in which Mr. Rajiv Goyal, Managing Director and Mrs.
Alka Goyal, Executive Director are interested. The same has also been approved by the Ministry of Corporate Affairs vide their letter
No.4/276/T-1/2011/D/2874 dated July 21, 2011.
Details of non-compliance by the Company, penalties, and strictures imposed on the Company by stock exchange or SEBI or any
statutory authority, on any matter related to capital markets, during the last three years. There are no disclosures required to be made
under this point.
8. MEANS OF COMMUNICATIONS i) Half-yearly report sent to each
household of shareholders Nil
ii) Quarterly results The quarterly results are taken on record by the Board of Directors of the Company for
each quarter and notified to stock exchanges in compliance with Clause 41 of the Listing
Agreement.
iii) Publications in newspapers English: Business Standard and Economic Times
Vernacular: Divya Himachal, Business Standard and Economic Times
iv) Website where displayed? BSE/NSE website
v) Whether it also displays
official news releases? NO
vi) Whether presentation made to
institutional investors or to analysts? NO
vii) Whether Management Discussion and
Analysis is part of annual report? YES
9. GENERAL SHAREHOLDER INFORMATIONi) Annual General Meeting:
Date & Time: September 30, 2011 at 10.00 A.M.
Venue: Jolly Good Banquet, Aditya Mega Mall, C.B.D. Sahadara, New Delhi - 110032
ii) Financial Calendar (2011-12) (Tentative):
AGM
Quarterly results: September 30, 2011
Quarter ended June 30, 2011 On or before August 14, 2011
Quarter ended September 30, 2011 On or before November 14, 2011
Quarter ended December 31, 2011 On or before February 14, 2012
Quarter ended March 31, 2012 On or before May 14, 2012
iii) Date of Book Closure September 29, 2011 - September 30, 2011
iv) Dividend payment date On or before October 29 2011
v) Listing of equity shares National Stock Exchange of India Limited (NSE) and Bombay Stock Exchange Ltd. (BSE)
on stock exchanges and Luxembourg Stock Exchange
The Annual Listing Fees in respect of above stock exchanges for the financial year
2011-12 has already been paid.
vi) Stock Code 532516
Script Code SURYAPHARMA
ISIN Number INE249G01012
(For Demat Trading)
Depository Connectivity NSDL & CDSL
vii) Market Price Data As per Table-I below
viii)Performance in comparison to As per Figure-I to II below
broad-based BSE Sensex
ix) Registrar and Transfer Agents M/s. Bigshare Services Pvt. Ltd.
E-2/3, Ansa Industrial Estate, Sakivihar Road, Saki Naka,
Andheri (E), Mumbai-400 072
Tel: 022-28470652/53, 40430200
x) Share Transfer System Trading in the equity shares of the Company is permitted only in dematerialised form.
However, there are certain shares still in physical form with the pre-issue shareholders.
All the share transfers in respect of physical shares are handled by the Registrar &
Share Transfer Agents. Whenever transfers are lodged, the certificates of registration of
transfers are returned within 1- 2 weeks and in case of rejections, average time is
seven days.
xi) Distribution of shareholding As per Table-2 & 3 given below
xii) Dematerialisation of shares Shares held in Demat Form as on March 31, 2011:-
and liquidity With NSDL: 30,320,962 (67.61%)
With CDSL: 50,759,238 (26.33%)
Physical: 1,16,72,180 (6.06%)
Company’s equity shares are tradable in Demat form and there is good liquidity of the
shares as the shares are actively traded both on NSE & BSE.
xiii)Outstanding GDRs/ADRs/ Warrants 27,50,000 Zero Coupon Convertible Warrants, Conversion date i.e. October 28, 2011.
or any Convertible instruments,
conversion date and likely impact
on equity
xiv)Plant locations 1. Village Banur, Tehsil Mohali, Distt. Mohali (Punjab)
2. Plot No. 383, Industrial Area, Phase I, Panchkula (Haryana)
3. Plot No. 85, HPSIDC, Industrial Area, Baddi, Distt. Solan, (H.P.)
4. Plot No. 87, HPSIDC, Industrial Area, Baddi, Distt. Solan, (H.P.)
5. Plot No. 50 -51, EPIP, Phase I, Jharmajiri, Baddi
6. Industrial Growth Center-II, Samba, District Jammu (J&K)
xv) Company Secretary & Compliance Mr. Rajansh Thukral
Officer Surya Pharmaceutical Limited
SCO 164-165, Sector 9-C,
Madhya Marg, Chandigarh -160 009
xvi)Address for Correspondence Corporate Office:
Surya Pharmaceutical Limited
SCO 164-165, Sector 9-C,
Madhya Marg, Chandigarh -160 009
C O R P O R A T EG O V E R N A N C E R E P O R T
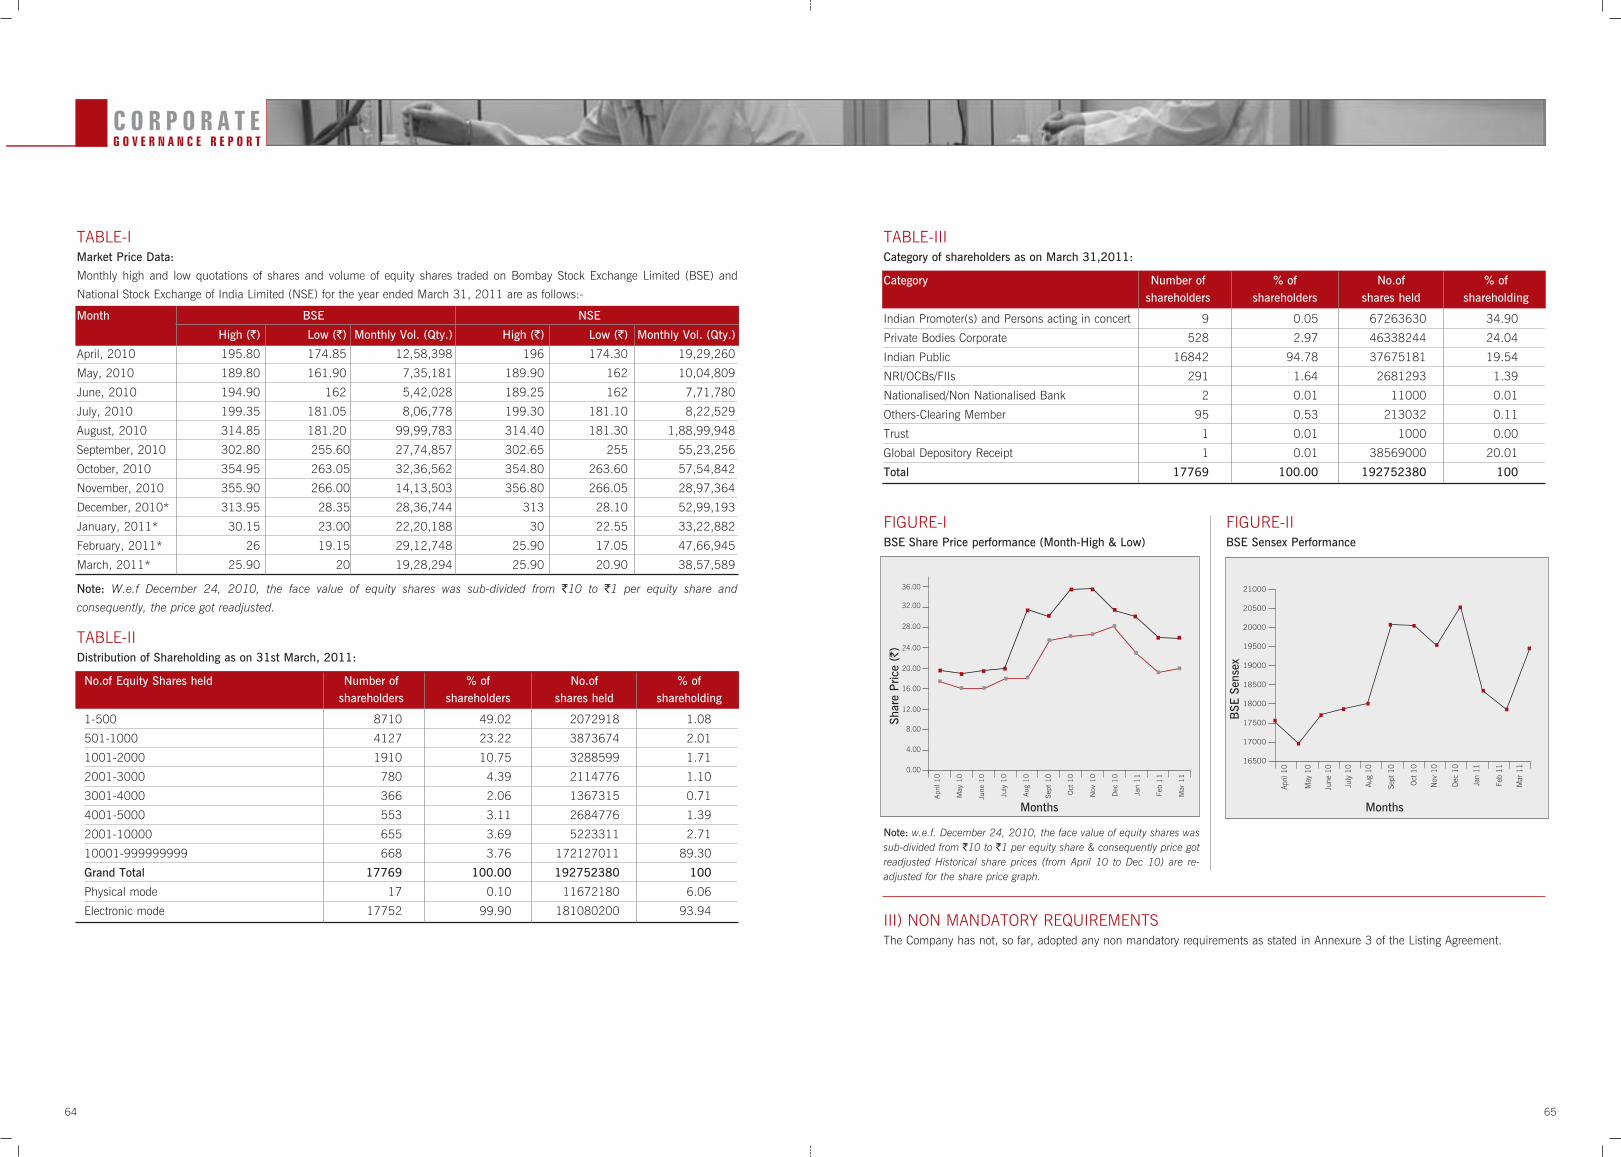
6564
Month BSE NSE
High (`) Low (`) Monthly Vol. (Qty.) High (`) Low (`) Monthly Vol. (Qty.)
April, 2010 195.80 174.85 12,58,398 196 174.30 19,29,260
May, 2010 189.80 161.90 7,35,181 189.90 162 10,04,809
June, 2010 194.90 162 5,42,028 189.25 162 7,71,780
July, 2010 199.35 181.05 8,06,778 199.30 181.10 8,22,529
August, 2010 314.85 181.20 99,99,783 314.40 181.30 1,88,99,948
September, 2010 302.80 255.60 27,74,857 302.65 255 55,23,256
October, 2010 354.95 263.05 32,36,562 354.80 263.60 57,54,842
November, 2010 355.90 266.00 14,13,503 356.80 266.05 28,97,364
December, 2010* 313.95 28.35 28,36,744 313 28.10 52,99,193
January, 2011* 30.15 23.00 22,20,188 30 22.55 33,22,882
February, 2011* 26 19.15 29,12,748 25.90 17.05 47,66,945
March, 2011* 25.90 20 19,28,294 25.90 20.90 38,57,589
TABLE-IMarket Price Data:
Monthly high and low quotations of shares and volume of equity shares traded on Bombay Stock Exchange Limited (BSE) and
National Stock Exchange of India Limited (NSE) for the year ended March 31, 2011 are as follows:-
Note: W.e.f December 24, 2010, the face value of equity shares was sub-divided from `10 to `1 per equity share and
consequently, the price got readjusted.
TABLE-IIDistribution of Shareholding as on 31st March, 2011:
No.of Equity Shares held Number of % of No.of % ofshareholders shareholders shares held shareholding
1-500 8710 49.02 2072918 1.08
501-1000 4127 23.22 3873674 2.01
1001-2000 1910 10.75 3288599 1.71
2001-3000 780 4.39 2114776 1.10
3001-4000 366 2.06 1367315 0.71
4001-5000 553 3.11 2684776 1.39
2001-10000 655 3.69 5223311 2.71
10001-999999999 668 3.76 172127011 89.30
Grand Total 17769 100.00 192752380 100
Physical mode 17 0.10 11672180 6.06
Electronic mode 17752 99.90 181080200 93.94
TABLE-IIICategory of shareholders as on March 31,2011:
III) NON MANDATORY REQUIREMENTSThe Company has not, so far, adopted any non mandatory requirements as stated in Annexure 3 of the Listing Agreement.
FIGURE-IBSE Share Price performance (Month-High & Low)
Note: w.e.f. December 24, 2010, the face value of equity shares wassub-divided from `10 to `1 per equity share & consequently price gotreadjusted Historical share prices (from April 10 to Dec 10) are re-adjusted for the share price graph.
FIGURE-IIBSE Sensex Performance
Category Number of % of No.of % ofshareholders shareholders shares held shareholding
Indian Promoter(s) and Persons acting in concert 9 0.05 67263630 34.90
Private Bodies Corporate 528 2.97 46338244 24.04
Indian Public 16842 94.78 37675181 19.54
NRI/OCBs/FIIs 291 1.64 2681293 1.39
Nationalised/Non Nationalised Bank 2 0.01 11000 0.01
Others-Clearing Member 95 0.53 213032 0.11
Trust 1 0.01 1000 0.00
Global Depository Receipt 1 0.01 38569000 20.01
Total 17769 100.00 192752380 100
Months Months
Shar
e P
rice
(`)
BSE
Sen
sex
C O R P O R A T EG O V E R N A N C E R E P O R T

66
Members of
Surya Pharmaceutical Limited,
911, 9th Floor, Surya Kiran Building, 19 K.G.Marg,
Connaught Place, New Delhi
Sub: Certificate on Corporate Governance
We have examined the compliance of conditions of Corporate Governance by M/s. Surya Pharmaceutical Limited, for the year ended
March 31, 2011 as stipulated in Clause 49 of the Listing Agreement of the said Company with stock exchanges.
The compliance of conditions of Corporate Governance is the responsibility of the management. Our examination has been limited
to a review of procedures and implementation thereof, adopted by the Company for ensuring the compliance of the conditions of
Corporate Governance. It is neither an audit nor an expression of opinion on the financial statements of the Company.
In our opinion and to the best of our information and according to the explanations given to us, we certify that the Company has
complied with, in all material respects, the conditions of Corporate Governance as stipulated in Clause 49 of the above mentioned
Listing Agreement.
We state that in respect of investor grievances received during the year ended March 31, 2011, no investor grievances are
unattended/pending for a period exceeding one month against the Company as certified by the Registrars of the Company and details
presented to the Investor Grievance Committee of the Company.
We further state that such compliance is neither an assurance as to the future viability of the Company nor of the efficiency or
effectiveness with which the management has conducted the affairs of the Company.
For AAD & Associates
Chartered Accountants
sd/-
Date: August 13, 2011 Shamsher Singh
Place: Chandigarh (Partner)
M.NO. 083898
FRN-020624N
CERTIFICATEON CORPORATE GOVERNANCE
C O R P O R A T EG O V E R N A N C E R E P O R T

67
ANNUAL REPORT 2010-11
Auditor’s Report
To the members ofSurya Pharmaceutical Limited
We have audited the attached Balance sheet of SURYA
PHARMACEUTICAL LIMITED as at 31st March, 2011 and also
the Profit and Loss Account and the cash flow statement for the
year ended on that date annexed thereto. These financial
statements are the responsibility of the Company’s
management. Our responsibility is to express an opinion on
these financial statements based on our audit.
1. We conducted our audit in accordance with auditing
standards generally accepted in India. The standards
require that we plan and perform the audit to obtain
reasonable assurance about whether the financial
statements are free of material mis-statement. An audit also
includes examining on a test basis, evidence supporting the
amounts and disclosures in the financial statements. An
audit also includes assessing the accounting principles
used and significant estimates made by management, as
well as evaluating the overall financial statement
presentation. We believe that our audit provides a
reasonable basis for our opinion
2. As required by the Companies (Auditors' Report) Order,
2003 issued by the Company Law Board in terms of
Section 227 (4A) of the Companies Act, 1956 we enclose
in the Annexure A statement on the matters specified in
paragraph 4 & 5 of said order:
3. Further to our comments in the annexure referred to in
paragraph (1) above, we report that:-
a) We have obtained all the information and explanations
which to the best of our knowledge and belief were
necessary for the purpose of our audit;
b) In our opinion, proper books of account as required by
Law have been kept by the Company so far as appears
from our examination of the books;
c) The Balance sheet and Profit and Loss Account dealt
with by this report are in agreement with the books of
accounts;
d) In our opinion, the balance sheet and the profit and
loss account comply with the accounting standards
referred to in sub section (3C) of section 211 of the
companies Act, 1956, subject to Notes on Accounts
forming part of Balance Sheet.
e) As per information and explanations given to us, none
of the directors of the company is disqualified from
being appointed as a director in terms of clause (g) of
subsection (1) of section 274 of the Companies Act,
1956.
f) In our opinion and to the best of our information and
according to the explanations given to us, the said
accounts give the information required by the
Companies Act, 1956, in the manner so required and
give a true and fair view.
i) In the case of the Balance Sheet of the State of
affairs of the company as at 31st March, 2011
and
ii) In the case of the Profit and Loss account, of Profit
of the company for the year ending on that date.
iii) In case of cash flow statement, of the cash flows
for the year ending on that date.
For AAD & Associates
Chartered Accountants
Sd/-
Place: Chandigarh Shamsher Singh
Date: 13th August, 2011 (Partner)
M.NO. 083898
FRN-020624N

69
ANNUAL REPORT 2010-11
which have not been deposited as at March 31.03.2011 on account of disputes are given below:
10.The Company does not have accumulated Losses.TheCompany has not incurred cash losses during the financialyear covered by our audit and in the immediately precedingfinancial year.
11.In our opinion and according to the information andexplanations given to us, the Company did not have anyamount outstanding to a financial institution or bank.Therefore the provision of clause (xi) of paragraph 4 of CAROis not applicable.
12.In our opinion and according to the information andexplanations given to us, the Company has not grantedloans & advances on the basis of security by way of pledgeof shares, debentures & other securities.
13.In our opinion and according to the information andexplanations given to us the provisions of chit fund notapplicable to the company
14.In our opinion and according to the information andexplanations given to us, the Company is not dealing inshares securities and debentures.Therefore.the provision ofclause 4(xiv) of CARO are not applicable to the Company.
15.In our opinion and according to the information andexplanations given to us, having regard to the fact that thesubsidiary is wholly owned the term and conditions of theguarantee given by the Company for loan taken by thesubsidiary from a bank are not prima facie prejudicial to theinterest of the Company
16.In our opinion and according to the information andexplanations given to us, the term loan have been applied forthe purpose for which they were raised.
17.In our opinion and according to the information andexplanations given to us and on an overall examination ofthe Balance Sheet of the Company, we report that fundsraised on short term basis have not been used during the
year for long term investment.
18.According to the information and explanations given to usduring the period covered by our audit, the Company hasmade preferential allotment of 47,00,000 convertible sharewarrants out of which 9,50,000 warrants has beenconverted into 95,00,000 equity shares to the parties andcompanies covered in the register maintained under Section301 of the Companies Act, 1956.
19.According to the information and explanations given to us,during the year covered by our report, the Company has notissued any secured debentures.
20.The Company has raised `111.85 crores from issue of GDR’s& the company has issued and allotted 47,00,000convertible Share Warrants during the year. The managementhas disclosed the end use of monies received through GDR’s& Convertible Share Warrants during the year in notes toaccounts (Refer Note-E) which has been verified by us.
21.During the course of our examination of the books andrecords of the Company carried out in accordance with thegenerally accepted auditing practices in India, and accordingto the information and explanation given to us, we haveneither come across any instance of fraud on or by theCompany noticed or reported during the year.
For AAD & Associates
Chartered Accountants
Sd/-
Place: Chandigarh Shamsher Singh
Date: 13th August, 2011 (Partner)
M.NO. 083898
FRN-020624N
Name of Statute Nature of Dues Amount ` in Lacs (*) Period to which the amount relates Forum where dispute is pending
The Income 89.72 AY 2006-07 ITAT
Tax Act, 1961 89.72
The Central Excise Demand 2.16 1998 CESTAT
Act, 1944 17.97 1999
3.69 2002
0.86 2003
94.12 2005
6.34 2008
371.53 2009
237.85 2010
Total 734.52
Service Tax Demand 2.89 2007 Department
13.25 2008
19.84 2009
137.96 2010
Total 173.94
Custom Act Demand 313.27 2008 Department
Total 1,311.45
• Net of pre-deposit amount
68
Annexure to the Auditors’ Report
SURYA PHARMACEUTICAL LIMITED
Annexure ‘A’ referred to in paragraph 1 of our Report of the Auditors to the members of SURYA PHARMACEUTICAL LIMITED on
the accounts for the year ending 31st March, 2011
1 a) The company has maintained proper records showing
full particulars including quantitative details and
situation of fixed assets.
b) The company has a regular program of physical
verification of its fixed assets by which all fixes assets are
verified every year. In our opinion, the periodicity of
physical verification is reasonable to the size of the
company and nature of its assets. No material
discrepancies were noted on such verification.
c) The fixed assets disposed off during the year were not
substantial, and therefore, do not affect the going
concern assumption.
2 a) Physical verification of stock of finished goods, stores,
spares and raw materials was conducted by the
management during the year and in our opinion, the
frequency of such verification was reasonable.
b) Procedures for physical verification of inventories
followed by the management are reasonable and
adequate in relation to the size of the company and the
nature of its business.
c) The company is maintaining proper records of inventory.
The discrepancies noticed on verification between the
physical stocks and book records were not material.
3 a) The company has granted unsecured loans to
Companies/ Firms and other Parties Listed in the register
maintained under Section 301 of the Companies Act,
1956 and the amount outstanding as on 31.03.2011
was `510.35 Lacs (`114.35 Lacs).
b) & (c)" These points are not applicable to the company.
4 In our opinion and according to the information and
explanations given to us, there are adequate internal control
procedures commensurate with the size of the company and
the nature of its business with regard to the purchase of
stores, raw materials including the Plant & Machinery,
Vehicles, Equipment and other assets and for the sale of
these goods. In our opinion and according to the information
and explanations given to us, there is no continuing failure
to correct the major weaknesses in internal control system.
We have not observed any major weakness in the internal
control system during the course of our audit.
5. According to the information and explanations given to us,
there are no contracts and arrangements the particulars of
which need to be entered into the register maintained under
section 301 of the Companies Act, 1956.
6. In our opinion, and according to the information and
explanations given to us, the company has complied with
the provisions of Section 58A of the Act and the Companies
(Acceptance of Deposits) Rules, 1975 with regard to the
deposits accepted from the public.
7 The company has an internal audit system, which in our
opinion is, commensurate with the size of the company and
nature of its business.
8 We have broadly reviewed the books of account maintained
by the company pursuant to the rules prescribed by the
Central Government for maintenance of cost records under
section 209(1)(d) of the companies Act, 1956 and are of
the opinion that prima facie, the prescribed accounts and
records have been made and maintained. However, we have
not made a detailed examination of the records.
9 a) The company has generally been regular in depositing
undisputed dues, including Provident Fund, Investor
Education and Protection Fund, Employees' State
Insurance, Income Tax, Sale Tax, Wealth Tax Service
Tax, Custom Duty, Excise Duty, cess and other material
statutory dues applicable to it with the appropriate
authorities.
b) No undisputed amounts payable in respect of Provident
Fund, Investor Education and Protection Fund,
Employees’ State Insurance, Income Tax, Sale Tax,
Custom Duty, Excise Duty, cess were in arrears as at
March 31.03.2011 for a Period of more than six months
from the date they became payable.
c) Detail of dues of Sales Tax, Service Tax and Income Tax

71
ANNUAL REPORT 2010-11
Profit and Loss Account for the year ending 31st March 2011
70
Balance Sheet as on 31st March 2011
SURYA PHARMACEUTICAL LIMITED SURYA PHARMACEUTICAL LIMITED
(Amount in `)
Schedules Current year Previous year
SOURCES OF FUNDS
1. Shareholders Funds
Share Capital I 19,27,52,380 14,46,83,380
Share Warrants Pending exercise 6,56,25,000 -
Reserves & Surplus II 4,94,10,96,739 5,19,94,74,119 2,88,72,02,477 3,03,18,85,857
2. Loan Funds
Secured Loans III 9,63,08,24,897 6,80,50,91,427
Unsecured Loans IV 1,55,59,45,284 11,18,67,70,181 27,60,03,562 7,08,10,94,989
3. Deferred Tax Liabilities (Net) V 19,36,04,497 13,21,71,744
16,57,98,48,797 10,24,51,52,590
APPLICATION OF FUNDS
1. Fixed Assets
Gross Block VI 7,46,53,74,432 5,12,95,19,286
Less : Accumulated Depreciation 1,11,51,89,086 84,97,19,542
Net Block 6,35,01,85,346 4,27,97,99,744
2. Investments VII 25,81,42,414 5,49,52,894
3. Current Assets, Loans & Advances
Inventories VIII 10,40,63,25,036 6,57,25,84,157
Sundry Debtors IX 2,90,84,87,488 1,53,08,02,023
Cash & Bank Balances X 15,48,02,238 17,90,76,275
Loans & Advances XI 1,56,60,46,041 1,22,65,23,270
15,03,56,60,803 9,50,89,85,725
Less: Current Liabilities & Provisions
Liabilities & Provisions XII 5,07,84,30,996 3,61,92,05,093
Net Current Assets 9,95,72,29,807 5,88,97,80,632
Miscellaneous Expenditure
(To the extent not written off or adjusted) XIII 1,42,91,230 2,06,19,320
16,57,98,48,797 10,24,51,52,590
Notes on Accounts XXI
AUDITORS' REPORT
For and on behalf of the Board As per our report of even date annexed
For AAD & Associates
Chartered Accountants
Sd/- Sd/- Sd/- Sd/-
Rajiv Goyal Alka Goyal Rajansh Thukral Shamsher Singh
Managing Director Executive Director Associate Director & Partner
Chief Co. Secretary
Place: Chandigarh
Date: 13.08.2011
(Amount in `)
Schedules Current year Previous year
INCOME
Sales & Job Charges 16,33,26,73,536 11,57,53,14,393
Other Income XIV 8,90,41,577 10,49,81,562
Increase/ decrease in value of Finished Goods 50,58,45,353 (87,87,284)
16,92,75,60,466 11,67,15,08,671
EXPENDITURE
Raw Material Consumed XV 12,75,61,49,830 8,85,05,70,520
Manufacturing Expenses XVI 42,65,13,849 28,08,38,485
Excise Duty Consumed 32,84,98,587 23,39,63,258
Personnel Expenses XVII 40,20,36,350 28,83,32,270
Administrative Expenses XVIII 14,94,96,921 9,59,73,071
Financial Expenses XIX 1,07,75,33,738 62,36,17,554
Selling Expenses XX 19,83,72,619 15,76,04,921
Depreciation VI 26,54,69,543 20,55,48,346
Loss Due to Fire – 2,44,73,135
Preliminary & Deferred Revenue Expenses Written Off 63,28,090 59,53,013
15,61,03,99,527 10,76,68,74,573
Profit / (Loss) before Tax 1,31,71,60,939 90,46,34,098
Tax Provisions
Provision for Tax 26,25,10,175 15,36,97,333
Provision for Deferred Tax 6,14,32,752 (96,68,896)
MAT Asset Appropriation (83,60,640) –
Profit after tax 1,00,15,78,651 76,06,05,661
Proposed Dividend 2,89,12,857 2,17,02,507
Dividend Distribution Tax 36,04,515 29,50,673
Income tax relating to previous years 1,24,59,989 51,62,258
Balance transferred to General Reserve 95,66,01,290 73,07,90,223
Basic Earning Per Equity Share of `1 each 5.20 5.26
Diluted Earning Per Equity Share of `1 each 5.10 5.26
AUDITORS' REPORT
For and on behalf of the Board As per our report of even date annexed
For AAD & Associates
Chartered Accountants
Sd/- Sd/- Sd/- Sd/-
Rajiv Goyal Alka Goyal Rajansh Thukral Shamsher Singh
Managing Director Executive Director Associate Director & Partner
Chief Co. Secretary
Place: Chandigarh
Date: 13.08.2011
ANNUAL REPORT 2010-11

73
ANNUAL REPORT 2010-11
Schedules to the Balance Sheet as on 31st March 2011
GROSS BLOCK DEPRECIATION NET BLOCK
Particulars Rate of As on Sale/ Closing As on During As on As on
Dep 01.04.2010 Additions Transfer Balance 01.04.2010 the Year Adjustment Total 31.03.2011 31.03.2010
Land 17,07,28,918 85,98,161 – 17,93,27,079 – – – – 17,93,27,079 17,07,28,918
Building 3.34% 34,41,28,441 59,07,82,364 – 93,49,10,805 3,88,90,375 1,58,90,889 – 5,47,81,264 88,01,29,540 30,52,38,066
Plant & Machinery 10.34% 1,55,85,37,432 1,06,70,29,393 – 2,62,55,66,825 61,68,86,365 19,48,06,046 – 81,16,92,412 1,81,38,74,413 94,16,51,068
R & D Assets 4.75% 85,01,81,263 15,80,15,784 – 1,00,81,97,047 12,37,41,679 3,91,31,130 – 16,28,72,809 84,53,24,238 72,64,39,583
Misc Assets 4.75% 6,88,84,362 2,77,72,348 – 9,66,56,710 2,64,58,579 33,65,729 – 2,98,24,308 6,68,32,402 4,24,25,783
Electricals & Fittings 4.75% 4,49,85,287 11,15,38,020 – 15,65,23,307 1,28,33,631 36,61,408 – 1,64,95,039 14,00,28,268 3,21,51,657
Computers 16.21% 1,60,02,082 1,27,17,379 – 2,87,19,461 81,66,304 24,62,874 – 1,06,29,178 1,80,90,283 78,35,777
Pollution Control Equipment 4.75% 4,16,42,504 – – 4,16,42,504 85,89,578 19,78,019 – 1,05,67,597 3,10,74,907 3,30,52,925
Furniture & Fixtures 6.33% 2,07,02,462 1,74,10,230 – 3,81,12,692 27,12,137 14,87,079 – 41,99,216 3,39,13,476 1,79,90,325
Motor Vehicle 9.50% 2,79,65,866 71,39,941 – 3,51,05,807 1,14,40,894 26,86,369 – 1,41,27,263 2,09,78,544 1,65,24,972
Capital Work In Progress 1,98,57,60,669 33,48,51,525 – 2,32,06,12,193 – – – – 2,32,06,12,193 1,98,57,60,669
Total 5,12,95,19,286 2,33,58,55,144 – 7,46,53,74,432 84,97,19,543 26,54,69,543 – 1,11,51,89,086 6,35,01,85,346 4,27,97,99,743
Previous Year Figures 3,65,54,39,088 1,51,23,12,057 3,82,31,859 5,12,95,19,286 64,76,52,929 20,55,48,346 34,81,732 84,97,10,542
72
Schedules to the Balance Sheet as on 31st March 2011
SURYA PHARMACEUTICAL LIMITED
(Amount in `) (Amount in `)
As on As on31.03.2011 31.03.2010
Authorised Capital
1,00,00,00,000 Equity Shares of `1/- each 1,00,00,00,000 50,00,00,000
Issued Subscribed & Paid Up
Capital
19,27,52,380 Equity Shares of `1/- each Fully paid up,out of which 67,50,000
shares @ `1/- each issued as bonus shares and 700 shares @ `1/- each
issued for consideration other than cash 19,27,52,380 14,46,83,380
19,27,52,380 14,46,83,380
Schedule SHARE CAPITAL
Schedule FIXED ASSETS
I
As on As on31.03.2011 31.03.2010
Quoted
a) 600 (600) Equity Shares of 21,000 21,000
Canara Bank of `10/- each Market Value `3,75,690 @ 626.15
b) GCDB Grindlay Cash Fund 1,48,859 1,42,048
Market Value of 14060.152 Units @ 10.5873 `1,48,859
c) 10,688 (10,688) Equity Shares of 8,76,416 8,76,416
Allahabad Bank of `10/- each Market Value `24,65,722 @ 230.70
d) Mutual Fund-Tax Saver PNB 10,00,000 10,00,000
Market Value `13,29,028 @ 19.86 Units 66919.85
e) Mutual Fund-SBI 5,00,00,000 –
Market Value `5,00,00,000 @ 21.79 Units 2294630.56
Unquoted
Surya Healthcare Ltd 7,52,50,000 1,80,00,000
37,50,000 Shares of 10/- each Share Premium-11,00,000 Shares @15/- & 8,50,000@ 25/-
Surya Eduquest Ltd 1,00,000 1,00,000
10,000 (10,000) Shares of 10/- each
Surya Pharmaceutical Inc 22,18,229 4,82,500
Surya Biopharma USA Inc 83,72,030 –
Surya Pharmaceutical (Singapore) Pte Ltd (Share Application Money Allotment Pending) 3,51,05,880 –
Surya Healthcare Ltd. (Share Application Money Allotment Pending) 8,50,50,000 3,43,30,930
Total 25,81,42,414 5,49,52,894
Schedule INVESTMENTSVII
VI
General Reserve
Opening Balance 2,45,51,31,457 1,72,43,41,234
Transferred From Profit & Loss Account 95,66,01,290 73,07,90,223
3,41,17,32,747 2,45,51,31,457
Share Premium 1,52,93,63,992 43,20,71,020
Total 4,94,10,96,739 2,88,72,02,477
Schedule RESERVES & SURPLUSII
Term Loan 3,23,18,56,987 2,88,71,29,270
Working Capital Limit 6,38,14,40,201 3,89,38,29,298
Vehicle Loan 95,05,018 73,46,086
Interest Accrued & Due 80,22,690 1,67,86,773
Total 9,63,08,24,897 6,80,50,91,427
Schedule SECURED LOANS III
Raw Material 3,01,30,02,624 1,92,52,82,222
Work-In-Progress 6,78,60,96,199 4,55,93,33,143
Finished Goods 55,58,06,039 4,99,60,686
Stores & Spares 5,14,20,174 3,80,08,106
Total 10,40,63,25,036 6,57,25,84,157
Schedule INVENTORIESVIII
Deferred Tax Liabilities Arising On Account Of Depreciation 20,00,72,858 (85,46,407)
Total (A) 20,00,72,858 (85,46,407)
Deferred Tax Assets Arising On Account Of Provision For :
Retirement Benefits 1,53,04,207 2,00,69,704
Loss on the sale of Shares long term – –
Total (B) 1,53,04,207 2,00,69,704
Deferred Tax Liability arising on Account of Dividend Received - U/S 10(34) 1,72,275 1,69,816
Total (C) 1,72,275 1,69,816
Net Deferred Tax Liability (A-B+C) 18,49,40,926 (2,84,46,295)
Tax Impact 6,14,32,752 (96,68,896)
Amount brought forward from previous year 13,21,71,744 14,18,40,640
Total 19,36,04,497 13,21,71,744
Schedule DEFERRED TAX LIABILITIES (NET) V
Short Term loan from banks 1,44,97,83,162 27,48,41,440
Others 10,61,62,122 11,62,122
Total 1,55,59,45,284 27,60,03,562
Schedule UNSECURED LOANS IV

75
ANNUAL REPORT 2010-11
Schedules to the Profit & Loss Account for the year ending 31st March 2011
74
Schedules to the Balance Sheet as on 31st March 2011
SURYA PHARMACEUTICAL LIMITED
(Amount in `)
As on As on31.03.2011 31.03.2010
(Unsecured, considered doubtful) Outstanding for a Period exceeding Six Months 28,38,629 25,85,423Less : Provision for Doubtful Debts – –
28,38,629 25,85,423(Unsecured, considered good) Outstanding for a Period exceeding Six Months 4,60,59,207 4,48,34,341Others 2,85,95,89,652 1,48,33,82,259Total 2,90,84,87,488 1,53,08,02,023
Schedule SUNDRY DEBTORS IX
Cash in Hand 21,19,648 23,30,601Balance in current A/c-With Scheduled banks 9,35,39,567 14,57,38,765Balance in Fixed Deposits 5,86,84,458 3,07,44,326SPL Dividend A/c IDBI 4,58,565 2,62,584Total 15,48,02,238 17,90,76,275
Schedule CASH & BANK BALANCES X
Sundry Creditors 3,92,02,40,002 2,61,81,46,455Other Liabilities on Capital A/c 44,64,77,239 61,61,37,152Advances from Customers 26,35,41,525 10,40,41,540Other Liabilities 41,92,59,373 25,91,77,439Proposed Dividend 2,89,12,857 2,17,02,507Total 5,07,84,30,996 3,61,92,05,093
Schedule CURRENT LIABILITIES & PROVISIONS XII
Opening Balance 2,06,19,320 84,11,995Addition during the year – 1,81,60,338
2,06,19,320 2,65,72,333Less Amount written off 63,28,090 59,53,013Closing Balance 1,42,91,230 2,06,19,320
Schedule DEFERRED REVENUE EXPENSES XIII
(Unsecured, considered good) 85,29,81,709 65,00,35,326Advances recoverable in cash or in kind or for value to be received (Includes advances to Directors, Firms/Companies in which Directors are interested ` NIL (Previous year ` NIL)Max. Balance during the year ` NIL (Previous Year ` NIL) – –
Advances to Group Companies 5,10,35,110 1,14,35,011Security Deposits 89,15,988 80,94,002Export Incentives 26,63,21,358 30,67,38,366Excise Duty Balances 18,00,56,513 10,49,10,988VAT Recoverable 20,65,90,364 14,46,64,577Earnest Money 1,45,000 6,45,000Total 1,56,60,46,041 1,22,65,23,270
Schedule LOANS & ADVANCES XI
(Amount in `)
Year ended Year ended31.03.2011 31.03.2010
Interest on FDRs 11,89,094 16,79,306
Dividend Received 1,72,275 1,69,816
Freight Received from parties 6,23,13,883 7,52,09,737
Claim Received 1,30,86,213 58,81,667
Miscellaneous Income 52,15,707 12,25,434
Profit on Sale of Fixed Assets – 10,82,283
Profit on Derivative Trading 70,64,405 1,97,33,319
Total 8,90,41,577 10,49,81,562
Schedule OTHER INCOME XIV
Opening Stock
- Raw Material 1,92,52,82,222 1,26,81,70,085
- Work in progress 4,55,93,33,143 2,38,21,48,611
Purchases 16,07,06,33,288 11,68,48,67,189
Total 22,55,52,48,653 15,33,51,85,885
Less : Closing Stock
- Raw Material 3,01,30,02,624 1,92,52,82,222
- Work-in-progress 6,78,60,96,199 4,55,93,33,143
Total 12,75,61,49,830 8,85,05,70,520
Schedule RAW MATERIAL CONSUMEDXV
Consumables Stores 4,05,71,367 2,47,07,348
Hire Charges 26,25,069 16,89,733
Insurance 1,76,67,009 1,55,75,450
Job Charges Paid 4,93,93,637 3,97,80,416
Repair & Maintenance 6,73,28,497 4,36,63,486
Testing Charges 3,36,825 3,15,433
Electricity & Water Charges 5,97,25,580 4,64,45,974
Fuel, Oil & Lubricants 18,83,91,475 10,83,11,175
Commission on Purchase 4,74,390 3,49,470
Total 42,65,13,849 28,08,38,485
Schedule MANUFACTURING EXPENSES XVI
Salary Directors 8,38,86,438 6,26,52,026
Staff salary 30,18,25,779 21,42,52,903
Staff Benefits 1,63,24,133 1,14,27,341
Total 40,20,36,350 28,83,32,270
Schedule PERSONNEL EXPENSES XVII

77
ANNUAL REPORT 2010-11
76
Schedules to the Profit & Loss Account for the year ending 31st March 2011
SURYA PHARMACEUTICAL LIMITED
(Amount in `)
Year ended Year ended31.03.2011 31.03.2010
Audit Fee 2,00,000 2,00,000
Books & Periodicals 3,17,481 3,74,489
Directors Sitting Fee 1,60,000 45,000
Donation 1,13,502 13,21,201
Legal & Professional Charges 2,87,40,212 1,06,40,597
Staff Welfare 15,62,578 10,87,342
Miscellaneous Expenses 1,32,94,976 89,91,722
Telephone & Telegram 67,60,692 38,51,036
Postage 24,27,822 17,42,830
Printing & Stationery 57,65,938 44,96,095
Rate, Fee & Taxes 96,66,515 87,35,575
Rent 2,88,12,574 2,88,16,179
Subscription 18,62,402 16,05,687
Travel & Conveyance 4,40,61,525 1,87,69,999
Vehicle Running & Maintenance 25,20,024 22,58,682
Ward & Watching Expenses 32,30,679 28,69,774
Loss on sale of Fixed Assets – 1,66,863
Total 14,94,96,921 9,59,73,071
Schedule ADMINISTRATIVE EXPENSES XVIII
Interest Paid - Term Loan 18,45,24,474 9,36,61,027- Short Term Loan 6,26,79,185 4,99,04,046- Working Capital 72,54,70,599 41,02,93,118- Others 51,32,274 11,98,526Bank Charges 9,97,27,206 6,85,60,837Total 1,07,75,33,738 62,36,17,554
Schedule FINANCIAL EXPENSES XIX
Advertisement 1,94,52,199 99,17,007Business Promotion 1,95,14,581 60,90,401Discount Allowed 64,800 4,85,183Export Commission 2,45,89,220 2,66,88,020Export Expenses 2,01,43,228 1,93,35,783Freight Outward 5,43,22,817 4,26,79,736Packing Expenses 5,95,98,415 4,24,52,896Sales Commission 6,87,359 99,55,895Total 19,83,72,619 15,76,04,921
Schedule SELLING EXPENSES XX
A. SIGNIFICANT ACCOUNTING POLICIES:1. Basis for preparation of financial statements
i) The financial statements have been prepared under the historical cost convention in accordance with the Indian GenerallyAccepted Accounting Principles (GAAP), accounting Standards issued by The Institute of Chartered Accountants of India and theprovisions of the Companies Act, 1956 and on the basis of a going concern.
ii) All the Income & expenditure are recognised on accrual basis.
iii) Figures have been taken to nearest rupee.
iv) Previous year figures have been re-grouped and re-arranged wherever considered necessary.
2. Fixed Assets i. Fixed Assets have been stated at original cost less depreciation.
ii. Depreciation has been provided during the year on straight line method at revised rates, vide Notification GSR No. 756 E Dated:16.12.93, as non continuous process on triple shift basis as per schedule XIV to the Companies Act, 1956.
3. Valuation of InventoriesRaw materials have been valued at cost or market price, whichever is less, Work in progress and other misc. Stocks have been valuedon estimated basis, In respect of Finished Goods and Work in Progress, applicable manufacturing overheads and other cost incurredin bringing the items of inventory to their present location and condition are also include. Finished Goods have been valued at costinclusive of the provision of excise duty thereon, in accordance with the guidance note on accounting treatment for excise duty issuedby the Institute of Chartered Accountants of India & other professional pronouncements. However, the same has no effect on theprofits for the year.
4. Foreign Exchange Transactions Monetary liabilities related to foreign currency transactions remaining unsettled at the end of the year are translated at year end rates.The resultant gain/loss, if any, is recognised in the Profit and Loss Account, except exchange differences on liabilities incurred foracquisition of fixed assets, which are adjusted to the carrying amounts of respective amounts of the respective assets. Non-monetaryassets and liabilities related to foreign currency transactions are reported at the rate on the date of the transaction.
5. Revenue Recognitioni. Sales are stated net of returns, inclusive of excise duty, job work charges received, export incentives and Mercantile sales.
ii. Dividend income has been accounted for on receipt basis.
iii. Export benefits are accounted for on accrual basis.
6. Employees Benefitsi. The Contribution to the Provident Fund, under the defined contribution plans are charged to revenue.
ii. The accrued liability towards gratuity has been calculated by SBI Life insurance Co Ltd amounting to `150.75 lacs (`148.90lacs) and has been provided upto 31st March 2011.
iii. The leave encashment has been provided amounting to `96.19 lacs (`64.56 lacs) upto 31st March 2011.
7. Apportionment of Indirect ExpensesIndirect expenses incurred by the company have been apportioned amongst all the units, on the following basis:-Fixed Administrative Expenses - on the basis of sales value, Export expenses - on the basis of exports in value Other Expenses - onthe basis of sales value.
8. Miscellaneous ExpenditureDeferred Revenue expenses are written off over a period of 5 years.
B. BALANCE SHEET1. Secured Loans
Term loansAll Term Loans are secured by first pari passu Charge on all the fixed assets of the company and second pari-passu charge on thecurrent assets of the Company.
Working Capital LimitsAll Working Capital Limits both fund based & non fund based are secured by way of first pari passu charge on all the current assetsof the Company and second pari passu charge on all the fixed assets of the Company.
2. Unsecured LoansAll Short Term Loans are secured by way of subservient charge on the fixed assets & current assets of the Company and personalguarantee of the Managing Director and Executive Director of the Company.
Schedule NOTES ON ACCOUNTSXXI

79
ANNUAL REPORT 2010-11
3. Fixed AssetsA sum of `1,580.15 lacs (`897.47 Lacs) (includes revenue and capital expenditure has been capitalized under the head Research& Development Assets. The company has been regularly working on modernization and development of its existing technologicalsystem and development of new products & processes. In the opinion of management, the process will yield benefits in the comingyears in the shape of improved yields, more demand in the international market as well as better price.
4. InvestmentsInvestments considered long term are stated at cost.
5. Current Assets, Loans & Advancesi. The company has sent letters of balance confirmation to all the parties but only a few have responded so far. So the balance in
the party accounts whether in debit or in credit are subject to reconciliation.
ii. Sundry debtors, Loans & Advances, Sundry creditor and Advances from customers are subject to confirmation, reconciliation andadjustments. Thus the impact of the same on the accounts of the company could not be ascertained.
iii. In the opinion of the directors of the Company, the current assets, loans and advances are approximately of the value as stated,if realized in the ordinary course of business.
iv. In the opinion of the directors of the Company, the Advance licenses/DEPB licenses are approximately of the value as stated, ifrealized/utilized in the ordinary course of business.
v. Fixed Deposits of `586.84 lacs (`307.44 lacs) as on 31.03.2011 are pledged as margin money against the bank guarantees,inland letter of credit and foreign letter of credit.
vi. The inventory of stocks, stores & spares has been taken, valued and certified by the management.
vii. Sundry Debtors are stated after making adequate provisions for doubtful debts.
6. Current Liabilitiesi. As regards compliance of provisions relating to dues to the Small Scale Industries in terms of the Companies (Amendment) Act,
1999, the Company has sent letters to the creditors to intimate whether they are Small Scale Industrial Units. The Company isyet to receive the required information from them. Hence, it is not possible to quantify the dues, if any, towards the Small ScaleUnits.
ii) Contingent Liabilities
iii) There was a search and seizure operation at various premises of the company and its employees on 17.09.2010. The necessaryentries/adjustment in respect of the same, if any, will be made as an when assessment are completed under Chapter XIV ofIncome Tax Act, 1961 in pursuance of provision of Section 153A of the said Act.
C. PROFIT & LOSS ACCOUNTi) Payment has been made to Auditors for the year ended 31st March 2010, and provision has been made for the year ended 31st
March 2011.
iii. Sales Tax Assessments for previous years are in progress. No provision has been made on account of sales tax liability and the same,if any, will be provided at the time of assessment.
iv. Provision for Income tax has been made as per Income-tax Act, 1961.
v. During the year, company is writing off Deferred Revenue Expenditure for marketing of products, exhibitions etc. over a period of fiveyears.
vi. Profit made in currency derivatives trading during the year is `70.64 lacs, (previous year `197.33 lacs) and exposure in sale is `6,765 lacs (`6,367.93) as on 31.03.2011.
vii. Menthol incentive for Vishesh Krishi Gram Upaj Yojana is `449.02 lacs. and quantity exported under this scheme is 1274.93 MT
D. EARNING PER SHAREBasic earning per share is calculated by dividing the net profit or loss for the year attributable to equity shareholders by the weightedaverage number of equity shares during the year. Diluted earning per share is calculated by dividing the net profit for the year attributableto equity shareholders by the weighted average number of equity shares outstanding during the period assuming the conversion of dilutedpotential equity shares.
E. SHARE CAPITAL1) The company has issued and allotted 47,00,000 Share Warrants at an exercise price of `70/- (inclusive of `10/- face value and
`60/- premium) to the promoters, which are 25% paid up. The warrants shall be converted in equity shares at the option of allottedwithin eighteen months from the date of allotment of the warrants. Out of this during the year 9,50,000 convertible share warrantshave been converted in share capital at face value of `1 per share (one share warrant comprises 10 equity share consequent tosubdivision of face value from `10 to `1 per share). Further during the year 2011-12, the promoters have exercised another10,00,000 share warrants and the paid up capital has increased to 20,27,52,380 number of shares.
2) The Company has raised USD 25 million through issue of 3,85,690 GDRs at US $ 64.819 in October 2010, 1 GDR comprises 10equity shares, the proceeds of GDRs were used for setting up/acquisition of new manufacturing facility, upgradation/modernisationof existing facilities, investment in subsidiaries, augmenting long term working capital.
ii) Director's Remuneration
a) Details of Remuneration to Managing Director & Whole Time Directors: -
Remuneration to Directors `312.00 lacs (`264.66 Lacs) and Commission to directors `526.86 lacs (`361.85 lacs).
b) Calculations of profit in accordance with Section 198 of the Companies Act, 1956.
Schedule NOTES ON ACCOUNTS (Contd...)XXI Schedule NOTES ON ACCOUNTS (Contd...)XXI
78
SURYA PHARMACEUTICAL LIMITED
(` in lacs)
Sr. No. Particulars 31.03.2011 31.03.2010
i. Foreign/ Inland Letter of Credit 2,116.73 3,576.89ii. Bank Guarantees 1,413.89 88.92iii Corporate Guarantee (Subsidiaries) 11,365.00 1,085.82iv. Bills Discounted (FOBN) 2,327.29 3,413.27v. Claims against the Company not acknowledged as debt as
on 31.03.2011 in respect of:a. Income Tax matters, pending decisions on various appeals
made by the company and by the departmenti. Cases for A.Y. 2000-01,2001-02, 2003-04,2004-05 & No Demand No Demand
2005-06 are remanded back by ITAT to Assessing Officer Pending Pendingfor reframing the case.
ii. Cases for A.Y. 2006-07 are pending with Tribunal. Appeal Pending Demand Noticeat ITAT 89.72 Lacs
iii. Case for A.Y. 2007-08 is under processing with ITAT. CIT(A) has allowed Demand Noticeour appeals and `649.47 Lacs
company has applied (`125 Lacs depositedfor appeal affect under protest, till
asking for refund of 31-03-10.) with (`555.61 Lacs) (CIT A)
b. Excise matters, under dispute 734.52 1,591.48c. Sales Tax matters, under dispute – 155.82d. Service Tax, under dispute 173.94 24.87e. Customs Act 313.27 313.27
(Amount in `)
(` in lacs)
Sr. No. Particulars 31.03.2011 31.03.2010
i) Statutory audit 2,00,000 2,00,000
ii) Tax Audit 1,00,000 1,00,000
iii) Others 3,00,000 3,00,000
iv) Service Tax 45,200 45,200
Particulars Amount
Profit before Tax as per Profit & Loss A/c 13,171.61
Add: Director Remuneration 312.00
Add: Commission to Directors 526.86
Net Profit for the purpose of calculating Directors commission
as per the provisions of the Companies Act, 1956 14,010.47
Director Remuneration payable as per Company Act, 1956 1,401.05
Remuneration Paid to Directors 312
Commission paid to Directors 526.86

81
ANNUAL REPORT 2010-11
80
SURYA PHARMACEUTICAL LIMITED
3) GDR issue expenses of `396.39 lacs has been adjusted against the Security premium accounts as permitted by Sec 78 (2) ofCompanies Act, 1956.
F. SEGMENT REPORTINGThere is not more than one reportable segment; hence information as per AS 17 is not required to be disclosed.
G. RELATED PARTY DISCLOSURESRelated party disclosures as required under Accounting Standard on “Related Party Disclosures” issued by the Institute of CharteredAccountants of India are given below :-
a) Relationshipi) Subsidiary Companies
M/s. Surya Healthcare Ltd.M/s. Surya Pharmaceutical Inc.M/s. Surya Pharmaceutical (Singapore) Pte LtdM/s. Surya Biopharma U.S.A Inc
ii) Key Management Personnel (Director/Whole-time directors)Sh. Rajiv GoyalSmt. Alka Goyal
Entities over which key management personnel/their relatives are able to exercise significant influenceM/s. Surya Healthcare Ltd M/s. Surya Pharmaceutical Inc.M/s. Ess Ess Exim Pvt. Ltd.M/s. Surya Envirotech Ltd.M/s. Kala Infra Pvt. Ltd. M/s. Surya Pharmaceutical (Singapore) Pte LtdM/s. Surya Biopharma U.S.A Inc
b) The following transactions were carried out with related parties in the ordinary course of business.i) Subsidiary Companies, Joint Ventures and associates of as follows:
Rent paid to M/s Surya Envirotech Ltd. of `25.50 lacs.Rent paid to M/s Ess Ess Exim Pvt Ltd of `7.00 LacsRent paid to M/s Kala Infra Pvt. Ltd. of `97.00 LacsRent received from M/s Surya Healthcare Ltd of `10.32 Lacs
Key Management Personnel and their relatives
Schedule NOTES ON ACCOUNTS (Contd...)XXI
I. ADDITIONAL INFORMATION PURSUANT TO THE PROVISION OF PARAGRAPH 3,4C AND 4D OF PART II OF SCHEDULE VI OFCOMPANIES ACT, 1956 ARE AS UNDER:
H. IMPAIRMENT OF ASSETS1) The indicators listed in paragraph 8 to 10 of Accounting Standard (AS) – 28 “Impairment of Assets” issued by Institute of Chartered
Accountants of India have been examined and on such examination, it has been found that none of the indicators are present in thecase of the Company. A formal estimate of the recoverable amount has not been made, as there is no indication of a potentialimpairment loss.
2) During the year Company has received insurance claim of `672.50 lacs caused by fire in Banur Plant last year. Out of this `300 lacs has been accounted this year.
Schedule NOTES ON ACCOUNTS (Contd...)XXI
(` in lacs)
Particulars Amount
i. Remuneration 792
ii. Purchase –
iii. Sales -
iv. Other Services (Rent) 35.84
v. Balance at the end of the year
--Deposits Received –
*includes only payment to key personnel
Other services includes rent paid to Mr. Rajiv Goyal and Mrs. Alka Goyal.
As on As on
Licensed and Installed Capacity and actual production 31.03.2011 31.03.2010
1. Licensed Capacity N.A. N.A.
2 Installed Capacity (As certified by the management
being a technical matter)
a. Bulk Drug (MT) 2,886 2,340
b. Formulation – Tablets & Capsules (No in Lacs) 16,020 16,020
c. Formulation - Dry Syrup (No in lacs) 180 180
d. Menthol & Mint Derivatives (MT) 5,400 5,400
e. Phyto Chemicals 900
3. Actual Production
a. Bulk Drug (MT) 1,873.01 2,119.43
b. Formulation – Tablets, Capsules & Dry Syrup (No in Lacs) 2,527.48 1,438.41
c. Menthol & Mint Derivatives (MT) 7,387.06 6,832.50
d. Phyto Chemicals (MT) 5.99 –
J. QUANTITATIVE DETAILS OF RAW MATERIAL CONSUMPTION
Sr. No. Particulars Unit 31.03.2011 31.03.2010
1. Drug Intermediate MT 24,622.94 13,338.26
2. Menthol MT 7,425.45 7,990.98
K. PARTICULARS IN RESPECT OF PRODUCTION AND SALES OF FINISHED GOODS
Sr. No. Particulars Production Sales
1 Bulk Drugs (MT’s) 1,873.01 1,873.01
(2,137.49) (2,119.43)
2 Formulation – Tablets, Capsules & Dry Syrup (Nos. in Lacs) 2,527.48 2,527.48
(1,438.41) (1,438.41)
3 Menthol & Mint Derivatives (MT’s) 7,387.06 7,387.06
(6,832.50) (6,832.50)
4 Phyto Chemicals (MT's) 5.99 5.55
5 Merchant Exports of API's (MT's) - 158.75
PARTICULARS IN RESPECT OF PURCHASE AND SALES OF FORMULATION DIVISION
Sr. No. Particulars Quantity (No in Lac) Value (` in Lacs)
1 Opening Balance 44.55 100.98
2 Purchase 45.88 1,903.91
3 Sales 70.14 1,486.21
4 Closing Balance 20.29 694.24
Notes
Figures in Brackets represent Previous year figures.
L. In compliance with Accounting Standard (AS-22) relating to “Accounting on Taxes on Income” issued by the Institute of CharteredAccountants of India, Deferred Tax Liability accruing during the period aggregating to `61.43 Lacs (`96.69 lacs) has been recognised inthe Profit & Loss Account.
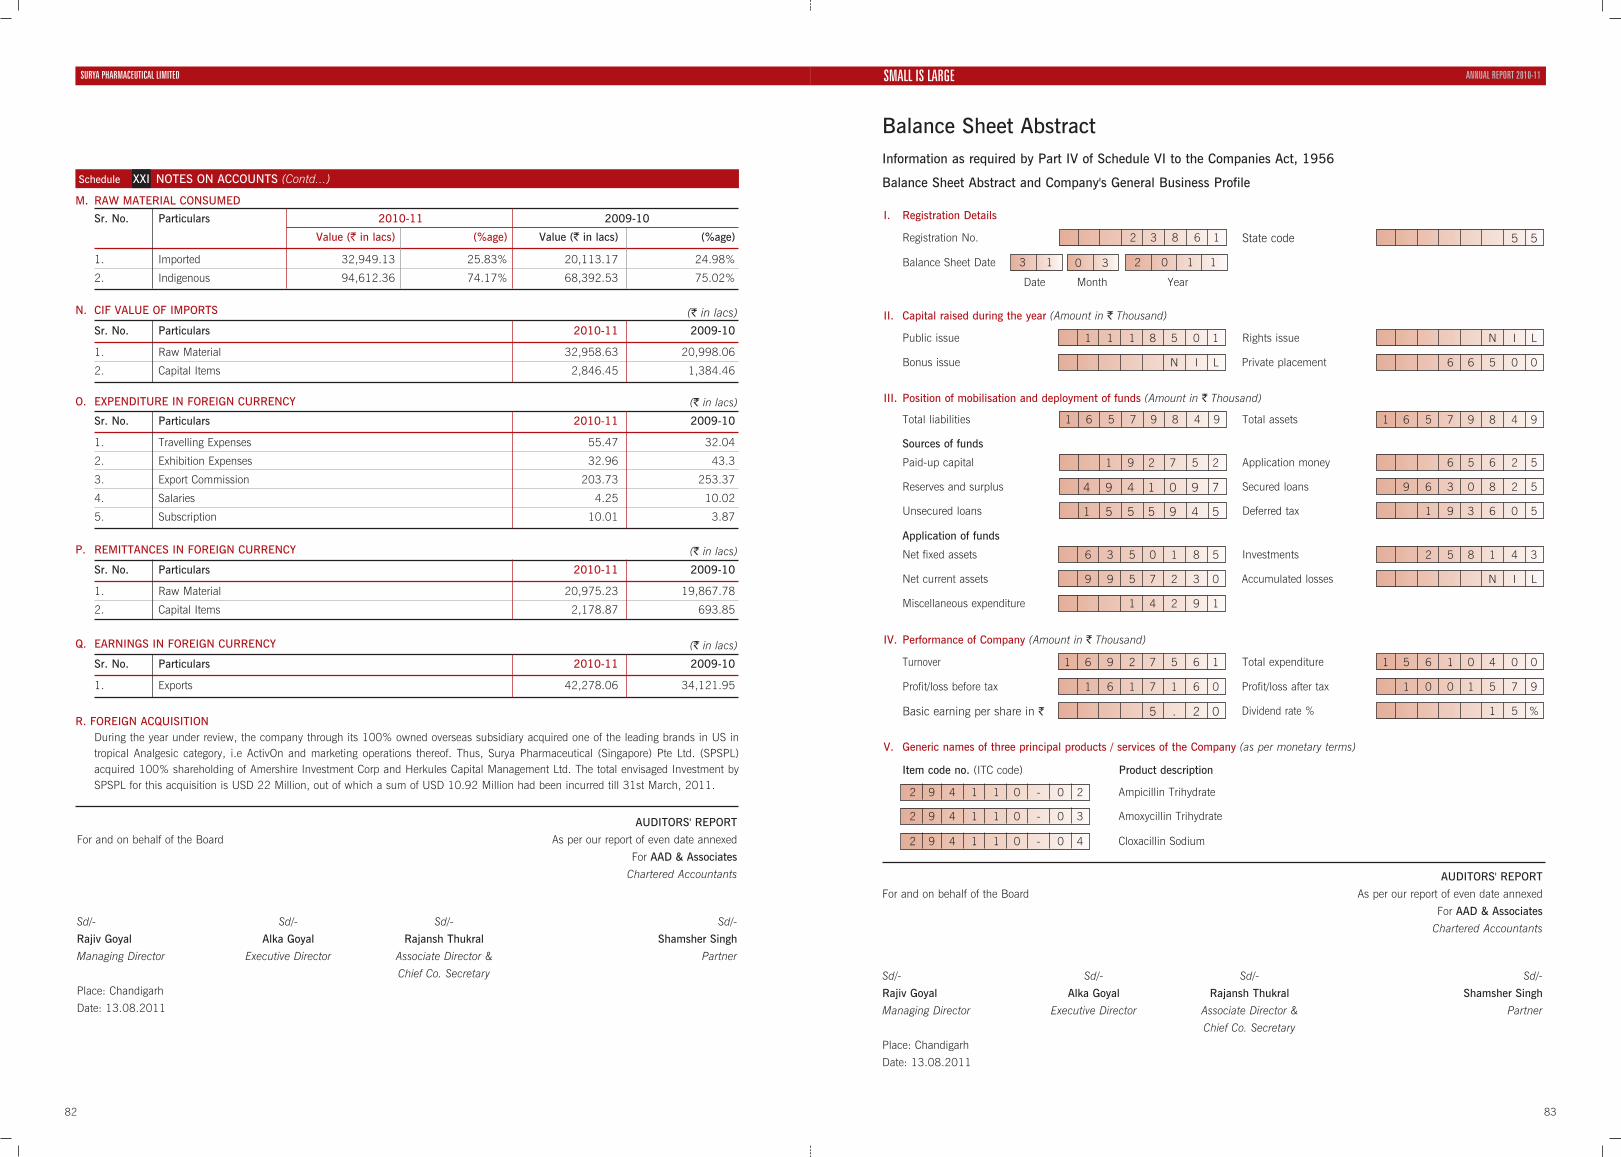
83
ANNUAL REPORT 2010-11
Balance Sheet AbstractInformation as required by Part IV of Schedule VI to the Companies Act, 1956
Balance Sheet Abstract and Company's General Business Profile
82
SURYA PHARMACEUTICAL LIMITED
M. RAW MATERIAL CONSUMED
Schedule NOTES ON ACCOUNTS (Contd...)XXI
O. EXPENDITURE IN FOREIGN CURRENCY
P. REMITTANCES IN FOREIGN CURRENCY
N. CIF VALUE OF IMPORTS
Sr. No. Particulars 2010-11 2009-10
1. Raw Material 32,958.63 20,998.06
2. Capital Items 2,846.45 1,384.46
Sr. No. Particulars 2010-11 2009-10
Value (` in lacs) (%age) Value (` in lacs) (%age)
1. Imported 32,949.13 25.83% 20,113.17 24.98%
2. Indigenous 94,612.36 74.17% 68,392.53 75.02%
(` in lacs)
Sr. No. Particulars 2010-11 2009-10
1. Travelling Expenses 55.47 32.04
2. Exhibition Expenses 32.96 43.3
3. Export Commission 203.73 253.37
4. Salaries 4.25 10.02
5. Subscription 10.01 3.87
(` in lacs)
Sr. No. Particulars 2010-11 2009-10
1. Raw Material 20,975.23 19,867.78
2. Capital Items 2,178.87 693.85
(` in lacs)
Q. EARNINGS IN FOREIGN CURRENCY
R. FOREIGN ACQUISITIONDuring the year under review, the company through its 100% owned overseas subsidiary acquired one of the leading brands in US intropical Analgesic category, i.e ActivOn and marketing operations thereof. Thus, Surya Pharmaceutical (Singapore) Pte Ltd. (SPSPL)acquired 100% shareholding of Amershire Investment Corp and Herkules Capital Management Ltd. The total envisaged Investment bySPSPL for this acquisition is USD 22 Million, out of which a sum of USD 10.92 Million had been incurred till 31st March, 2011.
Sr. No. Particulars 2010-11 2009-10
1. Exports 42,278.06 34,121.95
(` in lacs)
AUDITORS' REPORT
For and on behalf of the Board As per our report of even date annexed
For AAD & Associates
Chartered Accountants
Sd/- Sd/- Sd/- Sd/-
Rajiv Goyal Alka Goyal Rajansh Thukral Shamsher Singh
Managing Director Executive Director Associate Director & Partner
Chief Co. Secretary
Place: Chandigarh
Date: 13.08.2011
Public issue
Bonus issue
3 1 0 3
Registration No.
Balance Sheet Date
I. Registration Details
II. Capital raised during the year (Amount in ` Thousand)
Total liabilities
III. Position of mobilisation and deployment of funds (Amount in ` Thousand)
2 0 1 1
Date Month Year
Private placement
Paid-up capital
Sources of funds
Total assets
Application money
Item code no. (ITC code) Product description
V. Generic names of three principal products / services of the Company (as per monetary terms)
Application of funds
1 6 5 7 9 8 4 9
2 3 8 6 1
1 9 2 7 5 2
6 6 5 0 0
Rights issue N I L
State code 5 5
N I L
1 1 1 8 5 0 1
Turnover
Profit/loss before tax
IV. Performance of Company (Amount in ` Thousand)
Profit/loss after tax 1 0 0 1 5 7 9
Total expenditure 1 5 6 1 0 4 0 0
1 6 1 7 1 6 0
Basic earning per share in ` Dividend rate % 1 5 %5 . 2 0
Ampicillin Trihydrate2 9 4 1 1 0 - 0 2
Amoxycillin Trihydrate2 9 4 1 1 0 - 0 3
Cloxacillin Sodium2 9 4 1 1 0 - 0 4
1 6 9 2 7 5 6 1
Net fixed assets
Net current assets Accumulated losses N I L
Investments 2 5 8 1 4 3
9 9 5 7 2 3 0
Miscellaneous expenditure 1 4 2 9 1
6 3 5 0 1 8 5
1 6 5 7 9 8 4 9
6 5 6 2 5
Reserves and surplus Secured loans4 9 4 1 0 9 7 9 6 3 0 8 2 5
Unsecured loans Deferred tax1 5 5 5 9 4 5 1 9 3 6 0 5
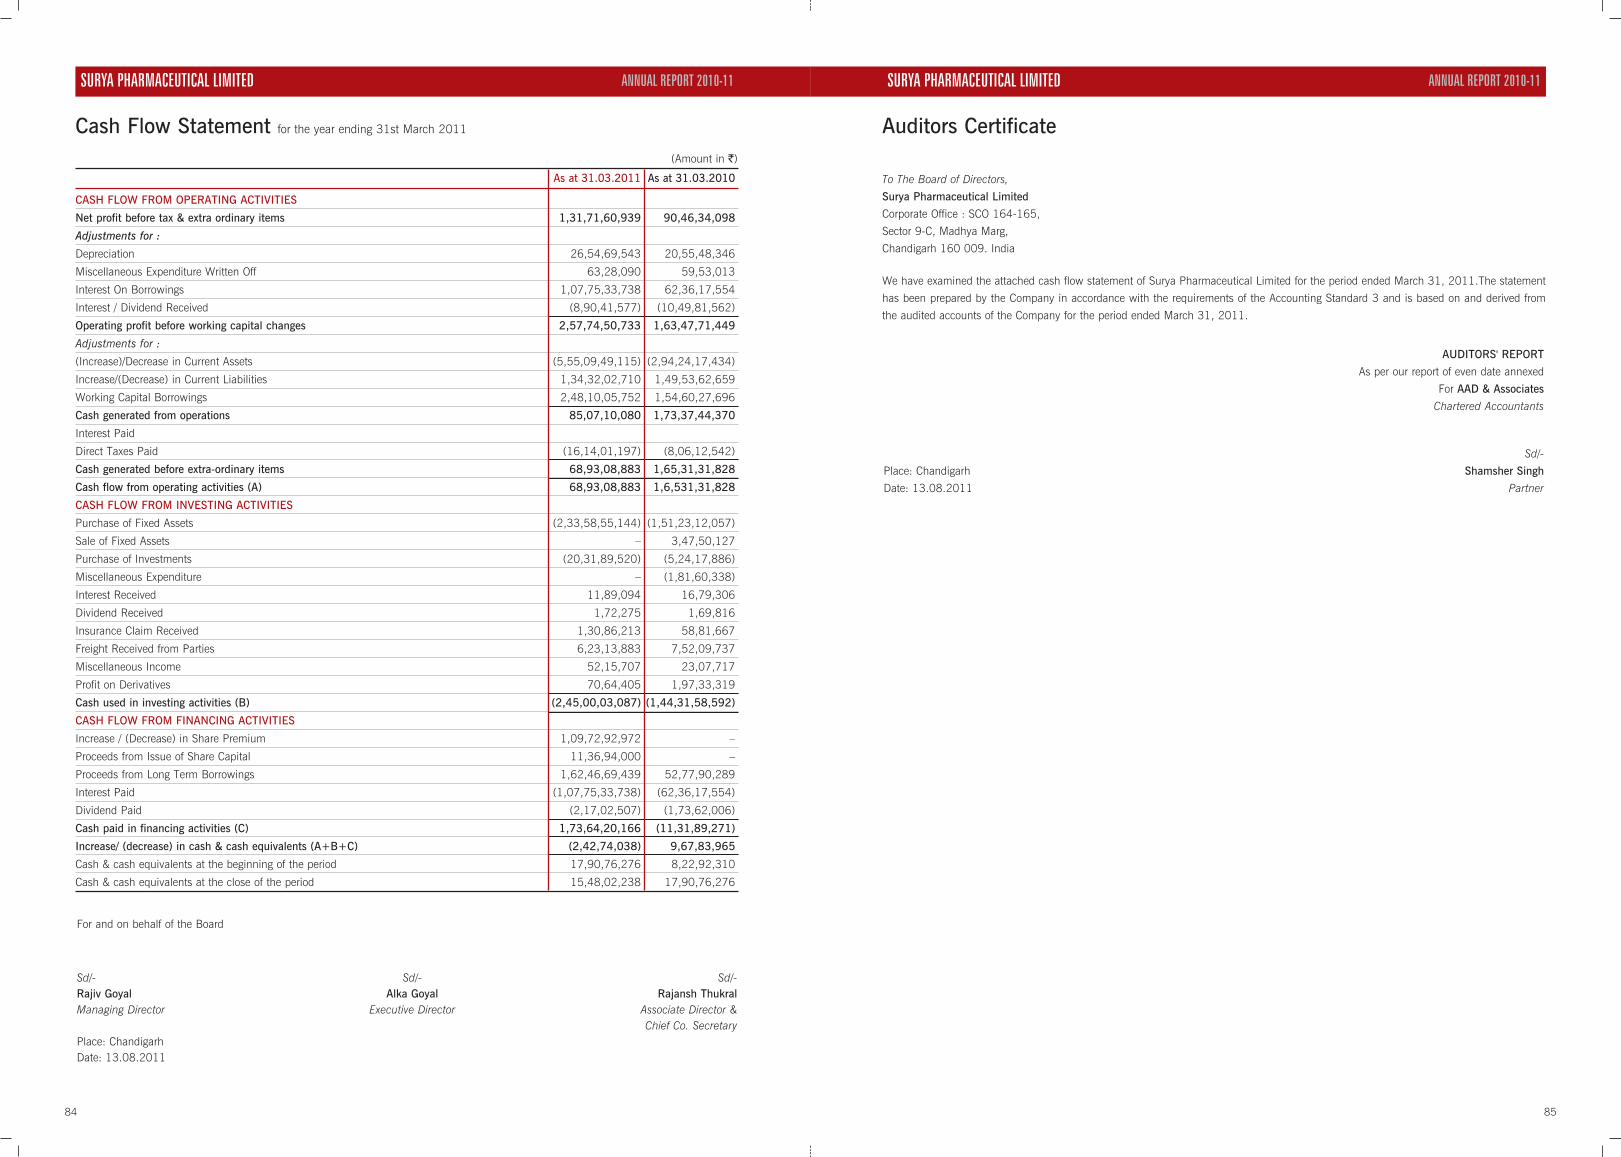
85
Auditors Certificate
84
Cash Flow Statement for the year ending 31st March 2011
(Amount in `)
As at 31.03.2011 As at 31.03.2010
CASH FLOW FROM OPERATING ACTIVITIES
Net profit before tax & extra ordinary items 1,31,71,60,939 90,46,34,098
Adjustments for :
Depreciation 26,54,69,543 20,55,48,346
Miscellaneous Expenditure Written Off 63,28,090 59,53,013
Interest On Borrowings 1,07,75,33,738 62,36,17,554
Interest / Dividend Received (8,90,41,577) (10,49,81,562)
Operating profit before working capital changes 2,57,74,50,733 1,63,47,71,449
Adjustments for :
(Increase)/Decrease in Current Assets (5,55,09,49,115) (2,94,24,17,434)
Increase/(Decrease) in Current Liabilities 1,34,32,02,710 1,49,53,62,659
Working Capital Borrowings 2,48,10,05,752 1,54,60,27,696
Cash generated from operations 85,07,10,080 1,73,37,44,370
Interest Paid
Direct Taxes Paid (16,14,01,197) (8,06,12,542)
Cash generated before extra-ordinary items 68,93,08,883 1,65,31,31,828
Cash flow from operating activities (A) 68,93,08,883 1,6,531,31,828
CASH FLOW FROM INVESTING ACTIVITIES
Purchase of Fixed Assets (2,33,58,55,144) (1,51,23,12,057)
Sale of Fixed Assets – 3,47,50,127
Purchase of Investments (20,31,89,520) (5,24,17,886)
Miscellaneous Expenditure – (1,81,60,338)
Interest Received 11,89,094 16,79,306
Dividend Received 1,72,275 1,69,816
Insurance Claim Received 1,30,86,213 58,81,667
Freight Received from Parties 6,23,13,883 7,52,09,737
Miscellaneous Income 52,15,707 23,07,717
Profit on Derivatives 70,64,405 1,97,33,319
Cash used in investing activities (B) (2,45,00,03,087) (1,44,31,58,592)
CASH FLOW FROM FINANCING ACTIVITIES
Increase / (Decrease) in Share Premium 1,09,72,92,972 –
Proceeds from Issue of Share Capital 11,36,94,000 –
Proceeds from Long Term Borrowings 1,62,46,69,439 52,77,90,289
Interest Paid (1,07,75,33,738) (62,36,17,554)
Dividend Paid (2,17,02,507) (1,73,62,006)
Cash paid in financing activities (C) 1,73,64,20,166 (11,31,89,271)
Increase/ (decrease) in cash & cash equivalents (A+B+C) (2,42,74,038) 9,67,83,965
Cash & cash equivalents at the beginning of the period 17,90,76,276 8,22,92,310
Cash & cash equivalents at the close of the period 15,48,02,238 17,90,76,276
To The Board of Directors,
Surya Pharmaceutical Limited
Corporate Office : SCO 164-165,
Sector 9-C, Madhya Marg,
Chandigarh 160 009. India
We have examined the attached cash flow statement of Surya Pharmaceutical Limited for the period ended March 31, 2011.The statement
has been prepared by the Company in accordance with the requirements of the Accounting Standard 3 and is based on and derived from
the audited accounts of the Company for the period ended March 31, 2011.
AUDITORS' REPORT
As per our report of even date annexed
For AAD & Associates
Chartered Accountants
Sd/-
Place: Chandigarh Shamsher Singh
Date: 13.08.2011 Partner
For and on behalf of the Board
Sd/- Sd/- Sd/-Rajiv Goyal Alka Goyal Rajansh ThukralManaging Director Executive Director Associate Director &
Chief Co. SecretaryPlace: ChandigarhDate: 13.08.2011
ANNUAL REPORT 2010-11SURYA PHARMACEUTICAL LIMITED SURYA PHARMACEUTICAL LIMITEDANNUAL REPORT 2010-11
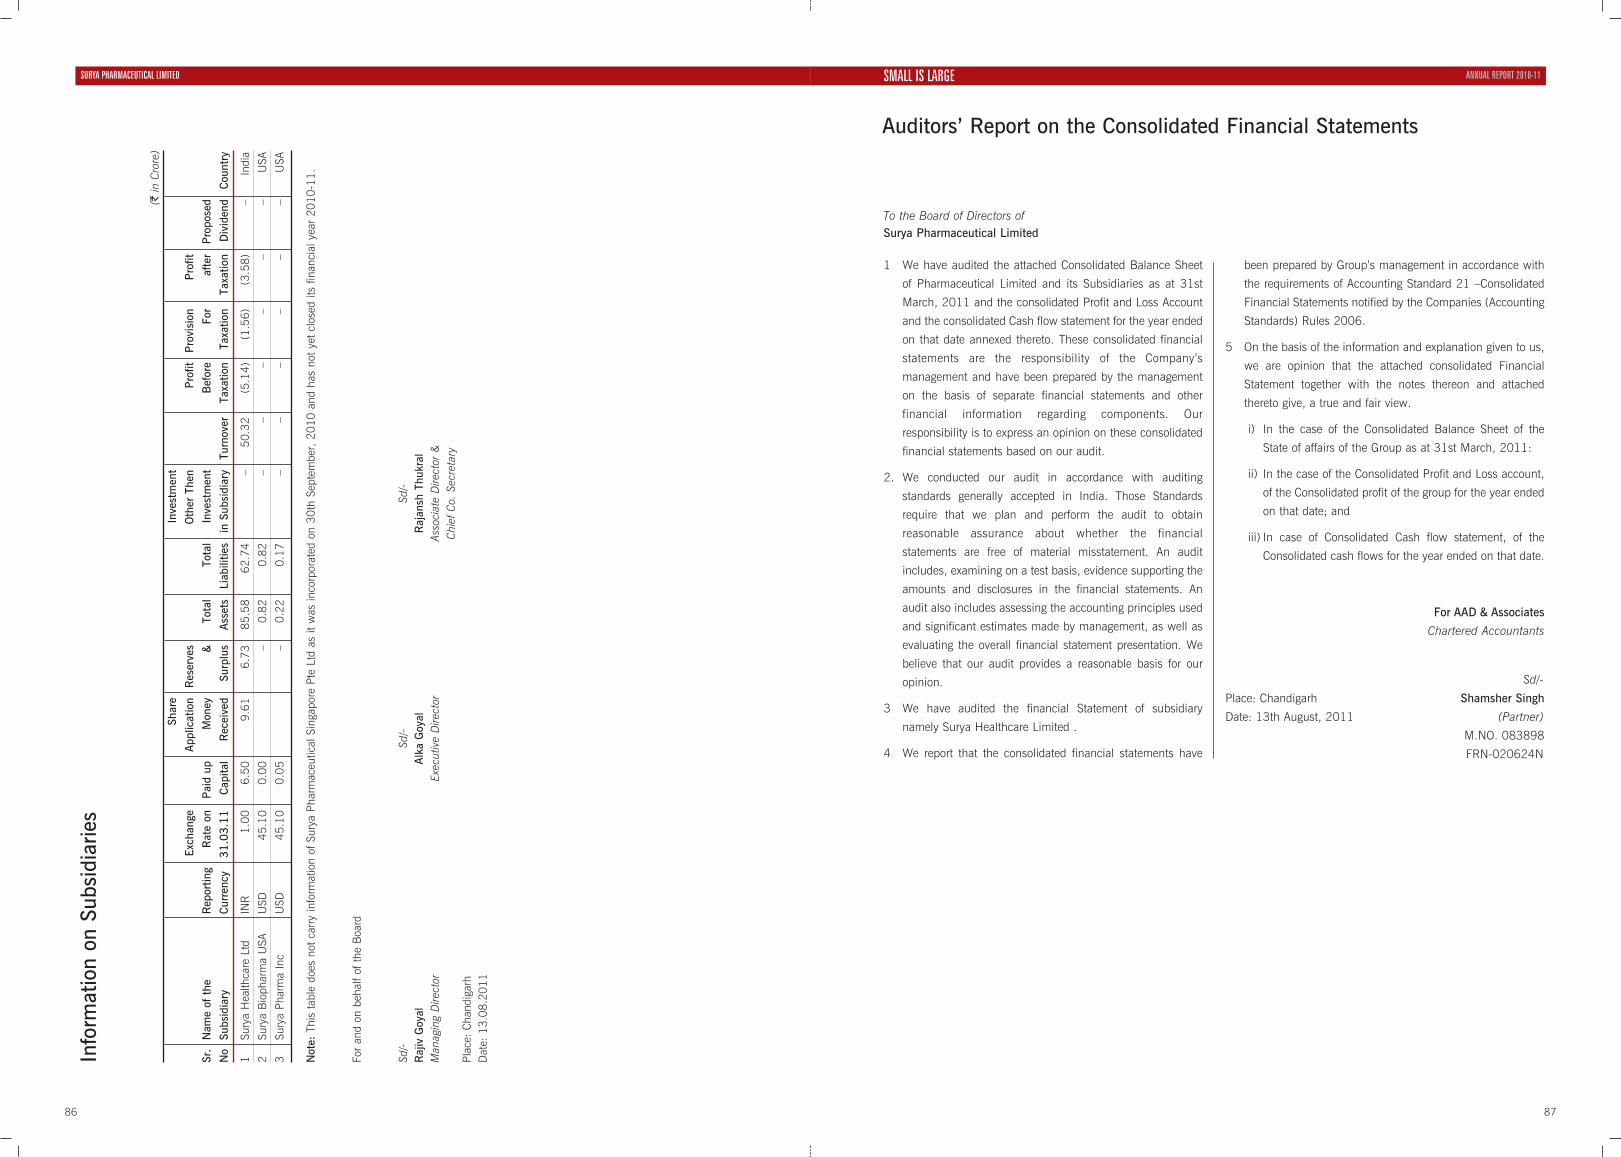
87
ANNUAL REPORT 2010-11
86
Info
rmat
ion
on S
ubsi
diar
ies
(`in
Cro
re)
Shar
eIn
vest
men
t
Exch
ange
App
licat
ion
Res
erve
sO
ther
The
nP
rofit
Pro
visi
onP
rofit
Sr.
Nam
e of
the
R
epor
ting
Rat
e on
Pai
d up
Mon
ey&
Tota
lTo
tal
Inve
stm
ent
Bef
ore
For
afte
rP
ropo
sed
No
Subs
idia
ryC
urre
ncy
31
.03
.11
Cap
ital
Rec
eive
dSu
rplu
sA
sset
sLi
abili
ties
in S
ubsi
diar
yTu
rnov
erTa
xatio
nTa
xatio
nTa
xatio
nD
ivid
end
Cou
ntry
1Su
rya
Hea
lthca
re L
tdIN
R1.
006.
509.
616.
7385
.58
62.7
4–
50.3
2(5
.14)
(1.5
6)(3
.58)
–In
dia
2Su
rya
Bio
phar
ma
USA
USD
45.1
00.
00–
0.82
0.82
––
––
––
USA
3Su
rya
Phar
ma
Inc
USD
45.1
00.
05–
0.22
0.17
––
––
––
USA
Not
e:Th
is t
able
doe
s no
t ca
rry
info
rmat
ion
of S
urya
Pha
rmac
eutic
al S
inga
pore
Pte
Ltd
as
it w
as in
corp
orat
ed o
n 30
th S
epte
mbe
r, 2
010
and
has
not
yet
clos
ed it
s fin
anci
al y
ear
2010
-11.
For
and
on b
ehal
f of t
he B
oard
Sd/-
Sd/-
Sd/-
Raj
iv G
oyal
Alk
a G
oyal
Raj
ansh
Thu
kral
Man
agin
g D
irect
orEx
ecut
ive
Dire
ctor
Ass
ocia
te D
irect
or &
Chi
ef C
o. S
ecre
tary
Plac
e: C
hand
igar
hD
ate:
13.
08.2
011
SURYA PHARMACEUTICAL LIMITED
Auditors’ Report on the Consolidated Financial Statements
To the Board of Directors ofSurya Pharmaceutical Limited
1 We have audited the attached Consolidated Balance Sheet
of Pharmaceutical Limited and its Subsidiaries as at 31st
March, 2011 and the consolidated Profit and Loss Account
and the consolidated Cash flow statement for the year ended
on that date annexed thereto. These consolidated financial
statements are the responsibility of the Company’s
management and have been prepared by the management
on the basis of separate financial statements and other
financial information regarding components. Our
responsibility is to express an opinion on these consolidated
financial statements based on our audit.
2. We conducted our audit in accordance with auditing
standards generally accepted in India. Those Standards
require that we plan and perform the audit to obtain
reasonable assurance about whether the financial
statements are free of material misstatement. An audit
includes, examining on a test basis, evidence supporting the
amounts and disclosures in the financial statements. An
audit also includes assessing the accounting principles used
and significant estimates made by management, as well as
evaluating the overall financial statement presentation. We
believe that our audit provides a reasonable basis for our
opinion.
3 We have audited the financial Statement of subsidiary
namely Surya Healthcare Limited .
4 We report that the consolidated financial statements have
been prepared by Group’s management in accordance with
the requirements of Accounting Standard 21 –Consolidated
Financial Statements notified by the Companies (Accounting
Standards) Rules 2006.
5 On the basis of the information and explanation given to us,
we are opinion that the attached consolidated Financial
Statement together with the notes thereon and attached
thereto give, a true and fair view.
i) In the case of the Consolidated Balance Sheet of the
State of affairs of the Group as at 31st March, 2011:
ii) In the case of the Consolidated Profit and Loss account,
of the Consolidated profit of the group for the year ended
on that date; and
iii) In case of Consolidated Cash flow statement, of the
Consolidated cash flows for the year ended on that date.
For AAD & Associates
Chartered Accountants
Sd/-
Place: Chandigarh Shamsher Singh
Date: 13th August, 2011 (Partner)
M.NO. 083898
FRN-020624N

8988
Consolidated Profit and Loss Account for the year ending 31st March 2011Consolidated Balance Sheet as on 31st March 2011
(Amount in `)
Schedules Current year Previous year
SOURCES OF FUNDS
1. Shareholders Funds
Share capital I 22,02,52,440 15,71,83,440
Share Application Money 7,66,60,000 3,80,35,000
Reserves & Surplus II 4,88,38,27,774 5,18,07,40,214 2,86,16,54,711 3,05,68,73,151
2. Loan Funds
Secured Loans III 9,94,32,22,823 6,91,36,73,107
Unsecured Loans IV 1,58,95,86,165 11,53,28,08,988 27,60,03,562 7,18,96,76,669
3. Deferred Tax Liabilities (Net) V 17,08,53,567 12,49,99,654
4. Minority Interest 3,33,77,211 95,11,917
16,91,77,79,980 10,38,10,61,391
APPLICATION OF FUNDS
1. Fixed Assets
Gross Block VI 7,84,46,21,091 5,22,60,93,354
Less : Depreciation 1,13,60,50,643 85,25,18,297
Net Block 6,70,85,70,448 4,37,35,75,057
Goodwill 6,49,17,173 –
2. Investments VII 8,72,52,155 21,39,464
3. Current Assets, Loans & Advances
Inventories VIII 10,61,16,61,073 6,62,85,84,417
Sundry Debtors IX 3,04,21,75,587 1,55,22,70,656
Cash & Bank Balances X 16,09,11,101 19,34,35,403
Loans & Advances XI 1,60,98,01,840 1,28,56,64,832
15,42,45,49,601 9,65,99,55,308
Less: Current Liabilities & Provisions
Liabilities & Provisions XII 5,38,18,00,627 3,67,67,25,553
Net Current Assets 10,04,27,48,974 5,98,32,29,755
Miscellaneous Expenditure
(To the extent not written off or adjusted) XIII 1,42,91,230 2,21,17,115
16,91,77,79,980 10,38,10,61,391
Notes on Accounts XXI
AUDITORS' REPORT
For and on behalf of the Board As per our report of even date annexed
For AAD & Associates
Chartered Accountants
Sd/- Sd/- Sd/- Sd/-
Rajiv Goyal Alka Goyal Rajansh Thukral Shamsher Singh
Managing Director Executive Director Associate Director & Partner
Chief Co. Secretary
Place: Chandigarh
Date: 13.08.2011
(Amount in `)
Schedules Current year Previous year
INCOME
Sales & Job Charges 16,90,53,93,609 11,65,67,98,708
Other Income XIV 10,46,75,580 10,57,01,932
Increase/ Decrease in value of finished Goods 50,58,45,353 -87,87,284
17,51,59,14,542 11,75,37,13,356
EXPENDITURE
Raw Material Consumed XV 12,75,61,49,830 8,85,05,70,520
Cost of Goods Sold 49,03,21,057 6,83,43,812
Manufacturing Expenses XVI 43,48,69,769 28,27,03,435
Excise Duty Consumed 32,84,98,587 23,39,63,258
Personnel Expenses XVII 47,98,05,337 30,45,68,549
Administrative Expenses XVIII 20,18,86,510 10,71,78,684
Financial Expenses XIX 1,08,71,38,995 62,52,51,959
Selling Expenses XX 21,38,02,717 16,09,36,912
Depreciation VI 28,10,57,119 20,83,47,101
Loss Due to Fire – 2,44,73,135
Preliminary & Deferred Revenue expenses written off 1,44,90,589 59,53,013
16,28,80,20,510 10,87,22,90,378
Profit/(Loss)before Tax 1,22,78,94,031 88,14,22,978
Tax Provisions
Provision for Tax 26,25,10,175 15,36,97,333
Provision for Deferred Tax (Net) 4,58,53,912 (1,68,40,986)
MAT Asset Appropriation (83,60,640) –
Profit after tax 92,78,90,584 74,45,66,631
Less:-Minority Interest -SHL 3,33,77,211 95,11,917
-Minority Interest-Medimart (3,63,32,163) –
Proposed Dividend 2,89,12,857 2,17,02,507
Dividend Distribution Tax 36,04,515 29,50,673
Income tax relating to previous years 1,24,59,989 51,62,258
Balance transfer to General Reserve 88,58,68,175 70,52,39,276
Basic Earning Per Equity Share of `1/- each (Previous Adjusted) 4.66 5.04
Diluted Earning Per Equity Share of `1/- each (Previous Adjusted) 4.56 5.04
AUDITORS' REPORT
For and on behalf of the Board As per our report of even date annexed
For AAD & Associates
Chartered Accountants
Sd/- Sd/- Sd/- Sd/-
Rajiv Goyal Alka Goyal Rajansh Thukral Shamsher Singh
Managing Director Executive Director Associate Director & Partner
Chief Co. Secretary
Place: Chandigarh
Date: 13.08.2011
ANNUAL REPORT 2010-11SURYA PHARMACEUTICAL LIMITED SURYA PHARMACEUTICAL LIMITEDANNUAL REPORT 2010-11

91
ANNUAL REPORT 2010-11
90
SURYA PHARMACEUTICAL LIMITED
Schedules to the Consolidated Balance Sheet as on 31st March 2011
GROSS BLOCK DEPRECIATION NET BLOCK
Particulars As on Opening Additions Sale/ Loss by Closing As on Opening During Adjustment Total As on As on
01.04.2010 Balance* Transfer Fire Balance 01.04.2010 Balance* the Year 31.03.11 31.03.2010
Land 17,07,28,918 – 85,98,161 – – 17,93,27,079 – – – – – 17,93,27,079 17,07,28,918
Building 34,41,28,441 – 59,07,82,364 – – 93,49,10,805 3,88,90,376 – 1,58,90,889 – 5,47,81,265 88,01,29,540 30,52,38,064
Leasehold Improvements 1,22,79,317 78,81,518 1,54,75,236 – – 3,56,36,071 3,93,777 3,97,944 25,18,629 – 33,10,350 3,23,25,721 1,18,85,540
Plant & Machinery 1,55,85,37,432 – 1,06,70,29,393 – – 2,62,55,66,825 61,68,86,363 – 19,48,06,046 – 81,16,92,409 1,81,38,74,416 94,16,51,069
R & D Assets 85,01,81,263 – 15,80,15,784 – – 1,00,81,97,047 12,37,41,679 – 3,91,31,130 – 16,28,72,809 84,53,24,238 72,64,39,584
Misc Assets 7,51,08,625 – 2,92,51,480 – – 10,43,60,105 2,65,84,622 – 33,65,729 – 2,99,50,351 7,44,09,754 4,85,24,003
Electricals & Fittings 4,49,85,287 – 11,15,38,020 – – 15,65,23,307 1,28,33,631 – 36,61,408 – 1,64,95,039 14,00,28,268 3,21,51,657
Computers 2,70,00,744 35,57,809 2,09,43,084 – – 5,15,01,637 84,89,386 9,33,484 48,35,117 – 1,42,57,987 3,72,43,650 1,85,11,357
Pollution Control
Equipment 4,16,42,504 – – – – 4,16,42,504 85,89,578 – 19,78,019 – 1,05,67,597 3,10,74,907 3,30,52,926
Furniture & Fixtures 7,40,18,414 1,12,06,998 13,76,38,327 – – 22,28,63,739 46,01,101 10,51,541 1,18,26,555 – 1,74,79,197 20,53,84,542 6,94,17,313
Motor Vehicle 2,99,65,630 6,35,358 84,11,806 2,800 – 3,90,09,994 1,15,07,783 93,250 30,43,597 992 1,46,43,638 2,43,66,356 1,84,57,847
Capital Work In Progress 1,99,75,16,779 – 44,75,65,201 – – 2,44,50,81,980 – – – – – 2,44,50,81,980 1,99,75,16,779
Total 5,22,60,93,354 2,32,81,683 2,59,52,48,855 2,800 – 7,84,46,21,092 85,25,18,296 24,76,219 28,10,57,119 992 1,13,60,50,642 6,70,85,70,450 4,37,35,75,057
Previous Year Figures 3,65,54,39,088 – 1,59,85,92,714 14,81,448 2,64,57,000 5,22,60,93,354 64,76,52,929 – 20,83,47,101 34,81,732 85,25,18,297
*Refer to Point H in Schedule XXI
Schedules to the Consolidated Balance Sheet as on 31st March 2011
(Amount in `) (Amount in `)
As on As on31.03.2011 31.03.2010
Authorised CapitalSPL-10,00,00,0000 Equity Shares (Previous Year 5,00,00,000) of `1/- each 101,50,90,200 55,04,82,500SHL-1,50,000,00 Shares (Previous year `50,00,000) of `10/- eachSPI -10,000 Shares of USD 1 per ShareSBP -10,000 Shares of USD 1 per ShareIssued subscribed & paid up capitalSPL-19,27,52,380 Equity Shares of `1/- each Fully paid up,out of which 67,50,000 shares @ `1/- each issued as bonus shares and 700 shares @ `1/- each issued for consideration other than cash 22,02,52,440 15,71,83,440SHL-37,50,000 Equity Shares of `10/- each Fully paid up SPI-10,000 Shares of USD 1 per share SBP 15 Shares of USD 1 per Share Total 22,02,52,440 15,71,83,440
Schedule SHARE CAPITAL
Schedule FIXED ASSETS
I
As on As on31.03.2011 31.03.2010
Quoted
a) 600 (600) Equity Shares of 21,000 21,000
Canara Bank of `10/- Each Market Value `410.20 @ `2,46,120
b) GCDB Grindlay Cash Fund 1,48,859 1,42,048
Market Value of 13416.813 Units @ 10.5873 `1,42,098
c) 10,688 (10,688) Equity Shares of 8,76,416 8,76,416
Allahabad Bank of `10/- Each Market Value `15,26,781 @ 142.85
d) Mutual Fund-Tax Saver PNB 10,00,000 10,00,000
Market Value `12,88,207@ 19.25 Units 66,919.85
e) Mutual Fund-SBI
Market Value `5,00,00,000 @ 21.79 Units 22,94,630.56 5,00,00,000 –
Unquoted
Surya Eduquest Ltd 1,00,000 1,00,000
Surya Pharmaceutical Singapore Pte. Ltd. (Share Application Money Allotment Pending) 3,51,05,880 –
Total 8,72,52,155 21,39,464
Schedule INVESTMENTSVII
VI
General ReserveOpening Balance 2,45,51,34,638 1,72,43,44,415Transferred From Profit & Loss Account 88,58,68,175 70,52,39,276
3,32,49,63,782 2,42,95,83,691Share Premium 1,55,88,63,992 43,20,71,020Total 4,88,38,27,774 2,86,16,54,711
Schedule RESERVES & SURPLUSII
Term Loan 3,37,46,77,875 2,95,44,34,875
Working Capital Limit 6,55,10,17,240 3,93,51,05,373
Vehicle Loan 95,05,018 73,46,086
Interest Accrued & Due 80,22,690 1,67,86,773
Total 9,94,32,22,823 6,91,36,73,107
Schedule SECURED LOANS III
Raw Material 3,01,30,02,624 1,92,52,82,222
Work-in-Progress 6,78,60,96,199 4,55,93,33,143
Finished Goods (Own Manufactured) 55,58,06,039 4,99,60,686
Finished Goods (Traded) 20,53,36,037 5,60,00,260
Stores & Spares 5,14,20,174 3,80,08,106
Total 10,61,16,61,073 6,62,85,84,417
Schedule INVENTORIESVIIIDeferred Tax Liabilities Arising on Account of Depreciation 21,92,15,660 (8,06,977)Total (A) 21,92,15,660 (8,06,977)Deferred Tax Assets Arising on Account of Provision For : Retirement Benefits 1,93,77,049 2,10,49,721Carried forward losses and Depreciation – 2,99,70,061Total (B) 1,93,77,049 5,10,19,782 Deferred Tax Liability arising on Account ofDividend Received - U/S 10(34) 1,72,275 1,69,816Total (C) 1,72,275 1,69,816 Net Deferred Tax Liability (A-B+C) 20,00,10,886 (5,16,56,943)Tax Impact 4,58,53,913 (1,68,40,986)Amount Brought Forward from previous year 12,49,99,654 14,18,40,640
17,08,53,567 12,49,99,654
Schedule DEFERRED TAX LIABILITIESV
Short Term loan from banks 1,44,97,83,162 27,48,41,440
Others 13,98,03,003 11,62,122
Total 1,58,95,86,165 27,60,03,562
Schedule UNSECURED LOANS IV

93
ANNUAL REPORT 2010-11
92
SURYA PHARMACEUTICAL LIMITED
Schedules to the Consolidated Profit & Loss Account for the year ending 31st March 2011Schedules to the Consolidated Balance Sheet as on 31st March 2011
(Amount in `)
As on As on31.03.2011 31.03.2010
(Unsecured, considered doubtful) Outstanding for a Period exceeding Six Months 28,38,629 25,85,423Less : Provision For Doubtful Debts – –
28,38,629 25,85,423(Unsecured, considered good) Outstanding for a Period exceeding Six Months 6,49,81,847 4,48,34,341Others 2,97,43,55,112 1,50,48,50,892Total 3,04,21,75,587 1,55,22,70,656
Schedule SUNDRY DEBTORS IX
Cash in Hand 28,16,304 30,78,288Balance in current A/c with Scheduled banks 9,37,96,304 15,91,50,205Balance in Fixed Deposits 6,38,39,928 3,09,44,326SPL Dividend 4,58,565 2,62,584Total 16,09,11,101 19,34,35,403
Schedule CASH & BANK BALANCES X
Sundry Creditors 3,92,02,40,002 2,65,51,16,419Other Liabilities on Capital A/c 53,16,60,667 61,61,37,152Advances from Customers 26,35,41,525 10,40,41,540Other Liabilities 63,74,45,575 27,97,27,934Proposed Dividend 2,89,12,857 2,17,02,508Total 5,38,18,00,627 3,67,67,25,553
Schedule CURRENT LIABILITIES & PROVISIONS XII
Opening Balance 2,21,17,115 87,48,325Addition during the year * (14,97,795) 1,93,21,803
2,06,19,320 2,80,70,128Less Amount written off 63,28,090 59,53,013Closing Balance 1,42,91,230 2,21,17,115
*Refer to Point A. B. 2 in Schedule XXI
Schedule DEFERRED REVENUE EXPENSES XIII
(Unsecured, considered good) 90,88,42,553 71,06,01,164Advances recoverable in cash or in kind or For value to be received (Includes Advances to Directors, Firms/Companies In which Directors are interested ` NIL (Previous year ` NIL) Max. Balance during the year ` NIL (Previous Year ` NIL) – –Advances to Group Companies 6,26,535 96,99,282Security Deposits 4,72,19,518 84,05,456Export Incentives 26,63,21,358 30,67,38,366Excise Duty Balances 18,00,56,513 10,49,10,988VAT Recoverable 20,65,90,364 14,46,64,577Earnest Money 1,45,000 6,45,000Total 1,60,98,01,840 1,28,56,64,832
Schedule LOANS & ADVANCES XI
(Amount in `)
Year ending Year ending31.03.2011 31.03.2010
Interest on FDRs 11,89,094 16,79,306
Dividend Received 1,72,275 1,69,816
Freight Received from parties 6,23,13,883 7,52,09,737
Claim Received 1,30,86,213 58,81,667
Miscellaneous Income 2,08,49,709 19,45,804
Profit on Sale of Fixed Assets – 10,82,283
Profit on Derivative Trading 70,64,405 1,97,33,319
Total 10,46,75,580 10,57,01,932
Schedule OTHER INCOME XIV
Opening Stock
- Raw Material 1,92,52,82,222 1,26,81,70,085
- Work in progress 4,55,93,33,143 2,38,21,48,611
Purchases 16,07,06,33,288 11,68,48,67,189
Total 22,55,52,48,653 15,33,51,85,885
Less : Closing Stock
- Raw Material 3,01,30,02,624 1,92,52,82,222
- Work-in-progress 6,78,60,96,199 4,55,93,33,143
Total 12,75,61,49,830 8,85,05,70,520
Schedule RAW MATERIAL CONSUMEDXV
Consumables Stores 4,20,18,565 2,55,62,772
Hire Charges 26,25,069 16,89,733
Insurance 1,81,78,255 1,56,24,658
Job Charges Paid 4,93,93,637 3,97,80,416
Repair & Maintenance 7,02,76,667 4,40,12,142
Testing Charges 3,36,825 3,15,433
Electricity & Water Charges 6,31,74,886 4,70,57,636
Fuel, Oil & Lubricants 18,83,91,475 10,83,11,175
Commission on Purchase 4,74,390 3,49,470
Total 43,48,69,769 28,27,03,435
Schedule MANUFACTURING EXPENSES XVI
Salary Directors 8,38,86,438 6,26,52,026
Staff salary 36,85,10,192 22,94,77,479
Staff Benefits 2,74,08,707 1,24,39,044
Total 47,98,05,337 30,45,68,549
Schedule PERSONNEL EXPENSES XVII

95
ANNUAL REPORT 2010-11
94
SURYA PHARMACEUTICAL LIMITED
Schedules to the Consolidated Profit & Loss Account for the year ending 31st March 2011
(Amount in `)
Year ended Year ended31.03.2011 31.03.2010
Audit Fee 4,29,559 2,90,000
Books & Periodicals 3,17,481 3,74,489
Directors Sitting Fee 1,60,000 45,000
Donation 1,13,502 13,21,201
Legal & Professional Charges 3,08,19,025 1,09,43,532
Staff Welfare 15,62,578 10,87,342
Miscellaneous Expenses 2,17,46,378 1,12,36,777
Telephone & Telegram 1,17,00,731 46,61,193
Postage 24,27,822 17,42,830
Printing & Stationery 80,98,179 49,64,548
Rate, Fee & Taxes 1,03,60,251 87,57,844
Rent 5,92,70,374 3,51,08,859
Subscription 18,62,402 16,05,687
Travel & Conveyance 4,72,67,526 1,97,44,063
Vehicle Running & Maintenance 25,20,024 22,58,682
Ward & Watching Expenses 32,30,679 28,69,774
Loss on sale of Fixed Assets – 1,66,863
Total 20,18,86,510 10,71,78,684
Schedule ADMINISTRATIVE EXPENSES XVIII
Interest Paid - Term Loan 18,76,70,015 9,48,48,470- Short Term Loan 6,26,79,185 4,99,04,046- Working Capital 72,97,59,032 41,02,93,118- Others 51,32,274 11,98,526Bank Charges 10,18,98,489 6,90,07,799Total 1,08,71,38,995 62,52,51,959
Schedule FINANCIAL EXPENSES XIX
Advertisement 2,15,31,020 1,13,58,321Business Promotion 1,95,14,581 60,90,401Discount Allowed 1,17,91,612 21,40,403Export Commission 2,45,89,220 2,66,88,020Export Expenses 2,01,43,228 1,93,35,783Freight Outward 5,57,77,466 4,29,15,193Packing Expenses 5,97,68,229 4,24,52,896Sales Commission 6,87,359 99,55,895Total 21,38,02,717 16,09,36,912
Schedule SELLING EXPENSES XX
A. SIGNIFICANT ACCOUNTING POLICIES:1. Basis of consolidation:
The consolidated financial statement relate to Surya Pharmaceutical Limited (the company) and its subsidiaries (the group).
The consolidated financial statements have been prepared in accordance with Accounting standard 21 “consolidated financialstatement” specified in the companies (accounting standard) rules, 2006 notified by the central government in the terms of section211 (3C) of the Companies Act, 1956.
A. Basis for preparation of financial statementsi) The financial statements have been prepared under the historical cost convention in accordance with the Indian Generally
Accepted Accounting Principles (GAAP), accounting Standards issued by The Institute of Chartered Accountants of India andthe provisions of the Companies Act, 1956 and on the basis of a going concern.
ii) All the Income & expenditure are recognised on accrual basis.
iii) Figures have been taken to nearest rupee.
B. Principle of Consolidation 1) The Consolidated financial statements have been combined on a line by line basis by adding the book values of the like items
of assets, liabilities, income and expenses of the subsidiary companies after eliminating intra group balance/ transaction andunrealized profits in full. The amounts shown in respect of reserve comprise the amount of the relevant reserves as per thebalance sheet of the Parent Company and its share in the relevant reserves of consolidated entities.
2) Excess of cost to the company of its investment in the subsidiaries companies is recognised in the financial accounts asgoodwill, which is tested for impairment on every balance sheet date. The excess of company’s share of equity and reservesof the subsidiary companies over the cost of Acquisition is treated as capital reserve. Due to goodwill creation for SHL, SPI& SBP, there is an adjustment of `14.98 lacs in Deferred Revenue Expenses (Schedule XIII).
The Consolidated financial statements are presented, to the extent possible, in the same format as that adopted by the ParentCompany.
Other Significant Accounting Policies:1. Fixed Assets:
i. Fixed Assets have been stated at original cost less depreciation.
ii. Depreciation in parent company has been provided during the year on straight line method at revised rates, vide NotificationGSR No. 756 E Dated: 16.12.93, as non continuous process on triple shift basis as per schedule XIV to the Companies Act,1956.
iii. Depreciation on fixed assets of SHL has been provided pro-rata to the period of use, on the straight-line method, using ratesbased on the management's assessment of economic useful lives of the assets. The useful lives of the assets are reviewed bythe management periodically and in case the useful lives is revised, the unamortised depreciable amount is charged over therevised remaining useful lives. The useful lives of all assets currently has been estimated at 9 (nine) years.
iv. Retail shops of SHL are considered to be operated on test marketing basis for 6 months, thereafter retail shops are consideredto be commercially operative and accordingly all expenses until the month of commencement of commercial operation arebeing capitalized.
2. Valuation of InventoriesRaw materials have been valued at cost or market price, whichever is less, Work in progress and other misc. Stocks have beenvalued on estimated basis, In respect of Finished Goods and Work in Progress, applicable manufacturing overheads and othercost incurred in bringing the items of inventory to their present location and condition are also include. Finished Goods have beenvalued at cost inclusive of the provision of excise duty thereon, in accordance with the guidance note on accounting treatmentfor excise duty issued by the Institute of Chartered Accountants of India & other professional pronouncements. However, the samehas no effect on the profits for the year.
3. Foreign Exchange Transactions Monetary liabilities related to foreign currency transactions remaining unsettled at the end of the year are translated at year endrates. The resultant gain/loss, if any, is recognised in the Profit and Loss Account, except exchange differences on liabilitiesincurred for acquisition of fixed assets, which are adjusted to the carrying amounts of respective amounts of the respective assets.Non-monetary assets and liabilities related to foreign currency transactions are reported at the rate on the date of the transaction.
4. Revenue Recognitioni. Sales are stated net of returns, inclusive of excise duty, job work charges received, export incentives and Mercantile sales.
ii. Dividend income has been accounted for on receipt basis.
Schedule NOTES ON ACCOUNTSXXI
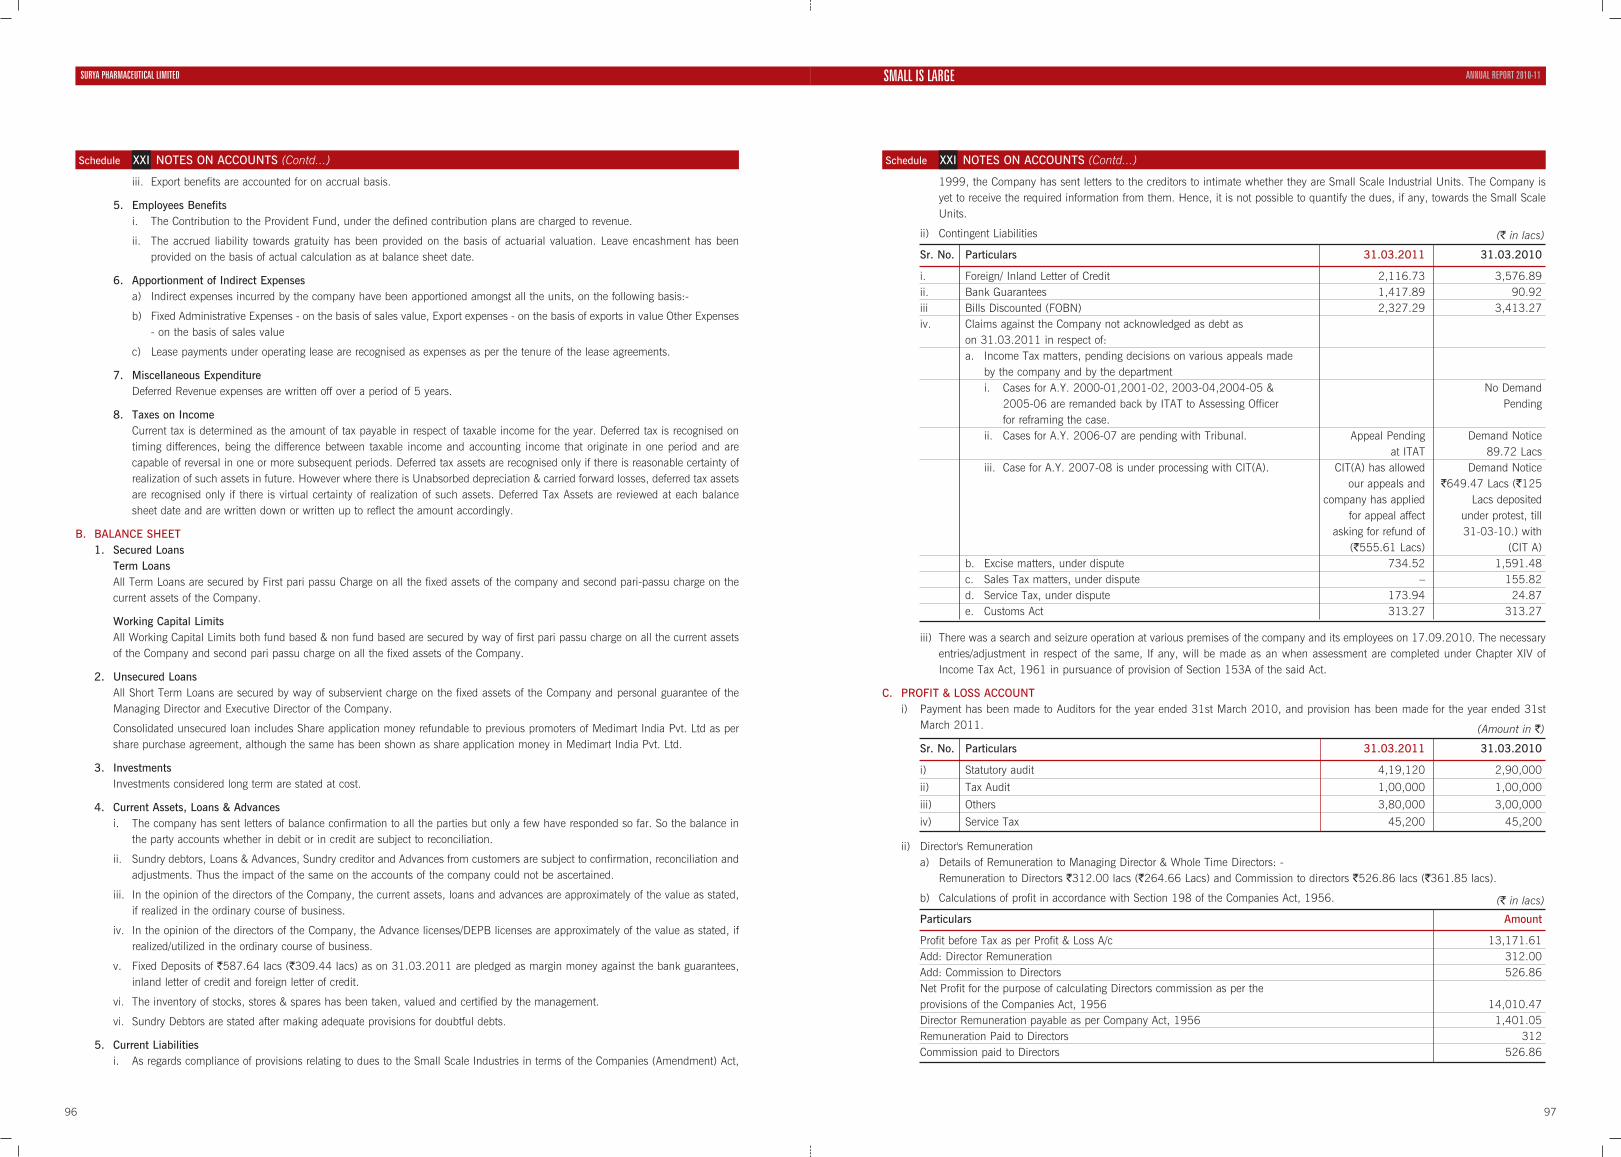
97
ANNUAL REPORT 2010-11
96
SURYA PHARMACEUTICAL LIMITED
iii. Export benefits are accounted for on accrual basis.
5. Employees Benefitsi. The Contribution to the Provident Fund, under the defined contribution plans are charged to revenue.
ii. The accrued liability towards gratuity has been provided on the basis of actuarial valuation. Leave encashment has beenprovided on the basis of actual calculation as at balance sheet date.
6. Apportionment of Indirect Expensesa) Indirect expenses incurred by the company have been apportioned amongst all the units, on the following basis:-
b) Fixed Administrative Expenses - on the basis of sales value, Export expenses - on the basis of exports in value Other Expenses- on the basis of sales value
c) Lease payments under operating lease are recognised as expenses as per the tenure of the lease agreements.
7. Miscellaneous ExpenditureDeferred Revenue expenses are written off over a period of 5 years.
8. Taxes on IncomeCurrent tax is determined as the amount of tax payable in respect of taxable income for the year. Deferred tax is recognised ontiming differences, being the difference between taxable income and accounting income that originate in one period and arecapable of reversal in one or more subsequent periods. Deferred tax assets are recognised only if there is reasonable certainty ofrealization of such assets in future. However where there is Unabsorbed depreciation & carried forward losses, deferred tax assetsare recognised only if there is virtual certainty of realization of such assets. Deferred Tax Assets are reviewed at each balancesheet date and are written down or written up to reflect the amount accordingly.
B. BALANCE SHEET1. Secured Loans
Term LoansAll Term Loans are secured by First pari passu Charge on all the fixed assets of the company and second pari-passu charge on thecurrent assets of the Company.
Working Capital LimitsAll Working Capital Limits both fund based & non fund based are secured by way of first pari passu charge on all the current assetsof the Company and second pari passu charge on all the fixed assets of the Company.
2. Unsecured LoansAll Short Term Loans are secured by way of subservient charge on the fixed assets of the Company and personal guarantee of theManaging Director and Executive Director of the Company.
Consolidated unsecured loan includes Share application money refundable to previous promoters of Medimart India Pvt. Ltd as pershare purchase agreement, although the same has been shown as share application money in Medimart India Pvt. Ltd.
3. InvestmentsInvestments considered long term are stated at cost.
4. Current Assets, Loans & Advances i. The company has sent letters of balance confirmation to all the parties but only a few have responded so far. So the balance in
the party accounts whether in debit or in credit are subject to reconciliation.
ii. Sundry debtors, Loans & Advances, Sundry creditor and Advances from customers are subject to confirmation, reconciliation andadjustments. Thus the impact of the same on the accounts of the company could not be ascertained.
iii. In the opinion of the directors of the Company, the current assets, loans and advances are approximately of the value as stated,if realized in the ordinary course of business.
iv. In the opinion of the directors of the Company, the Advance licenses/DEPB licenses are approximately of the value as stated, ifrealized/utilized in the ordinary course of business.
v. Fixed Deposits of `587.64 lacs (`309.44 lacs) as on 31.03.2011 are pledged as margin money against the bank guarantees,inland letter of credit and foreign letter of credit.
vi. The inventory of stocks, stores & spares has been taken, valued and certified by the management.
vi. Sundry Debtors are stated after making adequate provisions for doubtful debts.
5. Current Liabilities i. As regards compliance of provisions relating to dues to the Small Scale Industries in terms of the Companies (Amendment) Act,
Schedule NOTES ON ACCOUNTS (Contd...)XXI
1999, the Company has sent letters to the creditors to intimate whether they are Small Scale Industrial Units. The Company isyet to receive the required information from them. Hence, it is not possible to quantify the dues, if any, towards the Small ScaleUnits.
ii) Contingent Liabilities
Schedule NOTES ON ACCOUNTS (Contd...)XXI
(` in lacs)
Sr. No. Particulars 31.03.2011 31.03.2010
i. Foreign/ Inland Letter of Credit 2,116.73 3,576.89ii. Bank Guarantees 1,417.89 90.92iii Bills Discounted (FOBN) 2,327.29 3,413.27iv. Claims against the Company not acknowledged as debt as
on 31.03.2011 in respect of:a. Income Tax matters, pending decisions on various appeals made
by the company and by the departmenti. Cases for A.Y. 2000-01,2001-02, 2003-04,2004-05 & No Demand
2005-06 are remanded back by ITAT to Assessing Officer Pendingfor reframing the case.
ii. Cases for A.Y. 2006-07 are pending with Tribunal. Appeal Pending Demand Noticeat ITAT 89.72 Lacs
iii. Case for A.Y. 2007-08 is under processing with CIT(A). CIT(A) has allowed Demand Noticeour appeals and `649.47 Lacs (`125
company has applied Lacs depositedfor appeal affect under protest, till
asking for refund of 31-03-10.) with (`555.61 Lacs) (CIT A)
b. Excise matters, under dispute 734.52 1,591.48c. Sales Tax matters, under dispute – 155.82d. Service Tax, under dispute 173.94 24.87e. Customs Act 313.27 313.27
iii) There was a search and seizure operation at various premises of the company and its employees on 17.09.2010. The necessaryentries/adjustment in respect of the same, If any, will be made as an when assessment are completed under Chapter XIV ofIncome Tax Act, 1961 in pursuance of provision of Section 153A of the said Act.
C. PROFIT & LOSS ACCOUNTi) Payment has been made to Auditors for the year ended 31st March 2010, and provision has been made for the year ended 31st
March 2011. (Amount in `)
Sr. No. Particulars 31.03.2011 31.03.2010
i) Statutory audit 4,19,120 2,90,000
ii) Tax Audit 1,00,000 1,00,000
iii) Others 3,80,000 3,00,000
iv) Service Tax 45,200 45,200
ii) Director's Remunerationa) Details of Remuneration to Managing Director & Whole Time Directors: -
Remuneration to Directors `312.00 lacs (`264.66 Lacs) and Commission to directors `526.86 lacs (`361.85 lacs).
b) Calculations of profit in accordance with Section 198 of the Companies Act, 1956. (` in lacs)
Particulars Amount
Profit before Tax as per Profit & Loss A/c 13,171.61Add: Director Remuneration 312.00Add: Commission to Directors 526.86Net Profit for the purpose of calculating Directors commission as per the provisions of the Companies Act, 1956 14,010.47Director Remuneration payable as per Company Act, 1956 1,401.05Remuneration Paid to Directors 312Commission paid to Directors 526.86
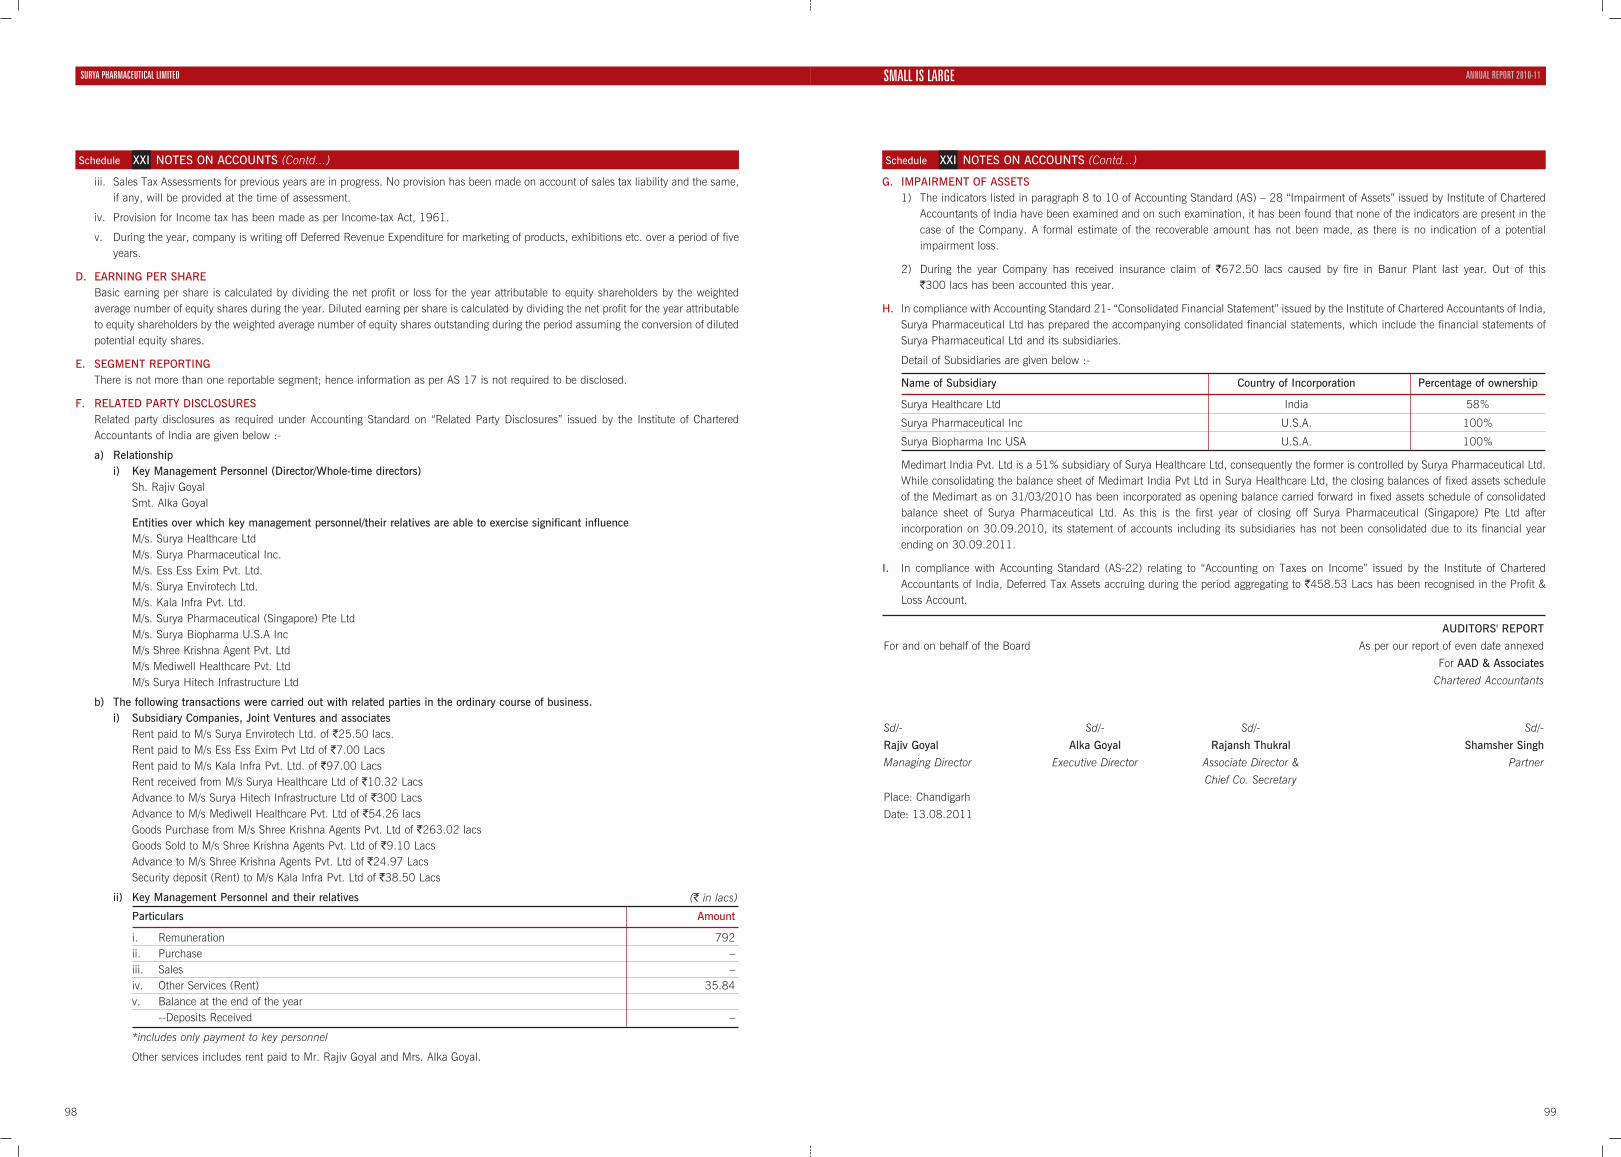
99
ANNUAL REPORT 2010-11
98
SURYA PHARMACEUTICAL LIMITED
G. IMPAIRMENT OF ASSETS1) The indicators listed in paragraph 8 to 10 of Accounting Standard (AS) – 28 “Impairment of Assets” issued by Institute of Chartered
Accountants of India have been examined and on such examination, it has been found that none of the indicators are present in thecase of the Company. A formal estimate of the recoverable amount has not been made, as there is no indication of a potentialimpairment loss.
2) During the year Company has received insurance claim of `672.50 lacs caused by fire in Banur Plant last year. Out of this `300 lacs has been accounted this year.
H. In compliance with Accounting Standard 21- “Consolidated Financial Statement” issued by the Institute of Chartered Accountants of India,Surya Pharmaceutical Ltd has prepared the accompanying consolidated financial statements, which include the financial statements ofSurya Pharmaceutical Ltd and its subsidiaries.
Detail of Subsidiaries are given below :-
Medimart India Pvt. Ltd is a 51% subsidiary of Surya Healthcare Ltd, consequently the former is controlled by Surya Pharmaceutical Ltd.While consolidating the balance sheet of Medimart India Pvt Ltd in Surya Healthcare Ltd, the closing balances of fixed assets scheduleof the Medimart as on 31/03/2010 has been incorporated as opening balance carried forward in fixed assets schedule of consolidatedbalance sheet of Surya Pharmaceutical Ltd. As this is the first year of closing off Surya Pharmaceutical (Singapore) Pte Ltd afterincorporation on 30.09.2010, its statement of accounts including its subsidiaries has not been consolidated due to its financial yearending on 30.09.2011.
I. In compliance with Accounting Standard (AS-22) relating to “Accounting on Taxes on Income” issued by the Institute of CharteredAccountants of India, Deferred Tax Assets accruing during the period aggregating to `458.53 Lacs has been recognised in the Profit &Loss Account.
Schedule NOTES ON ACCOUNTS (Contd...)XXI
iii. Sales Tax Assessments for previous years are in progress. No provision has been made on account of sales tax liability and the same,if any, will be provided at the time of assessment.
iv. Provision for Income tax has been made as per Income-tax Act, 1961.
v. During the year, company is writing off Deferred Revenue Expenditure for marketing of products, exhibitions etc. over a period of fiveyears.
D. EARNING PER SHAREBasic earning per share is calculated by dividing the net profit or loss for the year attributable to equity shareholders by the weightedaverage number of equity shares during the year. Diluted earning per share is calculated by dividing the net profit for the year attributableto equity shareholders by the weighted average number of equity shares outstanding during the period assuming the conversion of dilutedpotential equity shares.
E. SEGMENT REPORTINGThere is not more than one reportable segment; hence information as per AS 17 is not required to be disclosed.
F. RELATED PARTY DISCLOSURESRelated party disclosures as required under Accounting Standard on “Related Party Disclosures” issued by the Institute of CharteredAccountants of India are given below :-
a) Relationshipi) Key Management Personnel (Director/Whole-time directors)
Sh. Rajiv GoyalSmt. Alka Goyal
Entities over which key management personnel/their relatives are able to exercise significant influenceM/s. Surya Healthcare LtdM/s. Surya Pharmaceutical Inc.M/s. Ess Ess Exim Pvt. Ltd.M/s. Surya Envirotech Ltd.M/s. Kala Infra Pvt. Ltd.M/s. Surya Pharmaceutical (Singapore) Pte Ltd M/s. Surya Biopharma U.S.A IncM/s Shree Krishna Agent Pvt. LtdM/s Mediwell Healthcare Pvt. LtdM/s Surya Hitech Infrastructure Ltd
b) The following transactions were carried out with related parties in the ordinary course of business.i) Subsidiary Companies, Joint Ventures and associates
Rent paid to M/s Surya Envirotech Ltd. of `25.50 lacs.Rent paid to M/s Ess Ess Exim Pvt Ltd of `7.00 LacsRent paid to M/s Kala Infra Pvt. Ltd. of `97.00 LacsRent received from M/s Surya Healthcare Ltd of `10.32 LacsAdvance to M/s Surya Hitech Infrastructure Ltd of `300 LacsAdvance to M/s Mediwell Healthcare Pvt. Ltd of `54.26 lacsGoods Purchase from M/s Shree Krishna Agents Pvt. Ltd of `263.02 lacsGoods Sold to M/s Shree Krishna Agents Pvt. Ltd of `9.10 LacsAdvance to M/s Shree Krishna Agents Pvt. Ltd of `24.97 LacsSecurity deposit (Rent) to M/s Kala Infra Pvt. Ltd of `38.50 Lacs
ii) Key Management Personnel and their relatives
Schedule NOTES ON ACCOUNTS (Contd...)XXI
(` in lacs)
Particulars Amount
i. Remuneration 792ii. Purchase –iii. Sales –iv. Other Services (Rent) 35.84v. Balance at the end of the year
--Deposits Received –
*includes only payment to key personnel
Other services includes rent paid to Mr. Rajiv Goyal and Mrs. Alka Goyal.
Name of Subsidiary Country of Incorporation Percentage of ownership
Surya Healthcare Ltd India 58%
Surya Pharmaceutical Inc U.S.A. 100%
Surya Biopharma Inc USA U.S.A. 100%
AUDITORS' REPORT
For and on behalf of the Board As per our report of even date annexed
For AAD & Associates
Chartered Accountants
Sd/- Sd/- Sd/- Sd/-
Rajiv Goyal Alka Goyal Rajansh Thukral Shamsher Singh
Managing Director Executive Director Associate Director & Partner
Chief Co. Secretary
Place: Chandigarh
Date: 13.08.2011

100
Consolidated Cash Flow Statement for the year ending 31st March 2011(Amount in `)
As on 31.03.2011 As on 31.03.2010
CASH FLOW FROM OPERATING ACTIVITIESNet profit before Tax & Extra Ordinary Items 1,22,78,94,031 88,14,22,978Adjustments for :Depreciation 28,10,57,119 20,83,47,101Miscellaneous Expenditure written off 1,44,90,589 1,33,84,910Interest on Borrowings 1,08,71,38,995 62,52,51,959Provision for gratuity 40,72,842 –Interest / Dividend Received (10,46,75,580) (10,57,01,932)Operating profit before working capital changes 2,50,99,77,997 1,62,27,05,016Adjustments for :(Increase)/Decrease in Current Assets (5,79,71,18,595) (3,05,29,58,836)Increase / (Decrease) in current Liabilities 1,55,22,05,548 1,55,12,77,931Working capital borrowings 2,61,59,11,867 1,58,73,03,771Cash generated from operations 88,09,76,817 1,70,83,27,882Direct taxes paid (16,14,01,197) (8,06,12,542)Net cash flow from operating activities (A) 71,95,75,620 1,62,77,15,340CASH FLOW FROM INVESTING ACTIVITIESPurchase of Fixed Assets (2,61,85,30,538) (1,59,36,83,296)Sale of Fixed Assets 1,808 2,44,56,716Purchase of Investments (8,51,12,691) (1,04,456)Miscellaneous Expenditure – (1,93,21,803)Interest Received 11,89,094 16,79,306Dividend Received 1,72,275 1,69,816Insurance Claim Received 1,30,86,213 58,81,667Freight Received from Parties 6,23,13,883 7,52,09,737Miscellaneous Income 2,08,49,709 30,28,087Profit on Derivatives 70,64,405 1,97,33,319Net cash used in investing activities (B) (2,59,89,65,843) (1,48,29,50,908)CASH FLOW FROM FINANCING ACTIVITIESIncrease / Decrease in Share Premium 1,12,67,92,972 –Proceeds from Issue of Share Capital 6,30,69,000 1,25,00,000Share Application Money Received 3,86,25,000 (28,81,475)Proceeds from Long Term Borrowings 1,72,72,20,452 59,50,95,895Interest Paid (1,08,71,38,995) (62,52,51,959)Dividend Paid (2,17,02,507) (1,73,62,006)Net cash paid in financing activities (C) 1,84,68,65,922 (3,78,99,545)Net increase/ (decrease) in cash & cash equivalents (A+B+C) (3,25,24,301) 10,68,64,887Cash & cash equivalents at the beginning of the period 19,34,35,402 8,65,70,515Cash & cash equivalents at the close of the period 16,09,11,101 19,34,35,402
To The Board of Directors,Surya Pharmaceutical Limited
We have examined the attached Consolidated cash flow statement of Surya Pharmaceutical Limited for the period ended March 31, 2011.Thestatement has been prepared by the Group's Company in accordance with the requirements of the Accounting Standard 3 and is based on and derivedfrom the audited accounts of the Company for the period ended March 31,2011.
AUDITORS' REPORT As per our report of even date annexed
For AAD & AssociatesChartered Accountants
Sd/-Place: Chandigarh Shamsher SinghDate: 13.08.2011 Partner
For and on behalf of the Board
Sd/- Sd/- Sd/-Rajiv Goyal Alka Goyal Rajansh ThukralManaging Director Executive Director Associate Director &
Chief Co. SecretaryPlace: ChandigarhDate: 13.08.2011
SURYA PHARMACEUTICAL LIMITED ANNUAL REPORT 2010-11
Auditor’s Certificate
Related Documents