Small business edition 2019 Vanguard Retirement Plan Access ™ supplement to How America Saves

Welcome message from author
This document is posted to help you gain knowledge. Please leave a comment to let me know what you think about it! Share it to your friends and learn new things together.
Transcript

Small business edition
2019 Vanguard Retirement Plan Access™ supplement to How America Saves


The Small Business Administration reports that small businesses represent 99.7% of all employer firms, and they employ half of all private-sector employees. Accordingly, to help small-business DC plan sponsors understand how their plans compare with other small-business plans, we are pleased to add this VRPA supplement to our annual series of How America Saves benchmarking reports. As an industry leader, Vanguard recognizes that it is important to have a detailed understanding of DC plans and the role they play in the U.S. retirement system. We believe this information can help you make more effective plan decisions and will serve as a valuable reference tool as you continue to develop your retirement programs.
Vanguard Retirement Plan Access > 1
1 U.S. Department of Labor, Private Pension Plan Bulletin Historical Tables and Graphs, December 2018; and Investment Company Institute, Quarterly Retirement Market Data, Fourth Quarter 2018, April 2019.
IntroductionDefined contribution (DC) retirement plans are the centerpiece of the private-sector retirement system in the United States. More than 100 million Americans are covered by DC plans, with assets now in excess of $7.5 trillion.1 Vanguard is at the forefront with more than $1.4 trillion in DC plan assets under management, as of March 31, 2019. Across the business, we observe sponsors’ emphasis on plan design is having a positive impact on employee retirement savings behavior. Additionally, plan participation rates continue to improve, as does participant portfolio construction. In fact, our full-service DC recordkeeping business alone serves more than 13,000 plan sponsors and more than 5.4 million participants.
Launched in 2011, Vanguard Retirement Plan AccessTM (VRPA) is a comprehensive service for retirement plans with up to $20 million in assets. Through VRPA, we served 11,300 plan sponsors with 480,000 participants as of year-end 2018.
2 > Vanguard Retirement Plan Access
Figure 1. Population
Vanguard Retirement Plan Access defined contribution plans
2014 2015 2016 2017 2018
All All All All All Established Start-up
Number of plans 2,666 4,452 6,506 8,873 11,263 8,155 3,108
Number of participant accounts 125,136 199,242 273,045 370,414 489,625 400,170 89,455
Average number of plan participants
47 45 42 42 43 49 29
Median number of plan participants
21 20 19 19 19 24 11
Average plan assets $2.5 million $2.3 million $2.3 million $2.6 million $2.4 million $3.0 million $0.6 million
Average participant age 43 43 43 43 43 44 41
Median participant age 42 42 42 42 42 43 39
Average participant tenure 7 7 7 7 7 7 5
Median participant tenure 4 4 4 4 4 4 2
Median eligible employee income $47,000 $47,000 $49,000 $48,000 $45,000 $45,000 $44,000
Median participant income $58,000 $59,000 $64,000 $63,000 $62,000 $62,000 $62,000
Median nonparticipant income $29,000 $30,000 $30,000 $28,000 $22,000 $22,000 $24,000
Source: Vanguard, 2019.
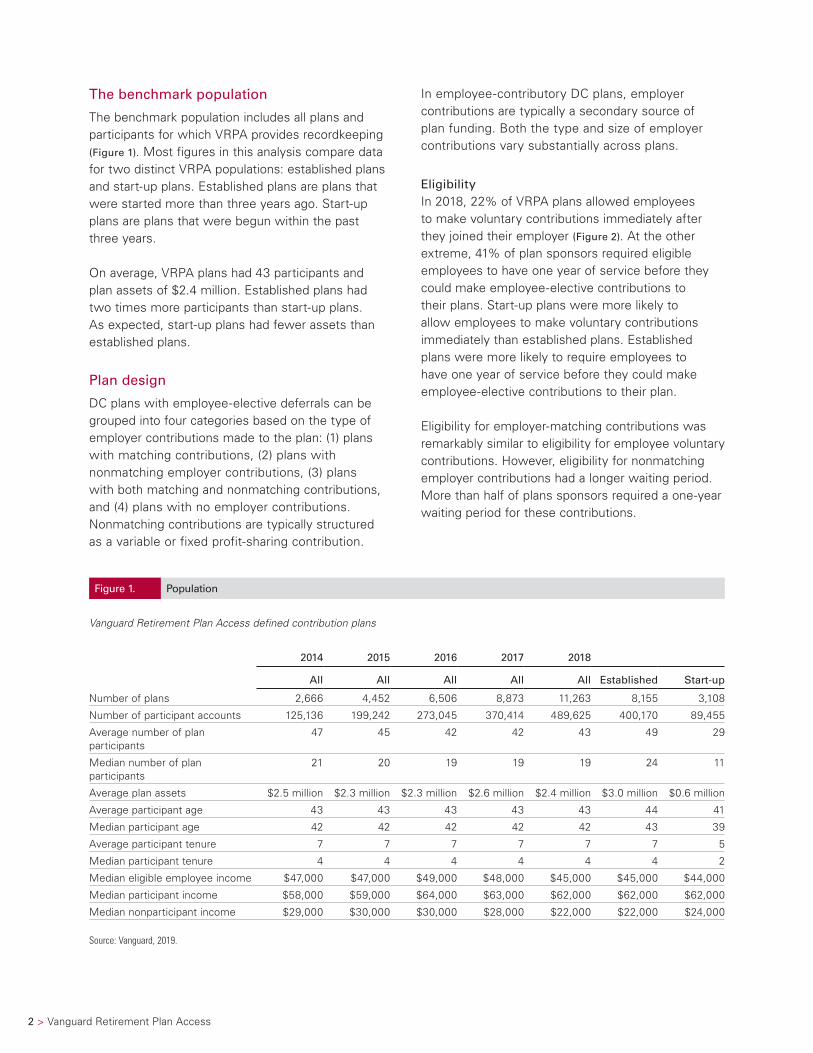
The benchmark population
The benchmark population includes all plans and participants for which VRPA provides recordkeeping (Figure 1). Most figures in this analysis compare data for two distinct VRPA populations: established plans and start-up plans. Established plans are plans that were started more than three years ago. Start-up plans are plans that were begun within the past three years.
On average, VRPA plans had 43 participants and plan assets of $2.4 million. Established plans had two times more participants than start-up plans. As expected, start-up plans had fewer assets than established plans.
Plan design
DC plans with employee-elective deferrals can be grouped into four categories based on the type of employer contributions made to the plan: (1) plans with matching contributions, (2) plans with nonmatching employer contributions, (3) plans with both matching and nonmatching contributions, and (4) plans with no employer contributions. Nonmatching contributions are typically structured as a variable or fixed profit-sharing contribution.
In employee-contributory DC plans, employer contributions are typically a secondary source of plan funding. Both the type and size of employer contributions vary substantially across plans.
EligibilityIn 2018, 22% of VRPA plans allowed employees to make voluntary contributions immediately after they joined their employer (Figure 2). At the other extreme, 41% of plan sponsors required eligible employees to have one year of service before they could make employee-elective contributions to their plans. Start-up plans were more likely to allow employees to make voluntary contributions immediately than established plans. Established plans were more likely to require employees to have one year of service before they could make employee-elective contributions to their plan.
Eligibility for employer-matching contributions was remarkably similar to eligibility for employee voluntary contributions. However, eligibility for nonmatching employer contributions had a longer waiting period. More than half of plans sponsors required a one-year waiting period for these contributions.

Vanguard Retirement Plan Access > 3
Figure 2. Eligibility, 2018
Vanguard Retirement Plan Access defined contribution plans permitting employee-elective deferrals
22%
4%
19% 14%
<0.5%
41%
20%
4%
18% 13%
<0.5%
45%
26%
5%
24%
15%
1%
29%
0%
75%
Immediate 1 month 2–3 months 4–6 months 7–11 months 1 year
18%
3%
13% 12%
<0.5%
54%
16%
3%
12% 12%
<0.5%
57%
23%
3%
17% 15%
1%
<0.5% <0.5% <0.5%
41%
0%
75%
Immediate 1 month 2–3 months 4–6 months 7–11 months 1 year
19%
4%
21% 16%
40%
18%
4%
19% 15%
44%
22%
4%
27%
17%
30%
0%
75%
Immediate 1 month 2–3 months 4–6 months 7–11 months 1 year
Employee-elective contributions
Employer matching contributions
Other employer contributions
All Established Start-up
Source: Vanguard, 2019.

4 > Vanguard Retirement Plan Access
VestingVoluntary employee contributions are immediately vested. Seven in 10 plan sponsors also immediately vested employer matching contributions (Figure 3). Seven in 10 employers also immediately vested nonmatching employer contributions.
Employer contributionsForty-five percent of VRPA plans provided only a matching contribution in 2018 (Figure 4). Eight percent of plans provided both a matching and a nonmatching employer contribution. Twenty-four percent of plans provided only a nonmatching employer contribution. Finally, about 23% of plans made no employer contributions of any kind in 2018.
Figure 3. Vesting, 2018
Vanguard Retirement Plan Access defined contribution plans permitting employee-elective deferrals
1% 2% 1%
70%
<0.5% 1% 3% 1% 2% 3% 6%
14%
<0.5%
66%
1% 1% 3% 1% 2% 3% 7%
16%
<0.5%
80%
<0.5% <0.5% 2% 1% 3% 3% 4% 7%
<0.5%
<0.5% <0.5% 0%
Immediate 1-yr cliff 2-yr cliff 3-yr cliff 2-yr graded 3-yr graded 4-yr graded 5-yr graded 6-yr graded Other
Immediate 1-yr cliff 2-yr cliff 3-yr cliff 2-yr graded 3-yr graded 4-yr graded 5-yr graded 6-yr graded Other
72%
3% 2% 1% 2% 3%
16%
71%
3% 2% 1% 2% 3%
17%
76%
5% 2% 1% 1% 2%
10%
90%
0%
90%
0%
Employer matching contributions
Nonmatching employer contribution
All Established Start-up
<0.5% 1% <0.5%
Source: Vanguard, 2019.

Vanguard Retirement Plan Access > 5
Safe harbor designsTwo-thirds of VRPA plans with an employer contribution had adopted a safe harbor design (Figure 5). The most common was a safe harbor match with a value of 4% up to the first 5% of employee contributions (40% of safe harbor plans). Fourteen
percent of VRPA plans provided a safe harbor match with a value greater than 4% on up to the first 6% of employee contributions. Forty-six percent of VRPA plans adopted a safe harbor nonelective employer contribution with a 3% value or higher.
Figure 4. Types of employer contributions, 2018
Vanguard Retirement Plan Access defined contribution plans
All Established Start-up
Matching contribution only 45% 44% 46%
Nonmatching contribution only 24 24 22
Both matching and other nonmatching contributions 8 10 5
Subtotal 77 78 73
No employer contribution 23 22 27
Source: Vanguard, 2019.
Figure 5. Safe harbor designs, 2018
Vanguard Retirement Plan Access defined contribution plans with employer contributions
All Established Start-up
Percentage of plans with employer contributions with safe harbor designs 67% 65% 75%
Type of safe harbor contribution
Automatic enrollment plans with a 3.5% employer match value <0.5% <0.5% <0.5%
Employer match with a 4% value 40 39 42
Employer match with a value >4% 14 13 16
Nonelective employer contribution with a 3% value 19 19 21
Nonelective employer contribution with a value >3% 27 29 21
Source: Vanguard, 2019.

6 > Vanguard Retirement Plan Access
Total employer contributionsAs noted previously, three-quarters of VRPA plans provided either an employer match or nonelective contribution, or both, in 2018. The average value of the total employer contribution was 4.8% in 2018. The median value was 4.0%, meaning half of VRPA plans providing an employer match or nonelective contribution were above this rate and half were below. (Figure 6). However, the value of employer contributions varies significantly from plan to plan. These contributions varied from less than 3% of wages for 17% of plans, to 10% of wages or more for 8% of plans. The most common employer contribution had a value of 4% of wages.
Automatic enrollment designAutomatic enrollment plan design reframes the savings decision. Instead of making a positive election to join the plan, employees are automatically enrolled and must take action to opt out. Automatic enrollment or autopilot designs are an important plan design feature that can increase plan participation and plan deferral rates. With an autopilot design, individuals are automatically enrolled in the plan, their deferral rates are automatically increased each year, and their contributions are automatically invested in a qualified default investment alternative (QDIA).
As of December 2018, 15% of VRPA plans permitting employee-elective deferrals had adopted automatic enrollment (Figure 7). Half of these plans automatically enroll participants at a 3% contribution rate. More than one-third of these plans automatically increase the contribution rate annually. Nearly all of these plans use a target-date or other balanced investment strategy as the default fund, with 97% choosing a target-date fund as the default.
Participation rates
A plan’s participation rate—the percentage of eligible employees who choose to make employee-elective contributions—remains the broadest metric for gauging 401(k) plan performance. The most common measure of participation rates is calculated by taking the average of participation rates among a group of plans. We refer to this as the plan-weighted participation rate. In 2018, VRPA’s plan-weighted participation rate was 72% (Figure 8).
A second measure of participation rates considers all employees in VRPA plans as if they were in a single plan. We refer to this as the participant-weighted participation rate. Across the universe of VRPA participants, 6 in 10 eligible employees are enrolled in their employer’s voluntary savings program.
Plans with automatic enrollment have higher participation rates than plans with voluntary enrollment. The participant-weighted participation rate is 52% higher in plans with automatic enrollment.
Figure 6. Total employer contributions, 2018
Vanguard Retirement Plan Access defined contribution plans with employer contributions
30%
0%
17%
7%5%
13%
18%
27%
5%
8%
Perc
enta
ge o
f pl
ans
with
em
ploy
er c
ontr
ibut
ions
Value of employer contributions as a percentage of wages
Average 4.8% (median 4.0%)
<3% 3% >3%–<4%
4% >4%–<5%
5% >5%–<10%
10%+
Source: Vanguard, 2019.

Vanguard Retirement Plan Access > 7
Figure 7. Automatic enrollment design
Vanguard Retirement Plan Access defined contribution plans permitting employee-elective deferrals
2014 2015 2016 2017 2018
All All All All All Established Start-up
Automatic enrollment adoption
Number of plans (n) 479 697 977 1,315 1,685 1,252 433
Percentage of plans 18% 16% 15% 15% 15% 16% 14%
Default automatic enrollment rate
1 percent 3% 3% 3% 3% 4% 4% 4%
2 percent 9 9 7 7 7 7 6
3 percent 62 59 57 54 50 51 47
4 percent 9 9 9 9 10 10 10
5 percent 10 10 11 13 13 12 16
6 percent or more 7 10 13 14 16 16 17
Default automatic increase rate
1 percent 37% 35% 37% 37% 38% 39% 35%
2 percent 1 1 1 1 1 1 1
3 percent 0 <0.5 <0.5 <0.5 <0.5 <0.5 0
Not offered 62 64 62 62 61 60 64
Default fund
Target-date fund 95% 96% 97% 97% 97% 97% 98%
Other balanced fund 4 3 2 2 2 2 1
Model portfolio 1 1 1 1 1 1 1
Money market or stable value fund <0.5 <0.5 <0.5 <0.5 <0.5 <0.5 0
Source: Vanguard, 2019.
Figure 8. Participation rates
Vanguard Retirement Plan Access defined contribution plans permitting employee-elective deferrals
Plan-weighted Participant-weighted
73% 72%
83%
64%
82%
65%
100%
0% 2014 2015 2016 2017 Voluntary
enrollment2018
71% 72% 72%
60%63%61%
2018 Automaticenrollment
2018
70%
54%
Source: Vanguard, 2019.

8 > Vanguard Retirement Plan Access
Participation rates by employee demographicsParticipation rates vary considerably by employee demographics (Figure 9). Income is one of the primary determinants of plan participation rates. Only 36% of eligible employees with income of less than $30,000 contributed to their employer’s DC plan in 2018, while 86% of employees with income of more than $100,000 elected to participate. Even among the highest-paid employees, 14% of eligible workers still failed to take advantage of their employer’s DC plan.
Participation rates were lowest for employees younger than 25. Only 35% of employees younger than 25 made deferrals to their employer’s plan in 2018, while 6 in 10 eligible employees between ages 45 and 64 saved for retirement in their employer’s plan. Tenure had a significant influence on plan participation. In 2018, only 44% of employees with less than two years on the job participated in their employer’s plan, while 8 in 10 employees with tenure of ten years or more participated.
Figure 9. Participation rates by participant demographics
Vanguard Retirement Plan Access defined contribution plans permitting employee-elective deferrals
2014 2015 2016 2017 2018
All All All All AllVoluntary
enrollmentAutomatic
enrollment
All 65% 64% 61% 63% 60% 54% 82%
Income
<$30,000 49% 45% 39% 41% 36% 29% 69%
$30,000–$49,999 66 64 62 62 61 56 85
$50,000–$74,999 77 71 74 74 74 70 90
$75,000–$99,999 82 80 79 81 80 77 92
$100,000+ 86 86 85 86 86 84 93
Age
<25 48% 45% 38% 39% 35% 25% 68%
25–34 63 61 58 60 58 51 82
35–44 66 65 63 65 62 57 84
45–54 69 69 67 67 64 60 84
55–64 70 71 70 70 66 62 85
65+ 60 60 60 59 55 52 76
Gender
Male 67% 65% 63% 63% 63% 57% 82%
Female 64 63 61 64 59 54 83
Job tenure (years)
0–1 58% 55% 47% 48% 44% 33% 75%
2–3 61 62 62 63 62 56 88
4–6 65 66 69 69 68 64 90
7–9 70 70 72 73 73 70 93
10+ 78 78 79 80 80 78 93
Source: Vanguard, 2019.

Vanguard Retirement Plan Access > 9
Impact of automatic enrollment on plan participationEmployees subjected to an automatic enrollment feature have an overall participation rate of 82%, compared with a participation rate of only 54% for employees hired under plans with voluntary enrollment.
Plans with automatic enrollment have higher participation rates across all demographic variables. For individuals earning less than $30,000 in plans
with automatic enrollment, the participation rate is more than double that of plans with voluntary enrollment.
Participation rates also vary by industry group (Figure 10). Employees in the law firm group had the highest participation rate, with more than three-quarters of workers participating in their employer’s plan. Employees in the ambulatory health care group had the lowest participation rate at 44%.
Figure 10. Participation rates by industry sector, 2018
Vanguard Retirement Plan Access defined contribution plans permitting employee-elective deferrals
Plan- weighted
Participant- weighted
Voluntary enrollment
Automatic enrollment
Overall 72% 60% 54% 82%
Industry group
Law firms 78% 78% 77% 82%
Architectural, engineering, and related services 80 74 71 83
Technology 75 74 67 89
Finance, insurance, and real estate 76 66 62 84
Wholesale and retail trade 69 62 58 71
Manufacturing 68 62 58 79
Agriculture, mining, and construction 66 60 55 79
Transportation, utilities, and communications 69 57 55 70
Business, professional, and nonprofit 73 55 49 85
Education and health 61 48 42 82
Media, entertainment, and leisure 60 48 37 83
Ambulatory health care 71 44 40 82
Source: Vanguard, 2019.

10 > Vanguard Retirement Plan Access
Contributions
Employee deferralsIn a typical DC plan, employees are the main source of funding, while employer contributions play a secondary role. Thus, the level of participant deferrals is a critical determinant of whether the DC plan will generate an adequate level of savings for retirement. VRPA deferral rates are drawn from recordkeeping data and exclude eligible employees not contributing to their plans.
VRPA participants saved 7.1% of their income, on average, in their employers’ plans in 2018 (Figure 11). The median participant deferral rate was 5.1%, meaning that half of participants were saving above this rate and half were saving below it. Plans with voluntary enrollment have average deferral rates that are 23% higher and median deferral rates that are 12% higher than plans with automatic enrollment.
Deferral rates by participant demographicsAs with plan participation rates, participant demographics have a strong influence on deferral rates (Figure 12). Income is the primary determinant of deferral rates, which generally rise with income, but then decline as highly paid participants reach either the statutory maximum contribution level
or plan-imposed caps on contributions related to nondiscrimination testing. The statutory maximum contribution was $18,500 ($24,500 for participants 50 and older), and a highly compensated employee was one who earned $120,000 or more in 2017 (based on the prior year for 2018).
In 2018, participants with incomes between $30,000 and $49,999 had deferral rates averaging 5.8%, while participants earning $75,000 to $99,999 had deferral rates of 7.8%—a savings rate that is about one-third higher. Deferral rates were 8.1% for participants earning $100,000 or more. Participants in the VRPA population earning less than $30,000 have higher deferral rates averaging 7.2%. However, a minority of these participants (3%) have very high deferral rates. When we exclude participants deferring more than 50%, then participants earning less than $30,000 had deferral rates averaging 5.5%.
Age is another important variable influencing savings. In 2018, deferral rates were lowest for participants younger than 25. This group saved only 5.2% of income. Deferral rates for participants ages 55 to 64 were nearly three-quarters higher, averaging 8.9%. Deferral rates also rose directly with employee tenure.
Figure 11. Deferral rates
Vanguard Retirement Plan Access defined contribution plans permitting employee-elective deferrals
Average Median
6.7%6.1%
5.0%
10%
0%
6.7%
5.0% 5.0% 5.0% 5.1%
2014 2015 2016 2017 Voluntaryenrollment
2018
6.9% 7.1% 7.1%
5.1%
2018 Automaticenrollment
2018
7.5%
5.6%
Source: Vanguard, 2019.

Vanguard Retirement Plan Access > 11
Impact of automatic enrollmentPlan design, specifically the predominant use of a 3% default deferral rate, means participants enrolled in plans through automatic enrollment are saving less. Participants joining a plan under an automatic enrollment feature have an average deferral rate of 6.1%, compared with 7.5% for participants joining plans under voluntary enrollment—a deferral rate that is 19% lower. This is especially remarkable in light of the fact that participants earning less than $30,000 save
twice as much, on average, under voluntary enrollment designs. This suggests that higher default deferral rates would be amenable to plan participants in automatic enrollment designs.
Our research on automatic enrollment indicates that “quit rates” do not deteriorate when higher default percentages are used to enroll employees.2
Figure 12. Deferral rates by participant demographics
Vanguard Retirement Plan Access defined contribution plans permitting employee-elective deferrals
2014 2015 2016 2017 2018
All All All All AllVoluntary
enrollmentAutomatic
enrollment
All 6.7% 6.7% 6.9% 7.1% 7.1% 7.5% 6.1%
Income
<$30,000 6.3% 5.9% 6.8% 7.4% 7.2% 9.2% 4.5%
$30,000–$49,999 5.4 5.4 5.5 5.8 5.8 6.2 4.8
$50,000–$74,999 6.6 6.5 6.5 6.7 6.7 6.9 6.1
$75,000–$99,999 7.7 7.6 7.6 7.8 7.8 8.0 7.3
$100,000+ 7.8 8.0 8.0 8.1 8.1 8.2 7.8
Age
<25 4.8% 4.6% 4.9% 5.2% 5.2% 5.9% 4.5%
25–34 5.5 5.5 5.7 5.9 5.9 6.2 5.4
35–44 6.3 6.2 6.4 6.6 6.5 6.8 5.9
45–54 7.1 7.2 7.3 7.6 7.5 7.8 6.7
55–64 8.5 8.6 8.7 9.0 8.9 9.1 7.9
65+ 10.5 10.5 10.4 10.6 10.6 10.9 9.0
Gender
Male 6.7% 6.7% 6.9% 7.1% 7.1% 7.4% 6.2%
Female 6.6 6.6 6.8 7.2 7.2 7.6 6.1
Job tenure (years)
0–1 5.5% 5.3% 5.6% 6.0% 5.9% 6.7% 5.0%
2–3 6.3 6.5 6.5 6.6 6.7 6.9 6.3
4–6 6.9 6.9 6.9 7.2 7.1 7.2 6.8
7–9 7.1 7.2 7.4 7.7 7.6 7.6 7.8
10+ 8.1 8.4 8.3 8.6 8.7 8.6 8.8
Source: Vanguard, 2019.
2 For an in-depth analysis of automatic enrollment, see Clark, Jeffrey W., and Jean A. Young, 2018, Automatic enrollment: The power of the default, Vanguard research, institutional.vanguard.com

12 > Vanguard Retirement Plan Access
Deferral rates also vary—by about 40%—by industry group (Figure 13). Participants in the law firm group had the highest median deferral rates in 2018. Participants in the media, entertainment, and leisure group had the lowest deferral rates.
Maximum contributorsDuring 2018, only 11% of participants saved the statutory maximum dollar amount of $18,500 ($24,500 for participants age 50 and older) (Figure 14). Participants who contributed the maximum dollar amount tended to have higher incomes, were older, had longer tenures with their current employer, and
had accumulated substantially higher account balances. Nearly 1 in 5 participants were saving 10% or more from their income.
Catch-up contributionsNearly all VRPA plans offered catch-up contributions in 2018. Only 18% of age-50-and-older participants eligible for catch-up contributions took advantage of this feature in 2018. The characteristics of participants making catch-up contributions are similar to those of participants making the maximum contribution to their plan. They tended to have higher incomes and had accumulated substantially higher account balances.
Figure 13. Deferral rates by industry sector, 2018
Vanguard Retirement Plan Access defined contribution plans permitting employee-elective deferrals
Average Median
Voluntary enrollment
average
Automatic enrollment
average
Overall 7.1% 5.1% 7.5% 6.1%
Industry group
Law firms 8.4% 6.2% 8.6% 7.3%
Architectural, engineering, and related services 7.8 6.0 8.4 6.1
Technology 7.8 6.0 8.1 7.3
Finance, insurance, and real estate 7.1 5.8 7.5 6.1
Business, professional, and nonprofit 7.3 5.3 7.6 6.2
Ambulatory health care 7.8 5.0 8.3 5.2
Agriculture, mining, and construction 6.9 5.0 7.2 6.1
Education and health 6.6 5.0 7.0 5.3
Wholesale and retail trade 6.4 5.0 7.0 5.3
Manufacturing 6.2 5.0 6.5 5.3
Transportation, utilities, and communications 5.7 4.8 6.0 4.9
Media, entertainment, and leisure 6.0 4.4 7.0 4.7
Source: Vanguard, 2019.

Vanguard Retirement Plan Access > 13
Roth contributionsAt year-end 2018, the Roth feature was offered by 8 in 10 VRPA plans and had been adopted by 16% of participants in plans offering the feature.
After-tax contributionsAfter-tax employee-elective deferrals are available to participants in only 3% of VRPA plans. In 2018, 1% of participants offered the after-tax deferral feature took advantage of it.
Figure 14. Other employee contribution data
Vanguard Retirement Plan Access defined contribution plans permitting employee-elective deferrals
2014 2015 2016 2017 2018
All All All All All Established Start-up
Percentage of participants reaching 402(g) limit 11% 12% 12% 12% 11% 12% 10%
Percentage of participants deferring more than 10% 18 18 19 19 19 19 19
Percentage of plans offering catch-up >99.5 >99.5 >99.5 >99.5 >99.5 >99.5 >99.5
Percentage of participants using catch-up if offered 18 18 17 17 18 19 16
Percentage of plans offering Roth 75 76 78 81 82 80 89
Percentage of participants using Roth if offered 14 14 15 15 16 16 16
Percentage of plans offering traditional after-tax 2 3 3 3 3 4 1
Percentage of participants using traditional after-tax if offered 1 1 <0.5 1 1 <0.5 2
Source: Vanguard, 2019.
14 > Vanguard Retirement Plan Access
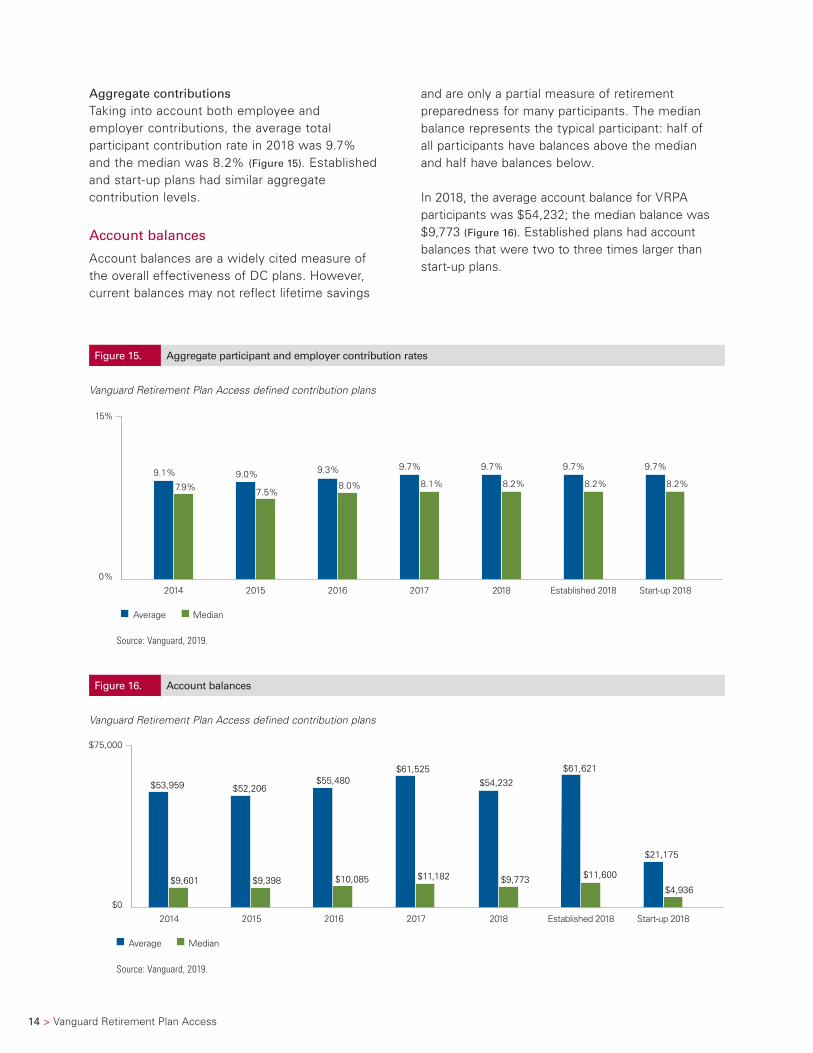
Aggregate contributionsTaking into account both employee and employer contributions, the average total participant contribution rate in 2018 was 9.7% and the median was 8.2% (Figure 15). Established and start-up plans had similar aggregate contribution levels.
Account balances
Account balances are a widely cited measure of the overall effectiveness of DC plans. However, current balances may not reflect lifetime savings
and are only a partial measure of retirement preparedness for many participants. The median balance represents the typical participant: half of all participants have balances above the median and half have balances below.
In 2018, the average account balance for VRPA participants was $54,232; the median balance was $9,773 (Figure 16). Established plans had account balances that were two to three times larger than start-up plans.
Figure 15. Aggregate participant and employer contribution rates
Vanguard Retirement Plan Access defined contribution plans
8.2%
9.7%
Average Median
9.1% 9.0%9.7%
8.2%
15%
0%
7.9% 7.5% 8.0% 8.1%
2014 2015 2016 2017 Established 2018
9.3% 9.7% 9.7%
8.2%
2018 Start-up 2018
Source: Vanguard, 2019.
Figure 16. Account balances
Vanguard Retirement Plan Access defined contribution plans
$54,232
$9,773
Average Median
$75,000
$02014 2015 2016 2017 Established 20182018 Start-up 2018
$53,959 $52,206 $55,480
$61,525 $61,621
$21,175
$9,601 $9,398 $10,085 $11,182 $11,600
$4,936
Source: Vanguard, 2019.
Vanguard Retirement Plan Access > 15
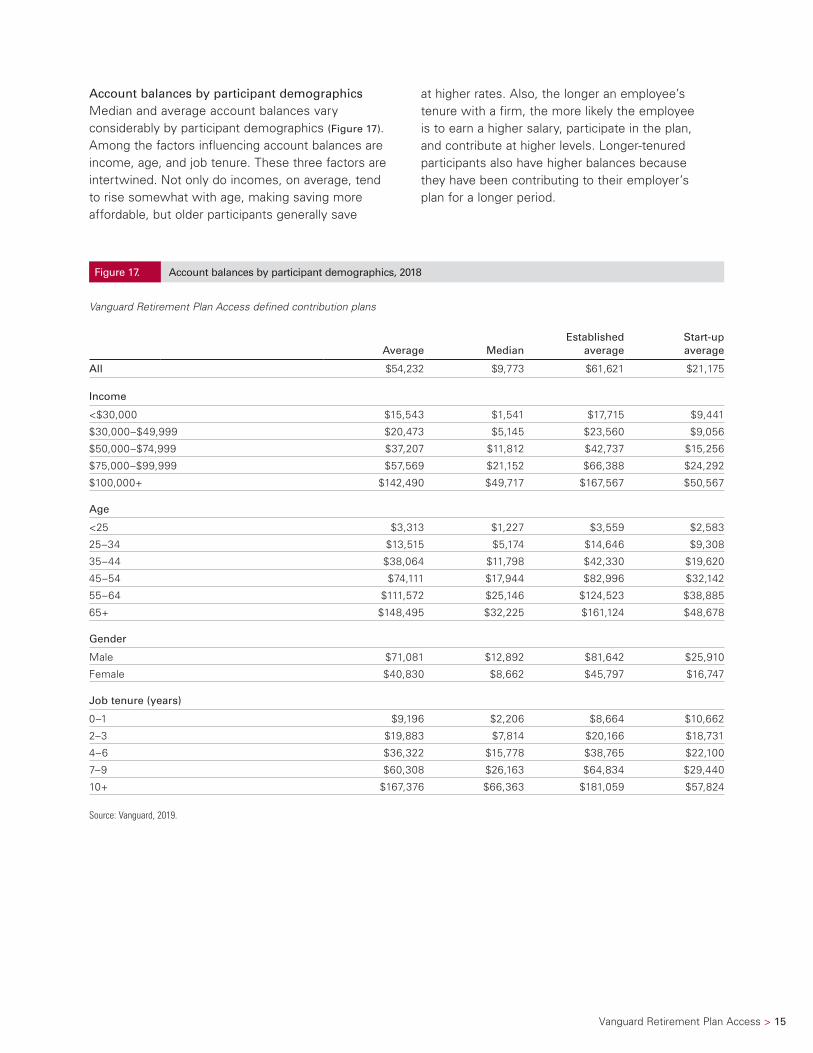
Account balances by participant demographicsMedian and average account balances vary considerably by participant demographics (Figure 17). Among the factors influencing account balances are income, age, and job tenure. These three factors are intertwined. Not only do incomes, on average, tend to rise somewhat with age, making saving more affordable, but older participants generally save
at higher rates. Also, the longer an employee’s tenure with a firm, the more likely the employee is to earn a higher salary, participate in the plan, and contribute at higher levels. Longer-tenured participants also have higher balances because they have been contributing to their employer’s plan for a longer period.
Figure 17. Account balances by participant demographics, 2018
Vanguard Retirement Plan Access defined contribution plans
Average MedianEstablished
averageStart-up average
All $54,232 $9,773 $61,621 $21,175
Income
<$30,000 $15,543 $1,541 $17,715 $9,441
$30,000–$49,999 $20,473 $5,145 $23,560 $9,056
$50,000–$74,999 $37,207 $11,812 $42,737 $15,256
$75,000–$99,999 $57,569 $21,152 $66,388 $24,292
$100,000+ $142,490 $49,717 $167,567 $50,567
Age
<25 $3,313 $1,227 $3,559 $2,583
25–34 $13,515 $5,174 $14,646 $9,308
35–44 $38,064 $11,798 $42,330 $19,620
45–54 $74,111 $17,944 $82,996 $32,142
55–64 $111,572 $25,146 $124,523 $38,885
65+ $148,495 $32,225 $161,124 $48,678
Gender
Male $71,081 $12,892 $81,642 $25,910
Female $40,830 $8,662 $45,797 $16,747
Job tenure (years)
0–1 $9,196 $2,206 $8,664 $10,662
2–3 $19,883 $7,814 $20,166 $18,731
4–6 $36,322 $15,778 $38,765 $22,100
7–9 $60,308 $26,163 $64,834 $29,440
10+ $167,376 $66,363 $181,059 $57,824
Source: Vanguard, 2019.

16 > Vanguard Retirement Plan Access
There are significant variations in account balances by industry sector, which reflect a complex mixture of firm characteristics (influencing employer contributions) and workforce demographics (influencing participant savings rates). Participants employed in the law firm group have average and
median account balances that are more than two times higher than other participants (Figure 18). Participants employed in the media, entertainment, and leisure and education and health groups have the lowest average and median account balances.
Figure 18. Account balances by industry sector, 2018
Vanguard Retirement Plan Access defined contribution plans
Average MedianEstablished
averageStart-up average
Overall $54,232 $9,773 $61,621 $21,175
Industry group
Law firms $126,589 $21,155 $135,507 $52,836
Architectural, engineering, and related services $64,694 $15,002 $68,908 $30,590
Finance, insurance, and real estate $65,876 $13,490 $74,801 $24,240
Technology $43,652 $12,464 $51,315 $22,092
Business, professional, and nonprofit $48,378 $9,559 $55,625 $19,357
Agriculture, mining, and construction $54,624 $9,478 $61,598 $15,786
Manufacturing $46,608 $9,008 $50,523 $21,398
Ambulatory health care $81,152 $8,936 $90,002 $22,457
Wholesale and retail trade $47,981 $8,038 $53,009 $19,292
Transportation, utilities, and communications $33,783 $6,218 $34,486 $31,640
Education and health $28,641 $5,995 $30,803 $17,834
Media, entertainment, and leisure $31,025 $5,284 $34,371 $11,676
Source: Vanguard, 2019.
Figure 19. Plan asset allocation summary
Vanguard Retirement Plan Access defined contribution plans
40%
39%
7% 8% 5%
39%
41%
6% 7% 6%
38%
42%
6% 7% 6%
38%
44%
5% 6% 5%
37%
45%
5% 7% 5%
37%
44%
5% 7% 6%
33%
56%
4% 4%
100%
0% 2014
73%equities
72%equities
71%equities
73%equities
72%equities
72%equities
76%equities
2015 2016 2017 Established 20182018 Start-up 2018
Brokerage Company stock Diversi�ed equity funds
Cash
Other balanced funds
Bond funds
Target-date funds
Source: Vanguard, 2019.
Vanguard Retirement Plan Access > 17
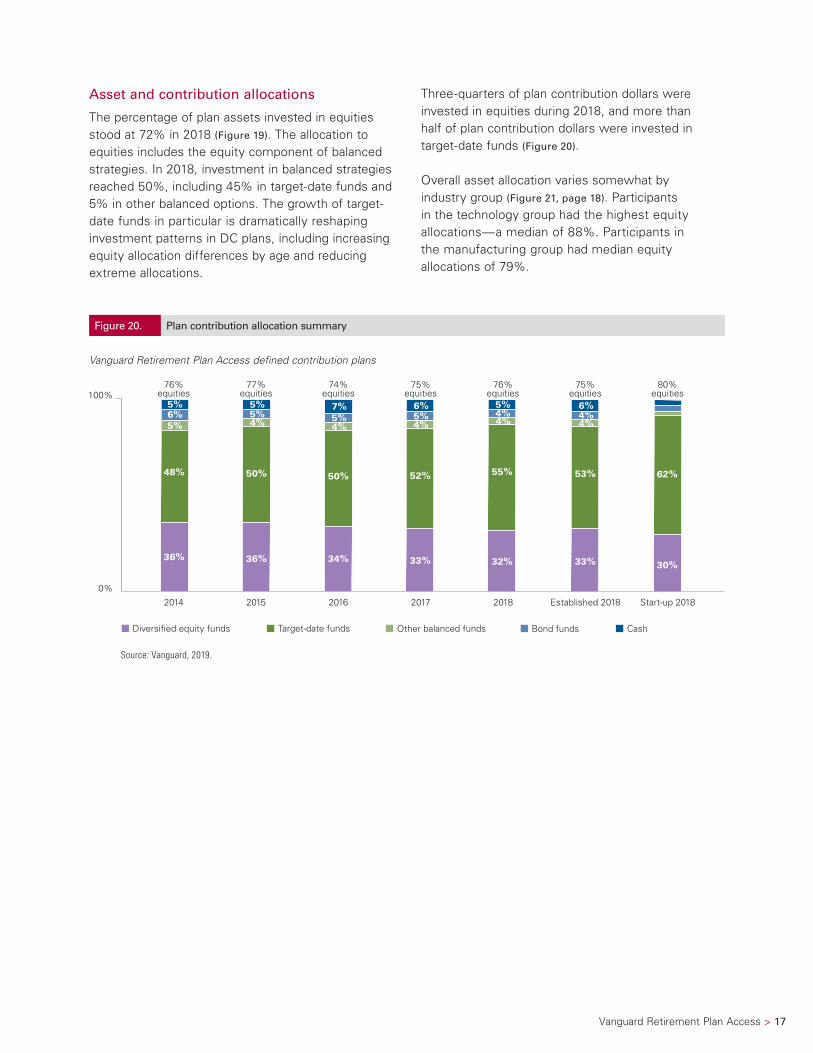
Asset and contribution allocations
The percentage of plan assets invested in equities stood at 72% in 2018 (Figure 19). The allocation to equities includes the equity component of balanced strategies. In 2018, investment in balanced strategies reached 50%, including 45% in target-date funds and 5% in other balanced options. The growth of target-date funds in particular is dramatically reshaping investment patterns in DC plans, including increasing equity allocation differences by age and reducing extreme allocations.
Three-quarters of plan contribution dollars were invested in equities during 2018, and more than half of plan contribution dollars were invested in target-date funds (Figure 20).
Overall asset allocation varies somewhat by industry group (Figure 21, page 18). Participants in the technology group had the highest equity allocations—a median of 88%. Participants in the manufacturing group had median equity allocations of 79%.
Figure 20. Plan contribution allocation summary
Vanguard Retirement Plan Access defined contribution plans
36% 36% 34% 33% 32% 33% 30%
48% 50% 50% 52% 55% 53% 62%
5% 4% 4% 4% 4% 4% 6% 5% 5% 5% 4% 4% 5% 5% 7% 6% 5% 6%
100%
0% 2014 2015 2016 2017 Established 20182018 Start-up 2018
Diversi�ed equity funds Target-date funds Other balanced funds Bond funds Cash
76%equities
77%equities
74%equities
75%equities
76%equities
75%equities
80%equities
Source: Vanguard, 2019.

18 > Vanguard Retirement Plan Access
Figure 21. Asset allocation by industry sector, 2018
Vanguard Retirement Plan Access defined contribution plans
BrokerageCompany
stock
Diversified equity funds
Target- date
funds
Other balanced
fundsBond funds Cash
Average equity
participant-weighted
Median equity
participant-weighted
All asset-weighted 1% <0.5% 37% 45% 5% 7% 5%
Industry group
Technology 1% 0% 37% 49% 3% 5% 5% 80% 88%
Business, professional, and nonprofit 1 0 38 44 5 7 5 77 87
Media, entertainment, and leisure 1 0 32 53 5 4 5 77 86
Architectural, engineering, and related services 1 0 39 44 5 6 5 77 84
Finance, insurance, and real estate 1 1 45 35 4 8 6 76 84
Wholesale and retail trade <0.5 0 34 47 6 6 7 75 84
Transportation, utilities, and communications <0.5 0 35 47 6 6 6 75 84
Ambulatory health care 3 0 34 44 6 8 5 74 84
Agriculture, mining, and construction 1 0 34 49 5 6 5 74 83
Law firms 3 0 39 38 6 8 6 73 83
Education and health 1 0 30 56 4 5 4 74 82
Manufacturing <0.5 0 34 47 6 6 7 72 79
Source: Vanguard, 2019.
Vanguard Retirement Plan Access > 19
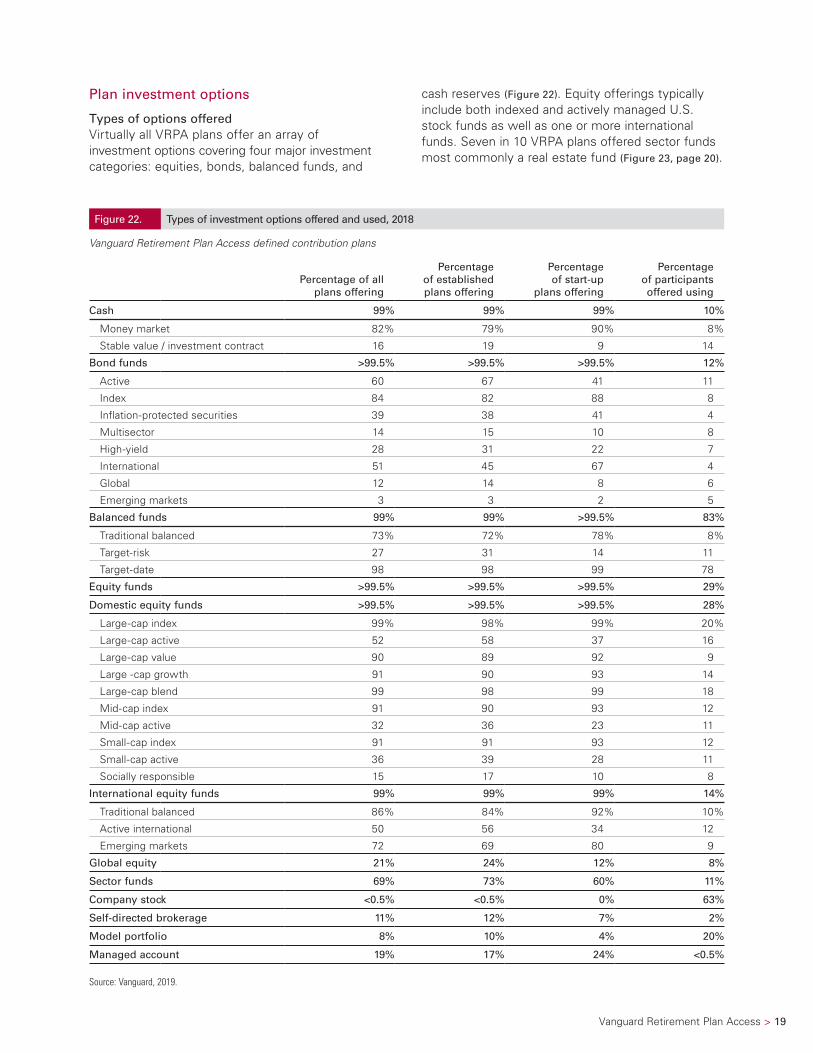
Plan investment options
Types of options offeredVirtually all VRPA plans offer an array of investment options covering four major investment categories: equities, bonds, balanced funds, and
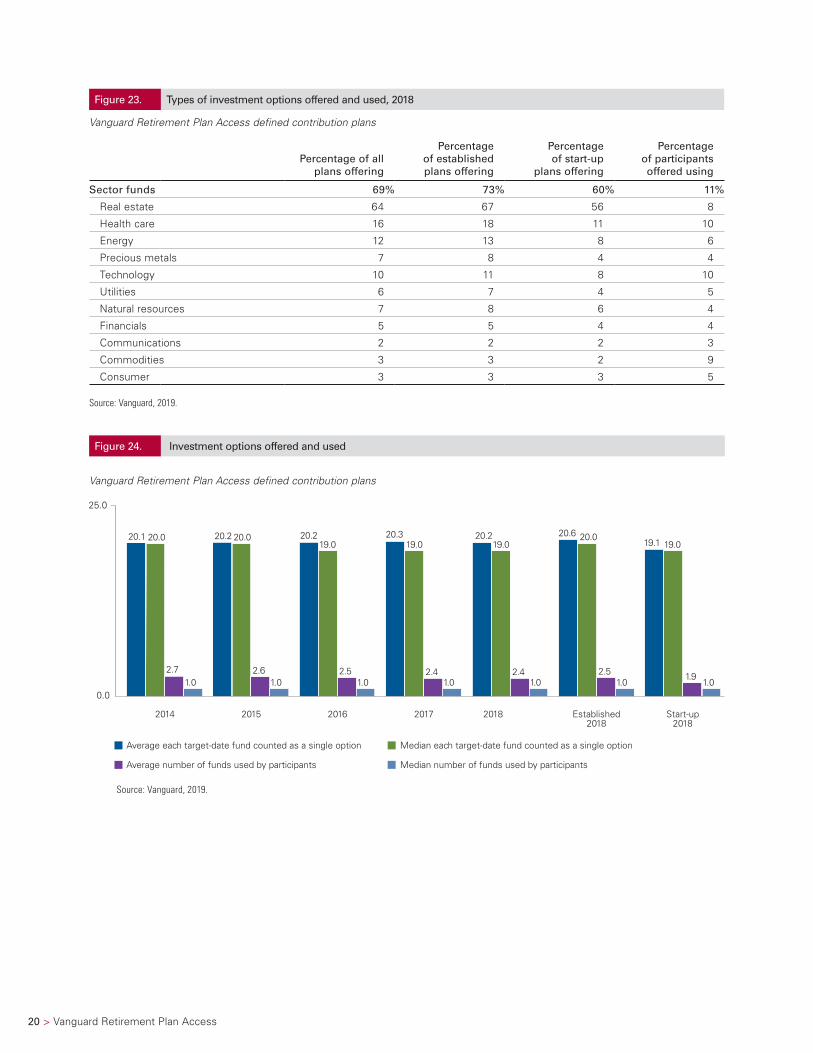
cash reserves (Figure 22). Equity offerings typically include both indexed and actively managed U.S. stock funds as well as one or more international funds. Seven in 10 VRPA plans offered sector funds most commonly a real estate fund (Figure 23, page 20).
Figure 22. Types of investment options offered and used, 2018
Vanguard Retirement Plan Access defined contribution plans
Percentage of all plans offering
Percentage of established plans offering
Percentage of start-up
plans offering
Percentage of participants offered using
Cash 99% 99% 99% 10%
Money market 82% 79% 90% 8%
Stable value / investment contract 16 19 9 14
Bond funds >99.5% >99.5% >99.5% 12%
Active 60 67 41 11
Index 84 82 88 8
Inflation-protected securities 39 38 41 4
Multisector 14 15 10 8
High-yield 28 31 22 7
International 51 45 67 4
Global 12 14 8 6
Emerging markets 3 3 2 5
Balanced funds 99% 99% >99.5% 83%
Traditional balanced 73% 72% 78% 8%
Target-risk 27 31 14 11
Target-date 98 98 99 78
Equity funds >99.5% >99.5% >99.5% 29%
Domestic equity funds >99.5% >99.5% >99.5% 28%
Large-cap index 99% 98% 99% 20%
Large-cap active 52 58 37 16
Large-cap value 90 89 92 9
Large -cap growth 91 90 93 14
Large-cap blend 99 98 99 18
Mid-cap index 91 90 93 12
Mid-cap active 32 36 23 11
Small-cap index 91 91 93 12
Small-cap active 36 39 28 11
Socially responsible 15 17 10 8
International equity funds 99% 99% 99% 14%
Traditional balanced 86% 84% 92% 10%
Active international 50 56 34 12
Emerging markets 72 69 80 9
Global equity 21% 24% 12% 8%
Sector funds 69% 73% 60% 11%
Company stock <0.5% <0.5% 0% 63%
Self-directed brokerage 11% 12% 7% 2%
Model portfolio 8% 10% 4% 20%
Managed account 19% 17% 24% <0.5%
Source: Vanguard, 2019.
20 > Vanguard Retirement Plan Access
Figure 24. Investment options offered and used
Vanguard Retirement Plan Access defined contribution plans
20.219.0
2.41.0
Average each target-date fund counted as a single option Median each target-date fund counted as a single option
Average number of funds used by participants Median number of funds used by participants
20.1 20.2 20.320.019.0
20.0 19.1 19.0
2.7 2.6 2.4 1.91.0 1.0 1.0
20.6 20.0
2.51.0
20.219.0
2.51.0 1.0
25.0
0.0
2014 2015 2016 Established2018
2017 2018 Start-up2018
Source: Vanguard, 2019.
Figure 23. Types of investment options offered and used, 2018
Vanguard Retirement Plan Access defined contribution plans
Percentage of all plans offering
Percentage of established plans offering
Percentage of start-up
plans offering
Percentage of participants offered using
Sector funds 69% 73% 60% 11%
Real estate 64 67 56 8
Health care 16 18 11 10
Energy 12 13 8 6
Precious metals 7 8 4 4
Technology 10 11 8 10
Utilities 6 7 4 5
Natural resources 7 8 6 4
Financials 5 5 4 4
Communications 2 2 2 3
Commodities 3 3 2 9
Consumer 3 3 3 5
Source: Vanguard, 2019.

Vanguard Retirement Plan Access > 21
Number of options offered and usedThe average VRPA plan offered 20.2 investment options in 2018 (Figure 24). In the plan analysis of options offered, we count a series of target-date funds as one fund, since these funds are designed as a single-fund investment. Counting a target-date series as a single fund offering, the median plan sponsor offered 19 investment options in 2018. In 2018, 1 in 5 plans offered more than 25 distinct investment options, while 5% of plans offered 10 or fewer (Figure 25).
Despite the large number of funds available to them, participants tend to use only a few. On average, VRPA plan participants used 2.4 funds and the typical participant held just one fund. In the participant analysis of options used, we count each target-date fund used as a separate fund, rather than considering them to be one fund. This is because participants can, and some do, invest in multiple target-date funds.
Figure 25. Number of options offered, 2018
Vanguard Retirement Plan Access defined contribution plans
Target-date funds counted as one option
All Established
4%
15%
23%
<0.5%<0.5%4%
25%
15%
6% 7%
<0.5%4%
16% 17%
4%
12%14%
7%
40%
35%
52%
60%
0%
1–5 6–10 11–15 26–3016–20 21–25 31+
Start-up
Source: Vanguard, 2019.
22 > Vanguard Retirement Plan Access
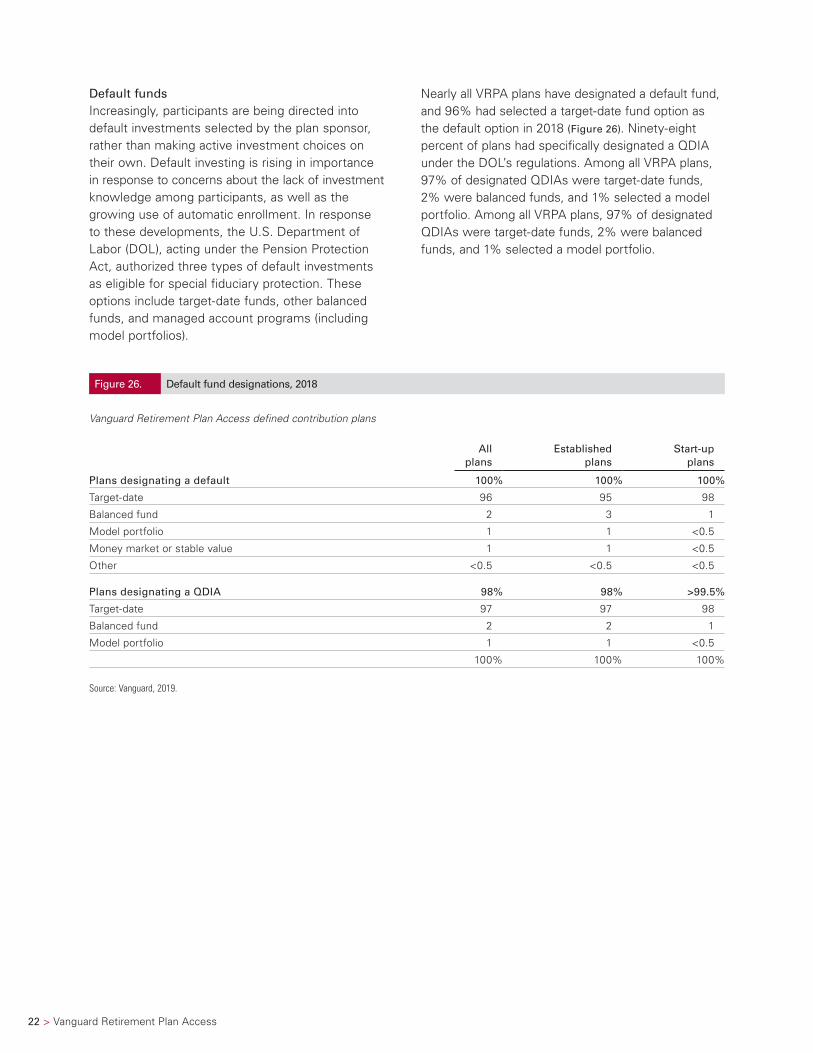
Default fundsIncreasingly, participants are being directed into default investments selected by the plan sponsor, rather than making active investment choices on their own. Default investing is rising in importance in response to concerns about the lack of investment knowledge among participants, as well as the growing use of automatic enrollment. In response to these developments, the U.S. Department of Labor (DOL), acting under the Pension Protection Act, authorized three types of default investments as eligible for special fiduciary protection. These options include target-date funds, other balanced funds, and managed account programs (including model portfolios).
Nearly all VRPA plans have designated a default fund, and 96% had selected a target-date fund option as the default option in 2018 (Figure 26). Ninety-eight percent of plans had specifically designated a QDIA under the DOL’s regulations. Among all VRPA plans, 97% of designated QDIAs were target-date funds, 2% were balanced funds, and 1% selected a model portfolio. Among all VRPA plans, 97% of designated QDIAs were target-date funds, 2% were balanced funds, and 1% selected a model portfolio.
Figure 26. Default fund designations, 2018
Vanguard Retirement Plan Access defined contribution plans
All plans
Established plans
Start-up plans
Plans designating a default 100% 100% 100%
Target-date 96 95 98
Balanced fund 2 3 1
Model portfolio 1 1 <0.5
Money market or stable value 1 1 <0.5
Other <0.5 <0.5 <0.5
Plans designating a QDIA 98% 98% >99.5%
Target-date 97 97 98
Balanced fund 2 2 1
Model portfolio 1 1 <0.5
100% 100% 100%
Source: Vanguard, 2019.

Vanguard Retirement Plan Access > 23
Professionally managed allocations
The most notable effect of plan investment menus on participant choices is the expanded offering and use of professionally managed allocations. Participants with professionally managed allocations are those who have their entire account balance invested solely in a single target-date fund, traditional balanced fund, a model portfolio, or a managed account program.
In 2018, two-thirds of VRPA participants were invested in a professionally managed allocation (Figure 27). Driving this development is the growing use of target-date funds. A total of 61% of participants were invested in a single target-date fund in 2018.
Among new plan entrants (those entering the plan for the first time), three-quarters of participants were invested in a single target-date fund.
Most VRPA plan sponsors chose to reenroll participants in a QDIA at conversion. As noted earlier in this report, VRPA was launched in 2011 and the majority of these plans converted between 2012 and 2018. Seven in 10 plans reenrolled participants in a QDIA at conversion and more than 95% using this strategy reenrolled on a target-date fund.
Figure 27. Participants with professionally managed allocations
Vanguard Retirement Plan Access defined contribution plans
65%
60%
Participants using a managed account or model portfolio
Participants holding a single balanced fund
60% 62% 62% 64% 66%
71%
80%
100%
0%
2014 2015 2016 Established2018
2017 2018 Start-up2018
New planentrants 2018
Participants holding a single target-date fund
54% 57% 57% 59% 61% 69%
77%
Perc
enta
ge o
f pa
rtic
ipan
ts
Source: Vanguard, 2019.

24 > Vanguard Retirement Plan Access
Target-date funds
Target-date funds base portfolio allocations on an expected retirement date; allocations grow more conservative as the participant approaches the fund’s target year. At year-end 2018, nearly all
VRPA participants were in plans offering target-date funds (Figure 28). Three-quarters of all participants had all or part of their account invested in target-date funds in 2018. Half of contribution dollars were directed to target-date funds in 2018.
Figure 28. Use of target-date funds
Vanguard Retirement Plan Access defined contribution plans
2014 2015 2016 2017 2018Established
2018Start-up
2018
Percentage of all plans offering target-date funds 97% 97% 98% 98% 98% 98% 99%
Percentage of recordkeeping assets in target-date funds 39 41 42 44 45 44 56
Percentage of all contributions directed to target-date funds 48 50 50 52 55 53 62
Percentage of all participants offered target-date funds 96 98 98 98 98 98 99
Percentage of all participants using target-date funds 73 75 75 76 78 77 83
Source: Vanguard, 2019.
Note: Investments in target-date funds are subject to the risks of their underlying funds. The year in the fund name refers to the approximate year (the target date) when an investor in the fund would retire and leave the workforce. The fund will gradually shift its emphasis from more aggressive investments to more conservative ones based on its target date. An investment in target-date funds is not guaranteed at any time, including on or after the target date.
Vanguard Retirement Plan Access > 25
Figure 29. Distribution of equity exposure
Vanguard Retirement Plan Access defined contribution plans
Participant-weighted balances
2014 2015 2016 2017 2018Established
2018Start-up
2018
Percentage of contributions to
equities 2018
Percentage of account balances
0% 3% 3% 4% 4% 3% 4% 2% 2%
1%–30% 2 2 3 3 3 3 1 3
31%–40% 2 2 1 1 2 2 2 2
41%–50% 3 3 3 3 2 2 1 2
51%–60% 9 8 8 7 10 10 9 10
61%–70% 10 10 15 14 11 12 9 11
71%–80% 12 18 12 11 11 11 10 11
81%–90% 45 41 42 44 45 44 51 45
91%–99% 6 6 5 6 6 5 6 6
100% 8 7 7 7 7 7 9 8
Average equity participant-weighted 76 77 75 75 76 75 79 77
Median equity participant-weighted 84 87 85 85 83 83 88 85
Source: Vanguard, 2019.
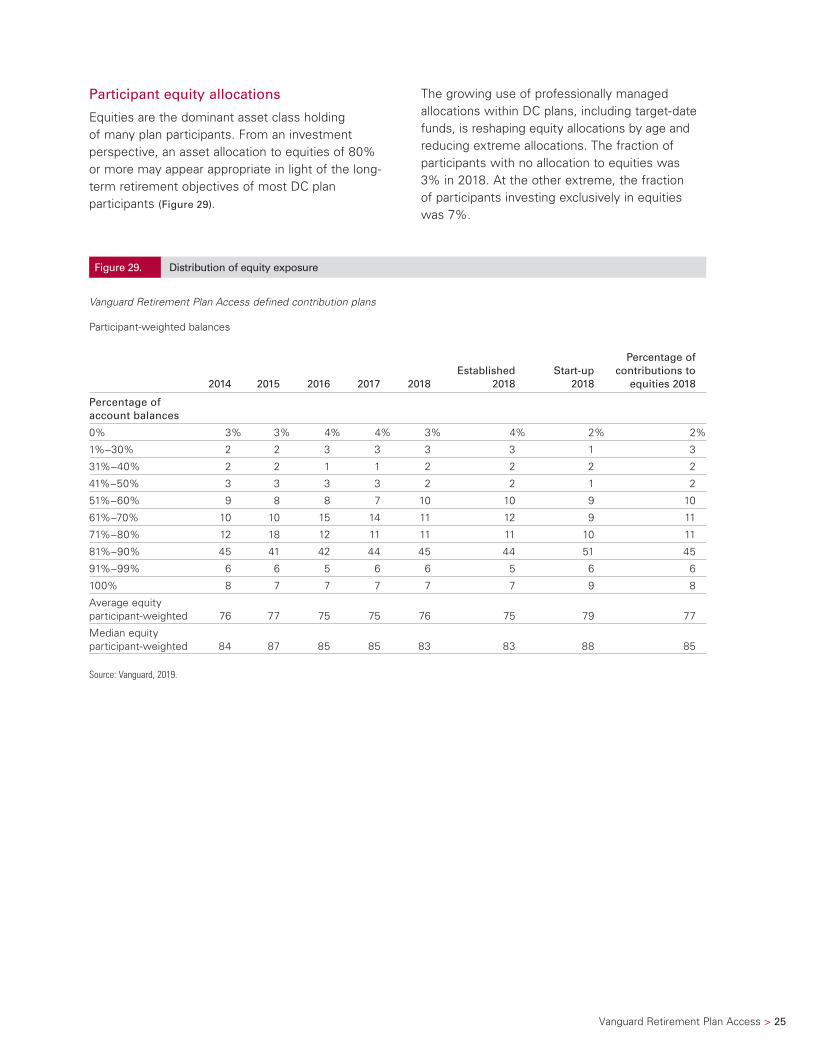
Participant equity allocations
Equities are the dominant asset class holding of many plan participants. From an investment perspective, an asset allocation to equities of 80% or more may appear appropriate in light of the long-term retirement objectives of most DC plan participants (Figure 29).
The growing use of professionally managed allocations within DC plans, including target-date funds, is reshaping equity allocations by age and reducing extreme allocations. The fraction of participants with no allocation to equities was 3% in 2018. At the other extreme, the fraction of participants investing exclusively in equities was 7%.

26 > Vanguard Retirement Plan Access
This rising use of professionally managed allocations is also improving portfolio construction (Figure 30). The fraction of participants holding broadly diversified portfolios was 79% in 2018. Less than 1% of VRPA participants were holding concentrated company stock positions.
Trading activity
Participant trading or exchange activity is the movement of existing account assets from one plan investment option to another. This transaction is distinct from a contribution allocation decision, in which participants decide how future contributions to the plan should be invested. Exchange activity is a proxy for a participant’s holding period
for investments, as well as a measure of the participant’s willingness to change their portfolio in response to short-term market volatility.
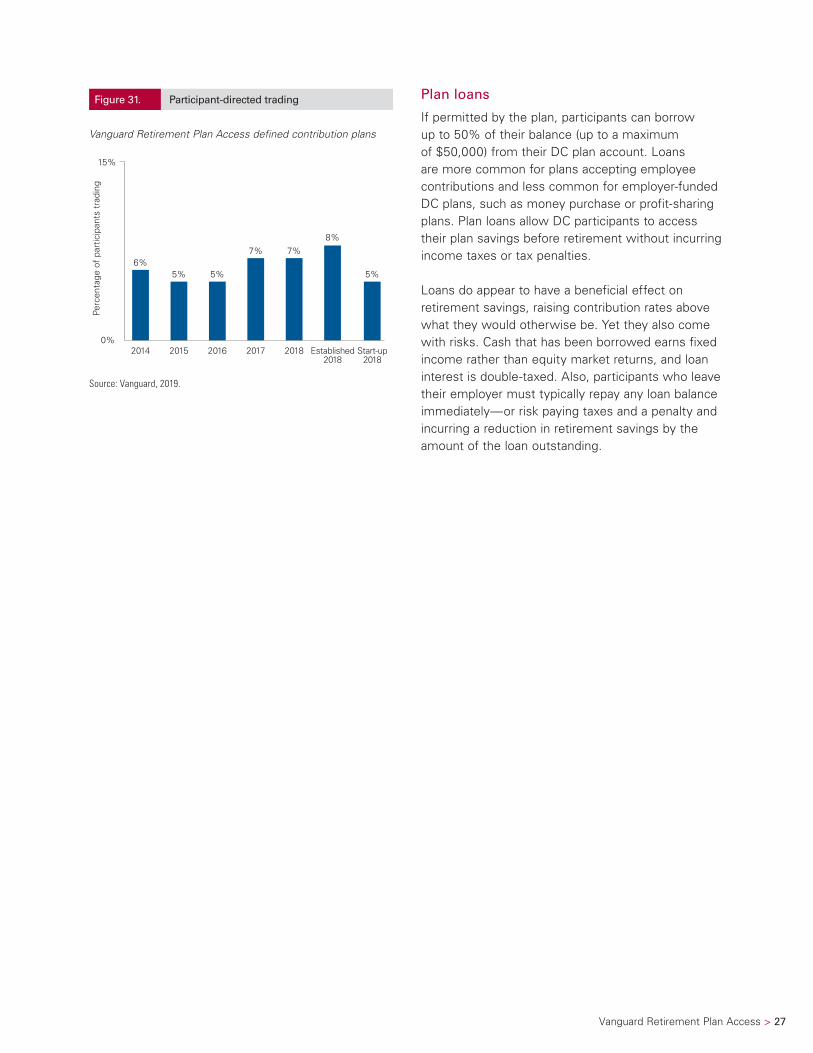
Daily trading is nearly universal for Vanguard DC plans, with virtually all plan sponsors allowing it. While assets can be traded daily, Vanguard and other investment companies serving DC plans typically have “round-trip” restrictions designed to thwart the minority of individual participants who seek to engage in active market-timing or day-trading. In 2018, only 7% of participants initiated one or more portfolio trades or exchanges during the year (Figure 31).
Figure 30. Participant portfolio construction
Vanguard Retirement Plan Access defined contribution plans
3%
5%
79%
13%
<0.5%
Zero equity
Conservative equity
Balanced strategies
Aggressive equity
Aggressive company stock
2014 2015 2016 2017 2018Established
2018Start-up
2018
Percentage participants using
Zero equity (0% equity and 0% company stock) 3% 3% 4% 3% 3% 4% 2%
Conservative equity (>0% and <40% equity) 4 4 4 4 5 5 3
Balanced strategies (40% to 90% equity and <20% company stock) 79 80 80 80 79 79 81
Aggressive equity (>90% equity) 14 13 12 13 13 12 14
Aggressive company stock (>20% company stock) <0.5 <0.5 <0.5 <0.5 <0.5 <0.5 0
Source: Vanguard, 2019.
Vanguard Retirement Plan Access > 27
Plan loans
If permitted by the plan, participants can borrow up to 50% of their balance (up to a maximum of $50,000) from their DC plan account. Loans are more common for plans accepting employee contributions and less common for employer-funded DC plans, such as money purchase or profit-sharing plans. Plan loans allow DC participants to access their plan savings before retirement without incurring income taxes or tax penalties.
Loans do appear to have a beneficial effect on retirement savings, raising contribution rates above what they would otherwise be. Yet they also come with risks. Cash that has been borrowed earns fixed income rather than equity market returns, and loan interest is double-taxed. Also, participants who leave their employer must typically repay any loan balance immediately—or risk paying taxes and a penalty and incurring a reduction in retirement savings by the amount of the loan outstanding.
Figure 31. Participant-directed trading
Vanguard Retirement Plan Access defined contribution plans
0%
15%
Perc
enta
ge o
f pa
rtic
ipan
ts t
radi
ng
6%5%5% 5%
8%7% 7%
2014 2015 2016 2017 2018 Established2018
Start-up2018
Source: Vanguard, 2019.

28 > Vanguard Retirement Plan Access
Loan availabilityLoans are widely offered by employee-contributory DC plans. In 2018, 7 in 10 VRPA 401(k) plans permitted participants to borrow from their plan and 77% of participants had access to a loan feature (Figure 32). Only 8% of VRPA participants offered a loan had a loan outstanding at year-end 2018.
On average, the outstanding loan account balance equaled 11% of the participant’s account balance including the loan, and the average participant had borrowed about $8,750. Participants in start-up plans
were least likely to have borrowed from their retirement plan account, but if they had borrowed, they borrowed 15% of their account balance. Outstanding loans are typically excluded from measures of plan and participant assets because these assets have, in effect, been withdrawn from the plan and are not currently available as a retirement resource. However, more than 90% of loans are repaid and outstanding loans represent participant and plan assets. Only about 1% of aggregate plan assets had been borrowed by participants.
Figure 32. Loans
Vanguard Retirement Plan Access defined contribution plans
Percentage of participants with loans if offered
Percentage of acount balance borrowed
9%8% 8% 8%
5%
8%
25%
0%
9%
12% 12%11%
10%11% 11%
15%
2014 2015 2016 2017 Established 20182018 Start-up 2018
2014 2015 2016 2017 2018Established
2018Start-up
2018
Percentage of all plans offering loans 71% 69% 70% 69% 69% 70% 67%
Percentage of participants offered loans 82 79 78 77 77 78 72
Percentage of recordkeeping assets borrowed 1 1 1 1 1 1 2
Average participant loan $8,409 $8,541 $8,648 $8,749 $8,751 $8,895 $7,593
Source: Vanguard, 2019.

Vanguard Retirement Plan Access > 29
Plan withdrawals
Plan withdrawals allow participants to access their plan savings before a job change or retirement. Withdrawals are optional plan provisions and availability varies from plan to plan. They can be classified into two categories. Hardship withdrawals allow participants to access a portion of their savings when they have a demonstrated financial hardship, such as receipt of an eviction or home foreclosure notice, but may also be used for such purposes as college education and purchase of a first home. Nonhardship withdrawals include both post-age-59½ withdrawals and other withdrawals. Post-age-59½ withdrawals allow participants age 59½ and older to access their savings while they are working and are exempt from the 10% penalty on premature
distributions. Some plans may also allow participants to withdraw employer profit-sharing contributions, after-tax contributions, or rollover assets while they are working.
Among VRPA DC plans in 2018, 85% allowed hardship withdrawals and nearly all allowed plan withdrawals for those who have reached age 59½ (Figure 33). In 2018, less than 1% (0.8%) of participants in plans offering any type of withdrawal used the feature, and the average portion of account balance withdrawn was 45%. Assets withdrawn totaled 1% of VRPA recordkeeping assets. Certain participants could, over time, jeopardize their retirement program if they continue to rely on this feature throughout their working careers.
Figure 33. Withdrawals
Vanguard Retirement Plan Access defined contribution plans
0.8%
45%
Percentage of participants with withdrawals if offered
Percentage of acount balance withdrawn
0.6% 0.7% 0.7% 0.8% 0.6%0.8%
60%
0%
48%
47%44%
38%
46%
40%
2014 2015 2016 2017 Established 20182018 Start-up 2018
2014 2015 2016 2017 2018Established
2018Start-up
2018
Percentage of all plans offering withdrawals 99% 99% >99.5% >99.5% >99.5% >99.5% >99.5%
Percentage of all plans offering hardship withdrawals 85 84 84 85 85 83 90
Percentage of all plans offering age 59½ withdrawals 99 99 99 99 >99.5 99 >99.5
Percentage of all plans offering employer contribution withdrawals 91 92 94 96 97 96 98
Percentage of all participants offered withdrawals >99.5 >99.5 >99.5 >99.5 >99.5 >99.5 >99.5
Percentage of recordkeeping assets withdrawn 1 1 1 1 1 1 1
Average participant withdrawal $23,034 $21,126 $22,277 $20,913 $27,545 $30,561 $8,844
Source: Vanguard, 2019.
30 > Vanguard Retirement Plan Access
Plan distributions and rollovers
When changing jobs or retiring, DC plan participants have the choice of preserving their savings for retirement (by retaining them in the plan or rolling them over to an IRA or another DC plan) or taking a cash lump sum (and spending or investing it). If they choose to roll over their savings to an IRA or another qualified retirement plan, participants avoid paying taxes on the accumulated balance. If participants spend the lump-sum distribution or invest it in a taxable account, they incur a possible income tax liability (and a 10% penalty if they are younger than 59½).
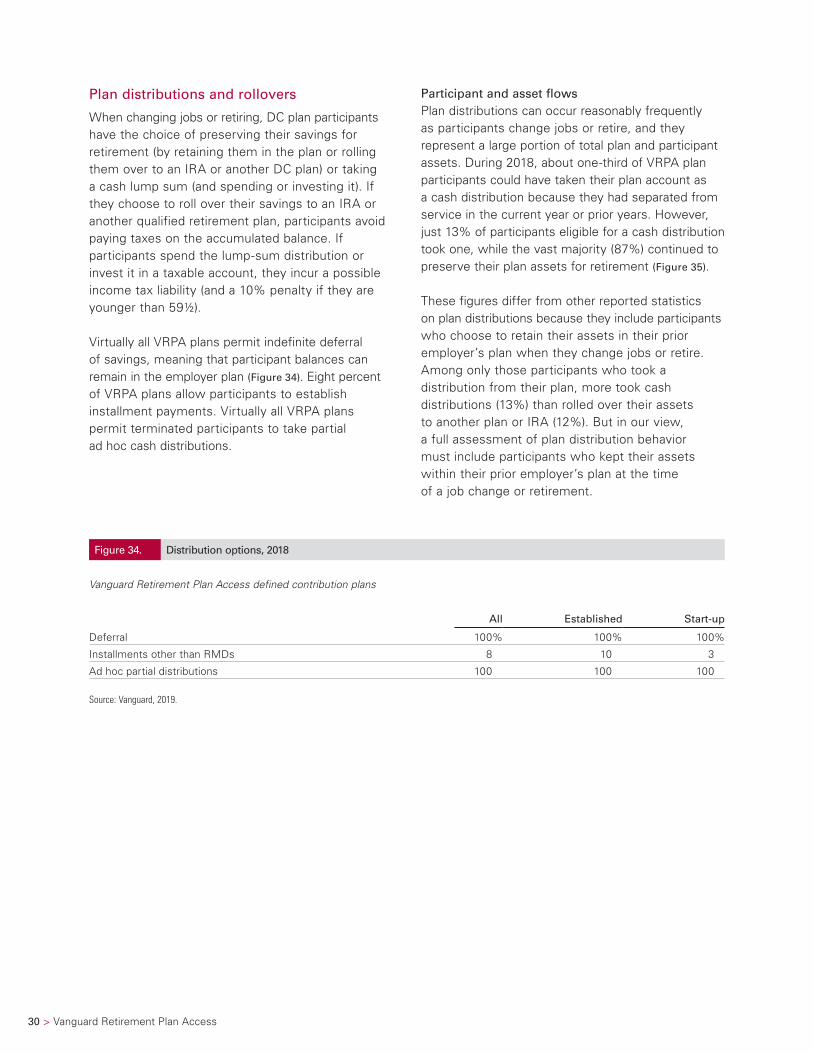
Virtually all VRPA plans permit indefinite deferral of savings, meaning that participant balances can remain in the employer plan (Figure 34). Eight percent of VRPA plans allow participants to establish installment payments. Virtually all VRPA plans permit terminated participants to take partial ad hoc cash distributions.
Participant and asset flowsPlan distributions can occur reasonably frequently as participants change jobs or retire, and they represent a large portion of total plan and participant assets. During 2018, about one-third of VRPA plan participants could have taken their plan account as a cash distribution because they had separated from service in the current year or prior years. However, just 13% of participants eligible for a cash distribution took one, while the vast majority (87%) continued to preserve their plan assets for retirement (Figure 35).
These figures differ from other reported statistics on plan distributions because they include participants who choose to retain their assets in their prior employer’s plan when they change jobs or retire. Among only those participants who took a distribution from their plan, more took cash distributions (13%) than rolled over their assets to another plan or IRA (12%). But in our view, a full assessment of plan distribution behavior must include participants who kept their assets within their prior employer’s plan at the time of a job change or retirement.
Figure 34. Distribution options, 2018
Vanguard Retirement Plan Access defined contribution plans
All Established Start-up
Deferral 100% 100% 100%
Installments other than RMDs 8 10 3
Ad hoc partial distributions 100 100 100
Source: Vanguard, 2019.

Vanguard Retirement Plan Access > 31
Figure 35. Plan distributions
Vanguard Retirement Plan Access defined contribution plans
87%
96%
Percentage of participants preserving assets
Percentage of assets preserved for retirement
85% 87% 88% 88%85%87%
100%
0%
96% 96% 97% 97% 96% 96%
2014 2015 2016 2017 Established 20182018 Start-up 2018
2014 2015 2016 2017 2018Established
2018Start-up
2018
Percentage of participants choosing
Remain in plan 73% 75% 77% 76% 75% 76% 75%
Rollover 12 12 11 11 12 12 10
Remain in plan and rollover <0.5 <0.5 <0.5 <0.5 <0.5 <0.5 <0.5
Installment payments <0.5 <0.5 <0.5 <0.5 <0.5 <0.5 0
Participants preserving assets 85 87 88 87 87 88 85
Cash lump sum 14 12 11 12 12 12 14
Rollover and cash 1 1 1 1 1 1 1
Percentage of assets available for distribution
Remain in plan 76% 74% 77% 78% 75% 75% 78%
Rollover 19 21 19 19 21 21 18
Remain in plan and rollover <0.5 <0.5 <0.5 <0.5 <0.5 <0.5 <0.5
Installment payments <0.5 <0.5 1 <0.5 <0.5 <0.5 <0.5
Assets preserved for retirement 96 96 97 97 96 96 96
Cash lump sum 3 3 2 2 3 3 3
Rollover and cash 1 1 1 1 1 1 1
Source: Vanguard, 2019.

32 > Vanguard Retirement Plan Access
Appendix
In this table, we provide a comparison of VRPA key statistics with the How America Saves population recordkept directly by Vanguard.
Vanguard Retirement Plan Access comparison with How America Saves
Vanguard Retirement Plan AccessHow America
Saves
2014 2015 2016 2017 2018 2018
Vanguard recordkeeping statistics
Number of participant accounts 125,136 199,242 273,045 370,414 489,625 5.0 million
Number of plans 2,666 4,452 6,506 8,873 11,263 1.9 thousand
Median participant age 42 42 42 42 42 44
Median participant tenure 4 4 4 4 4 7
Percentage male 56% 56% 57% 57% 57% 57%
Median eligible employee income (thousands) $47 $47 $49 $48 $45 $59*
Median participant income (thousands) $58 $59 $64 $63 $62 $70*
Median nonparticipant income (thousands) $29 $30 $30 $28 $22 $31*
1. Accumulating
Plan design
Plans offering immediate eligibility for employee contributions 23% 22% 21% 21% 22% 68%*
Plans providing an employer contribution 72% 72% 75% 75% 77% 95%*
Plans with automatic enrollment 18% 16% 15% 15% 15% 48%
Plans with automatic enrollment with automatic annual increases 38% 36% 38% 38% 39% 66%
Plans offering catch-up contributions >99.5% >99.5% >99.5% >99.5% >99.5% 98%
Plans offering Roth contributions 75% 76% 78% 81% 82% 71%
Plans offering after-tax contributions 2% 3% 3% 3% 3% 18%
Participation rates
Plan-weighted participation rate 73% 72% 71% 72% 72% 82%*
Participant-weighted participation rate 65% 64% 61% 63% 60% 74%*
Voluntary enrollment participant-weighted participation rate 59% 58% 57% 58% 54% 60%*
Automatic enrollment participant-weighted participation rate 89% 88% 82% 83% 82% 91%*
Participants using catch-up contributions (when offered) 18% 18% 17% 17% 18% 15%*
Participants using Roth (when offered) 14% 14% 15% 15% 16% 11%*
Participants using after-tax (when offered) 1% 1% <0.5% 1% 1% 8%*
Employee deferrals
Average participant deferral rate 6.7% 6.7% 6.9% 7.1% 7.1% 6.9%*
Median participant deferral rate 5.0% 5.0% 5.0% 5.1% 5.1% 6.0%*
Percentage of participants deferring more than 10% 18% 18% 19% 19% 19% 21%*
Voluntary enrollment plan average participant deferral rate 7.1% 7.2% 7.3% 7.6% 7.5% 7.1%*
Automatic enrollment plan average participant deferral rate 5.6% 5.5% 5.7% 6.0% 6.1% 6.7%*
Participants reaching 402(g) limit ($18,500 in 2018) 11% 12% 12% 12% 11% 13%*
Average total contribution rate (participant and employer) 9.1% 9.0% 9.3% 9.7% 9.7% 10.6%*
Median total contribution rate (participant and employer) 7.9% 7.5% 8.0% 8.1% 8.2% 9.9%*
Account balances
Average balance $53,959 $52,206 $55,480 $61,525 $54,232 $92,148
Median balance $9,601 $9,398 $10,085 $11,182 $9,773 $22,217

Vanguard Retirement Plan Access > 33
Vanguard Retirement Plan AccessHow America
Saves
2014 2015 2016 2017 2018 2018
2. Managing
Asset and contribution allocation
Average plan asset allocation to equities 73% 72% 71% 73% 72% 71%
Average plan contribution allocation to equities 76% 77% 74% 75% 76% 76%
Average plan asset allocation to target-date funds 39% 41% 42% 43% 45% 35%
Average plan contribution allocation to target-date funds 48% 50% 50% 52% 55% 57%
Participants with balanced strategies 79% 80% 80% 80% 79% 74%
Extreme participant asset allocations (100% fixed income or equity) 11% 10% 11% 11% 10% 9%
Plan investment options
Average number of funds offered 20.1 20.2 20.2 20.3 20.2 17.7
Average number of funds used 2.7 2.6 2.5 2.4 2.4 2.5
Percentage of plans designating a QDIA 98% 98% 98% 98% 98% 84%
Among all plans designating a QDIA, percentage target-date fund 96% 96% 97% 97% 97% 97%
Plans offering target-date funds 97% 97% 98% 98% 98% 93%
Participants using target-date funds (when offered) 73% 75% 75% 76% 78% 79%
Plans offering managed account program or a model portfolio 25% 29% 31% 27% 27% 32%
Participants with professionally managed allocations 60% 62% 62% 64% 66% 57%
Participants using a single target-date fund 54% 57% 57% 59% 61% 52%
Participants using a single risk-based balanced fund 3% 3% 3% 3% 3% 3%
Participants using a managed account program or model portfolio 3% 2% 2% 2% 2% 4%
Plans actively offering company stock <0.5% <0.5% <0.5% <0.5% <0.5% 9%
Participants with >20% company stock <0.5% <0.5% <0.5% <0.5% <0.5% 4%
Trading activity
Participant-directed trading 6% 5% 5% 7% 7% 8%
3. Accessing
Loans
Plans offering loans 71% 69% 70% 69% 69% 78%
Participants with an outstanding loan (when offered) 9% 9% 8% 8% 8% 13%
Recordkeeping assets borrowed 1% 1% 1% 1% 1% 1%
Withdrawals
Plans offering hardship withdrawals 85% 84% 84% 85% 85% 85%
Participants using withdrawals (when offered) 1% 1% 1% 1% 1% 3%
Recordkeeping assets withdrawn 1% 1% 1% 1% 1% 1%
Participant account balance withdrawn 48% 48% 44% 38% 45% 34%
Distributions and rollovers
Terminated participants preserving assets 85% 87% 88% 87% 87% 81%
Assets preserved that were available for distribution 96% 96% 97% 97% 96% 96%
* These figures are estimated for 2018 as the data required to compute them will not be available until December 2019.
Source: Vanguard, 2019.

Vanguard Institutional Investor Group
P.O. Box 2900 Valley Forge, PA 19482-2900
© 2019 The Vanguard Group, Inc. All rights reserved.
HASVRPA 072019
Connect with Vanguard® > institutional.vanguard.com > global.vanguard.com
(non-U.S. investors)
Acknowledgments
Launched in 2011, Vanguard Retirement Plan Access (VRPA) is a comprehensive service for retirement plans with up to $20 million in assets. Ascensus, LLC.—a nationally recognized recordkeeping firm—provides the administration of these plans on Vanguard’s behalf. Through VRPA, we served 11,300 plan sponsors with 480,000 participants as of year-end 2018.
We extend our thanks to the following individuals who made this publication possible:
Data analysisJohn A. Lamancusa (Vanguard)Edward Lukshides (Ascensus)
AuthorJean A. Young (Vanguard)
Vanguard research > Vanguard Center for Investor Research
Vanguard Investment Strategy Group
All investing is subject to risk, including the possible loss of the money you invest. Be aware that fluctuations in the financial markets and other factors may cause declines in the value of your account. There is no guarantee that any particular asset allocation or mix of funds will meet your investment objectives or provide you with a given level of income.
Prices of mid- and small-cap stocks often fluctuate more than those of large-company stocks.
Stocks of companies based in emerging markets are subject to national and regional political and economic risks and to the risk of currency fluctuations. These risks are especially high in emerging markets.
Funds that concentrate on a relatively narrow market sector face the risk of higher share-price volatility.
Investments in bonds are subject to interest rate, credit, and inflation risk.
High-yield bonds generally have medium- and lower-range credit quality ratings and are therefore subject to a higher level of credit risk than bonds with higher credit quality ratings.
Related Documents


