SMALL BUSINESS GUIDEBOOK TO QUALITY MANAGEMENT Office of the Secretary of Defense Quality Management Office http://web5.whs.osd.mil Washington, D.C. 20301-3016

Small Buiseness Guidebook to Quality Management
Oct 24, 2015
Welcome message from author
This document is posted to help you gain knowledge. Please leave a comment to let me know what you think about it! Share it to your friends and learn new things together.
Transcript

SMALL
BUSINESSGUIDEBOOK
TO QUALITYMANAGEMENT
Office of the Secretary of DefenseQuality Management Office
http://web5.whs.osd.mil Washington, D.C. 20301-3016

69
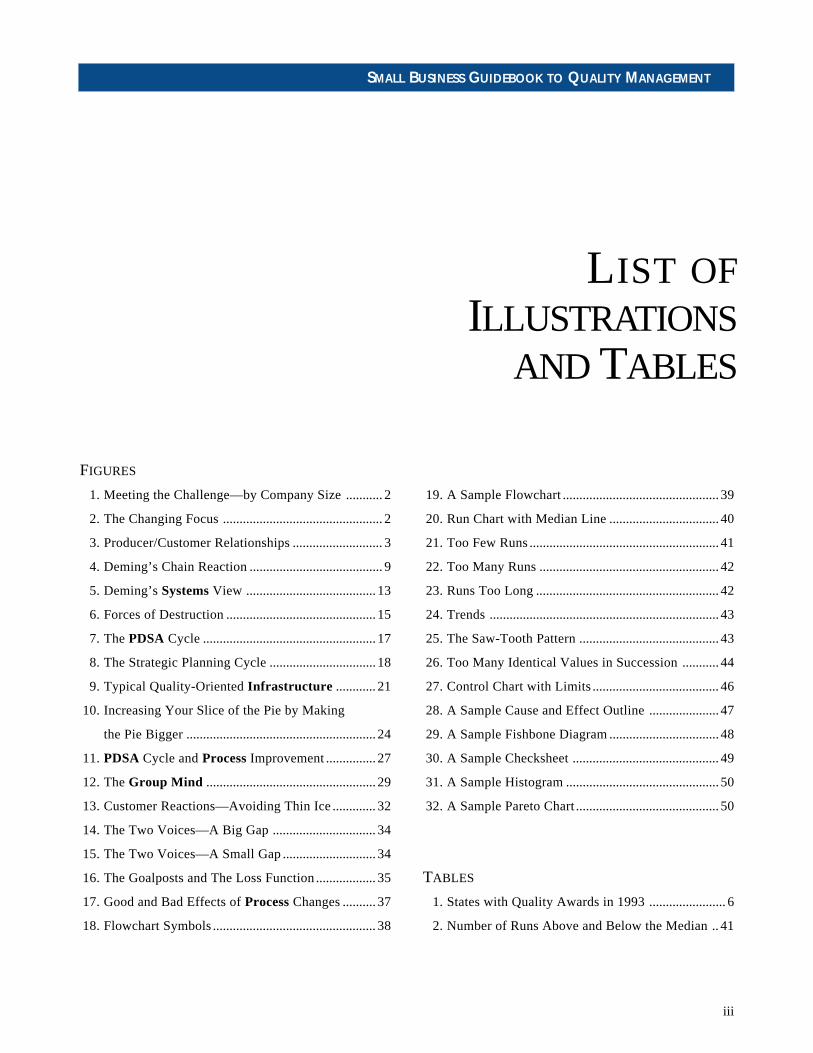
TABLE OFCONTENTS
LIST OF ILLUSTRATIONS AND TABLES .............. iii
FOREWORD.................................................................... v
CHAPTER 1—INTRODUCTION................................. 1Small Business and Quality........................................ 1Background.................................................................. 4ISO 9000...................................................................... 6Current Reality............................................................ 6
CHAPTER 2—THE DEMING PHILOSOPHY........... 9The Man and His Legacy............................................ 9The Fourteen Points..................................................10The Deadly Diseases................................................. 11The Obstacles............................................................ 12Profound Knowledge.............................................. 13
CHAPTER 3—PLANNING ......................................... 17PDSA Cycle.............................................................. 17Aim ............................................................................ 18Values and Guiding Principles................................. 18Mission ...................................................................... 19Objectives.................................................................. 19Transformation ....................................................... 20
Recharging the Infrastructure ........................... 20Leadership’s Roles and Responsibilities............ 20
CHAPTER 4—TEAMWORK......................................23Competition or Cooperation?................................... 23Empowerment.......................................................... 24
CHAPTER 5—TEAMS AND MEETINGS.............27Framework for Action.............................................. 27Meeting Management............................................... 28The Group Mind ...................................................... 29Membership Criteria................................................. 30
CHAPTER 6—CONTINUAL PROCESSIMPROVEMENT ..................................................... 31Constant Change....................................................... 31Customers and Suppliers.......................................... 31Voice of the Customer/Voice of the Process........ 33The Loss Function..................................................... 34Problem Solving and CPI ........................................ 35Variation.................................................................... 36Three Immediately Useful Tools............................. 38
Flowcharts............................................................ 38Run Charts............................................................ 40Control Charts...................................................... 45
Other Tools................................................................ 47Cause and Effect Diagrams................................. 47Brainstorming....................................................... 49Checksheets.......................................................... 49Histograms............................................................ 50Pareto Charts........................................................ 50
Measurement............................................................. 51
CHAPTER 7—STRATEGIES..................................... 53Begin the Transformation ...................................... 53A Last Word.............................................................. 54
ENDNOTES................................................................... 55
APPENDIXA. Glossary................................................................ 57B. Suggested Further Reading.................................. 59C. Some Detailed PDSA Steps................................. 61D. Control Chart Tests.............................................. 63E. Bibliography......................................................... 65
SMALL BUSINESS GUIDEBOOK TO QUALITY MANAGEMENT
71iii
L IST OFILLUSTRATIONS
AND TABLES
FIGURES
1. Meeting the Challenge—by Company Size........... 2
2. The Changing Focus................................................ 2
3. Producer/Customer Relationships........................... 3
4. Deming’s Chain Reaction........................................ 9
5. Deming’s Systems View ....................................... 13
6. Forces of Destruction............................................. 15
7. The PDSA Cycle.................................................... 17
8. The Strategic Planning Cycle................................18
9. Typical Quality-Oriented Infrastructure ............ 21
10. Increasing Your Slice of the Pie by Making
the Pie Bigger......................................................... 24
11. PDSA Cycle and Process Improvement............... 27
12. The Group Mind ................................................... 29
13. Customer Reactions—Avoiding Thin Ice............. 32
14. The Two Voices—A Big Gap............................... 34
15. The Two Voices—A Small Gap............................ 34
16. The Goalposts and The Loss Function.................. 35
17. Good and Bad Effects of Process Changes.......... 37
18. Flowchart Symbols................................................. 38
19. A Sample Flowchart............................................... 39
20. Run Chart with Median Line................................. 40
21. Too Few Runs......................................................... 41
22. Too Many Runs...................................................... 42
23. Runs Too Long....................................................... 42
24. Trends..................................................................... 43
25. The Saw-Tooth Pattern.......................................... 43
26. Too Many Identical Values in Succession........... 44
27. Control Chart with Limits...................................... 46
28. A Sample Cause and Effect Outline..................... 47
29. A Sample Fishbone Diagram................................. 48
30. A Sample Checksheet............................................ 49
31. A Sample Histogram.............................................. 50
32. A Sample Pareto Chart........................................... 50
TABLES
1. States with Quality Awards in 1993....................... 6
2. Number of Runs Above and Below the Median .. 41
SMALL BUSINESS GUIDEBOOK TO QUALITY MANAGEMENT

73v
SMALL BUSINESS GUIDEBOOK TO QUALITY MANAGEMENT
FOREWORD
The aim of this guidebook is to help small businesses makethe transition to a quality culture. The Federal Govern-ment, and the Department of Defense (DoD) in particu-lar, are now in the middle of this transition. It seemsimportant for those small businesses who now do busi-ness with the DoD, and for those who would like to dobusiness with DoD, to get on line with the rapidly spread-ing quality movement. It is this focus that prompted theDoD to produce this publication.
Deming experts, William Scherkenbach and HeeroHacquebord, helped assure the accuracy of the content.Their patience and creative suggestions, in particular,have hopefully made this both a useful and user-friendlyguidebook.
Inquiries related to this handbook should be directed toWilliam Bloom, Program Manager, OSD Quality Man-agement Office, 1155 Pentagon, Washington, DC20301-1155. Minor edits to this file (Aug 1998)

3
SMALL BUSINESSAND QUALITY
There are more than 20 million small businesses in theUnited States. Small businesses are a major force behindour economy. They employ more than half the privatesector workforce in this country. Between 1980 and 1986,64 percent of the 10.5 million jobs created in the U.S.were produced by small businesses.1 Small companiesare now operating in one of the most dynamic economicperiods in American history. The list of current concernsfor all business managers includes the usual factors:sales,profits, costs, schedules, deadlines, labor-managementagreements, suppliers, and competition. The last decadehas added other concerns like increased governmentreporting, increased global competition, increased com-plexity to government procurement, rising health carecosts, and new government-mandated programs. Perhapsthe overriding challenge of the past several years, how-ever, has been the prolonged recession and the gradual,sluggish nature of the economic recovery. For many smallbusiness owners, these increasing business concerns havebecome critical issues in the fight for survival. How doesone meet all these challenges?
According to a 1992 Gallup survey of 634 small busi-nesses,2 the recessionary environment is the biggestsurvival challenge these companies face. The surveyedbusinesses indicated that they have attempted to meet thischallenge by one of four different strategies: improvingquality, improving productivity, adding new products/services, or purchasing new equipment. Of the fouroptions, the new initiative most often taken by responding
CHAPTER 1INTRODUCTION
companies was quality improvement. However, a strik-ing result can be observed by looking at company sizeand the choice taken (See Figure 1.). Twenty-eight per-cent of the survey’s respondents with 1 to 20 employeesworked to improve quality over choosing the other threeoptions. The percentages of firms reporting a commit-ment to quality improvement were progressively higherfor larger businesses: 43 percent of firms with 21 to 100employees and 57 percent of companies with 101 to 500employees.3 The strategy of improving quality to meetthe survival challenge was more prevalent in larger com-panies. This should send a message to smaller firms.
The pressure to improve quality does not come just fromnecessity for small businesses. Customers are demand-ing more quality-consciousness and cost-efficiencyfrom their suppliers. Tom Klobucher, owner of ThomasInterior Systems Inc., put it this way: “Any companythat is not involved in some sort of quality process isalready out-classed. If they don’t begin to learn thequality language and quality life, they will be outof business.”4
The federal government and, in particular, the Depart-ment of Defense (DoD) have been evolving more and moreinto quality-consciousness, not only with the activitiesof agencies and their internal organizations but increas-ingly with regards to their suppliers: large and small busi-nesses. As shown above, smaller businesses are laggingbehind in the movement toward quality.
SMALL BUSINESS GUIDEBOOK TO QUALITY MANAGEMENT

4
ness and the pursuit of quality should prove of benefit toany company.
A more compelling reason for considering the transitionto a quality culture in any small business might lie in theexorbitant cost of reworking shoddy products. The costis not just in the direct dollars spent for the reworkingprocess, but it is reflected in additional time expendedand the stress on all the involved employees and manag-ers. Quality improvement will reduce the cost of produc-ing a product or service. It will reduce the cost of reworkand the cost of fighting crises. Management’s time in manycompanies today is dominated by efforts to fight crisesbrought on by inferior or inadequate processes andoutputs. Figure 2 illustrates the changed focus that ispossible through a transformation to a quality-driven
Figure 1. Meeting the Challenge—by Company Size.
CHAPTER 1 – INTRODUCTION
The DoD began productivity improvement programs inthe 1970’s. An Executive Order signed by PresidentReagan in February 1986 mandated the improvement ofproductivity, quality, and timeliness of government prod-ucts and services across the federal government. TheMalcolm Baldrige National Quality Award was establishedby the federal government in 1987 to honor private com-panies that excel in quality achievements. The FederalQuality Institute was established in 1988 to train andadvise federal managers in Total Quality Management(TQM) matters. The President’s Award for Quality wasinitiated in 1989 to honor those federal agencies that bestexemplified quality and productivity cultures. The fed-eral government is becoming more and more consciousof quality in what it does and in what it buys.
Those firms doing business or attempting to achieve busi-ness relations with the Department of Defense are find-ing a buyer more and more concerned with quality. TheDoD since the mid-1980’s has become committed to theTotal Quality philosophy. Many parts of the DoD havebegun to focus on supplier quality over supplier cost.Whether or not small businesses are interested in pursu-ing sales of products or services to the DoD, quality aware-Figure 2. The Changing Focus.
01-20
Employees21-100
Employees
Perc
ent S
eeki
ng Q
ualit
y Im
prov
emen
t
Company Size
101-500Employees
10
20
30
40
50
60
Management TimeCurrent Reality
Regular Activities
Fire Fighting Improvement
Management TimeVision of Future
Regular Activities
Fire Fighting
Improvement

5
organization. Note the change of emphasis from constantlydealing with crises to increased time for improvementand innovation.
What, then, is quality? It can be the speed in whicha service is delivered. It can be consistency. It can beinnovation. It can be reflected in low maintenance or fa-vorable repair history. Quality can be many things. Dr.W. Edwards Deming tells us “a product or service pos-sesses quality if it helps somebody and enjoys a good andsustainable market.”5 Webster’s dictionary defines qual-ity as “a degree of excellence and “superiority in kind.”First and foremost with quality, however, the product orservice meets or exceeds the expectations of the customer.The challenge of quality, therefore, is to supply some-thing your customers want or need, or you think they willpurchase, that not only meets or exceeds their expecta-tions but that can be produced or provided at an accept-able cost. The supplier needs to decide what to supplyand what the right level of quality for that product or ser-vice should be.
Once designed and created at the quality level desired,the key to maintaining or improving the quality of theproduct or service lies in the continual improvement ofthe processes. Each process takes input, adds value to it,and then produces a product. This is the value-added im-perative. The means by which that process adds valueand the extent to which value is added are major determi-nants of the quality of the output. A process that adds novalue should either be deleted or corrected to ensure thatvalue is added. Figure 3 shows the producer/customerrelationships related to value-added outputs.
Dr. Deming estimated that 95% or more of the causes forshoddy products and services can be traced to the man-agement of processes or subsystems that create the out-put. The need, then, is clearly for management to improvethose processes and subsystems and to monitor them con-tinually for improvement opportunities. The responsibil-ity for ensuring the improvement of the processes andsubsystems in an organization lies with top management.
In the private sector as well as in the federal government,this commitment to quality is referred to as TQM or TQL(Total Quality Leadership). The health care industryrefers to it as Continuous Quality Improvement (CQI).While the names differ, the core philosophy, methodolo-gies, tools, and techniques are much the same. The basicconcepts of the quality philosophy include:
• Careful short-range and long-range planning;
• The continual improvement of products and ser-vices and the processes that produce them;
• Top management commitment, understanding, andparticipation;
• Focus on customer/supplier relationships;
• Employee involvement in the decision-makingprocess;
• Team approach to product or service improvement;and
• Use of statistical tools and structured techniques.
A successful quality culture balances a reliance on sci-ence and philosophy to improve and innovate all workprocesses with an understanding of and appreciation forthe special knowledge, skills, and attitudes workers con-tribute. The basic method for achieving a quality trans-formation will probably not change drastically, but themeans to achieve it will differ depending on the individualneeds of each company.
Figure 3. Producer/Customer Relationships.
Small Business
Input
Add Value
Output
DoD
(Producer)
(Raw Materials)
(Process/Change)
(Product/Service)
(Customer)
SMALL BUSINESS GUIDEBOOK TO QUALITY MANAGEMENT
6
The purpose of this book is to present small businessmanagement with the basic philosophy of managementas envisioned by Dr. W. Edwards Deming, a pioneer andleading management visionary. It also includes some ofthe methods, tools, and techniques that have proven tobe effective in helping to realize the transformation to aquality culture. A major step for small business manag-ers is to gain an understanding of what Dr. Deming callsProfound Knowledge, a necessary awareness for enablinga transformation to a quality-centered organization.
Chapter 2, “The Deming Philosophy,” describes thebasic theories that support his teachings. This sectionincludes a discussion of the Fourteen Points, DeadlyDiseases, Obstacles and the theories of Systems,Variation, Knowledge, and Psychology.
Chapter 3 is titled “Planning.” Its purpose is to describehow to get a rapid start on the quality transformationby systematic planning. The lack of planning is oftenthe major weakness in the operation of small businesses.Included in this section is a description of the Plan, Do,Study, Act (PDSA) cycle developed by Deming.
Chapter 4, “Teamwork,” explores this most vital elementfor expanding the effectiveness of your organization.What kinds of people should serve on an action team?How should they interact? What power should they have?How can they be most effective?
Chapter 5, “Teams and Meetings,” provides advice onconducting effective meetings and includes a descriptionof the structured approach to problem solving and con-tinual improvement. How do you conduct yourselves inmeetings? How long should meetings last? How manyshould serve on the team?
Chapter 6, “Continual Process Improvement,” includesa discussion on variation and the importance of under-standing the difference between random, or commoncause, variation and special cause variation. This sec-tion describes some of the statistical tools that can be usedto reduce cost and increase quality.
Chapter 7, “Strategies,” contains a suggested series ofsteps to take to assist your company in moving towarda quality-centered culture. Where do you begin? Whoshould be responsible? How long will it take? What arethe pitfalls?
The appendices include: A–a glossary of selected terms(note: all terms listed in the glossary are printed in bold
in the text); B–suggested further reading on qualitymanagement; C–detailed PDSA steps that can be used inproblem solving or process improvement; D–control charttests other than limits, and E–the bibliography. Endnotecitations are listed just after the end of the main text.
BACKGROUND
Most business people today in the United States are awareof the enormous turnaround of the Japanese economy fromthe 1950’s to the 1970’s and beyond. Once consideredproducers of cheap junk, Japanese products have becomesynonymous with quality. This incredible reversal of prod-uct characteristics was not accomplished by miracle orgimmick. It was based in the fundamentals of the phi-losophy of quality management that was taught to thebusiness leaders of Japan by Dr. W. Edwards Deming.The methods he taught the Japanese led their industry toemphasize quality and the continual pursuit of improve-ment. Industry leaders in Japan today honor the philoso-pher by conferring annual Deming Awards on thosecompanies best exemplifying his quality principles.
Immediately following World War II, the only economycapable of producing goods was the American economy.Asian and European economies had, for the most part,been brought to a halt by the destruction of war. Withoutcompetition, the United States quickly became theproducer of goods for the free world. Moving from warmachinery production to goods producer for world-wideconsumers was a relatively easy conversion for our fac-tories. The emphasis was on mass production in order tosatisfy the demand. Quality was second, if that high, inthe pecking order. The focus was on high-volume outputthat met minimal standards. Quickly getting out the productand selling it with the highest immediate return was themethod of business operation in this country.
Then came the 1970’s and the rapid rise of the Japaneseeconomy. Japan’s electronics industry had made stronginroads on the American market place in the 1960’s , and,with the fuel crisis in this country early in the 1970’s, thefuel efficient, reliable Japanese automobiles followed suit.
CHAPTER 1 – INTRODUCTION

7
We all know the results and the adverse impact on thebalance of trade and on our domestic economy. The Japa-nese manufacturers with their focus on customer satis-faction and long-term reliability rapidly gained marketshare throughout the world and, rather dramatically, inAmerica. The resulting imbalance is strikingly detailedin one of the Federal Quality Institute’s TQM booklets:
• Since 1960, the United States has lost 40 percent of its market share to foreign competitors; during the same period, Japan has increased the size of its foreign market by 500 percent.
• The nine largest banks in the world are now Japanese.
• The United States used to make 90 percent of the color TV’s in the world. Now we make 5 percent.
• There are no American-made VCRs, compact disc players, or single-lens reflex cameras.6
Japan’s economic revitalization is clearly a modern daysuccess story that is unparalleled in history. Factors otherthan Deming’s philosophy of quality management mightalso have contributed to this astonishing turnaround, butthe base for this transformation was clearly founded inhis philosophy. Our country, like others, was a sitting duckwith our emphasis on short-term results. The uniquenessof the Japanese society and their ability to band togetherto carry out the long-term aims of the quality philosophyhad no small hand in their success.
Deming reached his 93rd birthday in October 1993 stillpracticing his quality management consulting business.He died two months later in December 1993. Prior to hisroughly 40 years working as a consultant, he worked atthe U.S. Department of Agriculture and at Western Elec-tric. From this experience and his association with Dr.Walter Shewhart, Deming learned the importance of thecontrol chart in determining special cause variation. Healso began to develop his concepts on structured processimprovement from Shewhart, which later became thePDSA cycle. His years as a civil servant with the CensusBureau in Washington, DC provided an impetus that even-tually found him being called to postwar Japan to assistwith the census in that country. It was during the late1940’s and early 1950’s that Deming began to teach Japa-
nese business leaders his philosophy of quality manage-ment. In meetings with the Union of Japanese Scienceand Engineering (JUSE), Deming taught the theory thathigher quality and lower operating costs were not neces-sarily separate pursuits—a heretical concept inthose days. The Japanese listened. They all had one clearaim in mind, rebuilding the shattered economy of Japan.The result is history. In recognition of Deming’s contri-butions, JUSE instituted the Deming Prize, an annualaward for product quality and dependability. In 1960,Deming was awarded the Second Order Medal of the Sa-cred Treasure by the emperor of Japan.
Deming’s work and his success in Japan were largely over-looked in the United States for 30 years. Then, in 1980,an NBC White Paper, “If Japan Can, Why Can’t We?”introduced quality management theories and techniquesand Dr. Deming to America. In 1987, President Reaganawarded Deming the National Medal of Technology.
Many theorists and methodologists in this country and inJapan have made their mark on the rising tide of qualitymanagement concepts. Like Deming, Dr. Joseph Juranemphasized the need for management involvement in qual-ity improvement. Dr. Armand Feigenbaum believed thequest for quality should be pursued in all departments ofthe organization, not just the manufacturing division. Hetalked about the “hidden plant,” that percentage of anorganization’s production capacity devoted strictly towaste and rework. Dr. Kaoru Ishikawa has written exten-sively about quality control, and he led the highly popu-lar “Quality Circle” movement in Japan. Dr. GenichiTaguchi is best known for his “Taguchi Loss Function,”which puts forth the theory that economic loss occurswhenever there is any variation from the optimal point ofa process or product. Thus, just being able to control aprocess or its output within a range of specified limitsdoes not avoid economic loss. Many excellent lecturerscurrently conduct seminars around the country helpingdefine and explain the various parts of Deming’s philoso-phy. William Scherkenbach, who worked both at Fordand at General Motors, has assisted Deming for more than20 years. Ed Baker, John Dowd, Heero Hacquebord, BrianJoiner, Gipsey Ranney, and Peter Scholtes are just a fewof the many assisting in the effort to get American com-panies moving toward a quality-centered culture.
SMALL BUSINESS GUIDEBOOK TO QUALITY MANAGEMENT

8
Thirty-two states have quality award programs.7 Stateswith quality awards in 1993 are listed in Table 1.
Alabama MissouriArizona NevadaCalifornia New HampshireConnecticut New JerseyDelaware New MexicoFlorida New YorkGeorgia North CarolinaIdaho OhioIndiana PennsylvaniaIowa Rhode IslandKansas South CarolinaMaine TennesseeMaryland TexasMassachusetts UtahMinnesota VirginiaMississippi Wyoming
Colorado, Illinois, Michigan, and Montanaare considering the establishment of statequality awards.
Table 1. States with Quality Awards in 1993.
ISO 9000
International attention has been drawn to quality improve-ment. The ISO 9000 is a series of quality standards thatoutline the requirements for quality management systems.It is becoming the quality standard in Europe and is gain-ing acceptance in Canada and the United States. Estab-lished standards for measuring quality have been aroundsince the industrial revolution began. Today, there are over76,000 U.S. military standards, more than 12,000 U.S.federal standards, and more than 35,000 U.S. industrystandards developed by 432 private sector organizations.8
CURRENT REALITY
The Small Business Administration (SBA) estimates that75 percent of all new businesses in the U.S. fail withinthe first few years of existence. Legislative efforts overthe past few decades to assist small businesses have hadmixed results. One of the primary reasons for the anti-trust laws passed by congress was to protect small busi-nesses from the perceived competitive advantage heldby large businesses. When the SBA was established in1953, it was a major effort by the federal government toassist small businesses. Yet, small businesses are clearlyhigh-risk, high-failure ventures. In poor to weak economictimes, such as the early 1990’s are, the small businessventure is even more high-risk. But, as we have seen ear-lier, the percentage of small businesses embracing thequality management philosophy is relatively low whencompared to larger businesses.
In many ways, the small business is a more ideal unitthan the large organization for the quality managementphilosophy to function effectively. There are normallyfewer internal cliques in small companies, and, therefore,there is less fighting and bickering between work units.The potential for effective teamwork is better in a smallorganization. There are fewer layers of management inmost small businesses, so that the potential exists for goodcommunications and dynamic work habits. The normallyoverworked small business owner and manager canoften benefit the most by relying more on the skills,knowledge and attitudes of the employees who operatethe processes.
On the other hand, the small business usually lacks thefunds and the time to make the investment necessary totransform to a quality-centered company. Yet, that invest-ment is very important and very worthwhile. The costincurred by reworking or replacing the products ofunpredictable, unreliable processes, the lost businesscaused by the production of poor products or services,the cost of hiring new employees caused by constantturnover are just some of the good reasons every smallbusiness should pursue the establishment of a qualityculture in the workplace.
CHAPTER 1 – INTRODUCTION

9
It is good to assess your reasons for changing to a qualityculture. List below the reasons you and your senior staffcan think of for making this transformation.
Your List of Reasons to Pursue a Quality Culture1.2.3.4.5.6.7.8.9.
10.
The need for this transformation in most small businessestoday is probably urgent. But, it is very important thatthe approach taken be a sound, comprehensive, well-planned initiative.
There are many quality methodologies and formulas forsuccess available. Most of these will show some positiveresults in application. But, it is important to understandthat the transition to a real quality culture is usually along-term commitment. It will not succeed if there istheory without action or action without theory. In otherwords, it will not do just to talk about quality while notactively pursuing it. Nor will it be sufficient to establishquality action groups without a set of concepts to guidethe activity. It is not a program. It is a change in the wayyou do business, a change in the way you look atprocesses, and a change in the way you think about the“company.”
It is our recommendation that a proven philosophy, theory,and methodology be followed consistently and per-sistently. The Deming philosophy has a clear record ofsuccess over the past 40 years, not only in Japan butalso here in this country. It is, therefore, the thesis of thisguidebook to follow Deming’s concepts in the pursuit ofthe quality transformation . As you begin to understandthe Deming philosophy, read the works of some of theother quality experts like those listed in Appendix B.Obtain training and facilitation services that are attunedto the Deming philosophy. Then proceed by followingDr. Deming’s advice, “Just do it!”
SMALL BUSINESS GUIDEBOOK TO QUALITY MANAGEMENT

11
THE MAN AND HIS LEGACY
Dr. Deming’s 70 years of developing and teachingconcepts and techniques to improve the organizationalsystem have had an enormous impact on quality manage-ment theory. The practice of his theories and philosophyhave dramatically improved the quality and performanceof companies in Japan and other countries. Businessmenthe world over use his theories and techniques and areliving proof of the success that is possible through theeffective use of his system and his philosophy. As earlyas 1950, Deming promoted the revolutionary conceptthat quality and productivity were not mutuallyexclusive goals. His chain reaction, shown in Figure 4,demonstrates how higher quality actually means lowercosts and continued survival.
The bulk of the Deming philosophy is contained in hisFourteen Points, the Deadly Diseases, the Obstacles,and Profound Knowledge. The latter element containsthe theories of Systems, Variation, Knowledge, andPsychology. These subjects are covered in two of hisbooks: Out of the Crisis10 and The New Economics.11
In this chapter, we will describe the highlights ofDeming’s teachings. Figure 4. Deming’s Chain Reaction9.
CHAPTER 2THE DEMING PHILOSOPHY
Improve Quality
Productivity improves
Stay in business
Provide jobs and more jobs
Increase marketshare withbetter quality, lower price
Less rework, fewer mistakes,fewer delays, snags and more
efficiency—lowers cost
SMALL BUSINESS GUIDEBOOK TO QUALITY MANAGEMENT
12
THE FOURTEEN POINTS
Many of the fourteen points are interrelated. These pointscan be viewed as the guidelines for beginning to changethe way you conduct business and the way you think aboutyour company. The major transition needed to obtain agood understanding of these points is the change of focusfrom thinking solely profit to thinking mainly quality.
1. Create constancy of purpose toward improvementof product and service, with the aim to become com-petitive and to stay in business and to provide jobs.
2. Adopt the new philosophy. We are in a new eco-nomic age. Western management must awaken tothe challenge, must learn their responsibilities, andtake on leadership for change.
3. Cease dependence on inspection to achieve quality.Eliminate the need for inspection on a mass basis bybuilding quality into the product in the first place.
4. End the practice of awarding business on the basisof price tag alone. Instead, minimize total cost. Movetoward a single supplier for any one item, on a long-term relationship of loyalty and trust.
5. Improve constantly and forever the system ofproduction and service, to improve quality and pro-ductivity, and thus constantly decrease costs.
6. Institute training on the job.
7. Institute leadership (see point 12). The aim of lead-ership should be to help people and machines andgadgets to do a better job. Leadership of manage-ment is in need of overhaul, as well as leadership ofproduction workers.
8. Drive out fear so that everyone may work effectivelyfor the organization.
9. Break down barriers between departments. Peoplein research, design, sales, and production mustwork as a team, to foresee problems of productionand in use that may be encountered with the productor service.
10. Eliminate slogans, exhortations, and targets forthe work force asking for zero defects and newlevels of productivity.
11a. Eliminate numerical goals for the work force andnumerical goals for management.
11b.Eliminate management by objective. Eliminatemanagement by numbers, numerical goals. Substi-tute leadership.
12a. Remove barriers that rob the hourly worker of hisright to pride of workmanship. The responsibilityof supervisors must be changed from sheer numbersto quality.
12b.Remove barriers that rob people in managementand in engineering of their right to pride of work-manship. This means, inter alia, abolishment of theannual or merit rating and of management by objec-tive, management by the numbers.
13. Institute a vigorous program of education and self-improvement for everyone.
14. Put everybody in the company to work to accom-plish the transformation . The transformation iseverybody’s job.
12
CHAPTER 2 – THE DEMING PHILOSOPHY

13
13THE DEADLY DISEASES
Dr. Deming described what he called the Deadly Diseases.They represent some perceived shortcomings that canerode any quality movement. Like any serious diseasethey are difficult to cure, and, if you are not alert, theymay seriously affect the health of your organization.
l. Lack of constancy of purpose to plan product andservice that will have a market and keep the com-pany in business and provide jobs.
2. Emphasis on short-term profits: short-term thinking(just the opposite from constancy of purpose to stayin business), fed by fear of friendly takeover, andby push by bankers and owners for dividends.
3. Evaluation of performance, merit rating, or annualreview.
4. Mobility of management; job hopping.
5. Management by use only of visible figures, with littleor no consideration of figures that are unknown orunknowable.
6. Excessive medical costs.
7. Excessive costs of liability, swelled by lawyers thatwork on contingency fees.
SMALL BUSINESS GUIDEBOOK TO QUALITY MANAGEMENT

14
THE OBSTACLES
(The Obstacles are the pitfalls or roadblocks that ofteninterfere with an organization’s movement toward andrealization of a quality culture. Not all organizations orleaders have these obstacles to surmount, but they are thecommon roadblocks.)
1. “Hope for instant pudding”14—The transformationtakes time and takes effort. There is no quick pathto quality.
2. “The supposition that solving problems, auto-mation, gadgets, and new machinery will transformindustry.”15
3. “Search for examples”16—Attempting to transformto a quality culture by copying other company’s pro-cedures is likely to fail. Improvement of quality is atheory that can be transferred to any company, butonly the theory can be transferred.
4. “Our problems are different.”17—Everyone’sproblems are different, but the principles forimprovement are universal.
5. “Obsolescence in schools”18—Business schoolsteach how to make a short-term profit rather thanhow to produce quality.
6. “Poor teaching of statistical methods in industry”19
—Don’t use poorly trained people to teach statis-tical methods to your employees. Hire competentstatisticians who are leaders of ProfoundKnowledge.
7. “Use of Military Standard 105D and other tablesfor acceptance”20—Using such standards to acceptor reject products or services guarantees defects.Continual Process Improvement will help toensure quality.
8. “Our quality control department takes care of all ourproblems of quality”21—In this kind of company thewrong people are responsible for quality. Qualityis the responsibility of the process operatorsand especially of management and the boardof directors.
9. “Our troubles lie entirely in the work force”22—The workers are handicapped by the system, and thesystem is the responsibility of management.
10. “False starts”23—The use of “pieces” of the qualityphilosophy, methodology, tools, and techniquescan provide deceiving results. Remember, there isno instant pudding. The transformation takes timeand effort.
11. “We installed quality control.”24—It cannot beinstalled. The improvement of quality requires alearning process, over time, led by management.
12. “The unmanned computer”25—The computer is justa machine. It can collect and summarize data, butit cannot discern what kind of variation exists in aprocess. An understanding of variation is vital toimproving quality.
13. “The supposition that it is only necessary to meetspecifications”26—Specifications do not determinequality. Quality is evidenced by something that meetsor exceeds the customers’ expectations.
14. “The fallacy of zero defects”27—No process iswithout variation. The point is to continually reducevariation, but it is not to seek the impossible. Toseek results within specification limits expecting zerodefects is an illusion. There is still loss, because thereis always variation.
15. “Inadequate testing of prototypes”28—A prototypeis just one instance of a product or service. It takesmany instances and continual improvement of theprocess to approach quality.
16. “Anyone that comes to try to help us must under-stand all about our business”29—Those who cometo help you must understand how to improvesystems. Together with those who understandthe systems, they can enable continual processimprovement of the systems.30
CHAPTER 2 – THE DEMING PHILOSOPHY

15
PROFOUND KNOWLEDGE
Profound Knowledge to Deming is comprised of fourtheories: Systems, Variation, Knowledge, and Psychol-ogy. Deming says managers do not need to become ex-perts in these areas to be able to understand and applythem. But, he does call upon managers to develop a deepappreciation for the overall organizational System, to un-derstand something about Variation, to grasp a theory ofKnowledge, and to appreciate human Psychology. Basi-cally, Deming’s theories can be described as follows:
1. The Theory of Systems requires that managementunderstand the organization as a whole system, acomplete picture; and they must emphasize theoptimization of that system. It is essential that theaim of the system is communicated to and under-stood by all members of the organization. Moreover,the best chances of achieving that aim come whenall the parts of the system are working collectivelytoward the aim. In this regard, it is wrong for oneunit of an organization to excel to the point where itadversely affects the contributions of other units tothe aim of the company. Teamwork is required acrossthe organization. Management must concentrate onseeing the forest as well as seeing the individual trees.
The nourishing of one or two of the trees to the det-riment of the others, however, is a major mistake bymanagement. Leadership must lead the optimiza-tion of the system. This is best accomplished by fo-cusing on the aim of the company.
This theory requires a sharply different focus on yourorganization. Figure 5 illustrates the systems viewas envisioned by Deming. This is in stark contrastto the standard hierarchical view depicted in the usualorganization charts. The systems view focuses onpleasing the customers, while the organization chartfocuses on pleasing the managers. The systemsview only implies that management is involved, theorganization chart only implies that customers areinvolved. Quality in the systems view is the resultof the interactions of all parts of the system, whilequality in the organization chart is the result ofindividual or team efforts. In the systems view whenfault occurs, the cause is sought within the system.In companies governed by the organization chartwhen fault occurs, the cause is sought in the people.
2. The Theory of Variation involves understandingvariation and knowing how to deal with it. There isvariation in everything. Variation causes economicloss. The normal variation in all processes is calledcommon cause variation. Special cause variationalso can adversely affect a process. It is important
Figure 5. Deming’s Systems View31.
Designand
Redesign
Consumer Research
Consumers
DistributionProduction
Suppliers
A
B
C
D
E
F
G
SMALL BUSINESS GUIDEBOOK TO QUALITY MANAGEMENT
16
4. The Theory of Psychology requires understandingthe variation in everyone: leaders, employees, sup-pliers and customers. You must learn the skills,knowledge, and attitudes of others in order to be ableto optimize the system. You need to understand thatalmost everyone has an innate desire to do a goodjob. The manager’s responsibility is to encourageand enable that attribute so that all employees canimprove. People are different from one another.Yet, some managers treat employees as though theyshould all be the same by ranking each of them againstone another. Ranking is destructive. Leaders needto understand and nurture the intrinsic (innate)motivational forces that people have. They also needto apply extrinsic (external) motivational forces thatproduce positive results in people. Examples are fairpay, good work environment, good equipment, etc.Ranking and fear can destroy the positive intrinsicattributes in a person. Deming described the lifelongimpact of what he called the “Forces of Destruction,”depicted in Figure 6, to indicate the need for man-agement to restore the intrinsic motivation,self-esteem, dignity, cooperation, curiosity, and joyof learning to all individuals working for them.
This is a synopsis of the Deming philosophy and itstheories. Some might say this is all just common sense.If this is so, then why is it not in common practice?Common sense, in fact, is what has taught us to rate, rank,and grade people thereby destroying them as shown inFigure 6. Common sense, one might contend, is probablythe source of the deadly diseases.
Moreover, there is considerable depth, particularly inthe Profound Knowledge concepts, to warrant carefulstudy and consideration of Deming’s teachings. It is histhesis that you need not be an expert in his theories tomake the system work. But you must be continually seek-ing improvement, continually learning more about theusefulness of his theories. It is not by chance that thefirst of the 14 Points is constancy of purpose.
to detect special cause variation because yourapproach to dealing with it should be different thanthe way you deal with common cause variation. Itis often possible to detect the presence of specialcause variation by observing data patterns. Thereare some simple statistical tests to help determinewhether special causes exist. Special cause varia-tion can occur when a cause outside the process af-fects the process. It can also occur within the processand is usually specific to a person or group. Demingidentifies two kinds of mistakes arising from confu-sion of special causes and common causes: mis-take the cause of a variation in a process as specialwhen it is actually common cause; mistake the causeof a variation in a process as common when it isactually special cause.
3. The Theory of Knowledge is the most abstract, andin many ways the most important, of the four tenetsof Profound Knowledge. In it Deming asserts thatmanagement is prediction. Everything you do as amanager involves predictions of one kind or another.In order to predict, you must test a theory over time.As you observe theory being tested by everydayoccurrences, you obtain knowledge about whatworks and what does not work. With these data youcan modify your theory. One exception to a theorycalls into question the usefulness of that theory.The PDSA cycle is the method to use to analyzeyour system. The resultant predictions allow you toplan. Planning is the first step in continual processimprovement.
CHAPTER 2 – THE DEMING PHILOSOPHY

17
Figure 6. Forces of Destruction. “The forces along the top rob people, and the nation,of innovation....We must replace these forces with management that will restore the powerof the individual.”32
Forc
ed d
istri
butio
n of
gra
des
in sc
hool
. Gol
d st
ars.
Ince
ntiv
e pay
. Pa
y fo
r per
form
ance
.N
umer
ical
goa
ls w
ithou
t
a m
etho
d.
Expl
anat
ion
of v
aria
nces
.
Mer
it sy
stem
. Jud
ge p
eopl
e;
put t
hem
into
slot
s. C
ompe
titio
n
betw
een
peop
le, g
roup
s, di
visio
ns.
Subo
ptim
izat
ion.
Eve
ry
grou
p, ev
ery
divi
sion–
a pr
ofit
cent
er.
Lifeends
Time
Lifebegins
These forces cause humiliation, fear, self-defense,competition for gold star, high grade, high rating on the
job. They lead anyone to play to win, not for fun. Theycrush out joy in learning, joy on the job, innovation.
Extrinsic motivation (complete resignation toexternal pressures) gradually replaces intrinsic
One is born with intrinsic motivation, self-esteem, dignity, cooperation, curiosity, joy in learning. These attributes are high at the beginning of life, but are gradually crushed by the forces of destruction.
motivation, self-esteem, dignity.
Forces of Destruction
SMALL BUSINESS GUIDEBOOK TO QUALITY MANAGEMENT
19
PDSA CYCLE
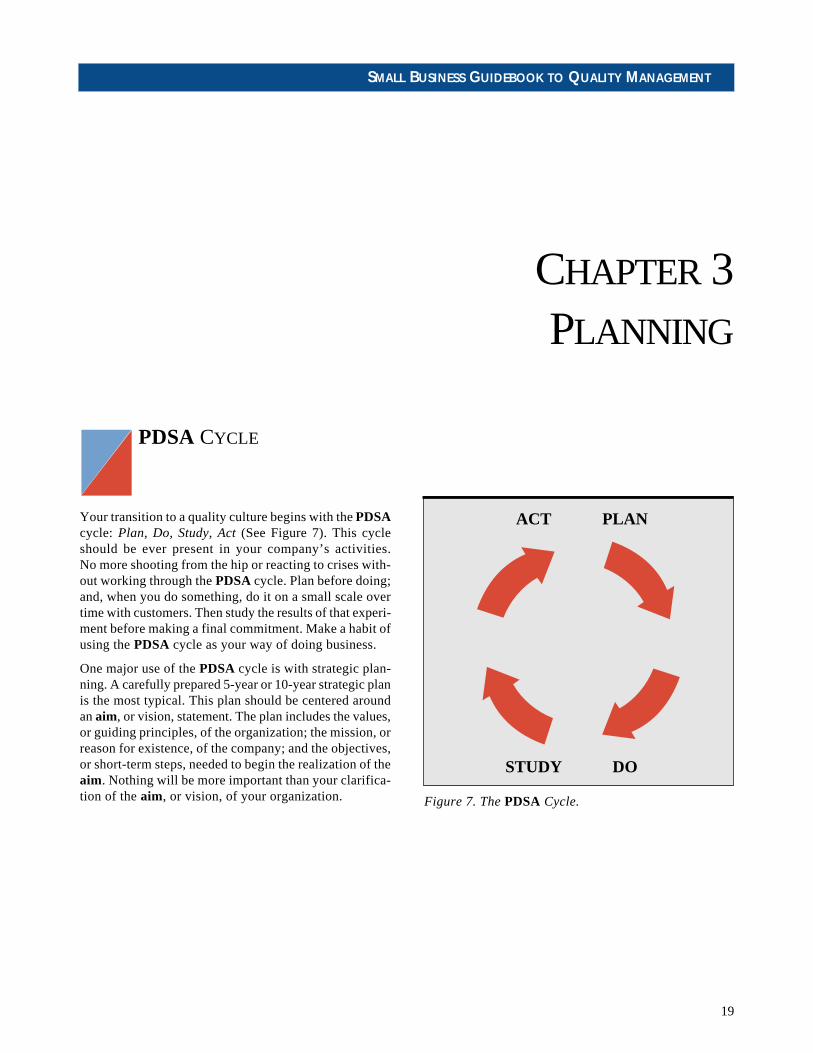
Your transition to a quality culture begins with the PDSAcycle: Plan, Do, Study, Act (See Figure 7). This cycleshould be ever present in your company’s activities.No more shooting from the hip or reacting to crises with-out working through the PDSA cycle. Plan before doing;and, when you do something, do it on a small scale overtime with customers. Then study the results of that experi-ment before making a final commitment. Make a habit ofusing the PDSA cycle as your way of doing business.
One major use of the PDSA cycle is with strategic plan-ning. A carefully prepared 5-year or 10-year strategic planis the most typical. This plan should be centered aroundan aim, or vision, statement. The plan includes the values,or guiding principles, of the organization; the mission, orreason for existence, of the company; and the objectives,or short-term steps, needed to begin the realization of theaim. Nothing will be more important than your clarifica-tion of the aim, or vision, of your organization.
CHAPTER 3PLANNING
Figure 7. The PDSA Cycle.
ACT PLAN
STUDY DO
SMALL BUSINESS GUIDEBOOK TO QUALITY MANAGEMENT
20
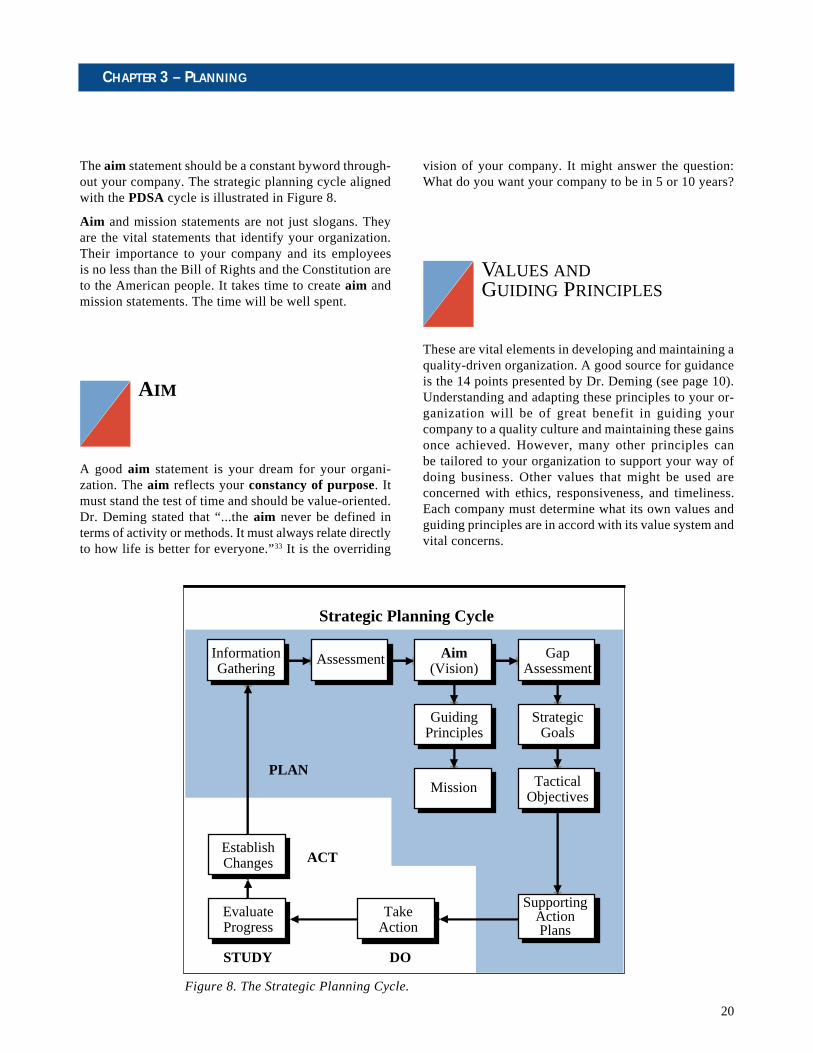
The aim statement should be a constant byword through-out your company. The strategic planning cycle alignedwith the PDSA cycle is illustrated in Figure 8.
Aim and mission statements are not just slogans. Theyare the vital statements that identify your organization.Their importance to your company and its employeesis no less than the Bill of Rights and the Constitution areto the American people. It takes time to create aim andmission statements. The time will be well spent.
AIM
A good aim statement is your dream for your organi-zation. The aim reflects your constancy of purpose. Itmust stand the test of time and should be value-oriented.Dr. Deming stated that “...the aim never be defined interms of activity or methods. It must always relate directlyto how life is better for everyone.”33 It is the overriding
vision of your company. It might answer the question:What do you want your company to be in 5 or 10 years?
VALUES ANDGUIDING PRINCIPLES
These are vital elements in developing and maintaining aquality-driven organization. A good source for guidanceis the 14 points presented by Dr. Deming (see page 10).Understanding and adapting these principles to your or-ganization will be of great benefit in guiding yourcompany to a quality culture and maintaining these gainsonce achieved. However, many other principles canbe tailored to your organization to support your way ofdoing business. Other values that might be used areconcerned with ethics, responsiveness, and timeliness.Each company must determine what its own values andguiding principles are in accord with its value system andvital concerns.
Figure 8. The Strategic Planning Cycle.
InformationGathering
Assessment Aim(Vision)
GapAssessment
GuidingPrinciples
StrategicGoals
Mission TacticalObjectives
SupportingActionPlans
EstablishChanges
TakeAction
EvaluateProgress
PLAN
ACT
DOSTUDY
Strategic Planning Cycle
CHAPTER 3 – PLANNING

21
MISSION
A good mission statement will contain a message con-veying the following type information:
• Why you are in business
• Who your customers are
• What your most cherished values are
OBJECTIVES
The statements of objectives are task statements, the meansby which your company intends to achieve its aim. Oneapproach is to designate goals that are achievable in 1 or2 years that will direct your company toward its aim. Otherobjectives might be longer term such as 3 to 5 years. Theseobjectives can be to overcome obstacles or roadblocks tothe aim. They might also be steps to improve strengths inthe organization. Objectives are the means by which yourcompany intends to achieve its aim. They are specificsteps to be taken in a particular time frame. The peopleresponsible for each objective are to be specified. Theaction item for each objective should include:
• Title of the objective and its goal
• Description of the task or tasks to be used to reachthe goal
• Timetable for completion
• Responsible party or parties
The key elements, then, of long-range planning are todevelop an aim statement, a mission statement, and theorganization’s values. Top management then needs toanalyze the gap between the aim and current reality anddevelop the strategic goals to enable the realization ofthe aim. The objectives needed to achieve those goalsare then developed with detailed action plans. These ele-ments are normally developed by senior staff and thenexplained to all employees. It is important that everyone
has the opportunity for input to the strategic plan. Thevalue of having everyone “buy off” on the strategic plancannot be overestimated. All employees must be made tofeel like part of the team from the very beginning of thisprocess, and, as new employees are added to the com-pany, from the very beginning of their employment withyour firm.
Once the strategic Plan is drafted, the next step is to Do,often best accomplished with a pilot program to test thevalidity of the planned activities on a small scale, low-risk basis. Once the pilot program has been conducted, acareful Study should be made of the success of that pro-gram. If adjustments are necessary, they can be made atthis time and then be Studied to evaluate the success. Anychanges are then institutionalized in the Act step. The cyclebrings us around to the beginning where we review theprocess, Studying the then current situation and Planningimprovements. The PDSA cycle is never-ending, provid-ing continual improvement of the various processes andsubsystems operating in the organization.
It is recommended that the strategic planning process beinitiated before the budget cycle so that its results can beincorporated into the budget. The strategic plan shouldbe reviewed on a regular basis. A 6- or 12-month reviewperiod is typical. Each review should assess theorganization’s progress toward a quality culture includ-ing a review of the objectives, mission validation, andoverall progress toward the organization’s aim. Eachreview is a repetition of the PDSA cycle.
The PDSA cycle is the major tool to be used in a qualityculture. It is a form of the scientific method. In simpleterms, it means that we plan action before we do it. Thismeans that we first learn all there is to learn about theprocess in question. We gather data, analyze data, andstudy the data. Then we plan an action on a small scale toattempt to improve the process. We study the results ofthat pilot effort. The next step is to finalize or institution-alize whatever it was that appeared to work. This cycleis repeated again and again in a quality culture to seekcontinual improvement.
SMALL BUSINESS GUIDEBOOK TO QUALITY MANAGEMENT

22
TRANSFORMATION
Top leadership must work at changing the organizationto a quality culture. This transformation requires anemphasis on fulfilling the potential of the organizationand continually improving its processes. The focus is onwhat your company can become rather than on where ithas been; the key is on continual improvement. The aimof the company, its mission, the values and principles thatwill guide it—these are the elements to be considered tobuild a bridge to the future. Transformation begins withtop leadership. Top leadership encourages and enablesall to follow. This is a different view of the world. Topmanagement must transform to the new style of leader-ship. Many of the old ways of doing business must becast aside in order to achieve an effective changeover. Ittakes time, it takes courage, it takes financial investment,and, as Deming noted, it takes knowledge.
Recharging the Infrastructure
The transformation to a quality culture requires manysignificant changes in an organization. The roadside islittered with organizations that have attempted to trans-form to a quality culture without a total commitmentfrom the senior leadership. Top management must notonly be committed to quality, but they must obtain theknowledge and show the way for the rest of the companyto achieve a quality culture. One of the first steps is toestablish quality as the driving factor in all the companydoes. Senior staff meetings should become top manage-ment quality meetings. Their meetings should be quality-driven, concentrating on customer needs and satisfaction,systems review, continual improvement initiatives, andother quality-centered concerns.
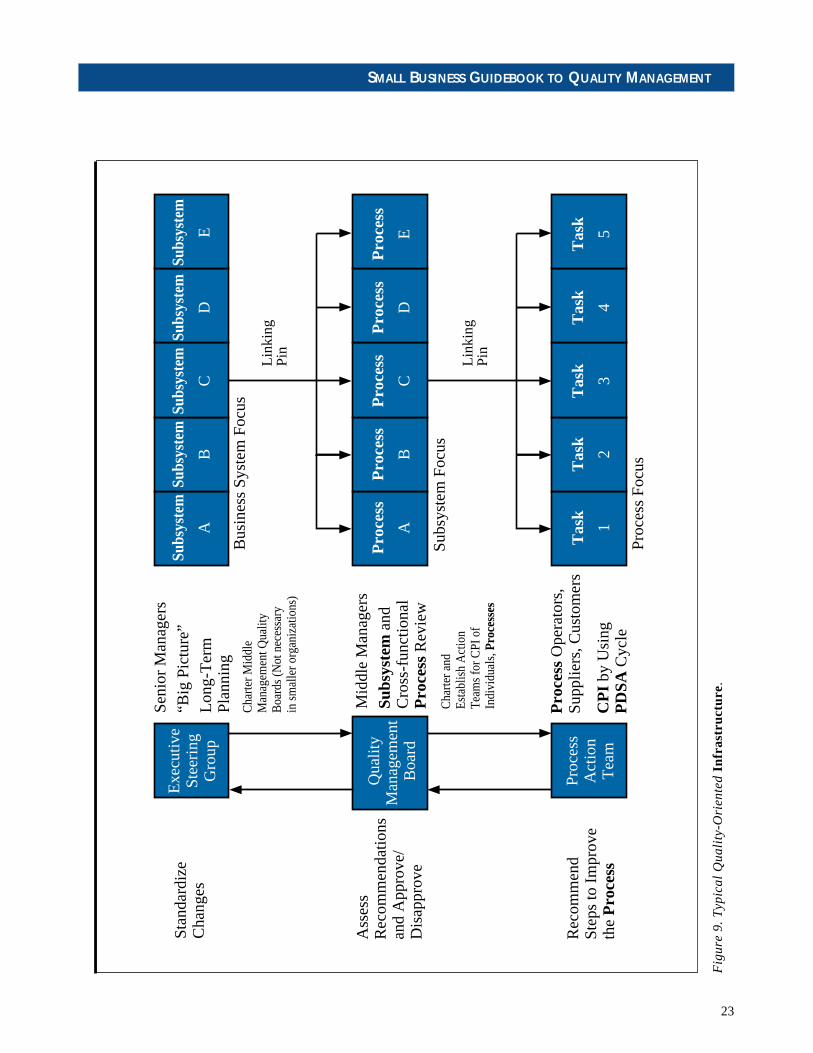
In firms with many employees, middle management qual-ity teams should be established. Cross-functional teamsmade up of middle managers should be established toprovide continual review of cross-functional activities.In smaller companies where there are few if any middlemanagers, cross-functional teams can be composed ofrepresentatives from the various functions who interactwith others in a given process. Ad hoc, or process actionteams, can be established to review a given process forcontinual improvement or for problem solving. These adhoc teams are often dissolved after they have accomplishedtheir mission. Figure 9 shows one scheme for a quality-
driven organization including the main responsibilitiesof each type team. Keep in mind the need for a systemsview as depicted in Figure 5.
Note the use of the linking pin from top management tomiddle management teams and from middle managementteams to action teams. The purpose of the linking pin isto provide support from management and to facilitatecommunications down and up the chain of command. Thelinking pin is not a control factor but a team memberwith status equal to all other team members. This in noway diminishes the linking pin’s role as a leader, but heshould not automatically be considered the leader of theteam.
Note also the changing emphasis as top managementis responsible for the overview of the organizational sys-tem and each of its subsystems, middle managementteams are responsible for subsystems and their compo-nent processes, and the action teams are responsible forindividual processes.
It is not advisable, with the exception of cross-functionalteams, to establish top management or middle manage-ment quality teams separate from the rest of the organi-zation. The need is to ensure that the focus of standingteams is on quality and continual improvement. If cross-functional teams do not now exist, they should be estab-lished where processes cross functional lines and shouldbe chartered to focus on the continual improvement ofthe processes for which they are responsible. The qualityfocus of all these teams conveys the important messageto all employees that management is committed to qual-ity not only in what it says but what it does.
Leadership’s Roles and Responsibilities
As mentioned earlier, it is leadership’s responsibility totake part in and enable the transformation to a qualityculture. This is a double-edged sword. On the one hand,it requires that the leader know why the transformationis necessary. He must be firmly committed to that neces-sity and must lead the organization through that change.On the other hand, the leader must transform himself tothe new style of leadership.
The transformation to a new style of leadership isperhaps the most difficult of all the changes needed toattain a quality culture. It is an individual, ego-centeredchangeover from, what for some might be a dictator roleto a coaching role; from a close-minded order-barkingrole to an open-minded, counselor role.
CHAPTER 3 – PLANNING
23
Fig
ure
9.
Typ
ica
l Qu
alit
y-O
rie
nte
d Infr
ast
ruct
ure
.
Exe
cutiv
eSt
eeri
ngG
roup
Stan
dard
ize
Cha
nges
Ass
ess
Rec
omm
enda
tions
and
App
rove
/D
isap
prov
e
Rec
omm
end
Step
s to
Im
prov
eth
e P
roce
ss
Seni
or M
anag
ers
“Big
Pic
ture
”
Lon
g-T
erm
Plan
ning
Cha
rter M
iddl
eM
anag
emen
t Qua
lity
Boa
rds
(Not
nec
essa
ryin
sm
alle
r org
aniz
atio
ns)
Cha
rter a
ndEs
tabl
ish
Act
ion
Team
s fo
r CPI
of
Indi
vidu
als,
Pro
cess
es
Mid
dle
Man
ager
s
Subs
yste
m a
ndC
ross
-fun
ctio
nal
Pro
cess
Rev
iew
Pro
cess
Ope
rato
rs,
Supp
liers
, Cus
tom
ers
CP
I by
Usi
ngP
DSA
Cyc
le
Qua
lity
Man
agem
ent
Boa
rd
Proc
ess
Act
ion
Tea
m
Subs
yste
m
A
Subs
yste
m
B
Subs
yste
m
C
Subs
yste
m
D
Subs
yste
m
E
Pro
cess
A
Pro
cess
B
Pro
cess
C
Pro
cess
D
Pro
cess
E
Tas
k
1
Tas
k
2
Tas
k
3
Proc
ess
Focu
s
Subs
yste
m F
ocus
Lin
king
Pin
Lin
king
Pin
Bus
ines
s Sy
stem
Foc
us
Tas
k
4
Tas
k
5
SMALL BUSINESS GUIDEBOOK TO QUALITY MANAGEMENT

24
It requires that the leader trust the employee, have faithin the employee’s ability, and believe the employee wantsto do a good job. It is important that leaders trust theiremployees and that they encourage them to take risks.The standard statement, “If you want the job done right,you have to do it yourself,” must be discarded. Withouttrust there is no real teamwork and there is no atmospherefor innovation. In that type of suboptimized workplace,there is no opportunity for real growth.
The transformation requires that the leader provide theemployee with the proper training, education, tools, andfacilities to accomplish the job. It requires that the leaderbe willing to delegate to the employees who operate aprocess the power to make decisions for its improvement.It requires that the leader not hold back information tosolidify his or her power base. In short, for some this willbe a massive transformation !
There are many advantages awaiting the leaders whosucceed with the transformation . The pool of experi-ence, brain power, and enthusiasm under the leader’s tu-telage is a massive asset for accomplishing the day-in andday-out activities of any business. The trusted, happyemployee is far less likely to cause headaches and ulcersfor his leaders and for himself than is the distrusted,unhappy employee. The employee who finds joy in hiswork is easily joined with other committed employeesinto effective working teams. Everybody wins in thistype organization: the employee, the leader, the organi-zation, the customer. The result is an optimization ofthe organization.
This is not to say that the leaders in an organization areprevented from making decisions. Leadership may chooseto approve or disapprove the recommended changes forimprovement provided by the employees, or they mayempower their employees to make those changes wherethey see fit.
Management must understand that a major part of theirjob is to predict. They must develop theories in order topredict, so they can make decisions based on those pre-dictions. The bottom line is that the leadership, havingthe overview of the whole system, is responsible fordecisions on matters related to the well-being of theorganization and the pursuit of its aim.
The transformation responsibilities that fall on yourshoulders, then, are as follows:
• Know and believe in the need to transform leader-ship and the organization.
• Change yourself to the new style of leadership.
• Be constant in your commitment to continualimprovement.
• Develop a detailed plan for the transformation .
• Be unflagging in your support for others involvedin the transformation .
Top management must understand that their role is tooversee the whole organization, the entire system. Theyneed to be in accord with the aim of that system. Theyneed to communicate that aim to all leaders and processoperators of the organization. Their responsibility isto optimize the system (company) in order to steer thatorganization toward its aim. Top management is notresponsible for managing the parts. That is the job ofmiddle managers and the process operators directlyinvolved with the subsystems and processes. In the opti-mized system, management and process operatorsthroughout the organization must function as a team. Theteam understands the aim and strives to reach it throughindividual effort and cooperative teamwork.
CHAPTER 3 – PLANNING

25
CHAPTER 4TEAMWORK
COMPETITION ORCOOPERATION?
Deming urges leaders to abandon competition and toseek cooperation. He promotes this change within yourorganization and externally with your “competitors.” Itshould be clear that internal competition is harmful tothe company and almost always harmful to efforts toachieve the company’s aim. When unit A of an organiza-tion competes against unit B of that organization, one ofthe units loses. The losing unit’s contribution toward theaim of the company is thereby lessened, and the com-pany loses. Deming’s approach is to create a win-winsituation whereby the company’s aim is achieved and noneof its units “loses.” This line of reasoning goes rightto the heart of the “systems” approach in ProfoundKnowledge. The optimization of the system is the over-riding matter of importance, not the strengthening ofone of the parts at the expense of any of the other partsin the organization.
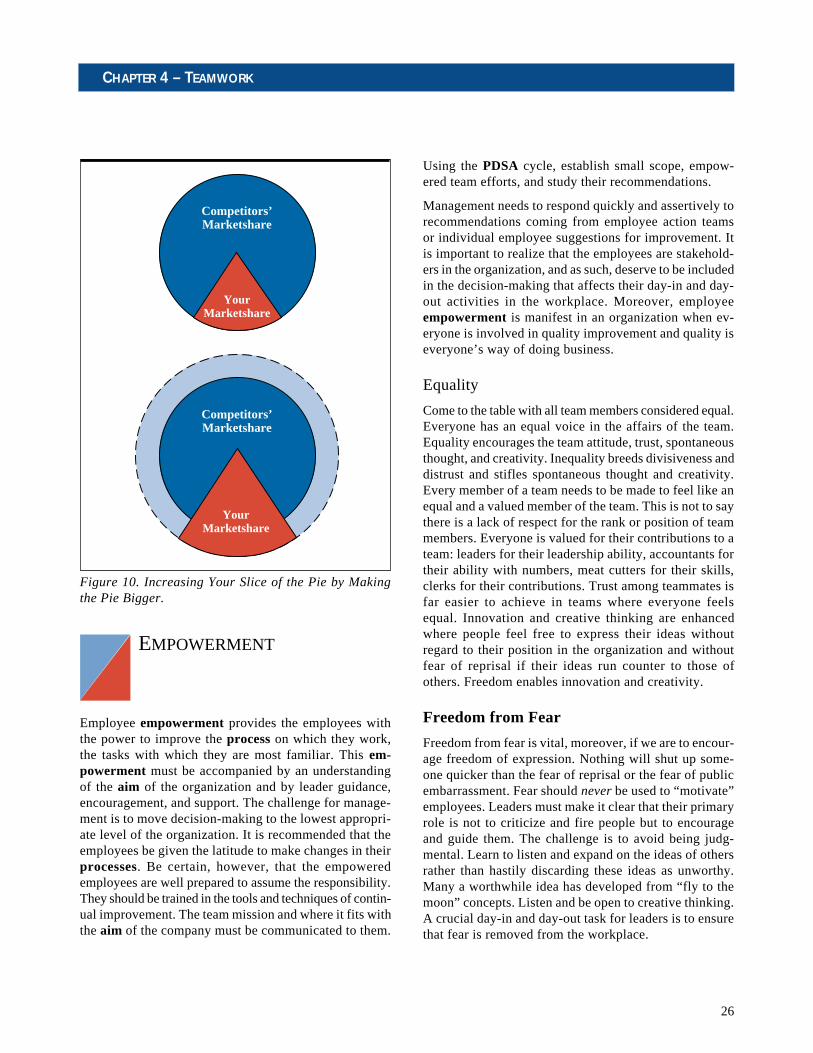
The switch from competition to cooperation with regardto external organizations is harder for some to accept.Nonetheless, it too is an important part of the systemsapproach envisioned in Profound Knowledge. Deming’spoint is that, rather than seek out a bigger piece of thepie by competing for it, make the pie bigger, in part, bycooperating with other companies. This results in an
increased pie slice for you as well as for the other com-panies. No one loses, another win-win situation. Deminguses a personal example of two service stations, each ofwhich owned a tow truck. Once when he called for a towtruck, the station he called sent over the truck owned bythe other station, presumably because the original station’struck was not available. The pooling of resources increasedthe market for each service station without decreasing themarket share of the other. The result was an increase intheir market and a win-win for both.34 This comparisonis visualized in Figure 10 below.
Teamwork is integral to a quality culture. Teamworkdepends on many factors. Team members need to feelequal, to feel free of fear, to experience joy in their work,to empathize with teammates, to have common objectives,to have the necessary knowledge, and to have a frame-work for action. Good leadership ensures that theseneeds are met, not only in action teams but in all facets ofthe company’s operation. Above all, employees need tofeel empowered to improve the processes on which theywork—in other words, to have some control over the thingsthat dominate their daily workday activities. There areother factors that go into creating good teamwork, butthe above list is critical to success.
SMALL BUSINESS GUIDEBOOK TO QUALITY MANAGEMENT
26
Using the PDSA cycle, establish small scope, empow-ered team efforts, and study their recommendations.
Management needs to respond quickly and assertively torecommendations coming from employee action teamsor individual employee suggestions for improvement. Itis important to realize that the employees are stakehold-ers in the organization, and as such, deserve to be includedin the decision-making that affects their day-in and day-out activities in the workplace. Moreover, employeeempowerment is manifest in an organization when ev-eryone is involved in quality improvement and quality iseveryone’s way of doing business.
Equality
Come to the table with all team members considered equal.Everyone has an equal voice in the affairs of the team.Equality encourages the team attitude, trust, spontaneousthought, and creativity. Inequality breeds divisiveness anddistrust and stifles spontaneous thought and creativity.Every member of a team needs to be made to feel like anequal and a valued member of the team. This is not to saythere is a lack of respect for the rank or position of teammembers. Everyone is valued for their contributions to ateam: leaders for their leadership ability, accountants fortheir ability with numbers, meat cutters for their skills,clerks for their contributions. Trust among teammates isfar easier to achieve in teams where everyone feelsequal. Innovation and creative thinking are enhancedwhere people feel free to express their ideas withoutregard to their position in the organization and withoutfear of reprisal if their ideas run counter to those ofothers. Freedom enables innovation and creativity.
Freedom from Fear
Freedom from fear is vital, moreover, if we are to encour-age freedom of expression. Nothing will shut up some-one quicker than the fear of reprisal or the fear of publicembarrassment. Fear should never be used to “motivate”employees. Leaders must make it clear that their primaryrole is not to criticize and fire people but to encourageand guide them. The challenge is to avoid being judg-mental. Learn to listen and expand on the ideas of othersrather than hastily discarding these ideas as unworthy.Many a worthwhile idea has developed from “fly to themoon” concepts. Listen and be open to creative thinking.A crucial day-in and day-out task for leaders is to ensurethat fear is removed from the workplace.
EMPOWERMENT
Employee empowerment provides the employees withthe power to improve the process on which they work,the tasks with which they are most familiar. This em-powerment must be accompanied by an understandingof the aim of the organization and by leader guidance,encouragement, and support. The challenge for manage-ment is to move decision-making to the lowest appropri-ate level of the organization. It is recommended that theemployees be given the latitude to make changes in theirprocesses. Be certain, however, that the empoweredemployees are well prepared to assume the responsibility.They should be trained in the tools and techniques of contin-ual improvement. The team mission and where it fits withthe aim of the company must be communicated to them.
CHAPTER 4 – TEAMWORK
Competitors’Marketshare
Competitors’Marketshare
YourMarketshare
YourMarketshare
Figure 10. Increasing Your Slice of the Pie by Makingthe Pie Bigger.

27
Joy in the Workplace
Fear and joy are not opposites, but fear can suppress joy.Most people have an intrinsic desire to do a good job.Everybody wants to be important. All employees need tobe given the benefit of the doubt that they can do goodwork and that they are important. Managers who nurturethis belief in their employees and who remove fearfrom the workplace find workers who experience joy.Workers who feel some control over their destiny in theworkplace and who feel their own importance for the workthey do tend to enjoy their work. Some necessary ingre-dients for this joy are as follows:
• Proper tools
• Good working conditions
• Good training
• Freedom from fear
• Guidance and empowerment
• Encouragement and praise
• Open communications
• Appropriate compensation
Appreciating Team Members
By careful listening we can better appreciate the strengthsin knowledge, experience, humor, persuasiveness, logic,ability, etc. that each team member possesses. Thisawareness is very helpful in the development of goodteamwork skills. We learn who to turn to for such mat-ters as legal help, financial advice, details, overviews,equipment limitations, and manpower availability. Themore awareness we have of our team members’ capa-bilities the better we can function as a team.
Common Objectives
It is important that each team member knows the objec-tives of the team. The mission of the process or subsystemon which the team is working is always to do somethingor make something for someone. Whatever the teamdoes, whether in a service industry or in a manufacturingcompany, it should be adding value to a product orservice. This value-added step is the key to any objec-tive. The team must always be aware of this focus. Again,this is the value-added imperative.
Knowledge
All members of the team need to possess the knowledgenecessary to complete their tasks. Managers who hold backinformation from the members of their teams are doingthemselves a disservice. Not only does this create dis-trust among the members, but it limits the team’s abilityto visualize the total picture of the system in which theyfunction. For example, there is no good reason to keepfrom employees information related to the company’ssales figures, hiring policies, future plans, and otherteam efforts. This kind of knowledge engenders trust andloyalty as well as providing a good perspective on thecompany, its aim, and its mission—all potentially usefulinformation for problem solving, innovation, and creativ-ity. Knowledge is power, so empower all employees withthe information they need to function as first-rate citi-zens in their company.
SMALL BUSINESS GUIDEBOOK TO QUALITY MANAGEMENT

29
FRAMEWORK FOR ACTION
When involving employees in continual processimprovement or in problem-solving action teams, do itin an organized manner. The PDSA cycle is a good, simpleand structured approach. Figure 11 shows the highlightsof a typical process improvement cycle.
Additional suggested details of the above procedureare included in Appendix C. This framework providesguidance that helps to avoid tampering with a processand introducing harmful or unnecessary changes. Whenused with action team continual process improvementmeetings, it ensures all team members understandthe process, what drives it, who contributes to it, whateveryone’s needs and concerns are, and what the customerwants. By going through the steps in order, the structuredprocess analysis approach saves time wasted in bounc-ing back and forth between analysis and solution stages,which usually results in a disorganized meeting, wastedtime, and the necessity for the group leader to push thegroup toward solutions just to get the job done.
CHAPTER 5TEAMS AND MEETINGS
Figure 11. PDSA Cycle and Process Improvement.
Describe and Definethe Process
Delineate Problemsand Variations
AnalyzeCausation
Develop Changesfor Improvement
Test Changes
Study Results
Adjust/MaintainProgress
DO
PLAN
STUDY
ACT
SMALL BUSINESS GUIDEBOOK TO QUALITY MANAGEMENT
30
MEETINGMANAGEMENT
Agendas and Facilitators
An agenda should be prepared prior to every meetingand distributed well in advance of the session. This isparticularly important if advanced preparation is requiredof the membership. The chairman normally prepares theagenda. However, a facilitator often assists in its prepa-ration. It is advisable to use a professional facilitator inearly meetings until the team becomes adept at self-facilitating. This will add to the cost of conducting meet-ings but should be more than offset by the time savedand the valuable guidance a facilitator will provide. Thefacilitator focuses on the conduct of the meeting ratherthan the content. The facilitator ensures the focus is main-tained and the appropriate team-building techniques areemployed. The facilitator also serves as quality advisorto the team.
Team Size
It is usually best to establish teams with between 5 and10 people. Fewer than 5 members on a team can proveto be nonrepresentative; there is more opportunity forindividual bias affecting team activities; and there arefewer people to contribute to the work of the team. Morethan 10 members can become cumbersome and unwieldy;more time is consumed ensuring that everyone has anopportunity to voice their ideas; and it is sometimesmore difficult for the group to reach a consensus oncontroversial issues. The smaller the team the betterthe chances of fast team action. Moreover, less effort isusually needed to reach consensus.
Ground Rules
One of the first things for team members to establishis a set of ground rules by which they will conduct allmeetings. It is essential that everyone understand and agreeto all the ground rules. The ground rules must be treatedas inviolable by the team. Some typical ground rules areas follows:
• Everyone is equal.
• One conversation at a time.
• No meetings held without an agreed upon quorum.
• All decisions will be reached by consensus.
• The 100-mile rule is in effect (meaning, it is asthough the meeting were being held 100 miles fromthe office—no interruptions).
• If requested, confidentiality will be honored byall team members (includes the facilitator andrecorder).
There are, of course many other possible ground rules.Each team must decide which rules are important to them.
Roles and Responsibilities
Each team should elect a team leader or chairperson anda recorder. Rank or position in the company should notbe considered a criterion for selecting a team leader.On long-term teams, the chairperson role is sometimesrotated every 6 months or every year. The responsibili-ties of the chairperson are to:
1. Call the meetings,
2. Reserve the meeting room,
3. Develop and distribute the agenda,
4. Focus on the content coverage of the session,
5. Assign action items,
6. Maintain all the official records of the meetings, and
7. Ensure compliance with the team charter.
The recorder records the highlights of the meeting, anyaction items that develop during the meeting, and otherimportant discussion points. It is usually not necessaryto keep verbatim minutes, but if this is felt necessary,then a professional recorder should be added. Normally,however, the recorder will just keep track of major itemsand prepare highlight minutes. Furthermore, the roleof recorder is usually rotated at each meeting. Thatpractice spreads the work load of recording over theentire membership.
Team Charter
Each team should be provided with a charter prior totheir first meeting. The charter should be prepared bythe management unit establishing the team. The chartershould include the following items:
• The aim and scope of the team’s activities
• The reasons for establishing the team
CHAPTER 5 – TEAMS AND MEETINGS
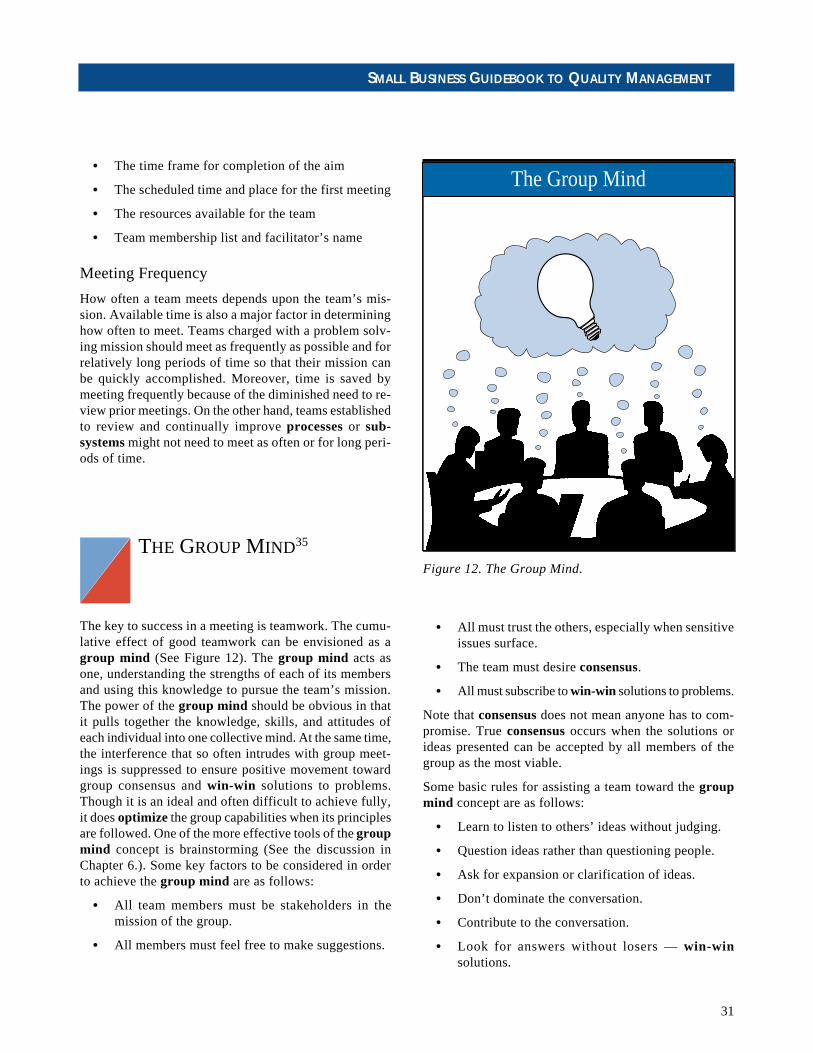
31
• The time frame for completion of the aim
• The scheduled time and place for the first meeting
• The resources available for the team
• Team membership list and facilitator’s name
Meeting Frequency
How often a team meets depends upon the team’s mis-sion. Available time is also a major factor in determininghow often to meet. Teams charged with a problem solv-ing mission should meet as frequently as possible and forrelatively long periods of time so that their mission canbe quickly accomplished. Moreover, time is saved bymeeting frequently because of the diminished need to re-view prior meetings. On the other hand, teams establishedto review and continually improve processes or sub-systems might not need to meet as often or for long peri-ods of time.
THE GROUP MIND35
The key to success in a meeting is teamwork. The cumu-lative effect of good teamwork can be envisioned as agroup mind (See Figure 12). The group mind acts asone, understanding the strengths of each of its membersand using this knowledge to pursue the team’s mission.The power of the group mind should be obvious in thatit pulls together the knowledge, skills, and attitudes ofeach individual into one collective mind. At the same time,the interference that so often intrudes with group meet-ings is suppressed to ensure positive movement towardgroup consensus and win-win solutions to problems.Though it is an ideal and often difficult to achieve fully,it does optimize the group capabilities when its principlesare followed. One of the more effective tools of the groupmind concept is brainstorming (See the discussion inChapter 6.). Some key factors to be considered in orderto achieve the group mind are as follows:
• All team members must be stakeholders in themission of the group.
• All members must feel free to make suggestions.
Figure 12. The Group Mind.
• All must trust the others, especially when sensitiveissues surface.
• The team must desire consensus.
• All must subscribe to win-win solutions to problems.
Note that consensus does not mean anyone has to com-promise. True consensus occurs when the solutions orideas presented can be accepted by all members of thegroup as the most viable.
Some basic rules for assisting a team toward the groupmind concept are as follows:
• Learn to listen to others’ ideas without judging.
• Question ideas rather than questioning people.
• Ask for expansion or clarification of ideas.
• Don’t dominate the conversation.
• Contribute to the conversation.
• Look for answers without losers — win-winsolutions.
The Group Mind
SMALL BUSINESS GUIDEBOOK TO QUALITY MANAGEMENT
32
• Don’t be locked in by old paradigms (old ways ofthinking about things).
• Avoid disagreement — look for something goodor something to build on in every idea.
• Avoid debating or fighting for an idea.
• Frequently review and summarize ideas, as you seethem.
• Stay focused — don’t jump ahead.
• Learn member strengths and exploit them.
• Listen!
MEMBERSHIPCRITERIA
Several criteria are extremely important when selectingteam membership. It is obviously important to selectpeople who have the time to meet and conduct the prob-able work of the team. However, if certain people arecritical operators of the process under study, make cer-tain they are included on the team whether they have thetime or not. The quality mission should take precedenceover all others. Prospective team members should be will-ing to join the team and be enthusiastic about the teamprocess. Ideally, those who supply something to the pro-cess (suppliers) and those who receive the output of theprocess (customers) under study should be representedon the team. Key to team membership, however, is toinclude those people closest to the operation of the pro-cess (task operators): the people who tighten the nuts,trim the produce, dot the “i’s,” and cross the “t’s.” It istheir process. They should have some excellent ideas onhow to improve it.
Listen to the process operators. The team also needs tohave a linking pin from the next higher level of manage-ment to ensure that the support is there from above andto facilitate good communications up and down thechain of command. In summary then, the membersshould be selected, by the following criteria:
• Willing to participate and enthusiastic;
• Suppliers to the process, if they are available;
• Customers of the process, if they are available;
• Key operators in the process;
• Linking pin from the next higher managementlevel; and
• Availability to do the expected work of the team.
CHAPTER 5 – TEAMS AND MEETINGS

33
CONSTANT CHANGE
Point 5 of Deming’s quality philosophy is ContinualProcess Improvement (CPI) of the process and its out-put. This does not mean that we should be changing allprocesses all the time. It does mean that we should monitorall processes regularly, and, when the opportunity arisesto eliminate unwanted variation or lessen the variationadversely affecting a process, we should proceed throughthe PDSA cycle to improve that process. Never be satis-fied that a process is “tolerable” or “under statistical con-trol.” “If it ain’t broke, don’t fix it” does not apply in aquality culture.
All processes are in a constant state of flux. Sometimesthey change ever so slightly and, other times, they changedrastically within a short period of time. Obviously,improving or changing a process can at times be morecostly and time-consuming than the value-added gainmight seem to warrant. Nevertheless, to achieve andmaintain a quality output, it is important that CPIbe used for all processes in a quality culture-drivenorganization. Moreover, because processes are alwayschanging, we should constantly and incessantly seekways to improve those processes. We improve theprocesses in order to lessen the cost added by adversevariation and to increase the value and usefulness ofthe output for the customer.
CUSTOMERSAND SUPPLIERS
Customers can be viewed at two basic levels. There areexternal customers and internal customers. The externalcustomers are the ones we usually think about when wethink of customers. They are the ones who purchase theproducts or the services. They write the checks. But thereare other customers too. The internal customers are anyof your company’s employees who receive a product orservice from any other employee or employees within thecompany. The engineers supply drawings to the shop fore-man. The foreman is the engineers’ customer, as is everyemployee who uses the drawings to construct the prod-uct. The people in shipping and sales are the customersof the shop. Employees submitting travel expense reportsare customers of the accountants.
On the other hand, all these customers (external andinternal) are furnished something by a supplier. Thesupplier, too, can be external and internal. More oftenthan not, we all play the role of supplier and of customerat one time or another in our daily work activities. Theengineers are suppliers in the example above, as are theforeman, the shop employees, accountants, etc. The sup-pliers must bear in the mind the needs and concerns ofthe customers. Business owners have internal suppliersand customers as well as external suppliers and custom-ers. Everyone must key on their customers’ satisfactionand reaction to products or services rendered.
CHAPTER 6CONTINUAL PROCESS IMPROVEMENT
SMALL BUSINESS GUIDEBOOK TO QUALITY MANAGEMENT

34
CPI is a major factor in determining the reaction of cus-tomers to products or services. Business as usual mightseem the shorter route to positive customer reactions,but as Figure 13 illustrates, the risks are far greater. Theexternal customers’ reaction to products or services cantake the six forms seen in Figure 13. They are as follows:
1. The customer may brag about your product orservice and remain a loyal customer;
2. The customer may brag about your product orservice, but might be lured away by more innova-tive, more convenient, better quality products orservices, etc.;
3. The customer may complain to you about the prod-uct or service received and remain a loyal customer,if your response is rapid and satisfactory;
4. The customer may complain to you about the prod-uct or service received and, without adequateresponse on your part, go elsewhere for futureproducts or services;
5. The customer may say nothing but still remain a loyalcustomer as long as your product or service meetshis needs; and
6. The customer may say nothing but might go else-where for the product or service you supply if itsquality, innovativeness, convenience, etc. does notsatisfy his needs.
It is, of course, reactions 2, 4, and 6 that all companieshope to avoid. That means lost business. But, theseadverse reactions can be countered by ensuring that CPIis a normal part of your organization’s culture. Beyondthe seriousness of losing business, as you might withreactions 2, 4, and 6, is the higher cost associated withincreased advertising, downsizing, reworking, etc. Addi-tionally, CPI can save you costs by improving processesbefore they cause the problems that appear in reac-tions 3 and 4 above. Preventive measures, which CPIstresses, will normally cost far less than problem solvingor fire fighting.
The first reaction is the one that every company wants.It is almost always necessary to be continually seekingways to improve the products or services being offeredand to meet with the customers’ expectations. Moreover,CPI can carry you beyond the customers’ expectationsby anticipating need and creating better products andservices. These are the ingredients that ensure customer
Complain,Loyal
Brag,Loyal
▲▲
Apparent LongRoute (CPI)
Figure 13. Customer Reactions—Avoiding Thin Ice.
Complain,Switch
Quiet,Switch
Brag,Switch
Apparent Short Route(Business As Usual)
Quiet,Loyal
CHAPTER 6 – CONTINUAL PROCESS IMPROVEMENT

35
loyalty. These are the things that keep your customersfrom going somewhere else for a product or service.
The third and fourth reactions are really opportunitiesfor you. Once a customer has complained to you about aproduct or service, you have the opportunity to create aloyal customer by rapidly responding to the complaintand providing a product or service that meets or exceedsthat customer’s expectations. The danger in 3 and 4 liesin the customer complaining to other customers or poten-tial customers. This can spread a bad reputation for yourfirm and eventual disaster. It is in your best interests toquickly mitigate complaints.
The majority of customer reactions normally falls in 5and 6 above. The difficulty with these reactions is thatthey might often be unknown to you. Is the customerhappy? Is the customer unhappy? Does your output meetthe customers’ needs or not? You can poll your custom-ers, but you might not get forthright answers. How canyou be sure your customers are satisified? The answer isCPI. Moreover, CPI can take you beyond just satisfyingyour customers. Customers are often not aware howimproved a product or service can be. Before we hadmicrowave ovens to bake a potato in 4 or 5 minutes, wewere delighted with the conventional oven that couldprovide enough heat to bake a potato in 45 minutes.Innovation, creativity and risk-taking are integral to CPI.They are often the key to increasing customer satisfac-tion by providing improved products or services thecustomer never dreamed were available.
The atmosphere that fosters innovation and creativityand allows risk-taking emanates from a quality culture-driven organization. In that type company, the processoperators feel empowered to improve continually theprocesses on which they work. These employees feel freeto take risks and seek innovative solutions without fearof reprisal. Therefore, management must not only takeinto consideration what the customers’ needs and con-cerns are but also the ideas and recommendations the pro-cess operators have for improvements to the process andsubsequent value-added products or services for the cus-tomer. (Refer to the earlier discussion on empowerment.)
At the same time, you need to listen to your customers soyou understand what they want. The job of bringing yourproducts or services up to a level that ensures customersatisfaction should be central to your operation. Alongwith that should be the desire to stay ahead of your cus-tomers’ expectations so they are not lured away by moreinnovative products or services.
VOICE OF THECUSTOMER/VOICEOF THE PROCESS
One of your major jobs, then, as a manager is to bringtogether the voice of the customer and the voice of theprocess. William Scherkenbach describes these two voicesand the manager’s responsibility to bring them togetherin his book, Deming’s Road to Continual Improvement.36
Scherkenbach calls the difference between the two voicesthe “gap.”
The gap is the opportunity for improvement that existswithin the process. However, the gap is not simply a dif-ference between two static points. “It incorporates thelocation, spread, and shape of each voice.”37 Figure 14on page 34 illustrates the two voices with a large gap.
The voice of the process is represented by the distribu-tion of actual shipping times from the date of the order.The voice of the customer is represented by the distribu-tion of shipping times requested by the customers of theprocess. The distribution in both voices is indicative ofthe variation that exists in both customers and processes.There are no two customers alike any more than two out-puts of a process are alike. The voice of the customerdoes show a cluster at and near the center line. This cen-ter line can be referred to as the optimal point, the pointwhere most customers are represented. It is the two opti-mal points in the voice of the customer and the voice ofthe process that management should seek to bring to-gether, though merging the spread and the shape of eachas well is the ultimate goal. The gap in Figure 14 showsthat the capability of the current shipping process is un-able to meet the voice of the customer. In all likelihoodthe process will have to be redesigned in order to closethe gap that exists. Dramatic changes will be necessaryto bring the two voices together.
Figure 15 on page 34 illustrates the two voices close toeach other. In this case, the gap appears to be small enough,with sufficient overlap of the distributions, that continualimprovement can bring the two voices into harmony.It shows that actual shipments have to a large extentmet with the voice of the customer. Continual improve-ment of the process will help close the gap between thetwo voices.
The lesson of the two voices is that it is vital to bring thevoice of the customer and the voice of the process to-gether. Furthermore, it is management’s job to ensure that
SMALL BUSINESS GUIDEBOOK TO QUALITY MANAGEMENT
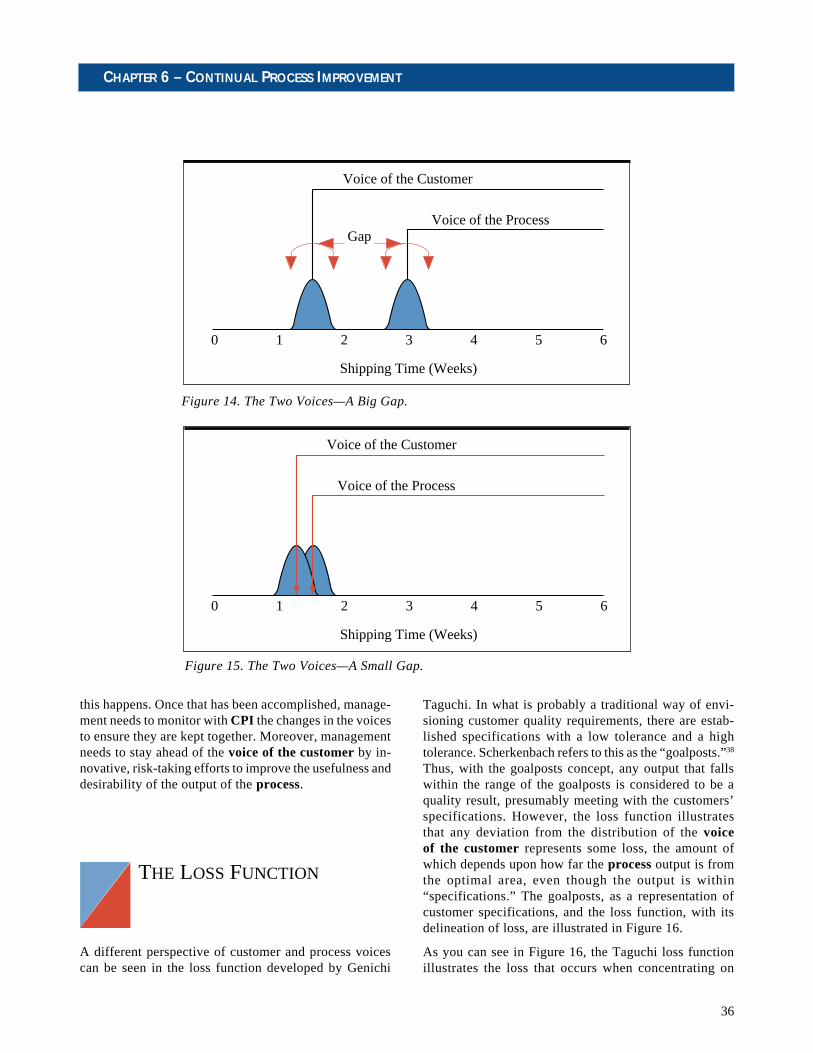
36
Figure 14. The Two Voices—A Big Gap.
Figure 15. The Two Voices—A Small Gap.
this happens. Once that has been accomplished, manage-ment needs to monitor with CPI the changes in the voicesto ensure they are kept together. Moreover, managementneeds to stay ahead of the voice of the customer by in-novative, risk-taking efforts to improve the usefulness anddesirability of the output of the process.
THE LOSS FUNCTION
A different perspective of customer and process voicescan be seen in the loss function developed by Genichi
Taguchi. In what is probably a traditional way of envi-sioning customer quality requirements, there are estab-lished specifications with a low tolerance and a hightolerance. Scherkenbach refers to this as the “goalposts.”38
Thus, with the goalposts concept, any output that fallswithin the range of the goalposts is considered to be aquality result, presumably meeting with the customers’specifications. However, the loss function illustratesthat any deviation from the distribution of the voiceof the customer represents some loss, the amount ofwhich depends upon how far the process output is fromthe optimal area, even though the output is within“specifications.” The goalposts, as a representation ofcustomer specifications, and the loss function, with itsdelineation of loss, are illustrated in Figure 16.
As you can see in Figure 16, the Taguchi loss functionillustrates the loss that occurs when concentrating on
0 1 2 3 4 5 6
Gap
Shipping Time (Weeks)
Voice of the Customer
Voice of the Process
Voice of the Process
0 1 2 3 4 5 6
Shipping Time (Weeks)
Voice of the Customer
CHAPTER 6 – CONTINUAL PROCESS IMPROVEMENT

37
customer specification limits as targets for output. Thelesson of the loss function is to align the voice of theprocess with the voice of the customer, and, asScherkenbach urges, seek to emulate the location, spread,and shape of the voice of the customer. That is the opti-mal area for the output of the process. To view your cus-tomers’ requirements simply as though they fit betweenthe goalposts will result in losses for your customers andfor you. The loss function theory is crucial to continualimprovement. It will help you minimize the loss.
PROBLEM SOLVINGAND CPI
In many respects problem solving and CPI have thesame purpose. The aims of each function are to singleout unwanted variation in a process, find its causation,and establish changes or solutions to overcome or, at least,ameliorate the causes of the variation thereby improvingthe process and increasing the value-added features ofthe output. If a special cause exists, the process is un-predictable until the special cause has been removed orincorporated. In accord with the Deming philosophy, CPIshould be a basic concept of any quality-driven company.It is an ongoing process. Too often the unwanted varia-tion in processes is left untouched until it causes a majorproblem. Then the fire fight begins. Sometimes, as wehave discussed earlier, the problem shows up in the formof customer complaints or lost business.
Nevertheless, the procedures and the tools used infirefighting, or problem solving, and in CPI are muchthe same. It is more comforting, however, to solve prob-lems in a relatively unhurried process such as CPI ratherthan in the panic that usually accompanies fighting fires.This is not to mention the injury done to your standingwith the customer receiving the faulty product or serviceor to your reputation as a result of the shoddy work. Whyuse your customers as filters for poor products or ser-vices?
The PDSA steps presented earlier represent a thorough,methodical approach to problem solving. It is difficult,particularly in firefighting situations, to take the time tofollow each of the steps in that approach; but, properlydone, the problem solving process is greatly enhanced.Even though the process cannot guarantee success, it canprovide good insurance to protect against making changesthat cause more problems than they overcome.
One of the most important elements of problem solvingis information. Without the proper information problemscannot be solved with any degree of reliability. Solelyusing gut feelings to solve problems can often cause moreproblems than are solved. The CPI tools and techniquesare intended to present and clarify information so it canbe better understood where the causation lies and whatkind of variation is affecting the process.
Figure 16. The Goalposts and The Loss Function.
The Goalposts(Within Specifications)
Voice of the Customer
The Loss Function(Optimal Output)
Voice of the Customer
LOSS LOSS
SMALL BUSINESS GUIDEBOOK TO QUALITY MANAGEMENT
38
VARIATION
Few, if any, processes are ever constant; they are alwaysin a state of flux. Over time the people, the materials, theenvironment, the methods, and the equipment change.These changes are called variations. Common Causevariations exist because of the process itself or the wayit is managed. Special Cause variations are unpredict-able abnormalities not part of the process. Special causesare often specific to the people, the materials, the envi-ronment, the methods, or the equipment involved withthe process. At times they appear as a drastic abnormal-ity that is not normally a part of the process or the way itis managed. When special cause variation is affectinga process, it is impossible to accurately predict whatwill occur in the process. The process is then consideredto be unstable. You will recall it is management’s jobto predict. Therefore, the very crux of management’sreason for being is affected when the process is unstable.
Common cause variation is to be expected in a process.When only common cause variation is affecting a pro-cess, it is possible to predict, within a range, what willoccur in the process. The process is then considered to bestable. Obviously, it is desirable to be able to predict howa process will function. However, when special causesare affecting a process, it is not possible to predict how aprocess will function. As we will see there are some teststhat can help us determine the presence of special cause.
Many times special cause variation is not readily appar-ent. The manager sees poor output and comes to a hastyconclusion about the cause. Often the employee is blamedfor the poor output, when the fault lies in special causesor in the normal variation that occurs in that process.Sometimes the manager decides the process is faulty andchanges the procedures or methods used, when the faultlies in forces outside the process. In either case, withoutthe knowledge of what kind of variation is affecting theprocess to cause the poor results, the manager is actingblindly. The results can be disastrous and expensive.
Imagine a trucking company attempting to maintain a tightshipping schedule. One truck on a particular route sud-denly begins to arrive at its destination consistently late.The manager, without attempting to understand the un-welcome variation, presses the driver to try to meet theschedule. The driver blames the heavy traffic. Occasion-ally, there is improvement. But the late arrivals continue.The manager offers bonuses to drivers who arrive onschedule. Still the one truck runs behind schedule. Themanager threatens the driver with pay reductions, formalpenalties and dismissal. The lateness continues. Whatshould the manager do?
The manager has already made a thorough mess of thesituation. The cause or causes for the lateness need to beuncovered. There appears to be a process shift in the caseof this truck’s route. The manager needs to find out whetherthe reason for the shift is special cause or common cause.If the reason is determined to be common cause, thenways should be found to improve the process in order tominimize the degree of lateness. However, careful inves-tigation might find that the variation is special cause, suchas a factory along the route that has changed its closinghour. The new closing hour happens to precede the timethe truck is passing the factory. Thus, there is a suddenincrease in traffic as the workers leave the factory. Thisis a special cause emanating from outside the truckingcompany’s process but having a direct adverse impacton the route in question. With this knowledge the man-ager can change the roads the truck follows or change thetime of departure so as to avoid the factory closing time.In this way, the manager can eliminate the special causeand bring the process back into control.
Proceeding as the trucking company manager did at firstcould have caused unwanted results. The driver might havetried to drive over the speed limit causing an accident ora speeding ticket. Or the driver might have gotten frus-trated enough to quit under the pressure. Other driversmight have benefitted by receiving bonuses, but it wouldhave resulted in considerable cost to the company. Noneof those actions would have resolved the unwanted varia-tion. It is, then, important to determine the presence ofspecial cause variation before taking action.
CHAPTER 6 – CONTINUAL PROCESS IMPROVEMENT

39
But, not all special cause is that easy to identify. Theway to find a special cause is to use run charts and con-trol charts. These tools require a sufficient number of datapoints plotted over time. Use of a control chart requiressome statistical knowledge in order to determine theupper and lower control limits. There are several teststhat can be used with run charts to provide indications ofspecial causes in a process. Some guidelines and pitfallsfor dealing with variation are shown in Figure 17.
Typeof Cause Action Taken Result
Common CPI or Good—LikelyImprovement to improveof the process output
Common Adjust process Tampering—to counter per- Likely to causeceived special more variationcause
Special Improve process Likely toto counter per- increase costceived common forevercause
Special Removing or Good—likelyincorporating to increasespecial cause predictability
Figure 17. Good and Bad Effects of Process Changes.
When special cause variation is located we should removeit; unless, the result of the special cause variation is animprovement in quality. In that case, it is desirable toattempt to locate the source of the special cause andsomehow emulate it. More often than not, however, thetask at hand is to remove the special cause variation. Atthis point it is very important to distinguish betweenspecial cause and common cause. To attempt to improvethe process to adjust for special cause variation is likelyto increase costs with no long-term gain. On the otherhand, finding and removing the special cause of varia-tion will improve the process and improve its predict-ability. If only common cause variation is affecting aprocess, the normal variation in a stable process can bedealt with by continual process improvement or byredesigning the process in order to improve it. Manage-ment very often makes the mistake of treating adversevariation as though it were special cause, when it is ac-tually common cause. Another mistake managementmakes is to blame a variation on common cause whenspecial causes are at fault.
The reasons for removing adverse special cause varia-tion are:
• Reduce variation to improve predictability,
• Stabilize the process in order to improve it,
• Avoid having it come back and bite you when youleast expect it,
• Reduce costs by eliminating unnecessary changesto processes and reducing dependence on inspec-tion, and
• Improve the quality of output.
SMALL BUSINESS GUIDEBOOK TO QUALITY MANAGEMENT

40
THREE IMMEDIATELYUSEFUL TOOLS
There are many tools available for use in the CPI cycle.The three most useful, however, are flowcharts and, asmentioned, run charts and control charts. Flowcharts arevery useful in visually displaying the steps in a process.Run charts and control charts are important for providinginsight into the kind of variation and extent of variationthat is affecting a process.
Flowcharts
It is almost always useful to flowchart the process underanalysis. The values of flowcharting are as follows:
• Visualizes the entire process from beginning to end
• Illustrates the sequence of events
• Visualizes relationships between tasks in the process
• Highlights any duplication
• Highlights potentially unnecessary tasks
• Establishes the relative complexity of the process
Time, distance, weight, number counts, manpower lev-els, and such measures, can be added to flowcharts to addmeaning and give more data for comparison purposes.When using flowcharts, it is best to use a consistent setof symbols to represent the different actions in the flow.Figure 18 shows some of the most used symbols. Manydictionaries have an extensive listing of flowchart sym-bols in their signs and symbols tables.
With very complex processes it is recommended thattwo flowcharts be prepared: one to show an overviewof the major steps in the process and the other to showthe detail. It is advisable to use the flowchart as a teameffort. This collective approach will often provide better
Figure 18. Flowchart Symbols39.
coverage because people see different things in a pro-cess. One of the focuses of the flowchart is to determinethe existence of duplicate and wasted tasks. The first flow-chart of a process should illustrate the current situation,the way you think the process actually works now.Another chart might need to be prepared to illustratehow the process is supposed to flow, if that flow is dif-ferent from the current situation. When reaching thesolution stage of problem solving, it is often useful tocreate an ideal flowchart to illustrate a far simplerapproach to accomplish the aims of the process. Figure19 on page 39 is a sample flowchart.
Start/Stop
Processing
Directionof Flow
On-LineStorage
Decision
Connector
Document
CommunicationLink
A
CHAPTER 6 – CONTINUAL PROCESS IMPROVEMENT

41
Figure 19. A Sample Flowchart.
Mail Response System
MailReceived
MailResponses
Engineering
Accounting
Sales
Administration
OpenMailand
StampDate
FoldLetter and
Stuff Envelope
FileOriginal and
Response
ReadLetter
WhoGets theLetter?
ReceiveAnswered
Letters
CopyComplete
File
Sealand
Stamp
TypeEnvelopes
StapleEnvelopeto back of
Letter
E
A
S
ADM
SMALL BUSINESS GUIDEBOOK TO QUALITY MANAGEMENT
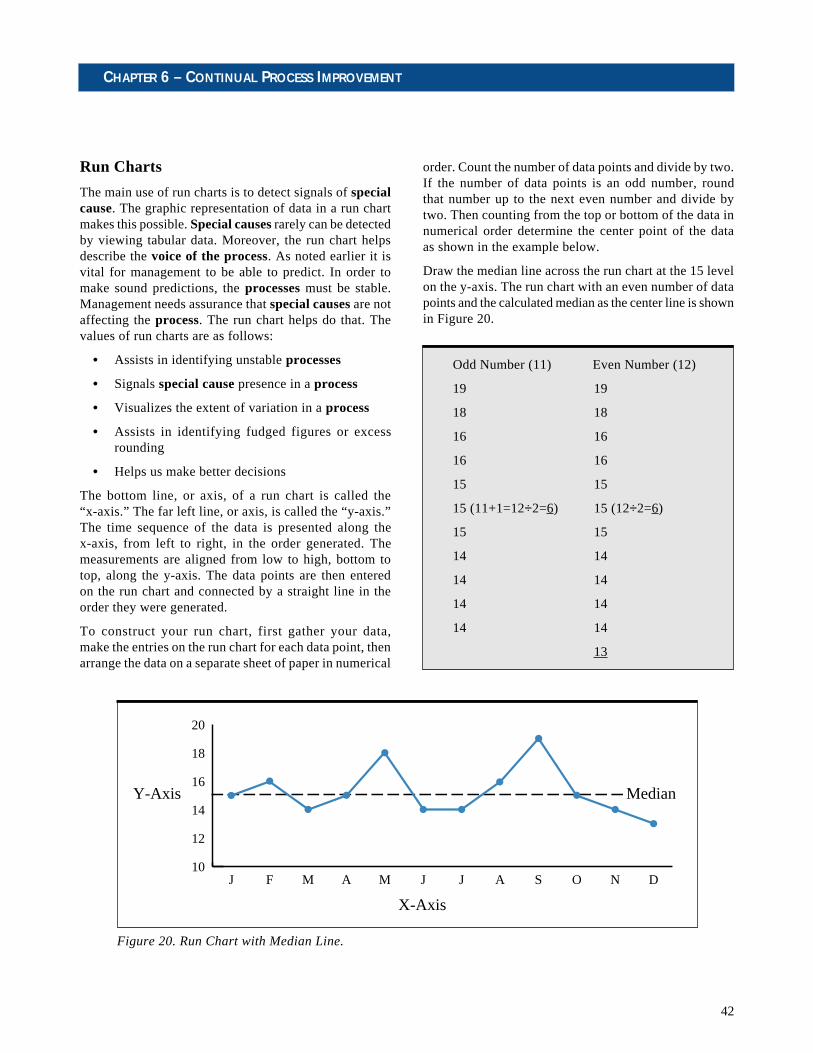
42
Run Charts
The main use of run charts is to detect signals of specialcause. The graphic representation of data in a run chartmakes this possible. Special causes rarely can be detectedby viewing tabular data. Moreover, the run chart helpsdescribe the voice of the process. As noted earlier it isvital for management to be able to predict. In order tomake sound predictions, the processes must be stable.Management needs assurance that special causes are notaffecting the process. The run chart helps do that. Thevalues of run charts are as follows:
• Assists in identifying unstable processes
• Signals special cause presence in a process
• Visualizes the extent of variation in a process
• Assists in identifying fudged figures or excessrounding
• Helps us make better decisions
The bottom line, or axis, of a run chart is called the“x-axis.” The far left line, or axis, is called the “y-axis.”The time sequence of the data is presented along thex-axis, from left to right, in the order generated. Themeasurements are aligned from low to high, bottom totop, along the y-axis. The data points are then enteredon the run chart and connected by a straight line in theorder they were generated.
To construct your run chart, first gather your data,make the entries on the run chart for each data point, thenarrange the data on a separate sheet of paper in numerical
order. Count the number of data points and divide by two.If the number of data points is an odd number, roundthat number up to the next even number and divide bytwo. Then counting from the top or bottom of the data innumerical order determine the center point of the dataas shown in the example below.
Draw the median line across the run chart at the 15 levelon the y-axis. The run chart with an even number of datapoints and the calculated median as the center line is shownin Figure 20.
Odd Number (11) Even Number (12)
19 19
18 18
16 16
16 16
15 15
15 (11+1=12÷2=6) 15 (12÷2=6)
15 15
14 14
14 14
14 14
14 14
13
Figure 20. Run Chart with Median Line.
10
12
14
16
18
20
DNOSAJJMAMFJ
X-Axis
Y-Axis Median
CHAPTER 6 – CONTINUAL PROCESS IMPROVEMENT

43
There are several available tests with run charts for deter-mining the existence of special causation in a process.40
Test 1. One means of using run charts to test for specialcausation involves first totalling the runs on the chart. Arun is one or more consecutive data points on the sameside of the median. To determine the number of runs, countthe number of times the line connecting consecutive datapoints crosses the median. Add one to that number for atotal number of runs in the run chart. Use that number withTable 2 to test for runs below the lower limit or above theupper limit. The first column of Table 2 is the total datapoints on the run chart other than those points that fall onthe median line. When a run chart shows a number ofruns that fall below or exceed the limits, it is a signalspecial cause variation is affecting the process.
Figures 21 and 22 illustrate the use of this test to detectsignals of special causation.
Note that there are four run crossings of the median inFigure 21. Now add one to the total to get five. There are19 data points not located on the median in the chart, solocate the number 19 in the first column of Table 2 andfollow this row across to the second column, which indi-cates a minimum of 6 runs. One can conclude there is asignal of special cause in these data with only five runswhere the table indicates a minimum of six runs. Table 2. Number of Runs Above and Below the Median.*
Total data pointson chart that are Lower limit Upper limitnot on median no. of runs no. of runs
10 3 811 3 912 3 1013 4 1014 4 1115 4 1216 5 1217 5 1318 6 1319 6 1420 6 1521 7 1522 7 1623 8 1624 8 1725 9 1726 9 1827 9 1928 10 1929 10 2030 11 20
Figure 21. Too Few Runs.
0
20
40
60
80
100
Median
NOSAJJMAMFJDNOSAJJMAMFJ
1988 1989
Number ofEngineeringChanges
SMALL BUSINESS GUIDEBOOK TO QUALITY MANAGEMENT
*Adapted from lecture materials presented by HeeroHacqebord.

44
Figure 22 illustrates 16 median crossings. Add 1 to thatto get 17. There are 21 data points not located on themedian, so go to the 21 row in Table 2. The third column
indicates the upper limit of runs to be 15. Again there is asignal that special cause exists in the process representedby this chart because of too many runs.
Figure 22. Too Many Runs.
Figure 23. Runs Too Long.
Test 2. Another test using the median line on a run chartchecks for runs that are too long. Ignoring any data pointsthat fall on the median line, a run of eight or more datapoints in a run chart with 20 or more points is a goodindication of special causation. A run of seven in a run
chart with fewer than 20 points is another indicator.Figure 23 illustrates this test.
Note in this illustration that there are nine data pointsin the run above the median signaling the presence of spe-cial cause.
0
20
40
60
80
100
special cause signal
Median
OSAJJMAMFJDNOSAJJMAMFJ
1988 1989
Number ofEngineeringChanges
0
20
40
60
80
100
1988 1989
Number ofEngineeringChanges
Median
NOSAJJMAMFJDNOSAJJMAMFJ
CHAPTER 6 – CONTINUAL PROCESS IMPROVEMENT

45
Note that in Figure 24 the data points from April throughNovember of 1989 are not considered a special causesignal because the August and September data pointsare the same thereby breaking the consecutive increasedownward.
Test 3. Testing for special causation without using themedian line can be accomplished in several ways. Ignor-ing consecutive repeated values, a run of six or more pointseither increasing or decreasing in the same direction isan indicator of special causation. This test is illustratedin Figure 24.
Figure 25. The Saw-Tooth Pattern.
Figure 24. Trends.
Test 4. Sequences of 14 or more points alternating upand down in a saw-tooth pattern suggest the presence of a
special cause. This signal is illustrated in Figure 25. It is oftenthe result of overadjustment or tampering with the process.
0
20
40
60
80
100
special cause signal
1988 1989
Number ofEngineeringChanges
NOSAJJMAMFJDNOSAJJMAMFJ
0
20
40
60
80
100
1988 1989
Number ofEngineeringChanges
NOSAJJMAMFJDNOSAJJMAMFJ
SMALL BUSINESS GUIDEBOOK TO QUALITY MANAGEMENT

46
Test 5. Sequences of seven or more consecutive pointsthat have identical values also suggest special causation.
Often this filter indicates figure fudging or excessiverounding off. It is illustrated in Figure 26.
Figure 26. Too Many Identical Values in Succession.
0
20
40
60
80
100
NOSAJJMAMFJDNOSAJJMAMFJ
1988 1989
Number ofEngineeringChanges
CHAPTER 6 – CONTINUAL PROCESS IMPROVEMENT

47
Control Charts
The control chart is another way to describe the voiceof the process. It has two basic uses: detecting specialcause variation in the history of the process and estab-lishing limits by which to predict the progress of aprocess. When the upper or lower limits in a control chartare exceeded by one or more data points, it is an indica-tion of the presence of special causation.
The control chart is a time series chart, like a run chart,with an upper control limit and a lower control limit.However, the center line in a control chart is usually theaverage of the data, whereas run charts normally use themedian of the data. Control chart limits are establishedby the use of historical data and a statistical formula. Thelimits are not set as management goals or targets nor arethey customer specification limits.
The limits are guidelines for indicating special causa-tion; they are not infallible. Occasionally, a process thatappears to be stable—within the control limits—mayactually be affected by special causes. The values of acontrol chart are as follows:
• Identifies whether a process has been operatingunder control
• Signals special cause presence in a process
• Visualizes the extent of variation in a process
• Uses control limits as a basis to establish a pro-cess’ average and variability now and to predictit in the future
Setting control limits for control charts requires somestatistical knowledge. There are several methods for set-ting control limits. One simple method for establishingcontrol limits is as follows:
1. Gather data.
2. Total data.
3. Calculate data average by dividing total by thenumber of data entries. Data average = X, or X bar.
4. Calculate the moving ranges (mR, or mR tilde),differences between consecutive data entries, andreorder them high to low.
5. Determine the median of the moving ranges.
6. Multiply the median of the moving ranges by 3.14.
7. Add/subtract the result of step 6 to/from the dataaverage to attain the upper/lower control limits.
12134023411
–
˜
˜
˜
–
–
–
–
This method of calculating control chart limits is shownin the example below and in Figure 27. Other tests forspecial causes using control charts are located in Appen-dix D. These tests and accompanying notes were devel-oped by Dr. Lloyd S. Nelson and cited by Dr. Deming inOut of the Crisis.41
The control chart is similar in construction to the run chart.The x-axis and y-axis serve the same general purposes.As noted above, the median of the data points is ordi-narily not used as the center line of the control chart.The more common center line in a control chart is theaverage (sometimes called the sample average) of the data.A common form of control chart uses the ranges thatoccur between consecutive data points to help in thecalculation of control limits. Using the same data fromFigure 27, we can calculate these moving ranges as follows:
Month Datum Point RangeJanuary 15February 16March 14April 15May 18June 14July 14August 16September 19October 15November 14December 13
Now reorder the ranges in numerical order to locate themedian moving range (mR): 4, 4, 3, 3, 2, 2, 1, 1, 1, 1, 0.Divide the number of range points by two (in this casethere are 11 range points, so we round up to 12) and usethe result (6) to locate the sixth range from the top orbottom of the ranges in numerical order (2). We cancalculate the sample average (X) of our data by totallingthe data points (183) and dividing by 12 to get an X valueof 15.25. We now have X and R with which we cancalculate the limits of the control chart. The formula forthis calculation is as follows: X ± (R x 3.14) = UCL/LCL.
Taking our data from above then we can fill in the for-mula as follows:
X ± (mR x 3.14) = UCL/LCL15.25 + 6.28 = 21.53 UCL15.25 - 6.28 = 8.97 LCL
We can now add the limits to our control chart, showingan apparently stable process. The resultant control chartis shown in Figure 27 on page 46.
˜–
˜
SMALL BUSINESS GUIDEBOOK TO QUALITY MANAGEMENT
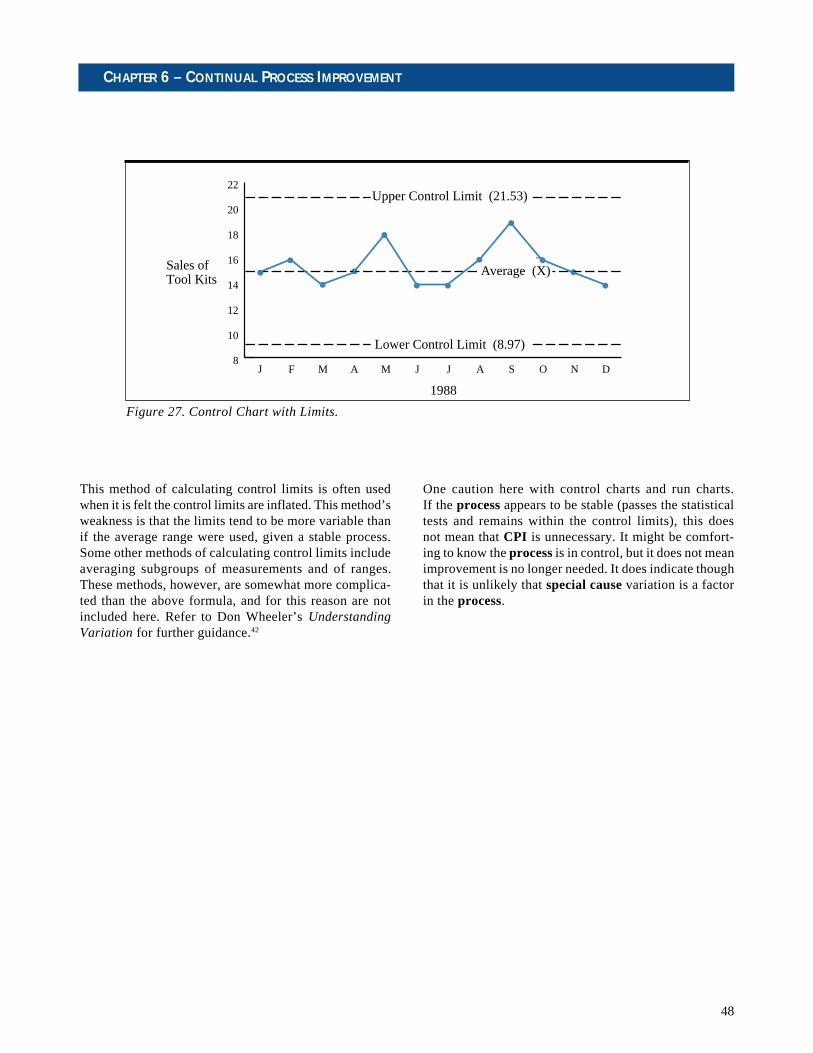
48
Figure 27. Control Chart with Limits.
This method of calculating control limits is often usedwhen it is felt the control limits are inflated. This method’sweakness is that the limits tend to be more variable thanif the average range were used, given a stable process.Some other methods of calculating control limits includeaveraging subgroups of measurements and of ranges.These methods, however, are somewhat more complica-ted than the above formula, and for this reason are notincluded here. Refer to Don Wheeler’s UnderstandingVariation for further guidance.42
One caution here with control charts and run charts.If the process appears to be stable (passes the statisticaltests and remains within the control limits), this doesnot mean that CPI is unnecessary. It might be comfort-ing to know the process is in control, but it does not meanimprovement is no longer needed. It does indicate thoughthat it is unlikely that special cause variation is a factorin the process.
–
1988
Sales ofTool Kits
Average (X)
Upper Control Limit (21.53)
Lower Control Limit (8.97)8
10
12
14
16
18
20
22
DNOSAJJMAMFJ
CHAPTER 6 – CONTINUAL PROCESS IMPROVEMENT

49
OTHER TOOLS
Cause and Effect Diagrams
Cause and effect diagrams are used primarily to assistin locating the causes of problems. They can take theform of the “fishbone chart” or can be done in outlineform subordinating the causation factors until arrivingat the basic causes. The values of using cause and effectdiagrams are as follows:
• Helps organize major effects (symptoms) ofproblems
• Assists in evaluation of causation
• Illustrates relationships among problems andadverse effects
• Provides trail to follow when seeking primarycausation
Figure 28 shows the outline format, often depicted in afishbone diagram. The outline format delineates the cau-sation factors so that the further to the right you look, themore primary the cause. The search for the primary cau-sation of adverse effects assists in avoiding the mistakeof treating the symptoms of a problem rather than treat-ing the basic cause of the problem. In other words, besure that you have isolated a cause of the problem notone of its effects. The typical problem has more than onecause, and efforts to uncover the so-called “root cause”may be mere exercise if other causation exists. If the rootcause can be located and if it can be defined as the majorcause for most of the bad effects, then by all means put apriority on removing that cause or ameliorating it. Figure29 on page 48 is an example of a fishbone diagram. Notethe major headings: people, methods, materials, environ-ment, and equipment. They represent the usual inputs andoutputs to every process.
Copier ProblemI. PEOPLE
A. Employees1. Full time2. Part-time
B. Training1. Formal
a. Recentb. Adequatec. Consistent
2. On-the-Joba. Recentb. Frequent
II. METHODSA. Manufacturer’s recommended proceduresB. Manufacturer’s recommended materialsC. Consistent
III. MATERIALSA. Paper
1. Size2. Thickness
a. Too thickb. Too thin
Figure 28. A Sample Cause and Effect Outline.
3. Condition of originalsa. Creasedb. Poor quality
B. Toner1. Too little2. Too much3. Lumpy4. Too thin
IV. ENVIRONMENTA. Temperature
1. Too hot2. Too cold
B. Humidity too highC. Dusty
V. EQUIPMENTA. Condition
1. Dirty2. Foreign objects3. Old4. Worn
B. Maintenance agreement1. Recent maintenance2. Preventive maintenance
SMALL BUSINESS GUIDEBOOK TO QUALITY MANAGEMENT

50
Fig
ure
29
. A
Sa
mp
le F
ish
bo
ne
Dia
gra
m.
Peo
ple
Met
hods
Mat
eria
lsE
quip
men
t
Poo
r C
opie
s
Con
ditio
n
Hum
idity
too
high
Tem
pera
ture
Dus
ty
Con
sist
ent M
aint
enan
ce
Ton
er
Em
ploy
ees
Tra
inin
g
Rec
ent
Ade
quat
eR
ecen
t
Poor
Qua
lity
Cre
ased
Too
thic
k
Too
thin
Freq
uent
Con
sist
entFormal
On-the-Job
Part-time
Fulltime
Procedures
Too little
Recent
Preventive
Old
DirtyWorn
Foreign objects
Too thin
Too much
Lumpy
Condition of originals
Thickness
Size
Too hot
Too cold
Materials
Pape
r
Mfg
. Rec
omm
ende
dEnv
iron
men
t
CHAPTER 6 – CONTINUAL PROCESS IMPROVEMENT

51
Checksheets
The checksheet takes many forms. Its basic purpose is toorganize pertinent data in order to ensure certain tasks,events, measurements, and other essential elements takeplace as expected or planned. The values of a checksheetare as follows:
• Organizes pertinent data points for analysis
• Reminds us to complete all tasks in a process
• Provides an efficient means to collect data
• Visualizes patterns of data
• Illustrates sequence of events and relationships
• Provides opportunity to collect data for furtheranalysis
As noted, the checksheet can take many forms depend-ing on its purpose and the process in which it is used. Itcan be used as a control device to remind the operatorthat certain tasks need to be completed and to remind theoperator of the sequence of those tasks. Checksheets canbe used to record data or visually depict results as theyoccur. For example, the exact place a variation occurs canbe recorded on a graphic depiction of the product underanalysis. The time of the occurrence can also be recorded,and so on. A sample of a checksheet is in Figure 30.
Figure 30. A Sample Checksheet.
Brainstorming
Teams may achieve the goals of the cause and effectdiagram by using effective brainstorming techniques.In this procedure the group keys on the major effect ofthe problem. The aim is to present as many factors asthe group imagination allows that might be causing theadverse effects. All ideas should be written down on flipchart paper, a white board, or other visual aid so thatthey can be viewed by the team. This will assist teammembers in building on other ideas to create new ones.When all ideas have been presented, the group then evalu-ates the stated causes and arrives at a consensus on cau-sation. Once the causes of a problem are uncovered, it isessential to determine if special cause variation is present.
Brainstorming is a tool that can be used at almost alllevels of CPI. It is often very effective in developingsolutions to problems. It is very effective in creationand innovation efforts with teams. It can be done individ-ually or in groups. It can be conducted silently or aloud.It is usually best to record all ideas presented so that theparticipants can clearly see them. The results of effectivebrainstorming are some of the fruits of the group mindconcept. Some of the values of brainstorming are:
• Encourages creativity and innovation
• Encourages contributions from all team members
SMALL BUSINESS GUIDEBOOK TO QUALITY MANAGEMENT
X
X
XXX X
X
X
X
X
X
X
X
XXX
XX
X = Incidents of Solder Defects
CircuitBoardSolderDefects
Checksheet

52
Histograms
Histograms (bar graphs) organize and summarize data forvisual analysis. The values of histograms are as follows:
• Allows rapid identification of the “shape” of data
• Facilitates comparisons among data categories
The histogram is a useful tool particularly when attempt-ing to describe a process or system. Be alert, however,that to be effective histograms must be derived from stableprocesses. Histogram data are not in a time series, so oneshould be careful not to distort the meaning of the databy shielding it with a histogram. A histogram, as well asa table of the data, make good supporting material forrun charts and control charts. A sample histogram is inFigure 31.
Pareto Charts
The Pareto chart is based on the premise that 80% of theadverse effects in a process come from 20% of the causes.The Pareto chart is a form of the histogram. The valuesof the Pareto chart are as follows:
• Assists in setting the priorities of causation
• Illustrates individual causation impacts
The Pareto chart is particularly useful where it is impor-tant and relevant to set the priorities of causation. Figure32 is a sample Pareto chart. Note the line indicating thecumulative effect of the causation impacts.
There are many other tools that can be used to assistin understanding the processes, the problems andthe adverse effects. See the books in Appendix B forfurther guidance.
Figure 31. A Sample Histogram.
Figure 32. A Sample Pareto Chart.
0
20
40
60
80
Numberof People
Miles
Personnel Commuting Distance
100
40+
2
353025
27
20
41
15
59
10
50
5
22
1
10
0
20
40
60
90%95%
98%100%
80
Rate ofIncidence(Pct.)
Personnel Reasons for Resignation
100
OtherPersonalCareerChange
MoreMoney
BetterJob
CHAPTER 6 – CONTINUAL PROCESS IMPROVEMENT

53
MEASUREMENT
One of the major elements needed to determine theprogress and success of your transition to a quality cul-ture is your system of measurements. Measurements arenecessary to locate your opportunities for improvement.They are necessary to prioritize these opportunities.They are necessary to help show you where to improve.They are necessary to evaluate the progress you havemade. They are necessary to determine where you wantto go. They are necessary to assure you that you havegotten there—or that you haven’t. They play a majorrole in the PDSA cycle. Measurements are vital to anyquality culture.
One of the first steps in using measurement is to deter-mine what it is you want to measure. The best startingpoint is with the key quality characteristics of the prod-uct or service. Key quality characteristics are those el-ements most vital to the function of a service or productand most important to customers of the service or prod-uct. For example, some of the key quality characteristicsof an automobile are good brakes and comfortable sus-pension. Some of the key quality characteristics of apayroll system might be on-time checks and accuratechecks.
Once it is known which key quality characteristics areto be measured, it is necessary to provide clear opera-tional definitions of them. An operational definition is“an agreement by a supplier and a customer that a certainprocedure carried out by a supplier will be useful to themboth. The usefulness of the operational definition is de-termined by the location, spread, and shape of the out-comes (voice of the process) relative to the aim (voiceof the customer).” 43 A good operational definition willnot only describe the appearance of the key quality char-acteristic but also the intent behind it. Moreover, an op-erational definition converts a concept into a measurementof some kind. As William Scherkenbach describes it, “op-erational definitions are the link between the letter of thelaw and the spirit of the law.”44 Defining on-time checksin the payroll system, for example, might involve stipu-lating the exact time span, designating where the checkis to be delivered, or providing alternate procedures whenthe payment due date occurs on a holiday. It is particu-
larly important to define clearly and reach agreement withyour customer on the key quality characteristics of theproduct or service you are providing. By “good brakes”does your customer mean front disk brakes, four-wheeldisc brakes, or antilock brakes? Or does the customer meansome hard-to-define quality in the operation of the brakesdescribed by negatives such as not jerky, not grabbing,or not mushy? It is important that the supplier understandas much as possible the operational definitions being usedby the customer.
Operational definitions of key quality characteristicslead us to what we should be measuring. Then, we needto determine three vital things:
1. The method of measurement, or test, for each keyquality characteristic,
2. The criteria for judgement or analysis of data, and
3. The decision as to whether the results indicate thedegree that the criteria were or were not met.
One method for gathering useful data is to ask your cus-tomers. You might have already done this to determinethe key quality characteristics. Other means of collect-ing data usually involve gathering numbers over time toprovide useful data. You need to determine the scope ofyour measurements in order to ensure the validity of theresultant numbers. You need to determine the numberof data points and the period of time over which theyoccur to ensure adequate coverage and to ensure the abil-ity to test for special causes. You need to determine whattools will be used to assist you with the analysis. Theflowchart, run chart, and control chart should almostalways be used to analyze processes. Cause and effectdiagrams/outlines, Pareto charts, and brainstorming areoften used tools.
Measurements are very necessary after process improve-ment efforts have been taken. How well have youimproved the process? Have you caused unforeseen vari-ations by changing the process? Does the process needmore improvement now? Should you change policy orpermanently institute these changes? How well has theimprovement team performed? All these questions cometo the front after making changes to a process. A goodsystem of measurements can answer all these questions.Measurements are a major part of the plan and study por-tions of the PDSA cycle.
SMALL BUSINESS GUIDEBOOK TO QUALITY MANAGEMENT

55
PLAN• Develop plans to train top management in the quality
management philosophy.
• Develop plans to provide all employees with basicquality management training.
DO• Train top managers.
• Train employees.
STUDY• Assess management training.
• Assess employee training.
ACT• Revise/institutionalize management training program.
• Revise/institutionalize employee training program.
PLAN• Begin strategic planning with top management
(Avoid emulating other companies. Do it yourway!).
• Conduct PDSA steps outlined in Chapter 3.
CHAPTER 7STRATEGIES
BEGIN THETRANSFORMATION
There are a multitude of things an organization can do toget started on the transformation to quality management.However, there are a few important factors necessary inany successful QM effort:
• Start with top management support, nurture withtop management support, and maintain top man-agement “constancy of purpose.”
• Ensure that all personnel understand theorganization’s aims and guiding principles.
• Ensure that all personnel have at least introductorytraining in the QM philosophy. Then, encourageand assist all personnel in further education andtraining.
• Ensure that process improvement teams receivetimely training and proper facilitation.
• Delegate authority to the lowest appropriate level.
• Focus on meeting or exceeding the customers’requirements.
• Make CPI the common practice throughout thecompany.
• Integrate the PDSA cycle into all company activities.
The path to QM is a long one and needs to be negotiatedwith care and with patience. The following are some typi-cal steps to begin down this path.
SMALL BUSINESS GUIDEBOOK TO QUALITY MANAGEMENT
56
DO
• Conduct strategic plan review with all employees(Listen to their suggestions, answer their questions,and make necessary revisions.).
• Begin strategic planning action items (Select smallscale, relatively easy action items. This will buildconfidence and develop credibility for the process.).
STUDY
• Review action results.
• Review status of strategic plan.
ACT
• Institutionalize action steps deemed successful.
• Revise actions needing further work.
PLAN
• Decide how to recharge the company infrastructure .
• Develop action initiatives (Remain cautious, moveslowly. Avoid overworking your personnel.).
DO
• Establish management teams and action teamswhere necessary.
• Develop cross-functional teams where processesinvolve more than one operating unit.
STUDY
• Analyze team recommendations.
ACT
• Respond to teams re: management decisions.
• Incorporate accepted changes or recycle efforts.
PLAN
• Review strategic plan.
• Revise and update action items.
These are just a few of the steps to begin the transitionto a quality culture. It is important that training and edu-cation becomes a centerpiece in the plan for the future ofyour company. As Deming wrote, don’t expect “instantpudding.” Remain constant in purpose. Put the customerfirst. Continually improve your processes, subprocesses,and the system. Continue to use the PDSA cycle.
A L AST WORD
According to Dr. Deming, it is the unknown and unknow-able that have the greatest impact on quality. Not all thingscan be measured. Not all variation is identifiable. Cus-tomers do not always accurately express their expecta-tions. Employees who appear happy may be unhappy.Processes that appear stable may not be. Etcetera. Thepotential customers in the United States and in many coun-tries around the world are becoming more and more con-scious of quality. Whether your intended customer is DoD,other government agencies, or the general public, it makessense to cut your costs by improving your quality therebyenhancing your products or services in the marketplace.The challenge lies with each of us to reach for the kind ofbusiness culture that will succeed in spite of the unknownand the unknowable. The quality management philoso-phy enhances the search for this culture.
Though, as noted in Chapter 1, large businesses in Americahave taken the lead in seeking quality improvement, manysmall businesses are beginning to seek a means to im-prove the quality of their output. The task for small busi-nesses might seem formidable. It is a challenge. Thestreamlined nature of small businesses, however, and thelack of a “bureaucracy” to battle gives some advantageto the small business. And American small businessmanagers are up to the task. The theories described inthis handbook should help you develop the best directionfor your company to take to improve quality. The rest isup to you. “Stay the course!” And as Deming was fondof saying, “Just do it!”
CHAPTER 7 – STRATEGIES
57
1Small Business Administration, “The State of SmallBusiness: A Report of the President” ( Washington, DC,1991).
2Karen Bemowski, “Small in Size But Not in Stature,”Quality Progress, (November 1992): 23-27.
3Ibid., derived from data presented.
4Mark Henricks, “Quality Makes a Difference,” SmallBusiness Reports 17, no. 12 (December 1992): 29-38.
5W. Edwards Deming, The New Economics (Cambridge,MA: MIT Center for Advanced Engineering Study,1993), 2.
6U.S. Office of Personnel Management, Introduction toTotal Quality Management in the Federal Government,Federal Total Quality Management Handbook series,#TQMHB-3, (Washington, DC: Federal Quality Insti-tute, 1991) 19.
7Bemowski, idem, Quality Progress, 9.
8National Standards Association, Inc.(Gaithersburg,MD).
9W. Edwards Deming, Out of the Crisis (Cambridge,MA: M.I.T. Center for Advanced Engineering Study,1986), 3 (slightly modified).
10 Deming, idem, Out of the Crisis.
11 Deming, idem, New Economics.
12 Deming, idem, Out of the Crisis, the points are listedon pp. 23-23, and Deming follows with a detailed dis-cussion of each point.
ENDNOTES
13 Ibid., the diseases are listed on pp. 97-98, and Demingfollows with a detailed discussion of each disease.
14 Ibid., 126.
15 Ibid., 127.
16 Ibid., 128.
17 Ibid., 130.
18 Ibid., 130.
19 Ibid., 131.
20 Ibid., 133.
21 Ibid., 133.
22 Ibid., 134.
23 Ibid., 135.
24 Ibid., 138.
25 Ibid., 139.
26 Ibid., 139.
27 Ibid., 141.
28 Ibid., 142.
29 Ibid., 143.
30 Deming, idem, Out of the Crisis, 23-148.
31 Deming, idem, New Economics, 60. Adapted fromDeming’s chart.
32 Deming, idem, New Economics, 125.
SMALL BUSINESS GUIDEBOOK TO QUALITY MANAGEMENT
58
33 Ibid., 52.
34 Ibid., 92.
35 This concept was used by William Bloom in groupdiscussion classes at Bowdoin College during the 1960’sand in training sessions for Process Action Teams inthe Joint Chiefs of Staff at the Pentagon in the 1990’s.
36 William W. Scherkenbach, Deming’s Road to ContinualImprovement (Knoxville, TN: SPS Press, 1991).
37 Ibid., 64.
38 Ibid., 250.
39 Webster’s Ninth New Collegiate Dictionary, (1985),“Signs and Symbols,” 1535.
40 Much of the material in this section was gatheredfrom one of Heero Hacquebord’s excellent seminars,“Statistical Thinking for Leaders,” presented at thePentagon in 1993.
41 Deming, idem. Out of Crisis, 321
42 Donald J. Wheeler, Understanding Variation, the Keyto Managing Chaos (Knoxville, TN: SPC Press, 1993.
43 Furnished by William Scherkenbach, January 21, 1994.
44 Scherkenbach, idem, 219.
45 Lloyd S. Nelson, “Technical Aids,” Journal of QualityTechnology 16, no. 4 (October 1984), 238-239. This en-tire appendix is quoted directly from the above citedarticle.
46 Generally, the individuals chart is based on “count” datausually determined by empirical observation. The X barchart uses data comparing count data by measurementssuch as percentages. Both X bar and X charts normallyuse arithmetic averages to determine the centerline.
47 Three sigma is the result one gets from using the vari-ous formulas to determine the upper limit and lowerlimit of a control chart. By breaking the control chartinto sigma zones, Dr. Nelson provides a further abilityto test for signals of special cause when the processappears to be within the control limits.
ENDNOTES

59
GLOSSARY
Aim . The purpose of a system, subsystem and process.The vital element of an organization that must be under-stood by all employees of the organization.
Common Cause. Any variation that is common to a pro-cess. When only common cause variation exists in a pro-cess, it is said to be stable, and predictions about theprocess can be made within a range of values.
Consensus. Agreement reached collectively by two ormore persons with which everyone can abide though itmight not be everyone’s first choice. This agreement doesnot involve concessions or compromise on anyone’s part.
Constancy of Purpose. The unflagging support neededfor a quality culture, particularly by top management. Thepatience and persistence required over time to seek, toachieve, and to maintain a quality culture.
CPI . Continual Process Improvement. The ever-watchful tenet of the Deming theory of managementthat epitomizes the desire for better and better quality.Does not connote a constant improvement in a processbut a continual awareness of processes and their chang-ing need for improvement. Usually takes place in steps.
Empowerment. The act of enabling employees to makedecisions, or at least recommendations for changes, withregards to the processes on which they work. Pushingdecision-making to the lowest possible level.
APPENDIX A
Infrastructure . The organizational structure from whicha company functions. In a quality-centered company, thisstructure is keyed to quality, good communications, anddecision-making at the lowest reasonable level.
Group Mind . The cumulative effect of good teamwork.This concept is an ideal that envisions a synergy of thebest in knowledge, abilities, and attitudes of all teammembers into one powerful, collective mind.
Key Quality Characteristics. Those elements most criti-cal to the function of a product or service as envisionedby the customer of the product or service. It is importantthat the producer and customer agree to operational defi-nitions of these characteristics.
Linking Pin . On quality teams the representative fromthe next higher management level who serves as the com-munication link to the team to ensure open communica-tion lines and to ensure upper management support forthe team’s activities.
Optimization . Ensuring the system is as functional andeffective as possible. This means the system’s aim is beingachieved, even though portions of the system may not beperforming at their best. This requires a systems view.
PDSA. Plan-Do-Study-Act cycle developed by Dr.Deming. It is the guide toward learning and improvement,a procedure to follow to monitor processes/systems andto make changes.
SMALL BUSINESS GUIDEBOOK TO QUALITY MANAGEMENT

60
Process. Any activity that takes an input, adds value, andproduces an output. It always has a beginning and an end.Two or more processes make up a subsystem or a system.
Profound Knowledge. The philosophy espoused byDr. Deming that centers on the theories of systems,variation, knowledge, and psychology—and their inter-relationships.
Special Cause. Any variation that is caused from outsidethe process or that is not common cause. The existenceof special cause variation in a process makes it anunstable process, and no reliable predictions about theprocess can be made.
Suboptimization. Said of a system that is not as func-tional and effective as it could be. Often characterized byinternal competition or over-emphasized subsystems with-out regard to the aim of the system.
Subsystem. Comprised of two or more related processes,these units are the major parts of a system.
System. The whole organization, the company, that is theresponsibility of top management. This is usually madeup of two or more subsystems forming the whole.
Tasks. The steps in a process. The individual activitiesthat make up the parts of any process.
Transformation . A change to a new paradigm of man-agement (Deming). The necessary change to fully acti-vate the quality-driven organization. It must be understoodand desired by all members of the organization. It placesthe emphasis on the individual’s and the organization’spotential rather than on their past or present state.
Value-added Imperative. The requirement that everyprocess add value to the input, which becomes the value-added product or service output of the process. If value isnot added, consider abolishing the process.
Voice of the Customer. The distribution representing whatthe customers want. Management should seek to ensurethat the voice of the process agrees with this distribution.
Voice of the Process. The distribution representing theoutput of the process. The control chart can be used to des-cribe the voice of the process. Management should seekto close the gap between it and the voice of the customer.
Win-Win . The desired solution to problems and to com-pany increased marketshare. In this scenario, there areno losers. Solutions or initiatives are sought that involvecooperation rather than competition.
APPENDIX A
61
SUGGESTED FURTHERREADING
Deming, W. Edwards. Out of the Crisis. Cambridge, MA:M.I.T. Center for Advanced Engineering Study, 1986.(His initial book on quality management.)
________. The New Economics. Cambridge, MA: M.I.T.Center for Advanced Engineering Study, 1993.(The book reflects the maturity of Deming’s philoso-phy, in particular with regard to Profound Knowl-edge — Must reading.)
Ishikawa, Kaoru. Guide to Quality Control. Tokyo,Japan: Asian Productivity Organization, 1976.(Very heavy on the statistical approach to manufac-turing, but most of the concepts can be translated tothe service area.)
Neave, Henry R. The Deming Dimension. Knoxville, TN:SPC Press, 1990.(A very helpful discussion of the 14 Points, the DeadlyDiseases and the Obstacles.)
Ott, Ellis R. Process Quality Control. New York, NY:McGraw- Hill, 1975.(A thorough statistical book directly related to theuse of Control Charts.)
APPENDIX B
SMALL BUSINESS GUIDEBOOK TO QUALITY MANAGEMENT
Scherkenbach, William W. Deming’s Road to ContinualImprovement. Knoxville, TN: SPS Press, 1991.(Most recent book by one of the leading DemingMasters. This is Must reading for its discussion ofthe Voice of the Process and the Voice of the Cus-tomer.)
________. The Deming Route to Quality and Productiv-ity. Rockville, MD: Mercury Press, 1987.(Good basic book relating the Deming philosophy.)
Wheeler, Donald J. Understanding Variation, the Key toManaging Chaos. Knoxville, TN: SPC Press, Inc.,1993.(Excellent statistical book on variation. Short, to thepoint, description of control charts and formulas forcalculating upper and lower control limits. Good forthe busy executive who wants to understand the topic.)
________ and Chambers, David S. Understanding Sta-tistical Process Control. Knoxville, TN: SPC Press,1986.(A more detailed treatment of the topic for the leadmathematician/statistician.)

63
SOME DETAILEDPDSA STEPS
Plan
1. Define the process.— Where does it begin?— Where does it end?— What does it do?— What is the value-added imperative?
2. Describe the process.— Have team Flowchart the steps.— Gather data to describe the process over
time using such tools as run charts andcontrol charts.
— Establish the criteria that limit the processsuch as people, equipment, environment,materials, and methods.
— Describe time and distance measures for tasks.
3. Describe the players.— Who are the external suppliers for this process?— Who are the ultimate customers for the output?— Who are the internal suppliers from task to task?— Who are the internal customers from task to task?— Who are the operators of the process?
4. What are the ultimate customers’ expectations?— What does the customer expect of the output?— What does the customer do with the output?— When does the customer want the output?
— Where does the customer want the outputdelivered?
5. What are the needs and concerns of the internalsuppliers?
6. What are the needs and concerns of the internalcustomers?
7. What are the needs and concerns of the processoperators?
8. Determine what historical data is available tounderstand the workings of the process and theexpectations of the customer using such tools ascustomer surveys and checksheets.
9. Determine what data is needed to give a betterunderstanding of the process and the expectationsof the customer.
10. Determine what variations exist in the process andwhat problems are perceived.
11. Determine whether special cause variation isadversely affecting the process using run chartsand control charts.
12. Use cause and effect diagrams or brainstormingto determine the primary causation.
APPENDIX C
SMALL BUSINESS GUIDEBOOK TO QUALITY MANAGEMENT

64
13. Describe the effects of the variations/problems.
14. Set the priorities of the variations/problemsusing special cause variation as a first priorityand Pareto charts for all variation.
15. Develop potential changes/solutions usingbrainstorming and cause and effect diagrams.
16. Test these changes/solutions against the earlierdeveloped criteria and dependencies.
— Are the criteria still met?— Might any of the dependencies be adversely
affected?— Might any new adverse variations/problems
be developed?
Do
1. If possible, conduct a pilot study to test theimpact of the changes/solutions using customersover time.
Study
1. Study the results of the pilot study.
2. Determine whether value has been added tothe output.
— Will the output meet or exceed the customers’expectations?
— Is the output better now than before thechanges?
3. Develop measures of success or progress.
— How will we know the changes/solutionsare successful?
— How can we monitor this success?
4. Develop implementation plan.
— How are these changes/solutions going tobe established?
— When are they going to be established?— How do we standardize these changes/solutions?
Act
1. Standardize and establish changes/solutions.
2. Establish data collection to measure processactivity.
Plan
1. Recycle the PDSA.
2. Establish regular period for review of the process.
APPENDIX C
65
APPENDIX D
CONTROL CHARTTESTS45
Refer back to Chapter 6, pp. 45-46, for the discussion oncontrol charts. These are tests, other than the first listed,that can be used to detect possible special cause varia-tion without regard to the upper and lower control limits.
Notes on Tests for Special Causes
1. These tests are applicable to X charts and toindividuals (X) charts.46 A normal distribution isassumed. Tests 1,2,5, and 6 are to be applied tothe upper and lower halves of the chart separately.Tests 3,4,7, and 8 are to be applied to the whole chart.
2. The upper control limit and the lower control limitare set at three sigma above the centerline and threesigma below the centerline.47 For the purpose ofapplying the tests, the control chart is equallydivided into six zones, each zone being one sigmawide. The upper half of the chart is referred to as A(outer third), B (middle third) and C (inner third).The lower half is taken as the mirror image.
3. When a process is in a state of statistical control,the chance of (incorrectly) getting a signal for thepresence of a special cause is less than five in a thou-sand for each of these tests.
4. It is suggested that Tests 1, 2, 3, and 4 be appliedroutinely by the person plotting the chart. The over-
SMALL BUSINESS GUIDEBOOK TO QUALITY MANAGEMENT
all probability of getting a false signal from one ormore of these is about one in a hundred.
5. It is suggested that the first four tests be augmentedby Tests 5 and 6 when it becomes economically desir-able to have earlier warning. This will raise the prob-ability of a false signal to about two in a hundred.
6. Tests 7 and 8 are diagnostic tests for stratification.They are very useful in setting up a control chart.These tests show when the observations in a sub-group have been taken from two (or more) sourceswith different means. Test 7 reacts when the obser-vations in the subgroup always come from bothsources. Test 8 reacts when the subgroups are takenfrom one source at a time.
7. Whenever the existence of a special cause is sig-naled by a test, this should be indicated by placing across just above the last point if that point lies abovethe centerline, or just below it if it lies below thecenterline.
8. Points can contribute to more than one test. However,no point is ever marked with more than one cross.
9. The presence of a cross indicates that the process isnot in statistical control. It means that the point isthe last one of a sequence of points (a single point inTest 1) that is very unlikely to occur if the processis in statistical control.
10. Although this can be taken as a basic set of tests,analysts should be alert to any patterns of points thatmight indicate the influences of special causes intheir process.

66
Control Chart Tests.
A
X
X
X
X
X
X
X
XX
X
X
X
X
BC
C
ALCL
X
UCL
B
Test 1. One point beyond Zone A
A
BC
C
ALCL
X
UCL
B
Test 2. Nine points in a row inZone C or beyond
A
BC
C
ALCL
X
UCL
B
Test 3. Six points in a row steadilyincreasing or decreasing
A
BC
C
ALCL
X
UCL
B
Test 4. Fourteen points in a rowalternating up and down
A
BC
C
ALCL
X
UCL
B
Test 5. Two out of three points in a row in Zone A or beyond
A
BC
C
ALCL
X
UCL
B
Test 6. Four out of five points in a row in Zone B or beyond
A
BC
C
ALCL
X
UCL
B
Test 7. Fifteen points in a row inZone C (above and belowcenterline)
A
BC
C
ALCL
X
UCL
B
Test 8. Eight points in a row onboth sides of centerlinewith none in Zones C
APPENDIX D

67
BIBLIOGRAPHY
Bemowski, Karen. “Small in Size But Not in Stature.”Quality Progress (November 1992): 23-27.
Deming, W. Edwards. Out of the Crisis. Cambridge, MA:M.I.T. Center for Advanced Engineering Study, 1986.
________. The New Economics. Cambridge, MA: M.I.T.Center for Advanced Engineering Study, 1993.
Hacquebord, Heero. Derived from seminar entitled,“Statistical Thinking for Leaders” (1993).
Henricks, Mark. “Quality Makes a Difference.” SmallBusiness Reports 17, no. 12 (December 1992): 29-38.
Ishikawa, Kaoru. Guide to Quality Control. Tokyo,Japan: Asian Productivity Organization, 1976.
Joiner, Brian. Fourth Generation Management. New York,etal: McGraw-Hill, Inc., 1993
Land, George and Jarman, Beth. Breakpoint and Beyond.New York, NY: Harper Business, 1992.
Neave, Henry R. The Deming Dimension. Knoxville, TN:SPC Press, 1990.
Nelson, Lloyd S. “Technical Aids,” Journal of QualityTechnology 16, no. 4, October 1984.
Ott, Ellis R. Process Quality Control. New York, NY:McGraw Hill, 1975.
APPENDIX E
SMALL BUSINESS GUIDEBOOK TO QUALITY MANAGEMENT
Scherkenbach, William W. Deming's Road to ContinualImprovement. Knoxville, TN: SPS Press, 1991.
________. The Deming Route to Quality and Productiv-ity. Rockville, MD: Mercury Press, 1987.
Small Business Administration. “The State of Small Busi-ness: A Report of the President.” Washington, DC, 1991.
U.S. Office of Personnel Management. Introduction toTotal Quality Management in the Federal Government.Federal Total Quality Management Handbook series,#TQMHB-3. Washington, DC: Federal Quality Institute,May 1991.
Webster's Ninth New Collegiate Dictionary, Springfield,MA: Merriam-Webster Inc., 1985.
Wheeler, Donald J. Understanding Variation, the Key toManaging Chaos. Knoxville, TN: SPC Press, 1983.
________ and David S. Chambers, Understanding Sta-tistical Process Control. Knoxville, TN: SPC Press, 1986.
Related Documents