Chemical Engineering Science 58 (2003) 275 – 286 www.elsevier.com/locate/ces Small bubble formation via a coalescence dependent break-up mechanism K. L. Tse a , T. Martin b , C. M. McFarlane a , A. W. Nienow a ; ∗ a Centre for Formulation Engineering, University of Birmingham, Edgbaston, Birmingham B15 2TT, UK b DSM Research, P. O. Box 18, 6160, Geleen, The Netherlands Received 14 June 2002; received in revised form 2 September 2002; accepted 17 September 2002 Abstract A mechanism has been elucidated for the coalescence-mediated break-up of bubbles in gas–liquid systems. Images taken from dynamic systems (a coalescence cell and laboratory-scale bubble columns) show that in some instances the coalescence of two bubbles is accompanied by the formation of a much smaller daughter bubble. Following the coalescence process an annular wave is formed due to the very rapid expansion of the hole following the instant of lm rupture. As the wave moves along the length of the bubble, away from the point of rupture it causes a rippling eect which distorts the newly coalesced bubble and may result in the formation of an unstable extension. Instabilities due to the annular wave pinch o a portion of this extension, resulting in the generation of a small daughter bubble. In coalescence dominated systems the process results in the generation of signicant numbers of bubbles much smaller (100 –200 m diameter) than the Sauter mean diameter (3–4 mm). ? 2002 Elsevier Science Ltd. All rights reserved. Keywords: Bubble; Coalescence; Break-up; Multiphase Flow; Mixing 1. Introduction In processes involving the dispersion of one or more gases into a liquid, it is necessary to control the bubble size dis- tribution in order to achieve the process aim. This depends in turn, on understanding the equilibrium between bubble coalescence and break-up occurring in the bulk uid. In ad- dition to the eects of process variables, such as gas ow rate and for mechanically agitated systems, impeller speed, this equilibrium will depend on the nature of the gas–liquid interfaces and the interactions between the bubbles them- selves. The constant collisions between bubbles in dynamic systems may lead to coalescence, whereas interactions be- tween the bubbles and uid stresses may result in bubble break-up. Generally, the two processes are not considered to be interdependent, occurring as they doing under very dierent conditions. Bubble coalescence depends not only on local ow conditions, (which determine collision veloc- ities and bubble densities), but is also crucially inuenced ∗ Corresponding author. Tel.: +44-121-414-5325; fax: +44-121-414-5324. E-mail address: [email protected] (A. W. Nienow). by the nature of the gas-liquid interface itself, to the extent where systems containing signicant concentrations of elec- trolytes, organic species or surfactants are often described as coalescence inhibited. In contrast, bubble break-up is found to depend very much on local hydrodynamic considerations (e.g. the micro scale of turbulence, Prince & Blanch, 1990) and in particular the eects of wake shear and bubble insta- bilities. Amongst the literature on bubble sizes in gas-liquid sys- tems, there are a small number of studies highlighting coa- lescence dominated systems which contain, in addition to the large bubbles expected, signicant numbers of very small bubbles (Machon, Pacek, & Nienow, 1997; Martin, 1996). Both these studies were carried out in air–water systems, using a non-invasive measurement technique to determine bubble sizes in stirred vessels. As a consequence of their size, these very small bubbles were hidden in volume prob- ability density functions and only became apparent when the data was viewed in terms of number population distri- butions. Both authors have noted the fact that these very small bubbles are observed only in systems considered to be fully coalescing and where the Sauter mean bubble size is very much larger (generally 2 orders of magnitude greater). 0009-2509/02/$ - see front matter ? 2002 Elsevier Science Ltd. All rights reserved. PII:S0009-2509(02)00528-6

Welcome message from author
This document is posted to help you gain knowledge. Please leave a comment to let me know what you think about it! Share it to your friends and learn new things together.
Transcript
Chemical Engineering Science 58 (2003) 275–286www.elsevier.com/locate/ces
Small bubble formation via a coalescence dependentbreak-up mechanism
K. L. Tsea, T. Martinb, C. M. McFarlanea, A. W. Nienowa ;∗
aCentre for Formulation Engineering, University of Birmingham, Edgbaston, Birmingham B15 2TT, UKbDSM Research, P. O. Box 18, 6160, Geleen, The Netherlands
Received 14 June 2002; received in revised form 2 September 2002; accepted 17 September 2002
Abstract
A mechanism has been elucidated for the coalescence-mediated break-up of bubbles in gas–liquid systems. Images taken from dynamicsystems (a coalescence cell and laboratory-scale bubble columns) show that in some instances the coalescence of two bubbles isaccompanied by the formation of a much smaller daughter bubble. Following the coalescence process an annular wave is formed due tothe very rapid expansion of the hole following the instant of 8lm rupture. As the wave moves along the length of the bubble, away fromthe point of rupture it causes a rippling e9ect which distorts the newly coalesced bubble and may result in the formation of an unstableextension. Instabilities due to the annular wave pinch o9 a portion of this extension, resulting in the generation of a small daughter bubble.In coalescence dominated systems the process results in the generation of signi8cant numbers of bubbles much smaller (100–200 �mdiameter) than the Sauter mean diameter (3–4 mm).? 2002 Elsevier Science Ltd. All rights reserved.
Keywords: Bubble; Coalescence; Break-up; Multiphase Flow; Mixing
1. Introduction
In processes involving the dispersion of one or more gasesinto a liquid, it is necessary to control the bubble size dis-tribution in order to achieve the process aim. This dependsin turn, on understanding the equilibrium between bubblecoalescence and break-up occurring in the bulk <uid. In ad-dition to the e9ects of process variables, such as gas <owrate and for mechanically agitated systems, impeller speed,this equilibrium will depend on the nature of the gas–liquidinterfaces and the interactions between the bubbles them-selves. The constant collisions between bubbles in dynamicsystems may lead to coalescence, whereas interactions be-tween the bubbles and <uid stresses may result in bubblebreak-up. Generally, the two processes are not consideredto be interdependent, occurring as they doing under verydi9erent conditions. Bubble coalescence depends not onlyon local <ow conditions, (which determine collision veloc-ities and bubble densities), but is also crucially in<uenced
∗ Corresponding author. Tel.: +44-121-414-5325;fax: +44-121-414-5324.E-mail address: [email protected] (A. W. Nienow).
by the nature of the gas-liquid interface itself, to the extentwhere systems containing signi8cant concentrations of elec-trolytes, organic species or surfactants are often described ascoalescence inhibited. In contrast, bubble break-up is foundto depend very much on local hydrodynamic considerations(e.g. the micro scale of turbulence, Prince & Blanch, 1990)and in particular the e9ects of wake shear and bubble insta-bilities.Amongst the literature on bubble sizes in gas-liquid sys-
tems, there are a small number of studies highlighting coa-lescence dominated systems which contain, in addition to thelarge bubbles expected, signi8cant numbers of very smallbubbles (Machon, Pacek, & Nienow, 1997; Martin, 1996).Both these studies were carried out in air–water systems,using a non-invasive measurement technique to determinebubble sizes in stirred vessels. As a consequence of theirsize, these very small bubbles were hidden in volume prob-ability density functions and only became apparent whenthe data was viewed in terms of number population distri-butions. Both authors have noted the fact that these verysmall bubbles are observed only in systems considered to befully coalescing and where the Sauter mean bubble size isvery much larger (generally 2 orders of magnitude greater).
0009-2509/02/$ - see front matter ? 2002 Elsevier Science Ltd. All rights reserved.PII: S0009 -2509(02)00528 -6
276 K. L. Tse et al. / Chemical Engineering Science 58 (2003) 275–286
Machon et al. (1997) point to the sensitivity of the mea-surement technique (in comparison to e.g. capillary suction)as the reason for the measurement of this previously un-reported class of bubbles. Martin (1996) proposed that thelarge numbers of small bubbles are “generated either by thestrong vortices of the impeller and survive coalescence be-cause of their small size amongst much larger ones; or byre-shedding from the rim of very large bubbles.”Explanations for bubble break-up in bubble columns are
usually based on the e9ects of wake vortices (Prince &Blanch, 1990; Miyhara, Tsuchiya, & Fan, 1991; amongstothers). A bubble rising through the column may be un-equally exposed to the wake in<uence of a preceding bub-ble, becoming elongated and subsequently shearing apartinto two daughter bubbles. Walter and Blanch (1986) pro-posed that small bubbles can be generated by sheddingfrom the rim of very large unstable bubbles under thein<uence of shear from wake vortices, although this wasconsidered important only for bubbles much larger (diam-eters 2–5 cm) than the maximum reported here. Ohnishi,Azuma, and Straub (1999) have postulated an alternativemechanism for coalescence induced small bubble forma-tion. Their work was based on experimental observationswhere bubbles were initiated in a test cell by a spot-heaterunder reduced pressure. Even using these very idealisedconditions, though visual observations with a high-speedcamera suggested the existence of a coalescence-inducedmechanism, they were unable to observe the mechanism insitu, relying on numerical simulation to elucidate the actualprocess.This paper describes detailed experimental work carried
out to identify the mechanism of formation of these smallbubbles in real processing equipment. Evidence for the ex-istence of a bubble break-up mechanism intrinsically linkedto the coalescence process was initially gathered from bub-ble size measurements in small-scale bubble columns. Thevalidity of such a concept was con8rmed by observing dis-crete two bubble collisions and coalescence in the controlledenvironment of coalescence cell. Complete elucidation ofthe mechanism was obtained visually through the captureof de8ning images, supported by high-speed video studiesof bubble-bubble interactions occurring within the bubblecolumns.
2. Experimental
2.1. Bubble columns
Measurements of bubble size distributions were carriedout in small-scale bubble columns (diameter 50 mm, un-gassed liquid height 250 mm), 8tted with sintered discs ofPyrexTM glass as distributor plates. Data was collected fromcolumns 8tted with three sinters of di9ering porosity, whichenabled the e9ect of the initial bubble size to be examined.Gas was supplied continuously to the column at an abso-
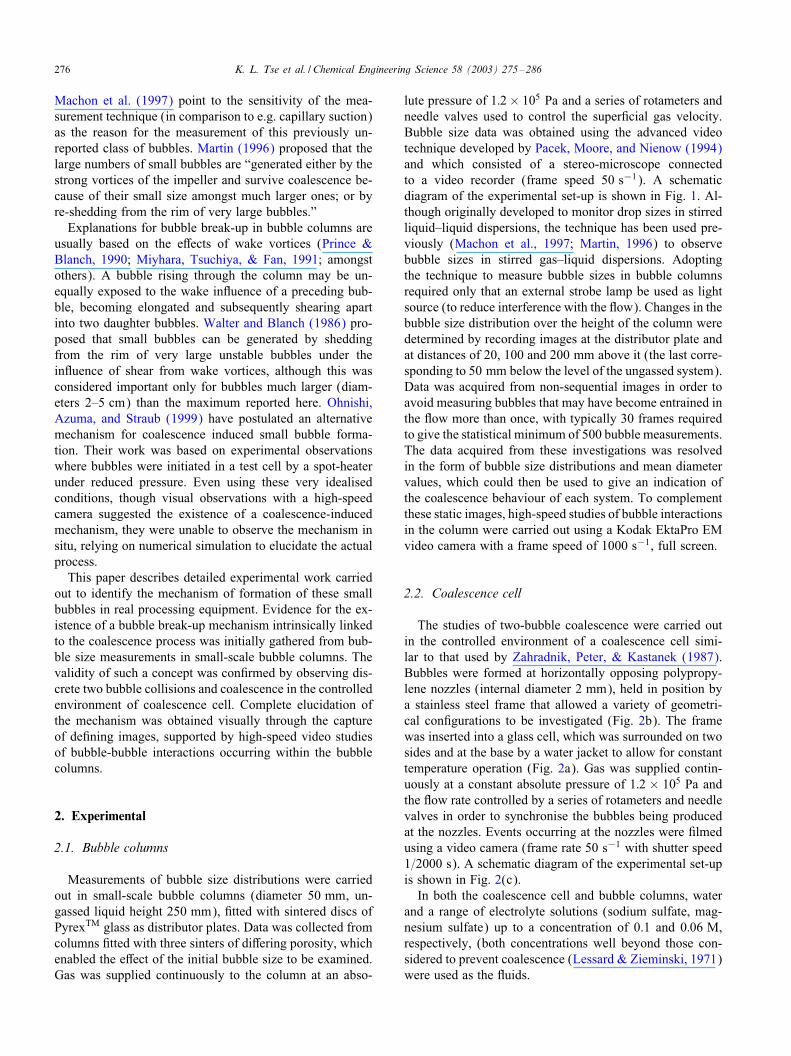
lute pressure of 1:2× 10⁵ Pa and a series of rotameters andneedle valves used to control the super8cial gas velocity.Bubble size data was obtained using the advanced videotechnique developed by Pacek, Moore, and Nienow (1994)and which consisted of a stereo-microscope connectedto a video recorder (frame speed 50 s−1). A schematicdiagram of the experimental set-up is shown in Fig. 1. Al-though originally developed to monitor drop sizes in stirredliquid–liquid dispersions, the technique has been used pre-viously (Machon et al., 1997; Martin, 1996) to observebubble sizes in stirred gas–liquid dispersions. Adoptingthe technique to measure bubble sizes in bubble columnsrequired only that an external strobe lamp be used as lightsource (to reduce interference with the <ow). Changes in thebubble size distribution over the height of the column weredetermined by recording images at the distributor plate andat distances of 20, 100 and 200 mm above it (the last corre-sponding to 50 mm below the level of the ungassed system).Data was acquired from non-sequential images in order toavoid measuring bubbles that may have become entrained inthe <ow more than once, with typically 30 frames requiredto give the statistical minimum of 500 bubble measurements.The data acquired from these investigations was resolvedin the form of bubble size distributions and mean diametervalues, which could then be used to give an indication ofthe coalescence behaviour of each system. To complementthese static images, high-speed studies of bubble interactionsin the column were carried out using a Kodak EktaPro EMvideo camera with a frame speed of 1000 s−1, full screen.
2.2. Coalescence cell
The studies of two-bubble coalescence were carried outin the controlled environment of a coalescence cell simi-lar to that used by Zahradnik, Peter, & Kastanek (1987).Bubbles were formed at horizontally opposing polypropy-lene nozzles (internal diameter 2 mm), held in position bya stainless steel frame that allowed a variety of geometri-cal con8gurations to be investigated (Fig. 2b). The framewas inserted into a glass cell, which was surrounded on twosides and at the base by a water jacket to allow for constanttemperature operation (Fig. 2a). Gas was supplied contin-uously at a constant absolute pressure of 1:2 × 10⁵ Pa andthe <ow rate controlled by a series of rotameters and needlevalves in order to synchronise the bubbles being producedat the nozzles. Events occurring at the nozzles were 8lmedusing a video camera (frame rate 50 s−1 with shutter speed1=2000 s). A schematic diagram of the experimental set-upis shown in Fig. 2(c).In both the coalescence cell and bubble columns, water
and a range of electrolyte solutions (sodium sulfate, mag-nesium sulfate) up to a concentration of 0.1 and 0:06 M,respectively, (both concentrations well beyond those con-sidered to prevent coalescence (Lessard & Zieminski, 1971)were used as the <uids.
K. L. Tse et al. / Chemical Engineering Science 58 (2003) 275–286 277
(2)
(11)
(10)(9)
(8)
(7)
(6)
(5)
(4)
(3)
(1)
(12)(13)
(14)
(15)
Fig. 1. Schematic diagram of the experimental set-up: (1) gas cylinder, (2) mercury manometer, (3) 0:2 �m 8lter, (4) saturator, (5) bu9er tank, (6)needle valve, (7) <owmeter, (8) bubble column, (9) stereomicroscope, (10) Panasonic F15 HS camera, (11) video recorder, (12) monitor, (13) computer,(14) stroboscope and strobe light, (15) light di9user.
Fig. 2. (a) Glass cell, showing dimensions. (b) Stainless steel frame, which is inserted into (a) to form the coalescence cell. (c) Schematic diagram ofthe experimental set-up: (1) gas cylinder, (2) mercury manometer, (3) 0:2 �m 8lter, (4) saturator, (5) bu9er tank, (6) needle valve, (7) <ow meter, (8)glass capillary tube, (9) coalescence cell with stainless steel frame, (10) water bath, (11) Panasonic NV-M40 movie camera, (12) television.
278 K. L. Tse et al. / Chemical Engineering Science 58 (2003) 275–286
3. Results
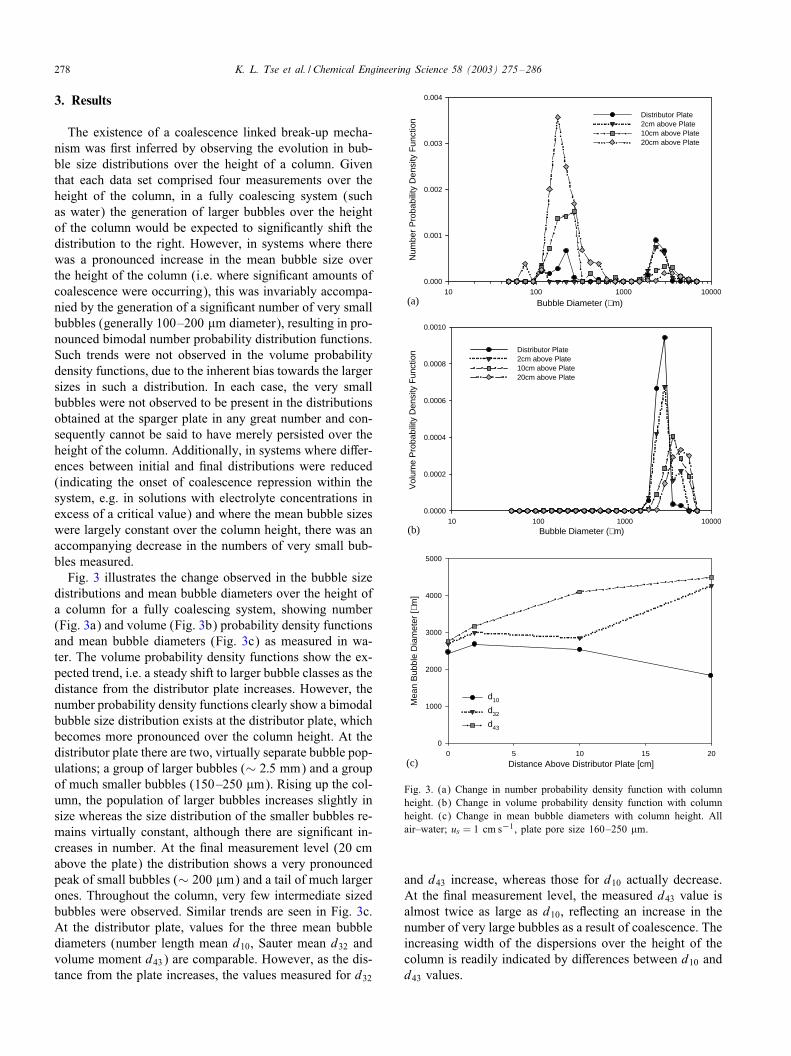
The existence of a coalescence linked break-up mecha-nism was 8rst inferred by observing the evolution in bub-ble size distributions over the height of a column. Giventhat each data set comprised four measurements over theheight of the column, in a fully coalescing system (suchas water) the generation of larger bubbles over the heightof the column would be expected to signi8cantly shift thedistribution to the right. However, in systems where therewas a pronounced increase in the mean bubble size overthe height of the column (i.e. where signi8cant amounts ofcoalescence were occurring), this was invariably accompa-nied by the generation of a signi8cant number of very smallbubbles (generally 100–200 �m diameter), resulting in pro-nounced bimodal number probability distribution functions.Such trends were not observed in the volume probabilitydensity functions, due to the inherent bias towards the largersizes in such a distribution. In each case, the very smallbubbles were not observed to be present in the distributionsobtained at the sparger plate in any great number and con-sequently cannot be said to have merely persisted over theheight of the column. Additionally, in systems where di9er-ences between initial and 8nal distributions were reduced(indicating the onset of coalescence repression within thesystem, e.g. in solutions with electrolyte concentrations inexcess of a critical value) and where the mean bubble sizeswere largely constant over the column height, there was anaccompanying decrease in the numbers of very small bub-bles measured.Fig. 3 illustrates the change observed in the bubble size
distributions and mean bubble diameters over the height ofa column for a fully coalescing system, showing number(Fig. 3a) and volume (Fig. 3b) probability density functionsand mean bubble diameters (Fig. 3c) as measured in wa-ter. The volume probability density functions show the ex-pected trend, i.e. a steady shift to larger bubble classes as thedistance from the distributor plate increases. However, thenumber probability density functions clearly show a bimodalbubble size distribution exists at the distributor plate, whichbecomes more pronounced over the column height. At thedistributor plate there are two, virtually separate bubble pop-ulations; a group of larger bubbles (∼ 2:5 mm) and a groupof much smaller bubbles (150–250 �m). Rising up the col-umn, the population of larger bubbles increases slightly insize whereas the size distribution of the smaller bubbles re-mains virtually constant, although there are signi8cant in-creases in number. At the 8nal measurement level (20 cmabove the plate) the distribution shows a very pronouncedpeak of small bubbles (∼ 200 �m) and a tail of much largerones. Throughout the column, very few intermediate sizedbubbles were observed. Similar trends are seen in Fig. 3c.At the distributor plate, values for the three mean bubblediameters (number length mean d10, Sauter mean d32 andvolume moment d43) are comparable. However, as the dis-tance from the plate increases, the values measured for d32
Bubble Diameter (µm)10 100 1000 10000
Num
ber
Pro
babi
lity
Den
sity
Fun
ctio
n
0.000
0.001
0.002
0.003
0.004
Distributor Plate2cm above Plate10cm above Plate20cm above Plate
(a)
Distance Above Distributor Plate [cm]0 5 10 15 20
Mea
n B
ubbl
e D
iam
eter
[ µm
]
0
1000
2000
3000
4000
5000
d10
d32
d43
(c)
Bubble Diameter (µm)10 100 1000 10000
Vol
ume
Pro
babi
lity
Den
sity
Fun
ctio
n
0.0000
0.0002
0.0004
0.0006
0.0008
0.0010
Distributor Plate 2cm above Plate10cm above Plate20cm above Plate
(b)
Fig. 3. (a) Change in number probability density function with columnheight. (b) Change in volume probability density function with columnheight. (c) Change in mean bubble diameters with column height. Allair–water; us = 1 cm s−1, plate pore size 160–250 �m.
and d43 increase, whereas those for d10 actually decrease.At the 8nal measurement level, the measured d43 value isalmost twice as large as d10, re<ecting an increase in thenumber of very large bubbles as a result of coalescence. Theincreasing width of the dispersions over the height of thecolumn is readily indicated by di9erences between d10 andd43 values.
K. L. Tse et al. / Chemical Engineering Science 58 (2003) 275–286 279
2 mm
2 mm
2 mm
(d)
(a) (b)
(c)
2 mm
Fig. 4. Images of bubbles in water; us = 1 cm s−1, plate pore size 160–250 �m. (a) at distributor plate, (b) 2 cm above, (c) 10 cm above, (d) 20 cmabove plate.
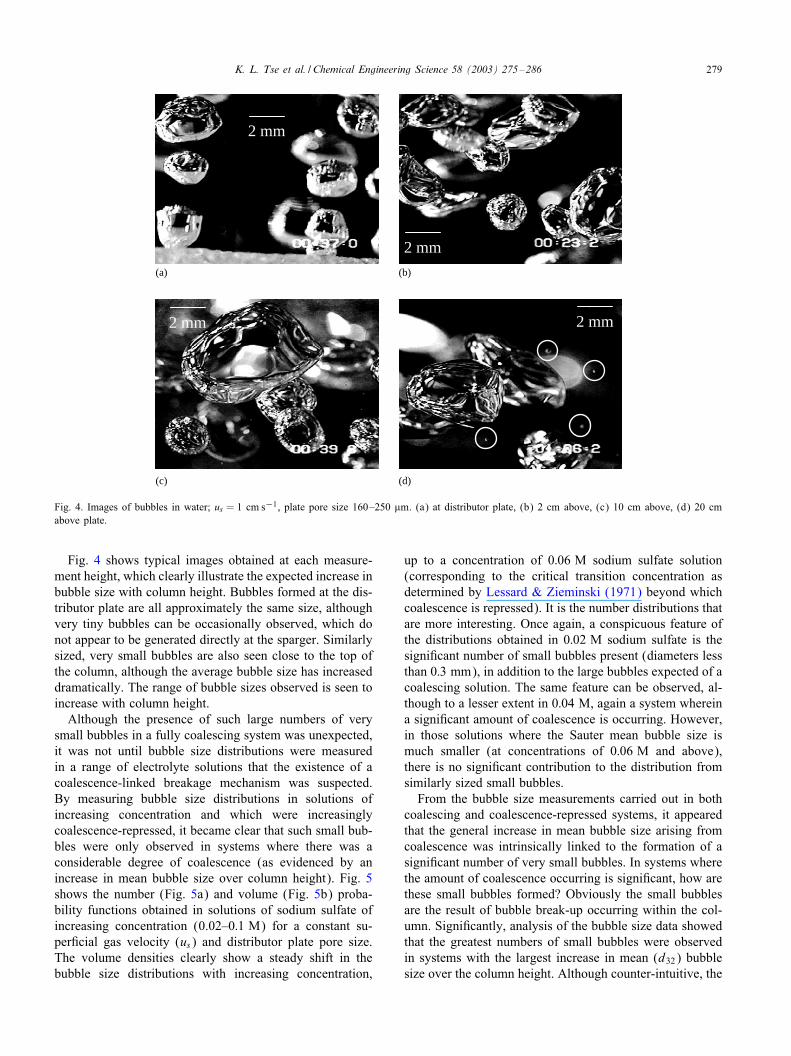
Fig. 4 shows typical images obtained at each measure-ment height, which clearly illustrate the expected increase inbubble size with column height. Bubbles formed at the dis-tributor plate are all approximately the same size, althoughvery tiny bubbles can be occasionally observed, which donot appear to be generated directly at the sparger. Similarlysized, very small bubbles are also seen close to the top ofthe column, although the average bubble size has increaseddramatically. The range of bubble sizes observed is seen toincrease with column height.Although the presence of such large numbers of very
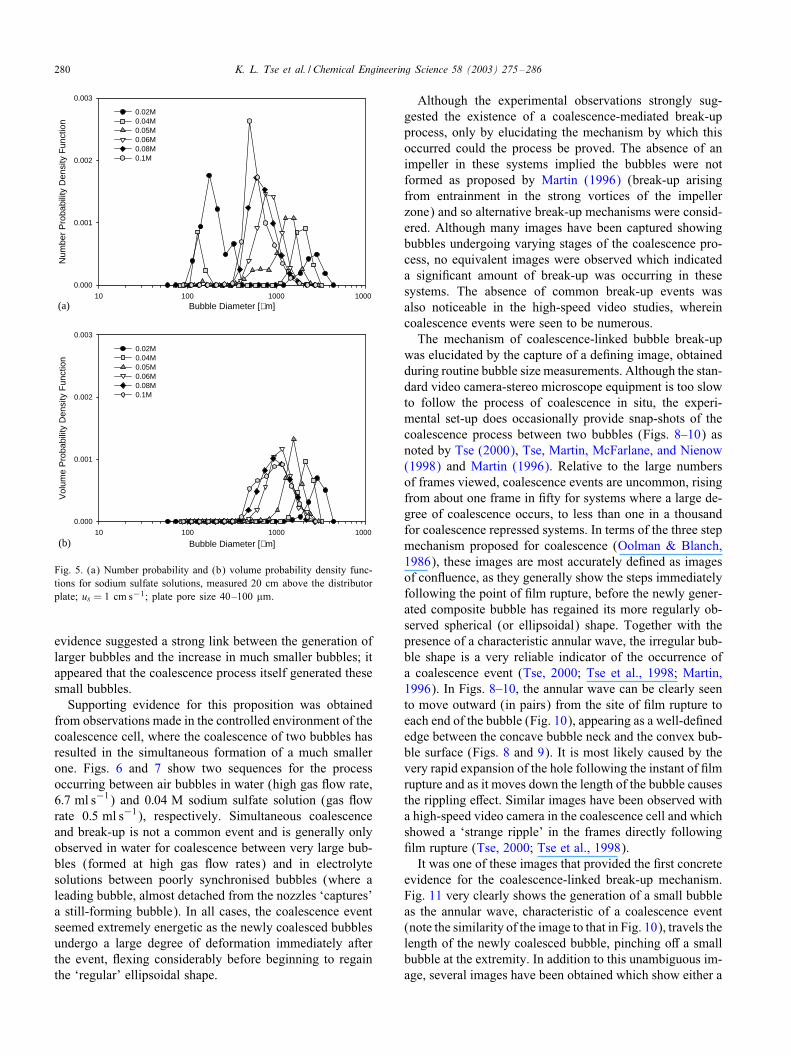
small bubbles in a fully coalescing system was unexpected,it was not until bubble size distributions were measuredin a range of electrolyte solutions that the existence of acoalescence-linked breakage mechanism was suspected.By measuring bubble size distributions in solutions ofincreasing concentration and which were increasinglycoalescence-repressed, it became clear that such small bub-bles were only observed in systems where there was aconsiderable degree of coalescence (as evidenced by anincrease in mean bubble size over column height). Fig. 5shows the number (Fig. 5a) and volume (Fig. 5b) proba-bility functions obtained in solutions of sodium sulfate ofincreasing concentration (0.02–0:1 M) for a constant su-per8cial gas velocity (us) and distributor plate pore size.The volume densities clearly show a steady shift in thebubble size distributions with increasing concentration,
up to a concentration of 0:06 M sodium sulfate solution(corresponding to the critical transition concentration asdetermined by Lessard & Zieminski (1971) beyond whichcoalescence is repressed). It is the number distributions thatare more interesting. Once again, a conspicuous feature ofthe distributions obtained in 0:02 M sodium sulfate is thesigni8cant number of small bubbles present (diameters lessthan 0:3 mm), in addition to the large bubbles expected of acoalescing solution. The same feature can be observed, al-though to a lesser extent in 0:04 M, again a system whereina signi8cant amount of coalescence is occurring. However,in those solutions where the Sauter mean bubble size ismuch smaller (at concentrations of 0:06 M and above),there is no signi8cant contribution to the distribution fromsimilarly sized small bubbles.From the bubble size measurements carried out in both
coalescing and coalescence-repressed systems, it appearedthat the general increase in mean bubble size arising fromcoalescence was intrinsically linked to the formation of asigni8cant number of very small bubbles. In systems wherethe amount of coalescence occurring is signi8cant, how arethese small bubbles formed? Obviously the small bubblesare the result of bubble break-up occurring within the col-umn. Signi8cantly, analysis of the bubble size data showedthat the greatest numbers of small bubbles were observedin systems with the largest increase in mean (d32) bubblesize over the column height. Although counter-intuitive, the
280 K. L. Tse et al. / Chemical Engineering Science 58 (2003) 275–286
Bubble Diameter [µm]10 100 1000 1000
Vol
ume
Pro
babi
lity
Den
sity
Fun
ctio
n
0.000
0.001
0.002
0.003
0.02M0.04M0.05M0.06M0.08M0.1M
(b)
Bubble Diameter [µm]10 100 1000 1000
Num
ber
Pro
babi
lity
Den
sity
Fun
ctio
n
0.000
0.001
0.002
0.003
0.02M0.04M0.05M0.06M0.08M0.1M
(a)
Fig. 5. (a) Number probability and (b) volume probability density func-tions for sodium sulfate solutions, measured 20 cm above the distributorplate; us = 1 cm s−1; plate pore size 40–100 �m.
evidence suggested a strong link between the generation oflarger bubbles and the increase in much smaller bubbles; itappeared that the coalescence process itself generated thesesmall bubbles.Supporting evidence for this proposition was obtained
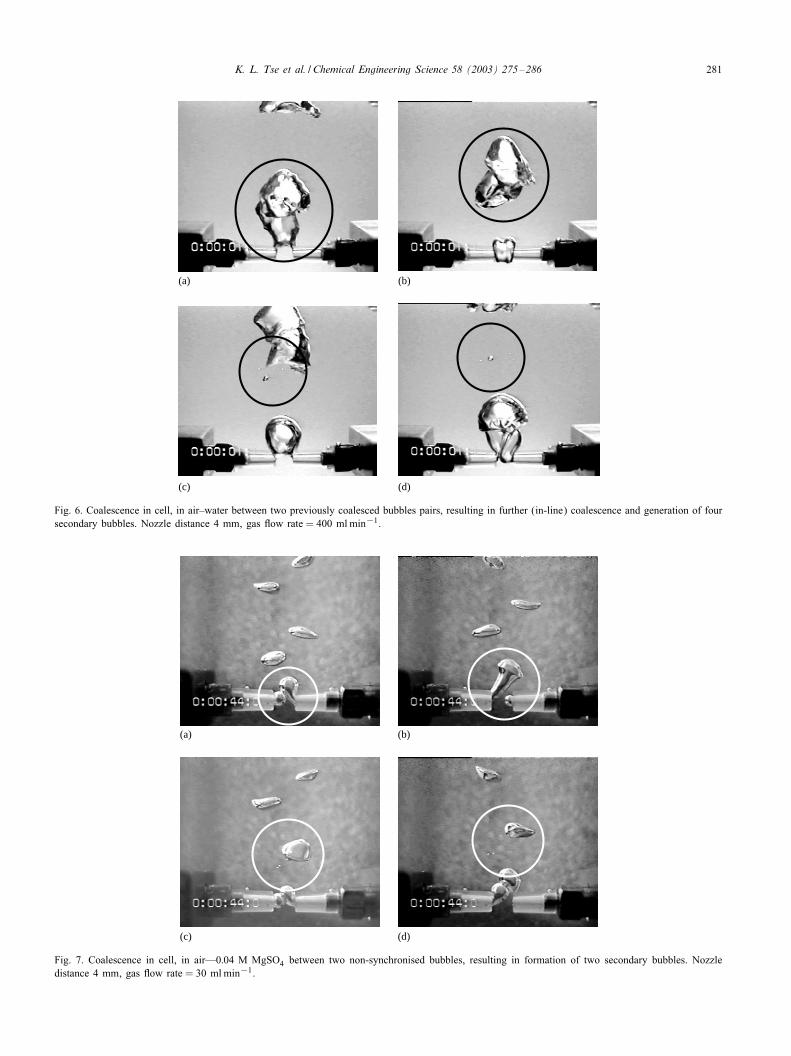
from observations made in the controlled environment of thecoalescence cell, where the coalescence of two bubbles hasresulted in the simultaneous formation of a much smallerone. Figs. 6 and 7 show two sequences for the processoccurring between air bubbles in water (high gas <ow rate,6:7 ml s−1) and 0:04 M sodium sulfate solution (gas <owrate 0:5 ml s−1), respectively. Simultaneous coalescenceand break-up is not a common event and is generally onlyobserved in water for coalescence between very large bub-bles (formed at high gas <ow rates) and in electrolytesolutions between poorly synchronised bubbles (where aleading bubble, almost detached from the nozzles ‘captures’a still-forming bubble). In all cases, the coalescence eventseemed extremely energetic as the newly coalesced bubblesundergo a large degree of deformation immediately afterthe event, <exing considerably before beginning to regainthe ‘regular’ ellipsoidal shape.
Although the experimental observations strongly sug-gested the existence of a coalescence-mediated break-upprocess, only by elucidating the mechanism by which thisoccurred could the process be proved. The absence of animpeller in these systems implied the bubbles were notformed as proposed by Martin (1996) (break-up arisingfrom entrainment in the strong vortices of the impellerzone) and so alternative break-up mechanisms were consid-ered. Although many images have been captured showingbubbles undergoing varying stages of the coalescence pro-cess, no equivalent images were observed which indicateda signi8cant amount of break-up was occurring in thesesystems. The absence of common break-up events wasalso noticeable in the high-speed video studies, whereincoalescence events were seen to be numerous.The mechanism of coalescence-linked bubble break-up
was elucidated by the capture of a de8ning image, obtainedduring routine bubble size measurements. Although the stan-dard video camera-stereo microscope equipment is too slowto follow the process of coalescence in situ, the experi-mental set-up does occasionally provide snap-shots of thecoalescence process between two bubbles (Figs. 8–10) asnoted by Tse (2000), Tse, Martin, McFarlane, and Nienow(1998) and Martin (1996). Relative to the large numbersof frames viewed, coalescence events are uncommon, risingfrom about one frame in 8fty for systems where a large de-gree of coalescence occurs, to less than one in a thousandfor coalescence repressed systems. In terms of the three stepmechanism proposed for coalescence (Oolman & Blanch,1986), these images are most accurately de8ned as imagesof con<uence, as they generally show the steps immediatelyfollowing the point of 8lm rupture, before the newly gener-ated composite bubble has regained its more regularly ob-served spherical (or ellipsoidal) shape. Together with thepresence of a characteristic annular wave, the irregular bub-ble shape is a very reliable indicator of the occurrence ofa coalescence event (Tse, 2000; Tse et al., 1998; Martin,1996). In Figs. 8–10, the annular wave can be clearly seento move outward (in pairs) from the site of 8lm rupture toeach end of the bubble (Fig. 10), appearing as a well-de8nededge between the concave bubble neck and the convex bub-ble surface (Figs. 8 and 9). It is most likely caused by thevery rapid expansion of the hole following the instant of 8lmrupture and as it moves down the length of the bubble causesthe rippling e9ect. Similar images have been observed witha high-speed video camera in the coalescence cell and whichshowed a ‘strange ripple’ in the frames directly following8lm rupture (Tse, 2000; Tse et al., 1998).
It was one of these images that provided the 8rst concreteevidence for the coalescence-linked break-up mechanism.Fig. 11 very clearly shows the generation of a small bubbleas the annular wave, characteristic of a coalescence event(note the similarity of the image to that in Fig. 10), travels thelength of the newly coalesced bubble, pinching o9 a smallbubble at the extremity. In addition to this unambiguous im-age, several images have been obtained which show either a
K. L. Tse et al. / Chemical Engineering Science 58 (2003) 275–286 281
(a)
(d)(c)
(b)
Fig. 6. Coalescence in cell, in air–water between two previously coalesced bubbles pairs, resulting in further (in-line) coalescence and generation of foursecondary bubbles. Nozzle distance 4 mm, gas <ow rate = 400 mlmin−1.
(a)
(d)(c)
(b)
Fig. 7. Coalescence in cell, in air—0:04 M MgSO4 between two non-synchronised bubbles, resulting in formation of two secondary bubbles. Nozzledistance 4 mm, gas <ow rate = 30 mlmin−1.
282 K. L. Tse et al. / Chemical Engineering Science 58 (2003) 275–286
2 mm
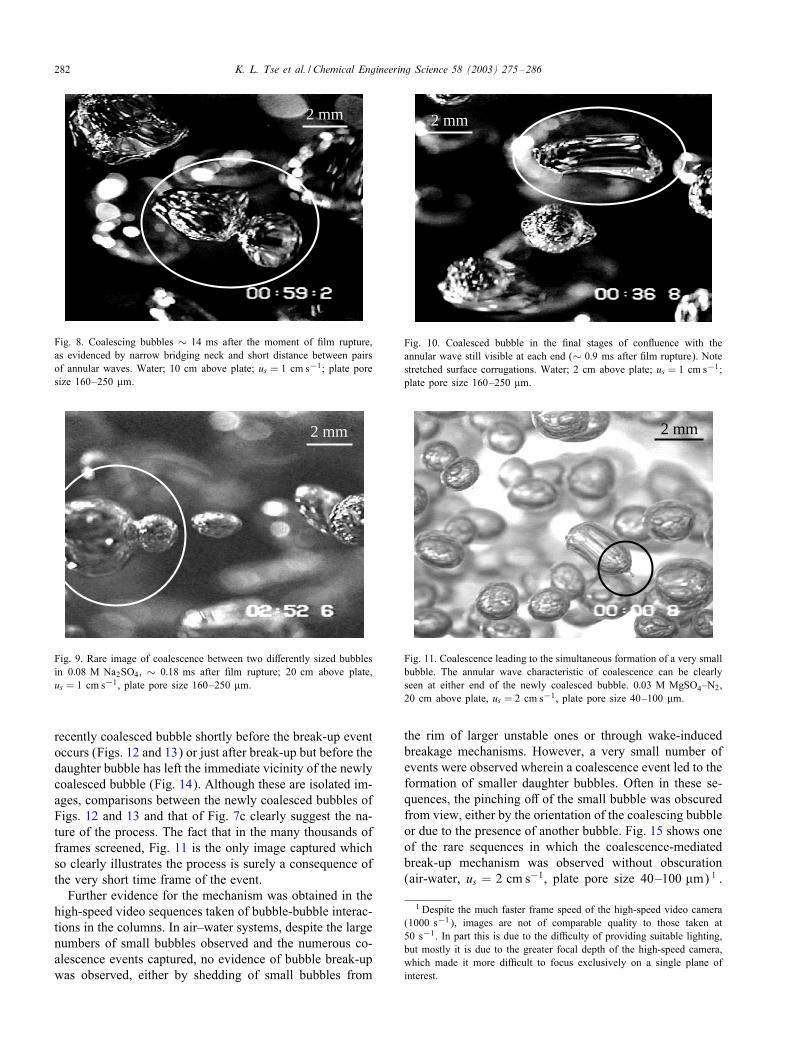
Fig. 8. Coalescing bubbles ∼ 14 ms after the moment of 8lm rupture,as evidenced by narrow bridging neck and short distance between pairsof annular waves. Water; 10 cm above plate; us = 1 cm s−1; plate poresize 160–250 �m.
2 mm
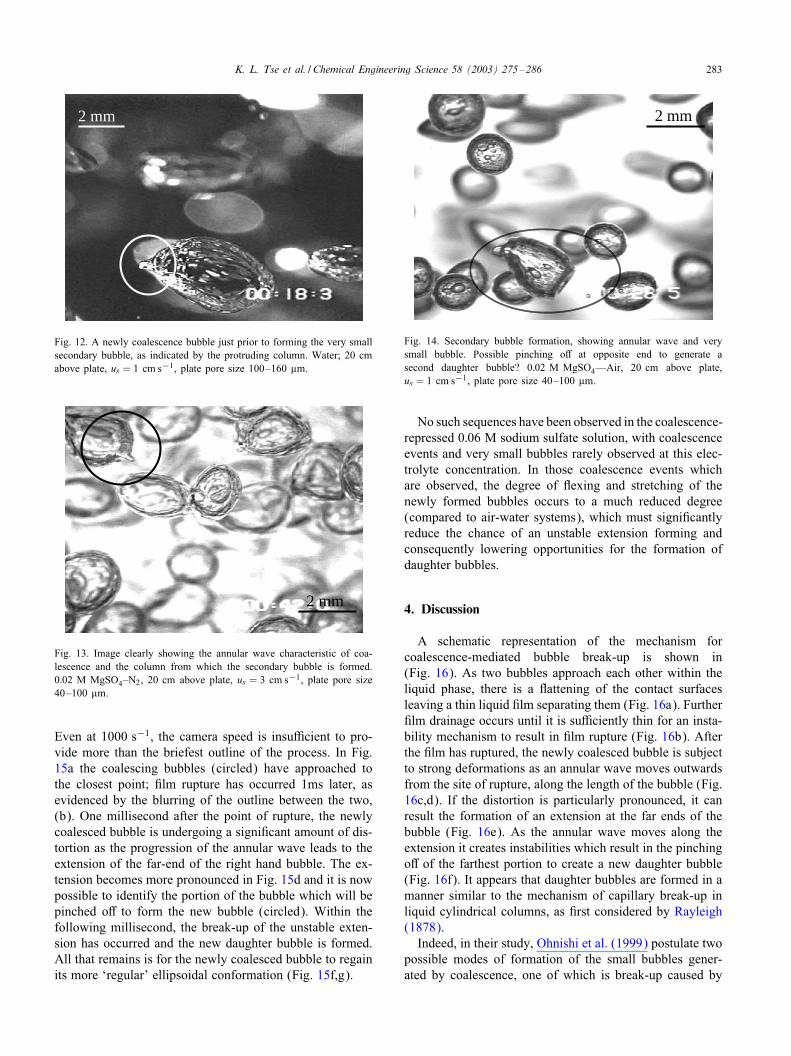
Fig. 9. Rare image of coalescence between two di9erently sized bubblesin 0:08 M Na2SO4, ∼ 0:18 ms after 8lm rupture; 20 cm above plate,us = 1 cm s−1, plate pore size 160–250 �m.
recently coalesced bubble shortly before the break-up eventoccurs (Figs. 12 and 13) or just after break-up but before thedaughter bubble has left the immediate vicinity of the newlycoalesced bubble (Fig. 14). Although these are isolated im-ages, comparisons between the newly coalesced bubbles ofFigs. 12 and 13 and that of Fig. 7c clearly suggest the na-ture of the process. The fact that in the many thousands offrames screened, Fig. 11 is the only image captured whichso clearly illustrates the process is surely a consequence ofthe very short time frame of the event.Further evidence for the mechanism was obtained in the
high-speed video sequences taken of bubble-bubble interac-tions in the columns. In air–water systems, despite the largenumbers of small bubbles observed and the numerous co-alescence events captured, no evidence of bubble break-upwas observed, either by shedding of small bubbles from
2 mm
Fig. 10. Coalesced bubble in the 8nal stages of con<uence with theannular wave still visible at each end (∼ 0:9 ms after 8lm rupture). Notestretched surface corrugations. Water; 2 cm above plate; us = 1 cm s−1;plate pore size 160–250 �m.
2 mm
Fig. 11. Coalescence leading to the simultaneous formation of a very smallbubble. The annular wave characteristic of coalescence can be clearlyseen at either end of the newly coalesced bubble. 0:03 M MgSO4–N2,20 cm above plate, us = 2 cm s−1, plate pore size 40–100 �m.
the rim of larger unstable ones or through wake-inducedbreakage mechanisms. However, a very small number ofevents were observed wherein a coalescence event led to theformation of smaller daughter bubbles. Often in these se-quences, the pinching o9 of the small bubble was obscuredfrom view, either by the orientation of the coalescing bubbleor due to the presence of another bubble. Fig. 15 shows oneof the rare sequences in which the coalescence-mediatedbreak-up mechanism was observed without obscuration(air-water, us = 2 cm s−1, plate pore size 40–100 �m) 1 .
1 Despite the much faster frame speed of the high-speed video camera(1000 s−1), images are not of comparable quality to those taken at50 s−1. In part this is due to the diRculty of providing suitable lighting,but mostly it is due to the greater focal depth of the high-speed camera,which made it more diRcult to focus exclusively on a single plane ofinterest.
K. L. Tse et al. / Chemical Engineering Science 58 (2003) 275–286 283
2 mm
Fig. 12. A newly coalescence bubble just prior to forming the very smallsecondary bubble, as indicated by the protruding column. Water; 20 cmabove plate, us = 1 cm s−1, plate pore size 100–160 �m.
2 mm
Fig. 13. Image clearly showing the annular wave characteristic of coa-lescence and the column from which the secondary bubble is formed.0:02 M MgSO4–N2, 20 cm above plate, us = 3 cm s−1, plate pore size40–100 �m.
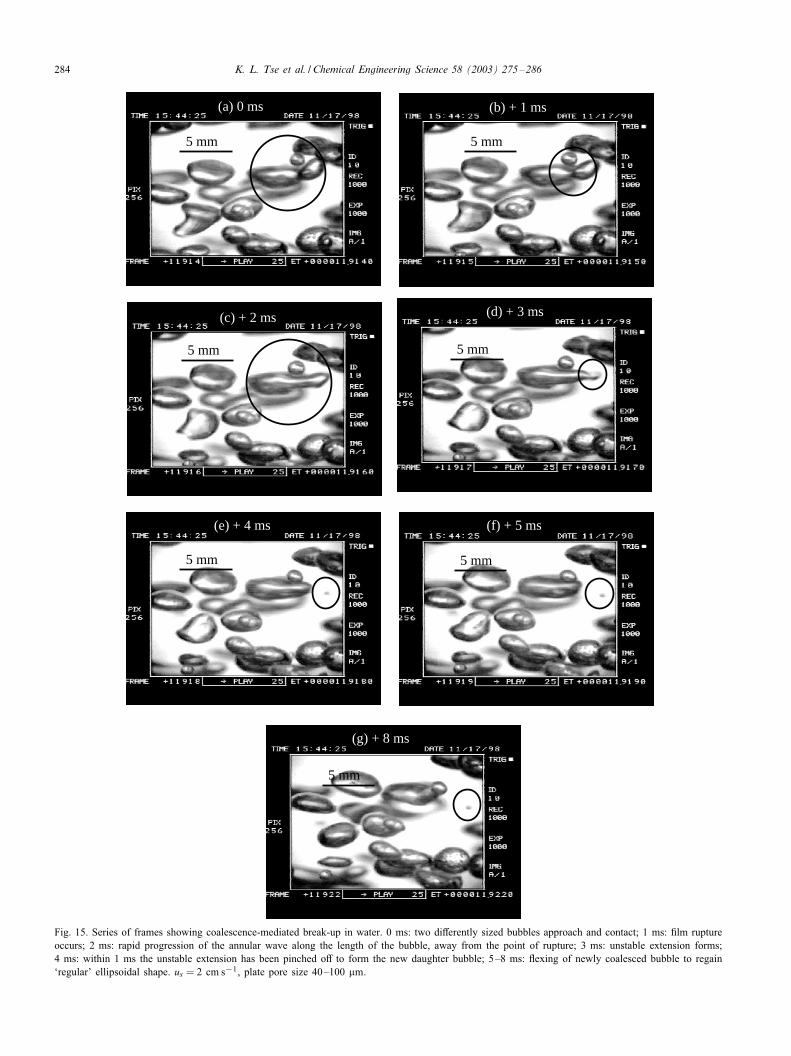
Even at 1000 s−1, the camera speed is insuRcient to pro-vide more than the briefest outline of the process. In Fig.15a the coalescing bubbles (circled) have approached tothe closest point; 8lm rupture has occurred 1ms later, asevidenced by the blurring of the outline between the two,(b). One millisecond after the point of rupture, the newlycoalesced bubble is undergoing a signi8cant amount of dis-tortion as the progression of the annular wave leads to theextension of the far-end of the right hand bubble. The ex-tension becomes more pronounced in Fig. 15d and it is nowpossible to identify the portion of the bubble which will bepinched o9 to form the new bubble (circled). Within thefollowing millisecond, the break-up of the unstable exten-sion has occurred and the new daughter bubble is formed.All that remains is for the newly coalesced bubble to regainits more ‘regular’ ellipsoidal conformation (Fig. 15f,g).
2 mm
Fig. 14. Secondary bubble formation, showing annular wave and verysmall bubble. Possible pinching o9 at opposite end to generate asecond daughter bubble? 0:02 M MgSO4—Air, 20 cm above plate,us = 1 cm s−1, plate pore size 40–100 �m.
No such sequences have been observed in the coalescence-repressed 0:06 M sodium sulfate solution, with coalescenceevents and very small bubbles rarely observed at this elec-trolyte concentration. In those coalescence events whichare observed, the degree of <exing and stretching of thenewly formed bubbles occurs to a much reduced degree(compared to air-water systems), which must signi8cantlyreduce the chance of an unstable extension forming andconsequently lowering opportunities for the formation ofdaughter bubbles.
4. Discussion
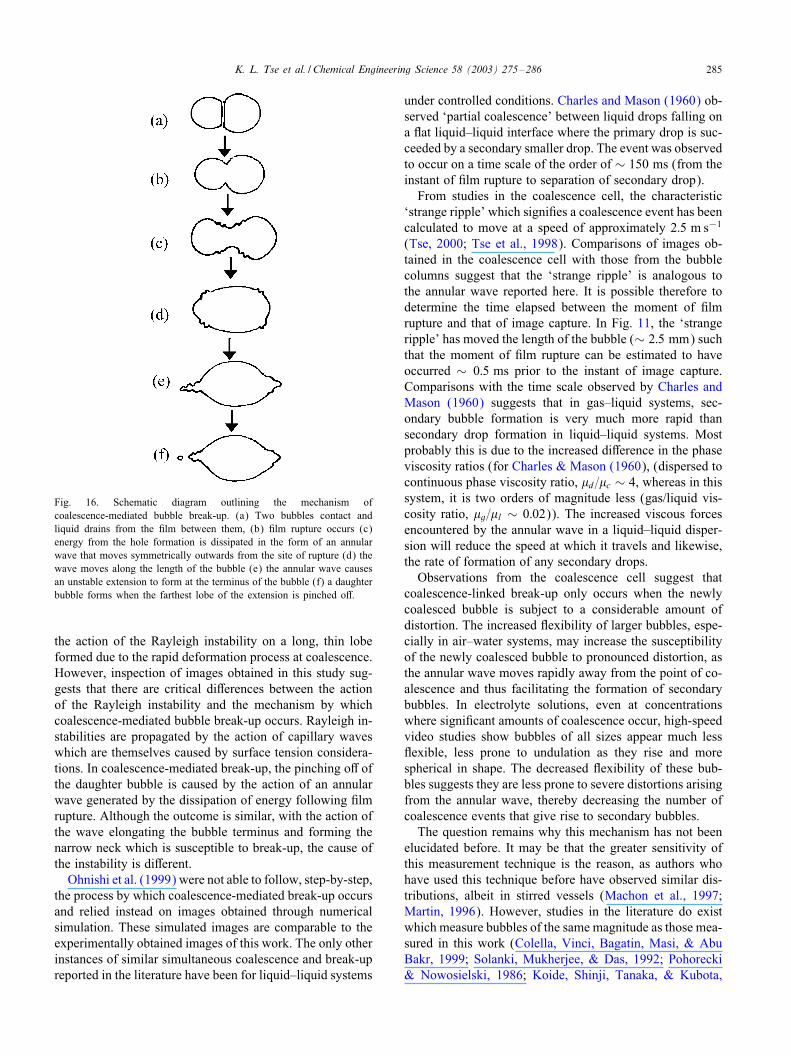
A schematic representation of the mechanism forcoalescence-mediated bubble break-up is shown in(Fig. 16). As two bubbles approach each other within theliquid phase, there is a <attening of the contact surfacesleaving a thin liquid 8lm separating them (Fig. 16a). Further8lm drainage occurs until it is suRciently thin for an insta-bility mechanism to result in 8lm rupture (Fig. 16b). Afterthe 8lm has ruptured, the newly coalesced bubble is subjectto strong deformations as an annular wave moves outwardsfrom the site of rupture, along the length of the bubble (Fig.16c,d). If the distortion is particularly pronounced, it canresult the formation of an extension at the far ends of thebubble (Fig. 16e). As the annular wave moves along theextension it creates instabilities which result in the pinchingo9 of the farthest portion to create a new daughter bubble(Fig. 16f). It appears that daughter bubbles are formed in amanner similar to the mechanism of capillary break-up inliquid cylindrical columns, as 8rst considered by Rayleigh(1878).Indeed, in their study, Ohnishi et al. (1999) postulate two
possible modes of formation of the small bubbles gener-ated by coalescence, one of which is break-up caused by
284 K. L. Tse et al. / Chemical Engineering Science 58 (2003) 275–286
(a) 0 ms
5 mm
(f) + 5 ms
5 mm
(d) + 3 ms
5 mm
(e) + 4 ms
5 mm
(c) + 2 ms
5 mm
(b) + 1 ms
5 mm
(g) + 8 ms
5 mm
Fig. 15. Series of frames showing coalescence-mediated break-up in water. 0 ms: two di9erently sized bubbles approach and contact; 1 ms: 8lm ruptureoccurs; 2 ms: rapid progression of the annular wave along the length of the bubble, away from the point of rupture; 3 ms: unstable extension forms;4 ms: within 1 ms the unstable extension has been pinched o9 to form the new daughter bubble; 5–8 ms: <exing of newly coalesced bubble to regain‘regular’ ellipsoidal shape. us = 2 cm s−1, plate pore size 40–100 �m.
K. L. Tse et al. / Chemical Engineering Science 58 (2003) 275–286 285
Fig. 16. Schematic diagram outlining the mechanism ofcoalescence-mediated bubble break-up. (a) Two bubbles contact andliquid drains from the 8lm between them, (b) 8lm rupture occurs (c)energy from the hole formation is dissipated in the form of an annularwave that moves symmetrically outwards from the site of rupture (d) thewave moves along the length of the bubble (e) the annular wave causesan unstable extension to form at the terminus of the bubble (f) a daughterbubble forms when the farthest lobe of the extension is pinched o9.
the action of the Rayleigh instability on a long, thin lobeformed due to the rapid deformation process at coalescence.However, inspection of images obtained in this study sug-gests that there are critical di9erences between the actionof the Rayleigh instability and the mechanism by whichcoalescence-mediated bubble break-up occurs. Rayleigh in-stabilities are propagated by the action of capillary waveswhich are themselves caused by surface tension considera-tions. In coalescence-mediated break-up, the pinching o9 ofthe daughter bubble is caused by the action of an annularwave generated by the dissipation of energy following 8lmrupture. Although the outcome is similar, with the action ofthe wave elongating the bubble terminus and forming thenarrow neck which is susceptible to break-up, the cause ofthe instability is di9erent.Ohnishi et al. (1999) were not able to follow, step-by-step,
the process by which coalescence-mediated break-up occursand relied instead on images obtained through numericalsimulation. These simulated images are comparable to theexperimentally obtained images of this work. The only otherinstances of similar simultaneous coalescence and break-upreported in the literature have been for liquid–liquid systems
under controlled conditions. Charles and Mason (1960) ob-served ‘partial coalescence’ between liquid drops falling ona <at liquid–liquid interface where the primary drop is suc-ceeded by a secondary smaller drop. The event was observedto occur on a time scale of the order of ∼ 150 ms (from theinstant of 8lm rupture to separation of secondary drop).From studies in the coalescence cell, the characteristic
‘strange ripple’ which signi8es a coalescence event has beencalculated to move at a speed of approximately 2:5 m s−1
(Tse, 2000; Tse et al., 1998). Comparisons of images ob-tained in the coalescence cell with those from the bubblecolumns suggest that the ‘strange ripple’ is analogous tothe annular wave reported here. It is possible therefore todetermine the time elapsed between the moment of 8lmrupture and that of image capture. In Fig. 11, the ‘strangeripple’ has moved the length of the bubble (∼ 2:5 mm) suchthat the moment of 8lm rupture can be estimated to haveoccurred ∼ 0:5 ms prior to the instant of image capture.Comparisons with the time scale observed by Charles andMason (1960) suggests that in gas–liquid systems, sec-ondary bubble formation is very much more rapid thansecondary drop formation in liquid–liquid systems. Mostprobably this is due to the increased di9erence in the phaseviscosity ratios (for Charles & Mason (1960), (dispersed tocontinuous phase viscosity ratio, �d=�c ∼ 4, whereas in thissystem, it is two orders of magnitude less (gas/liquid vis-cosity ratio, �g=�l ∼ 0:02)). The increased viscous forcesencountered by the annular wave in a liquid–liquid disper-sion will reduce the speed at which it travels and likewise,the rate of formation of any secondary drops.Observations from the coalescence cell suggest that
coalescence-linked break-up only occurs when the newlycoalesced bubble is subject to a considerable amount ofdistortion. The increased <exibility of larger bubbles, espe-cially in air–water systems, may increase the susceptibilityof the newly coalesced bubble to pronounced distortion, asthe annular wave moves rapidly away from the point of co-alescence and thus facilitating the formation of secondarybubbles. In electrolyte solutions, even at concentrationswhere signi8cant amounts of coalescence occur, high-speedvideo studies show bubbles of all sizes appear much less<exible, less prone to undulation as they rise and morespherical in shape. The decreased <exibility of these bub-bles suggests they are less prone to severe distortions arisingfrom the annular wave, thereby decreasing the number ofcoalescence events that give rise to secondary bubbles.The question remains why this mechanism has not been
elucidated before. It may be that the greater sensitivity ofthis measurement technique is the reason, as authors whohave used this technique before have observed similar dis-tributions, albeit in stirred vessels (Machon et al., 1997;Martin, 1996). However, studies in the literature do existwhich measure bubbles of the same magnitude as those mea-sured in this work (Colella, Vinci, Bagatin, Masi, & AbuBakr, 1999; Solanki, Mukherjee, & Das, 1992; Pohorecki& Nowosielski, 1986; Koide, Shinji, Tanaka, & Kubota,
286 K. L. Tse et al. / Chemical Engineering Science 58 (2003) 275–286
1968) but which have not observed these bi-modal popu-lations. There are several possible explanations. Pohoreckiand Nowosielski (1986) and Koide et al. (1968) carried outtheir studies in coalescence repressed systems where sucha mechanism would not be expected to be signi8cant. Intheir studies Colella et al. (1999) and Solanki et al. (1992)used initial bubble sizes greater than those used in this studywhich suggests that in these systems there is a signi8cant de-gree of bubble break-up in the initial sections of the columnand a reduced amount of coalescence between the largerbubbles which is observed to favour the proposed mecha-nism. It appears that contributions of this mechanism to thebubble size distribution are only signi8cant in systems thatare coalescence dominated.
5. Conclusions
For the 8rst time, images have been obtained froma dynamic system, which allow a mechanism for thecoalescence-mediated break-up of bubbles in gas-liquidsystems to be fully identi8ed. Captured images show thatthe coalescence of two bubbles results in an annular waveforming, due to the very rapid expansion of the hole follow-ing the instant of 8lm rupture. As this wave moves awayfrom the point of rupture, along the length of the bubble, itcauses a rippling e9ect which distorts the newly coalescedbubble and may result in the formation of an unstable ex-tension. Instabilities due to the annular wave pinch o9 aportion of this extension resulting in the generation of asmall daughter bubble. In coalescence dominated systemsthe process results in the generation of signi8cant numbersof bubbles much smaller (100–200 �m diameter) than theSauter mean value (3–4 mm).
Notation
d10 Number length mean diameter, md32 Sauter mean diameter, md43 Volume moment mean diameter, mus Super8cial gas velocity, m s−1
�c Continuous phase viscosity, Pa s�d Dispersed phase viscosity, Pa s�g Gas viscosity, Pa s�l Liquid viscosity, Pa s
Acknowledgements
Thanks to the EPSRC Instrument Pool for providingthe Kodak Ekta-Pro Camera and the technical support. KT
wishes to thank Dr M. J. H. Simmons (Birmingham) forvaluable discussions and advice. KT gratefully acknowl-edges a research studentship from DSM (Netherlands).
References
Charles, G. E., & Mason, S. G. (1960). The mechanism of partialcoalescence of liquid drops at liquid–liquid interfaces. Journal ofColloid Science, 15, 105–122.
Colella, D., Vinci, D., Bagatin, R., Masi, M., & Abu Bakr, E. (1999).A study on coalescence and breakage mechanisms in three di9erentbubble columns. Chemical Engineering Science, 54, 4767–4777.
Koide, K., Shinji, K., Tanaka, Y., & Kubota, H. (1968). Bubble generatedfrom a porous plate. Journal of Chemical Engineering of Japan, 1,51–56.
Lessard, R. R., & Zieminski, S. A. (1971). Bubble coalescence and gastransfer in aqueous electrolytic solutions. Industrial and EngineeringChemistry Fundamentals, 10, 260–269.
Machon, V., Pacek, A. W., & Nienow, A. W. (1997). Bubble sizesin electrolyte and alcohol solutions in a turbulent stirred vessel.Transactions of the Institution of Chemical Engineers, 75(Part A),339–348.
Martin, T. (1996). Gas Dispersion with Radial and Hydrofoil Impellersin Fluids with Di;erent Coalescence. Ph.D thesis, University ofBirmingham, UK.
Miyhara, T., Tsuchiya, K., & Fan, L-S. (1991). E9ect of turbulent wakeson bubble–bubble interaction in a gas–liquid–solids <uidized bed.Chemical Engineering Science, 46(9), 2368–2373.
Ohnishi, M., Azuma, H., & Straub, J. (1999). Study on secondary bubblecreation induced by bubble coalescence. Advances in Space Research,24(10), 1331–1336.
Oolman, T. O., & Blanch, H. W. (1986). Bubble coalescence in stagnantliquids. Chemical Engineering Communications, 43, 237–261.
Pacek, A. W., Moore, I. T. P., & Nienow, A. W. (1994). Videotechnique for measuring dynamics of liquid–liquid dispersion duringphase inversion. American Institute of Chemical Engineers Journal,40, 1940–1949.
Pohorecki, R., & Nowosielski, J. (1986). Interfacial area generated inaqueous electrolyte solutions on a sieve plate. American Institute ofChemical Engineers Journal, 32, 632–639.
Prince, M. J., & Blanch, H. W. (1990). Bubble coalescence and break-upin air-sparged bubble columns. American Institute of ChemicalEngineers Journal, 36, 1485–1499.
Rayleigh, J. W. S. (1878). On the instability of jets. Proc. London Math.Soc., 10, 4–13.
Solanki, M. K. S., Mukherjee, A. K., & Das, T. R. (1992). Bubbleformation at closely spaced ori8ces in aqueous solutions. The ChemicalEngineering Journal, 49, 65–71.
Tse, K. L. (2000). Bubble Coalescence in a Range of Fluids: Surfaceand Viscous E;ects. Ph.D thesis, University of Birmingham, UK.
Tse, K. L., Martin, T. M., McFarlane, C. M., & Nienow, A. W. (1998).Visualisation of bubble coalescence in a coalescence cell a stirredtank and a bubble column. Chemical Engineering Science, 53(23),4031–4036.
Walter, J. F., & Blanch, H. W. (1986). Bubble break-up in gas–liquid bioreactors—break-up in turbulent <ows. Chemical EngineeringJournal and the Biochemical Engineering Journal, 32(1), B7–B17.
Zahradnik, J., Peter, R., & Kastanek, F. (1987). The e9ect of liquidphase properties on gas holdup in bubble column reactors. Collectionof Czechoslovakian Chemical Communications, 52, 335–347.
Related Documents


![Review Bursting Bubbles and Bilayers · Bursting Bubbles and Bilayers ... bubble coalescence and convey stealth quality so as to prolong circulation time.[3] It is now appreciated](https://static.cupdf.com/doc/110x72/5fd1fd9bbdf84a0c512357bf/review-bursting-bubbles-and-bilayers-bursting-bubbles-and-bilayers-bubble-coalescence.jpg)