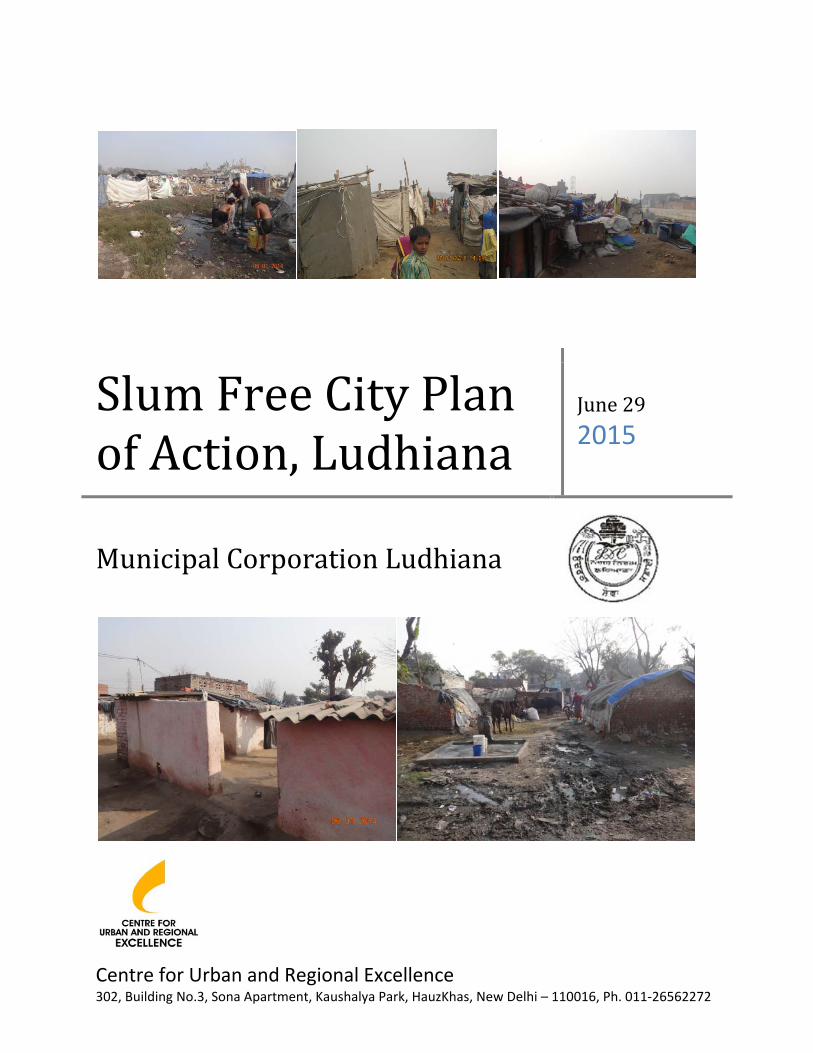
Centre for Urban and Regional Excellence 302, Building No.3, Sona Apartment, Kaushalya Park, HauzKhas, New Delhi – 110016, Ph. 011-26562272 Slum Free City Plan of Action, Ludhiana June 29 2015 Municipal Corporation Ludhiana

Welcome message from author
This document is posted to help you gain knowledge. Please leave a comment to let me know what you think about it! Share it to your friends and learn new things together.
Transcript
Centre for Urban and Regional Excellence 302, Building No.3, Sona Apartment, Kaushalya Park, HauzKhas, New Delhi – 110016, Ph. 011-26562272
Slum Free City Plan of Action, Ludhiana
June 29 2015
Municipal Corporation Ludhiana
1
Contents 1. Process of Preparing the SFCPOA-‐Ludhiana ...................................................................................... 12 1.1. Stakeholder workshops and meetings to prepare the ground for beginning the processes and surveys required under SFCPoA .............................. 12 a. Participatory Planning with the Community ............................................................... 12
1.2. Spatial Mapping of Slums ....................................................................................................... 15 a. Slum Identification: ................................................................................................................. 15 b. Slum Boundaries and GIS Mapping: ................................................................................ 15
1.3. Slum and Household Surveys .............................................................................................. 17 a. Mobile Application for Socio-‐Economic Data Collection ........................................ 17 b. Household Surveys ................................................................................................................. 17 c. Data Quality Check .................................................................................................................. 18
1.4. Vacant Land Survey .................................................................................................................. 18 1.5. Housing Study: Analysis of Housing Component in Slums ..................................... 18
2. Preparation of a City Profile ................................................................................................................. 21 2.1. Regional Context ........................................................................................................................ 21 2.2. City Profile .................................................................................................................................... 21 a. Demography ............................................................................................................................... 22 b. Administrative .......................................................................................................................... 22 c. Climate .......................................................................................................................................... 22 d. Religious and Historical Importance ............................................................................... 22 e. Education ..................................................................................................................................... 22 f. Commerce .................................................................................................................................... 22 g. Housing in the City .................................................................................................................. 23 h. Slum Households: Population and Demography ....................................................... 23 i. Physical Infrastructure Profile ............................................................................................ 23
2.3. Review of Existing Policies, Programmes and Projects related to Slums and Housing ...................................................................................................................................................... 24 a. Ludhiana Master Plan 2021 ................................................................................................ 24 b. City Development Plan, Ludhiana 2021 ........................................................................ 24 c. Programs on Slum Development ....................................................................................... 25 d. Challenges and Constraints in Preparing Slum Free City Plan ................................... 26
2.4. Assessment of Present Status of Slums: Primary Survey ........................................ 26 a. Typology of Slums ................................................................................................................... 27 b. Slum: Demographic Profile ................................................................................................. 29 c. Socio-‐Economic Profile .......................................................................................................... 31 d. Access to Basic Services – .................................................................................................... 35
2.5. Community FGDs ................................................................................................................... 42
2
2.6. Slums, GIS and Boundary Mapping .................................................................................. 47 a. Slum Validation: ....................................................................................................................... 47 b. Base Map ..................................................................................................................................... 47 c. Slum Mapping ............................................................................................................................ 47 d. Spatial Analysis of Slums in Ludhiana ............................................................................ 48 e. Average land holdings in slums ......................................................................................... 50
3. Categorization of Slums ............................................................................................................................... 51 3.1 Tenability Assessment ............................................................................................................. 51 3.2 Prioritization of Tenable Slums through Priority Matrix ......................................... 52 a. Infrastructure Deficiency Assessment ............................................................................ 52 b. Housing Parameters ............................................................................................................... 53 c. Tenure Security ......................................................................................................................... 53
3.3 Prioritization Matrix ................................................................................................................. 53 a. Matrix for Zone A ..................................................................................................................... 54 b. Matrix for Zone B ..................................................................................................................... 54 c. Matrix for Zone C ...................................................................................................................... 54 d. Matrix for Zone D ..................................................................................................................... 54
3.4 Matrix Analysis ............................................................................................................................ 55 3.5 Formulation of Development Strategy ............................................................................. 55 a. In-‐situ upgrading ..................................................................................................................... 55 b. Redevelopment ......................................................................................................................... 56 c. Resettlement: ............................................................................................................................. 56
3.6 Development Model as per the new AHP ........................................................................ 56 a. Tenable Slums: .......................................................................................................................... 56 b. Un-‐Tenable Slums ................................................................................................................... 56
4. Housing study .................................................................................................................................................. 58 4.1 Housing Supply trends for the Urban Poor ..................................................................... 58 4.2 Assessment of Housing needs and demands in Ludhiana ........................................ 58 a. Classified typology of households .................................................................................... 59 b. Slum households in Ludhiana ............................................................................................ 59 c. Proposed Scenario for Year 2021 and 2031 ................................................................ 60 d. Conclusion .................................................................................................................................. 62
4.3 Vacant Land survey ................................................................................................................... 63 a. Land Density and Values: ..................................................................................................... 64
4.4 Supply and Demand Constraints in Housing .................................................................. 64 4.5 Housing Typology based on structure .............................................................................. 66 4.6 Formulation of Slum Intervention Strategies for all Prioritized Slums .............. 70 a. Design Proposals-‐ .................................................................................................................... 70 b. In-‐Situ Upgradation ................................................................................................................ 70
3
c. Redevelopment or Relocation ............................................................................................ 73 4.7 Slum Development in Ludhiana: Opportunities and Challenges ........................... 76 a. Opportunities ............................................................................................................................ 76 b. Challenges ................................................................................................................................... 78
5. Access to Basic Services in Slums of Ludhiana .................................................................................. 79 5.1 Current need Assessment ....................................................................................................... 79 a. Water Supply ............................................................................................................................. 79 b. Sewerage ..................................................................................................................................... 80 c. Roads ............................................................................................................................................. 80 d. Drainage ...................................................................................................................................... 80 e. Streetlights .................................................................................................................................. 80 f. Housing ......................................................................................................................................... 80
5.2 Future Need Assessment: ....................................................................................................... 81 5.3 Total Resource Demand for Slum Free Ludhiana ........................................................ 83
6. Implementation Plan .................................................................................................................................... 85 6.1 Time Line ....................................................................................................................................... 86 6.2 Resource Availability ................................................................................................................ 87 6.3 Resource Funding to meet the vision of SFCPoA, Ludhiana .................................... 87 a. CSR Funds ................................................................................................................................... 87 b. Housing Credit Fund .............................................................................................................. 91 c. PPP Arrangements ................................................................................................................... 91 d. Housing Finance Options ..................................................................................................... 91 e. Group housing societies of slum-‐dwellers .................................................................... 92 f. Rental Housing or Housing on Hire Purchase .............................................................. 92
7. Strategy to make Ludhiana a ‘Slum Free City’ ................................................................................... 93 7.1 Ludhiana Vision: An Inclusive, Green and Growing City ........................................... 93 a. Project Implementation Agency ........................................................................................ 93 b. Community Mobilization and Organization ................................................................. 93 c. Approach to Slum Free Ludhiana ...................................................................................... 93
7.2 Slum Development Strategy .................................................................................................. 94 a. Housing ........................................................................................................................................ 94 b. Water Supply ............................................................................................................................. 95 c. Sanitation Services .................................................................................................................. 97 d. Development of Livelihoods ............................................................................................... 99 e. Access to Health and Education Services ................................................................... 101 f. Access to Social Security ..................................................................................................... 101
7.3 Project Implementation Unit ............................................................................................. 101 Annexures …………………………………………………………………………………………………………………………….102
4
List of Exhibits Exhibit 1: Focused Group Discussions being held in slums __________________________________ 13 Exhibit 2: Slum Resource Maps prepared with Slum Communities _________________________ 13 Exhibit 3: Ludhiana slums and wards overlaid on the Satellite image _____________________ 15 Exhibit 4: Arc Pad used to make Slum Boundary Maps ______________________________________ 16 Exhibit 6: Mobile Survey Application _________________________________________________________ 17 Exhibit 8: Website for managing the household data collection ____________________________ 18 Exhibit 10: Urbanization level in Punjab Districts ___________________________________________ 21 Exhibit 12: Types of Industries based in Ludhiana __________________________________________ 22 Exhibit 13: Employment and Turnover by Industry Type in Ludhiana _____________________ 23 Exhibit 14: Showing slums covered under BSUP and proposed sites for relocation _______ 25 Exhibit 15: Sex Ration of Ludhiana Slums as compared to Ludhiana city, District and State of Punjab _______________________________________________________________________________________ 29 Exhibit 16: Age sex Pyramid of Slum population in Ludhiana ______________________________ 30 Exhibit 17: Classification of Population based on Religion and Caste ______________________ 30 Exhibit 18: Comparative analysis of Religious classification within Slums _________________ 31 Exhibit 19: Education Profile in Slums _______________________________________________________ 31 Exhibit 20: Access to Education Institutions and Reported deficiencies in Schools ________ 32 Exhibit 21:Working Profile in Slums of Ludhiana ___________________________________________ 32 Exhibit 22: Incidences of loans in Slums ______________________________________________________ 33 Exhibit 23: Purpose of Loans as reported by the Respondents ______________________________ 34 Exhibit 24: Repayment profile in Slums and Number of Households having Bank Accounts _________________________________________________________________________________________________ 34 Exhibit 25: % of Personal ID. Proofs __________________________________________________________ 35 Exhibit 26: Structural Quality of Housing in Slums __________________________________________ 35 Exhibit 27: Municipal and Private Water Sources available in Slums ______________________ 36 Exhibit 28: Source and Duration of Water Supply in Slums _________________________________ 36 Exhibit 29: Toilet facility at Household level _________________________________________________ 37 Exhibit 30: Typology of Household Toilets ___________________________________________________ 37 Exhibit 31: Toilet Usage among Households having no Individual Toilets _________________ 38 Exhibit 32: Toilet usage among Children ____________________________________________________ 38 Exhibit 33: Solid Waste Collection and Disposal in Slums ___________________________________ 39 Exhibit 35: Drainage infrastructure in Slums ________________________________________________ 40 Exhibit 36: Mode of transport used by Households in Slums ________________________________ 40 Exhibit 37: Reported Illnesses in Slums ______________________________________________________ 41 Exhibit 38: Healthcare facilities opted in case of Major Illnesses ___________________________ 41 Exhibit 39: Education Profile among Children in Slums _____________________________________ 42 Exhibit 40: A sample FGD with one of the slums in Ludhiana _______________________________ 45 Exhibit 41: Boundary Map of Slums, Ludhiana ______________________________________________ 47 Exhibit 42: Zone-‐wise Distribution of Slums _________________________________________________ 48 Exhibit 43: Geographical distributions of Wards with Slums in Ludhiana City ____________ 49 Exhibit 44: Geographic distributions of Zones and Slums ___________________________________ 49 Exhibit 45: The logical process followed in determining the tenability of slums ___________ 51 Exhibit 47: population Growth in Ludhiana City ____________________________________________ 58 Exhibit 48: Classified typology of slum houses _______________________________________________ 59 Exhibit 49: Methodology adopted for Assessing Housing Demand _________________________ 60
5
Exhibit 50: Estimated share of slums as compared to non-‐slum households by 2021 _____ 61 Exhibit 51: Framework for determining housing Strategy __________________________________ 62 Exhibit 52: Vacant Lands in Ludhiana _______________________________________________________ 63 Exhibit 53: Kuccha house in a Squatter settlement in Ludhiana ____________________________ 66 Exhibit 54: Average Jhuggi Size _______________________________________________________________ 67 Exhibit 55: A typical plan of Semi-‐Pucca houses in Slums of Ludhiana _____________________ 68 Exhibit 56: Proposed design for a 35 sq.m and 25sq.m shelter with toilet facility _________ 70 Exhibit 57: Model for Housing Upgrade in Semi-‐Pucca houses in Slums in Ludhiana _____ 71 Exhibit 58: Decentralized infrastructure for Slums __________________________________________ 72 Exhibit 59: Layout of Housing ________________________________________________________________ 73 Exhibit 60: Housing Block _____________________________________________________________________ 74 Exhibit 61: Detail of Balcony __________________________________________________________________ 74 Exhibit 62: Connection of wastewater to decentralized wastewater treatment system ___ 74 Exhibit 63: Components of Decentralized Wastewater Treatment System (DEWATS) for Group Housings ________________________________________________________________________________ 75 Exhibit 64: In-‐house Composting Facility for Efficient Solid Waste Management _________ 75 Exhibit 66: Income Expenditure Pattern of MCL, Year 2012-‐14 ____________________________ 87 Exhibit 67: Decentralized and Local Solutions for Water ___________________________________ 96 Exhibit 68: Household Toilets in Slums _______________________________________________________ 97
6
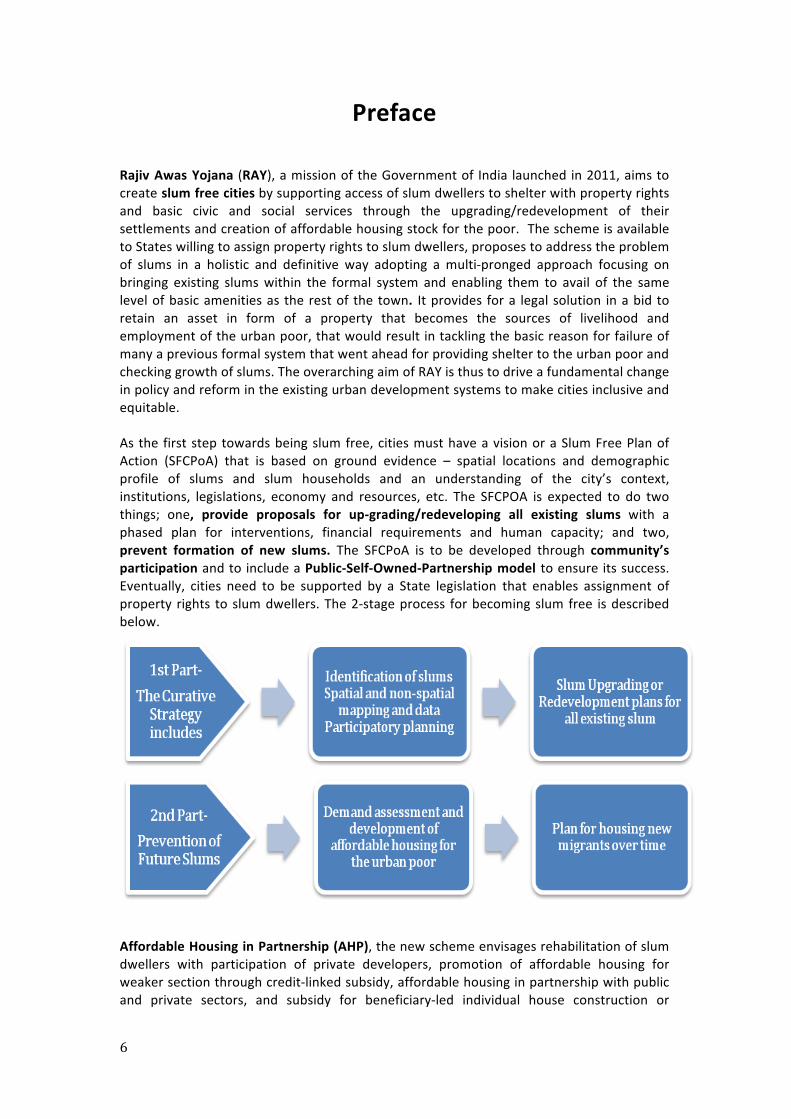
Preface Rajiv Awas Yojana (RAY), a mission of the Government of India launched in 2011, aims to create slum free cities by supporting access of slum dwellers to shelter with property rights and basic civic and social services through the upgrading/redevelopment of their settlements and creation of affordable housing stock for the poor. The scheme is available to States willing to assign property rights to slum dwellers, proposes to address the problem of slums in a holistic and definitive way adopting a multi-‐pronged approach focusing on bringing existing slums within the formal system and enabling them to avail of the same level of basic amenities as the rest of the town. It provides for a legal solution in a bid to retain an asset in form of a property that becomes the sources of livelihood and employment of the urban poor, that would result in tackling the basic reason for failure of many a previous formal system that went ahead for providing shelter to the urban poor and checking growth of slums. The overarching aim of RAY is thus to drive a fundamental change in policy and reform in the existing urban development systems to make cities inclusive and equitable. As the first step towards being slum free, cities must have a vision or a Slum Free Plan of Action (SFCPoA) that is based on ground evidence – spatial locations and demographic profile of slums and slum households and an understanding of the city’s context, institutions, legislations, economy and resources, etc. The SFCPOA is expected to do two things; one, provide proposals for up-‐grading/redeveloping all existing slums with a phased plan for interventions, financial requirements and human capacity; and two, prevent formation of new slums. The SFCPoA is to be developed through community’s participation and to include a Public-‐Self-‐Owned-‐Partnership model to ensure its success. Eventually, cities need to be supported by a State legislation that enables assignment of property rights to slum dwellers. The 2-‐stage process for becoming slum free is described below.
Affordable Housing in Partnership (AHP), the new scheme envisages rehabilitation of slum dwellers with participation of private developers, promotion of affordable housing for weaker section through credit-‐linked subsidy, affordable housing in partnership with public and private sectors, and subsidy for beneficiary-‐led individual house construction or
7
enhancement. Under the grant, a central grant of Rs 1 lakh per house on average will be available under the slum rehabilitation programme. Besides, the credit-‐linked interest subsidy component will have interest subsidy of 6.5% on housing loans up to a tenure of 15 years, for economically weaker sections (EWS) and low income groups, giving them a benefit of about Rs 2.3 lakh each. Municipal Corporation of Ludhiana (MCL) seeks to develop a clear and comprehensive strategy/ Action Plan to make the city slum free – level up all the slum dwellers, create inclusion and integration, ensure housing and services’ comprehensiveness, and make the city safe including for the large numbers of migrant workers that flock to the city and live in Self-‐Ownedly shared housing called Vehdas as part of its plan for future migrants. Towards this end, MCL has entrusted Centre for Urban and Regional Excellence (CURE), an NGO working in the field of urban slum rehabilitation/resettlement, to participate in the development of the SFCPOA and to carry out activities envisaged in the guidelines, including:
Survey activities Mapping activities Development of Framework through Community Participation Formulating Implementation Plan ensuring people’s representation
The approach used in the development of the SFCPOA has been participatory involving slum communities in every settlement for prioritizing needs and solutions. Members of various groups -‐ citizens, vulnerable, local NGOs, elected representatives; Self-‐Owned sector agencies and officials were involved in the processes of preparing the Plan. The Ludhiana Slum Free City Plan envisions Ludhiana as an Inclusive, Green and Growing City; a city that welcomes poor workers and creates decent, clean and pollution-‐free living environments for the poor by mainstreaming their low-‐income settlements with city’s infrastructure with improved, in-‐house, basic municipal services and housing; access to roads, transport, schools, health care, food and social security; and enhanced skills for promoting growth. Its approach to achieving slum free Ludhiana shall be rights-‐based, equitable, comprehensive, inclusive, socially, economically and environmentally sustainable and futuristic.
8
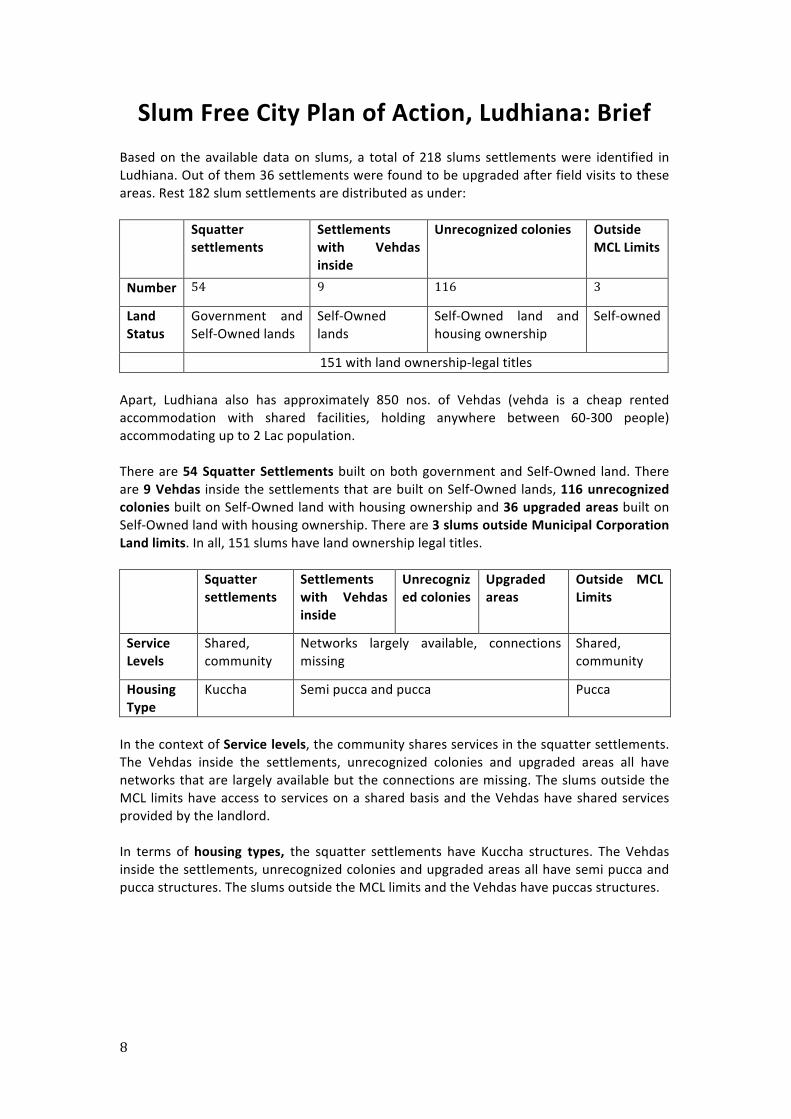
Slum Free City Plan of Action, Ludhiana: Brief Based on the available data on slums, a total of 218 slums settlements were identified in Ludhiana. Out of them 36 settlements were found to be upgraded after field visits to these areas. Rest 182 slum settlements are distributed as under: Squatter
settlements Settlements with Vehdas inside
Unrecognized colonies Outside MCL Limits
Number 54 9 116 3
Land Status
Government and Self-‐Owned lands
Self-‐Owned lands
Self-‐Owned land and housing ownership
Self-‐owned
151 with land ownership-‐legal titles Apart, Ludhiana also has approximately 850 nos. of Vehdas (vehda is a cheap rented accommodation with shared facilities, holding anywhere between 60-‐300 people) accommodating up to 2 Lac population. There are 54 Squatter Settlements built on both government and Self-‐Owned land. There are 9 Vehdas inside the settlements that are built on Self-‐Owned lands, 116 unrecognized colonies built on Self-‐Owned land with housing ownership and 36 upgraded areas built on Self-‐Owned land with housing ownership. There are 3 slums outside Municipal Corporation Land limits. In all, 151 slums have land ownership legal titles. Squatter
settlements Settlements with Vehdas inside
Unrecognized colonies
Upgraded areas
Outside MCL Limits
Service Levels
Shared, community
Networks largely available, connections missing
Shared, community
Housing Type
Kuccha Semi pucca and pucca Pucca
In the context of Service levels, the community shares services in the squatter settlements. The Vehdas inside the settlements, unrecognized colonies and upgraded areas all have networks that are largely available but the connections are missing. The slums outside the MCL limits have access to services on a shared basis and the Vehdas have shared services provided by the landlord. In terms of housing types, the squatter settlements have Kuccha structures. The Vehdas inside the settlements, unrecognized colonies and upgraded areas all have semi pucca and pucca structures. The slums outside the MCL limits and the Vehdas have puccas structures.
9
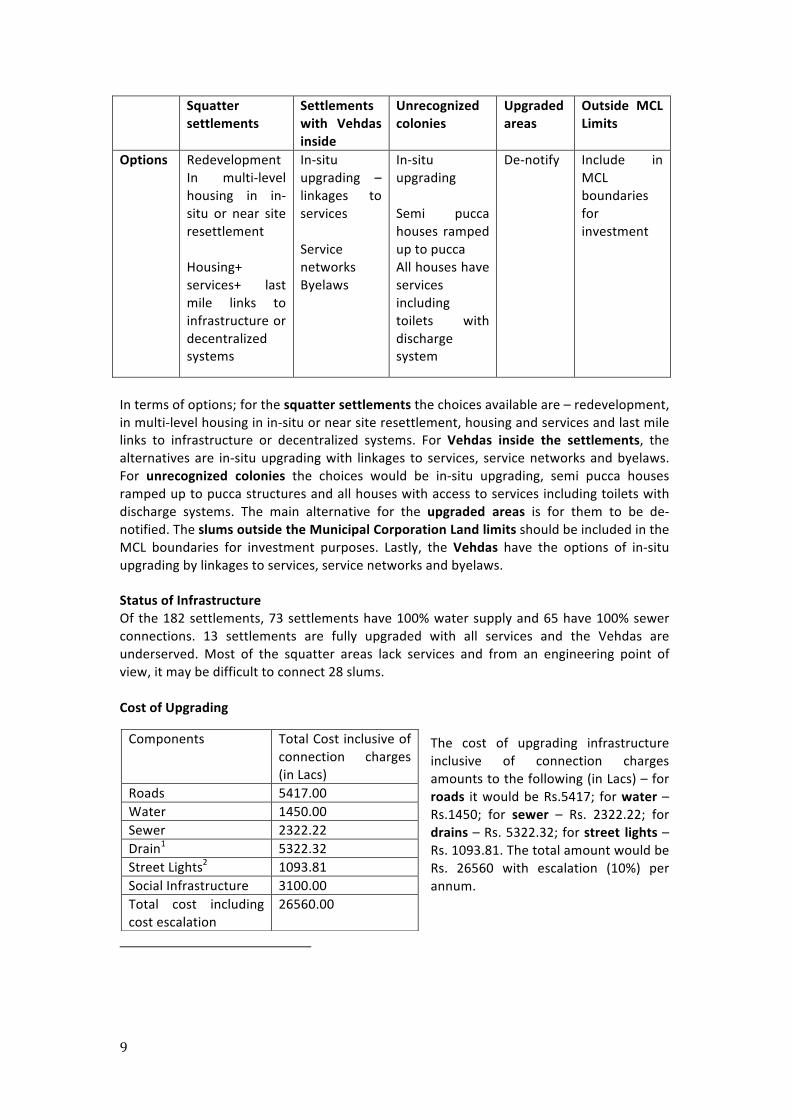
Squatter settlements
Settlements with Vehdas inside
Unrecognized colonies
Upgraded areas
Outside MCL Limits
Options Redevelopment In multi-‐level housing in in-‐situ or near site resettlement Housing+ services+ last mile links to infrastructure or decentralized systems
In-‐situ upgrading – linkages to services Service networks Byelaws
In-‐situ upgrading Semi pucca houses ramped up to pucca All houses have services including toilets with discharge system
De-‐notify Include in MCL boundaries for investment
In terms of options; for the squatter settlements the choices available are – redevelopment, in multi-‐level housing in in-‐situ or near site resettlement, housing and services and last mile links to infrastructure or decentralized systems. For Vehdas inside the settlements, the alternatives are in-‐situ upgrading with linkages to services, service networks and byelaws. For unrecognized colonies the choices would be in-‐situ upgrading, semi pucca houses ramped up to pucca structures and all houses with access to services including toilets with discharge systems. The main alternative for the upgraded areas is for them to be de-‐notified. The slums outside the Municipal Corporation Land limits should be included in the MCL boundaries for investment purposes. Lastly, the Vehdas have the options of in-‐situ upgrading by linkages to services, service networks and byelaws. Status of Infrastructure Of the 182 settlements, 73 settlements have 100% water supply and 65 have 100% sewer connections. 13 settlements are fully upgraded with all services and the Vehdas are underserved. Most of the squatter areas lack services and from an engineering point of view, it may be difficult to connect 28 slums. Cost of Upgrading
The cost of upgrading infrastructure inclusive of connection charges amounts to the following (in Lacs) – for roads it would be Rs.5417; for water – Rs.1450; for sewer – Rs. 2322.22; for drains – Rs. 5322.32; for street lights – Rs. 1093.81. The total amount would be Rs. 26560 with escalation (10%) per annum.
Components Total Cost inclusive of connection charges (in Lacs)
Roads 5417.00 Water 1450.00 Sewer 2322.22 Drain1 5322.32 Street Lights2 1093.81 Social Infrastructure 3100.00 Total cost including cost escalation
26560.00
10
Housing Demand The total numbers of Dwelling Units that are to be upgraded are 11504. These are both squatter settlements and kuccha structures in unauthorized areas. On calculating the future demand, we find 38000 additional units per decade based on population growth rate of the city, which is at 17%. Of this, about 41% is estimated from migration growth. Assuming that the Self-‐Owned sector would continue providing accommodation to the population in rental housing, it is estimated that it will cover 70% of the total estimated housing demand. Rest 30% (11500) additional individual housing units are required to be built by public sector agencies over the next decade. The proposed housing construction cost borne by MCL would be 3 lac per house x ~23000 units = Rs.690 cr. The land required would be 155 hectares. MCL’s Share per annum as per RAY guidelines The MCL would be required to invest 10% of the total cost of Housing which would amount to Rs.106 cr. In terms of Infrastructure they would be required to invest 20% of the total cost amounting to Rs.8.5 cr. The total MCL share would be Rs. 114.5 cr. Vacant Land The land required to cater to the current deficit and for future growth is 155 Ha. As per the survey Ludhiana has a total of 1478 Ha of land cover under Open/Green/Vacant Category. Issues to be addressed In conclusion there are certain issues that need to be addressed. To begin with, upgraded settlements are required to be de-‐notified. The Vehdas house poor migrants and while this is rental housing built by the Self-‐Owned sector, there is a major lack of environmental hygiene in this area due to a lack of networked services. This issue needs to be addressed. The Vehdas need byelaws and regulation as they are a result of non conforming areas as per the Master Plan. Lastly, the squatter settlements are an encroachment on State and Self-‐Owned land but they are tenable and may be considered for redevelopment.
11
SECTION 1: INTRODUCTION
12
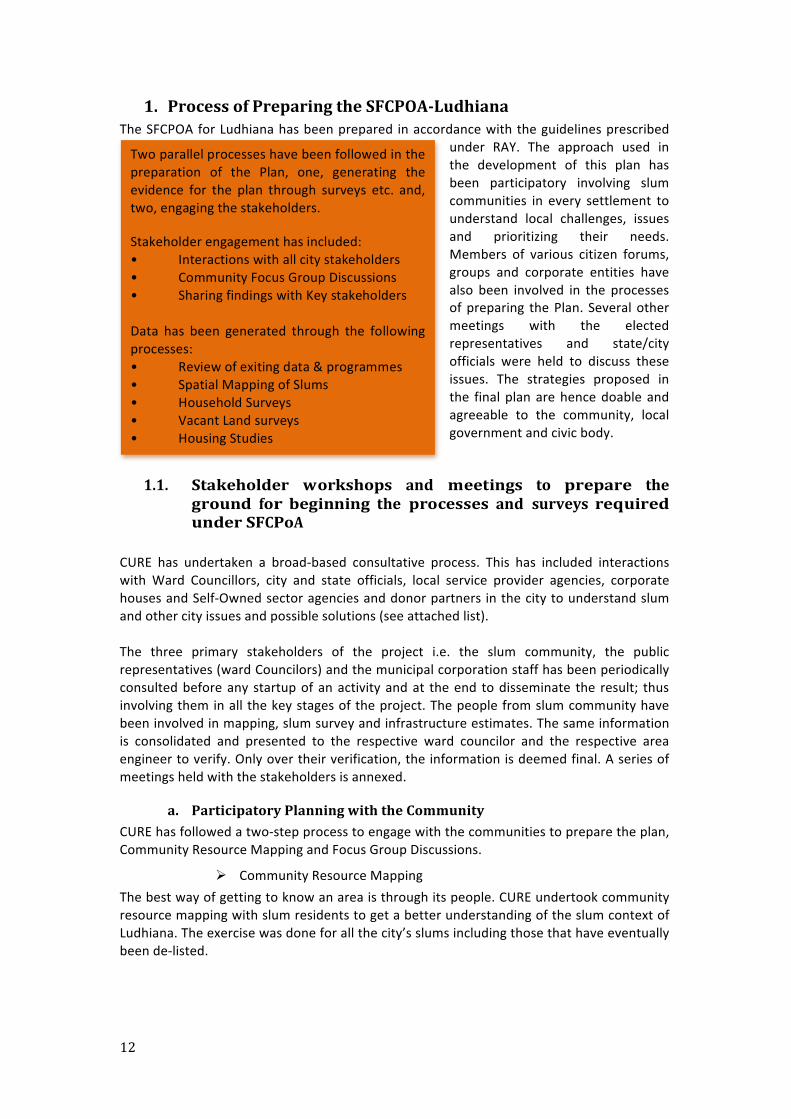
1. Process of Preparing the SFCPOA-‐Ludhiana The SFCPOA for Ludhiana has been prepared in accordance with the guidelines prescribed
under RAY. The approach used in the development of this plan has been participatory involving slum communities in every settlement to understand local challenges, issues and prioritizing their needs. Members of various citizen forums, groups and corporate entities have also been involved in the processes of preparing the Plan. Several other meetings with the elected representatives and state/city officials were held to discuss these issues. The strategies proposed in the final plan are hence doable and agreeable to the community, local government and civic body.
1.1. Stakeholder workshops and meetings to prepare the ground for beginning the processes and surveys required under SFCPoA
CURE has undertaken a broad-‐based consultative process. This has included interactions with Ward Councillors, city and state officials, local service provider agencies, corporate houses and Self-‐Owned sector agencies and donor partners in the city to understand slum and other city issues and possible solutions (see attached list). The three primary stakeholders of the project i.e. the slum community, the public representatives (ward Councilors) and the municipal corporation staff has been periodically consulted before any startup of an activity and at the end to disseminate the result; thus involving them in all the key stages of the project. The people from slum community have been involved in mapping, slum survey and infrastructure estimates. The same information is consolidated and presented to the respective ward councilor and the respective area engineer to verify. Only over their verification, the information is deemed final. A series of meetings held with the stakeholders is annexed.
a. Participatory Planning with the Community CURE has followed a two-‐step process to engage with the communities to prepare the plan, Community Resource Mapping and Focus Group Discussions.
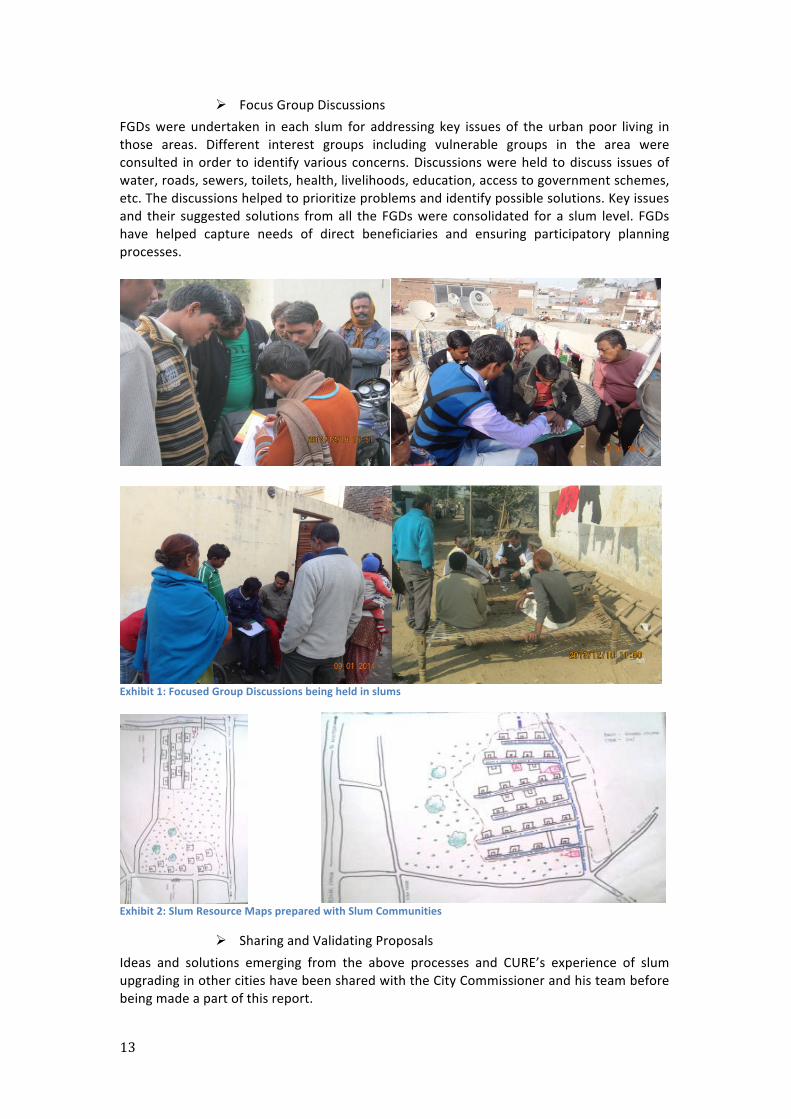
Ø Community Resource Mapping The best way of getting to know an area is through its people. CURE undertook community resource mapping with slum residents to get a better understanding of the slum context of Ludhiana. The exercise was done for all the city’s slums including those that have eventually been de-‐listed.
Two parallel processes have been followed in the preparation of the Plan, one, generating the evidence for the plan through surveys etc. and, two, engaging the stakeholders.
Stakeholder engagement has included: • Interactions with all city stakeholders • Community Focus Group Discussions • Sharing findings with Key stakeholders Data has been generated through the following processes: • Review of exiting data & programmes • Spatial Mapping of Slums • Household Surveys • Vacant Land surveys • Housing Studies
13
Ø Focus Group Discussions FGDs were undertaken in each slum for addressing key issues of the urban poor living in those areas. Different interest groups including vulnerable groups in the area were consulted in order to identify various concerns. Discussions were held to discuss issues of water, roads, sewers, toilets, health, livelihoods, education, access to government schemes, etc. The discussions helped to prioritize problems and identify possible solutions. Key issues and their suggested solutions from all the FGDs were consolidated for a slum level. FGDs have helped capture needs of direct beneficiaries and ensuring participatory planning processes.
Exhibit 1: Focused Group Discussions being held in slums
Exhibit 2: Slum Resource Maps prepared with Slum Communities
Ø Sharing and Validating Proposals Ideas and solutions emerging from the above processes and CURE’s experience of slum upgrading in other cities have been shared with the City Commissioner and his team before being made a part of this report.
14
Voice of Local Public Representative 1. The support and benefits of such scheme should be increased to the people
who are from marginal castes, widows and senior citizens even if they are above the poverty line but marginal as compared to others.
2. The councillors should be given a fixed sum of fund for implementing small activities like in these bastis. Also the activities should be finalised with the councillors as they feel they can correctly represent people knowing the real ground situation.
Voice of Urban Local Body
1. The slums in Ludhiana are not really the main challenge for the city of Ludhiana; but Vehdas are. It is necessary to address the haphazard growth of these irregular built up structures that are Vehdas.
2. Vehdas are to be seen as a positive support to the housing problem of the city. 3. The lack of availability of land with Municipal Corporation Ludhiana can limit
the successful implementation. Hence the priority shall be given to in-‐situ upgrade slums wherever possible.
4. The existing housing stock created under BSUP which have not been allotted shall be utilized for accommodating RAY.
5. Since a major part of the housing need in Ludhiana is from Industrial workers, the corporate houses must be asked to contribute to slum upgrading projects.
Voice of Community
1. Community accounts solid waste as the primary problem for them. 2. The absence of storm water drains causes water logging for most of these
settlements, with water standing for a minimum of 4 days to a week in peak rainy season. This makes it difficult for them to commute to the city.
3. A major part of slum dwellers have individual and shared toilets with septic tanks with an outfall in open drains, which needs to be tapped for environmental hygiene of these settlements.
Voice of Corporate houses and Private sector
1. The corporate houses in Ludhiana collectively are ready to give their CSR money for various slum oriented projects.
2. The livelihood component in Slum Free City Plan shall be interlinked with the CSR activities. The private sector considers it a good opportunity to train and connect suitable candidates from slum to get proper employment.
3. The corporate houses also suggest that if the local body comes along with a list of projects which can be funded under CSR, they would willingly accept to contribute.
15
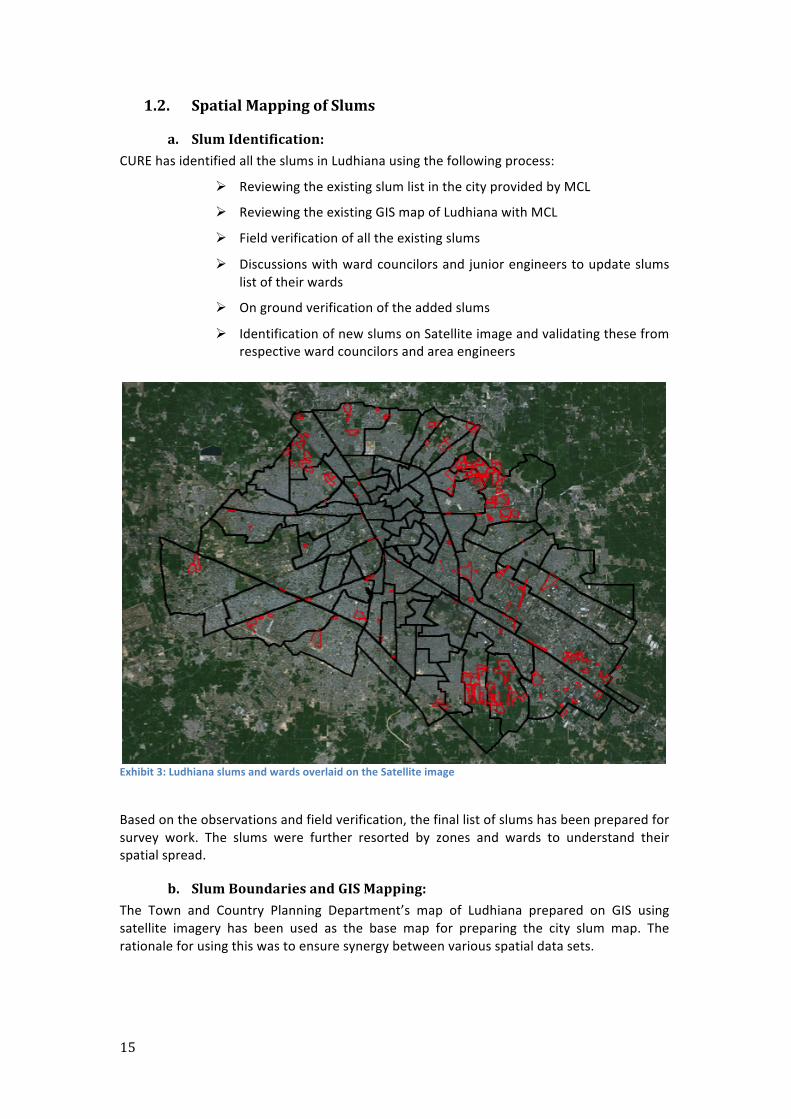
1.2. Spatial Mapping of Slums
a. Slum Identification: CURE has identified all the slums in Ludhiana using the following process:
Ø Reviewing the existing slum list in the city provided by MCL
Ø Reviewing the existing GIS map of Ludhiana with MCL
Ø Field verification of all the existing slums
Ø Discussions with ward councilors and junior engineers to update slums list of their wards
Ø On ground verification of the added slums
Ø Identification of new slums on Satellite image and validating these from respective ward councilors and area engineers
Exhibit 3: Ludhiana slums and wards overlaid on the Satellite image
Based on the observations and field verification, the final list of slums has been prepared for survey work. The slums were further resorted by zones and wards to understand their spatial spread.
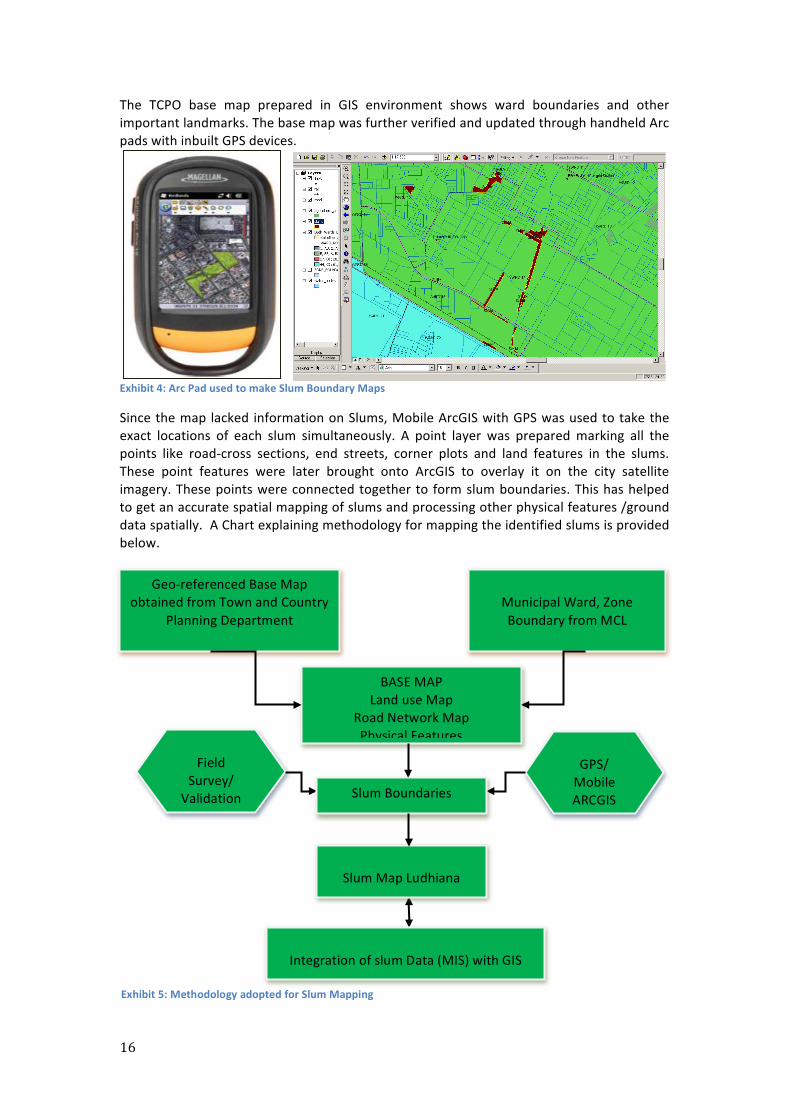
b. Slum Boundaries and GIS Mapping: The Town and Country Planning Department’s map of Ludhiana prepared on GIS using satellite imagery has been used as the base map for preparing the city slum map. The rationale for using this was to ensure synergy between various spatial data sets.
16
The TCPO base map prepared in GIS environment shows ward boundaries and other important landmarks. The base map was further verified and updated through handheld Arc pads with inbuilt GPS devices.
Exhibit 4: Arc Pad used to make Slum Boundary Maps
Since the map lacked information on Slums, Mobile ArcGIS with GPS was used to take the exact locations of each slum simultaneously. A point layer was prepared marking all the points like road-‐cross sections, end streets, corner plots and land features in the slums. These point features were later brought onto ArcGIS to overlay it on the city satellite imagery. These points were connected together to form slum boundaries. This has helped to get an accurate spatial mapping of slums and processing other physical features /ground data spatially. A Chart explaining methodology for mapping the identified slums is provided below.
Field
Survey/ Validation
GPS/ Mobile ARCGIS
BASE MAP Land use Map
Road Network Map Physical Features
Geo-‐referenced Base Map obtained from Town and Country
Planning Department
Slum Boundaries
Integration of slum Data (MIS) with GIS
Municipal Ward, Zone Boundary from MCL
Slum Map Ludhiana
Exhibit 5: Methodology adopted for Slum Mapping
17
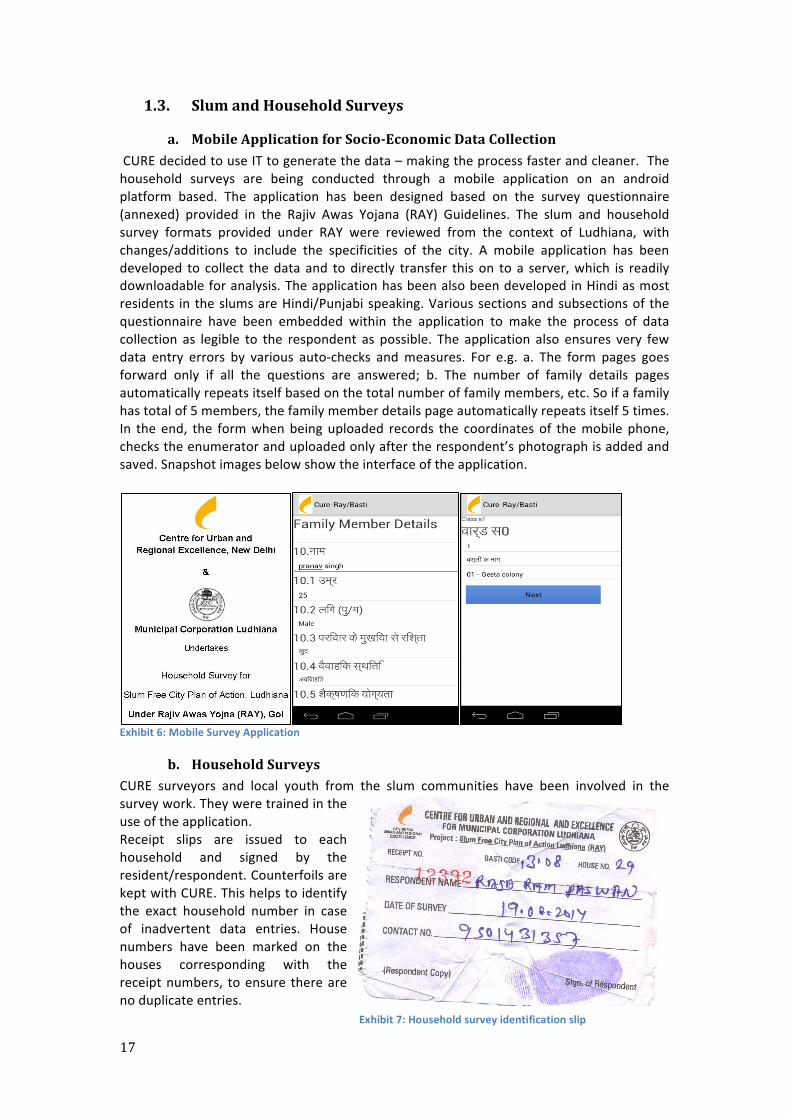
1.3. Slum and Household Surveys
a. Mobile Application for Socio-‐Economic Data Collection CURE decided to use IT to generate the data – making the process faster and cleaner. The household surveys are being conducted through a mobile application on an android platform based. The application has been designed based on the survey questionnaire (annexed) provided in the Rajiv Awas Yojana (RAY) Guidelines. The slum and household survey formats provided under RAY were reviewed from the context of Ludhiana, with changes/additions to include the specificities of the city. A mobile application has been developed to collect the data and to directly transfer this on to a server, which is readily downloadable for analysis. The application has been also been developed in Hindi as most residents in the slums are Hindi/Punjabi speaking. Various sections and subsections of the questionnaire have been embedded within the application to make the process of data collection as legible to the respondent as possible. The application also ensures very few data entry errors by various auto-‐checks and measures. For e.g. a. The form pages goes forward only if all the questions are answered; b. The number of family details pages automatically repeats itself based on the total number of family members, etc. So if a family has total of 5 members, the family member details page automatically repeats itself 5 times. In the end, the form when being uploaded records the coordinates of the mobile phone, checks the enumerator and uploaded only after the respondent’s photograph is added and saved. Snapshot images below show the interface of the application.
Exhibit 6: Mobile Survey Application
b. Household Surveys CURE surveyors and local youth from the slum communities have been involved in the survey work. They were trained in the use of the application. Receipt slips are issued to each household and signed by the resident/respondent. Counterfoils are kept with CURE. This helps to identify the exact household number in case of inadvertent data entries. House numbers have been marked on the houses corresponding with the receipt numbers, to ensure there are no duplicate entries.
Exhibit 7: Household survey identification slip
18
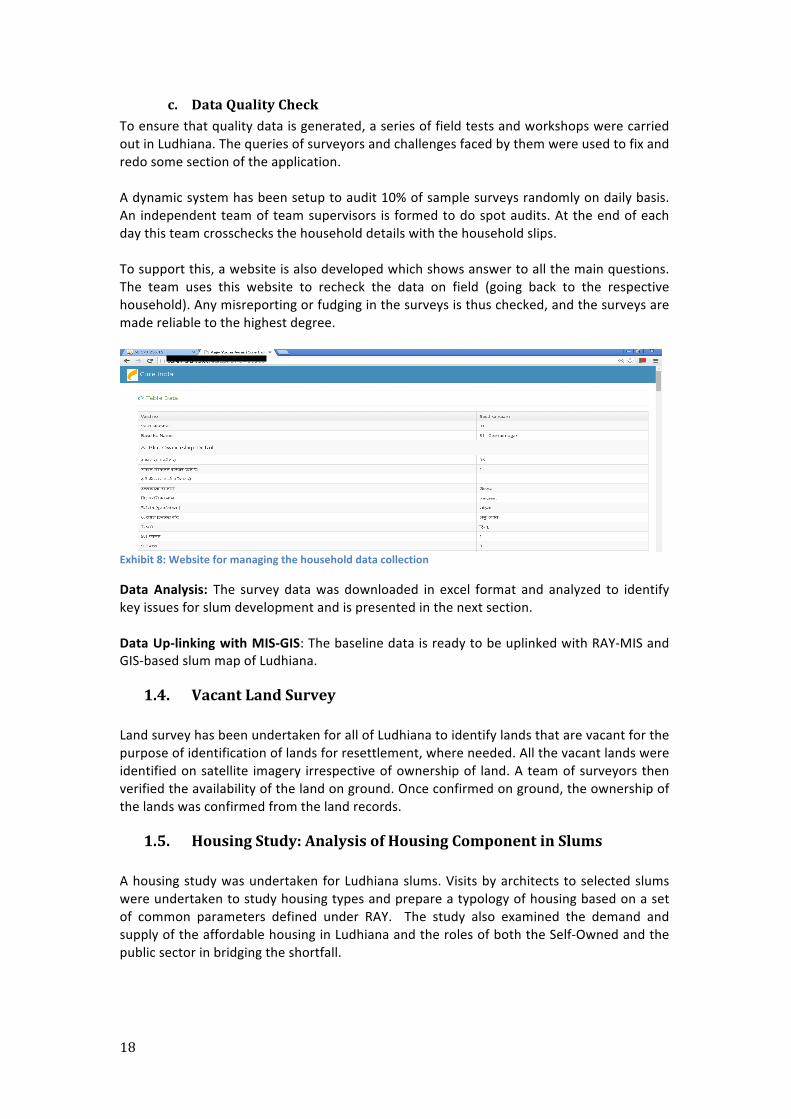
c. Data Quality Check To ensure that quality data is generated, a series of field tests and workshops were carried out in Ludhiana. The queries of surveyors and challenges faced by them were used to fix and redo some section of the application. A dynamic system has been setup to audit 10% of sample surveys randomly on daily basis. An independent team of team supervisors is formed to do spot audits. At the end of each day this team crosschecks the household details with the household slips. To support this, a website is also developed which shows answer to all the main questions. The team uses this website to recheck the data on field (going back to the respective household). Any misreporting or fudging in the surveys is thus checked, and the surveys are made reliable to the highest degree.
Exhibit 8: Website for managing the household data collection
Data Analysis: The survey data was downloaded in excel format and analyzed to identify key issues for slum development and is presented in the next section. Data Up-‐linking with MIS-‐GIS: The baseline data is ready to be uplinked with RAY-‐MIS and GIS-‐based slum map of Ludhiana.
1.4. Vacant Land Survey Land survey has been undertaken for all of Ludhiana to identify lands that are vacant for the purpose of identification of lands for resettlement, where needed. All the vacant lands were identified on satellite imagery irrespective of ownership of land. A team of surveyors then verified the availability of the land on ground. Once confirmed on ground, the ownership of the lands was confirmed from the land records.
1.5. Housing Study: Analysis of Housing Component in Slums A housing study was undertaken for Ludhiana slums. Visits by architects to selected slums were undertaken to study housing types and prepare a typology of housing based on a set of common parameters defined under RAY. The study also examined the demand and supply of the affordable housing in Ludhiana and the roles of both the Self-‐Owned and the public sector in bridging the shortfall.
19
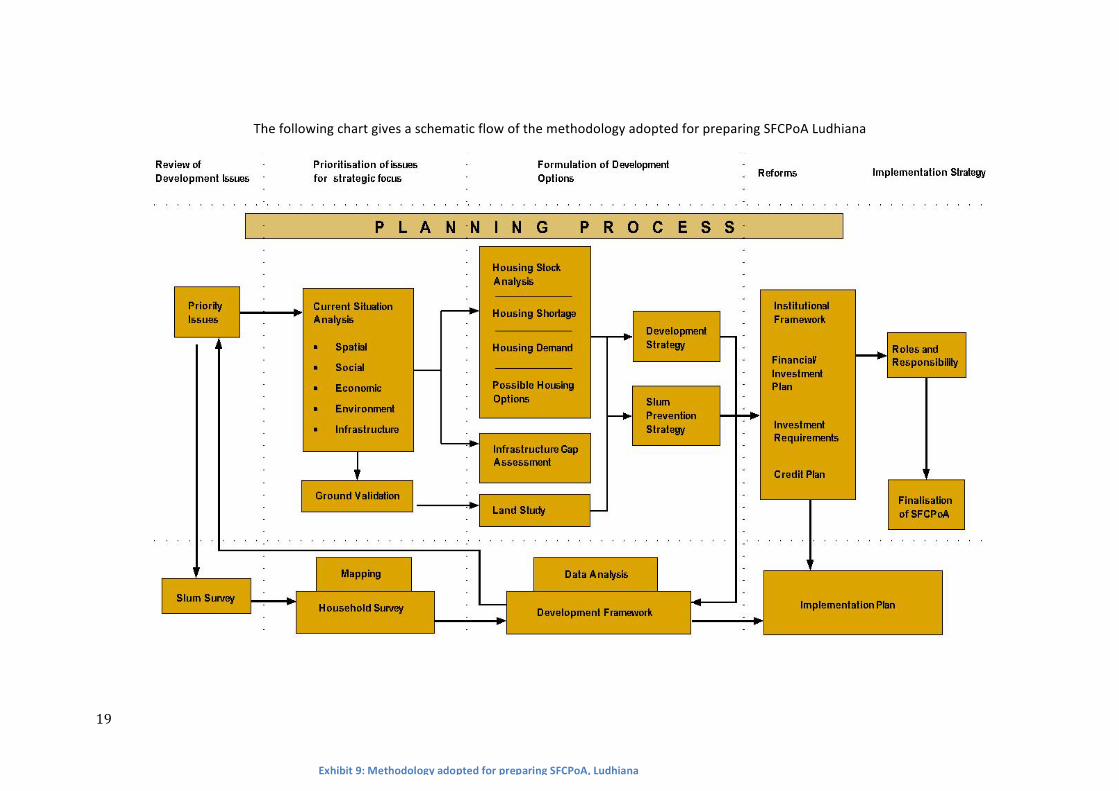
The following chart gives a schematic flow of the methodology adopted for preparing SFCPoA Ludhiana
Exhibit 9: Methodology adopted for preparing SFCPoA, Ludhiana
20
SECTION 2: SLUM PROFILE
21
2. Preparation of a City Profile
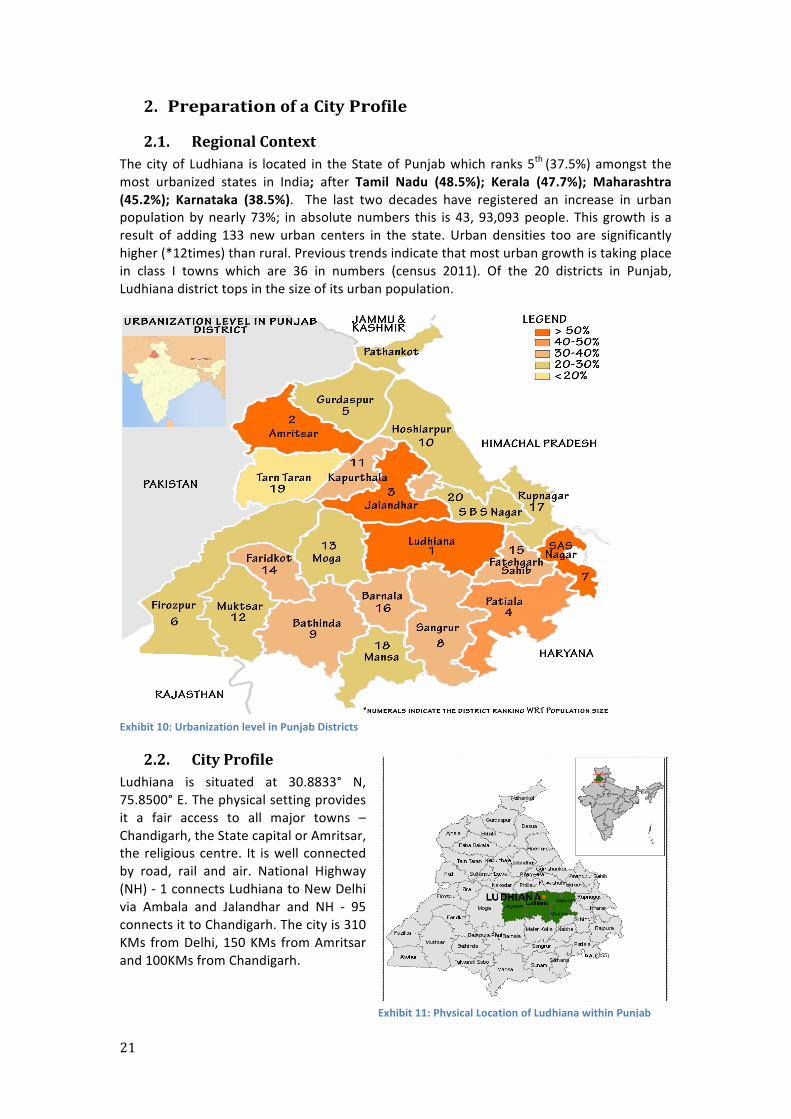
2.1. Regional Context The city of Ludhiana is located in the State of Punjab which ranks 5th (37.5%) amongst the most urbanized states in India; after Tamil Nadu (48.5%); Kerala (47.7%); Maharashtra (45.2%); Karnataka (38.5%). The last two decades have registered an increase in urban population by nearly 73%; in absolute numbers this is 43, 93,093 people. This growth is a result of adding 133 new urban centers in the state. Urban densities too are significantly higher (*12times) than rural. Previous trends indicate that most urban growth is taking place in class I towns which are 36 in numbers (census 2011). Of the 20 districts in Punjab, Ludhiana district tops in the size of its urban population.
Exhibit 10: Urbanization level in Punjab Districts
2.2. City Profile Ludhiana is situated at 30.8833° N, 75.8500° E. The physical setting provides it a fair access to all major towns – Chandigarh, the State capital or Amritsar, the religious centre. It is well connected by road, rail and air. National Highway (NH) -‐ 1 connects Ludhiana to New Delhi via Ambala and Jalandhar and NH -‐ 95 connects it to Chandigarh. The city is 310 KMs from Delhi, 150 KMs from Amritsar and 100KMs from Chandigarh.
Exhibit 11: Physical Location of Ludhiana within Punjab
22
a. Demography Ludhiana has emerged as Punjab’s largest city in terms of area, population -‐ experiencing an unprecedented bulge, and economic growth. The city is spread over 159.37 sq. km and has a total population of 1,613,878 (Census 2011). Its growth rate has been very fast but is beginning to slow down, 2001-‐11 saw a 16% increase, the lowest since 1961. The city is growing largely due to migration – people coming to work in its various industries. Two-‐third workforce is of migratory workers, and 1/3rd of the total migratory workers are inter-‐state migrates. Ludhiana’s gross density is 975 people per sq. km.
b. Administrative Ludhiana is divided into 75 wards for administrative purposes. The wards are aggregated into 4 Zones, each representing a quarter of the city. Zone A and Zone B has 20 wards each and Zone C and D have 17 and 16 wards respectively.
c. Climate Ludhiana has a humid subtropical climate. It is very hot and dry in summer, from April to June -‐ average high in May and June is 40 °C. In winter temperatures drop to 3 °C. Ludhiana average annual precipitation is 730 mm (29 in). Its air is highly polluted with particulate matter over six times the World Health Organization recommended standard.
d. Religious and Historical Importance Besides being a commercial hub, Ludhiana is also an important pilgrimage centre with a number of Gurudwaras located in and around the city. The Fort of Lodhi which is a 500 years old historical monument, built by the Muslim ruler Sikander Lodhi, is also located near the city, along the banks of River Sutlej. City name probably derived from founder’s name.
e. Education Ludhiana has some prestigious education institutions. It has two Medical Colleges, an Engineering College and the Punjab Agricultural University that has played a key role in Punjab’s 'Green Revolution'.
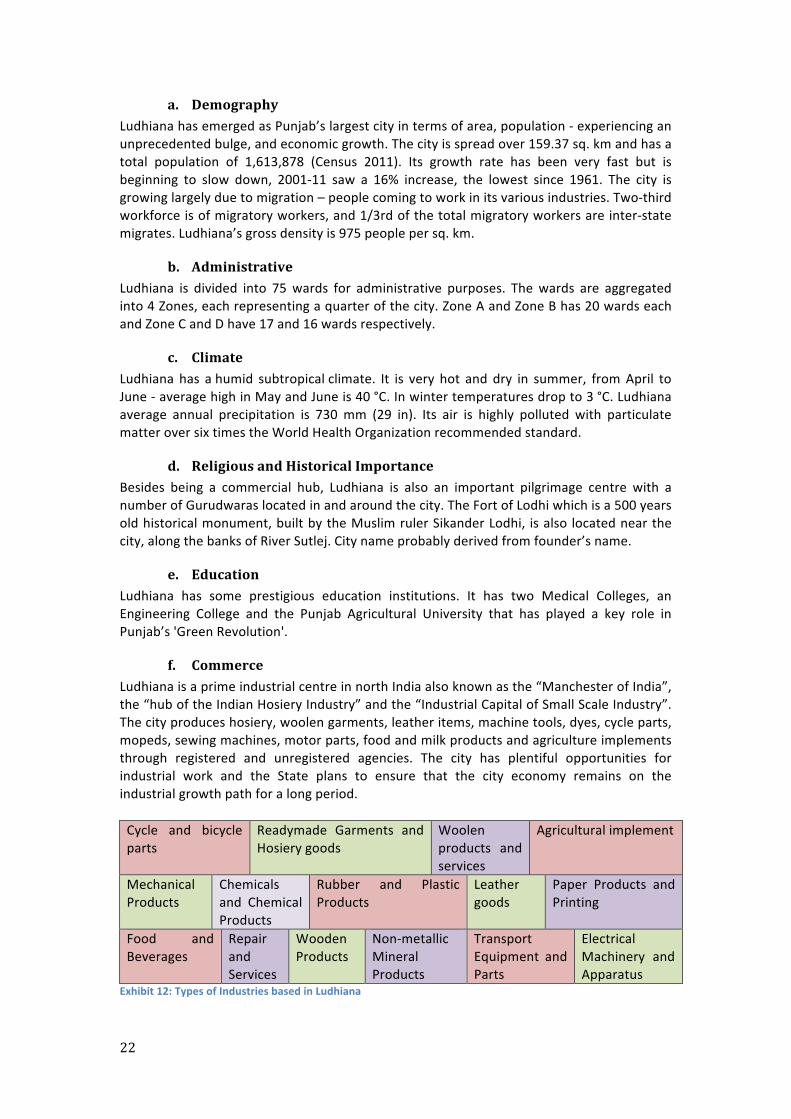
f. Commerce Ludhiana is a prime industrial centre in north India also known as the “Manchester of India”, the “hub of the Indian Hosiery Industry” and the “Industrial Capital of Small Scale Industry”. The city produces hosiery, woolen garments, leather items, machine tools, dyes, cycle parts, mopeds, sewing machines, motor parts, food and milk products and agriculture implements through registered and unregistered agencies. The city has plentiful opportunities for industrial work and the State plans to ensure that the city economy remains on the industrial growth path for a long period. Cycle and bicycle parts
Readymade Garments and Hosiery goods
Woolen products and services
Agricultural implement
Mechanical Products
Chemicals and Chemical Products
Rubber and Plastic Products
Leather goods
Paper Products and Printing
Food and Beverages
Repair and Services
Wooden Products
Non-‐metallic Mineral Products
Transport Equipment and Parts
Electrical Machinery and Apparatus
Exhibit 12: Types of Industries based in Ludhiana
23
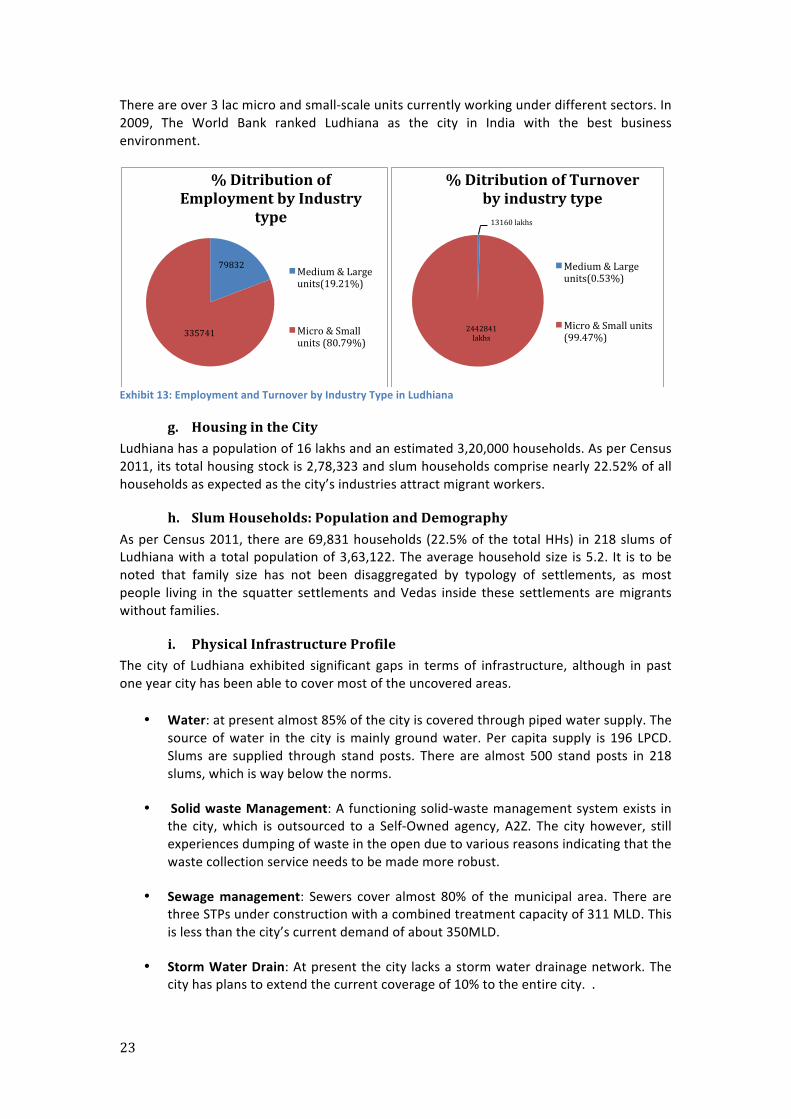
There are over 3 lac micro and small-‐scale units currently working under different sectors. In 2009, The World Bank ranked Ludhiana as the city in India with the best business environment.
Exhibit 13: Employment and Turnover by Industry Type in Ludhiana
g. Housing in the City Ludhiana has a population of 16 lakhs and an estimated 3,20,000 households. As per Census 2011, its total housing stock is 2,78,323 and slum households comprise nearly 22.52% of all households as expected as the city’s industries attract migrant workers.
h. Slum Households: Population and Demography As per Census 2011, there are 69,831 households (22.5% of the total HHs) in 218 slums of Ludhiana with a total population of 3,63,122. The average household size is 5.2. It is to be noted that family size has not been disaggregated by typology of settlements, as most people living in the squatter settlements and Vedas inside these settlements are migrants without families.
i. Physical Infrastructure Profile The city of Ludhiana exhibited significant gaps in terms of infrastructure, although in past one year city has been able to cover most of the uncovered areas.
• Water: at present almost 85% of the city is covered through piped water supply. The source of water in the city is mainly ground water. Per capita supply is 196 LPCD. Slums are supplied through stand posts. There are almost 500 stand posts in 218 slums, which is way below the norms.
• Solid waste Management: A functioning solid-‐waste management system exists in the city, which is outsourced to a Self-‐Owned agency, A2Z. The city however, still experiences dumping of waste in the open due to various reasons indicating that the waste collection service needs to be made more robust.
• Sewage management: Sewers cover almost 80% of the municipal area. There are three STPs under construction with a combined treatment capacity of 311 MLD. This is less than the city’s current demand of about 350MLD.
• Storm Water Drain: At present the city lacks a storm water drainage network. The city has plans to extend the current coverage of 10% to the entire city. .
79832
335741
% Ditribution of Employment by Industry
type
Medium & Large units(19.21%)
Micro & Small units (80.79%)
13160 lakhs
2442841 lakhs
% Ditribution of Turnover by industry type
Medium & Large units(0.53%)
Micro & Small units (99.47%)
24
2.3. Review of Existing Policies, Programmes and Projects related to Slums and Housing
a. Ludhiana Master Plan 2021 The Master Plan of Ludhiana 2021 devotes a whole chapter to slums with facts and figures. One of the objectives in the Master Plan is, “To minimize growth of slums by making informal sector integral part of city planning and development process”. The Master Plan deems “Slums are a major source of nuisance to the residents of the planned colonies” and the issue of slums and poverty as the two major challenges facing the policy makers and planners of Ludhiana. Its observations of slums include the following;
§ Illegal water supply/electricity connections. § Absence of sewerage system resulting in open defecation, in turn creating
unhygienic conditions for residents, and causing environmental and developmental problems.
§ Encroachment on roads and parks are another major challenge. § There is no formal housing for industrial workers, due to which there are many
slums that have come up near the industrial areas. § The Government of Punjab has been unable to support urban local self-‐government
institutions to address the problems of urban poverty. § There have been negligible grant for urban poverty alleviation and slum
development in Punjab.
Further the Master Plan adds that the implementation of urban poverty alleviation schemes has not been effective due to poor institutional mechanism for poverty alleviation; “Evaluation of previous poverty alleviation schemes in the city showed poor implementation. The poor community mobilization/participation, training provided for skill-‐upgradation a mere formality, arbitrary sanctioning of loans, leakages of loan money as high as 12 per cent, were some of the listed deficiencies in implementing such schemes”. While the Master Plan has a negative view of slums, it fails to deliver any major policy recommendations or plan for addressing the issues, except the following initiative; “Municipal Corporation must speed up the slum development and poverty alleviation activities and a strong institutional mechanism is required for improving planning and local governance in the city.”
b. City Development Plan, Ludhiana 2021 The CDP 2011 (draft) prepared by Ludhiana under the JNNURM, has counted 209 slums with 20 per cent of the total population of Ludhiana. The CDP has recognized the diversity of housing structures in the slums; 65% houses are pucca, 12% are kutcha, and rest 23% is semi pucca. As per the CDP 57 slums were upgraded with all infrastructure facilities like household water supply, sewerage, streetlights, metal roads and parks; 68 were partially upgraded and the remaining 84 slums were to be upgraded. The CDP Ludhiana envisages Ludhiana as slum free by 2020 and suggests the city prepare a ‘Slum Free City Plan of Action’ under RAY. The CDP also suggests strategies for poverty alleviation -‐ it proposes a livelihood program to provide skill training to the urban poor, encouraging and scaling up of SHGs, initiating health programs for slum dwellers, providing infrastructure in and construction of 7000 houses for urban poor.
25
A total amount of Rs. 220Crores (5.6% of total investment proposed in the city) has been proposed exclusively for urban poor housing and services, under CDP. MCL (in collaboration with the Ludhiana Improvement Trust) has started the process of building about 3600 of the 7000 pucca houses of 30 sq. meters area each and to relocate slum dwellers at an investment of Rs. 180Crores at Rs. 1.97 Lakh per unit, inclusive of land cost. Upgrading basic infrastructure facilities (housing, water supply, sewerage, toilets, roads and streetlights) in slums is deemed priority under slum upgrading projects for which Rs. 27.62 Crores investment is proposed. Since the Ludhiana CDP has been drafted after the initiation of the RAY project, its strategy has included the provisions of RAY, although the solutions are typical of BSUP – which is resettlement housing.
c. Programs on Slum Development There are a number of programmes and schemes that are under implementation by MCL to address the issue of poverty and slums.
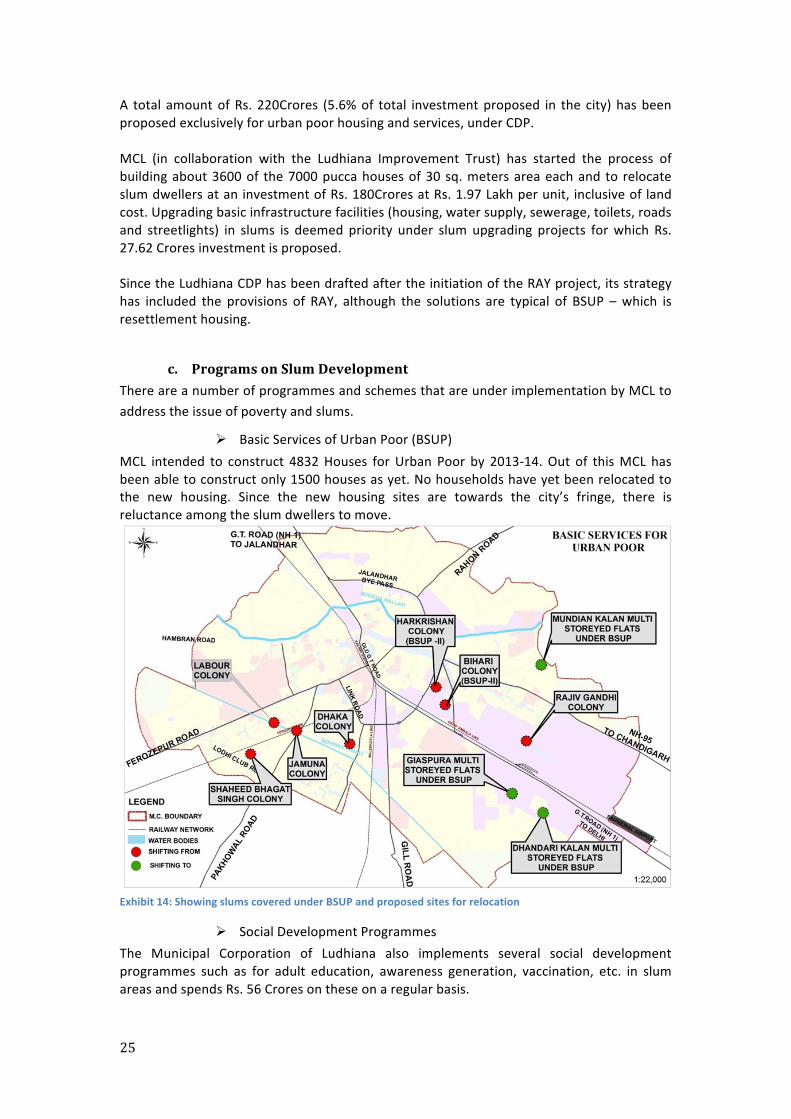
Ø Basic Services of Urban Poor (BSUP) MCL intended to construct 4832 Houses for Urban Poor by 2013-‐14. Out of this MCL has been able to construct only 1500 houses as yet. No households have yet been relocated to the new housing. Since the new housing sites are towards the city’s fringe, there is reluctance among the slum dwellers to move.
Exhibit 14: Showing slums covered under BSUP and proposed sites for relocation
Ø Social Development Programmes The Municipal Corporation of Ludhiana also implements several social development programmes such as for adult education, awareness generation, vaccination, etc. in slum areas and spends Rs. 56 Crores on these on a regular basis.
26
d. Challenges and Constraints in Preparing Slum Free City Plan Based on the above review, a few challenges in the preparation of the slum free city plan were envisaged.
a. Absence of data: While the basic numbers of slums were available with the MCL, the lists were not updated based on interventions over the past years. Apart from the slum list, no other data related to slums was available.
b. Number of Slum Households: The number of slum households at 68000 in the RFP is from Census 2011. This was the basis on which the financial quotations were prepared by CURE and the contract was formulated. However, on the ground the numbers of households were found to be much fewer in the listed-‐traditional slums. This is affecting the project budgeting.
c. Vehdas-‐Vertical Slums: Instead majority of the poor households were found living in Vehdas – tenement type of housing developed by Self-‐Owned landowners as migrant labour hostel and industrial worker’s accommodations. These can be imagined as vertical slums in dilapidated and in unhygienic conditions. However, due to the nature of definition of slums under RAY these were hard to include in the planning. A decision on their inclusion in the survey could not be taken till the report was finalized. This is phenomenon that is pan Punjab and addressing it in Ludhiana could provide the way forward for other cities as well.
d. Household Surveys: These have proved to be challenging for two reasons; the availability of skilled manpower in the city/slums who could get involved in collecting information using IT applications. The effort to involve students of Punjab Agriculture University – using this as an opportunity to build local capacity -‐ could not happen because of very high requirement for data collection by the Department. Eventually CURE had to move its own teams from Delhi and Agra to do the surveys.
e. Mobile Application for Data Generation: As this was the first time CURE was experimenting with the use of an IT application using android mobiles, there were a few difficulties in setting up the system at the start – especially with respect to language. These were eventually sorted out but meant a delayed start of the HH survey. However, this has reduced considerably the time needed for data entry and speeded up the process and provided more time for data analysis.
f. Councillor Interactions: These have been difficult to arrange due to non-‐availability of the councillors/lack of interest. As a result the list of slums could only be finalized towards the very end of the process.
g. GIS Mapping: MCL in 2004 had prepared a slum GIS under support from Cities Alliance and USAID. However, the copy of this GIS could not be accessed from any of the known sources. Having a 2004 map would have been useful to see the pattern of slum growth in the decade.
2.4. Assessment of Present Status of Slums: Primary Survey There are 182 slum settlements in Ludhiana (refer map 3 on page 33). As per Census 2011, the proportion of slums dwellers living in Ludhiana (22.5%) is much higher compared to the state average of 14%. Slums are mostly concentrated in the northeast and southeast of the city, along the Ludhiana-‐Rohan road and NH1. There are very few slums in the city centre and the nearest one is located at about 1.5 km from the heart of the city. Nearly three-‐fourths (70%) of the current slums in Ludhiana came up between 1981 -‐ 2000 (see table 2.1) due to the rise in economic growth in the city. These slums have come up in
27
small clusters (less than 500 households, (see Table 2.2)), and majority of these settlements constitute people from Bihar and Uttar Pradesh.
Table 2.2: Distribution of Slums by their Population Size
S.No. Population Size Slums Nos. %age
1 <500 32 15.84 2 501-‐1000 52 25.74 3 1001-‐2000 50 24.75 4 2001-‐3000 40 19.80 5 3001-‐5000 16 7.92 6 5001-‐10000 10 4.95 7 10000-‐15000 2 0.99 TOTAL 202 202 100 Source: MCL, Ludhiana
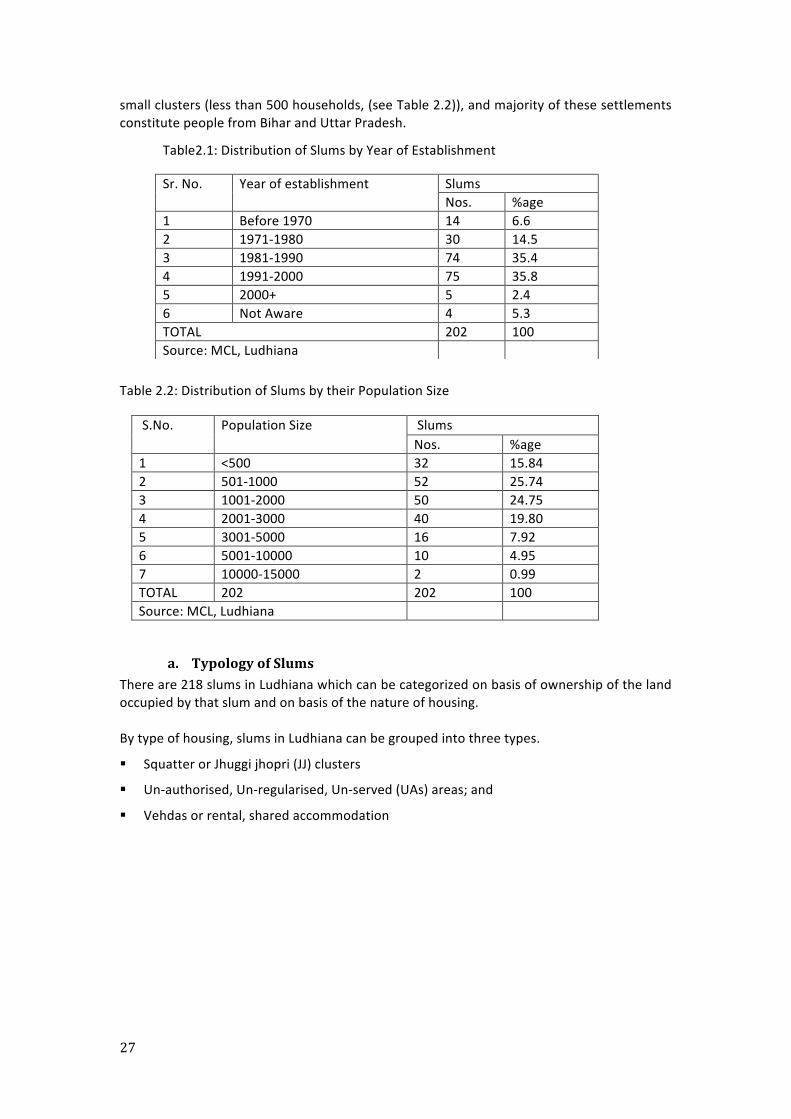
a. Typology of Slums There are 218 slums in Ludhiana which can be categorized on basis of ownership of the land occupied by that slum and on basis of the nature of housing. By type of housing, slums in Ludhiana can be grouped into three types.
§ Squatter or Jhuggi jhopri (JJ) clusters
§ Un-‐authorised, Un-‐regularised, Un-‐served (UAs) areas; and
§ Vehdas or rental, shared accommodation
Table2.1: Distribution of Slums by Year of Establishment
Sr. No. Year of establishment Slums Nos. %age
1 Before 1970 14 6.6 2 1971-‐1980 30 14.5 3 1981-‐1990 74 35.4 4 1991-‐2000 75 35.8 5 2000+ 5 2.4 6 Not Aware 4 5.3 TOTAL 202 100 Source: MCL, Ludhiana
28
Ø Squatter or Jhuggi jhopri (JJ) clusters
Ø Un-‐authorised, Un-‐regularised, Un-‐served (UAs) areas
Ø Vehdas or rental, shared accommodation.
By ownership of land occupied by these slums, they can be categorized into:
Ø Slums on state and city government land
Ø Slums on self owned land with clear titles
Ø Slums on lands with unclear land titles
Ø Vehdas on land owned by the Vehda owner
29
The matrix below combines the two aspects of housing quality and land ownership to re-‐categorize the slum settlements as five types:
§ Squatter settlements § Vehdas inside Settlements § Unrecognized colonies § Upgraded area outside MCL Limits § Vehdas
Squatter
settlements Settlements having Vehdas inside
Unrecognized colonies
Upgraded areas
Outside MCL Limits
Vehdas
Numbers 54 9 116 36 3 850 Land Status
Government and Self-‐Owned lands
Self-‐Owned lands
Self-‐ owned land and housing ownership
Self-‐owned land and housing ownership
Self-‐Owned lands
151 with land ownership-‐legal titles Housing Type
Kuccha (39%)
Semi pucca and pucca (43%)
Pucca (17.64%)
pucca
Service Levels
Shared, community
Networks largely available, connections missing
Shared, community
Shared provided
by landlord
Source: CURE, 2014
b. Slum: Demographic Profile There are almost 50,941 households in 182 slums of Ludhiana with a total population of 2,59,289. Apart from it there are almost 2,00,000 people living in sub-‐standard hostel accommodations i.e. Vehdas.
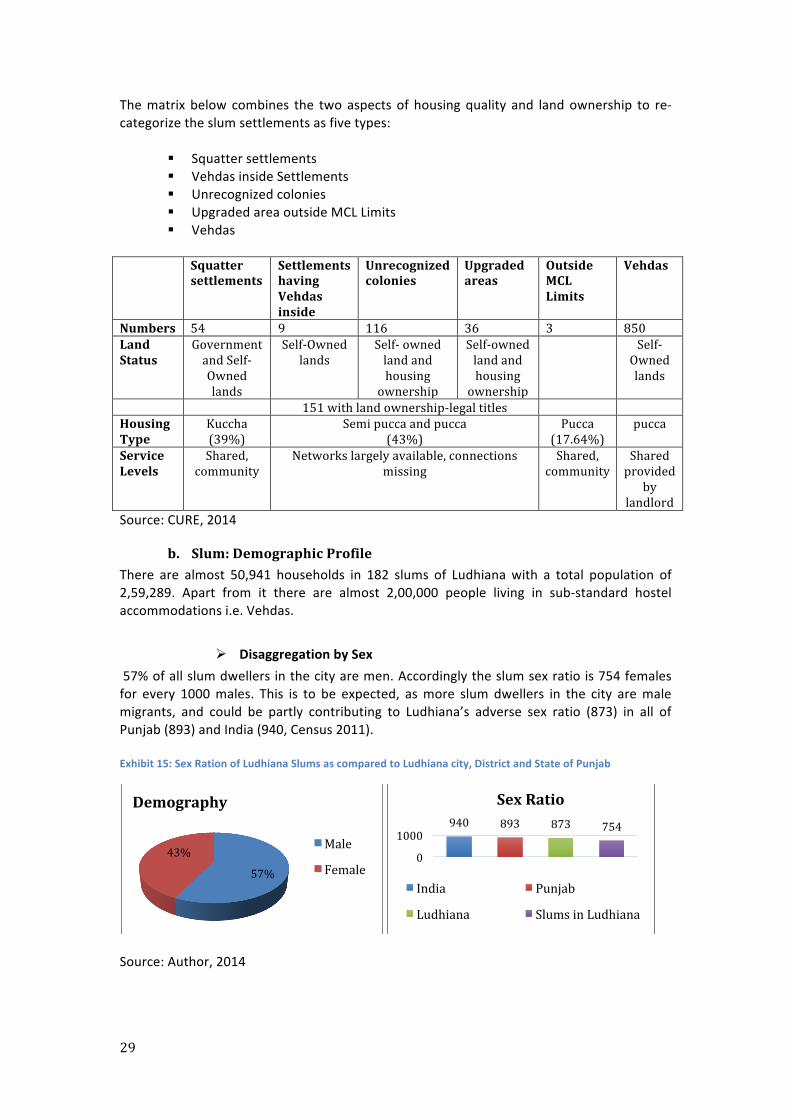
Ø Disaggregation by Sex 57% of all slum dwellers in the city are men. Accordingly the slum sex ratio is 754 females for every 1000 males. This is to be expected, as more slum dwellers in the city are male migrants, and could be partly contributing to Ludhiana’s adverse sex ratio (873) in all of Punjab (893) and India (940, Census 2011). Exhibit 15: Sex Ration of Ludhiana Slums as compared to Ludhiana city, District and State of Punjab
Source: Author, 2014
57%
43%
Demography
Male
Female
940 893 873 754
0
1000
Sex Ratio
India Punjab
Ludhiana Slums in Ludhiana
30
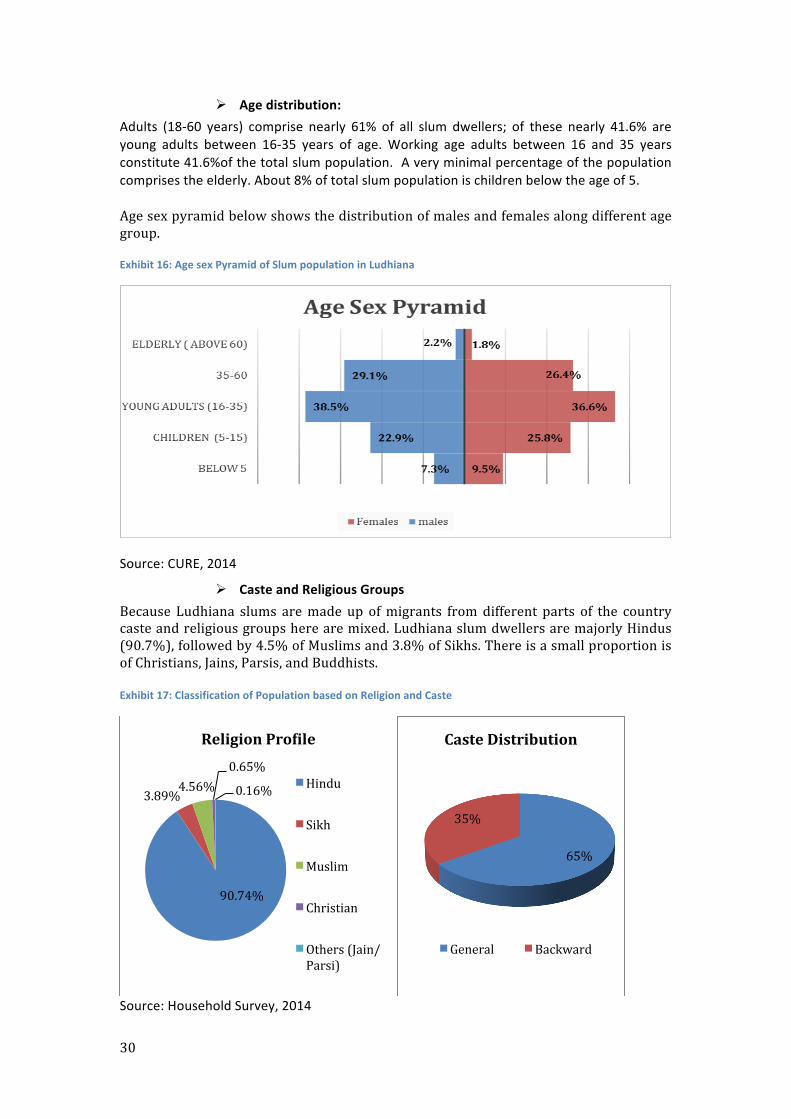
Ø Age distribution: Adults (18-‐60 years) comprise nearly 61% of all slum dwellers; of these nearly 41.6% are young adults between 16-‐35 years of age. Working age adults between 16 and 35 years constitute 41.6%of the total slum population. A very minimal percentage of the population comprises the elderly. About 8% of total slum population is children below the age of 5. Age sex pyramid below shows the distribution of males and females along different age group.
Exhibit 16: Age sex Pyramid of Slum population in Ludhiana
Source: CURE, 2014
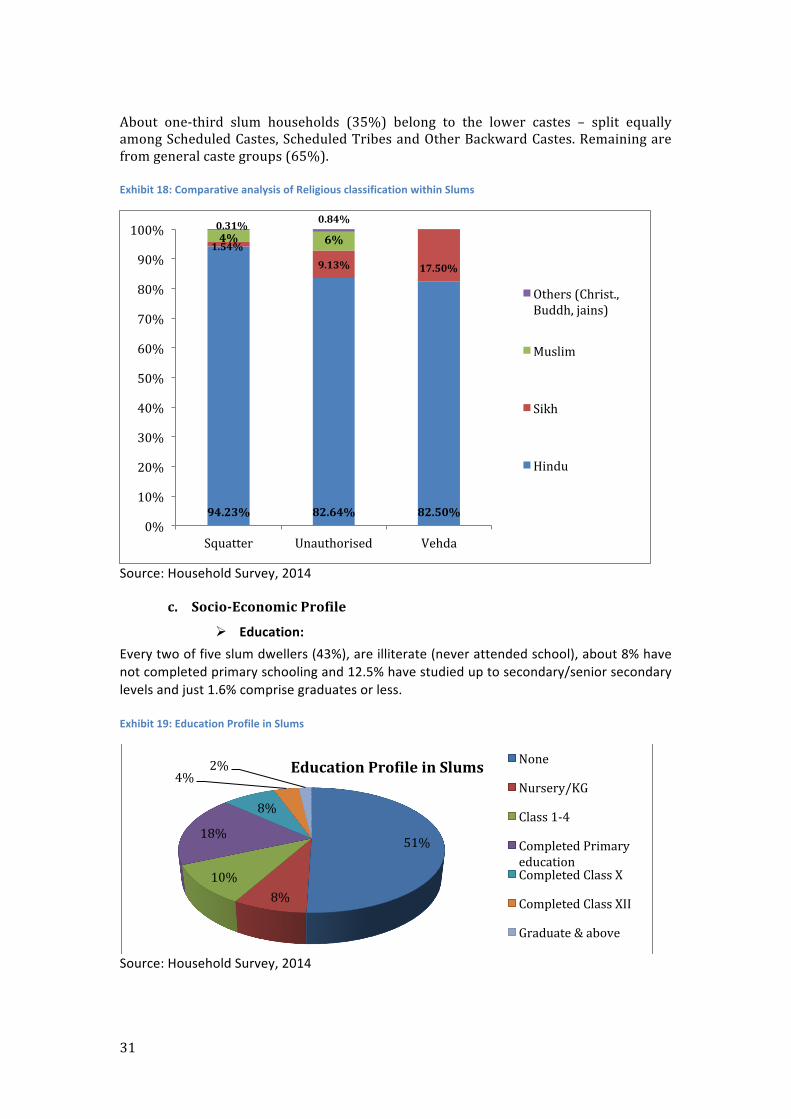
Ø Caste and Religious Groups Because Ludhiana slums are made up of migrants from different parts of the country caste and religious groups here are mixed. Ludhiana slum dwellers are majorly Hindus (90.7%), followed by 4.5% of Muslims and 3.8% of Sikhs. There is a small proportion is of Christians, Jains, Parsis, and Buddhists. Exhibit 17: Classification of Population based on Religion and Caste
Source: Household Survey, 2014
90.74%
3.89% 4.56%
0.65%
0.16%
Religion ProTile
Hindu
Sikh
Muslim
Christian
Others (Jain/Parsi)
65%
35%
Caste Distribution
General Backward
31
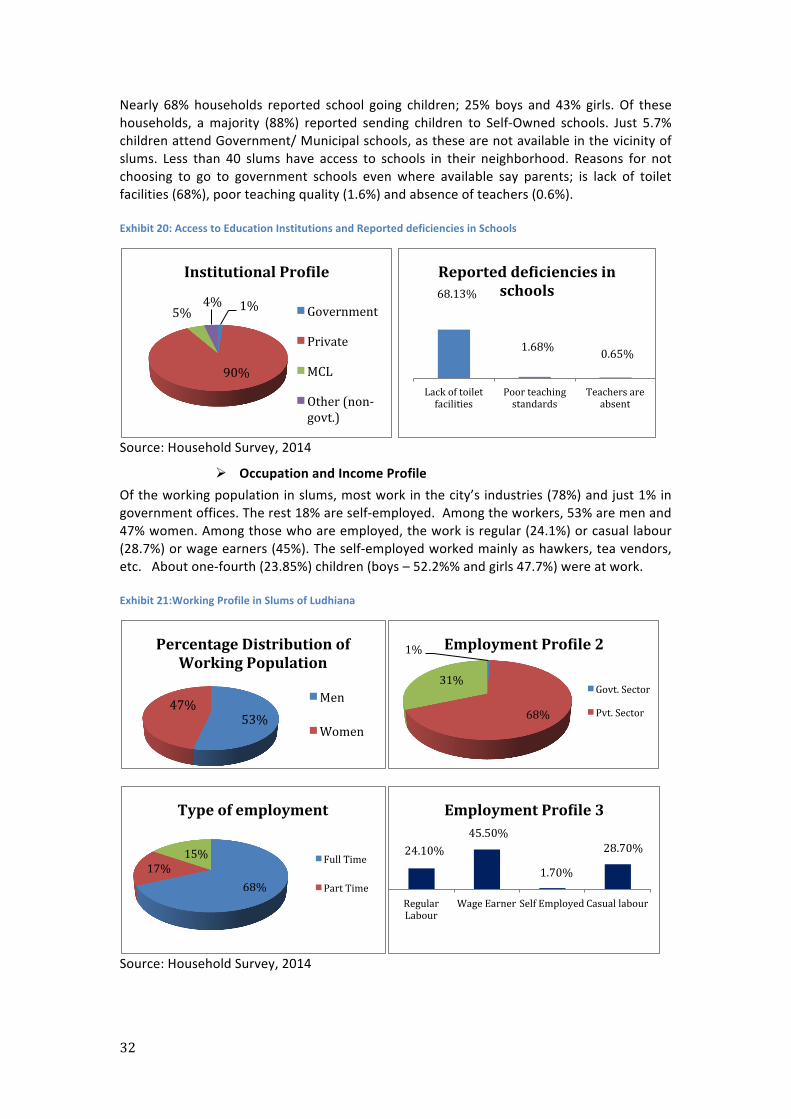
About one-‐third slum households (35%) belong to the lower castes – split equally among Scheduled Castes, Scheduled Tribes and Other Backward Castes. Remaining are from general caste groups (65%). Exhibit 18: Comparative analysis of Religious classification within Slums
Source: Household Survey, 2014
c. Socio-‐Economic Profile
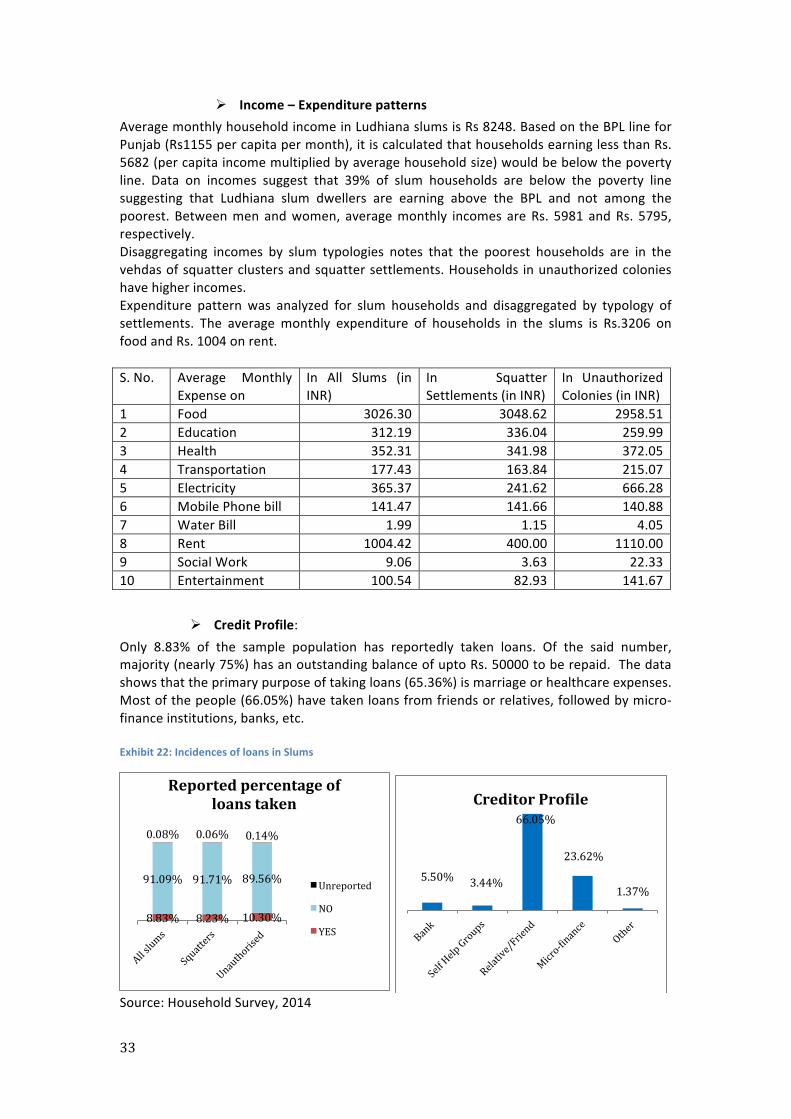
Ø Education: Every two of five slum dwellers (43%), are illiterate (never attended school), about 8% have not completed primary schooling and 12.5% have studied up to secondary/senior secondary levels and just 1.6% comprise graduates or less. Exhibit 19: Education Profile in Slums
Source: Household Survey, 2014
94.23% 82.64% 82.50%
1.54%
9.13% 17.50%
4% 6% 0.31% 0.84%
0%
10%
20%
30%
40%
50%
60%
70%
80%
90%
100%
Squatter Unauthorised Vehda
Others (Christ., Buddh, jains)
Muslim
Sikh
Hindu
51%
8% 10%
18%
8%
4% 2% Education ProTile in Slums None
Nursery/KG
Class 1-‐4
Completed Primary education Completed Class X
Completed Class XII
Graduate & above
32
Nearly 68% households reported school going children; 25% boys and 43% girls. Of these households, a majority (88%) reported sending children to Self-‐Owned schools. Just 5.7% children attend Government/ Municipal schools, as these are not available in the vicinity of slums. Less than 40 slums have access to schools in their neighborhood. Reasons for not choosing to go to government schools even where available say parents; is lack of toilet facilities (68%), poor teaching quality (1.6%) and absence of teachers (0.6%). Exhibit 20: Access to Education Institutions and Reported deficiencies in Schools
Source: Household Survey, 2014
Ø Occupation and Income Profile Of the working population in slums, most work in the city’s industries (78%) and just 1% in government offices. The rest 18% are self-‐employed. Among the workers, 53% are men and 47% women. Among those who are employed, the work is regular (24.1%) or casual labour (28.7%) or wage earners (45%). The self-‐employed worked mainly as hawkers, tea vendors, etc. About one-‐fourth (23.85%) children (boys – 52.2%% and girls 47.7%) were at work. Exhibit 21:Working Profile in Slums of Ludhiana
Source: Household Survey, 2014
1%
90%
5% 4%
Institutional ProTile
Government
Private
MCL
Other (non-‐govt.)
68.13%
1.68% 0.65%
Lack of toilet facilities
Poor teaching standards
Teachers are absent
Reported deTiciencies in schools
53% 47%
Percentage Distribution of Working Population
Men
Women
1%
68%
31%
Employment ProTile 2
Govt. Sector
Pvt. Sector
68% 17%
15%
Type of employment
Full Time
Part Time
24.10% 45.50%
1.70%
28.70%
Regular Labour
Wage Earner Self Employed Casual labour
Employment ProTile 3
33
Ø Income – Expenditure patterns Average monthly household income in Ludhiana slums is Rs 8248. Based on the BPL line for Punjab (Rs1155 per capita per month), it is calculated that households earning less than Rs. 5682 (per capita income multiplied by average household size) would be below the poverty line. Data on incomes suggest that 39% of slum households are below the poverty line suggesting that Ludhiana slum dwellers are earning above the BPL and not among the poorest. Between men and women, average monthly incomes are Rs. 5981 and Rs. 5795, respectively. Disaggregating incomes by slum typologies notes that the poorest households are in the vehdas of squatter clusters and squatter settlements. Households in unauthorized colonies have higher incomes. Expenditure pattern was analyzed for slum households and disaggregated by typology of settlements. The average monthly expenditure of households in the slums is Rs.3206 on food and Rs. 1004 on rent. S. No. Average Monthly
Expense on In All Slums (in INR)
In Squatter Settlements (in INR)
In Unauthorized Colonies (in INR)
1 Food 3026.30 3048.62 2958.51 2 Education 312.19 336.04 259.99 3 Health 352.31 341.98 372.05 4 Transportation 177.43 163.84 215.07 5 Electricity 365.37 241.62 666.28 6 Mobile Phone bill 141.47 141.66 140.88 7 Water Bill 1.99 1.15 4.05 8 Rent 1004.42 400.00 1110.00 9 Social Work 9.06 3.63 22.33 10 Entertainment 100.54 82.93 141.67
Ø Credit Profile: Only 8.83% of the sample population has reportedly taken loans. Of the said number, majority (nearly 75%) has an outstanding balance of upto Rs. 50000 to be repaid. The data shows that the primary purpose of taking loans (65.36%) is marriage or healthcare expenses. Most of the people (66.05%) have taken loans from friends or relatives, followed by micro-‐finance institutions, banks, etc. Exhibit 22: Incidences of loans in Slums
Source: Household Survey, 2014
8.83% 8.23% 10.30%
91.09% 91.71% 89.56%
0.08% 0.06% 0.14%
Reported percentage of loans taken
Unreported
NO
YES
5.50% 3.44%
66.05%
23.62%
1.37%
Creditor ProTile
34
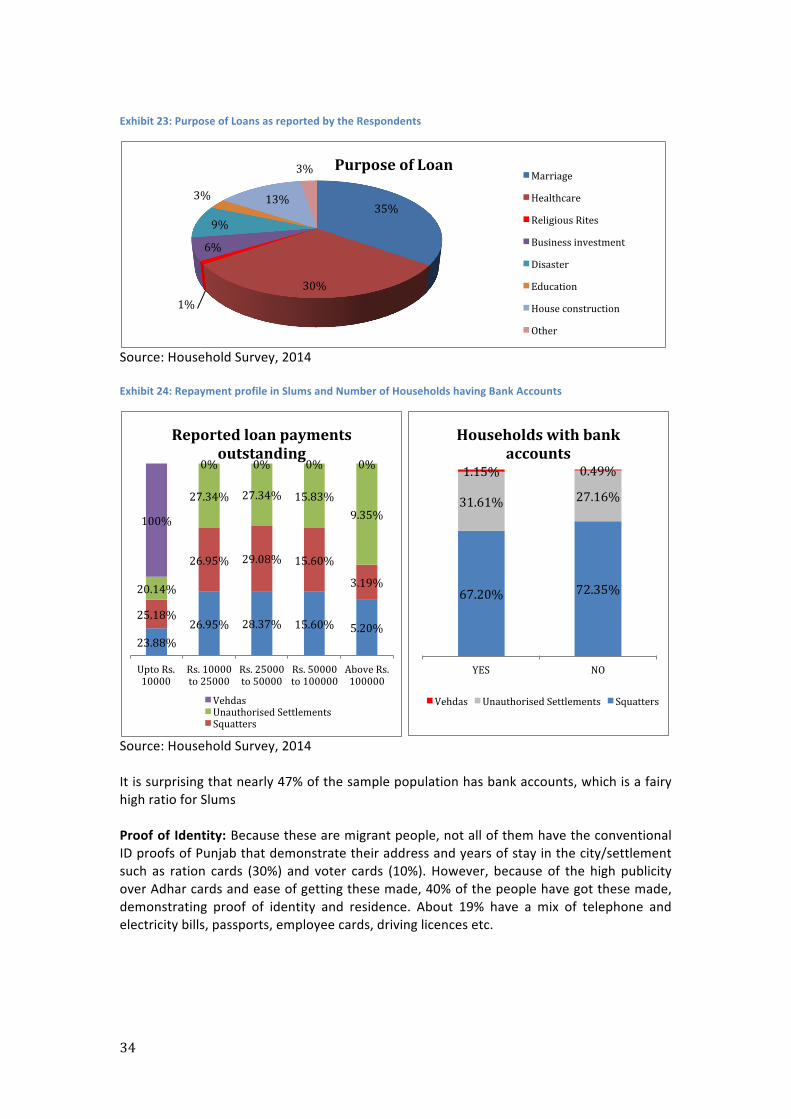
Exhibit 23: Purpose of Loans as reported by the Respondents
Source: Household Survey, 2014 Exhibit 24: Repayment profile in Slums and Number of Households having Bank Accounts
Source: Household Survey, 2014 It is surprising that nearly 47% of the sample population has bank accounts, which is a fairy high ratio for Slums Proof of Identity: Because these are migrant people, not all of them have the conventional ID proofs of Punjab that demonstrate their address and years of stay in the city/settlement such as ration cards (30%) and voter cards (10%). However, because of the high publicity over Adhar cards and ease of getting these made, 40% of the people have got these made, demonstrating proof of identity and residence. About 19% have a mix of telephone and electricity bills, passports, employee cards, driving licences etc.
35%
30% 1%
6%
9%
3% 13%
3% Purpose of Loan Marriage
Healthcare
Religious Rites
Business investment
Disaster
Education
House construction
Other
23.88% 26.95% 28.37% 15.60% 5.20%
25.18%
26.95% 29.08% 15.60%
3.19% 20.14%
27.34% 27.34% 15.83% 9.35% 100%
0% 0% 0% 0%
Upto Rs. 10000
Rs. 10000 to 25000
Rs. 25000 to 50000
Rs. 50000 to 100000
Above Rs. 100000
Reported loan payments outstanding
Vehdas Unauthorised Settlements Squatters
67.20% 72.35%
31.61% 27.16%
1.15% 0.49%
YES NO
Households with bank accounts
Vehdas Unauthorised Settlements Squatters
35
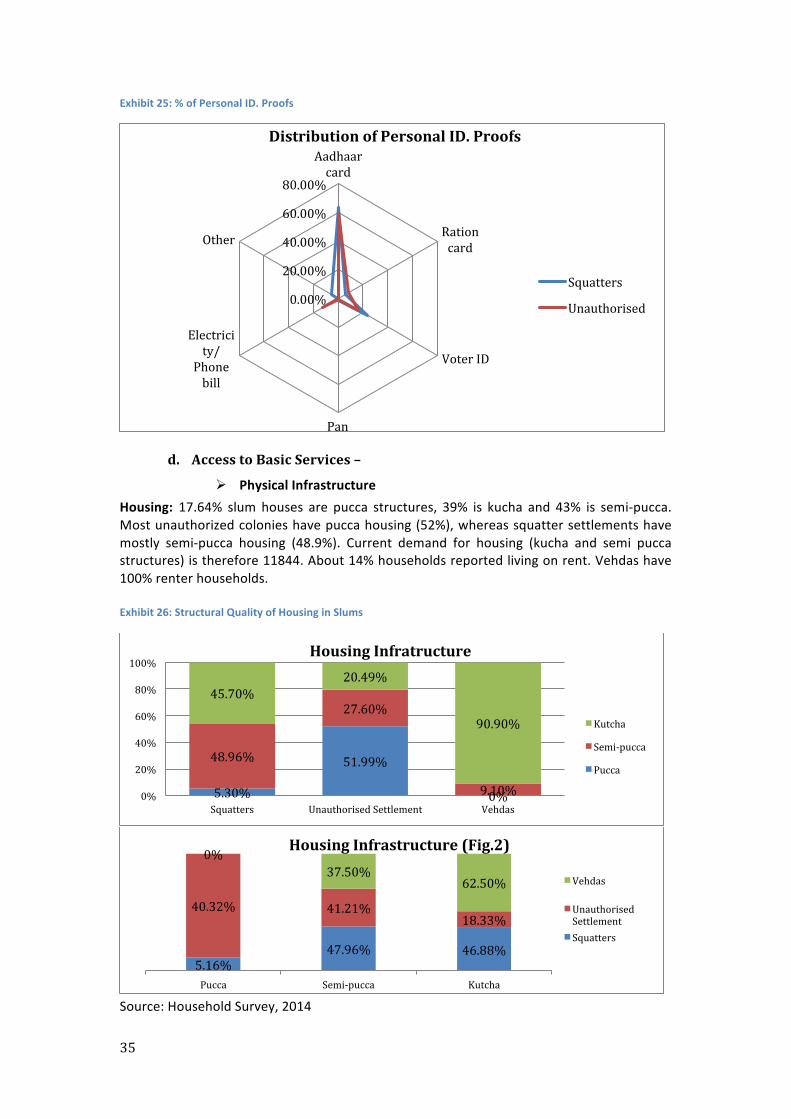
Exhibit 25: % of Personal ID. Proofs
d. Access to Basic Services –
Ø Physical Infrastructure Housing: 17.64% slum houses are pucca structures, 39% is kucha and 43% is semi-‐pucca. Most unauthorized colonies have pucca housing (52%), whereas squatter settlements have mostly semi-‐pucca housing (48.9%). Current demand for housing (kucha and semi pucca structures) is therefore 11844. About 14% households reported living on rent. Vehdas have 100% renter households. Exhibit 26: Structural Quality of Housing in Slums
Source: Household Survey, 2014
0.00%
20.00%
40.00%
60.00%
80.00%
Aadhaar card
Ration card
Voter ID
Pan Card
Electricity/
Phone bill
Other
Distribution of Personal ID. Proofs
Squatters
Unauthorised
5.30%
51.99%
0%
48.96%
27.60%
9.10%
45.70% 20.49%
90.90%
0%
20%
40%
60%
80%
100%
Squatters Unauthorised Settlement Vehdas
Housing Infratructure
Kutcha
Semi-‐pucca
Pucca
5.16% 47.96% 46.88%
40.32% 41.21% 18.33%
0% 37.50%
62.50%
Pucca Semi-‐pucca Kutcha
Housing Infrastructure (Fig.2)
Vehdas
Unauthorised Settlement Squatters
36
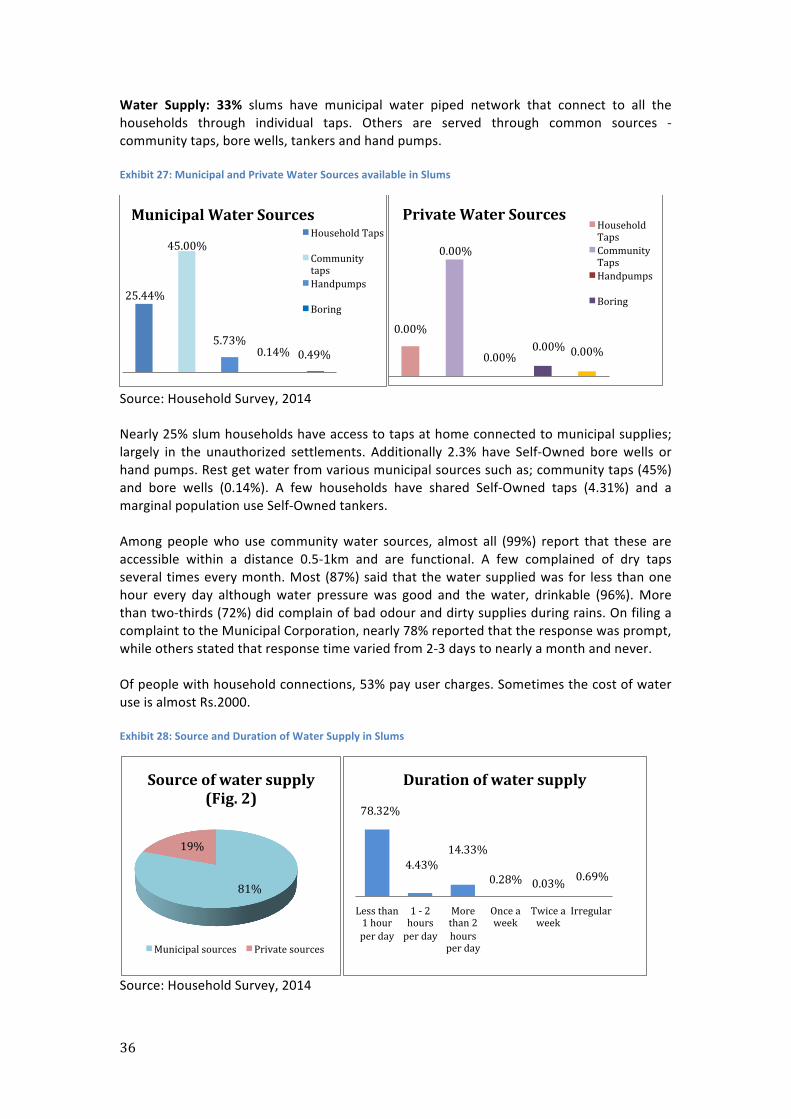
Water Supply: 33% slums have municipal water piped network that connect to all the households through individual taps. Others are served through common sources -‐ community taps, bore wells, tankers and hand pumps. Exhibit 27: Municipal and Private Water Sources available in Slums
Source: Household Survey, 2014 Nearly 25% slum households have access to taps at home connected to municipal supplies; largely in the unauthorized settlements. Additionally 2.3% have Self-‐Owned bore wells or hand pumps. Rest get water from various municipal sources such as; community taps (45%) and bore wells (0.14%). A few households have shared Self-‐Owned taps (4.31%) and a marginal population use Self-‐Owned tankers. Among people who use community water sources, almost all (99%) report that these are accessible within a distance 0.5-‐1km and are functional. A few complained of dry taps several times every month. Most (87%) said that the water supplied was for less than one hour every day although water pressure was good and the water, drinkable (96%). More than two-‐thirds (72%) did complain of bad odour and dirty supplies during rains. On filing a complaint to the Municipal Corporation, nearly 78% reported that the response was prompt, while others stated that response time varied from 2-‐3 days to nearly a month and never. Of people with household connections, 53% pay user charges. Sometimes the cost of water use is almost Rs.2000. Exhibit 28: Source and Duration of Water Supply in Slums
Source: Household Survey, 2014
25.44%
45.00%
5.73% 0.14% 0.49%
Municipal Water Sources Household Taps
Community taps Handpumps
Boring
0.00%
0.00%
0.00% 0.00% 0.00%
Private Water Sources Household Taps Community Taps Handpumps
Boring
81%
19%
Source of water supply (Fig. 2)
Municipal sources Private sources
78.32%
4.43% 14.33%
0.28% 0.03% 0.69%
Less than 1 hour per day
1 -‐ 2 hours per day
More than 2 hours per day
Once a week
Twice a week
Irregular
Duration of water supply
37
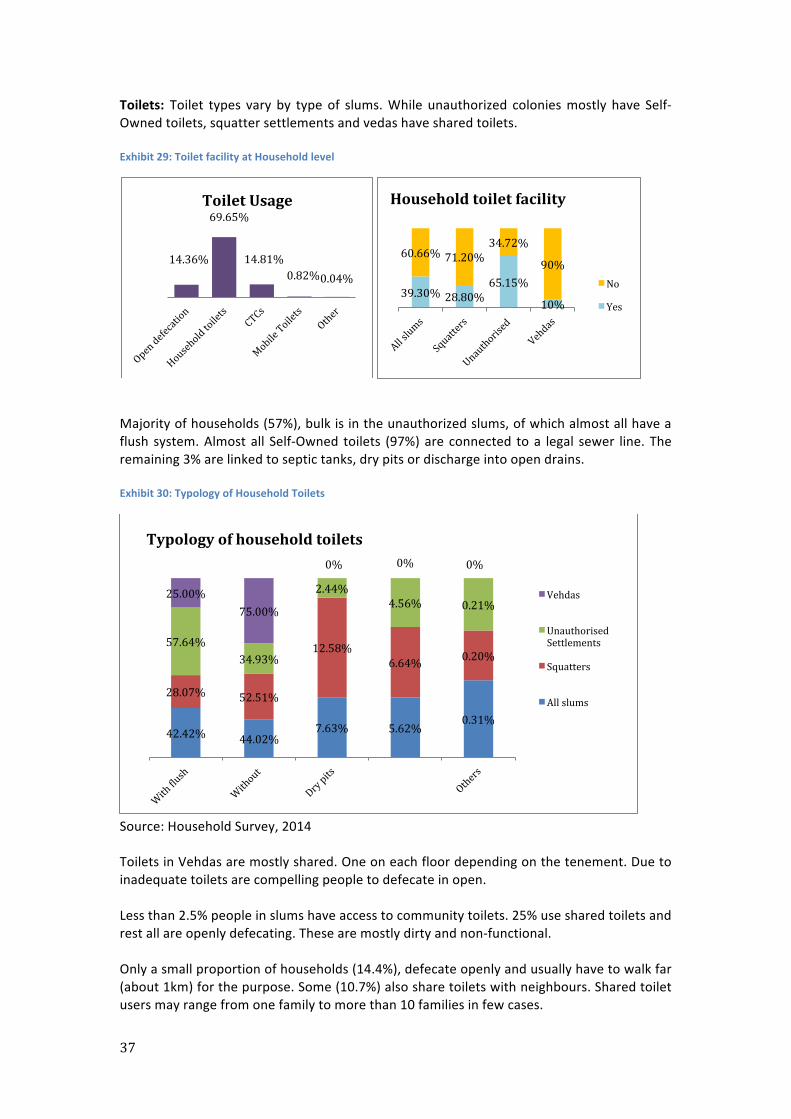
Toilets: Toilet types vary by type of slums. While unauthorized colonies mostly have Self-‐Owned toilets, squatter settlements and vedas have shared toilets. Exhibit 29: Toilet facility at Household level
Majority of households (57%), bulk is in the unauthorized slums, of which almost all have a flush system. Almost all Self-‐Owned toilets (97%) are connected to a legal sewer line. The remaining 3% are linked to septic tanks, dry pits or discharge into open drains. Exhibit 30: Typology of Household Toilets
Source: Household Survey, 2014 Toilets in Vehdas are mostly shared. One on each floor depending on the tenement. Due to inadequate toilets are compelling people to defecate in open. Less than 2.5% people in slums have access to community toilets. 25% use shared toilets and rest all are openly defecating. These are mostly dirty and non-‐functional. Only a small proportion of households (14.4%), defecate openly and usually have to walk far (about 1km) for the purpose. Some (10.7%) also share toilets with neighbours. Shared toilet users may range from one family to more than 10 families in few cases.
14.36%
69.65%
14.81% 0.82% 0.04%
Toilet Usage
39.30% 28.80% 65.15%
10%
60.66% 71.20% 34.72%
90%
Household toilet facility
No
Yes
42.42% 44.02% 7.63% 5.62%
0.31%
28.07% 52.51%
12.58% 6.64% 0.20%
57.64% 34.93%
2.44% 4.56% 0.21%
25.00% 75.00%
0% 0% 0%
Typology of household toilets
Vehdas
Unauthorised Settlements
Squatters
All slums
38
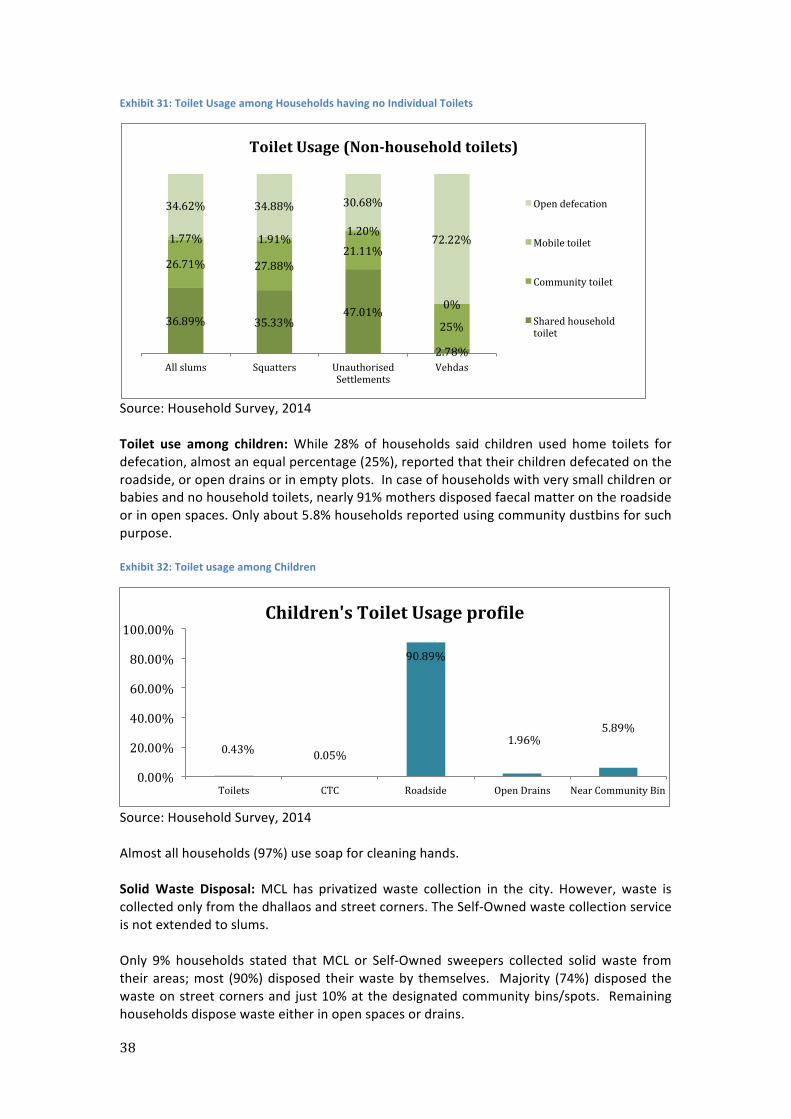
Exhibit 31: Toilet Usage among Households having no Individual Toilets
Source: Household Survey, 2014 Toilet use among children: While 28% of households said children used home toilets for defecation, almost an equal percentage (25%), reported that their children defecated on the roadside, or open drains or in empty plots. In case of households with very small children or babies and no household toilets, nearly 91% mothers disposed faecal matter on the roadside or in open spaces. Only about 5.8% households reported using community dustbins for such purpose. Exhibit 32: Toilet usage among Children
Source: Household Survey, 2014 Almost all households (97%) use soap for cleaning hands. Solid Waste Disposal: MCL has privatized waste collection in the city. However, waste is collected only from the dhallaos and street corners. The Self-‐Owned waste collection service is not extended to slums. Only 9% households stated that MCL or Self-‐Owned sweepers collected solid waste from their areas; most (90%) disposed their waste by themselves. Majority (74%) disposed the waste on street corners and just 10% at the designated community bins/spots. Remaining households dispose waste either in open spaces or drains.
36.89% 35.33% 47.01%
2.78%
26.71% 27.88% 21.11%
25%
1.77% 1.91% 1.20%
0%
34.62% 34.88% 30.68%
72.22%
All slums Squatters Unauthorised Settlements
Vehdas
Toilet Usage (Non-‐household toilets)
Open defecation
Mobile toilet
Community toilet
Shared household toilet
0.43% 0.05%
90.89%
1.96% 5.89%
0.00%
20.00%
40.00%
60.00%
80.00%
100.00%
Toilets CTC Roadside Open Drains Near Community Bin
Children's Toilet Usage proTile
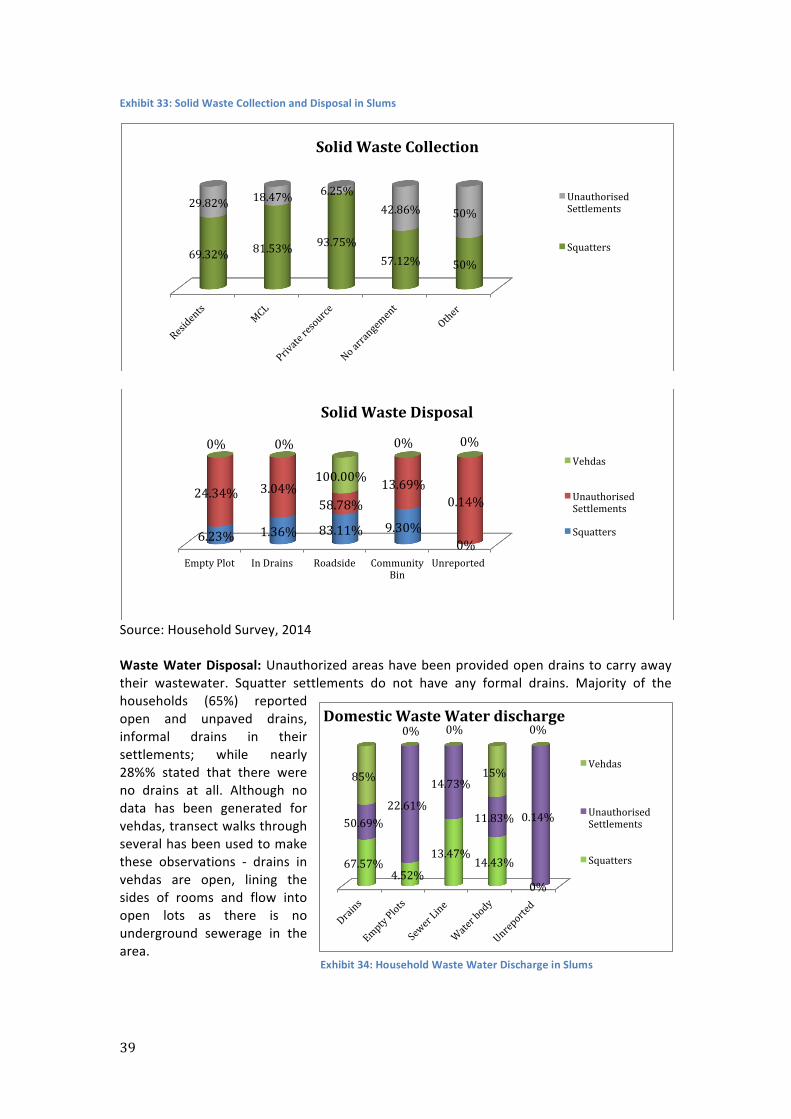
39
Exhibit 33: Solid Waste Collection and Disposal in Slums
Source: Household Survey, 2014 Waste Water Disposal: Unauthorized areas have been provided open drains to carry away their wastewater. Squatter settlements do not have any formal drains. Majority of the households (65%) reported open and unpaved drains, informal drains in their settlements; while nearly 28%% stated that there were no drains at all. Although no data has been generated for vehdas, transect walks through several has been used to make these observations -‐ drains in vehdas are open, lining the sides of rooms and flow into open lots as there is no underground sewerage in the area.
69.32% 81.53% 93.75% 57.12% 50%
29.82% 18.47% 6.25% 42.86% 50%
Solid Waste Collection
Unauthorised Settlements
Squatters
Empty Plot In Drains Roadside Community Bin
Unreported
6.23% 1.36% 83.11% 9.30% 0%
24.34% 3.04% 58.78%
13.69% 0.14%
0% 0%
100.00%
0% 0%
Solid Waste Disposal
Vehdas
Unauthorised Settlements
Squatters
67.57% 4.52%
13.47% 14.43%
0%
50.69% 22.61%
14.73%
11.83% 0.14%
85%
0% 0%
15%
0% Domestic Waste Water discharge
Vehdas
Unauthorised Settlements
Squatters
Exhibit 34: Household Waste Water Discharge in Slums
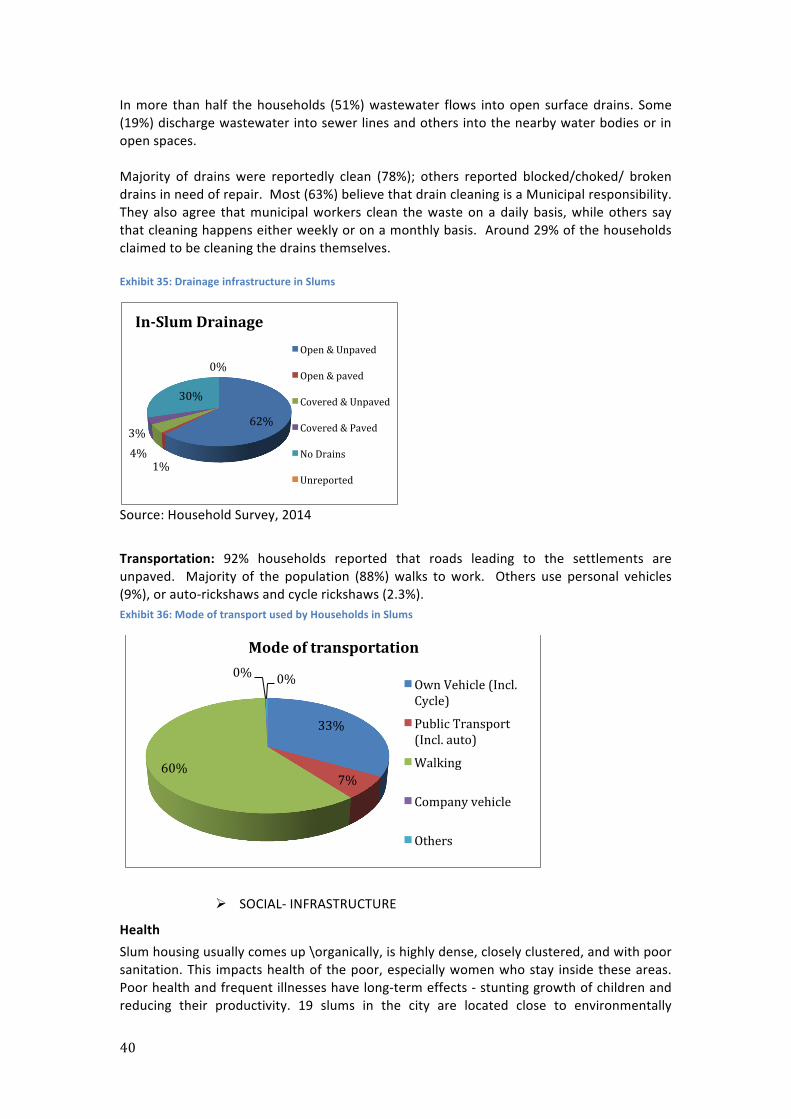
40
In more than half the households (51%) wastewater flows into open surface drains. Some (19%) discharge wastewater into sewer lines and others into the nearby water bodies or in open spaces. Majority of drains were reportedly clean (78%); others reported blocked/choked/ broken drains in need of repair. Most (63%) believe that drain cleaning is a Municipal responsibility. They also agree that municipal workers clean the waste on a daily basis, while others say that cleaning happens either weekly or on a monthly basis. Around 29% of the households claimed to be cleaning the drains themselves. Exhibit 35: Drainage infrastructure in Slums
Source: Household Survey, 2014
Transportation: 92% households reported that roads leading to the settlements are unpaved. Majority of the population (88%) walks to work. Others use personal vehicles (9%), or auto-‐rickshaws and cycle rickshaws (2.3%). Exhibit 36: Mode of transport used by Households in Slums
Ø SOCIAL-‐ INFRASTRUCTURE
Health Slum housing usually comes up \organically, is highly dense, closely clustered, and with poor sanitation. This impacts health of the poor, especially women who stay inside these areas. Poor health and frequent illnesses have long-‐term effects -‐ stunting growth of children and reducing their productivity. 19 slums in the city are located close to environmentally
62%
1% 4% 3%
30%
0%
In-‐Slum Drainage Open & Unpaved
Open & paved
Covered & Unpaved
Covered & Paved
No Drains
Unreported
33%
7% 60%
0% 0%
Mode of transportation
Own Vehicle (Incl. Cycle)
Public Transport (Incl. auto)
Walking
Company vehicle
Others
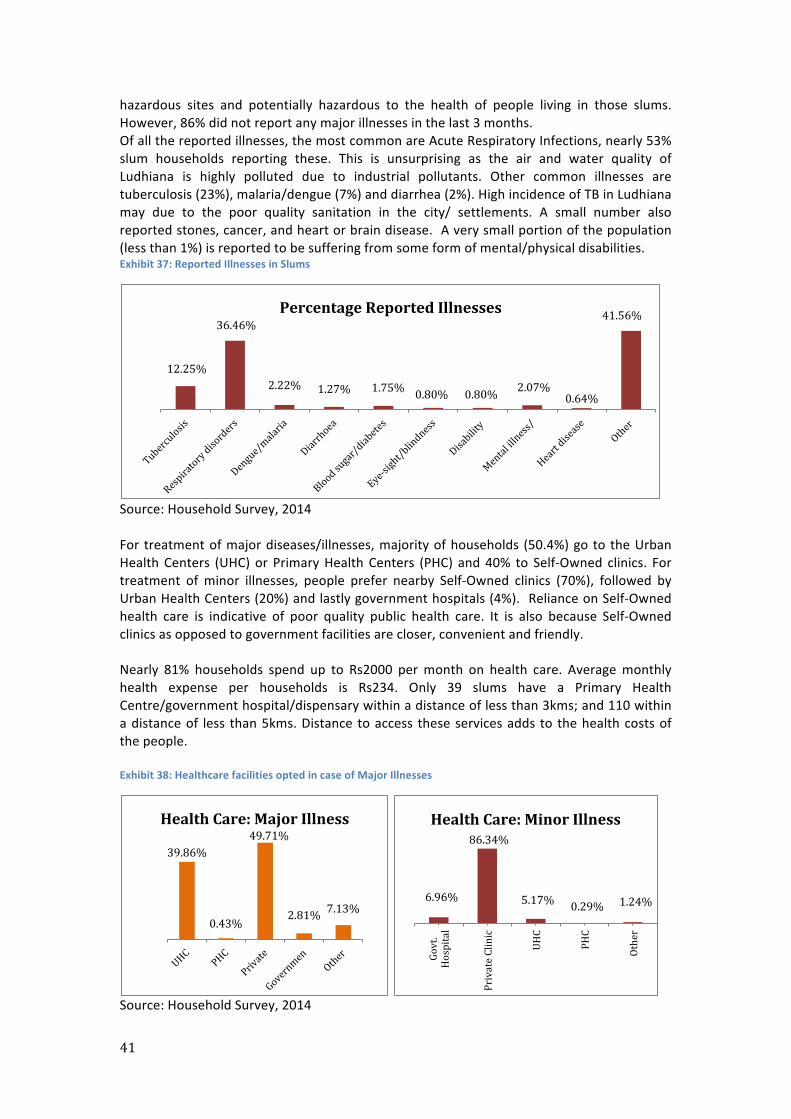
41
hazardous sites and potentially hazardous to the health of people living in those slums. However, 86% did not report any major illnesses in the last 3 months. Of all the reported illnesses, the most common are Acute Respiratory Infections, nearly 53% slum households reporting these. This is unsurprising as the air and water quality of Ludhiana is highly polluted due to industrial pollutants. Other common illnesses are tuberculosis (23%), malaria/dengue (7%) and diarrhea (2%). High incidence of TB in Ludhiana may due to the poor quality sanitation in the city/ settlements. A small number also reported stones, cancer, and heart or brain disease. A very small portion of the population (less than 1%) is reported to be suffering from some form of mental/physical disabilities. Exhibit 37: Reported Illnesses in Slums
Source: Household Survey, 2014 For treatment of major diseases/illnesses, majority of households (50.4%) go to the Urban Health Centers (UHC) or Primary Health Centers (PHC) and 40% to Self-‐Owned clinics. For treatment of minor illnesses, people prefer nearby Self-‐Owned clinics (70%), followed by Urban Health Centers (20%) and lastly government hospitals (4%). Reliance on Self-‐Owned health care is indicative of poor quality public health care. It is also because Self-‐Owned clinics as opposed to government facilities are closer, convenient and friendly. Nearly 81% households spend up to Rs2000 per month on health care. Average monthly health expense per households is Rs234. Only 39 slums have a Primary Health Centre/government hospital/dispensary within a distance of less than 3kms; and 110 within a distance of less than 5kms. Distance to access these services adds to the health costs of the people. Exhibit 38: Healthcare facilities opted in case of Major Illnesses
Source: Household Survey, 2014
12.25%
36.46%
2.22% 1.27% 1.75% 0.80% 0.80% 2.07% 0.64%
41.56% Percentage Reported Illnesses
39.86%
0.43%
49.71%
2.81% 7.13%
Health Care: Major Illness
6.96%
86.34%
5.17% 0.29% 1.24%
Govt.
Hospital
Private Clinic
UHC
PHC
Other
Health Care: Minor Illness
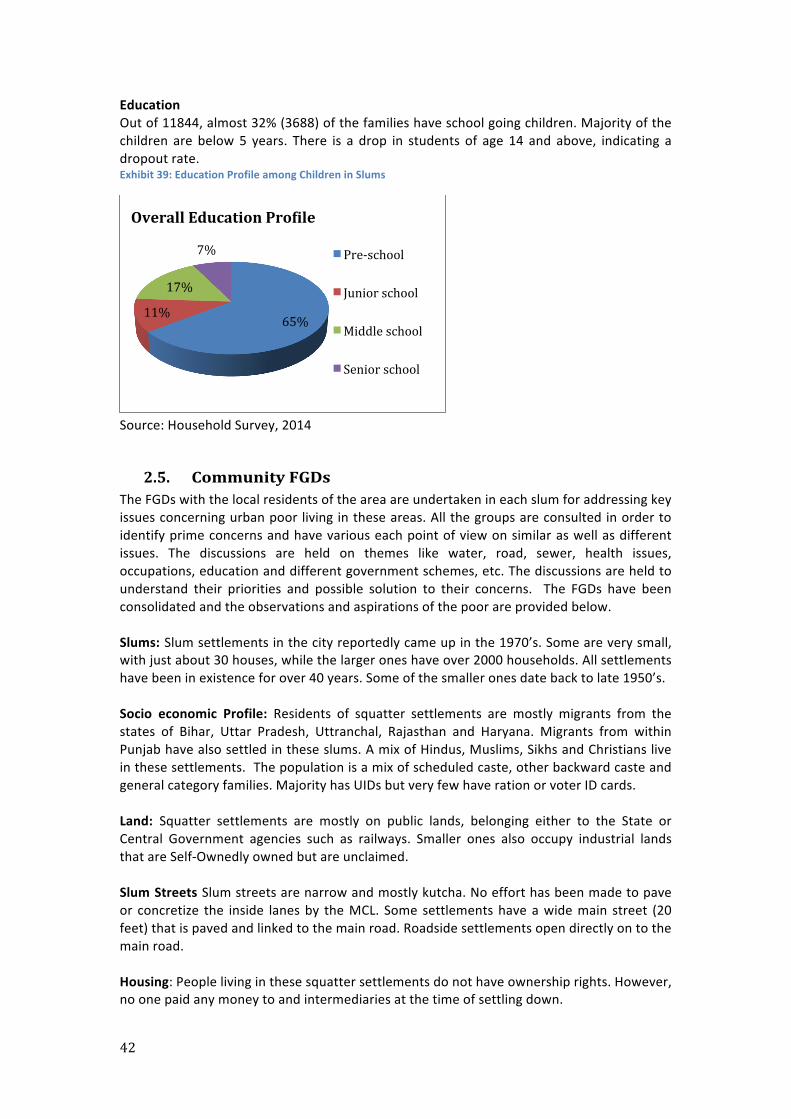
42
Education Out of 11844, almost 32% (3688) of the families have school going children. Majority of the children are below 5 years. There is a drop in students of age 14 and above, indicating a dropout rate. Exhibit 39: Education Profile among Children in Slums
Source: Household Survey, 2014
2.5. Community FGDs The FGDs with the local residents of the area are undertaken in each slum for addressing key issues concerning urban poor living in these areas. All the groups are consulted in order to identify prime concerns and have various each point of view on similar as well as different issues. The discussions are held on themes like water, road, sewer, health issues, occupations, education and different government schemes, etc. The discussions are held to understand their priorities and possible solution to their concerns. The FGDs have been consolidated and the observations and aspirations of the poor are provided below. Slums: Slum settlements in the city reportedly came up in the 1970’s. Some are very small, with just about 30 houses, while the larger ones have over 2000 households. All settlements have been in existence for over 40 years. Some of the smaller ones date back to late 1950’s. Socio economic Profile: Residents of squatter settlements are mostly migrants from the states of Bihar, Uttar Pradesh, Uttranchal, Rajasthan and Haryana. Migrants from within Punjab have also settled in these slums. A mix of Hindus, Muslims, Sikhs and Christians live in these settlements. The population is a mix of scheduled caste, other backward caste and general category families. Majority has UIDs but very few have ration or voter ID cards. Land: Squatter settlements are mostly on public lands, belonging either to the State or Central Government agencies such as railways. Smaller ones also occupy industrial lands that are Self-‐Ownedly owned but are unclaimed. Slum Streets Slum streets are narrow and mostly kutcha. No effort has been made to pave or concretize the inside lanes by the MCL. Some settlements have a wide main street (20 feet) that is paved and linked to the main road. Roadside settlements open directly on to the main road. Housing: People living in these squatter settlements do not have ownership rights. However, no one paid any money to and intermediaries at the time of settling down.
65% 11%
17%
7%
Overall Education ProTile
Pre-‐school
Junior school
Middle school
Senior school
43
Water: Water in the settlement is supplied from municipal bore wells outside slum settlements connected to pipes that stretch inside. Most households use community water stand posts provided by MCL in the settlement however only 70% of these taps are functional. Other households have water supply at home, having illegally extended pipelines from the municipal supply to their homes by paying a connection cost (to intermediaries) for plumbing. Where people have invested in galli extensions, they also protect the pipes to ensure these do not get damaged. Water is supplied for two hours each, thrice a day – morning, afternoon and evening. Despite this, the quantity of water in some settlements, particularly the large ones is insufficient with frequent fights over water sharing. Low water pressure (takes 10 minutes for one bucket to fill up) and power outages are responsible for inadequate or no water supply to these settlements. Residents face the problem of poor water pressure especially in the summer months. Since connections are illegally drawn, households do not pay water charges nor does the Corporation bill them for the same. A few older settlements pay Rs100 per month as fixed charges for water use to the MCL. Toilets: Many houses have individual toilets which are connected to the city’s trunk sewers. In some cases where the settlements are along the drains, they directly discharge sewage into these. Households do not pay any sanitation charge for using the sewers and the MCL is responsible for the regular maintenance of the sewers. There are hardly any Community Toilet Complexes and those that are present and non-‐functional. Due to this, some people have made pits while others continue to defecate in open spaces. Drains: The majority of settlements do not have surface drains. However most settlements are connected to a sewer line and people have set up Self-‐Owned connections of their toilets to the sewer line. The cost for maintaining these connections is between Rs.500 to Rs.2000. Some settlements do not have any sewer line and community members have built small pits to collect their waste. Household wastewater is directly discharged into the trunk sewers. Only 2 to 3 areas have paid maintenance system for sewer related problems. Solid Waste: The majority of households dump their waste in open spaces and on the road nearby. There is no provision of a government karamchari to collect the waste from households or any designated collection site/dhallao. In some areas a collector hired by the MCL picks up the waste and charges around Rs.30/-‐ but he is not regular. A small percentage of people have hired a Self-‐Owned collector to carry out a door-‐to-‐door waste collection system. There is no provision of Community Toilet Complexes and so all menstrual waste is also thrown in the open. Power Supply: Nearly 90% of the households have Self-‐Owned metered power supply. There are some residents who do not have any electricity and buy power from their neighbours. These households were refused connections by the electricity department. The residents with power supply complain of having to pay high electricity bills. There are no connections to a meter from the electricity department. In many settlements there are no streetlights or poles and in those that have streetlights they are non-‐functional. There are many electric wires in dangerous conditions and a constant fear of fire. The streets remain dark and are dangerous in the night – molestation, thefts etc. are common. There is one settlement that uses diyas to light up their homes.
44
Livelihoods: The main source of livelihood for residents is split between working in Self-‐Owned factories and being engaged in Self-‐Owned jobs. Around 30% of women are employed either as factory workers or domestic help. A small percentage of the population is self employed and while some work as sanitary workers with the Corporation others are street vendors. Transport: A very small percentage of people own personal vehicles; majority use public transport or travel by rickshaws, tempos or three wheelers. Health Services: Common illnesses in the slums are coughs and colds, fevers, diarrhoea, jaundice, typhoid, dengue, tuberculosis etc. In a few settlements, 1 or 2 deaths per year due to Dengue and Jaundice have been recorded. There are no government health centres or dispensaries in the settlements and those that are present are situated at least 5-‐7 km away at a fair distance. In cases where people do travel to the government hospitals, they use their personal vehicles or go by rickshaws, tempos or public transport. For minor problems people prefer fee-‐paying neighbourhood Self-‐Owned clinics or nursing homes. These are expensive and the poorest cannot afford to get treated here and so delay seeking treatment till desperate. Travel to and from the hospital is also expensive and hence avoided. However, people still mostly visit Self-‐Owned doctors and clinics and hardly ever go to government hospitals. They complain that the staff at the government hospitals is not attentive and very rude. In some slums health workers make visits to administer polio and other vaccinations but in most slums the residents take their children either to the dispensary or a Self-‐Owned hospital for vaccines. However, mostly immunization services are not available in or near the settlements. These are accessed through Self-‐Owned health care on personal initiative and by paying a fee. Education: There are no government schools in the slum settlement itself. In most settlements half the population of children go to Self-‐Owned schools while those that cannot afford Self-‐Owned schools attend the government schools. In some settlements the children do not have any access to education as the Self-‐Owned schools are too expensive and the government schools are situated too far away. In this case children are often engaged in collecting waste and rag picking. People would like to have government education facilities near their settlements so that their children can attend school. There is also no anganwadi near the settlement. Access to Welfare Scheme: Residents are unaware of welfare schemes and while they have various forms of Identification cards they feel these are of no use. 80% of residents have Aadhar cards and Voter Cards. About 60% residents have Ration Cards and a very low percentage has BPL cards. Officials, say people are reluctant to share information about beneficiary schemes.
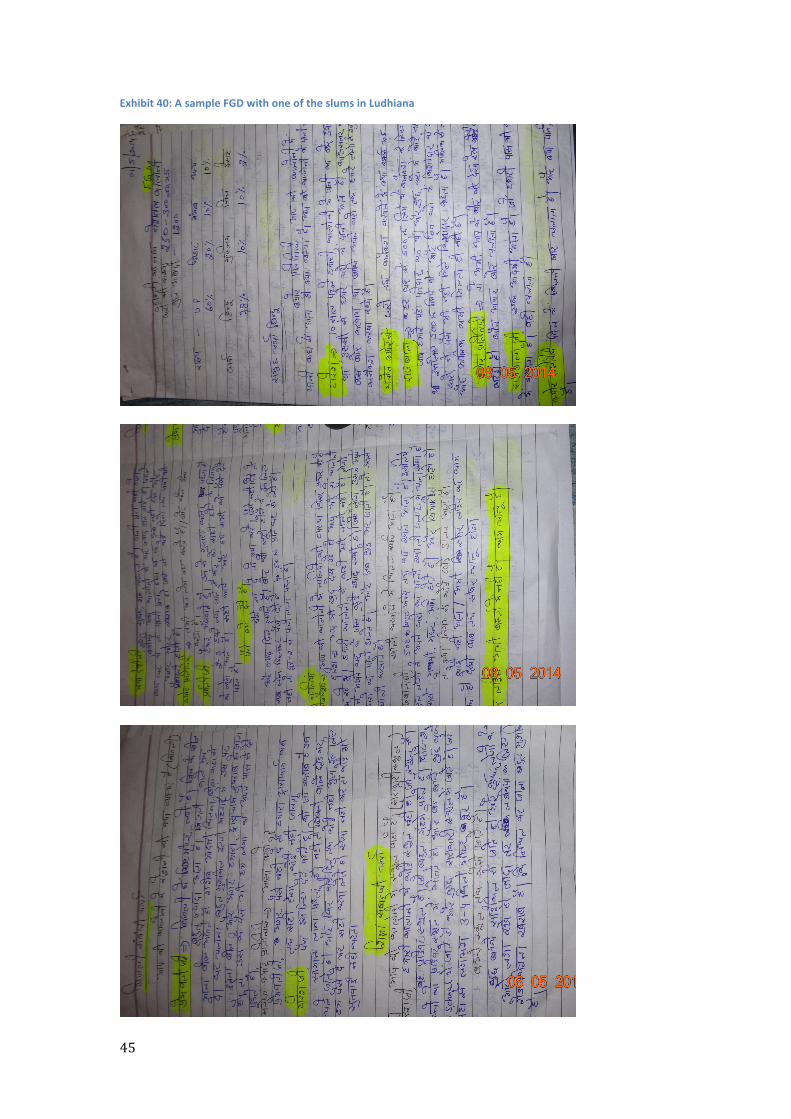
45
Exhibit 40: A sample FGD with one of the slums in Ludhiana
46
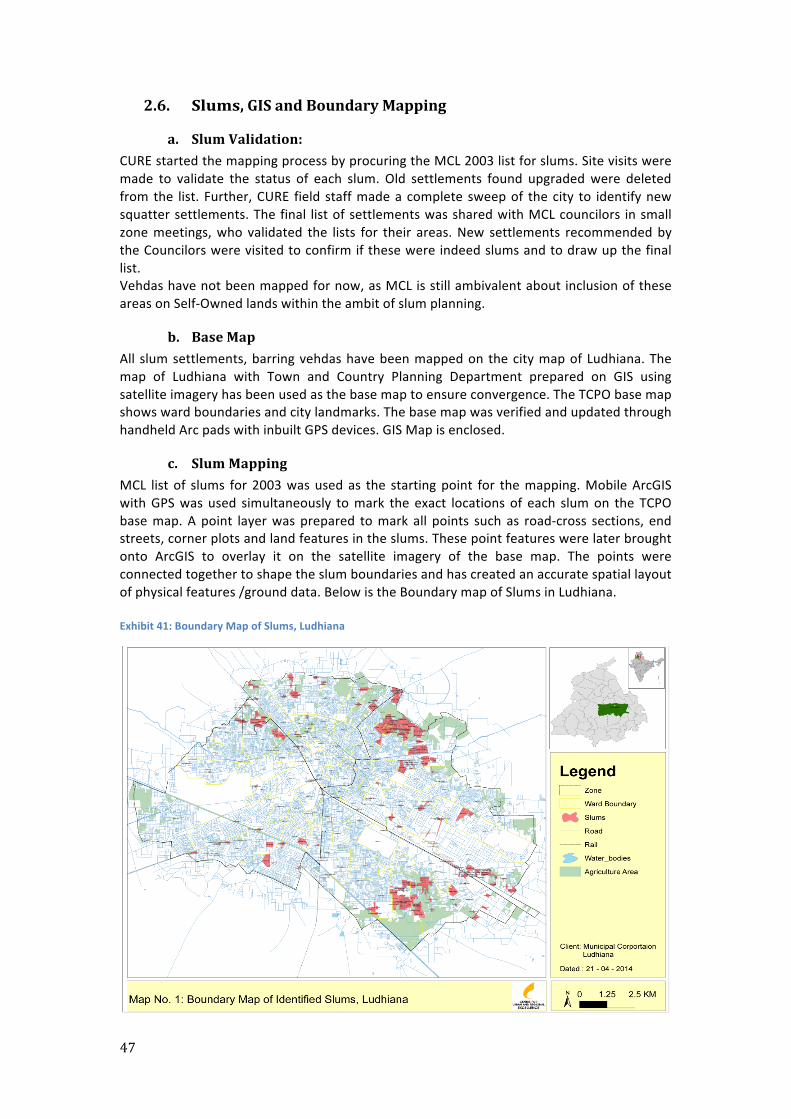
47
2.6. Slums, GIS and Boundary Mapping
a. Slum Validation: CURE started the mapping process by procuring the MCL 2003 list for slums. Site visits were made to validate the status of each slum. Old settlements found upgraded were deleted from the list. Further, CURE field staff made a complete sweep of the city to identify new squatter settlements. The final list of settlements was shared with MCL councilors in small zone meetings, who validated the lists for their areas. New settlements recommended by the Councilors were visited to confirm if these were indeed slums and to draw up the final list. Vehdas have not been mapped for now, as MCL is still ambivalent about inclusion of these areas on Self-‐Owned lands within the ambit of slum planning.
b. Base Map All slum settlements, barring vehdas have been mapped on the city map of Ludhiana. The map of Ludhiana with Town and Country Planning Department prepared on GIS using satellite imagery has been used as the base map to ensure convergence. The TCPO base map shows ward boundaries and city landmarks. The base map was verified and updated through handheld Arc pads with inbuilt GPS devices. GIS Map is enclosed.
c. Slum Mapping MCL list of slums for 2003 was used as the starting point for the mapping. Mobile ArcGIS with GPS was used simultaneously to mark the exact locations of each slum on the TCPO base map. A point layer was prepared to mark all points such as road-‐cross sections, end streets, corner plots and land features in the slums. These point features were later brought onto ArcGIS to overlay it on the satellite imagery of the base map. The points were connected together to shape the slum boundaries and has created an accurate spatial layout of physical features /ground data. Below is the Boundary map of Slums in Ludhiana. Exhibit 41: Boundary Map of Slums, Ludhiana
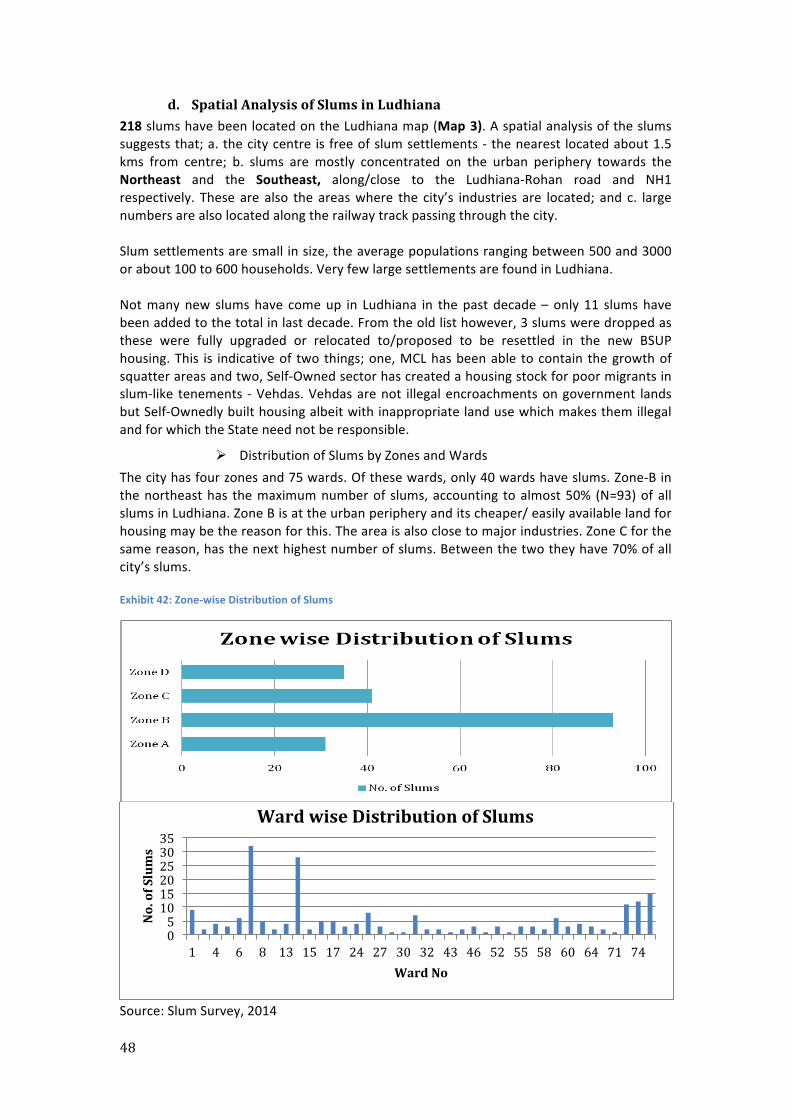
48
d. Spatial Analysis of Slums in Ludhiana 218 slums have been located on the Ludhiana map (Map 3). A spatial analysis of the slums suggests that; a. the city centre is free of slum settlements -‐ the nearest located about 1.5 kms from centre; b. slums are mostly concentrated on the urban periphery towards the Northeast and the Southeast, along/close to the Ludhiana-‐Rohan road and NH1 respectively. These are also the areas where the city’s industries are located; and c. large numbers are also located along the railway track passing through the city. Slum settlements are small in size, the average populations ranging between 500 and 3000 or about 100 to 600 households. Very few large settlements are found in Ludhiana. Not many new slums have come up in Ludhiana in the past decade – only 11 slums have been added to the total in last decade. From the old list however, 3 slums were dropped as these were fully upgraded or relocated to/proposed to be resettled in the new BSUP housing. This is indicative of two things; one, MCL has been able to contain the growth of squatter areas and two, Self-‐Owned sector has created a housing stock for poor migrants in slum-‐like tenements -‐ Vehdas. Vehdas are not illegal encroachments on government lands but Self-‐Ownedly built housing albeit with inappropriate land use which makes them illegal and for which the State need not be responsible.
Ø Distribution of Slums by Zones and Wards The city has four zones and 75 wards. Of these wards, only 40 wards have slums. Zone-‐B in the northeast has the maximum number of slums, accounting to almost 50% (N=93) of all slums in Ludhiana. Zone B is at the urban periphery and its cheaper/ easily available land for housing may be the reason for this. The area is also close to major industries. Zone C for the same reason, has the next highest number of slums. Between the two they have 70% of all city’s slums.
Exhibit 42: Zone-‐wise Distribution of Slums
Source: Slum Survey, 2014
0 5 10 15 20 25 30 35
1 4 6 8 13 15 17 24 27 30 32 43 46 52 55 58 60 64 71 74
No. of Slums
Ward No
Ward wise Distribution of Slums
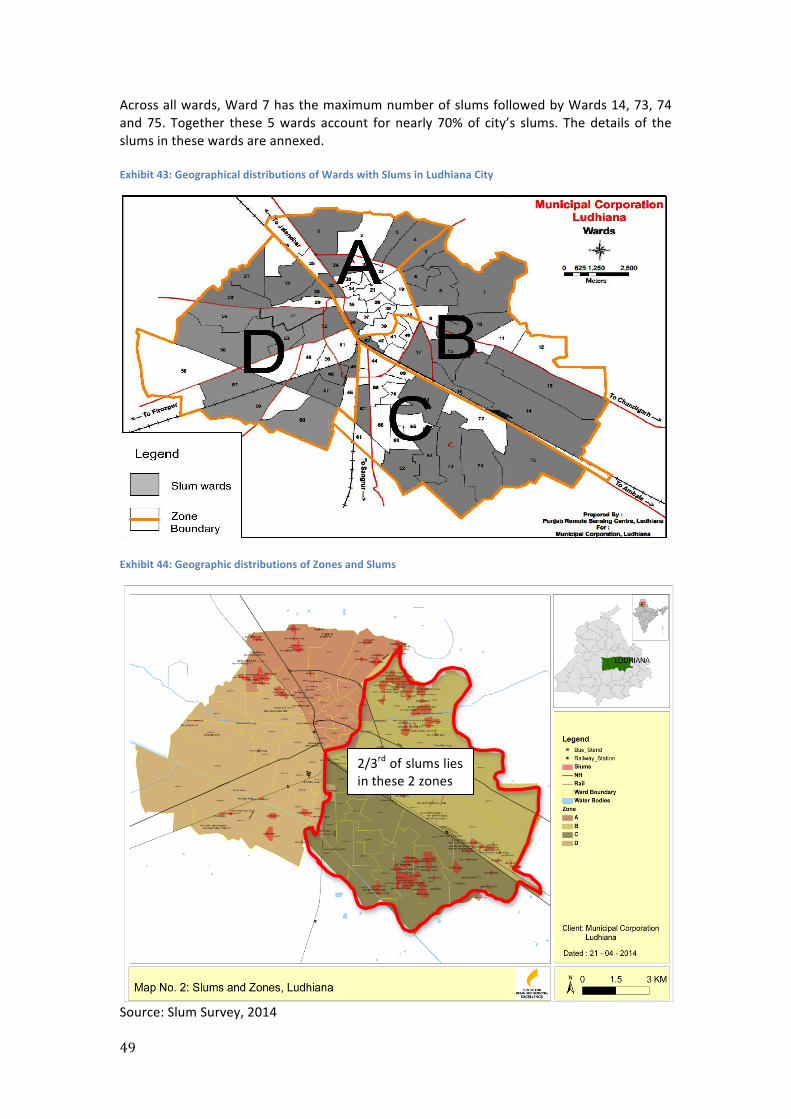
49
Across all wards, Ward 7 has the maximum number of slums followed by Wards 14, 73, 74 and 75. Together these 5 wards account for nearly 70% of city’s slums. The details of the slums in these wards are annexed. Exhibit 43: Geographical distributions of Wards with Slums in Ludhiana City
Exhibit 44: Geographic distributions of Zones and Slums
Source: Slum Survey, 2014
2/3rd of slums lies in these 2 zones
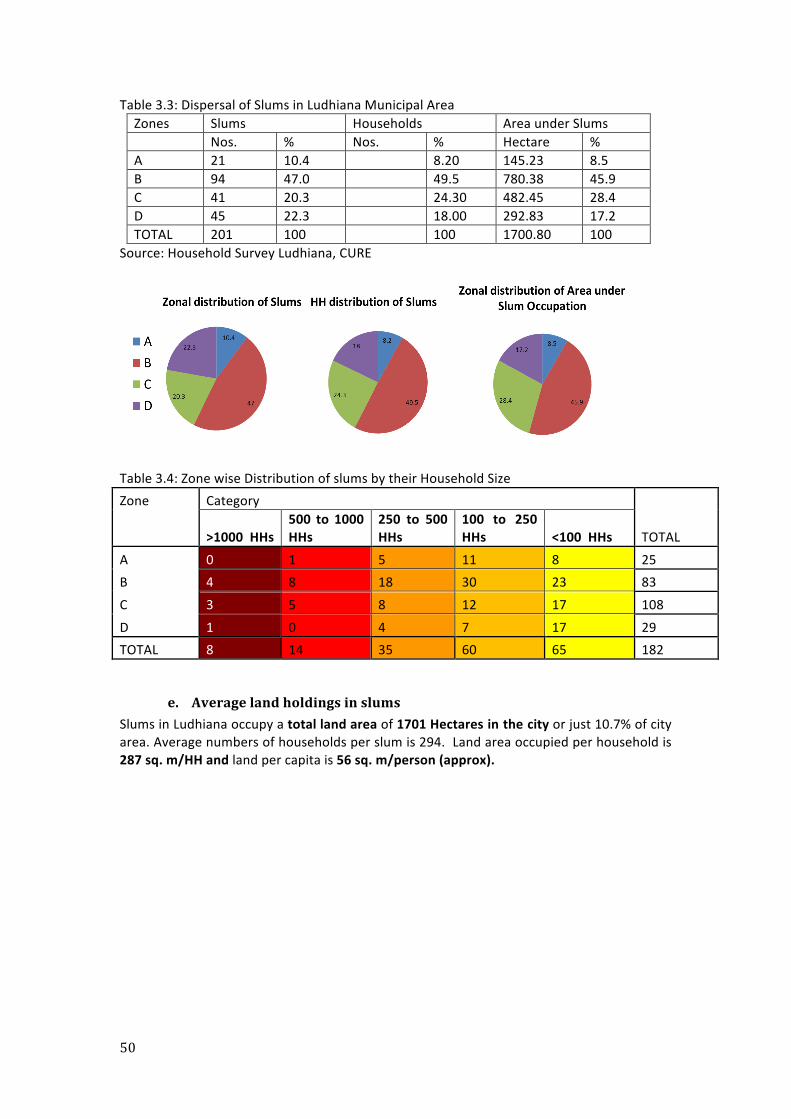
50
Table 3.3: Dispersal of Slums in Ludhiana Municipal Area Zones Slums Households Area under Slums Nos. % Nos. % Hectare % A 21 10.4 8.20 145.23 8.5 B 94 47.0 49.5 780.38 45.9 C 41 20.3 24.30 482.45 28.4 D 45 22.3 18.00 292.83 17.2 TOTAL 201 100 100 1700.80 100
Source: Household Survey Ludhiana, CURE
Table 3.4: Zone wise Distribution of slums by their Household Size Zone Category
>1000 HHs 500 to 1000 HHs
250 to 500 HHs
100 to 250 HHs <100 HHs TOTAL
A 0 1 5 11 8 25 B 4 8 18 30 23 83 C 3 5 8 12 17 108 D 1 0 4 7 17 29 TOTAL 8 14 35 60 65 182
e. Average land holdings in slums Slums in Ludhiana occupy a total land area of 1701 Hectares in the city or just 10.7% of city area. Average numbers of households per slum is 294. Land area occupied per household is 287 sq. m/HH and land per capita is 56 sq. m/person (approx).
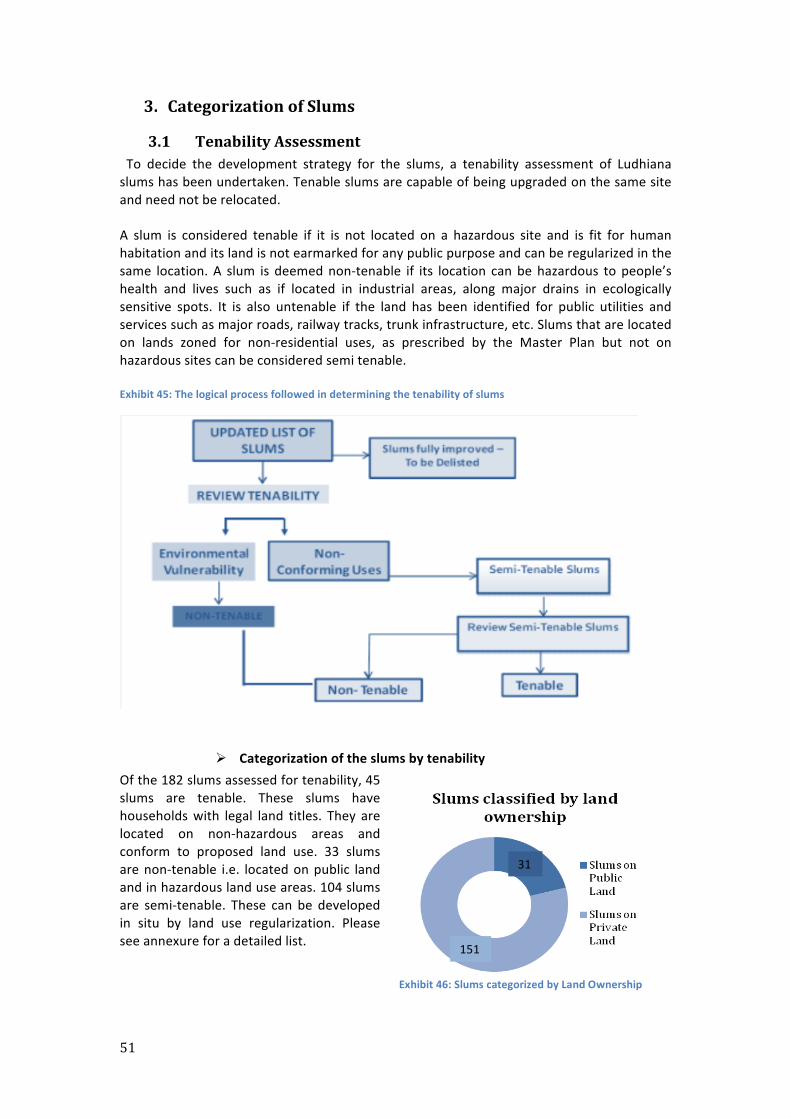
51
3. Categorization of Slums
3.1 Tenability Assessment To decide the development strategy for the slums, a tenability assessment of Ludhiana slums has been undertaken. Tenable slums are capable of being upgraded on the same site and need not be relocated. A slum is considered tenable if it is not located on a hazardous site and is fit for human habitation and its land is not earmarked for any public purpose and can be regularized in the same location. A slum is deemed non-‐tenable if its location can be hazardous to people’s health and lives such as if located in industrial areas, along major drains in ecologically sensitive spots. It is also untenable if the land has been identified for public utilities and services such as major roads, railway tracks, trunk infrastructure, etc. Slums that are located on lands zoned for non-‐residential uses, as prescribed by the Master Plan but not on hazardous sites can be considered semi tenable. Exhibit 45: The logical process followed in determining the tenability of slums
Ø Categorization of the slums by tenability Of the 182 slums assessed for tenability, 45 slums are tenable. These slums have households with legal land titles. They are located on non-‐hazardous areas and conform to proposed land use. 33 slums are non-‐tenable i.e. located on public land and in hazardous land use areas. 104 slums are semi-‐tenable. These can be developed in situ by land use regularization. Please see annexure for a detailed list.
151
31
Exhibit 46: Slums categorized by Land Ownership
52
Ø Land ownership of slums Nearly 80% slum households in Ludhiana have legal ownership right to the land. Slums where people have self-‐owned land parcels but which fall under non-‐conforming uses or hazardous areas shall be considered for in situ-‐upgrading unless people collectively and willingly surrender their lands to be relocated. Matrix showing relation between non-‐tenable slums and land ownership is provided below. Of the slums on pubic lands, majority is on hazardous lands or has non-‐conforming land use. Very few of self-‐owned land are in risky areas. Most are however, not on residential lands. Table 3.5: Slums categorized on Land Tenure
Total Hazardous Area
Non-‐Confirming Land-‐use
Slums on encroached (Public) Land 31 13 11 Slums on self-‐owned Land 151 9 71 Total 182 22 82 Source: Slum Survey, 2014
3.2 Prioritization of Tenable Slums through Priority Matrix As part of the assessment, slums in Ludhiana were prioritized on the basis of their vulnerability. The purpose is to phase the upgrading plan by prioritizing the most vulnerable first for investments. Such a prioritization helps when funds are limited and need to be deployed to maximize benefits. Three parameters are used in the matrix: infrastructure deficiency, housing condition and tenure status. The latter two indicators indicate the degree of vulnerability for the slums. All slums are scored against each of these indicators. The average scores for Infrastructure deficiency and vulnerability hence determine ranges representing worst, average and good slum settlements. Each slum gets a rank based on where it falls in the 2x2x23 matrix format. This matrix helps to develop a systematic and transparent process to categorize slums.
a. Infrastructure Deficiency Assessment Infrastructure deficiency (ID) in each slum is assessed using a two-‐step approach. From focused group discussions with slum dwellers, service requirements were identified. Based on these, percent deficiency of these services in the slums was determined. The service standards developed during community consultations included; individual water supplies connections, pucca access and in-‐slum roads, sewerage connections and in-‐house toilet facilities. The percentage deficiency was measured on a 5-‐point scale for each parameter, where 0 being the lowest value or the poorest level and 5 being the highest value. The difference between the highest and lowest values was then divided by 5 to get the range. The composite score of all the parameters was added to get the overall ID score for each slum. Slums with the following scores were rated with high or low vulnerability.
• Total Score of less or equal to 25: High level of infrastructure (code 1) • Total Score of greater than 25: Low level of infrastructure (Code 2)
3 The 2x2x2 matrix represents (Less Infrastructure deficiency) X (Permanent Housing) X (Secure Tenure). The 1x1x1 represents (High Infrastructure deficiency) X (Temporary Housing) X (Insecure Tenure)
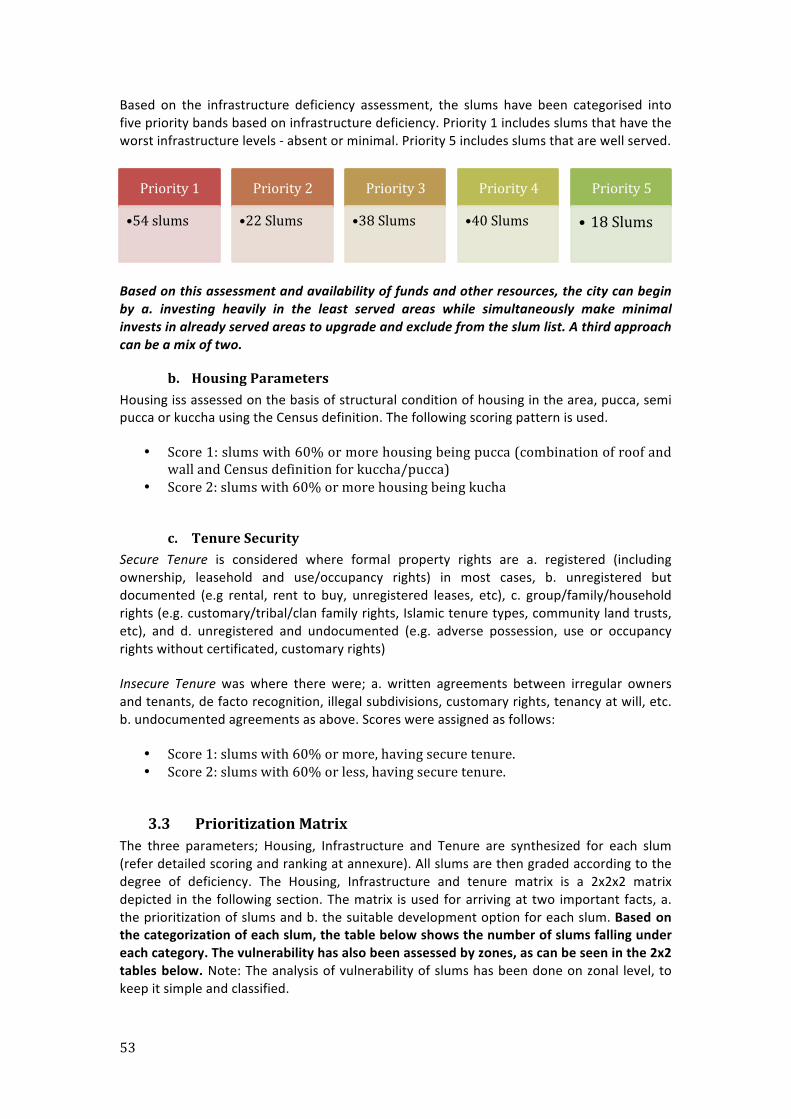
53
Based on the infrastructure deficiency assessment, the slums have been categorised into five priority bands based on infrastructure deficiency. Priority 1 includes slums that have the worst infrastructure levels -‐ absent or minimal. Priority 5 includes slums that are well served.
Based on this assessment and availability of funds and other resources, the city can begin by a. investing heavily in the least served areas while simultaneously make minimal invests in already served areas to upgrade and exclude from the slum list. A third approach can be a mix of two.
b. Housing Parameters Housing iss assessed on the basis of structural condition of housing in the area, pucca, semi pucca or kuccha using the Census definition. The following scoring pattern is used.
• Score 1: slums with 60% or more housing being pucca (combination of roof and wall and Census definition for kuccha/pucca)
• Score 2: slums with 60% or more housing being kucha
c. Tenure Security Secure Tenure is considered where formal property rights are a. registered (including ownership, leasehold and use/occupancy rights) in most cases, b. unregistered but documented (e.g rental, rent to buy, unregistered leases, etc), c. group/family/household rights (e.g. customary/tribal/clan family rights, Islamic tenure types, community land trusts, etc), and d. unregistered and undocumented (e.g. adverse possession, use or occupancy rights without certificated, customary rights)
Insecure Tenure was where there were; a. written agreements between irregular owners and tenants, de facto recognition, illegal subdivisions, customary rights, tenancy at will, etc. b. undocumented agreements as above. Scores were assigned as follows:
• Score 1: slums with 60% or more, having secure tenure. • Score 2: slums with 60% or less, having secure tenure.
3.3 Prioritization Matrix The three parameters; Housing, Infrastructure and Tenure are synthesized for each slum (refer detailed scoring and ranking at annexure). All slums are then graded according to the degree of deficiency. The Housing, Infrastructure and tenure matrix is a 2x2x2 matrix depicted in the following section. The matrix is used for arriving at two important facts, a. the prioritization of slums and b. the suitable development option for each slum. Based on the categorization of each slum, the table below shows the number of slums falling under each category. The vulnerability has also been assessed by zones, as can be seen in the 2x2 tables below. Note: The analysis of vulnerability of slums has been done on zonal level, to keep it simple and classified.
Priority 1
• 54 slums
Priority 2
• 22 Slums
Priority 3
• 38 Slums
Priority 4
• 40 Slums
Priority 5
• 18 Slums
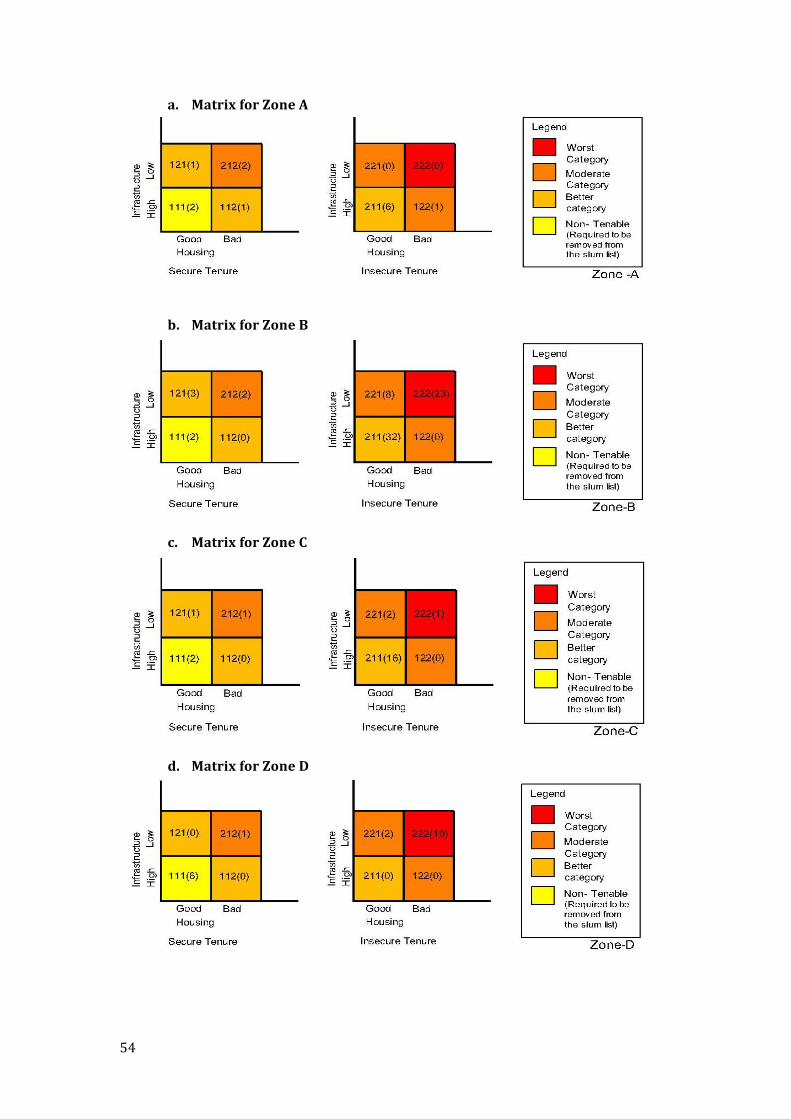
54
a. Matrix for Zone A
b. Matrix for Zone B
c. Matrix for Zone C
d. Matrix for Zone D
55
Table: showing Different Slums under different categories
S. No. Ranking Category Total Zone-‐A Zone-‐B Zone-‐C Zone-‐D 1 1x1x1 29 3 9 14 3 2 1x1x2 4 1 0 1 2 3 1x2x1 5 1 3 1 0 4 2x1x1 54 8 30 16 0 5 1x2x2 3 2 0 1 0 6 2x1x2 23 7 10 5 1 7 2x2x1 20 1 11 6 2 8 2x2x2 36 4 20 1 11
TOTAL -‐ 182 14 83 45 29 Source: Slum Survey, 2014
3.4 Matrix Analysis All the slums falling under the first category (1x1x1) are the ones, which are the most vulnerable slums, lacking infrastructure services, proper built structures/housing, etc. Subsequently, category 2, 3 and 4 are the next vulnerable set comprising of slums falling short on any two of the three parameters used. Lastly is the set of category 5, 6 and 7 which have slums that need a minimal investment to be upgraded as two of the parameters are sufficiently at par with the city averages. Please see the ranking table at annex x. From the above table it is seen that 29 slums are far below standards making them non-‐habitable and need immediate solutions and inputs from the city government. Almost 44 slums are at par with the standards and need to be delisted from the slum list. A significant number of slums (54 slums) falls under the category ‘2x1x1’, which shall have similar strategies for development. These strategies of development are discussed in the following section.
3.5 Formulation of Development Strategy Slum development options have been decided on the basis of slum vulnerability and tenability, in particular slum land ownership, tenure, density and value. Slums may be developed using three options. These are presented below in order of priority.
a. In-‐situ upgrading 147 tenable settlements or the unauthorized-‐un-‐regularized colonies and selected squatter settlements) mostly with secure land tenure, appropriate land use as per the City’s Master Plan, and low to medium vulnerability shall be upgraded on the same site and on as-‐is-‐where-‐is basis. In-‐situ upgrading shall ensure existing livelihoods of the poor can continue. Depending on the context, the city shall chose one of three upgrading options; i. only bring in the basic services with last mile connections; ii. Upgrade kutcha, semi-‐pucca houses to pucca with in-‐house services as per RAY norms; and c. upgrade pucca houses with in-‐house services, where missing and create additional space in small houses.
56
b. Redevelopment Semi tenable slums (1 in number) shall be redeveloped on the same site. This would include demolishing hutments and rebuilding housing in multi-‐level structures and by shifting residents to transit accommodation during the reconstruction.
c. Resettlement: 32 slums that are highly vulnerable, untenable settlements with no land tenure i.e. mostly squatter settlements shall be resettled with housing, services and livelihoods rehabilitation (recognizing that development through far-‐site relocation has an adverse impact on people’s livelihoods and incomes) on the basis of a resettlement plan. Resettlement may be in:
Ø Site and Services Schemes Scheme proposed in serviced plots with basic infrastructure and secure tenure. In this model, people can incrementally build their own housing with technical support from MCL.
Ø New Housing Housing with all basic services in near or far-‐site resettlement in multi-‐level or low-‐rise housing depending on demand and land availability. This would include households in existing slums and new migrants. A livelihoods’ rehabilitation plan shall be part of the housing design to create space for employment and generate new opportunities in the neighborhood.
3.6 Development Model as per the new AHP
a. Tenable Slums: Ø Slums on Govt./ Central Govt. Land
§ On Private Partnership basis by using land as a resource § Such slum lands to be given Additional FSI/TDR by State/ULB § Private builders to exploit part of the land or FSI/TDR for Commercial Purposes § Private builders to build houses for eligible Slum Dwellers at free of cost § Private builders through transparent bidding process § Not all slums amenable for cross subsidization
Ø Other slums will require funding from Government § Government of India and State Governments to share financial burden in case of
viability gap (60-‐75%) § Some slums may result into surplus to State Government/ULBs to be used for cross
subsidization of other slums
Ø Slums on Private Land § Slums on private land to be developed by giving additional FSI/TDR to owner for
providing in-‐situ housing to existing slum dwellers § Government of India/State Governments to prescribe Technical Specifications and
Area norms for housing to Slum Dwellers
b. Un-‐Tenable Slums § Slums located on sites not fit for Residential Purpose like river bed, forest, drain
lines, High tension lines etc. are to be relocated to Tenable Sites. § Expenditure to be shared between GoI, State Govt and ULB Every slum that is to be taken up for development must be studied in detail and proposals shall be based on detailed study.
57
Section 4: Housing Study
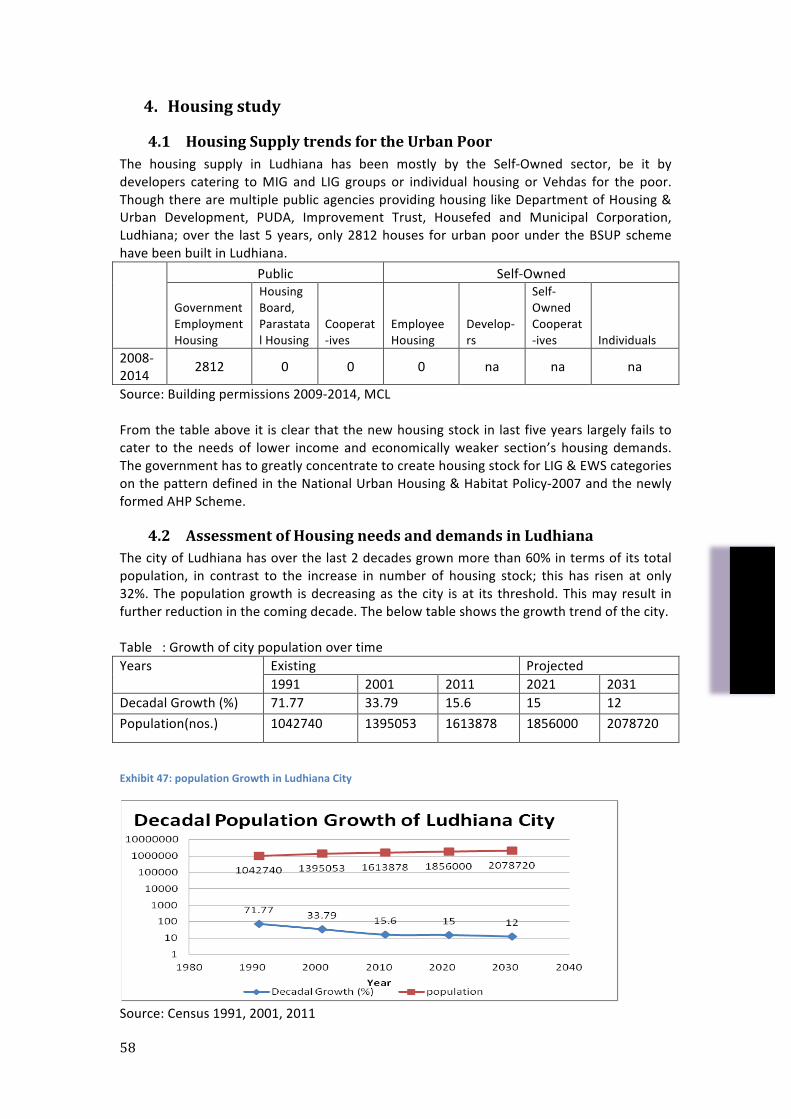
58
4. Housing study
4.1 Housing Supply trends for the Urban Poor The housing supply in Ludhiana has been mostly by the Self-‐Owned sector, be it by developers catering to MIG and LIG groups or individual housing or Vehdas for the poor. Though there are multiple public agencies providing housing like Department of Housing & Urban Development, PUDA, Improvement Trust, Housefed and Municipal Corporation, Ludhiana; over the last 5 years, only 2812 houses for urban poor under the BSUP scheme have been built in Ludhiana.
Public Self-‐Owned
Government Employment Housing
Housing Board, Parastatal Housing
Cooperat-‐ives
Employee Housing
Develop-‐rs
Self-‐Owned Cooperat-‐ives Individuals
2008-‐2014 2812 0 0 0 na na na
Source: Building permissions 2009-‐2014, MCL From the table above it is clear that the new housing stock in last five years largely fails to cater to the needs of lower income and economically weaker section’s housing demands. The government has to greatly concentrate to create housing stock for LIG & EWS categories on the pattern defined in the National Urban Housing & Habitat Policy-‐2007 and the newly formed AHP Scheme.
4.2 Assessment of Housing needs and demands in Ludhiana The city of Ludhiana has over the last 2 decades grown more than 60% in terms of its total population, in contrast to the increase in number of housing stock; this has risen at only 32%. The population growth is decreasing as the city is at its threshold. This may result in further reduction in the coming decade. The below table shows the growth trend of the city. Table : Growth of city population over time Years Existing Projected
1991 2001 2011 2021 2031 Decadal Growth (%) 71.77 33.79 15.6 15 12 Population(nos.) 1042740 1395053 1613878 1856000 2078720
Exhibit 47: population Growth in Ludhiana City
Source: Census 1991, 2001, 2011
Housing Need = current shortage of housing Housing Demand = newly arising need of housing Housing Supply = what market can supply
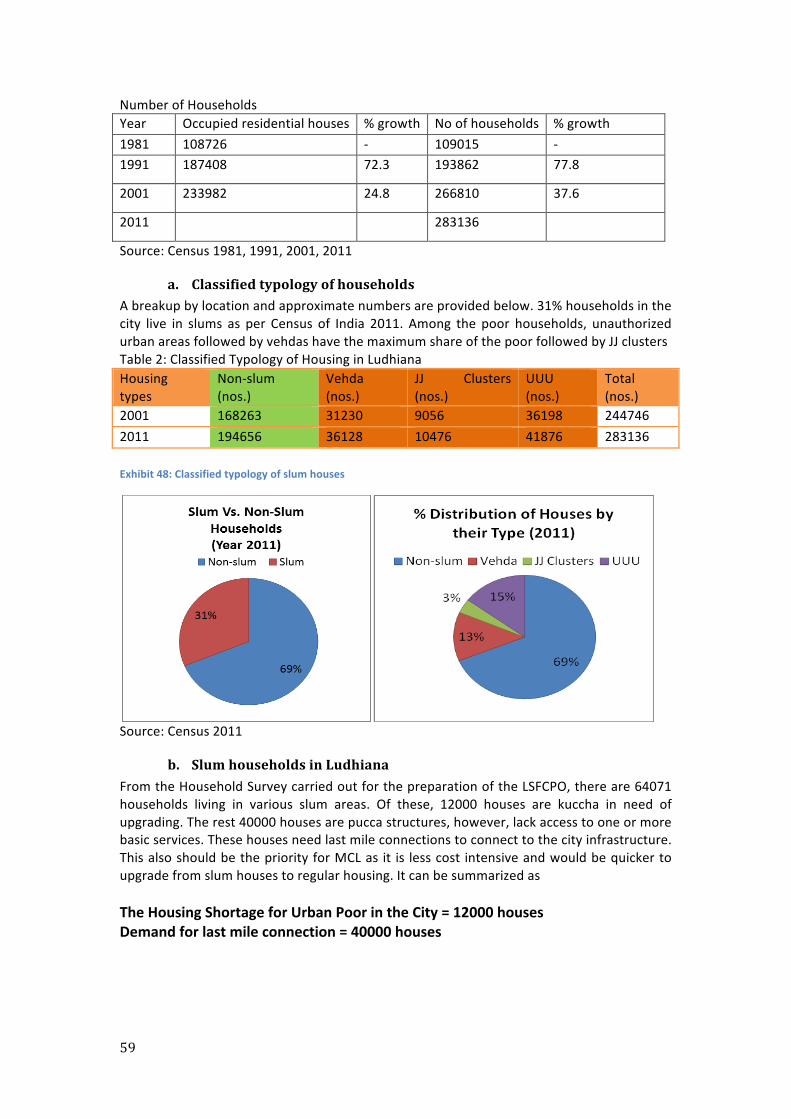
59
Number of Households Year Occupied residential houses % growth No of households % growth 1981 108726 -‐ 109015 -‐ 1991 187408 72.3 193862 77.8
2001 233982 24.8 266810 37.6
2011 283136
Source: Census 1981, 1991, 2001, 2011
a. Classified typology of households A breakup by location and approximate numbers are provided below. 31% households in the city live in slums as per Census of India 2011. Among the poor households, unauthorized urban areas followed by vehdas have the maximum share of the poor followed by JJ clusters Table 2: Classified Typology of Housing in Ludhiana Housing types
Non-‐slum (nos.)
Vehda (nos.)
JJ Clusters (nos.)
UUU (nos.)
Total (nos.)
2001 168263 31230 9056 36198 244746 2011 194656 36128 10476 41876 283136 Exhibit 48: Classified typology of slum houses
Source: Census 2011
b. Slum households in Ludhiana From the Household Survey carried out for the preparation of the LSFCPO, there are 64071 households living in various slum areas. Of these, 12000 houses are kuccha in need of upgrading. The rest 40000 houses are pucca structures, however, lack access to one or more basic services. These houses need last mile connections to connect to the city infrastructure. This also should be the priority for MCL as it is less cost intensive and would be quicker to upgrade from slum houses to regular housing. It can be summarized as The Housing Shortage for Urban Poor in the City = 12000 houses Demand for last mile connection = 40000 houses
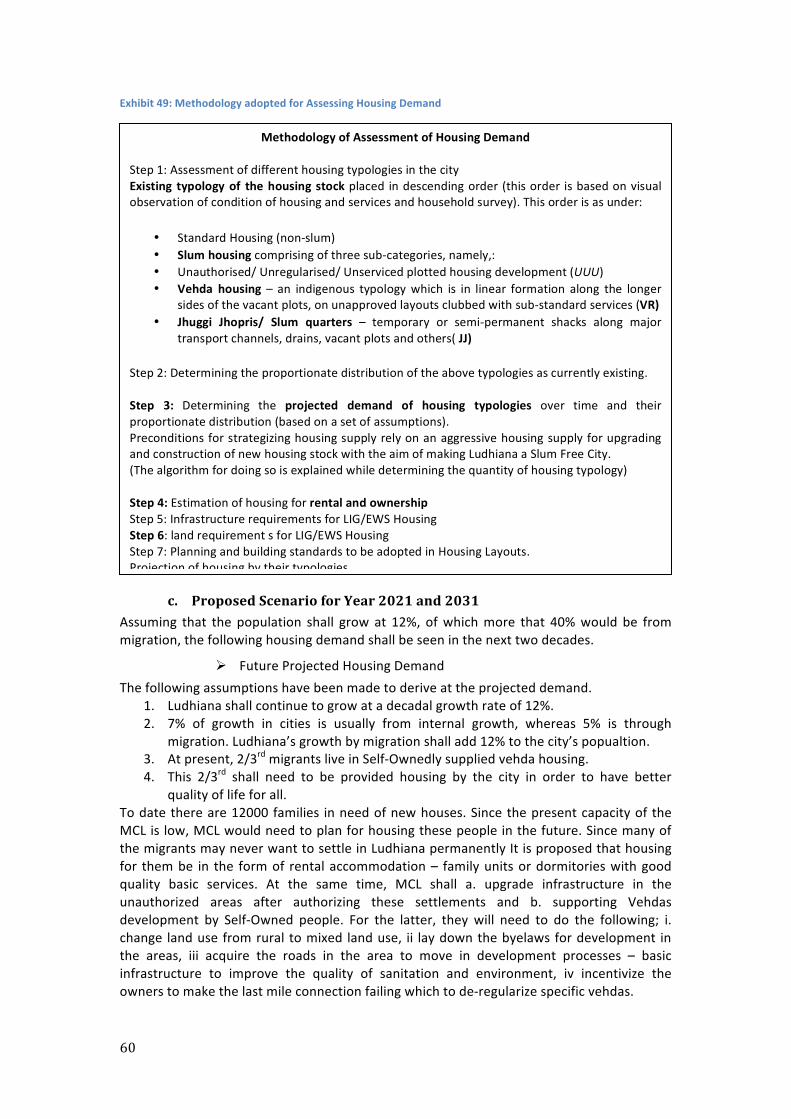
60
Exhibit 49: Methodology adopted for Assessing Housing Demand
c. Proposed Scenario for Year 2021 and 2031 Assuming that the population shall grow at 12%, of which more that 40% would be from migration, the following housing demand shall be seen in the next two decades.
Ø Future Projected Housing Demand The following assumptions have been made to derive at the projected demand.
1. Ludhiana shall continue to grow at a decadal growth rate of 12%. 2. 7% of growth in cities is usually from internal growth, whereas 5% is through
migration. Ludhiana’s growth by migration shall add 12% to the city’s popualtion. 3. At present, 2/3rd migrants live in Self-‐Ownedly supplied vehda housing. 4. This 2/3rd shall need to be provided housing by the city in order to have better
quality of life for all. To date there are 12000 families in need of new houses. Since the present capacity of the MCL is low, MCL would need to plan for housing these people in the future. Since many of the migrants may never want to settle in Ludhiana permanently It is proposed that housing for them be in the form of rental accommodation – family units or dormitories with good quality basic services. At the same time, MCL shall a. upgrade infrastructure in the unauthorized areas after authorizing these settlements and b. supporting Vehdas development by Self-‐Owned people. For the latter, they will need to do the following; i. change land use from rural to mixed land use, ii lay down the byelaws for development in the areas, iii acquire the roads in the area to move in development processes – basic infrastructure to improve the quality of sanitation and environment, iv incentivize the owners to make the last mile connection failing which to de-‐regularize specific vehdas.
Methodology of Assessment of Housing Demand Step 1: Assessment of different housing typologies in the city Existing typology of the housing stock placed in descending order (this order is based on visual observation of condition of housing and services and household survey). This order is as under:
• Standard Housing (non-‐slum) • Slum housing comprising of three sub-‐categories, namely,: • Unauthorised/ Unregularised/ Unserviced plotted housing development (UUU) • Vehda housing – an indigenous typology which is in linear formation along the longer
sides of the vacant plots, on unapproved layouts clubbed with sub-‐standard services (VR) • Jhuggi Jhopris/ Slum quarters – temporary or semi-‐permanent shacks along major
transport channels, drains, vacant plots and others( JJ)
Step 2: Determining the proportionate distribution of the above typologies as currently existing. Step 3: Determining the projected demand of housing typologies over time and their proportionate distribution (based on a set of assumptions). Preconditions for strategizing housing supply rely on an aggressive housing supply for upgrading and construction of new housing stock with the aim of making Ludhiana a Slum Free City. (The algorithm for doing so is explained while determining the quantity of housing typology) Step 4: Estimation of housing for rental and ownership Step 5: Infrastructure requirements for LIG/EWS Housing Step 6: land requirement s for LIG/EWS Housing Step 7: Planning and building standards to be adopted in Housing Layouts. Projection of housing by their typologies
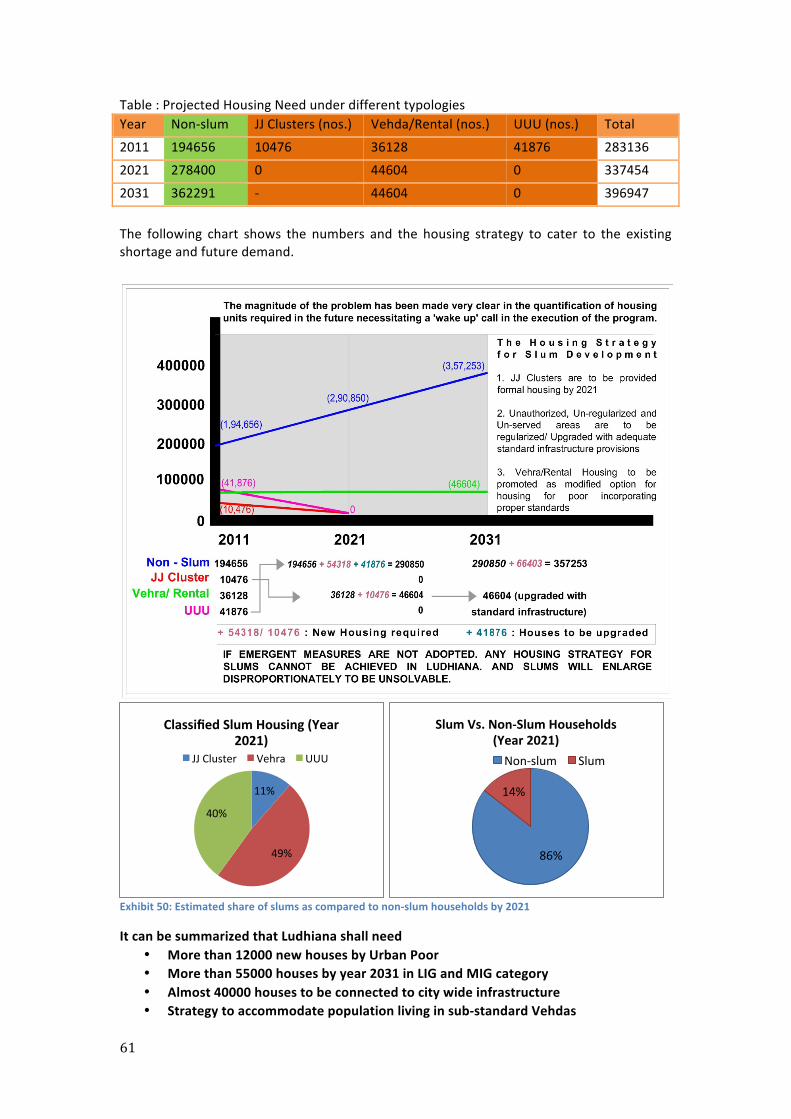
61
Table : Projected Housing Need under different typologies Year Non-‐slum JJ Clusters (nos.) Vehda/Rental (nos.) UUU (nos.) Total
2011 194656 10476 36128 41876 283136
2021 278400 0 44604 0 337454
2031 362291 -‐ 44604 0 396947
The following chart shows the numbers and the housing strategy to cater to the existing shortage and future demand.
Exhibit 50: Estimated share of slums as compared to non-‐slum households by 2021
It can be summarized that Ludhiana shall need • More than 12000 new houses by Urban Poor • More than 55000 houses by year 2031 in LIG and MIG category • Almost 40000 houses to be connected to city wide infrastructure • Strategy to accommodate population living in sub-‐standard Vehdas
11%
49%
40%
Classified Slum Housing (Year 2021)
JJ Cluster Vehra UUU
86%
14%
Slum Vs. Non-‐Slum Households (Year 2021) Non-‐slum Slum
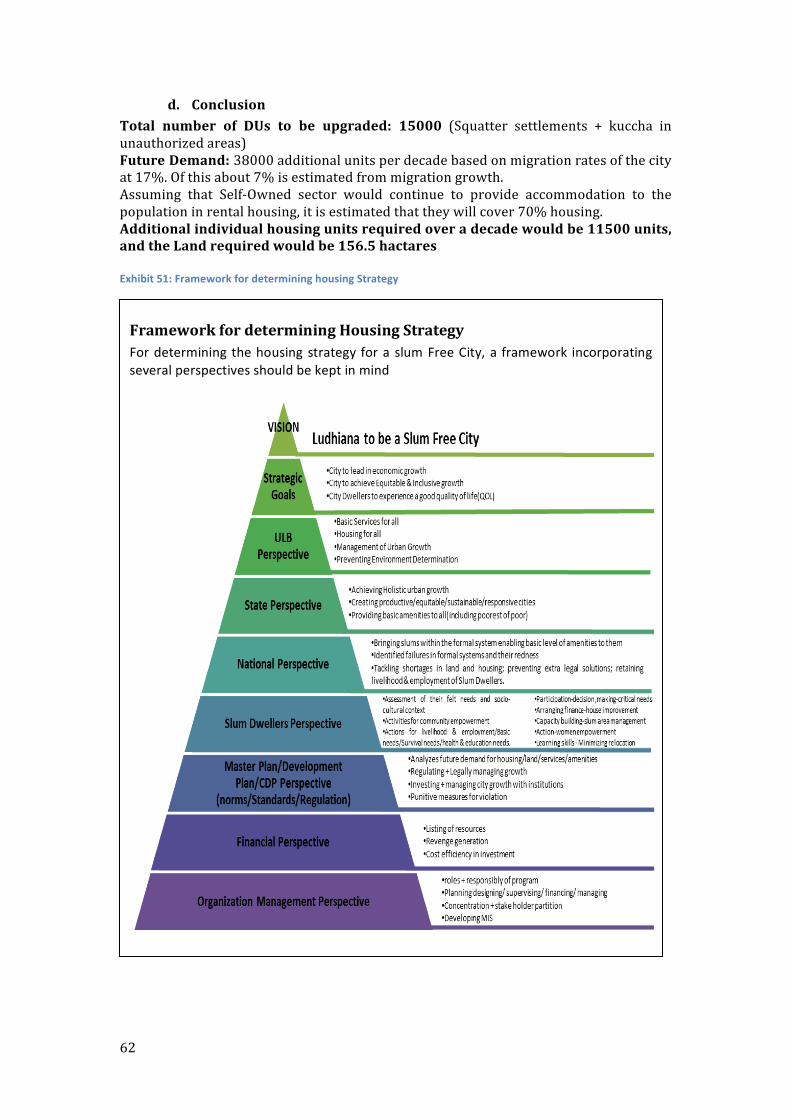
62
d. Conclusion Total number of DUs to be upgraded: 15000 (Squatter settlements + kuccha in unauthorized areas) Future Demand: 38000 additional units per decade based on migration rates of the city at 17%. Of this about 7% is estimated from migration growth. Assuming that Self-‐Owned sector would continue to provide accommodation to the population in rental housing, it is estimated that they will cover 70% housing. Additional individual housing units required over a decade would be 11500 units, and the Land required would be 156.5 hactares Exhibit 51: Framework for determining housing Strategy
Framework for determining Housing Strategy For determining the housing strategy for a slum Free City, a framework incorporating several perspectives should be kept in mind
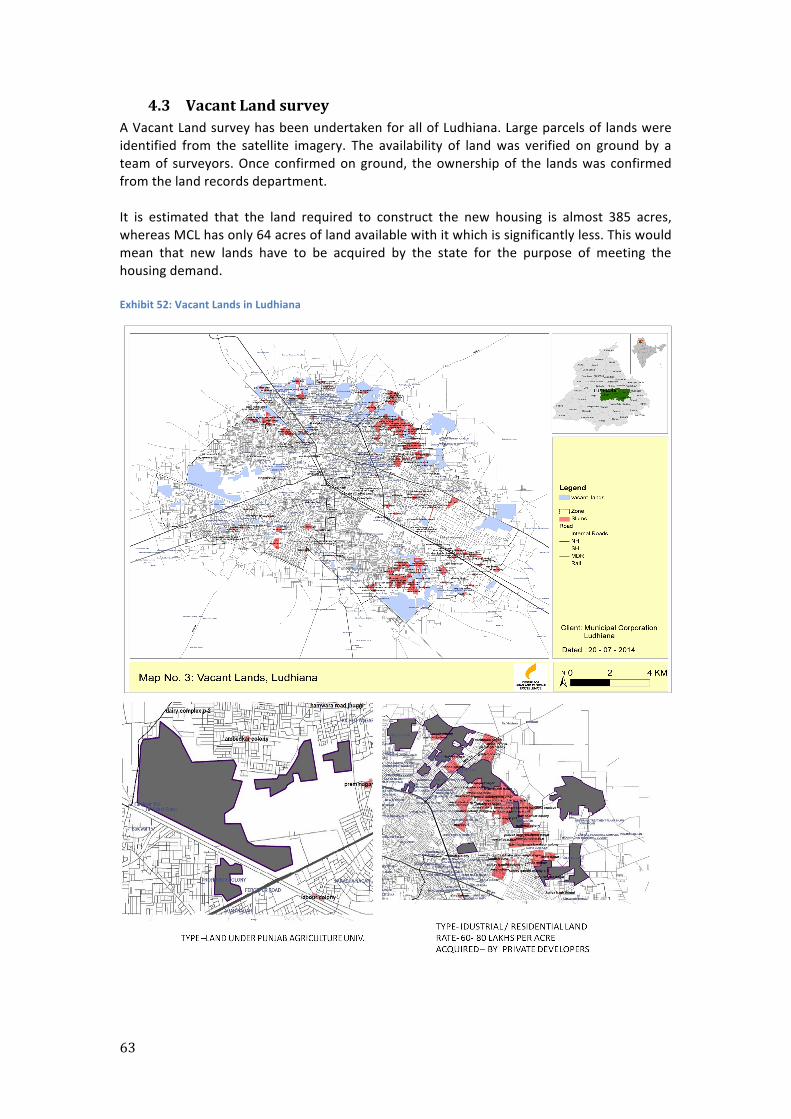
63
4.3 Vacant Land survey A Vacant Land survey has been undertaken for all of Ludhiana. Large parcels of lands were identified from the satellite imagery. The availability of land was verified on ground by a team of surveyors. Once confirmed on ground, the ownership of the lands was confirmed from the land records department. It is estimated that the land required to construct the new housing is almost 385 acres, whereas MCL has only 64 acres of land available with it which is significantly less. This would mean that new lands have to be acquired by the state for the purpose of meeting the housing demand. Exhibit 52: Vacant Lands in Ludhiana
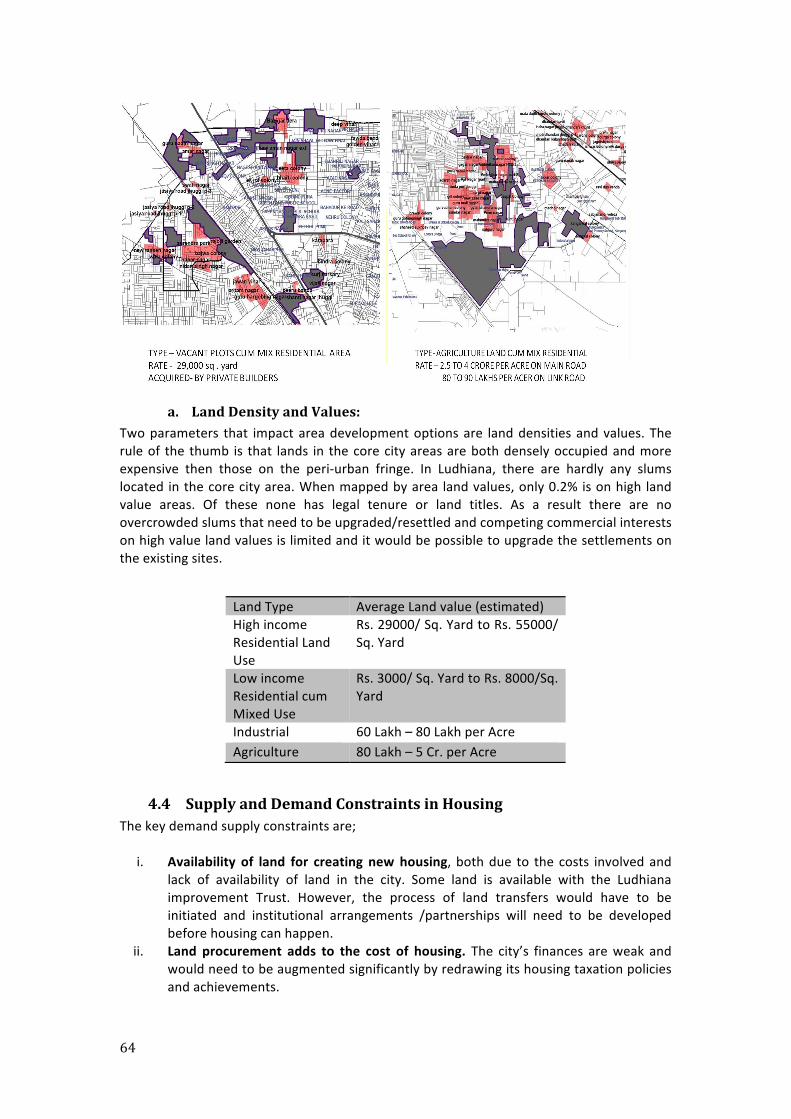
64
a. Land Density and Values: Two parameters that impact area development options are land densities and values. The rule of the thumb is that lands in the core city areas are both densely occupied and more expensive then those on the peri-‐urban fringe. In Ludhiana, there are hardly any slums located in the core city area. When mapped by area land values, only 0.2% is on high land value areas. Of these none has legal tenure or land titles. As a result there are no overcrowded slums that need to be upgraded/resettled and competing commercial interests on high value land values is limited and it would be possible to upgrade the settlements on the existing sites.
4.4 Supply and Demand Constraints in Housing The key demand supply constraints are;
i. Availability of land for creating new housing, both due to the costs involved and lack of availability of land in the city. Some land is available with the Ludhiana improvement Trust. However, the process of land transfers would have to be initiated and institutional arrangements /partnerships will need to be developed before housing can happen.
ii. Land procurement adds to the cost of housing. The city’s finances are weak and would need to be augmented significantly by redrawing its housing taxation policies and achievements.
Land Type Average Land value (estimated) High income Residential Land Use
Rs. 29000/ Sq. Yard to Rs. 55000/ Sq. Yard
Low income Residential cum Mixed Use
Rs. 3000/ Sq. Yard to Rs. 8000/Sq. Yard
Industrial 60 Lakh – 80 Lakh per Acre Agriculture 80 Lakh – 5 Cr. per Acre
65
iii. Regularization of Slums: Unauthorized colonies where people have property rights cannot be displaced. These form a large segment slums and can easily be developed by regularization and releasing the energies of the neighbourhood for self-‐development. The process for regularization will need to be initiated and may take some time to happen as this would need state intervention.
iv. In-‐situ development There are very few slums in the city core area. The few that are there could be developed in-‐situ to obviate the need for land procurement and keep the costs low. This would need decisions to grant land-‐tenure in these sites on a case-‐to-‐case basis.
v. Housing of Migrants from Other States: There would need to be a decision to provide housing with property titles to families not domiciled in Punjab; large majority of the poor people lack voter ID and ration cards from the state. The State will need to decide on some form of temporary tenure, besides creating rental accommodation – currently the preferred mode of housing among the poorest.
vi. Investing in Vehda Development: Vehdas, the particular phenomenon of Punjab is tenement housing created by rich land owners by converting rural lands into residential lands in contravention of the Master Plan. These are however, the worst areas with respect to environmental services. RAY funding for upgrading these, would need hard decisions will be made for investments in city infrastructure – bringing in water, toilets, roads, power supply, etc. inside these Self-‐Owned properties.
vii. Gentrification: For slums households having ownership rights, their properties have a natural propensity for higher value, therefore, when improved, owners can be tempted to transfer or resell. Taking an affidavit from owners for a continuous stay of 10 years in the improved house will ensure a well-‐spent public resource.
viii. Mixed Use Development: There will be need to promote integrated housing with shopping, commercial activity, space for self-‐employment work at the ground levels and residential areas on the upper levels.
ix. Byelaws for Vehdas: Housing for the poor must be planned with appropriate byelaws. For now, the idea is to ensure housing density does not exceed 400 D.U.s per hectare, light angles are at 30 degree and housing maintained for light and ventilation. Any construction violating this norm should be penalized.
i. Land reservation: in the slum vicinity, land would need to be accommodated for new households, creating a supply of 15%-‐20% per annum (for new Households).
MAPPING EACH SLUM; Prepare a technical layout plan for each upgraded slum with building standards for heights, road widths; minimum area of 270 sq ft. Per HH; Average area of 350 sq ft. per household (commensurate with each slum) Minimum plot frontage 3.6 m Minimum room size 12.5 sqm; Minimum room width 2.4 m Planning standards for upgraded slums; Open space…….……...0.3 ha/1000 persons Roads……………..……… 10 -‐20% of site area One nursery school… 0.1ha/1500 population Micro shops………….…10 shops/1000 population
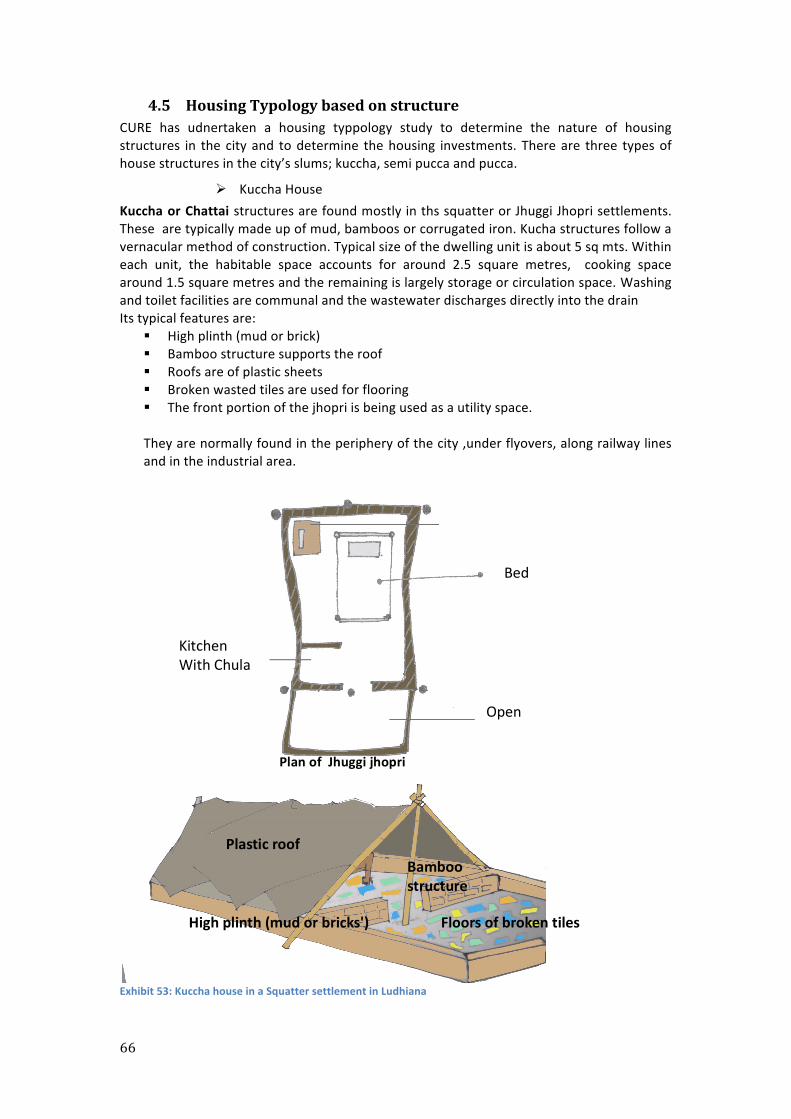
66
4.5 Housing Typology based on structure CURE has udnertaken a housing typpology study to determine the nature of housing structures in the city and to determine the housing investments. There are three types of house structures in the city’s slums; kuccha, semi pucca and pucca.
Ø Kuccha House Kuccha or Chattai structures are found mostly in ths squatter or Jhuggi Jhopri settlements. These are typically made up of mud, bamboos or corrugated iron. Kucha structures follow a vernacular method of construction. Typical size of the dwelling unit is about 5 sq mts. Within each unit, the habitable space accounts for around 2.5 square metres, cooking space around 1.5 square metres and the remaining is largely storage or circulation space. Washing and toilet facilities are communal and the wastewater discharges directly into the drain Its typical features are:
§ High plinth (mud or brick) § Bamboo structure supports the roof § Roofs are of plastic sheets § Broken wasted tiles are used for flooring § The front portion of the jhopri is being used as a utility space. They are normally found in the periphery of the city ,under flyovers, along railway lines and in the industrial area.
Exhibit 53: Kuccha house in a Squatter settlement in Ludhiana
Bed
Open Space
Kitchen With Chula
Plan of Jhuggi jhopri
Plastic roof
Floors of broken tiles High plinth (mud or bricks')
Bamboo structure
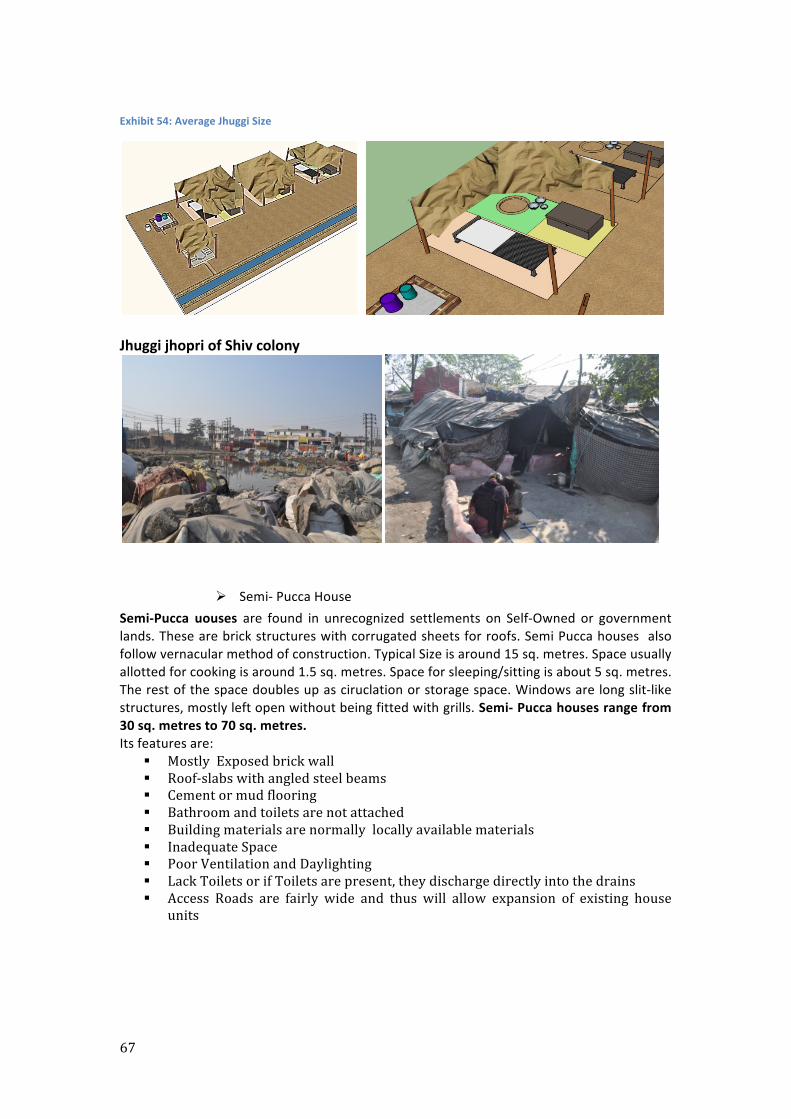
67
Exhibit 54: Average Jhuggi Size
Jhuggi jhopri of Shiv colony
Ø Semi-‐ Pucca House Semi-‐Pucca uouses are found in unrecognized settlements on Self-‐Owned or government lands. These are brick structures with corrugated sheets for roofs. Semi Pucca houses also follow vernacular method of construction. Typical Size is around 15 sq. metres. Space usually allotted for cooking is around 1.5 sq. metres. Space for sleeping/sitting is about 5 sq. metres. The rest of the space doubles up as ciruclation or storage space. Windows are long slit-‐like structures, mostly left open without being fitted with grills. Semi-‐ Pucca houses range from 30 sq. metres to 70 sq. metres. Its features are:
§ Mostly Exposed brick wall § Roof-‐slabs with angled steel beams § Cement or mud flooring § Bathroom and toilets are not attached § Building materials are normally locally available materials § Inadequate Space § Poor Ventilation and Daylighting § Lack Toilets or if Toilets are present, they discharge directly into the drains § Access Roads are fairly wide and thus will allow expansion of existing house
units
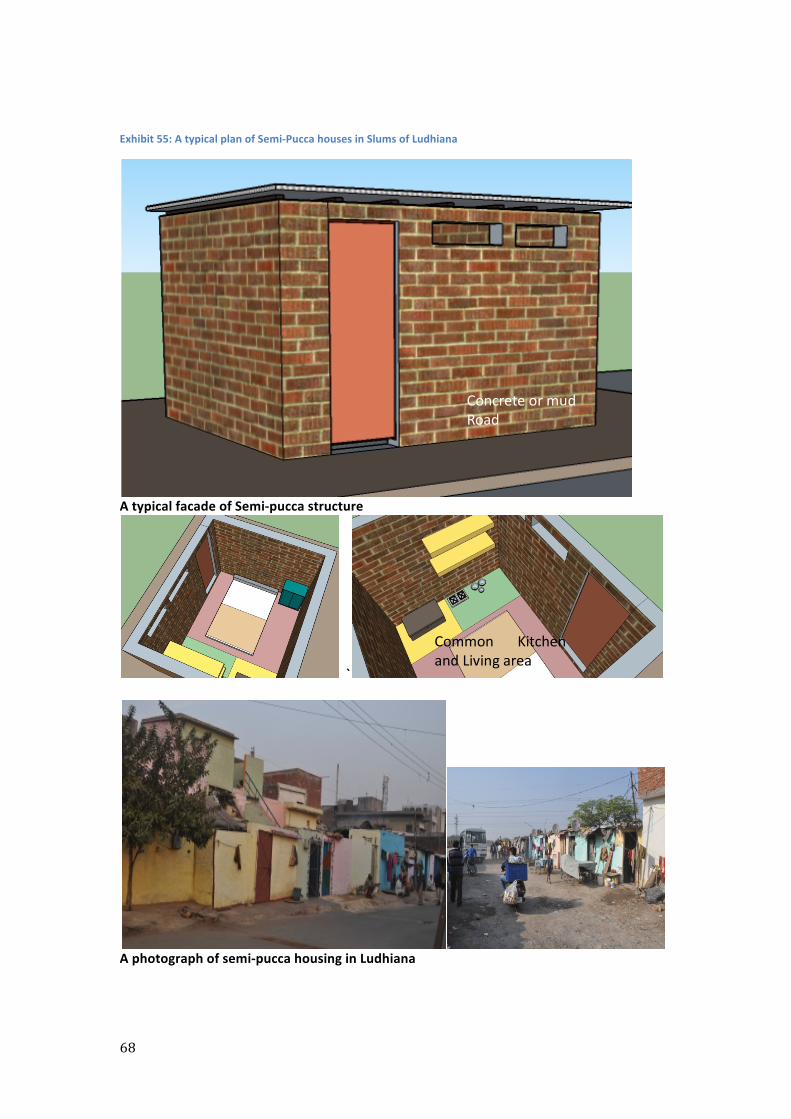
68
Exhibit 55: A typical plan of Semi-‐Pucca houses in Slums of Ludhiana
A typical facade of Semi-‐pucca structure
`
A photograph of semi-‐pucca housing in Ludhiana
Concrete or mud Road
Common Kitchen and Living area
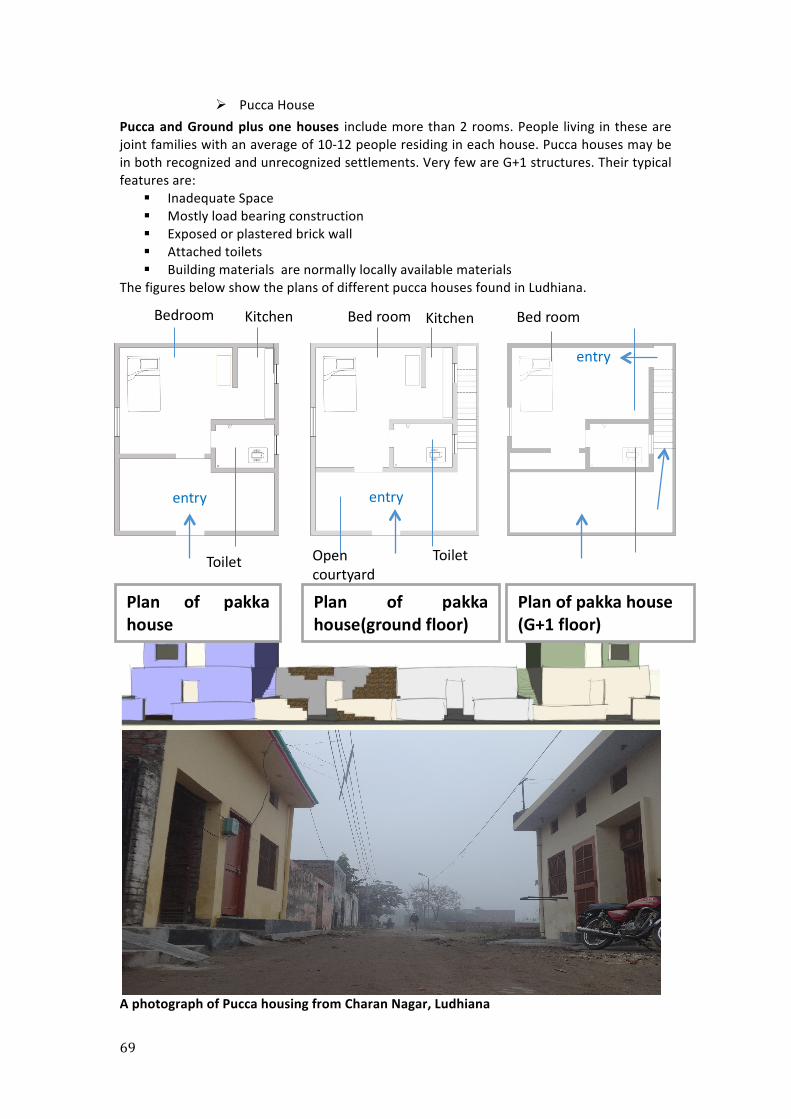
69
Ø Pucca House Pucca and Ground plus one houses include more than 2 rooms. People living in these are joint families with an average of 10-‐12 people residing in each house. Pucca houses may be in both recognized and unrecognized settlements. Very few are G+1 structures. Their typical features are:
§ Inadequate Space § Mostly load bearing construction § Exposed or plastered brick wall § Attached toilets § Building materials are normally locally available materials
The figures below show the plans of different pucca houses found in Ludhiana.
A photograph of Pucca housing from Charan Nagar, Ludhiana
Bedroom Kitchen
Toilet
Bed room Kitchen
Toilet Open courtyard
Bed room
entry entry
entry
Plan of pakka house
Plan of pakka house(ground floor)
Plan of pakka house (G+1 floor)
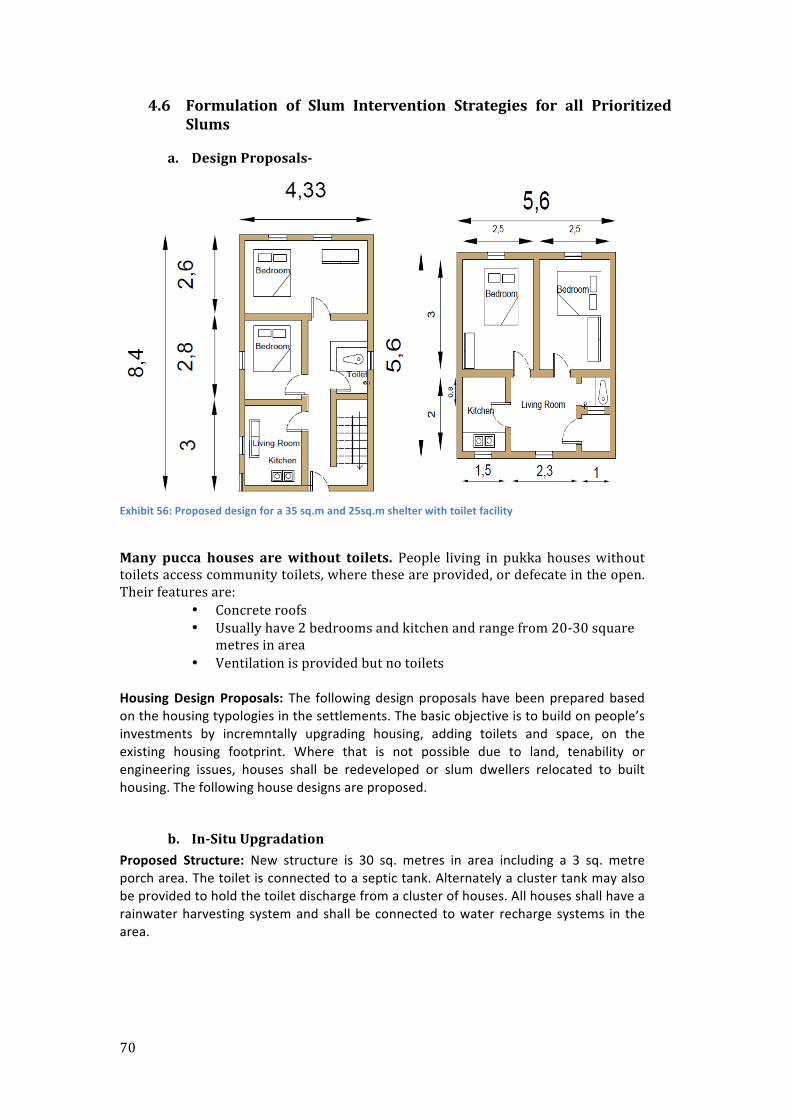
70
4.6 Formulation of Slum Intervention Strategies for all Prioritized Slums
a. Design Proposals-‐
Exhibit 56: Proposed design for a 35 sq.m and 25sq.m shelter with toilet facility
Many pucca houses are without toilets. People living in pukka houses without toilets access community toilets, where these are provided, or defecate in the open. Their features are:
• Concrete roofs • Usually have 2 bedrooms and kitchen and range from 20-‐30 square
metres in area • Ventilation is provided but no toilets
Housing Design Proposals: The following design proposals have been prepared based on the housing typologies in the settlements. The basic objective is to build on people’s investments by incremntally upgrading housing, adding toilets and space, on the existing housing footprint. Where that is not possible due to land, tenability or engineering issues, houses shall be redeveloped or slum dwellers relocated to built housing. The following house designs are proposed.
b. In-‐Situ Upgradation Proposed Structure: New structure is 30 sq. metres in area including a 3 sq. metre porch area. The toilet is connected to a septic tank. Alternately a cluster tank may also be provided to hold the toilet discharge from a cluster of houses. All houses shall have a rainwater harvesting system and shall be connected to water recharge systems in the area.
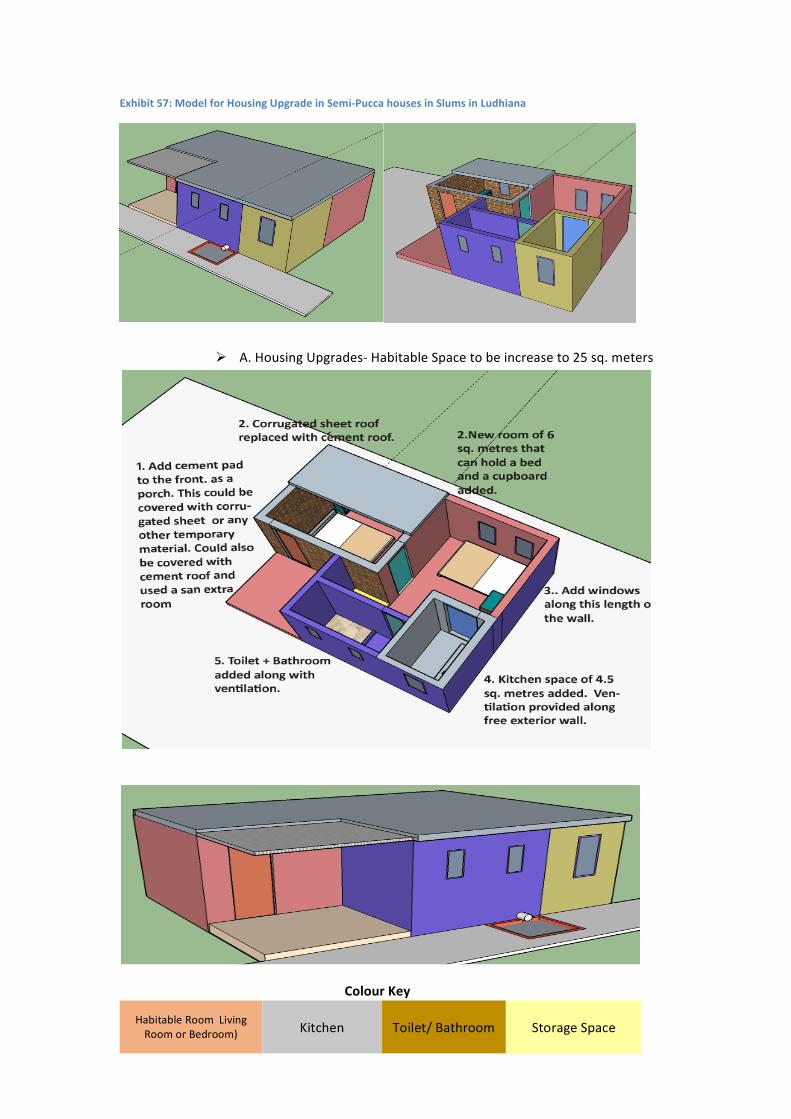
71
Exhibit 57: Model for Housing Upgrade in Semi-‐Pucca houses in Slums in Ludhiana
Ø A. Housing Upgrades-‐ Habitable Space to be increase to 25 sq. meters
Colour Key
Habitable Room Living Room or Bedroom) Kitchen Storage Space Toilet/ Bathroom
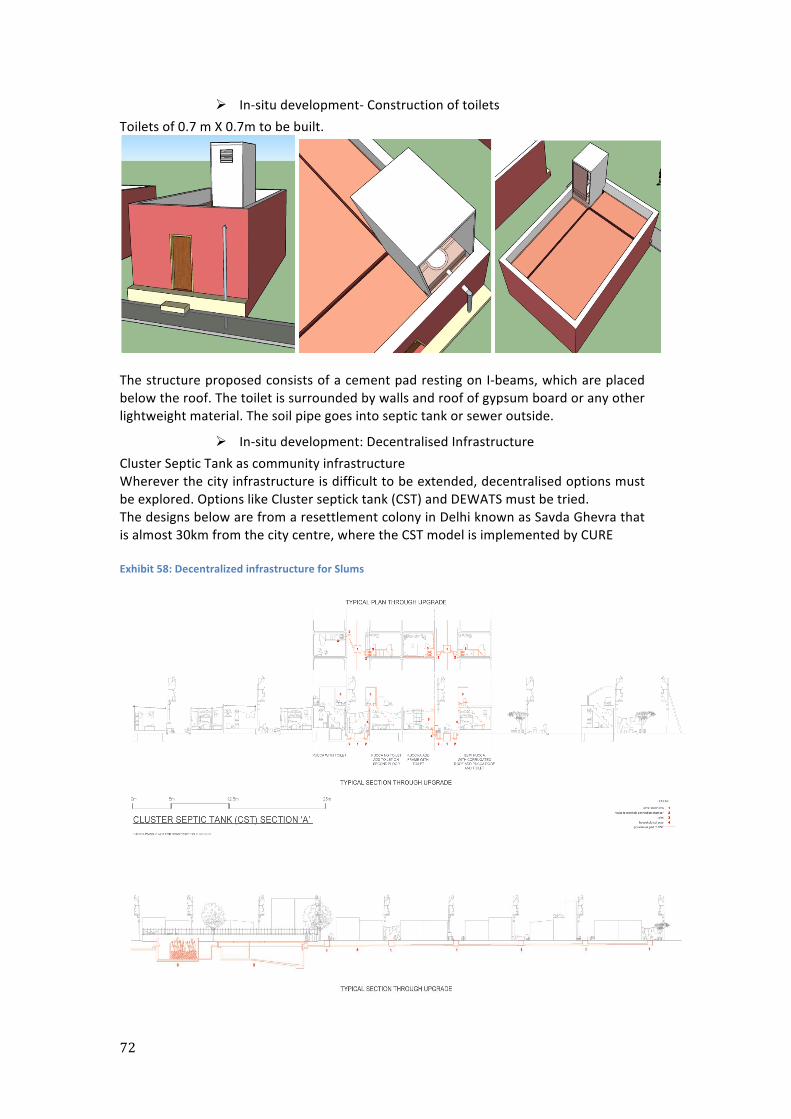
72
Ø In-‐situ development-‐ Construction of toilets Toilets of 0.7 m X 0.7m to be built.
The structure proposed consists of a cement pad resting on I-‐beams, which are placed below the roof. The toilet is surrounded by walls and roof of gypsum board or any other lightweight material. The soil pipe goes into septic tank or sewer outside.
Ø In-‐situ development: Decentralised Infrastructure Cluster Septic Tank as community infrastructure Wherever the city infrastructure is difficult to be extended, decentralised options must be explored. Options like Cluster septick tank (CST) and DEWATS must be tried. The designs below are from a resettlement colony in Delhi known as Savda Ghevra that is almost 30km from the city centre, where the CST model is implemented by CURE Exhibit 58: Decentralized infrastructure for Slums
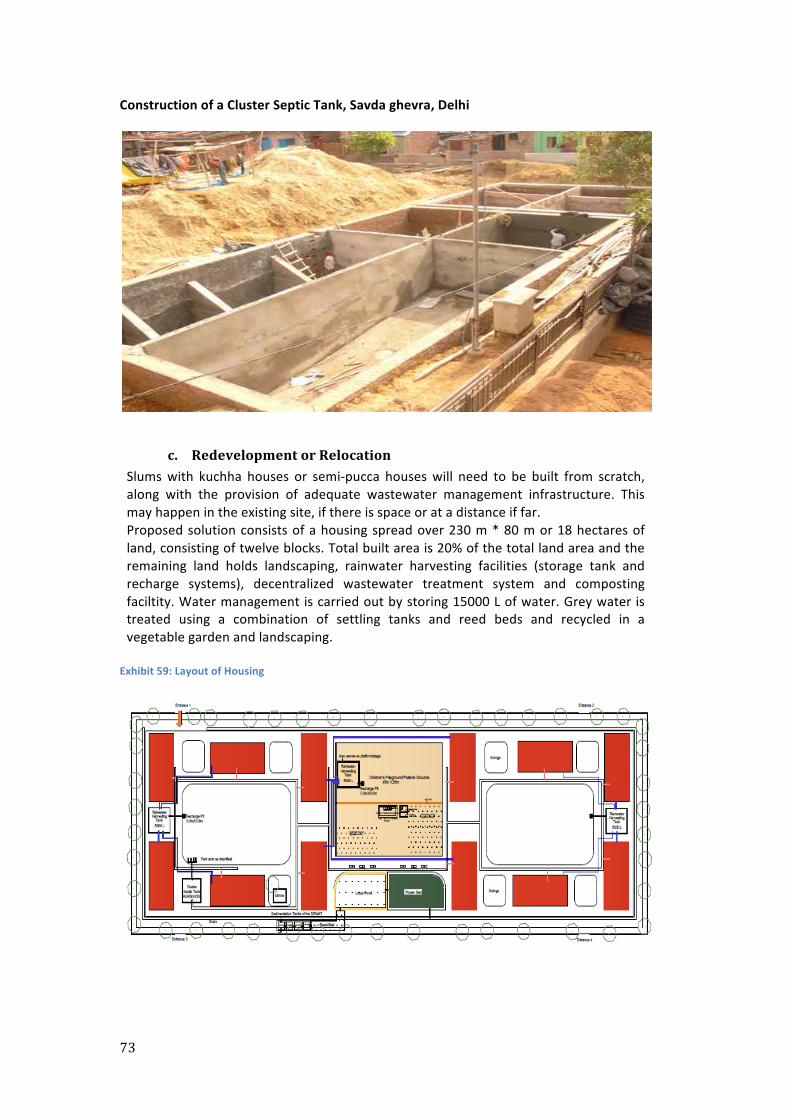
73
Construction of a Cluster Septic Tank, Savda ghevra, Delhi
c. Redevelopment or Relocation Slums with kuchha houses or semi-‐pucca houses will need to be built from scratch, along with the provision of adequate wastewater management infrastructure. This may happen in the existing site, if there is space or at a distance if far. Proposed solution consists of a housing spread over 230 m * 80 m or 18 hectares of land, consisting of twelve blocks. Total built area is 20% of the total land area and the remaining land holds landscaping, rainwater harvesting facilities (storage tank and recharge systems), decentralized wastewater treatment system and composting faciltity. Water management is carried out by storing 15000 L of water. Grey water is treated using a combination of settling tanks and reed beds and recycled in a vegetable garden and landscaping. Exhibit 59: Layout of Housing
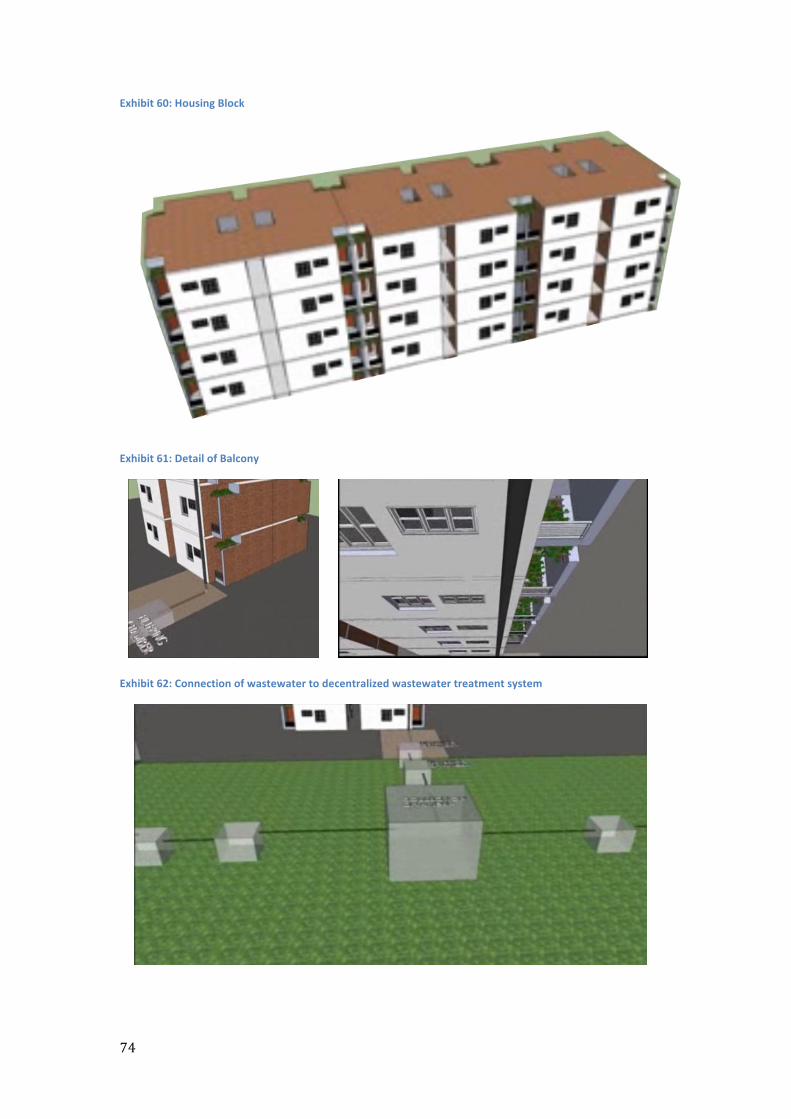
74
Exhibit 60: Housing Block
Exhibit 61: Detail of Balcony
Exhibit 62: Connection of wastewater to decentralized wastewater treatment system
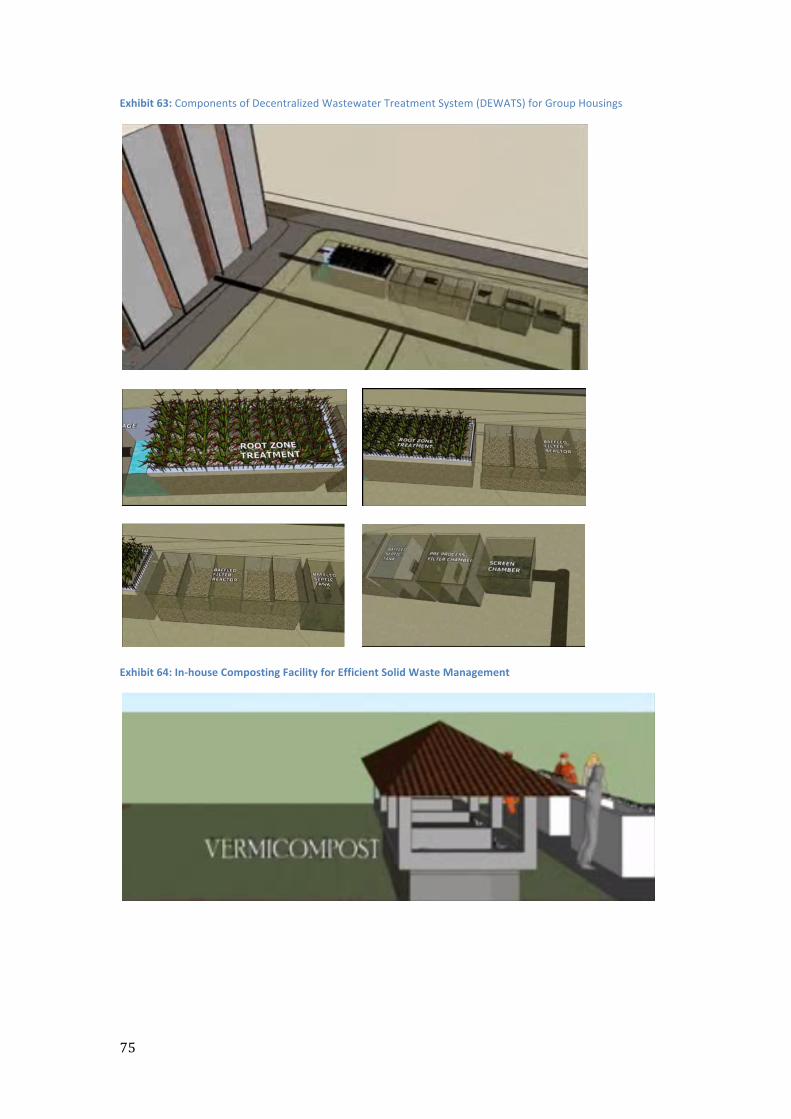
75
Exhibit 63: Components of Decentralized Wastewater Treatment System (DEWATS) for Group Housings
Exhibit 64: In-‐house Composting Facility for Efficient Solid Waste Management
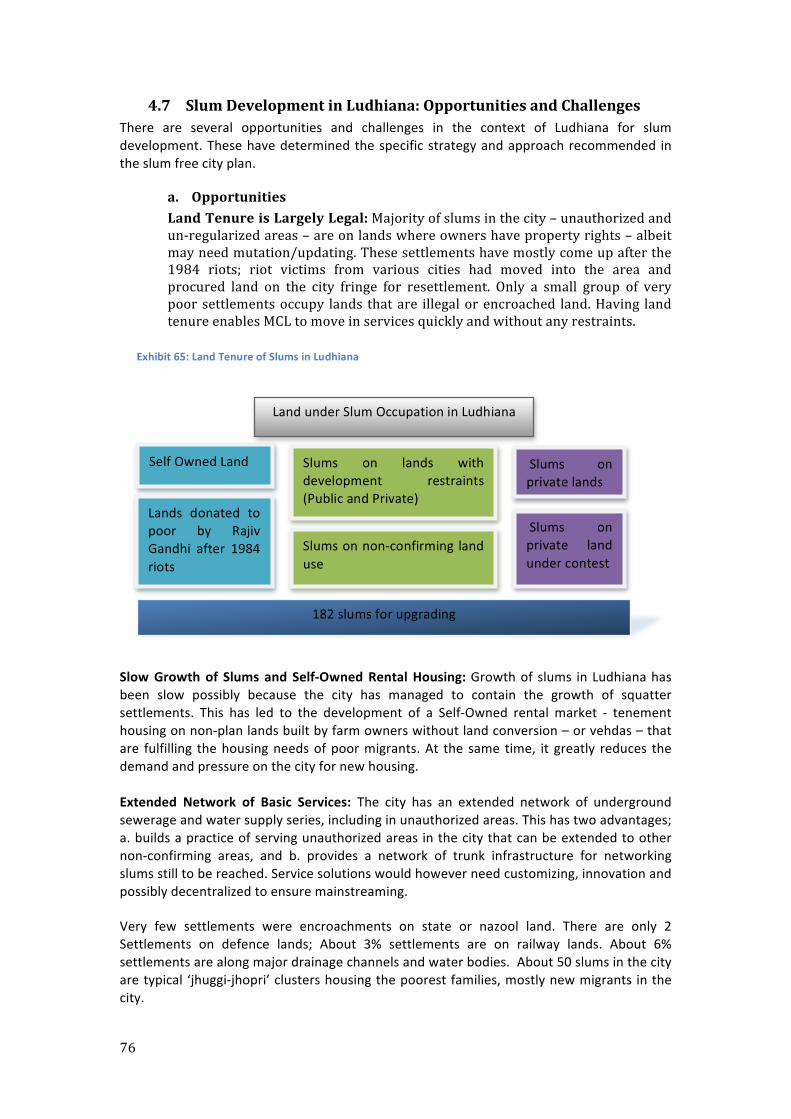
76
4.7 Slum Development in Ludhiana: Opportunities and Challenges There are several opportunities and challenges in the context of Ludhiana for slum development. These have determined the specific strategy and approach recommended in the slum free city plan.
a. Opportunities Land Tenure is Largely Legal: Majority of slums in the city – unauthorized and un-‐regularized areas – are on lands where owners have property rights – albeit may need mutation/updating. These settlements have mostly come up after the 1984 riots; riot victims from various cities had moved into the area and procured land on the city fringe for resettlement. Only a small group of very poor settlements occupy lands that are illegal or encroached land. Having land tenure enables MCL to move in services quickly and without any restraints.
Slow Growth of Slums and Self-‐Owned Rental Housing: Growth of slums in Ludhiana has been slow possibly because the city has managed to contain the growth of squatter settlements. This has led to the development of a Self-‐Owned rental market -‐ tenement housing on non-‐plan lands built by farm owners without land conversion – or vehdas – that are fulfilling the housing needs of poor migrants. At the same time, it greatly reduces the demand and pressure on the city for new housing. Extended Network of Basic Services: The city has an extended network of underground sewerage and water supply series, including in unauthorized areas. This has two advantages; a. builds a practice of serving unauthorized areas in the city that can be extended to other non-‐confirming areas, and b. provides a network of trunk infrastructure for networking slums still to be reached. Service solutions would however need customizing, innovation and possibly decentralized to ensure mainstreaming.
Very few settlements were encroachments on state or nazool land. There are only 2 Settlements on defence lands; About 3% settlements are on railway lands. About 6% settlements are along major drainage channels and water bodies. About 50 slums in the city are typical ‘jhuggi-‐jhopri’ clusters housing the poorest families, mostly new migrants in the city.
Self Owned Land
Land under Slum Occupation in Ludhiana
Lands donated to poor by Rajiv Gandhi after 1984 riots
182 slums for upgrading
Slums on lands with development restraints (Public and Private)
Slums on private lands
Slums on non-‐confirming land use
Slums on private land under contest
Exhibit 65: Land Tenure of Slums in Ludhiana
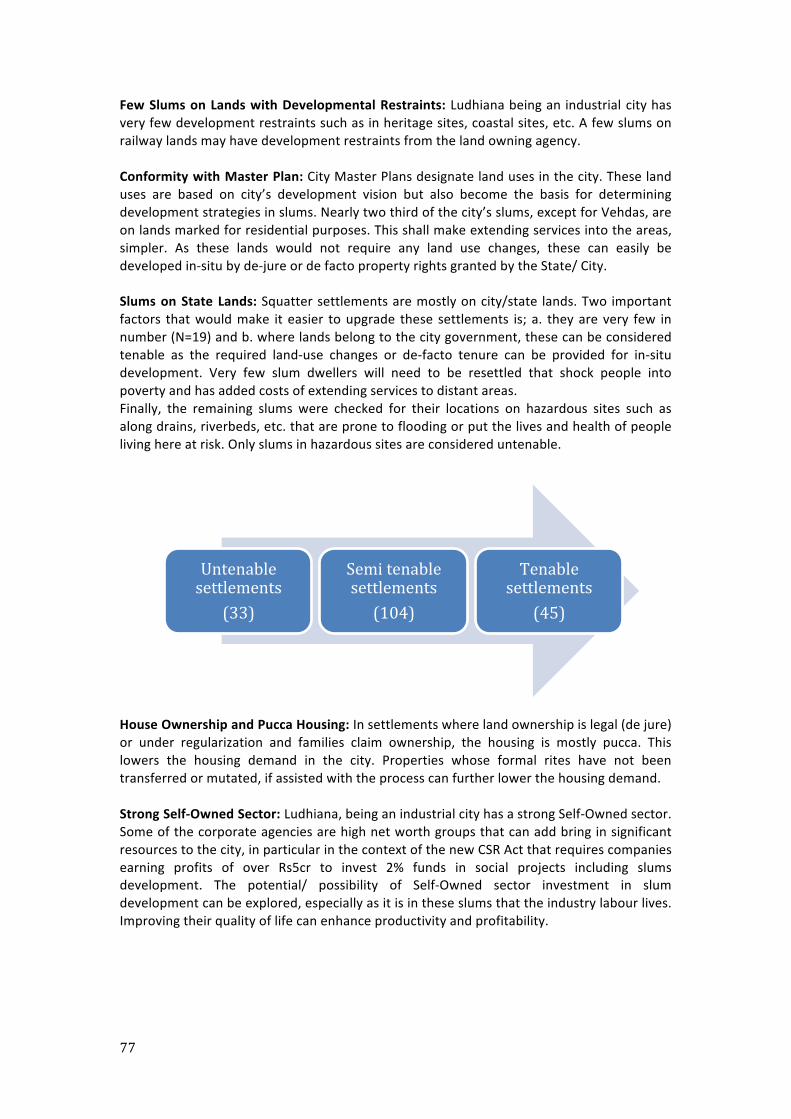
77
Few Slums on Lands with Developmental Restraints: Ludhiana being an industrial city has very few development restraints such as in heritage sites, coastal sites, etc. A few slums on railway lands may have development restraints from the land owning agency. Conformity with Master Plan: City Master Plans designate land uses in the city. These land uses are based on city’s development vision but also become the basis for determining development strategies in slums. Nearly two third of the city’s slums, except for Vehdas, are on lands marked for residential purposes. This shall make extending services into the areas, simpler. As these lands would not require any land use changes, these can easily be developed in-‐situ by de-‐jure or de facto property rights granted by the State/ City. Slums on State Lands: Squatter settlements are mostly on city/state lands. Two important factors that would make it easier to upgrade these settlements is; a. they are very few in number (N=19) and b. where lands belong to the city government, these can be considered tenable as the required land-‐use changes or de-‐facto tenure can be provided for in-‐situ development. Very few slum dwellers will need to be resettled that shock people into poverty and has added costs of extending services to distant areas. Finally, the remaining slums were checked for their locations on hazardous sites such as along drains, riverbeds, etc. that are prone to flooding or put the lives and health of people living here at risk. Only slums in hazardous sites are considered untenable.
House Ownership and Pucca Housing: In settlements where land ownership is legal (de jure) or under regularization and families claim ownership, the housing is mostly pucca. This lowers the housing demand in the city. Properties whose formal rites have not been transferred or mutated, if assisted with the process can further lower the housing demand. Strong Self-‐Owned Sector: Ludhiana, being an industrial city has a strong Self-‐Owned sector. Some of the corporate agencies are high net worth groups that can add bring in significant resources to the city, in particular in the context of the new CSR Act that requires companies earning profits of over Rs5cr to invest 2% funds in social projects including slums development. The potential/ possibility of Self-‐Owned sector investment in slum development can be explored, especially as it is in these slums that the industry labour lives. Improving their quality of life can enhance productivity and profitability.
Untenable settlements
(33)
Semi tenable settlements (104)
Tenable settlements
(45)
78
b. Challenges Despite the many opportunities in the city, there will be some challenges to making Ludhiana slum free. Some of these are;
Vehdas and Bye Laws: Four times Ludhiana’s poor live in vehdas, the Self-‐Ownedly supplied tenement housing (Veda N=850 versus Slum N= 182). There will be four key challenges to addressing the issue of vehdas; a. clear acceptance by the city that vehdas are slum areas – this will need broadening the definition of slums under the Act; b. Land use conversion from agricultural to urban lands – which will be politically challenging; c. bye laws will need to be developed to regularize the constructions; and d. provision for extension of services into Self-‐Owned lands would need to be approved. Lack of Resources: MCL lacks financial resources to implement slum-‐upgrading programmes at a city scale – even if that amounts to 10-‐20% contribution for various components. MCL would need to reimagine generation of funds in the city for slum development. Institutional Capacity: MCL is headed by an IAS officer and supported by two Additional Commissioner, also from the administrative cadres. There are also experienced engineers heading the various departments. This is indicative of the potential capacity of the local body. However, despite understanding of slum issues, solutions for development continue to be clichéd. This would need to be addressed through capacity building programmes and institutional simplification
79
5. Access to Basic Services in Slums of Ludhiana Ludhiana being the largest city of Punjab, an industrial and educational hub, has experienced a rapid growth in its population attracting people for work. This has led to a high demand in housing. In the absence of planned residential areas, many unplanned residential colonies and slums have come up in the city, which lack basic services, including rental areas called Vehdas. The failure of authorities to plan sufficient residential zones have forced people to buy properties in unplanned colonies and MCL is duty bound to provide basic infrastructure in these residential areas to improve their living standard. GOI has approved a DPR of Rs116.5crores for augmentation of water supply in peripheral areas of Ludhiana by providing 239kms of water pipelines, 79 deep tube wells and 25000 household connections. The L-‐SFCPOA seeks to provide water, sewer, drains, street lighting and roads in slum settlements. The provision of water and sewer will ensure that every household will get drinking water and toilet at home. Settlements shall have concrete roads with drains to ensure connectivity with the city. Lack of drainage causes cesspools that breed mosquitoes. Underground sewerage and drainage will improve health of residents.
5.1 Current need Assessment Of the 182 slum settlements in the city, 149 can be upgraded through in-‐house services. The remaining 28 are very small and have no pattern of roads and are not considered for networking. These settlements because of their sizes and absence of space shall be considered for near site relocation. Of the 149 settlements, 73 have 100% municipal water supply and 65, 100% sewer network. Only 13 settlements like Geeta, Ekjot, Fawda bend have all the services; water, sewer networks and pucca roads. Total length of roads in these colonies is 206.4 km.
a. Water Supply Source: At present there are 658 deep tube wells and 277 shallow tube wells yielding 490MLD of water. Due to over drawl/extraction of the ground water, the water table has gone down to a depth of 500 feet. Moreover, deep tube wells require more energy to pump out water. Low ground water table also causes contamination and deterioration in quality of ground water. This has led to serious water scarcity in the city and the people are dependent on hand pumps and bore wells for water. Even this water is insufficient and non-‐potable. Therefore, it is proposed that MC Ludhiana should make arrangements for canal-‐based water supply from the nearby Sirhind/Sidhwan canal that has adequate water. Inside the slums it is proposed to provide 100mm internal dia. DI pipes for water supply. These pipes shall connect with the existing main pipeline. Wherever the connection to main pipeline is not possible, it is proposed to provide deep tube wells to draw the water and connect these to small water treatment plants. The total cost incurred in providing water supply is Rs 9,63,16,336.00 at per unit cost of Rs.1275.00 per meter. A ten percent of total cost has been earmarked for external water connection/tube wells. Cost of DI pipe has been taken as Rs950.00 per meter.
80
b. Sewerage It is proposed to provide 200 mm internal dia. stoneware pipes for laying sewer in these colonies/slums. The network shall then be designed in such a way that the sewerage is discharged in the existing main trunk sewer. Household connections have been proposed with oblique junctions to reduce cost and due to space limitations. Wherever trunk sewer has not been laid it is proposed to provide septic tanks or small STPs subject to availability of space. Total cost of sewerage is Rs19,34,36,550.00 at Rs 1825.00 per meter. Cost of one meter SW pipe has been taken as Rs275.00 and manholes have been proposed at an interval of 20 meters. Slope of 1 in 280 is proposed for self-‐cleaning velocity.
c. Roads It is proposed to construct cement concrete (CC) roads of 3-‐meter average width in these colonies. The roads shall be designed to provide a single side camber with drains along one side. The total length in these colonies is 206.4 kms. Approximately 15 kms of pucca roads exists, and requires no additional reinstatement or relaying. Hence a total of 191.4 kms of road is to be constructed with a total cost of 54,17,04,429.00
d. Drainage The city of Ludhiana does not have a functional drainage system. Major drains are absent and there are no drains available alongside approach roads to the colonies. Therefore it is proposed to prepare a comprehensive plan for the city drainage integrating low-‐income colonies within. Since the colonies don’t have drainage system at present, it is proposed to provide RCC covered drains on one side of road. The total cost of providing drains in the slum colonies is Rs. 52,72,32,258.00 at per unit cost of Rs.2912 per meter. It is to be noted that the drains are calculated for 80% of the total road length. Wherever connection to a major drain is not possible, the drainage is proposed to be channelised into recharging pits and rainwater harvesting structures.
e. Streetlights Since most of these colonies are already having partial streetlight arrangement, it is proposed that approximately 40% of the total roads would need additional street lighting. It is proposed to provide galvanized octagonal 3mm thick 9-‐meter long poles with 150-‐watt street light luminaries and HDPE (DWC) 63/50mm pipes for laying conductors. The cost has been calculated at 20lacs per km with a total estimated cost to provide streetlights at 16,54,87,520.00.
f. Housing Requirements for housing have been estimated for all settlements in Ludhiana and are provided in the following table. Total number of semi pucca constructions that would require upgrading is given in the following table. There are also nearly 10000 renter households that shall also be provided access to housing under the housing programme through non-‐subsidised, rental or hire-‐purchase housing, especially as most renter are likely to be poorer than the land lords and or new migrants to the city. Kuchha and Semi Pucca houses to be upgraded in-‐situ development
Houses to be resettled
Pucca houses without toilets
Dilapidated Houses
Houses for renter families
81
Ø Cost of Housing The average cost of housing developed in Ludhiana under BSUP for 2-‐bedroom flats with a kitchen, toilet, and bath is Rs.3 lakhs and there has been no element of cost or interest subsidy. At current rates, the average cost of construction is approximately Rs.1200per sq. foot. Accordingly the cost of construction for a single dwelling unit of size 250 sq. ft. with a toilet, bath and kitchen without cost of land would be Rs.300000.
Ø Cost of Land for Housing In-‐situ Upgrading: In-‐situ up grading, where people already own land, shall have no land costs. However, bringing in services to the area shall require funds. The lowest prevailing cost of land development in Ludhiana is Rs.6000 per sq. meter, which has been applied. Relocation: Land procurement costs for a 30 sq. meter plot is estimated at Rs.150000 while total cost of construction of a 30 sq meter dwelling unit at current price is estimated to be Rs.300000, @ Rs.12000/-‐ per sq. meter. Thus the total cost of a dwelling unit of 30 sq. meters with land procurement and built in single-‐storey construction would be an estimated Rs. 4.5 lakh. To make housing affordable without compromising the housing quality and structural safety, it can be developed in multi-‐level structures to lower land costs. The city’s Byelaws permit construction of ground plus three or four storey constructions. For 4-‐storeyed flats, the shared land costs would reduce from Rs.150000/-‐for a single-‐storey building to Rs.37500 per unit and the cost of a flat would be Rs.337500 each. If the city decides to increase the numbers of storeys for EWS and RAY housing to 6-‐stories, the shared land costs would drop further to Rs.25000 per unit, bringing down the cost of house to Rs.325000 each.
5.2 Future Need Assessment: Ludhiana has a high annual inflow of new migrants. While many rent Vehdas – Self-‐Owned rental housing – others end up in slums. It is estimated that Ludhiana sees an average annual inflow migrants at 6.5%; of these 5.5% will need housing with basic services. Over the 10-‐year period envisaged for making Ludhiana slum free, the future need of housing shall be 38000 dwelling units (DUs). It is envisaged that part of this future need shall be met through Vehdas, which shall reduce the need for MCL to procure additional land. However, MCL shall need to invest in extending basic infrastructure to Vehdas to ensure these buildings do not become slummy. Total Need Assessment (Demand for Housing and Services) for Citywide Slum Development Based on the above premises, the total demand for housing and services or a ‘Slum-‐free Ludhiana’ in the next 10 years is as follows. Based on the above estimates for housing -‐ in-‐situ upgrading, relocation and new housing with urban services is provided below.
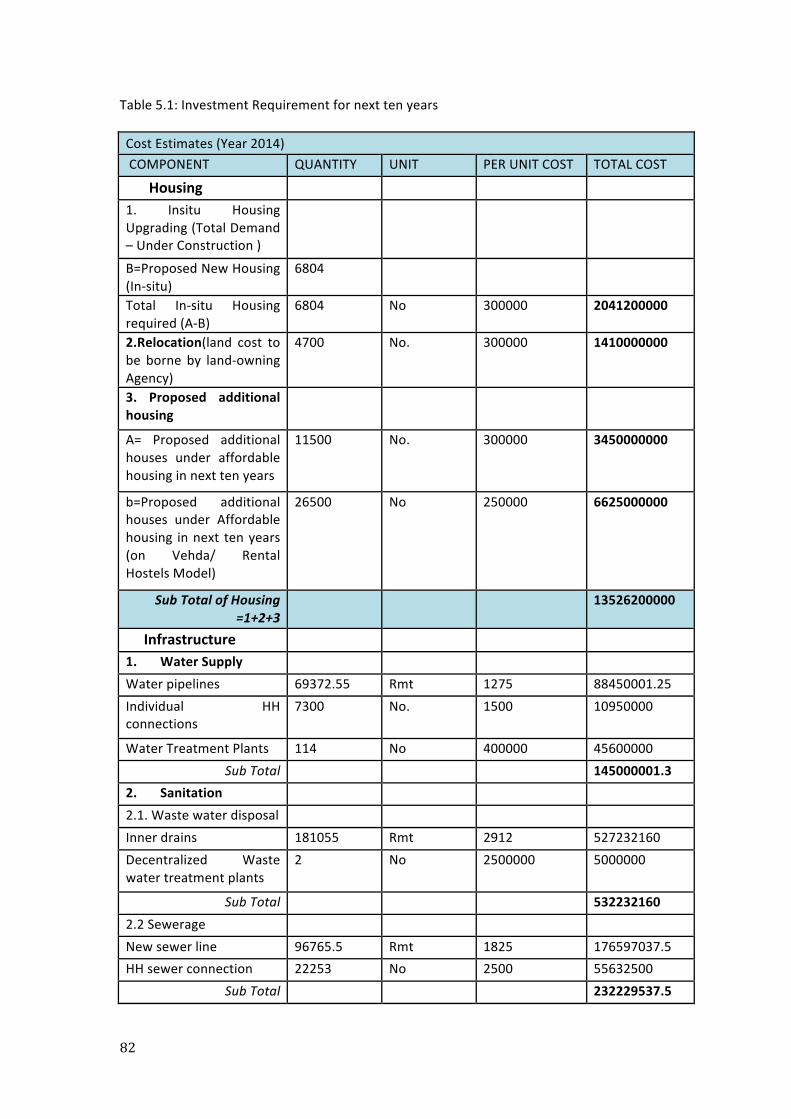
82
Table 5.1: Investment Requirement for next ten years Cost Estimates (Year 2014) COMPONENT QUANTITY UNIT PER UNIT COST TOTAL COST
Housing
1. Insitu Housing Upgrading (Total Demand – Under Construction )
B=Proposed New Housing (In-‐situ)
6804
Total In-‐situ Housing required (A-‐B)
6804 No 300000 2041200000
2.Relocation(land cost to be borne by land-‐owning Agency)
4700 No. 300000 1410000000
3. Proposed additional housing
A= Proposed additional houses under affordable housing in next ten years
11500 No. 300000 3450000000
b=Proposed additional houses under Affordable housing in next ten years (on Vehda/ Rental Hostels Model)
26500 No 250000 6625000000
Sub Total of Housing =1+2+3
13526200000
Infrastructure 1. Water Supply Water pipelines 69372.55 Rmt 1275 88450001.25 Individual HH connections
7300 No. 1500 10950000
Water Treatment Plants 114 No 400000 45600000 Sub Total 145000001.3
2. Sanitation 2.1. Waste water disposal Inner drains 181055 Rmt 2912 527232160 Decentralized Waste water treatment plants
2 No 2500000 5000000
Sub Total 532232160 2.2 Sewerage New sewer line 96765.5 Rmt 1825 176597037.5 HH sewer connection 22253 No 2500 55632500
Sub Total 232229537.5
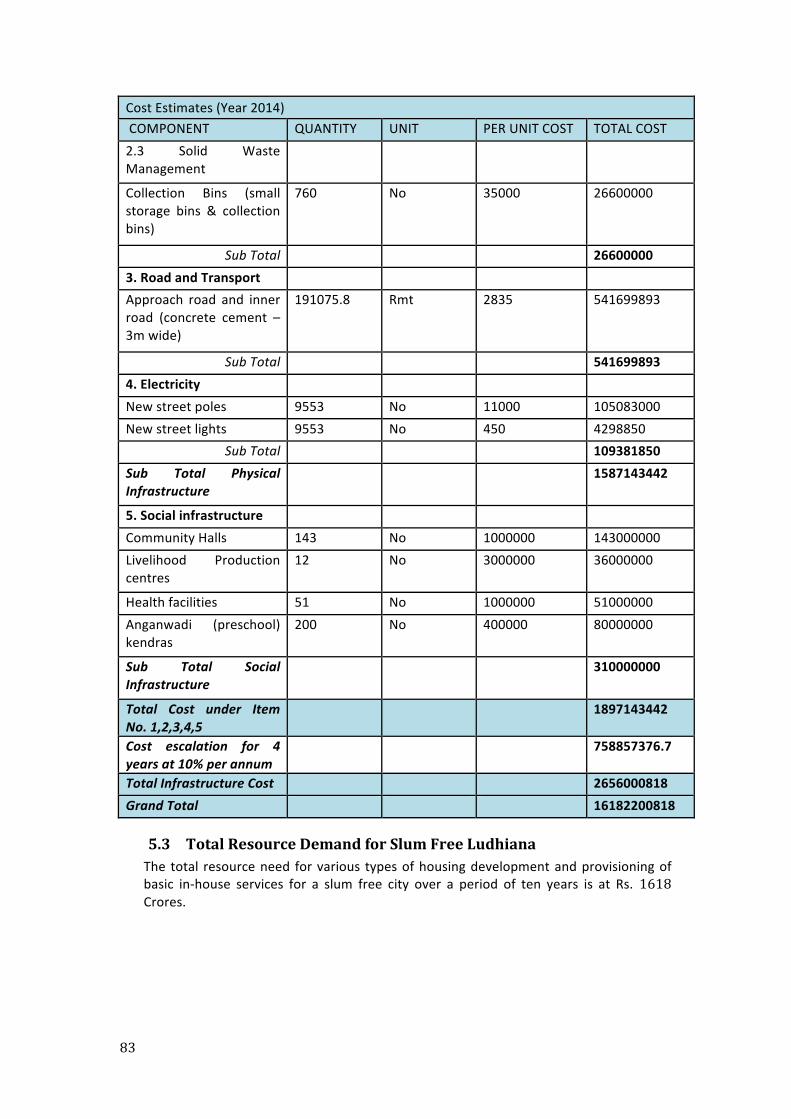
83
Cost Estimates (Year 2014) COMPONENT QUANTITY UNIT PER UNIT COST TOTAL COST 2.3 Solid Waste Management
Collection Bins (small storage bins & collection bins)
760 No 35000 26600000
Sub Total 26600000 3. Road and Transport Approach road and inner road (concrete cement – 3m wide)
191075.8 Rmt 2835 541699893
Sub Total 541699893 4. Electricity New street poles 9553 No 11000 105083000 New street lights 9553 No 450 4298850
Sub Total 109381850 Sub Total Physical Infrastructure
1587143442
5. Social infrastructure Community Halls 143 No 1000000 143000000 Livelihood Production centres
12 No 3000000 36000000
Health facilities 51 No 1000000 51000000 Anganwadi (preschool) kendras
200 No 400000 80000000
Sub Total Social Infrastructure
310000000
Total Cost under Item No. 1,2,3,4,5
1897143442
Cost escalation for 4 years at 10% per annum
758857376.7
Total Infrastructure Cost 2656000818 Grand Total 16182200818
5.3 Total Resource Demand for Slum Free Ludhiana The total resource need for various types of housing development and provisioning of basic in-‐house services for a slum free city over a period of ten years is at Rs. 1618 Crores.
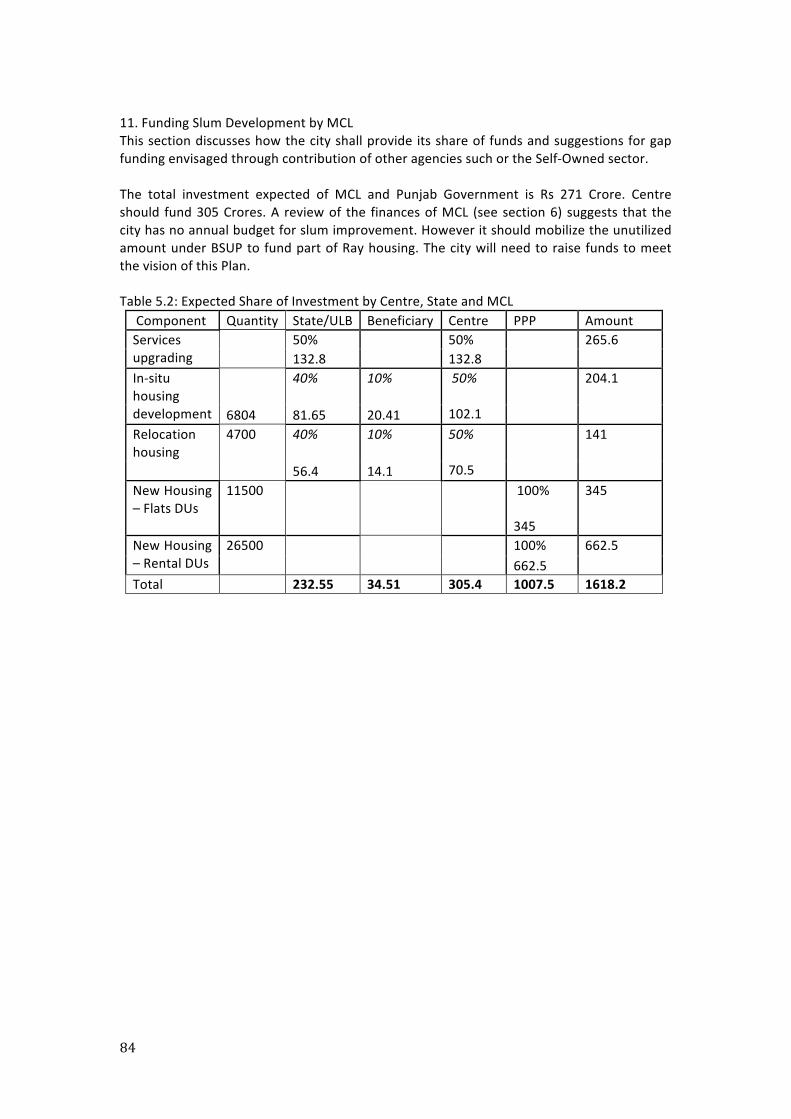
84
11. Funding Slum Development by MCL This section discusses how the city shall provide its share of funds and suggestions for gap funding envisaged through contribution of other agencies such or the Self-‐Owned sector. The total investment expected of MCL and Punjab Government is Rs 271 Crore. Centre should fund 305 Crores. A review of the finances of MCL (see section 6) suggests that the city has no annual budget for slum improvement. However it should mobilize the unutilized amount under BSUP to fund part of Ray housing. The city will need to raise funds to meet the vision of this Plan. Table 5.2: Expected Share of Investment by Centre, State and MCL Component Quantity State/ULB Beneficiary Centre PPP Amount Services upgrading
50% 50% 265.6 132.8 132.8
In-‐situ housing development
40%
10% 50% 102.1
204.1
6804 81.65 20.41 Relocation housing
4700 40%
10% 50% 70.5
141
56.4 14.1 New Housing – Flats DUs
11500
100% 345
345
New Housing – Rental DUs
26500 100% 662.5 662.5
Total 232.55 34.51 305.4 1007.5 1618.2
85
6. Implementation Plan
Phasing of Interventions by Prioritization of Slums Slum upgrading in the city shall be implemented in a phased manner. Based on the prioritization matrix the phasing and proposed intervention strategy has been determined. Phase 1 Slums shall include:
Ø Tenable
Ø Less vulnerable slums
Ø All slums with clear property titles,
Ø Slums that are mostly upgraded under various development schemes and can be fully upgraded and de-‐notified,
Ø Slums with easy access to trunk infrastructure and technical feasibility for connecting to main trunk lines, and
Ø Slums with strong community groups ready to partner in the process of slum development, and
Ø Semi tenable/untenable
Ø Most vulnerable
Ø Slums to be relocated (on Central Government -‐ Railway/Defence lands) Phase 2 Slums shall include:
Ø Tenable
Ø More Vulnerable Slums
Ø All slums with de facto property titles that need to be regularised
Ø All slums which need expansion of city basic infrastructure
Ø Semi tenable
Ø Slums including vehdas not conforming to City Master Plan
Ø Slums located on State Government lands
Ø Slums to be redeveloped/relocated/resettled Phase 3 Slums shall cover:
Ø Tenable
Ø All slums with technical difficulties to connect to trunk infrastructure and can only be served by decentralized /dedicated systems such as in the peri-‐urban, and
Ø Slums not covered in the above phases due to various socio-‐political reasons
Ø Semi tenable
Ø Slums to be redeveloped/relocated/resettled
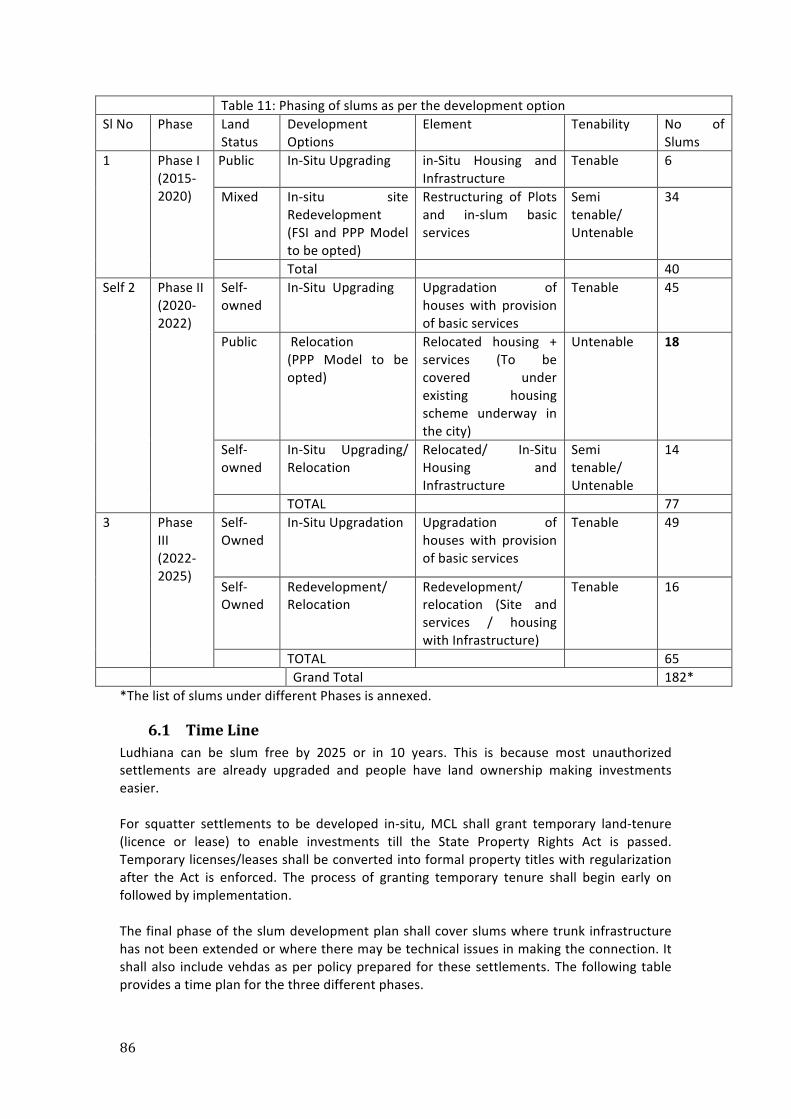
86
Table 11: Phasing of slums as per the development option Sl No Phase Land
Status Development Options
Element Tenability No of Slums
1 Phase I (2015-‐2020)
Public In-‐Situ Upgrading in-‐Situ Housing and Infrastructure
Tenable 6
Mixed In-‐situ site Redevelopment (FSI and PPP Model to be opted)
Restructuring of Plots and in-‐slum basic services
Semi tenable/ Untenable
34
Total 40 Self 2 Phase II
(2020-‐2022)
Self-‐owned
In-‐Situ Upgrading Upgradation of houses with provision of basic services
Tenable 45
Public Relocation (PPP Model to be opted)
Relocated housing + services (To be covered under existing housing scheme underway in the city)
Untenable 18
Self-‐owned
In-‐Situ Upgrading/ Relocation
Relocated/ In-‐Situ Housing and Infrastructure
Semi tenable/ Untenable
14
TOTAL 77 3 Phase
III (2022-‐2025)
Self-‐Owned
In-‐Situ Upgradation Upgradation of houses with provision of basic services
Tenable 49
Self-‐Owned
Redevelopment/ Relocation
Redevelopment/ relocation (Site and services / housing with Infrastructure)
Tenable 16
TOTAL 65 Grand Total 182*
*The list of slums under different Phases is annexed.
6.1 Time Line Ludhiana can be slum free by 2025 or in 10 years. This is because most unauthorized settlements are already upgraded and people have land ownership making investments easier. For squatter settlements to be developed in-‐situ, MCL shall grant temporary land-‐tenure (licence or lease) to enable investments till the State Property Rights Act is passed. Temporary licenses/leases shall be converted into formal property titles with regularization after the Act is enforced. The process of granting temporary tenure shall begin early on followed by implementation. The final phase of the slum development plan shall cover slums where trunk infrastructure has not been extended or where there may be technical issues in making the connection. It shall also include vehdas as per policy prepared for these settlements. The following table provides a time plan for the three different phases.
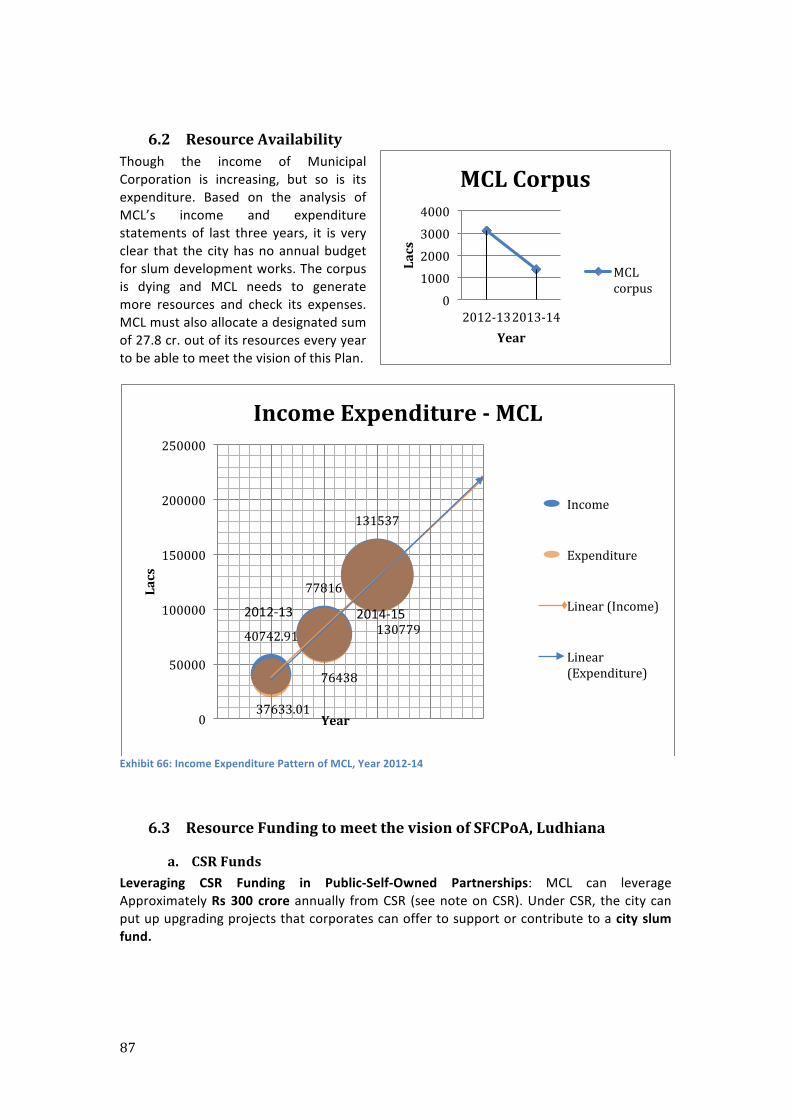
87
6.2 Resource Availability Though the income of Municipal Corporation is increasing, but so is its expenditure. Based on the analysis of MCL’s income and expenditure statements of last three years, it is very clear that the city has no annual budget for slum development works. The corpus is dying and MCL needs to generate more resources and check its expenses. MCL must also allocate a designated sum of 27.8 cr. out of its resources every year to be able to meet the vision of this Plan.
Exhibit 66: Income Expenditure Pattern of MCL, Year 2012-‐14
6.3 Resource Funding to meet the vision of SFCPoA, Ludhiana
a. CSR Funds Leveraging CSR Funding in Public-‐Self-‐Owned Partnerships: MCL can leverage Approximately Rs 300 crore annually from CSR (see note on CSR). Under CSR, the city can put up upgrading projects that corporates can offer to support or contribute to a city slum fund.
40742.91
77816
131537
37633.01
76438
130779
0
50000
100000
150000
200000
250000
Lacs
Year
Income Expenditure -‐ MCL
Income
Expenditure
Linear (Income)
Linear (Expenditure)
0
1000
2000
3000
4000
2012-‐13 2013-‐14
Lacs
Year
MCL Corpus
MCL corpus
2012-‐13 2014-‐15
88
A brief note on Corporate Social Responsibility for Ludhiana Corporate Social Responsibility or CSR is essentially a form of corporate self-‐regulation integrated into a business model. Over time in India it is has transformed from corporations’ implementing businesses with social responsibility to businesses contributing resources to bring about an overall positive impact on the communities, cultures, societies and environments in which they operate and that not only state but corporates too should be responsible for addressing social issues, especially as the growth of an industry impacts the environment and people that work in it. The Ministry of Corporate Affairs (MCA) had in 2009, introduced the concept of voluntary contribution under its Corporate Social Responsibility Voluntary Guidelines. In 2013, these guidelines have been incorporated within the Companies Act and have obtained legal sanctity. The Act provides that every company having a net worth of 500 crore INR, or more or a turnover of 1000 crore INR or more, or a net profit of five crore INR or more, during any financial year must spend part of its profits for social development. Companies that have been earning a profit of Rs.5crore annually for 3 years must constitute a corporate social responsibility committee from the board and mandatorily spend a minimum 2% of their average profits on CSR related activities. The CSR committee is to comprise three or more directors from the Board, out of which, at least one should be an independent director and to report its constitution in the annual report. The CSR committee is required to formulate the policy, which could cover a range of activities such as slum development, eradicating extreme hunger and poverty, promotion of education, promoting gender equality and empowering women, reducing child mortality and improving maternal health, combating diseases, ensuring environmental sustainability, employment enhancing vocational skills, social business projects and/or contribute to the Prime Minister’s national relief fund or any other fund set-‐up by the central or state governments for socio-‐economic development, relief, welfare of the scheduled castes and tribes, other backward classes, minorities and women etc. For now, corporate houses are in the process of comprehensively integrating the concept throughout their business operations and processes and to identify niche sectors for investments that will protect their goodwill and reputation and defend business competitiveness. Companies are setting aside budgets to fund development projects in various sectors of education, environment, healthcare etc. Corporates are also increasingly joining hands with Non-‐governmental organizations (NGOs) and using their expertise in devising programs, which address wider social problems – making a major shift from defensive, charitable and promotional CSR to strategic and transformative investments designed to tackle the root cause of inequality and unsustainability. Industrial Profile Of Ludhiana: Ludhiana is a hub of industry. According to a Brief Industrial Profile of District Ludhiana published by the Government of India in the year 2009-‐10, the industry in the city grew by Rs. 1183.78 Lakhs in production and Rs. 705.04 lakhs increase in investment. It also generated 790 persons employment. These figures suggest that Ludhiana productivity is slowing down. In Ludhiana there are 116 Large & Medium Scale Enterprises/PSUs (Annex.1) of which the major exportable item industry sectors are given below. 1. Textile Products 2. Cycle Parts 3. Auto Parts 4. Hand Tools Milk Products 5. Agriculture Implements 6. Fasteners 7. Milk Products 8. Food Products 9. Electronic Items 10. Vehicle Parts 11. Sewing Machines 12.Knitting Machines 13. Yarns & Textiles 14. Sport Goods
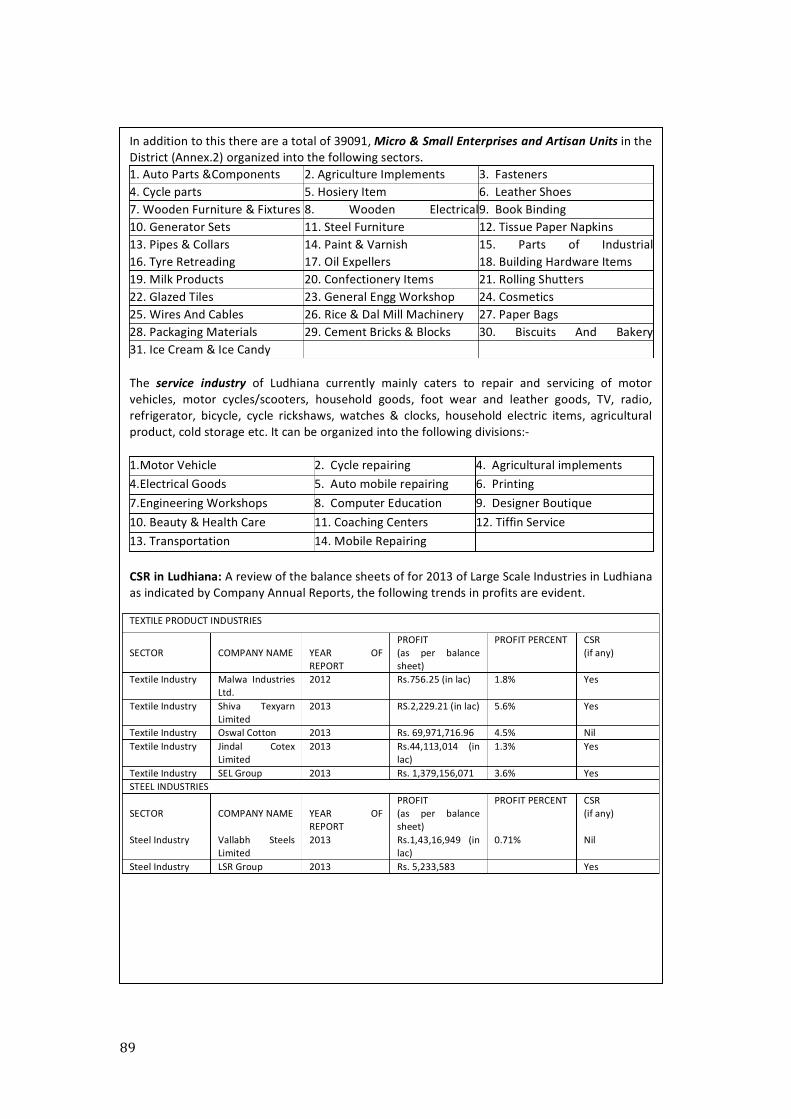
89
In addition to this there are a total of 39091, Micro & Small Enterprises and Artisan Units in the District (Annex.2) organized into the following sectors. 1. Auto Parts &Components 2. Agriculture Implements 3. Fasteners 4. Cycle parts 5. Hosiery Item 6. Leather Shoes 7. Wooden Furniture & Fixtures 8. Wooden Electrical
Accessories 9. Book Binding
10. Generator Sets 11. Steel Furniture 12. Tissue Paper Napkins 13. Pipes & Collars 14. Paint & Varnish 15. Parts of Industrial
Machinery 16. Tyre Retreading 17. Oil Expellers 18. Building Hardware Items 19. Milk Products 20. Confectionery Items 21. Rolling Shutters 22. Glazed Tiles 23. General Engg Workshop 24. Cosmetics 25. Wires And Cables 26. Rice & Dal Mill Machinery 27. Paper Bags 28. Packaging Materials 29. Cement Bricks & Blocks 30. Biscuits And Bakery
Products 31. Ice Cream & Ice Candy The service industry of Ludhiana currently mainly caters to repair and servicing of motor vehicles, motor cycles/scooters, household goods, foot wear and leather goods, TV, radio, refrigerator, bicycle, cycle rickshaws, watches & clocks, household electric items, agricultural product, cold storage etc. It can be organized into the following divisions:-‐ 1.Motor Vehicle 2. Cycle repairing 4. Agricultural implements 4.Electrical Goods 5. Auto mobile repairing 6. Printing 7.Engineering Workshops 8. Computer Education 9. Designer Boutique 10. Beauty & Health Care 11. Coaching Centers 12. Tiffin Service 13. Transportation 14. Mobile Repairing CSR in Ludhiana: A review of the balance sheets of for 2013 of Large Scale Industries in Ludhiana as indicated by Company Annual Reports, the following trends in profits are evident. TEXTILE PRODUCT INDUSTRIES
SECTOR
COMPANY NAME
YEAR OF REPORT
PROFIT (as per balance sheet)
PROFIT PERCENT CSR (if any)
Textile Industry Malwa Industries Ltd.
2012 Rs.756.25 (in lac) 1.8% Yes
Textile Industry Shiva Texyarn Limited
2013 RS.2,229.21 (in lac) 5.6% Yes
Textile Industry Oswal Cotton 2013 Rs. 69,971,716.96 4.5% Nil Textile Industry Jindal Cotex
Limited 2013 Rs.44,113,014 (in
lac) 1.3% Yes
Textile Industry SEL Group 2013 Rs. 1,379,156,071 3.6% Yes STEEL INDUSTRIES SECTOR
COMPANY NAME
YEAR OF REPORT
PROFIT (as per balance sheet)
PROFIT PERCENT CSR (if any)
Steel Industry Vallabh Steels Limited
2013 Rs.1,43,16,949 (in lac)
0.71% Nil
Steel Industry LSR Group 2013 Rs. 5,233,583 Yes
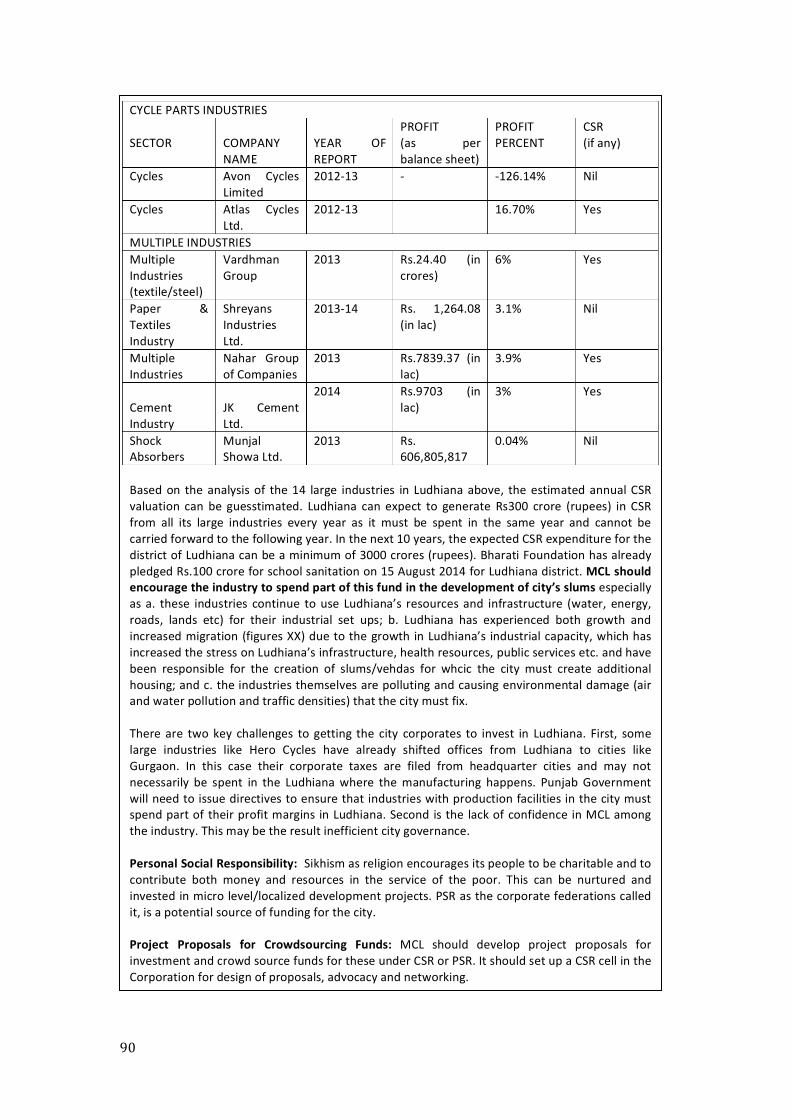
90
CYCLE PARTS INDUSTRIES SECTOR
COMPANY NAME
YEAR OF REPORT
PROFIT (as per balance sheet)
PROFIT PERCENT
CSR (if any)
Cycles Avon Cycles Limited
2012-‐13 -‐ -‐126.14% Nil
Cycles Atlas Cycles Ltd.
2012-‐13 16.70% Yes
MULTIPLE INDUSTRIES Multiple Industries (textile/steel)
Vardhman Group
2013 Rs.24.40 (in crores)
6% Yes
Paper & Textiles Industry
Shreyans Industries Ltd.
2013-‐14 Rs. 1,264.08 (in lac)
3.1% Nil
Multiple Industries
Nahar Group of Companies
2013 Rs.7839.37 (in lac)
3.9% Yes
Cement Industry
JK Cement Ltd.
2014 Rs.9703 (in lac)
3% Yes
Shock Absorbers
Munjal Showa Ltd.
2013 Rs. 606,805,817
0.04% Nil
Based on the analysis of the 14 large industries in Ludhiana above, the estimated annual CSR valuation can be guesstimated. Ludhiana can expect to generate Rs300 crore (rupees) in CSR from all its large industries every year as it must be spent in the same year and cannot be carried forward to the following year. In the next 10 years, the expected CSR expenditure for the district of Ludhiana can be a minimum of 3000 crores (rupees). Bharati Foundation has already pledged Rs.100 crore for school sanitation on 15 August 2014 for Ludhiana district. MCL should encourage the industry to spend part of this fund in the development of city’s slums especially as a. these industries continue to use Ludhiana’s resources and infrastructure (water, energy, roads, lands etc) for their industrial set ups; b. Ludhiana has experienced both growth and increased migration (figures XX) due to the growth in Ludhiana’s industrial capacity, which has increased the stress on Ludhiana’s infrastructure, health resources, public services etc. and have been responsible for the creation of slums/vehdas for whcic the city must create additional housing; and c. the industries themselves are polluting and causing environmental damage (air and water pollution and traffic densities) that the city must fix. There are two key challenges to getting the city corporates to invest in Ludhiana. First, some large industries like Hero Cycles have already shifted offices from Ludhiana to cities like Gurgaon. In this case their corporate taxes are filed from headquarter cities and may not necessarily be spent in the Ludhiana where the manufacturing happens. Punjab Government will need to issue directives to ensure that industries with production facilities in the city must spend part of their profit margins in Ludhiana. Second is the lack of confidence in MCL among the industry. This may be the result inefficient city governance. Personal Social Responsibility: Sikhism as religion encourages its people to be charitable and to contribute both money and resources in the service of the poor. This can be nurtured and invested in micro level/localized development projects. PSR as the corporate federations called it, is a potential source of funding for the city. Project Proposals for Crowdsourcing Funds: MCL should develop project proposals for investment and crowd source funds for these under CSR or PSR. It should set up a CSR cell in the Corporation for design of proposals, advocacy and networking.
91
b. Housing Credit Fund MCL could also consider setting up a Housing Credit Fund as a Revolving Fund. This could be capitalized out of the RAY funding and/or by setting aside 25% ULB revenue income each year and transferring it into the HC Revolving Fund. The initial receipts may be kept in a interest earning Bank Account to earn interest @ 9% per annum.
c. PPP Arrangements MCL can also enter into PPP arrangements in two ways. One where Self-‐Owned builders construct flats on part of the land, using the remaining land to develop high-‐income housing or commercial flats sold Self-‐Ownedly to finance the low-‐income housing. Two, where the builder builds affordable houses on procured lands, and the city creates an enabling environment for this to happen. PPP arrangements of the first type shall work only in core city areas with high commercial prospects or with changes in FAR policies that allow additional coverage or Transfer of Development Rights (TDRs) or tax incentives or land allotments at lower rates. In the second scenario, the city can help the Self-‐Owned builders with land acquisition, speedier sanctions of projects, etc. In both models, houses shall be provided at fixed concessional rates or subsidy as provided under RAY.
d. Housing Finance Options For beneficiary contribution, the city would need to ensure access to housing finance. As mentioned above, people owning lands can access home loans from banks/ housing finance institutions. The city can work with the banks to provide loans on concessional interest rates as prescribed for EWS housing on providing their land as security. As unauthorized colonies reportedly have housing land ownership, many residents can avail of this facility. Other poor (in squatter settlements) can be assisted to form Thrift and Credit Societies and lend to members to raise the 10-‐12% contribution or fill the savings gap. However, because of the small amounts of money saved by the groups, members may not be able to access large loans for housing and would need to get connected to Housing Microfinance institutions. The common terms and conditions for advancing housing loans by these banks/financial institutions are given in Annexure 3.The institutions providing housing loans are briefly stated in Table 11. Where these are Self-‐Owned equities, MCL shall regulate these closely. Group Housing Societies can raise construction costs by mortgaging land to the financial institution while taking loan and where all households enter into repayment arrangements through paying for the house. They shall however need technical assistance for construction purposes. The State Government must pass the Act on vesting ownership rights of land in the slum-‐dwellers. This shall help households to avail low-‐cost loans from banks/financial institutions. They must also consider housing for migrant households who have made the city their home for long years.
92
e. Group housing societies of slum-‐dwellers Co-‐operative group housing societies of slum-‐dwellers could be assisted with access to loans for payment of land costs and construction of housing. While in the first three cases, the demand for resources shall remain unaltered, in the fourth scenario the poor shall have to put together the entire cost of land and construction, which may be difficult to afford unless credit is provided at low-‐interest.
f. Rental Housing or Housing on Hire Purchase Houses developed for new migrants can be made available on hire purchase or rent, especially as these would be non-‐residents. This would enable cities to, over a period of time, recover the costs of developing these houses. Although the houses shall be non-‐subsidized, the repayments shall be kept affordable. There may be several approaches to financing these houses; new migrants could be supported with low interest (5% subsidized interest rate), long-‐term (20 years) bank/HMFI loans. This has two advantages. One, the local agency recovers its finances immediately and two; the recovery is managed by agencies that have experience of collecting; new migrants may be offered houses on rent-‐to-‐own basis. In this case, the local body shall recover its cost slowly and would need to hire an agency; new migrants may be offered houses on rental basis for a maximum period of 5 years after which they are deemed to have created sufficient personal savings to move into Self-‐Owned housing. These shall be like transit houses to prevent slum formation. In case of houses offered on rental basis, the local bodies shall recover reasonable return on the cost of housing, it is felt that the land value need not be included in the total cost for calculating the reasonable return. The land may be accessed by MCL from the state government. It shall continue to be ULB property whose values will keep appreciating and on which the city does not have to incur any maintenance cost. However in case of buildings there is a recurring cost being incurred for keeping it fit for use like repairs and maintenance in addition to depreciation and interest on investment. While land appreciates in value and does not need maintenance, it is only building which depreciates and therefore needs maintenance, cost of which ought to be recovered from the users as part of rent. Housing for new migrants may be developed through PPP arrangements or if these are commercially unattractive, may be taken up directly by DUDA or other local bodies in the city.
93
7. Strategy to make Ludhiana a ‘Slum Free City’ The Ludhiana Slum Free City Plan of Action (L-‐SFCPOA) is an inclusive plan prepared through bottom-‐up and participatory processes, consultations with poor communities and key stakeholders and evidence generated above. It also has an institutional and resource plan to ensure that it is implementable.
7.1 Ludhiana Vision: An Inclusive, Green and Growing City L-‐SFCPOA envisions Ludhiana as an Inclusive, Green and Growing City; a city that welcomes poor workers and creates decent, clean and pollution-‐free living environments for the poor by mainstreaming their low-‐income settlements with city’s infrastructure with improved, in-‐house, basic municipal services and housing; access to roads, transport, schools, health care, food and social security; and enhanced skills for promoting growth.
a. Project Implementation Agency L-‐SFCPOA shall be implemented by MCL. MCL will work closely with all service delivery agencies in the city and key stakeholders for implementing the plan -‐ such as the departments of transport, roads, education, health, etc. and synergize its slum plan with the policies and plans of these departments for effective implementation.
b. Community Mobilization and Organization Community mobilization will be at the core of slum development intervention in Ludhiana. MCL will, using due process, contract a lead NGO with experience of working with urban slum communities in Ludhiana, for mobilizing and organizing these communities for inclusive planning development. Ludhiana has a very small/weak civil society. Local NGOs will need to work with the Lead NGO to a. reach all identified slums and b. build their capacity to engage communities in the processes of planning, implementation, monitoring and maintenance of all development activities in their areas. NGO shall mobilize community groups -‐ self-‐help/savings groups, enterprise and livelihood groups, water, toilet and sanitation committees, area welfare associations, construction monitoring committees, etc. and empower them to partner with MCL in development processes.
c. Approach to Slum Free Ludhiana The approach to achieving slum free Ludhiana shall be rights-‐based, equitable, comprehensive, inclusive, socially, economically and environmentally sustainable and futuristic.
Rights-‐based: The city recognizes that all people, women and men, especially the poorest, excluded, most vulnerable groups, and migrants to the city have a right to the city and its services, decent housing, and opportunities for skilling. Equitable: The level of services in the city shall be equal for all, without discrimination on grounds of land ownership, migratory status or formal identity.
94
Inclusive: The city recognizes that poor, including migrants must be included in the city’s plans and be a part of the processes of city and slum, planning and implementation. Comprehensive: Plans for development of the low-‐income settlements shall be holistic, addressing the full breadth of needs of poor people to bring about sustainable reduction in their poverty. Economically Sustainable: The city recognizes that migrant labour contributes significantly to city’s growth and their inclusion is critical for city growth, and that migrant workers shall be part of city’s plans and included in the processes of planning and implementation. Socially and Environmentally Sustainable: Interventions for slum development shall be socially and environmentally sustainable so that the city moves on a path of green growth with social and environmental responsibility. Systems and institutions shall also be strengthened to ensure long-‐term sustainability of the programme.
7.2 Slum Development Strategy Slum development shall include access to housing, basic services, roads and connectivity, power supply and social services.
a. Housing Housing development shall follow two approaches, self-‐built by people or built by MCL. Self-‐built housing shall happen mostly in the unauthorized colonies. MCL developed housing for eligible beneficiaries shall be through, in-‐situ redevelopment or relocation. All kuchha and semi-‐pucca houses in unauthorized settlements with proof of ownership shall be built incrementally and may be self-‐developed with technical support from MCL. Self-‐built housing shall be built incrementally, customized on the existing plot/housing footprint, where structurally sound, and shall build upon people’s investments. Incremental housing will focus on addition of toilets, kitchens, ventilation, rainwater harvesting structures, structural safety etc. to bring houses up to the norm. Incremental housing can happen slowly and through self-‐financing based on individual affordability. Structurally weak kuchha and semi-‐pucca houses in these settlements shall be demolished and rebuilt as pucca structures, with minimum 25 sq.mt carpet area in ground or ground plus one construction and with a toilet, bathroom, kitchen, water supply, power, proper ventilation and lighting as per RAY norms. All pucca houses shall be be built up if smaller than 25 sq.mt with added toilet and water services. All existing toilets in these houses shall be connected to appropriate discharge systems -‐ sewer line, shared or Self-‐Owned septic tank. MCL shall provide technical support to the families, who shall be encouraged to self-‐finance the upgrading. MCL shall identify and accredit contractors for self-‐built housing, negotiate construction rates with them and build their capacities in improved construction techniques. Families may choose from the DUDA accredited contractors or pick their own contractors or even build by themselves as many among the poor work in the construction sector as masons, plumbers etc.
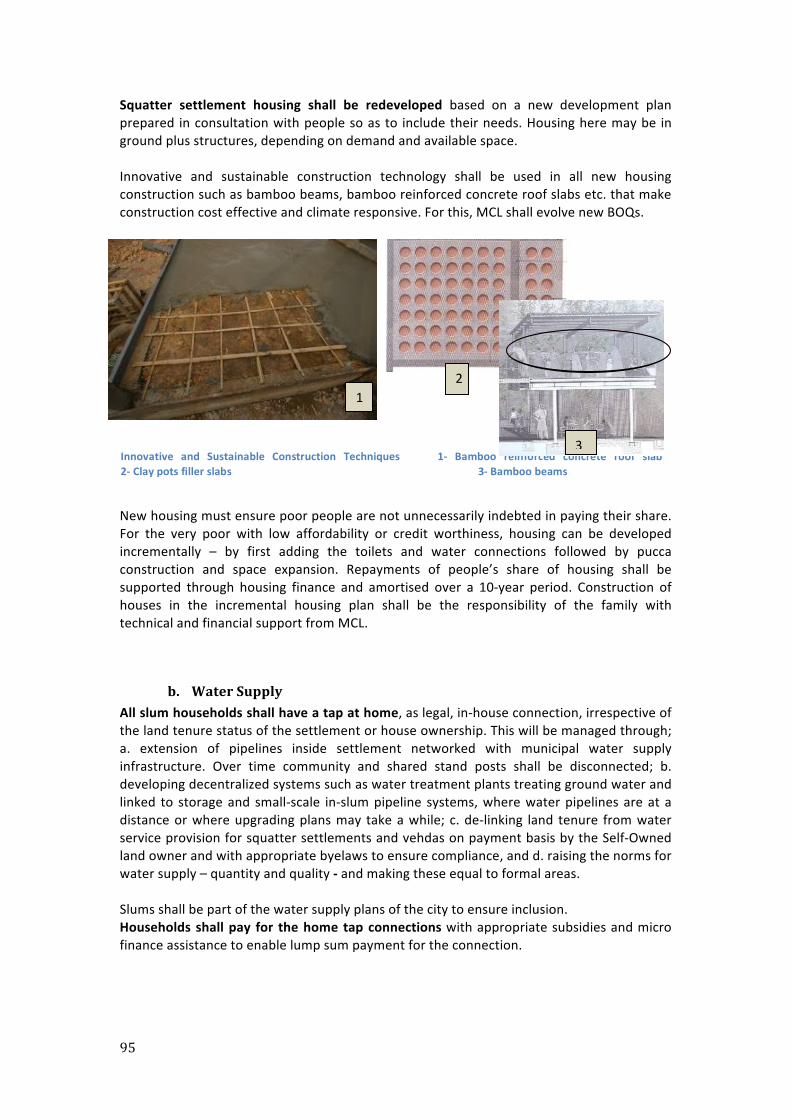
95
Squatter settlement housing shall be redeveloped based on a new development plan prepared in consultation with people so as to include their needs. Housing here may be in ground plus structures, depending on demand and available space. Innovative and sustainable construction technology shall be used in all new housing construction such as bamboo beams, bamboo reinforced concrete roof slabs etc. that make construction cost effective and climate responsive. For this, MCL shall evolve new BOQs.
New housing must ensure poor people are not unnecessarily indebted in paying their share. For the very poor with low affordability or credit worthiness, housing can be developed incrementally – by first adding the toilets and water connections followed by pucca construction and space expansion. Repayments of people’s share of housing shall be supported through housing finance and amortised over a 10-‐year period. Construction of houses in the incremental housing plan shall be the responsibility of the family with technical and financial support from MCL.
b. Water Supply All slum households shall have a tap at home, as legal, in-‐house connection, irrespective of the land tenure status of the settlement or house ownership. This will be managed through; a. extension of pipelines inside settlement networked with municipal water supply infrastructure. Over time community and shared stand posts shall be disconnected; b. developing decentralized systems such as water treatment plants treating ground water and linked to storage and small-‐scale in-‐slum pipeline systems, where water pipelines are at a distance or where upgrading plans may take a while; c. de-‐linking land tenure from water service provision for squatter settlements and vehdas on payment basis by the Self-‐Owned land owner and with appropriate byelaws to ensure compliance, and d. raising the norms for water supply – quantity and quality -‐ and making these equal to formal areas. Slums shall be part of the water supply plans of the city to ensure inclusion. Households shall pay for the home tap connections with appropriate subsidies and micro finance assistance to enable lump sum payment for the connection.
Innovative and Sustainable Construction Techniques 1-‐ Bamboo reinforced concrete roof slab 2-‐ Clay pots filler slabs 3-‐ Bamboo beams
1 2
3
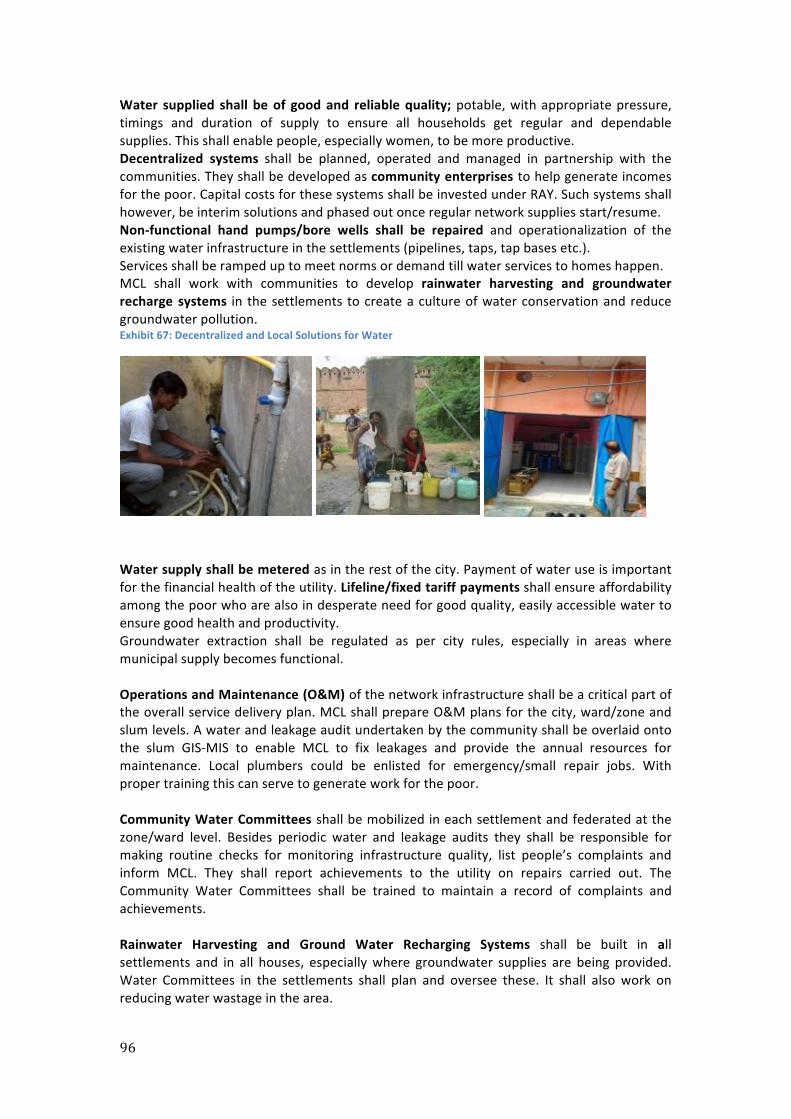
96
Water supplied shall be of good and reliable quality; potable, with appropriate pressure, timings and duration of supply to ensure all households get regular and dependable supplies. This shall enable people, especially women, to be more productive. Decentralized systems shall be planned, operated and managed in partnership with the communities. They shall be developed as community enterprises to help generate incomes for the poor. Capital costs for these systems shall be invested under RAY. Such systems shall however, be interim solutions and phased out once regular network supplies start/resume. Non-‐functional hand pumps/bore wells shall be repaired and operationalization of the existing water infrastructure in the settlements (pipelines, taps, tap bases etc.). Services shall be ramped up to meet norms or demand till water services to homes happen. MCL shall work with communities to develop rainwater harvesting and groundwater recharge systems in the settlements to create a culture of water conservation and reduce groundwater pollution. Exhibit 67: Decentralized and Local Solutions for Water
Water supply shall be metered as in the rest of the city. Payment of water use is important for the financial health of the utility. Lifeline/fixed tariff payments shall ensure affordability among the poor who are also in desperate need for good quality, easily accessible water to ensure good health and productivity. Groundwater extraction shall be regulated as per city rules, especially in areas where municipal supply becomes functional. Operations and Maintenance (O&M) of the network infrastructure shall be a critical part of the overall service delivery plan. MCL shall prepare O&M plans for the city, ward/zone and slum levels. A water and leakage audit undertaken by the community shall be overlaid onto the slum GIS-‐MIS to enable MCL to fix leakages and provide the annual resources for maintenance. Local plumbers could be enlisted for emergency/small repair jobs. With proper training this can serve to generate work for the poor. Community Water Committees shall be mobilized in each settlement and federated at the zone/ward level. Besides periodic water and leakage audits they shall be responsible for making routine checks for monitoring infrastructure quality, list people’s complaints and inform MCL. They shall report achievements to the utility on repairs carried out. The Community Water Committees shall be trained to maintain a record of complaints and achievements. Rainwater Harvesting and Ground Water Recharging Systems shall be built in all settlements and in all houses, especially where groundwater supplies are being provided. Water Committees in the settlements shall plan and oversee these. It shall also work on reducing water wastage in the area.
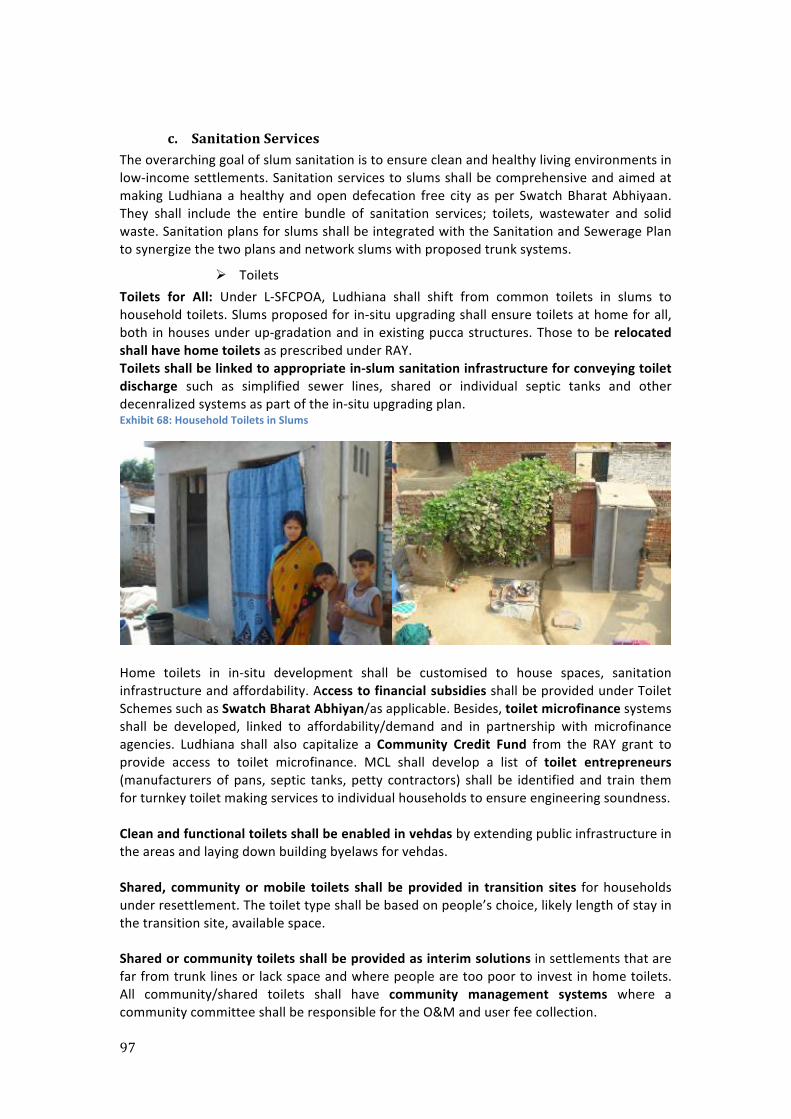
97
c. Sanitation Services The overarching goal of slum sanitation is to ensure clean and healthy living environments in low-‐income settlements. Sanitation services to slums shall be comprehensive and aimed at making Ludhiana a healthy and open defecation free city as per Swatch Bharat Abhiyaan. They shall include the entire bundle of sanitation services; toilets, wastewater and solid waste. Sanitation plans for slums shall be integrated with the Sanitation and Sewerage Plan to synergize the two plans and network slums with proposed trunk systems.
Ø Toilets Toilets for All: Under L-‐SFCPOA, Ludhiana shall shift from common toilets in slums to household toilets. Slums proposed for in-‐situ upgrading shall ensure toilets at home for all, both in houses under up-‐gradation and in existing pucca structures. Those to be relocated shall have home toilets as prescribed under RAY. Toilets shall be linked to appropriate in-‐slum sanitation infrastructure for conveying toilet discharge such as simplified sewer lines, shared or individual septic tanks and other decenralized systems as part of the in-‐situ upgrading plan. Exhibit 68: Household Toilets in Slums
Home toilets in in-‐situ development shall be customised to house spaces, sanitation infrastructure and affordability. Access to financial subsidies shall be provided under Toilet Schemes such as Swatch Bharat Abhiyan/as applicable. Besides, toilet microfinance systems shall be developed, linked to affordability/demand and in partnership with microfinance agencies. Ludhiana shall also capitalize a Community Credit Fund from the RAY grant to provide access to toilet microfinance. MCL shall develop a list of toilet entrepreneurs (manufacturers of pans, septic tanks, petty contractors) shall be identified and train them for turnkey toilet making services to individual households to ensure engineering soundness. Clean and functional toilets shall be enabled in vehdas by extending public infrastructure in the areas and laying down building byelaws for vehdas. Shared, community or mobile toilets shall be provided in transition sites for households under resettlement. The toilet type shall be based on people’s choice, likely length of stay in the transition site, available space. Shared or community toilets shall be provided as interim solutions in settlements that are far from trunk lines or lack space and where people are too poor to invest in home toilets. All community/shared toilets shall have community management systems where a community committee shall be responsible for the O&M and user fee collection.
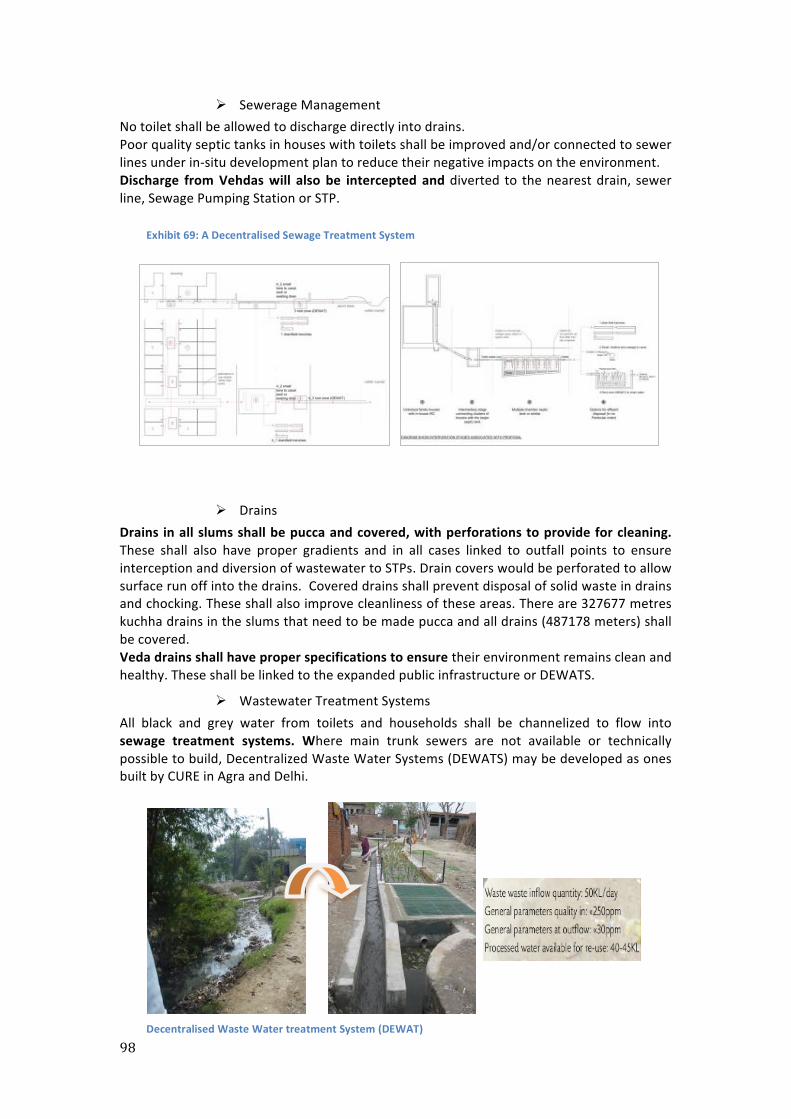
98
Ø Sewerage Management No toilet shall be allowed to discharge directly into drains. Poor quality septic tanks in houses with toilets shall be improved and/or connected to sewer lines under in-‐situ development plan to reduce their negative impacts on the environment. Discharge from Vehdas will also be intercepted and diverted to the nearest drain, sewer line, Sewage Pumping Station or STP.
Ø Drains Drains in all slums shall be pucca and covered, with perforations to provide for cleaning. These shall also have proper gradients and in all cases linked to outfall points to ensure interception and diversion of wastewater to STPs. Drain covers would be perforated to allow surface run off into the drains. Covered drains shall prevent disposal of solid waste in drains and chocking. These shall also improve cleanliness of these areas. There are 327677 metres kuchha drains in the slums that need to be made pucca and all drains (487178 meters) shall be covered. Veda drains shall have proper specifications to ensure their environment remains clean and healthy. These shall be linked to the expanded public infrastructure or DEWATS.
Ø Wastewater Treatment Systems All black and grey water from toilets and households shall be channelized to flow into sewage treatment systems. Where main trunk sewers are not available or technically possible to build, Decentralized Waste Water Systems (DEWATS) may be developed as ones built by CURE in Agra and Delhi.
Decentralised Waste Water treatment System (DEWAT)
Exhibit 69: A Decentralised Sewage Treatment System
99
Ø Solid Waste Management Solid waste collection services shall be expanded to cover all slums, low-‐income settlements and vehdas in Ludhiana. This shall include a door-‐to-‐door waste collection service operated by the community and linked to Self-‐Owned service provider. Community systems for waste management i.e. recycling, composting and disposal of non-‐biodegradable waste shall be encouraged with support of NGOs and planned as livelihood enterprises to enable communities to generate income.
Ø Roads and Transport Connecting low-‐income settlements to appropriate road and transport systems is critical for improving their mobility and productivity. Road and in-‐slum streets shall be improved by relaying and reconstruction where needed. All kuccha and semi pucca, in-‐slum roads shall be upgraded to pucca roads in cement concrete or paved pathways as per MCL norms. The road construction will also include repair/reconstruction of the approach roads. Access roads to Vehdas shall also be laid. Relaying or laying of new road/streets will be done with proper levelling and appropriate sloping to the side drains. Transport linkages shall be provided to the nearest point and planned to connect slum areas to the city’s industrial/commercial areas. MCL shall work with the transport department to plan the linkages.
Ø Power Supply and Street Lights A Self-‐Owned power distribution company is increasingly connecting slum households to metered power supply. MCL shall work with the Self-‐Owned distributor to ensure all slum households are covered with legal power supply at appropriate rates. The effort will be to build shorter billing cycles that correspond with people’s earnings and ability to pay. MCL shall create awareness on power saving and monitor the complaints redressal system for faulty/fast meters, billing inaccuracies, disconnection etc. Streetlights in slums shall be made functional, new ones shall be added where required as per norms. MCL shall make available ground level information on dysfunctional or inadequate numbers to the company. All approach roads to slums shall also have streetlights for safety purposes. Community toilets in slums shall also be provided with lights/streetlights on access pathways.
d. Development of Livelihoods Industries of Ludhiana create plentiful livelihood opportunities for the poor. As per the baseline survey, half of the working population in slums (42.6%) is employed. Most of the work done is informal. A small percentage (3%) has formal employment and draw regular salaries. About 8% are self-‐employed, have set up Self-‐Owned enterprises that service both industries and slum dwellers and are vendors, loaders, delivery people, rickshaw pullers etc.
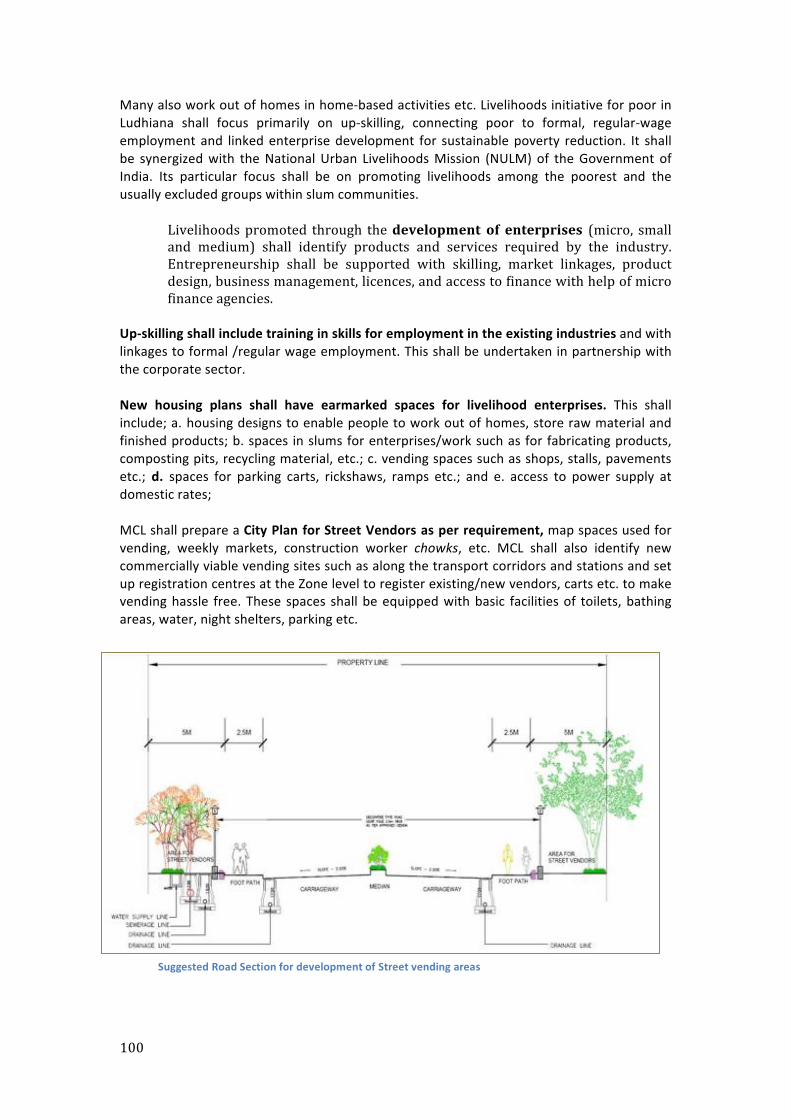
100
Many also work out of homes in home-‐based activities etc. Livelihoods initiative for poor in Ludhiana shall focus primarily on up-‐skilling, connecting poor to formal, regular-‐wage employment and linked enterprise development for sustainable poverty reduction. It shall be synergized with the National Urban Livelihoods Mission (NULM) of the Government of India. Its particular focus shall be on promoting livelihoods among the poorest and the usually excluded groups within slum communities.
Livelihoods promoted through the development of enterprises (micro, small and medium) shall identify products and services required by the industry. Entrepreneurship shall be supported with skilling, market linkages, product design, business management, licences, and access to finance with help of micro finance agencies.
Up-‐skilling shall include training in skills for employment in the existing industries and with linkages to formal /regular wage employment. This shall be undertaken in partnership with the corporate sector. New housing plans shall have earmarked spaces for livelihood enterprises. This shall include; a. housing designs to enable people to work out of homes, store raw material and finished products; b. spaces in slums for enterprises/work such as for fabricating products, composting pits, recycling material, etc.; c. vending spaces such as shops, stalls, pavements etc.; d. spaces for parking carts, rickshaws, ramps etc.; and e. access to power supply at domestic rates; MCL shall prepare a City Plan for Street Vendors as per requirement, map spaces used for vending, weekly markets, construction worker chowks, etc. MCL shall also identify new commercially viable vending sites such as along the transport corridors and stations and set up registration centres at the Zone level to register existing/new vendors, carts etc. to make vending hassle free. These spaces shall be equipped with basic facilities of toilets, bathing areas, water, night shelters, parking etc.
Suggested Road Section for development of Street vending areas
101
e. Access to Health and Education Services Health and education services shall be planned and delivered in convergence with the concerned departments. MCL shall jointly review with concerned department official, spatial distribution of municipal schools and health centres, identify gaps and plan for gap filling. Education and health committees shall be set up at Ward level to monitor service delivery quality.
f. Access to Social Security MCL shall promote social security benefits of development schemes among the slum dwellers, such as pensions for widows, elderly, disabled; girl child plans, health insurances, etc. Based on the data generated under the HH survey, MCL shall prepare beneficiary lists and develop a strategy to cover these people with support of NGOs. The NGOs shall also inform communities so that they can avail of these benefits. MCL shall set up at the Ward level single window systems for extending scheme benefits. MCL shall monitor benefit provision using the GIS-‐MIS to prevent leakages.
7.3 Project Implementation Unit For the efficient implementation of the strategies proposed in the Plan, MCL shall set-‐up a project Implementation Unit. The PMU shall coordinate, and work closely with a range of city agencies and concerned stakeholders in implementation of the plan. The PMU shall also facilitate a CBO/ NGO group on undertaking participatory planning for Slum Development.
102
ANNEXURES
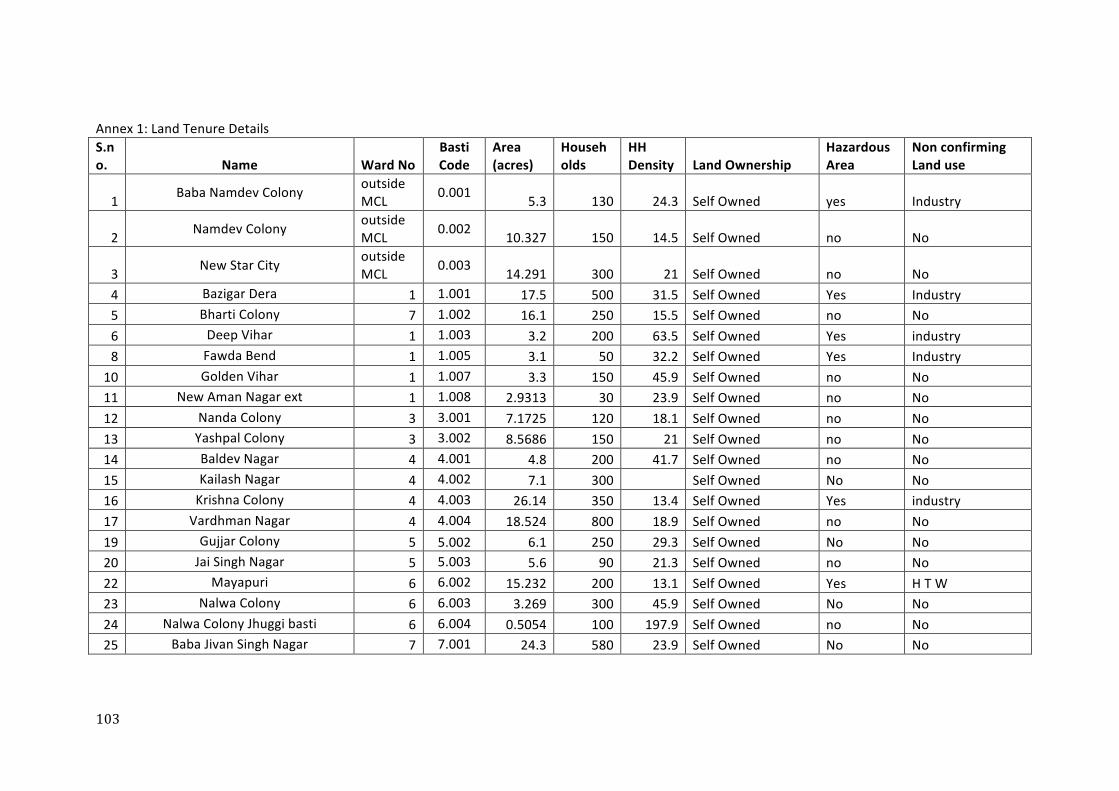
103
Annex 1: Land Tenure Details S.no. Name Ward No
Basti Code
Area (acres)
Households
HH Density Land Ownership
Hazardous Area
Non confirming Land use
1 Baba Namdev Colony outside MCL 0.001 5.3 130 24.3 Self Owned yes Industry
2 Namdev Colony outside MCL 0.002 10.327 150 14.5 Self Owned no No
3 New Star City outside MCL 0.003 14.291 300 21 Self Owned no No
4 Bazigar Dera 1 1.001 17.5 500 31.5 Self Owned Yes Industry 5 Bharti Colony 7 1.002 16.1 250 15.5 Self Owned no No 6 Deep Vihar 1 1.003 3.2 200 63.5 Self Owned Yes industry 8 Fawda Bend 1 1.005 3.1 50 32.2 Self Owned Yes Industry
10 Golden Vihar 1 1.007 3.3 150 45.9 Self Owned no No 11 New Aman Nagar ext 1 1.008 2.9313 30 23.9 Self Owned no No 12 Nanda Colony 3 3.001 7.1725 120 18.1 Self Owned no No 13 Yashpal Colony 3 3.002 8.5686 150 21 Self Owned no No 14 Baldev Nagar 4 4.001 4.8 200 41.7 Self Owned no No 15 Kailash Nagar 4 4.002 7.1 300 Self Owned No No 16 Krishna Colony 4 4.003 26.14 350 13.4 Self Owned Yes industry 17 Vardhman Nagar 4 4.004 18.524 800 18.9 Self Owned no No 19 Gujjar Colony 5 5.002 6.1 250 29.3 Self Owned No No 20 Jai Singh Nagar 5 5.003 5.6 90 21.3 Self Owned no No 22 Mayapuri 6 6.002 15.232 200 13.1 Self Owned Yes H T W 23 Nalwa Colony 6 6.003 3.269 300 45.9 Self Owned No No 24 Nalwa Colony Jhuggi basti 6 6.004 0.5054 100 197.9 Self Owned no No 25 Baba Jivan Singh Nagar 7 7.001 24.3 580 23.9 Self Owned No No
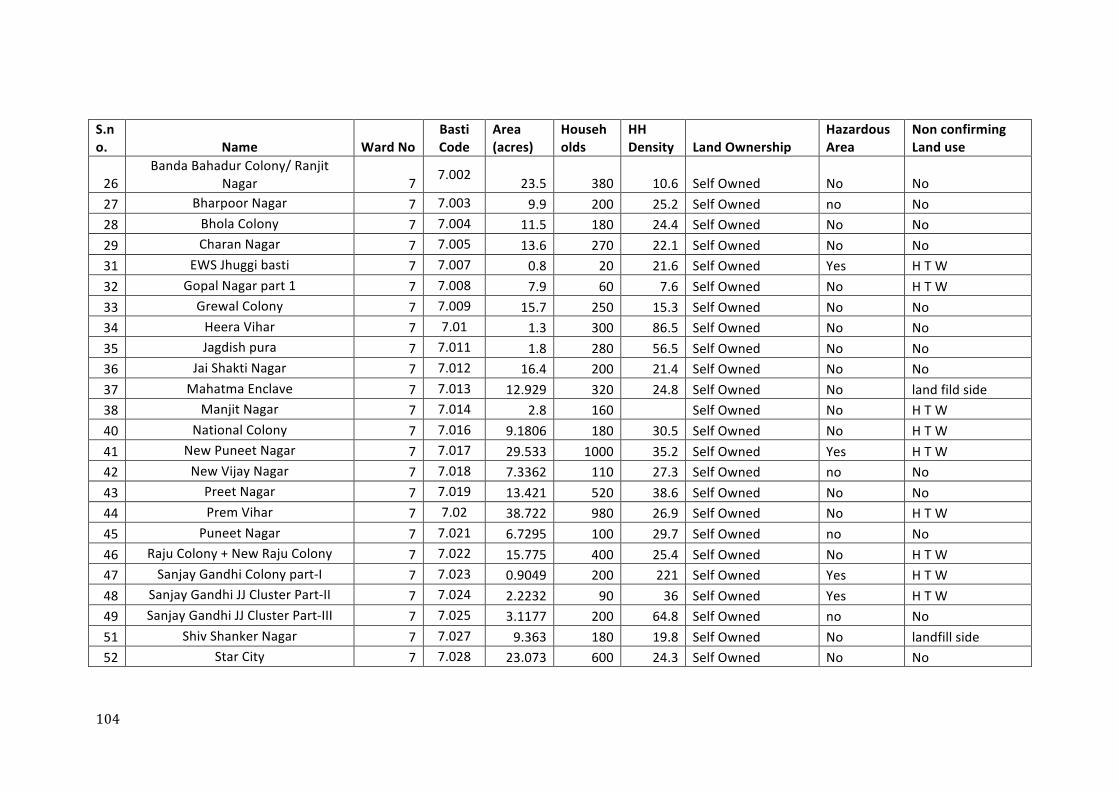
104
S.no. Name Ward No
Basti Code
Area (acres)
Households
HH Density Land Ownership
Hazardous Area
Non confirming Land use
26 Banda Bahadur Colony/ Ranjit
Nagar 7 7.002 23.5 380 10.6 Self Owned No No 27 Bharpoor Nagar 7 7.003 9.9 200 25.2 Self Owned no No 28 Bhola Colony 7 7.004 11.5 180 24.4 Self Owned No No 29 Charan Nagar 7 7.005 13.6 270 22.1 Self Owned No No 31 EWS Jhuggi basti 7 7.007 0.8 20 21.6 Self Owned Yes H T W 32 Gopal Nagar part 1 7 7.008 7.9 60 7.6 Self Owned No H T W 33 Grewal Colony 7 7.009 15.7 250 15.3 Self Owned No No 34 Heera Vihar 7 7.01 1.3 300 86.5 Self Owned No No 35 Jagdish pura 7 7.011 1.8 280 56.5 Self Owned No No 36 Jai Shakti Nagar 7 7.012 16.4 200 21.4 Self Owned No No 37 Mahatma Enclave 7 7.013 12.929 320 24.8 Self Owned No land fild side 38 Manjit Nagar 7 7.014 2.8 160 Self Owned No H T W 40 National Colony 7 7.016 9.1806 180 30.5 Self Owned No H T W 41 New Puneet Nagar 7 7.017 29.533 1000 35.2 Self Owned Yes H T W 42 New Vijay Nagar 7 7.018 7.3362 110 27.3 Self Owned no No 43 Preet Nagar 7 7.019 13.421 520 38.6 Self Owned No No 44 Prem Vihar 7 7.02 38.722 980 26.9 Self Owned No H T W 45 Puneet Nagar 7 7.021 6.7295 100 29.7 Self Owned no No 46 Raju Colony + New Raju Colony 7 7.022 15.775 400 25.4 Self Owned No H T W 47 Sanjay Gandhi Colony part-‐I 7 7.023 0.9049 200 221 Self Owned Yes H T W 48 Sanjay Gandhi JJ Cluster Part-‐II 7 7.024 2.2232 90 36 Self Owned Yes H T W 49 Sanjay Gandhi JJ Cluster Part-‐III 7 7.025 3.1177 200 64.8 Self Owned no No 51 Shiv Shanker Nagar 7 7.027 9.363 180 19.8 Self Owned No landfill side 52 Star City 7 7.028 23.073 600 24.3 Self Owned No No
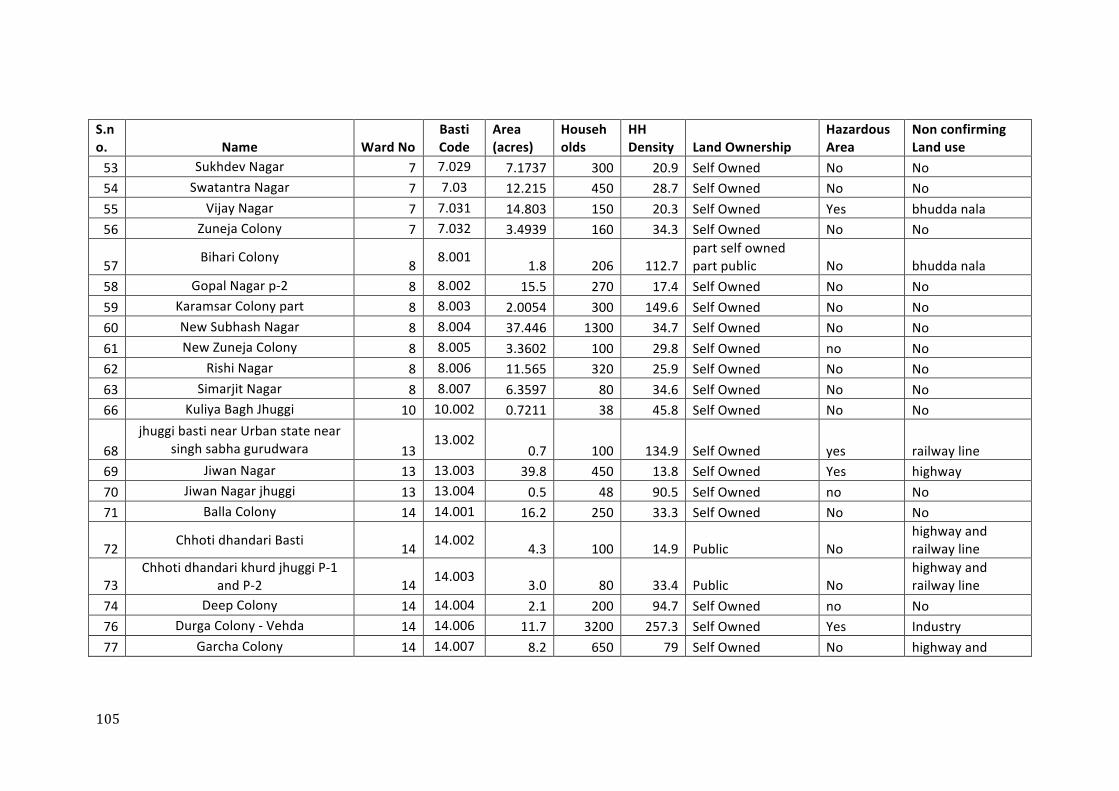
105
S.no. Name Ward No
Basti Code
Area (acres)
Households
HH Density Land Ownership
Hazardous Area
Non confirming Land use
53 Sukhdev Nagar 7 7.029 7.1737 300 20.9 Self Owned No No 54 Swatantra Nagar 7 7.03 12.215 450 28.7 Self Owned No No 55 Vijay Nagar 7 7.031 14.803 150 20.3 Self Owned Yes bhudda nala 56 Zuneja Colony 7 7.032 3.4939 160 34.3 Self Owned No No
57 Bihari Colony 8 8.001 1.8 206 112.7 part self owned part public No bhudda nala
58 Gopal Nagar p-‐2 8 8.002 15.5 270 17.4 Self Owned No No 59 Karamsar Colony part 8 8.003 2.0054 300 149.6 Self Owned No No 60 New Subhash Nagar 8 8.004 37.446 1300 34.7 Self Owned No No 61 New Zuneja Colony 8 8.005 3.3602 100 29.8 Self Owned no No 62 Rishi Nagar 8 8.006 11.565 320 25.9 Self Owned No No 63 Simarjit Nagar 8 8.007 6.3597 80 34.6 Self Owned No No 66 Kuliya Bagh Jhuggi 10 10.002 0.7211 38 45.8 Self Owned No No
68 jhuggi basti near Urban state near
singh sabha gurudwara 13 13.002
0.7 100 134.9 Self Owned yes railway line 69 Jiwan Nagar 13 13.003 39.8 450 13.8 Self Owned Yes highway 70 Jiwan Nagar jhuggi 13 13.004 0.5 48 90.5 Self Owned no No 71 Balla Colony 14 14.001 16.2 250 33.3 Self Owned No No
72 Chhoti dhandari Basti 14 14.002 4.3 100 14.9 Public No highway and railway line
73 Chhoti dhandari khurd jhuggi P-‐1
and P-‐2 14 14.003 3.0 80 33.4 Public No highway and railway line
74 Deep Colony 14 14.004 2.1 200 94.7 Self Owned no No 76 Durga Colony -‐ Vehda 14 14.006 11.7 3200 257.3 Self Owned Yes Industry 77 Garcha Colony 14 14.007 8.2 650 79 Self Owned No highway and
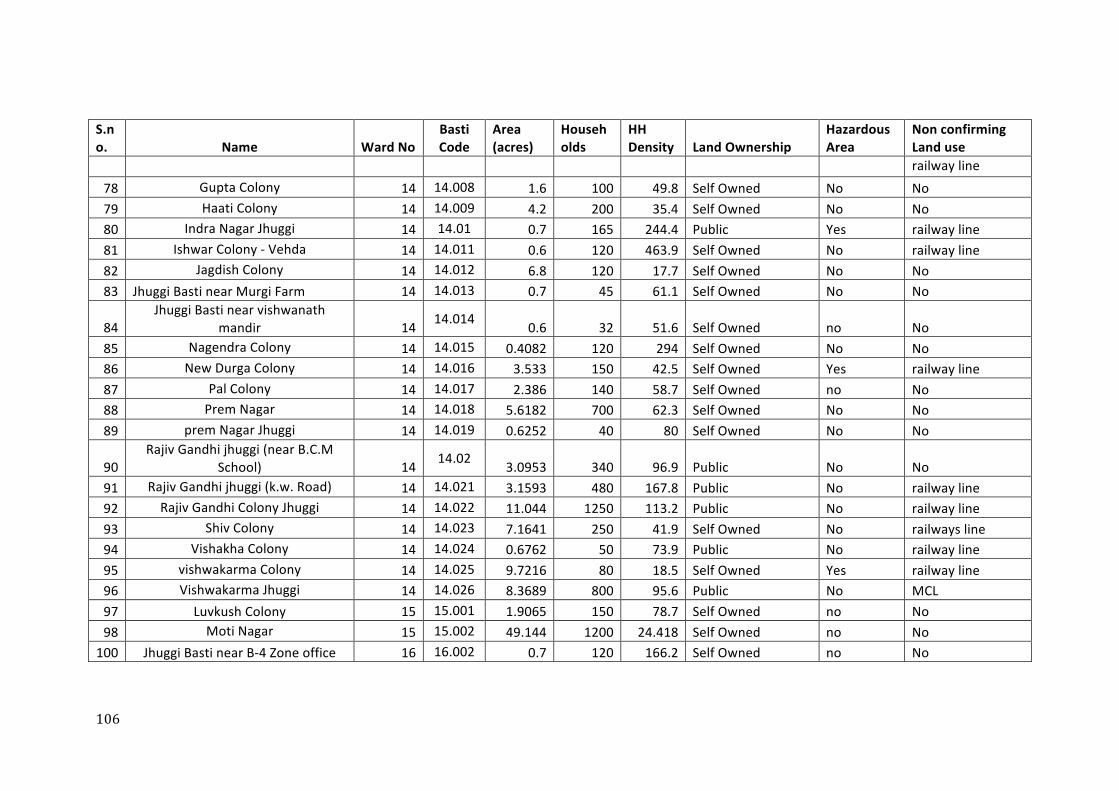
106
S.no. Name Ward No
Basti Code
Area (acres)
Households
HH Density Land Ownership
Hazardous Area
Non confirming Land use railway line
78 Gupta Colony 14 14.008 1.6 100 49.8 Self Owned No No 79 Haati Colony 14 14.009 4.2 200 35.4 Self Owned No No 80 Indra Nagar Jhuggi 14 14.01 0.7 165 244.4 Public Yes railway line 81 Ishwar Colony -‐ Vehda 14 14.011 0.6 120 463.9 Self Owned No railway line 82 Jagdish Colony 14 14.012 6.8 120 17.7 Self Owned No No 83 Jhuggi Basti near Murgi Farm 14 14.013 0.7 45 61.1 Self Owned No No
84 Jhuggi Basti near vishwanath
mandir 14 14.014 0.6 32 51.6 Self Owned no No 85 Nagendra Colony 14 14.015 0.4082 120 294 Self Owned No No 86 New Durga Colony 14 14.016 3.533 150 42.5 Self Owned Yes railway line 87 Pal Colony 14 14.017 2.386 140 58.7 Self Owned no No 88 Prem Nagar 14 14.018 5.6182 700 62.3 Self Owned No No 89 prem Nagar Jhuggi 14 14.019 0.6252 40 80 Self Owned No No
90 Rajiv Gandhi jhuggi (near B.C.M
School) 14 14.02 3.0953 340 96.9 Public No No 91 Rajiv Gandhi jhuggi (k.w. Road) 14 14.021 3.1593 480 167.8 Public No railway line 92 Rajiv Gandhi Colony Jhuggi 14 14.022 11.044 1250 113.2 Public No railway line 93 Shiv Colony 14 14.023 7.1641 250 41.9 Self Owned No railways line 94 Vishakha Colony 14 14.024 0.6762 50 73.9 Public No railway line 95 vishwakarma Colony 14 14.025 9.7216 80 18.5 Self Owned Yes railway line 96 Vishwakarma Jhuggi 14 14.026 8.3689 800 95.6 Public No MCL 97 Luvkush Colony 15 15.001 1.9065 150 78.7 Self Owned no No 98 Moti Nagar 15 15.002 49.144 1200 24.418 Self Owned no No
100 Jhuggi Basti near B-‐4 Zone office 16 16.002 0.7 120 166.2 Self Owned no No
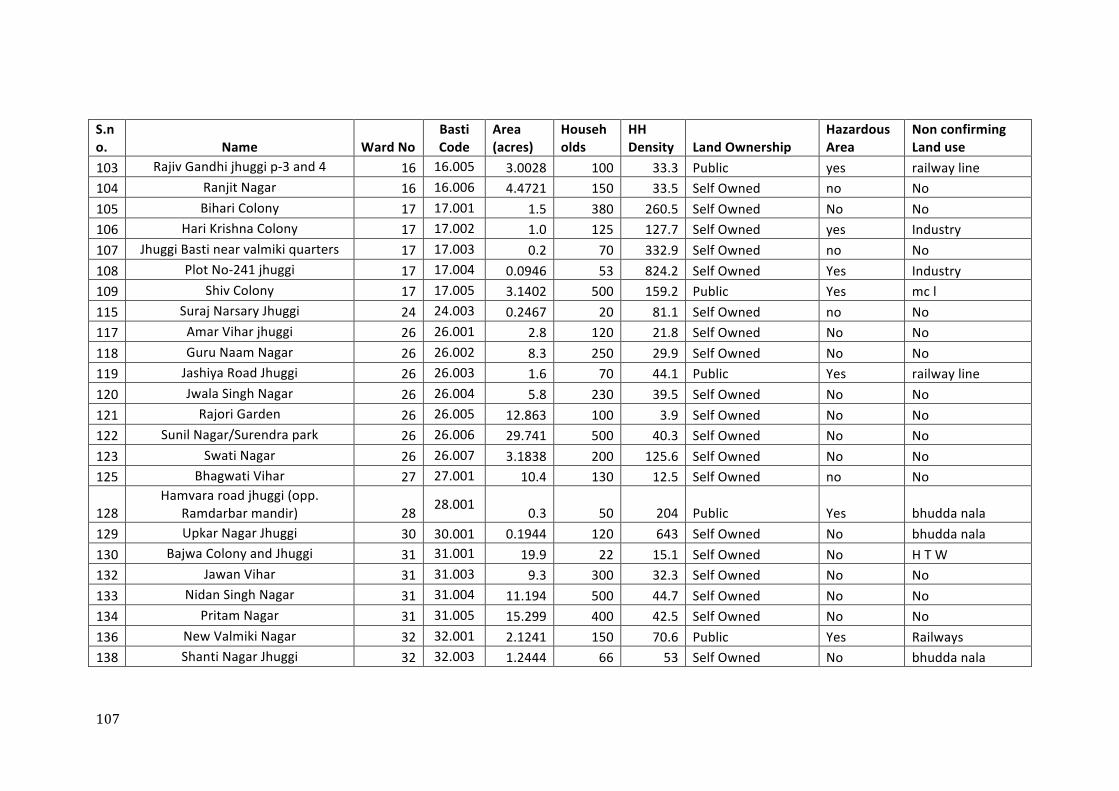
107
S.no. Name Ward No
Basti Code
Area (acres)
Households
HH Density Land Ownership
Hazardous Area
Non confirming Land use
103 Rajiv Gandhi jhuggi p-‐3 and 4 16 16.005 3.0028 100 33.3 Public yes railway line 104 Ranjit Nagar 16 16.006 4.4721 150 33.5 Self Owned no No 105 Bihari Colony 17 17.001 1.5 380 260.5 Self Owned No No 106 Hari Krishna Colony 17 17.002 1.0 125 127.7 Self Owned yes Industry 107 Jhuggi Basti near valmiki quarters 17 17.003 0.2 70 332.9 Self Owned no No 108 Plot No-‐241 jhuggi 17 17.004 0.0946 53 824.2 Self Owned Yes Industry 109 Shiv Colony 17 17.005 3.1402 500 159.2 Public Yes mc l 115 Suraj Narsary Jhuggi 24 24.003 0.2467 20 81.1 Self Owned no No 117 Amar Vihar jhuggi 26 26.001 2.8 120 21.8 Self Owned No No 118 Guru Naam Nagar 26 26.002 8.3 250 29.9 Self Owned No No 119 Jashiya Road Jhuggi 26 26.003 1.6 70 44.1 Public Yes railway line 120 Jwala Singh Nagar 26 26.004 5.8 230 39.5 Self Owned No No 121 Rajori Garden 26 26.005 12.863 100 3.9 Self Owned No No 122 Sunil Nagar/Surendra park 26 26.006 29.741 500 40.3 Self Owned No No 123 Swati Nagar 26 26.007 3.1838 200 125.6 Self Owned No No 125 Bhagwati Vihar 27 27.001 10.4 130 12.5 Self Owned no No
128 Hamvara road jhuggi (opp.
Ramdarbar mandir) 28 28.001 0.3 50 204 Public Yes bhudda nala 129 Upkar Nagar Jhuggi 30 30.001 0.1944 120 643 Self Owned No bhudda nala 130 Bajwa Colony and Jhuggi 31 31.001 19.9 22 15.1 Self Owned No H T W 132 Jawan Vihar 31 31.003 9.3 300 32.3 Self Owned No No 133 Nidan Singh Nagar 31 31.004 11.194 500 44.7 Self Owned No No 134 Pritam Nagar 31 31.005 15.299 400 42.5 Self Owned No No 136 New Valmiki Nagar 32 32.001 2.1241 150 70.6 Public Yes Railways 138 Shanti Nagar Jhuggi 32 32.003 1.2444 66 53 Self Owned No bhudda nala
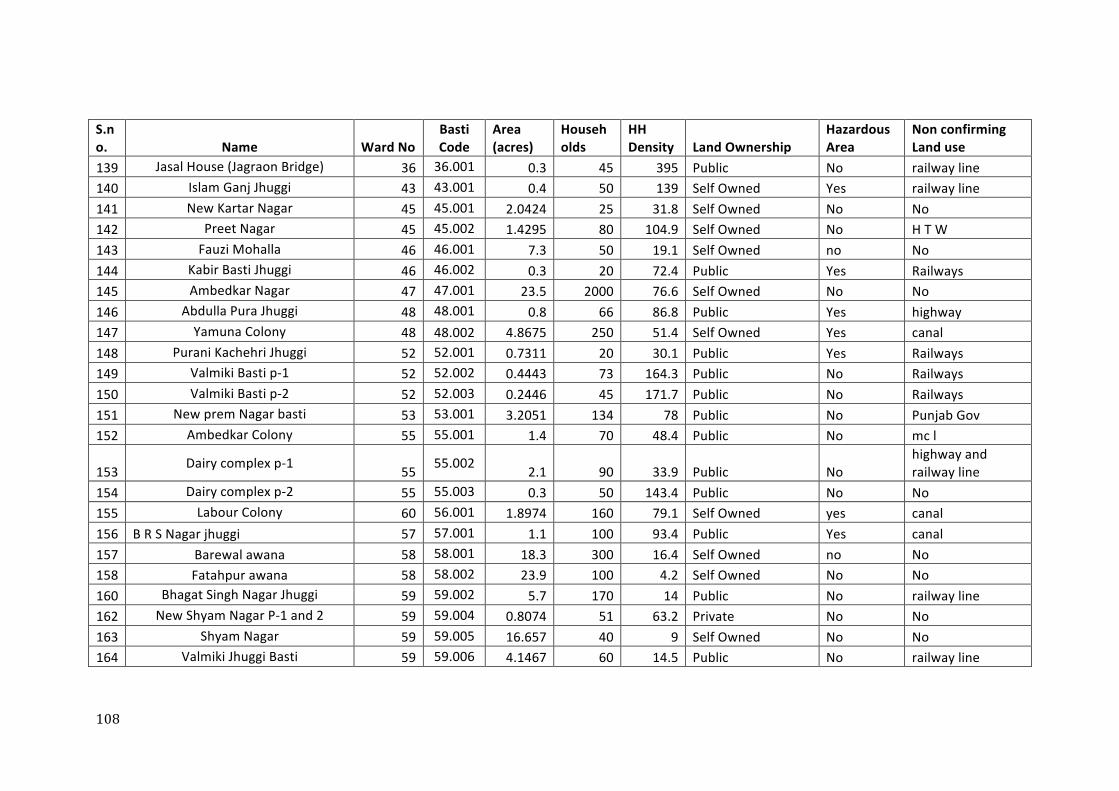
108
S.no. Name Ward No
Basti Code
Area (acres)
Households
HH Density Land Ownership
Hazardous Area
Non confirming Land use
139 Jasal House (Jagraon Bridge) 36 36.001 0.3 45 395 Public No railway line 140 Islam Ganj Jhuggi 43 43.001 0.4 50 139 Self Owned Yes railway line 141 New Kartar Nagar 45 45.001 2.0424 25 31.8 Self Owned No No 142 Preet Nagar 45 45.002 1.4295 80 104.9 Self Owned No H T W 143 Fauzi Mohalla 46 46.001 7.3 50 19.1 Self Owned no No 144 Kabir Basti Jhuggi 46 46.002 0.3 20 72.4 Public Yes Railways 145 Ambedkar Nagar 47 47.001 23.5 2000 76.6 Self Owned No No 146 Abdulla Pura Jhuggi 48 48.001 0.8 66 86.8 Public Yes highway 147 Yamuna Colony 48 48.002 4.8675 250 51.4 Self Owned Yes canal 148 Purani Kachehri Jhuggi 52 52.001 0.7311 20 30.1 Public Yes Railways 149 Valmiki Basti p-‐1 52 52.002 0.4443 73 164.3 Public No Railways 150 Valmiki Basti p-‐2 52 52.003 0.2446 45 171.7 Public No Railways 151 New prem Nagar basti 53 53.001 3.2051 134 78 Public No Punjab Gov 152 Ambedkar Colony 55 55.001 1.4 70 48.4 Public No mc l
153 Dairy complex p-‐1 55 55.002 2.1 90 33.9 Public No highway and railway line
154 Dairy complex p-‐2 55 55.003 0.3 50 143.4 Public No No 155 Labour Colony 60 56.001 1.8974 160 79.1 Self Owned yes canal 156 B R S Nagar jhuggi 57 57.001 1.1 100 93.4 Public Yes canal 157 Barewal awana 58 58.001 18.3 300 16.4 Self Owned no No 158 Fatahpur awana 58 58.002 23.9 100 4.2 Self Owned No No 160 Bhagat Singh Nagar Jhuggi 59 59.002 5.7 170 14 Public No railway line 162 New Shyam Nagar P-‐1 and 2 59 59.004 0.8074 51 63.2 Private No No 163 Shyam Nagar 59 59.005 16.657 40 9 Self Owned No No 164 Valmiki Jhuggi Basti 59 59.006 4.1467 60 14.5 Public No railway line
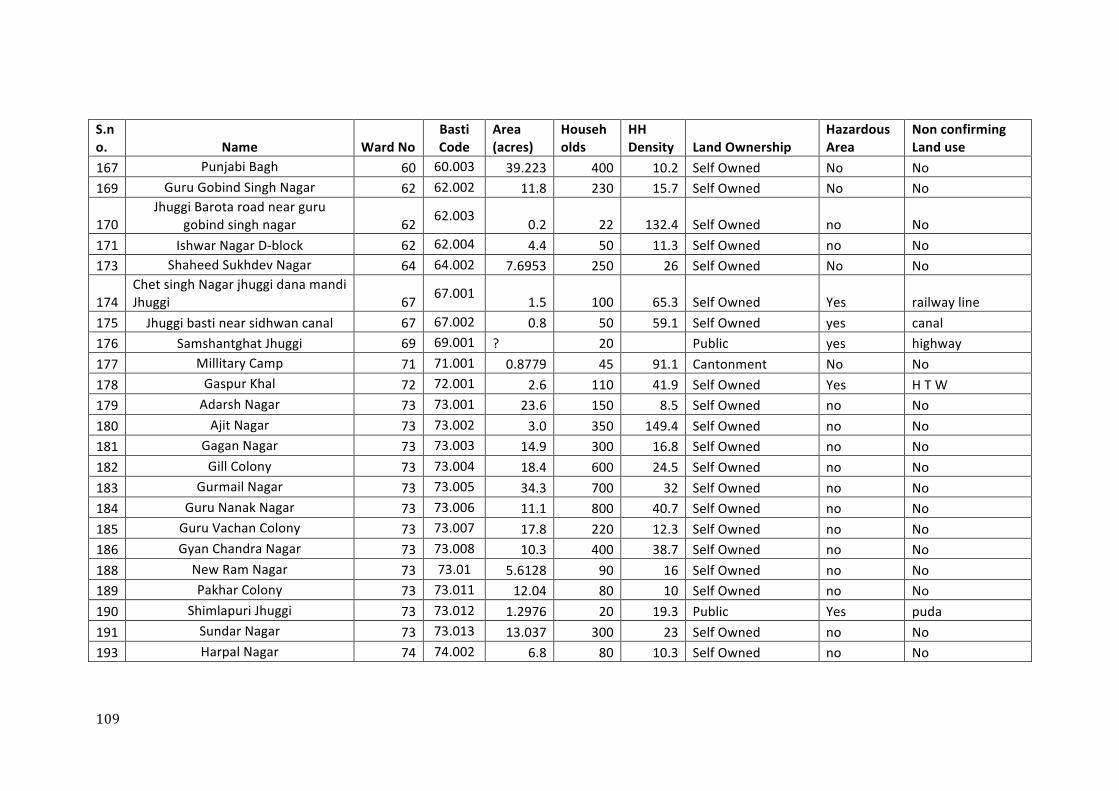
109
S.no. Name Ward No
Basti Code
Area (acres)
Households
HH Density Land Ownership
Hazardous Area
Non confirming Land use
167 Punjabi Bagh 60 60.003 39.223 400 10.2 Self Owned No No 169 Guru Gobind Singh Nagar 62 62.002 11.8 230 15.7 Self Owned No No
170 Jhuggi Barota road near guru
gobind singh nagar 62 62.003 0.2 22 132.4 Self Owned no No 171 Ishwar Nagar D-‐block 62 62.004 4.4 50 11.3 Self Owned no No 173 Shaheed Sukhdev Nagar 64 64.002 7.6953 250 26 Self Owned No No
174 Chet singh Nagar jhuggi dana mandi Jhuggi 67 67.001 1.5 100 65.3 Self Owned Yes railway line
175 Jhuggi basti near sidhwan canal 67 67.002 0.8 50 59.1 Self Owned yes canal 176 Samshantghat Jhuggi 69 69.001 ? 20 Public yes highway 177 Millitary Camp 71 71.001 0.8779 45 91.1 Cantonment No No 178 Gaspur Khal 72 72.001 2.6 110 41.9 Self Owned Yes H T W 179 Adarsh Nagar 73 73.001 23.6 150 8.5 Self Owned no No 180 Ajit Nagar 73 73.002 3.0 350 149.4 Self Owned no No 181 Gagan Nagar 73 73.003 14.9 300 16.8 Self Owned no No 182 Gill Colony 73 73.004 18.4 600 24.5 Self Owned no No 183 Gurmail Nagar 73 73.005 34.3 700 32 Self Owned no No 184 Guru Nanak Nagar 73 73.006 11.1 800 40.7 Self Owned no No 185 Guru Vachan Colony 73 73.007 17.8 220 12.3 Self Owned no No 186 Gyan Chandra Nagar 73 73.008 10.3 400 38.7 Self Owned no No 188 New Ram Nagar 73 73.01 5.6128 90 16 Self Owned no No 189 Pakhar Colony 73 73.011 12.04 80 10 Self Owned no No 190 Shimlapuri Jhuggi 73 73.012 1.2976 20 19.3 Public Yes puda 191 Sundar Nagar 73 73.013 13.037 300 23 Self Owned no No 193 Harpal Nagar 74 74.002 6.8 80 10.3 Self Owned no No
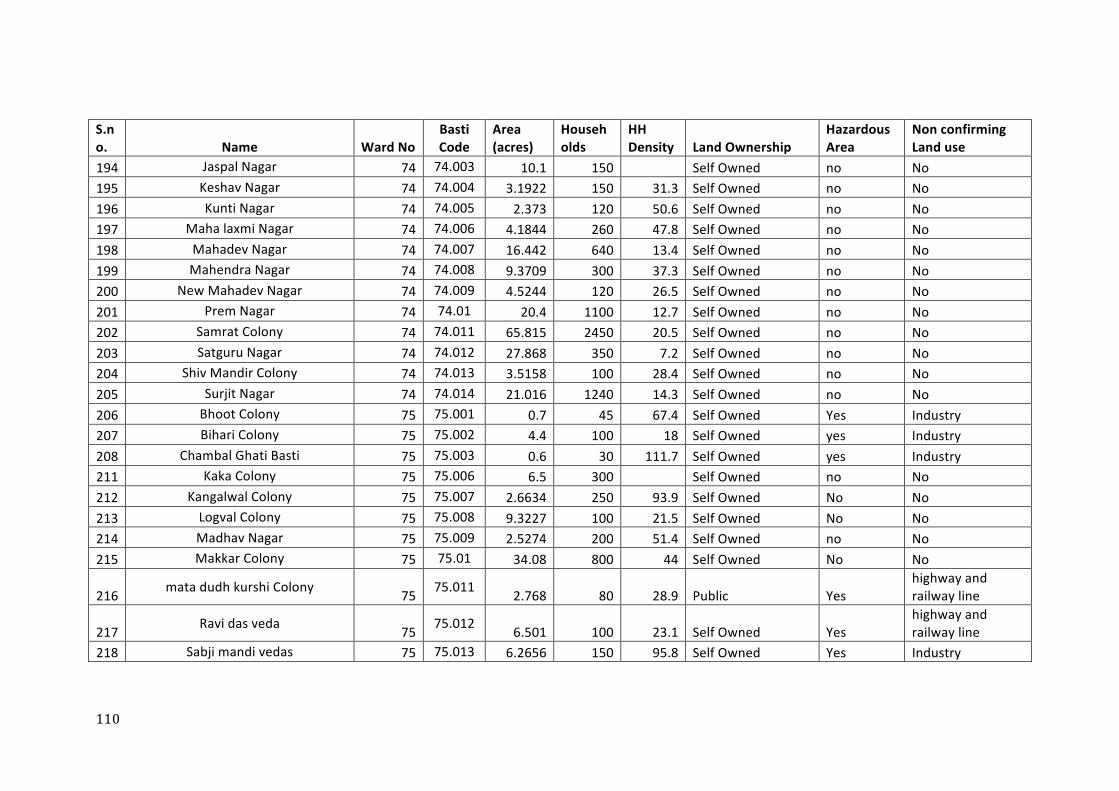
110
S.no. Name Ward No
Basti Code
Area (acres)
Households
HH Density Land Ownership
Hazardous Area
Non confirming Land use
194 Jaspal Nagar 74 74.003 10.1 150 Self Owned no No 195 Keshav Nagar 74 74.004 3.1922 150 31.3 Self Owned no No 196 Kunti Nagar 74 74.005 2.373 120 50.6 Self Owned no No 197 Maha laxmi Nagar 74 74.006 4.1844 260 47.8 Self Owned no No 198 Mahadev Nagar 74 74.007 16.442 640 13.4 Self Owned no No 199 Mahendra Nagar 74 74.008 9.3709 300 37.3 Self Owned no No 200 New Mahadev Nagar 74 74.009 4.5244 120 26.5 Self Owned no No 201 Prem Nagar 74 74.01 20.4 1100 12.7 Self Owned no No 202 Samrat Colony 74 74.011 65.815 2450 20.5 Self Owned no No 203 Satguru Nagar 74 74.012 27.868 350 7.2 Self Owned no No 204 Shiv Mandir Colony 74 74.013 3.5158 100 28.4 Self Owned no No 205 Surjit Nagar 74 74.014 21.016 1240 14.3 Self Owned no No 206 Bhoot Colony 75 75.001 0.7 45 67.4 Self Owned Yes Industry 207 Bihari Colony 75 75.002 4.4 100 18 Self Owned yes Industry 208 Chambal Ghati Basti 75 75.003 0.6 30 111.7 Self Owned yes Industry 211 Kaka Colony 75 75.006 6.5 300 Self Owned no No 212 Kangalwal Colony 75 75.007 2.6634 250 93.9 Self Owned No No 213 Logval Colony 75 75.008 9.3227 100 21.5 Self Owned No No 214 Madhav Nagar 75 75.009 2.5274 200 51.4 Self Owned no No 215 Makkar Colony 75 75.01 34.08 800 44 Self Owned No No
216 mata dudh kurshi Colony 75 75.011 2.768 80 28.9 Public Yes highway and railway line
217 Ravi das veda 75 75.012 6.501 100 23.1 Self Owned Yes highway and railway line
218 Sabji mandi vedas 75 75.013 6.2656 150 95.8 Self Owned Yes Industry

111
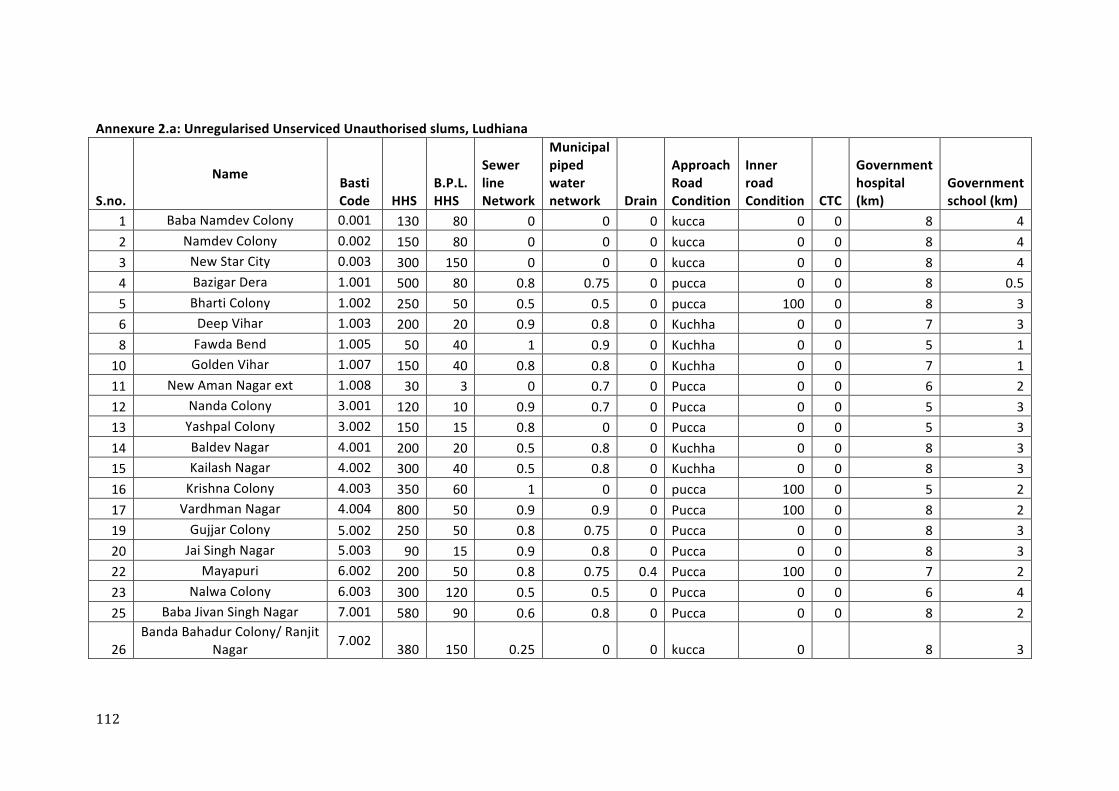
112
Annexure 2.a: Unregularised Unserviced Unauthorised slums, Ludhiana
S.no.
Name Basti Code HHS
B.P.L. HHS
Sewer line Network
Municipal piped water network Drain
Approach Road Condition
Inner road Condition CTC
Government hospital (km)
Government school (km)
1 Baba Namdev Colony 0.001 130 80 0 0 0 kucca 0 0 8 4 2 Namdev Colony 0.002 150 80 0 0 0 kucca 0 0 8 4 3 New Star City 0.003 300 150 0 0 0 kucca 0 0 8 4 4 Bazigar Dera 1.001 500 80 0.8 0.75 0 pucca 0 0 8 0.5 5 Bharti Colony 1.002 250 50 0.5 0.5 0 pucca 100 0 8 3 6 Deep Vihar 1.003 200 20 0.9 0.8 0 Kuchha 0 0 7 3 8 Fawda Bend 1.005 50 40 1 0.9 0 Kuchha 0 0 5 1
10 Golden Vihar 1.007 150 40 0.8 0.8 0 Kuchha 0 0 7 1 11 New Aman Nagar ext 1.008 30 3 0 0.7 0 Pucca 0 0 6 2 12 Nanda Colony 3.001 120 10 0.9 0.7 0 Pucca 0 0 5 3 13 Yashpal Colony 3.002 150 15 0.8 0 0 Pucca 0 0 5 3 14 Baldev Nagar 4.001 200 20 0.5 0.8 0 Kuchha 0 0 8 3 15 Kailash Nagar 4.002 300 40 0.5 0.8 0 Kuchha 0 0 8 3 16 Krishna Colony 4.003 350 60 1 0 0 pucca 100 0 5 2 17 Vardhman Nagar 4.004 800 50 0.9 0.9 0 Pucca 100 0 8 2 19 Gujjar Colony 5.002 250 50 0.8 0.75 0 Pucca 0 0 8 3 20 Jai Singh Nagar 5.003 90 15 0.9 0.8 0 Pucca 0 0 8 3 22 Mayapuri 6.002 200 50 0.8 0.75 0.4 Pucca 100 0 7 2 23 Nalwa Colony 6.003 300 120 0.5 0.5 0 Pucca 0 0 6 4 25 Baba Jivan Singh Nagar 7.001 580 90 0.6 0.8 0 Pucca 0 0 8 2
26 Banda Bahadur Colony/ Ranjit
Nagar 7.002 380 150 0.25 0 0 kucca 0 8 3
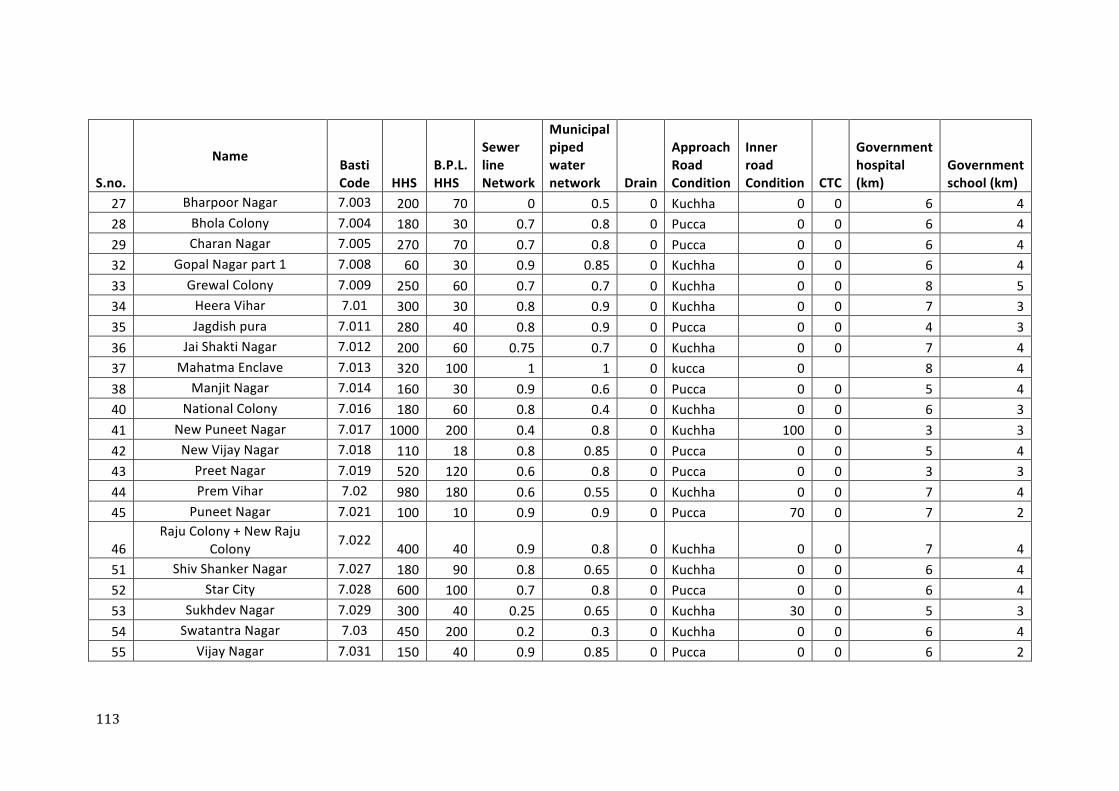
113
S.no.
Name Basti Code HHS
B.P.L. HHS
Sewer line Network
Municipal piped water network Drain
Approach Road Condition
Inner road Condition CTC
Government hospital (km)
Government school (km)
27 Bharpoor Nagar 7.003 200 70 0 0.5 0 Kuchha 0 0 6 4 28 Bhola Colony 7.004 180 30 0.7 0.8 0 Pucca 0 0 6 4 29 Charan Nagar 7.005 270 70 0.7 0.8 0 Pucca 0 0 6 4 32 Gopal Nagar part 1 7.008 60 30 0.9 0.85 0 Kuchha 0 0 6 4 33 Grewal Colony 7.009 250 60 0.7 0.7 0 Kuchha 0 0 8 5 34 Heera Vihar 7.01 300 30 0.8 0.9 0 Kuchha 0 0 7 3 35 Jagdish pura 7.011 280 40 0.8 0.9 0 Pucca 0 0 4 3 36 Jai Shakti Nagar 7.012 200 60 0.75 0.7 0 Kuchha 0 0 7 4 37 Mahatma Enclave 7.013 320 100 1 1 0 kucca 0 8 4 38 Manjit Nagar 7.014 160 30 0.9 0.6 0 Pucca 0 0 5 4 40 National Colony 7.016 180 60 0.8 0.4 0 Kuchha 0 0 6 3 41 New Puneet Nagar 7.017 1000 200 0.4 0.8 0 Kuchha 100 0 3 3 42 New Vijay Nagar 7.018 110 18 0.8 0.85 0 Pucca 0 0 5 4 43 Preet Nagar 7.019 520 120 0.6 0.8 0 Pucca 0 0 3 3 44 Prem Vihar 7.02 980 180 0.6 0.55 0 Kuchha 0 0 7 4 45 Puneet Nagar 7.021 100 10 0.9 0.9 0 Pucca 70 0 7 2
46 Raju Colony + New Raju
Colony 7.022 400 40 0.9 0.8 0 Kuchha 0 0 7 4 51 Shiv Shanker Nagar 7.027 180 90 0.8 0.65 0 Kuchha 0 0 6 4 52 Star City 7.028 600 100 0.7 0.8 0 Pucca 0 0 6 4 53 Sukhdev Nagar 7.029 300 40 0.25 0.65 0 Kuchha 30 0 5 3 54 Swatantra Nagar 7.03 450 200 0.2 0.3 0 Kuchha 0 0 6 4 55 Vijay Nagar 7.031 150 40 0.9 0.85 0 Pucca 0 0 6 2
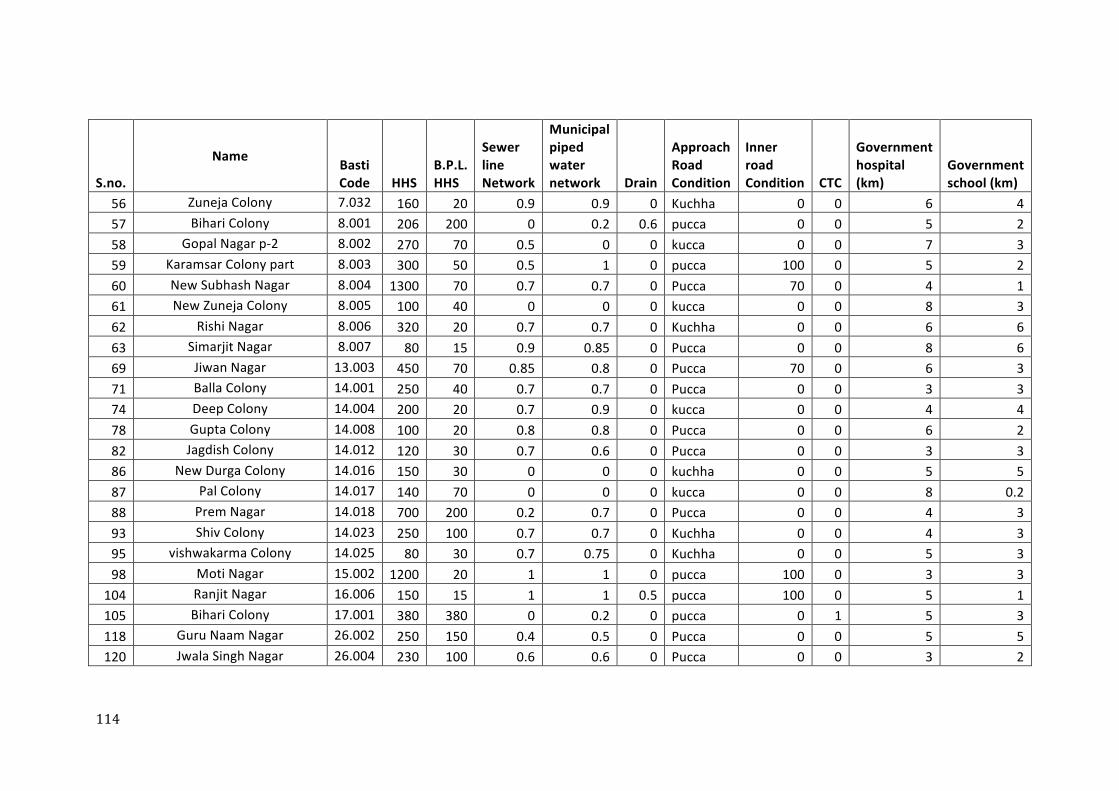
114
S.no.
Name Basti Code HHS
B.P.L. HHS
Sewer line Network
Municipal piped water network Drain
Approach Road Condition
Inner road Condition CTC
Government hospital (km)
Government school (km)
56 Zuneja Colony 7.032 160 20 0.9 0.9 0 Kuchha 0 0 6 4 57 Bihari Colony 8.001 206 200 0 0.2 0.6 pucca 0 0 5 2 58 Gopal Nagar p-‐2 8.002 270 70 0.5 0 0 kucca 0 0 7 3 59 Karamsar Colony part 8.003 300 50 0.5 1 0 pucca 100 0 5 2 60 New Subhash Nagar 8.004 1300 70 0.7 0.7 0 Pucca 70 0 4 1 61 New Zuneja Colony 8.005 100 40 0 0 0 kucca 0 0 8 3 62 Rishi Nagar 8.006 320 20 0.7 0.7 0 Kuchha 0 0 6 6 63 Simarjit Nagar 8.007 80 15 0.9 0.85 0 Pucca 0 0 8 6 69 Jiwan Nagar 13.003 450 70 0.85 0.8 0 Pucca 70 0 6 3 71 Balla Colony 14.001 250 40 0.7 0.7 0 Pucca 0 0 3 3 74 Deep Colony 14.004 200 20 0.7 0.9 0 kucca 0 0 4 4 78 Gupta Colony 14.008 100 20 0.8 0.8 0 Pucca 0 0 6 2 82 Jagdish Colony 14.012 120 30 0.7 0.6 0 Pucca 0 0 3 3 86 New Durga Colony 14.016 150 30 0 0 0 kuchha 0 0 5 5 87 Pal Colony 14.017 140 70 0 0 0 kucca 0 0 8 0.2 88 Prem Nagar 14.018 700 200 0.2 0.7 0 Pucca 0 0 4 3 93 Shiv Colony 14.023 250 100 0.7 0.7 0 Kuchha 0 0 4 3 95 vishwakarma Colony 14.025 80 30 0.7 0.75 0 Kuchha 0 0 5 3 98 Moti Nagar 15.002 1200 20 1 1 0 pucca 100 0 3 3
104 Ranjit Nagar 16.006 150 15 1 1 0.5 pucca 100 0 5 1 105 Bihari Colony 17.001 380 380 0 0.2 0 pucca 0 1 5 3 118 Guru Naam Nagar 26.002 250 150 0.4 0.5 0 Pucca 0 0 5 5 120 Jwala Singh Nagar 26.004 230 100 0.6 0.6 0 Pucca 0 0 3 2

115
S.no.
Name Basti Code HHS
B.P.L. HHS
Sewer line Network
Municipal piped water network Drain
Approach Road Condition
Inner road Condition CTC
Government hospital (km)
Government school (km)
121 Rajori Garden 26.005 100 20 0.7 0.8 0 Kuchha 0 0 5 3 122 Sunil Nagar/Surendra park 26.006 500 350 0.3 0.5 0 Pucca 0 0 5 5 123 Swati Nagar 26.007 200 80 0.2 0.2 0 Kuchha 0 0 5 5 125 Bhagwati Vihar 27.001 130 130 1 1 0 kucca 0 0 6 3 132 Jawan Vihar 31.003 300 50 1 0.7 0 Pucca 0 0 4 2 133 Nidan Singh Nagar 31.004 500 100 0.7 0.7 0 Pucca 0 0 5 3 134 Pritam Nagar 31.005 400 40 0.8 0.75 0 Pucca 30 0 4 2 136 New Valmiki Nagar 32.001 150 45 0 0.5 1 Pucca 0 0 2 2 139 Jasal House (Jagraon Bridge) 36.001 45 45 1 1 0 Pucca 100 0 2 2 141 New Kartar Nagar 45.001 25 18 0.9 0.9 0 Pucca 100 0 4 1 142 Preet Nagar 45.002 80 10 0.9 0.9 0 Pucca 0 0 3 3 143 Fauzi Mohalla 46.001 50 40 1 0.9 0 Pucca 0 0 5 1 153 Dairy complex p-‐1 55.002 90 50 0 0 0 Kuchha 0 0 4 2 154 Dairy complex p-‐2 55.003 50 70 0 0 0 Pucca 0 0 4 2 157 Barewal awana 58.001 300 150 1 1 0 pucca 100 0 5 3 158 Fatahpur awana 58.002 100 70 1 1 0 pucca 100 0 5 3 163 Shyam Nagar 59.005 40 40 0 0 0 Pucca 0 0 3 3 169 Guru Gobind Singh Nagar 62.002 230 92 0 0.8 0 Kuchha 0 0 6 3 171 Ishwar Nagar D-‐block 62.004 50 50 0 0.8 0 pucca 0 0 5 2 173 Shaheed Sukhdev Nagar 64.002 250 40 0.8 0.8 0 Kuchha 0 0 5 3 177 Millitary Camp 71.001 45 30 0 0.3 0 Pucca 0 0 5 2 178 Gaspur Khal 72.001 110 60 0.45 0.6 0 Pucca 0 0 3 1.5 179 Adarsh Nagar 73.001 150 20 1 0.9 0 Pucca 0 0 6 2
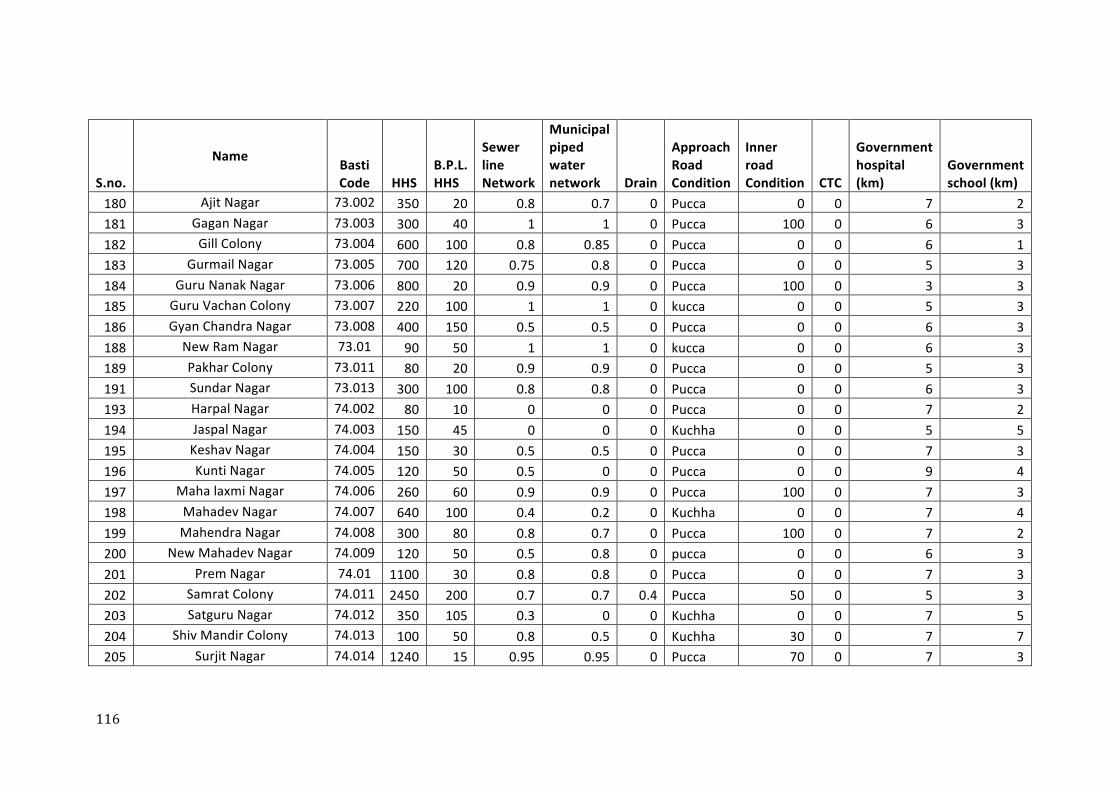
116
S.no.
Name Basti Code HHS
B.P.L. HHS
Sewer line Network
Municipal piped water network Drain
Approach Road Condition
Inner road Condition CTC
Government hospital (km)
Government school (km)
180 Ajit Nagar 73.002 350 20 0.8 0.7 0 Pucca 0 0 7 2 181 Gagan Nagar 73.003 300 40 1 1 0 Pucca 100 0 6 3 182 Gill Colony 73.004 600 100 0.8 0.85 0 Pucca 0 0 6 1 183 Gurmail Nagar 73.005 700 120 0.75 0.8 0 Pucca 0 0 5 3 184 Guru Nanak Nagar 73.006 800 20 0.9 0.9 0 Pucca 100 0 3 3 185 Guru Vachan Colony 73.007 220 100 1 1 0 kucca 0 0 5 3 186 Gyan Chandra Nagar 73.008 400 150 0.5 0.5 0 Pucca 0 0 6 3 188 New Ram Nagar 73.01 90 50 1 1 0 kucca 0 0 6 3 189 Pakhar Colony 73.011 80 20 0.9 0.9 0 Pucca 0 0 5 3 191 Sundar Nagar 73.013 300 100 0.8 0.8 0 Pucca 0 0 6 3 193 Harpal Nagar 74.002 80 10 0 0 0 Pucca 0 0 7 2 194 Jaspal Nagar 74.003 150 45 0 0 0 Kuchha 0 0 5 5 195 Keshav Nagar 74.004 150 30 0.5 0.5 0 Pucca 0 0 7 3 196 Kunti Nagar 74.005 120 50 0.5 0 0 Pucca 0 0 9 4 197 Maha laxmi Nagar 74.006 260 60 0.9 0.9 0 Pucca 100 0 7 3 198 Mahadev Nagar 74.007 640 100 0.4 0.2 0 Kuchha 0 0 7 4 199 Mahendra Nagar 74.008 300 80 0.8 0.7 0 Pucca 100 0 7 2 200 New Mahadev Nagar 74.009 120 50 0.5 0.8 0 pucca 0 0 6 3 201 Prem Nagar 74.01 1100 30 0.8 0.8 0 Pucca 0 0 7 3 202 Samrat Colony 74.011 2450 200 0.7 0.7 0.4 Pucca 50 0 5 3 203 Satguru Nagar 74.012 350 105 0.3 0 0 Kuchha 0 0 7 5 204 Shiv Mandir Colony 74.013 100 50 0.8 0.5 0 Kuchha 30 0 7 7 205 Surjit Nagar 74.014 1240 15 0.95 0.95 0 Pucca 70 0 7 3
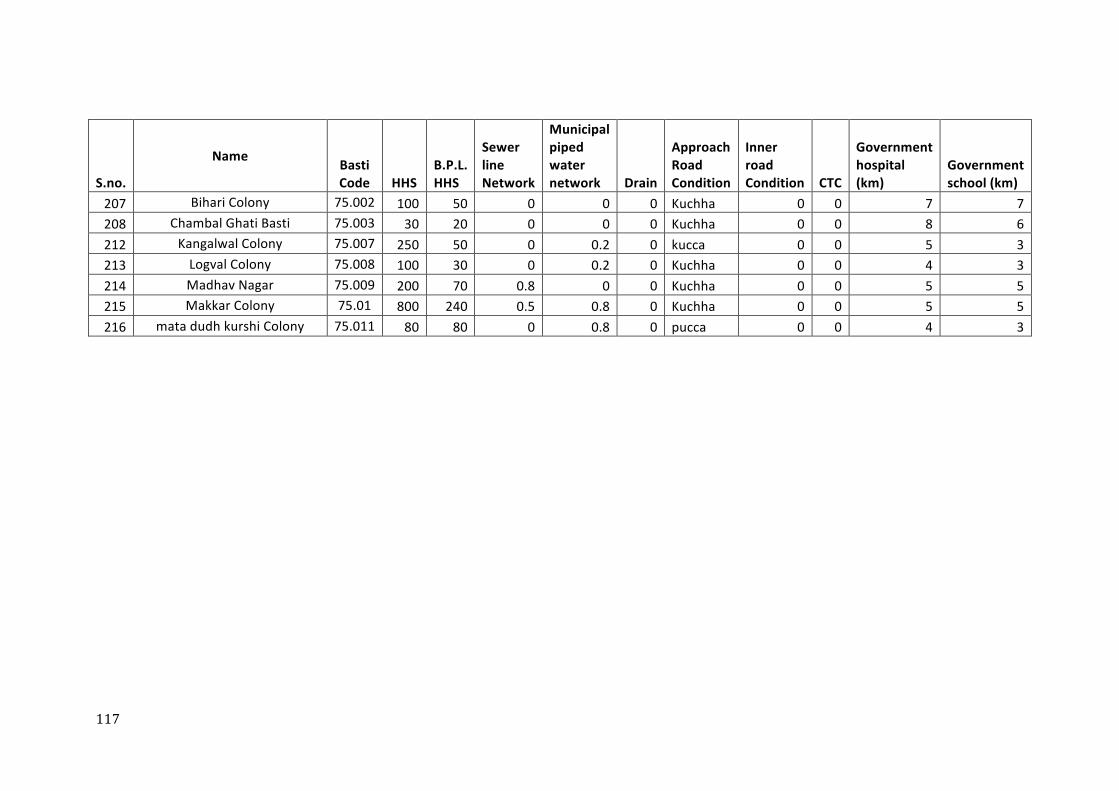
117
S.no.
Name Basti Code HHS
B.P.L. HHS
Sewer line Network
Municipal piped water network Drain
Approach Road Condition
Inner road Condition CTC
Government hospital (km)
Government school (km)
207 Bihari Colony 75.002 100 50 0 0 0 Kuchha 0 0 7 7 208 Chambal Ghati Basti 75.003 30 20 0 0 0 Kuchha 0 0 8 6 212 Kangalwal Colony 75.007 250 50 0 0.2 0 kucca 0 0 5 3 213 Logval Colony 75.008 100 30 0 0.2 0 Kuchha 0 0 4 3 214 Madhav Nagar 75.009 200 70 0.8 0 0 Kuchha 0 0 5 5 215 Makkar Colony 75.01 800 240 0.5 0.8 0 Kuchha 0 0 5 5 216 mata dudh kurshi Colony 75.011 80 80 0 0.8 0 pucca 0 0 4 3
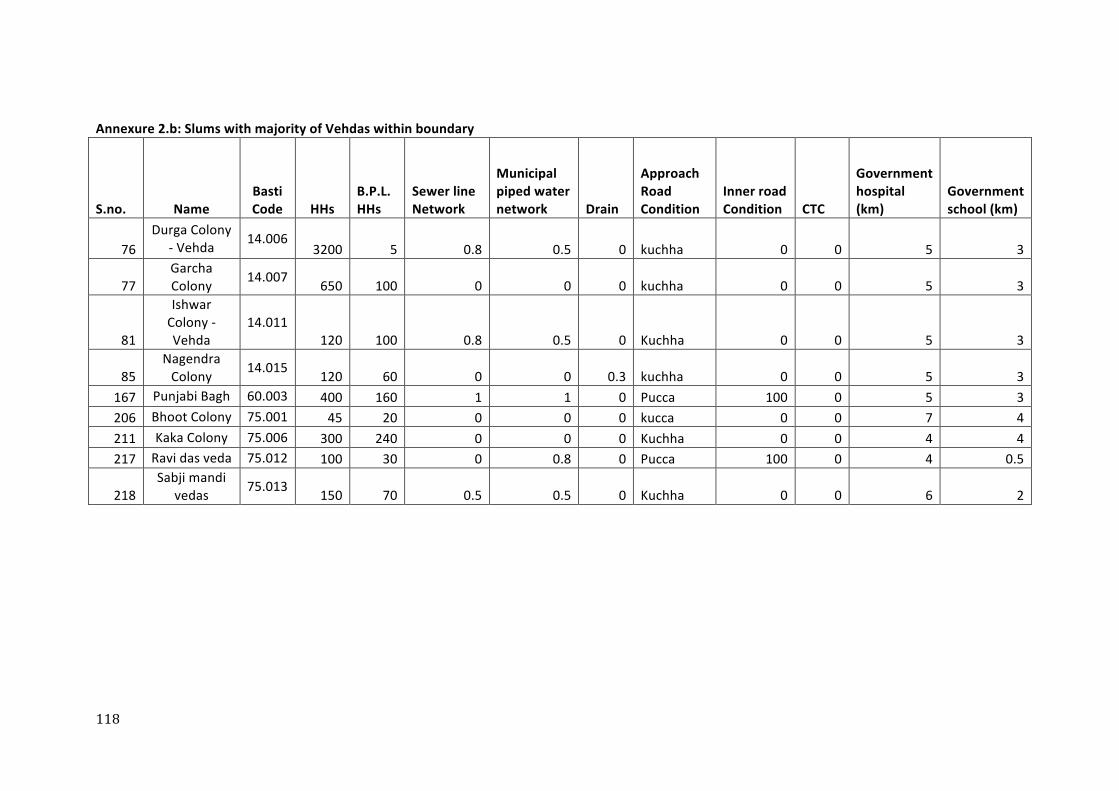
118
Annexure 2.b: Slums with majority of Vehdas within boundary
S.no. Name Basti Code HHs
B.P.L. HHs
Sewer line Network
Municipal piped water network Drain
Approach Road Condition
Inner road Condition CTC
Government hospital (km)
Government school (km)
76 Durga Colony
-‐ Vehda 14.006 3200 5 0.8 0.5 0 kuchha 0 0 5 3
77 Garcha Colony 14.007 650 100 0 0 0 kuchha 0 0 5 3
81
Ishwar Colony -‐ Vehda
14.011 120 100 0.8 0.5 0 Kuchha 0 0 5 3
85 Nagendra Colony 14.015 120 60 0 0 0.3 kuchha 0 0 5 3
167 Punjabi Bagh 60.003 400 160 1 1 0 Pucca 100 0 5 3 206 Bhoot Colony 75.001 45 20 0 0 0 kucca 0 0 7 4 211 Kaka Colony 75.006 300 240 0 0 0 Kuchha 0 0 4 4 217 Ravi das veda 75.012 100 30 0 0.8 0 Pucca 100 0 4 0.5
218 Sabji mandi
vedas 75.013 150 70 0.5 0.5 0 Kuchha 0 0 6 2
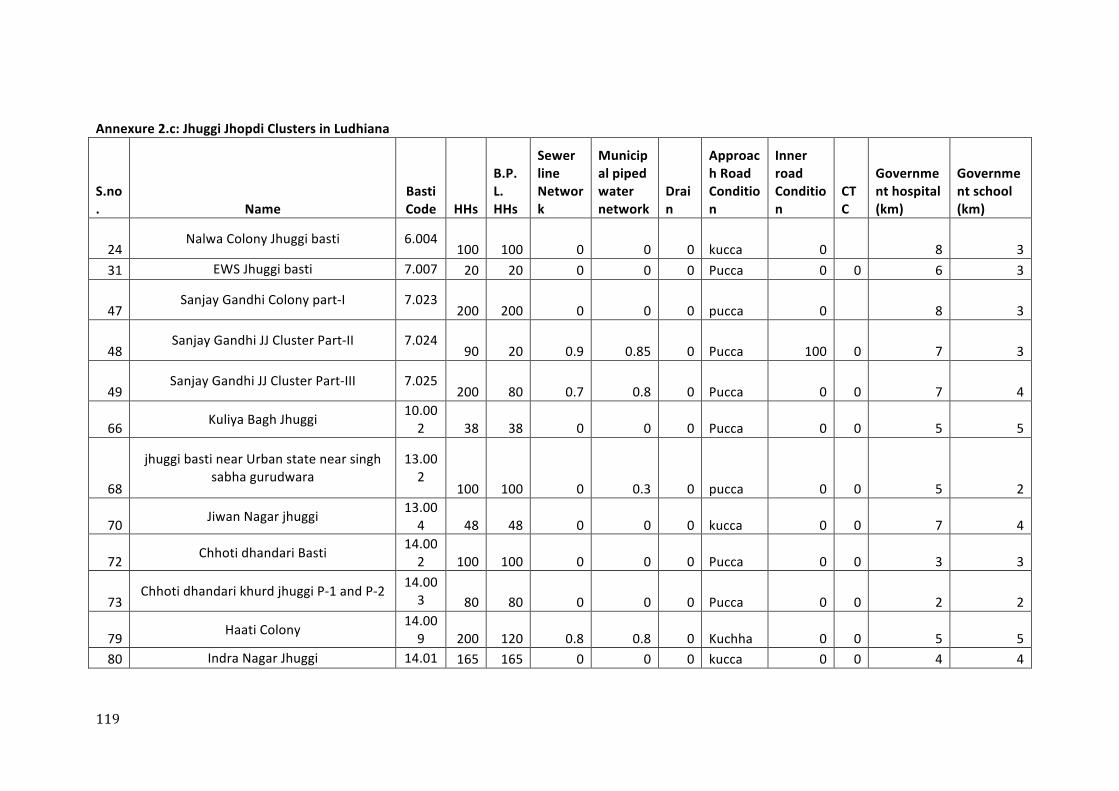
119
Annexure 2.c: Jhuggi Jhopdi Clusters in Ludhiana
S.no. Name
Basti Code HHs
B.P.L. HHs
Sewer line Network
Municipal piped water network
Drain
Approach Road Condition
Inner road Condition
CTC
Government hospital (km)
Government school (km)
24 Nalwa Colony Jhuggi basti 6.004
100 100 0 0 0 kucca 0 8 3 31 EWS Jhuggi basti 7.007 20 20 0 0 0 Pucca 0 0 6 3
47 Sanjay Gandhi Colony part-‐I 7.023
200 200 0 0 0 pucca 0 8 3
48 Sanjay Gandhi JJ Cluster Part-‐II 7.024
90 20 0.9 0.85 0 Pucca 100 0 7 3
49 Sanjay Gandhi JJ Cluster Part-‐III 7.025
200 80 0.7 0.8 0 Pucca 0 0 7 4
66 Kuliya Bagh Jhuggi 10.002 38 38 0 0 0 Pucca 0 0 5 5
68
jhuggi basti near Urban state near singh sabha gurudwara
13.002
100 100 0 0.3 0 pucca 0 0 5 2
70 Jiwan Nagar jhuggi 13.004 48 48 0 0 0 kucca 0 0 7 4
72 Chhoti dhandari Basti 14.002 100 100 0 0 0 Pucca 0 0 3 3
73 Chhoti dhandari khurd jhuggi P-‐1 and P-‐2 14.00
3 80 80 0 0 0 Pucca 0 0 2 2
79 Haati Colony 14.009 200 120 0.8 0.8 0 Kuchha 0 0 5 5
80 Indra Nagar Jhuggi 14.01 165 165 0 0 0 kucca 0 0 4 4
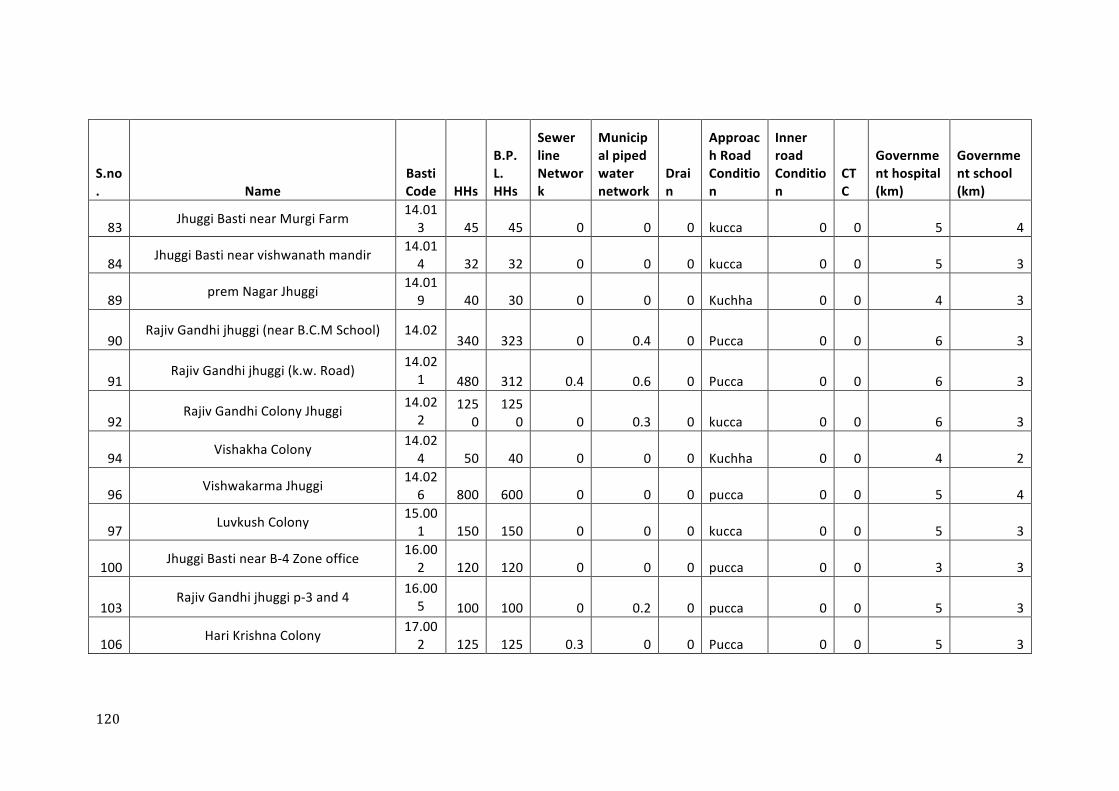
120
S.no. Name
Basti Code HHs
B.P.L. HHs
Sewer line Network
Municipal piped water network
Drain
Approach Road Condition
Inner road Condition
CTC
Government hospital (km)
Government school (km)
83 Jhuggi Basti near Murgi Farm 14.013 45 45 0 0 0 kucca 0 0 5 4
84 Jhuggi Basti near vishwanath mandir 14.014 32 32 0 0 0 kucca 0 0 5 3
89 prem Nagar Jhuggi 14.019 40 30 0 0 0 Kuchha 0 0 4 3
90 Rajiv Gandhi jhuggi (near B.C.M School) 14.02
340 323 0 0.4 0 Pucca 0 0 6 3
91 Rajiv Gandhi jhuggi (k.w. Road) 14.02
1 480 312 0.4 0.6 0 Pucca 0 0 6 3
92 Rajiv Gandhi Colony Jhuggi 14.02
2 125
0 125
0 0 0.3 0 kucca 0 0 6 3
94 Vishakha Colony 14.024 50 40 0 0 0 Kuchha 0 0 4 2
96 Vishwakarma Jhuggi 14.026 800 600 0 0 0 pucca 0 0 5 4
97 Luvkush Colony 15.001 150 150 0 0 0 kucca 0 0 5 3
100 Jhuggi Basti near B-‐4 Zone office 16.002 120 120 0 0 0 pucca 0 0 3 3
103 Rajiv Gandhi jhuggi p-‐3 and 4 16.00
5 100 100 0 0.2 0 pucca 0 0 5 3
106 Hari Krishna Colony 17.002 125 125 0.3 0 0 Pucca 0 0 5 3
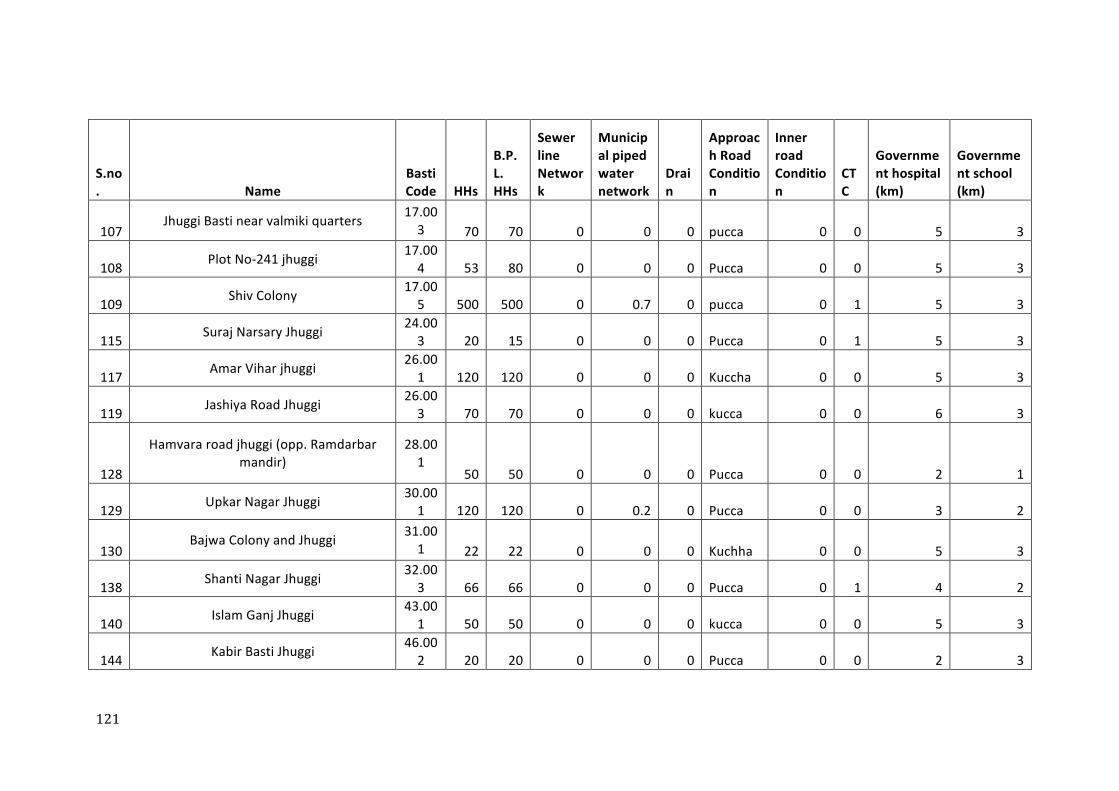
121
S.no. Name
Basti Code HHs
B.P.L. HHs
Sewer line Network
Municipal piped water network
Drain
Approach Road Condition
Inner road Condition
CTC
Government hospital (km)
Government school (km)
107 Jhuggi Basti near valmiki quarters 17.00
3 70 70 0 0 0 pucca 0 0 5 3
108 Plot No-‐241 jhuggi 17.004 53 80 0 0 0 Pucca 0 0 5 3
109 Shiv Colony 17.005 500 500 0 0.7 0 pucca 0 1 5 3
115 Suraj Narsary Jhuggi 24.003 20 15 0 0 0 Pucca 0 1 5 3
117 Amar Vihar jhuggi 26.001 120 120 0 0 0 Kuccha 0 0 5 3
119 Jashiya Road Jhuggi 26.003 70 70 0 0 0 kucca 0 0 6 3
128
Hamvara road jhuggi (opp. Ramdarbar mandir)
28.001
50 50 0 0 0 Pucca 0 0 2 1
129 Upkar Nagar Jhuggi 30.001 120 120 0 0.2 0 Pucca 0 0 3 2
130 Bajwa Colony and Jhuggi 31.00
1 22 22 0 0 0 Kuchha 0 0 5 3
138 Shanti Nagar Jhuggi 32.003 66 66 0 0 0 Pucca 0 1 4 2
140 Islam Ganj Jhuggi 43.001 50 50 0 0 0 kucca 0 0 5 3
144 Kabir Basti Jhuggi 46.002 20 20 0 0 0 Pucca 0 0 2 3
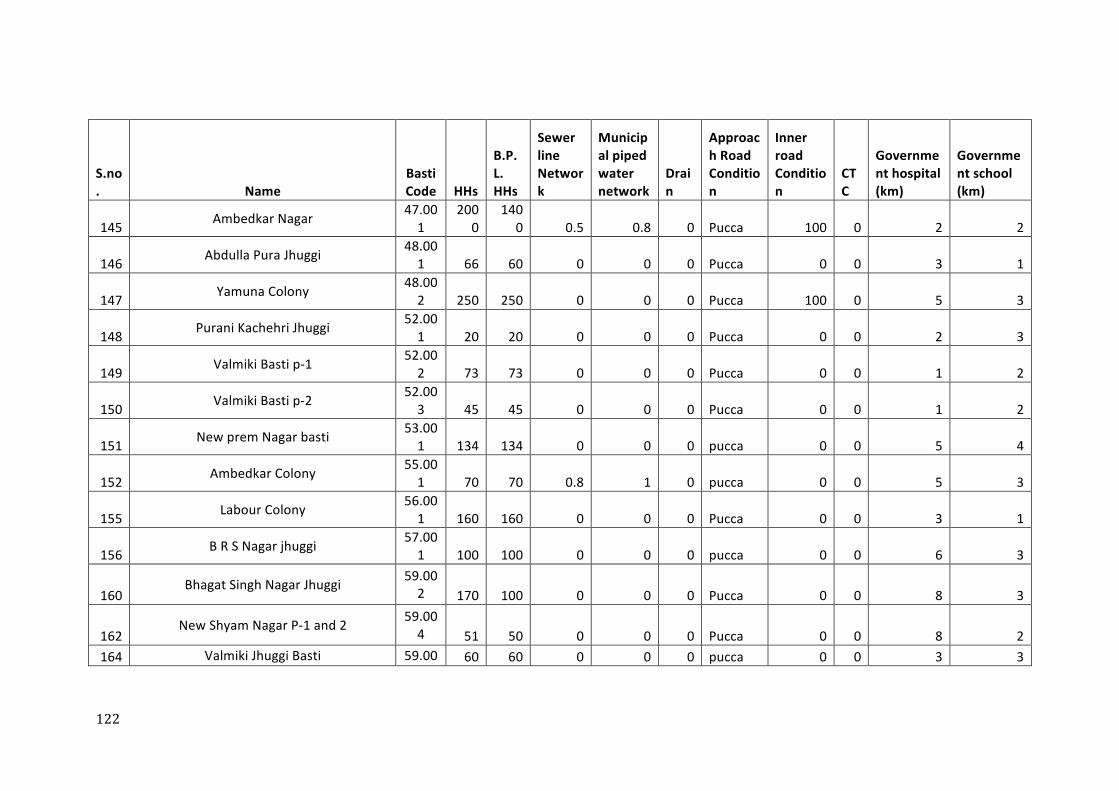
122
S.no. Name
Basti Code HHs
B.P.L. HHs
Sewer line Network
Municipal piped water network
Drain
Approach Road Condition
Inner road Condition
CTC
Government hospital (km)
Government school (km)
145 Ambedkar Nagar 47.001
2000
1400 0.5 0.8 0 Pucca 100 0 2 2
146 Abdulla Pura Jhuggi 48.001 66 60 0 0 0 Pucca 0 0 3 1
147 Yamuna Colony 48.002 250 250 0 0 0 Pucca 100 0 5 3
148 Purani Kachehri Jhuggi 52.001 20 20 0 0 0 Pucca 0 0 2 3
149 Valmiki Basti p-‐1 52.002 73 73 0 0 0 Pucca 0 0 1 2
150 Valmiki Basti p-‐2 52.003 45 45 0 0 0 Pucca 0 0 1 2
151 New prem Nagar basti 53.001 134 134 0 0 0 pucca 0 0 5 4
152 Ambedkar Colony 55.001 70 70 0.8 1 0 pucca 0 0 5 3
155 Labour Colony 56.001 160 160 0 0 0 Pucca 0 0 3 1
156 B R S Nagar jhuggi 57.001 100 100 0 0 0 pucca 0 0 6 3
160 Bhagat Singh Nagar Jhuggi 59.00
2 170 100 0 0 0 Pucca 0 0 8 3
162 New Shyam Nagar P-‐1 and 2 59.00
4 51 50 0 0 0 Pucca 0 0 8 2 164 Valmiki Jhuggi Basti 59.00 60 60 0 0 0 pucca 0 0 3 3
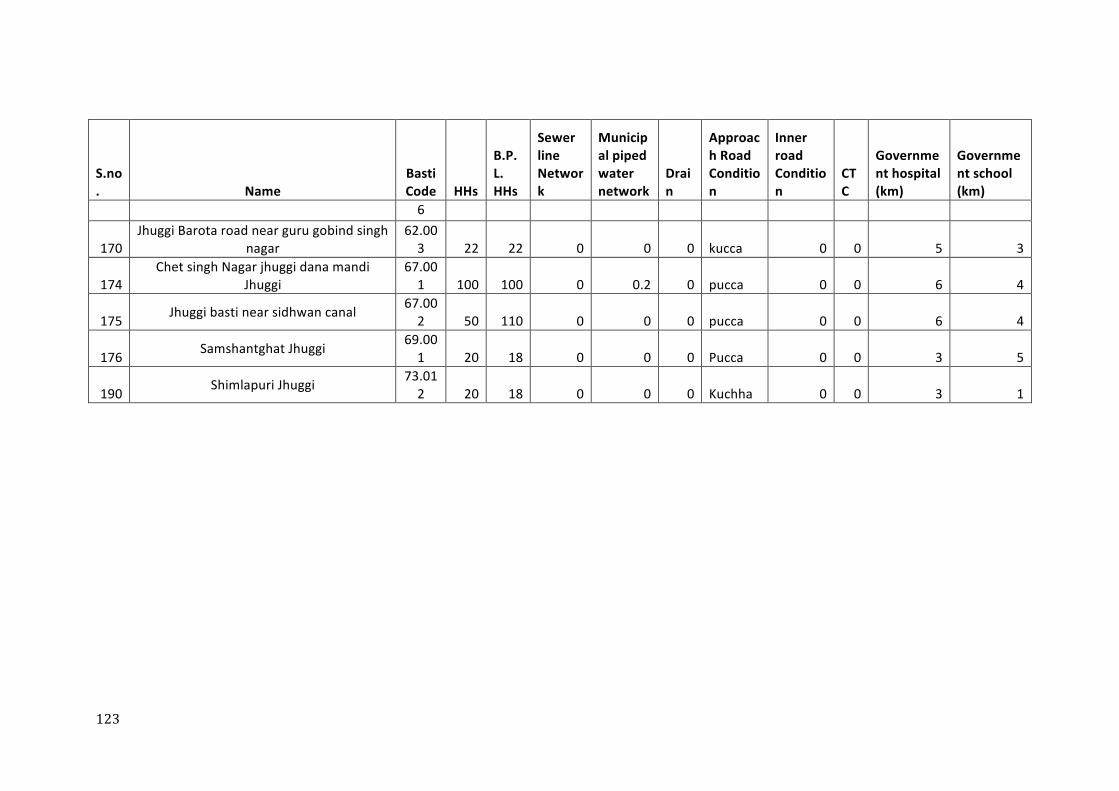
123
S.no. Name
Basti Code HHs
B.P.L. HHs
Sewer line Network
Municipal piped water network
Drain
Approach Road Condition
Inner road Condition
CTC
Government hospital (km)
Government school (km)
6
170 Jhuggi Barota road near guru gobind singh
nagar 62.003 22 22 0 0 0 kucca 0 0 5 3
174 Chet singh Nagar jhuggi dana mandi
Jhuggi 67.001 100 100 0 0.2 0 pucca 0 0 6 4
175 Jhuggi basti near sidhwan canal 67.002 50 110 0 0 0 pucca 0 0 6 4
176 Samshantghat Jhuggi 69.001 20 18 0 0 0 Pucca 0 0 3 5
190 Shimlapuri Jhuggi 73.012 20 18 0 0 0 Kuchha 0 0 3 1
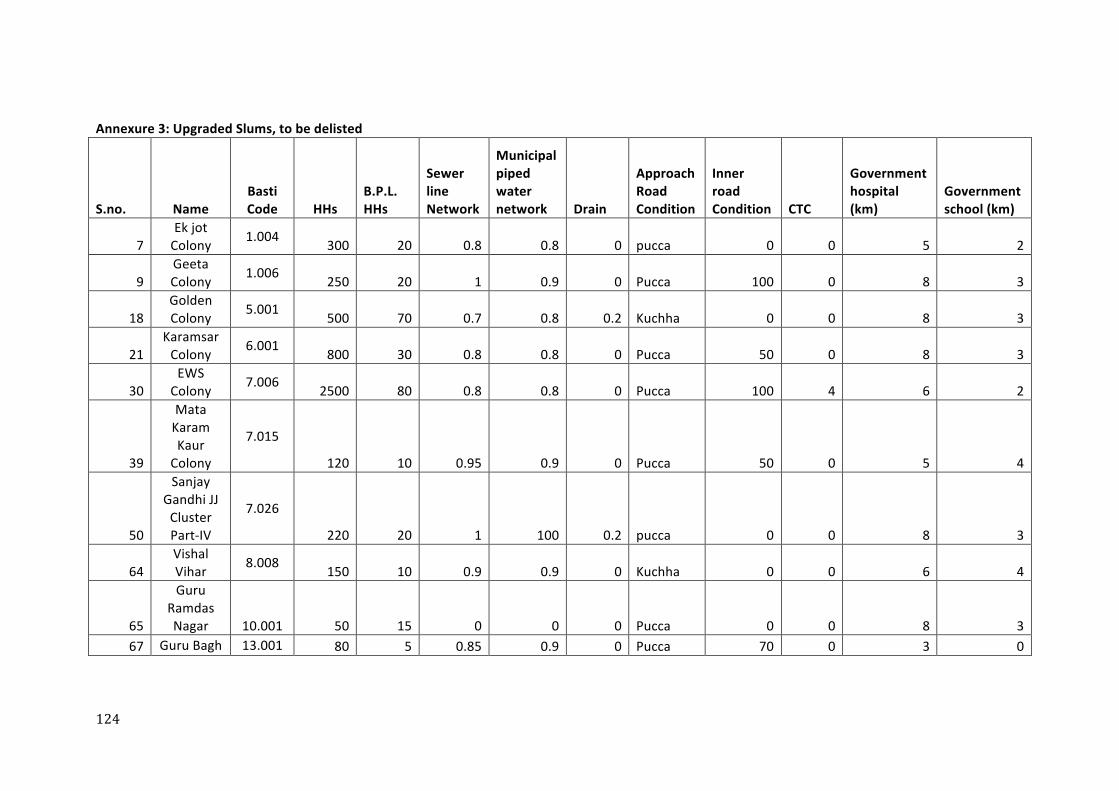
124
Annexure 3: Upgraded Slums, to be delisted
S.no. Name Basti Code HHs
B.P.L. HHs
Sewer line Network
Municipal piped water network Drain
Approach Road Condition
Inner road Condition CTC
Government hospital (km)
Government school (km)
7 Ek jot Colony 1.004 300 20 0.8 0.8 0 pucca 0 0 5 2
9 Geeta Colony 1.006 250 20 1 0.9 0 Pucca 100 0 8 3
18 Golden Colony 5.001 500 70 0.7 0.8 0.2 Kuchha 0 0 8 3
21 Karamsar Colony 6.001 800 30 0.8 0.8 0 Pucca 50 0 8 3
30 EWS Colony 7.006 2500 80 0.8 0.8 0 Pucca 100 4 6 2
39
Mata Karam Kaur Colony
7.015
120 10 0.95 0.9 0 Pucca 50 0 5 4
50
Sanjay Gandhi JJ Cluster Part-‐IV
7.026
220 20 1 100 0.2 pucca 0 0 8 3
64 Vishal Vihar 8.008 150 10 0.9 0.9 0 Kuchha 0 0 6 4
65
Guru Ramdas Nagar 10.001 50 15 0 0 0 Pucca 0 0 8 3
67 Guru Bagh 13.001 80 5 0.85 0.9 0 Pucca 70 0 3 0
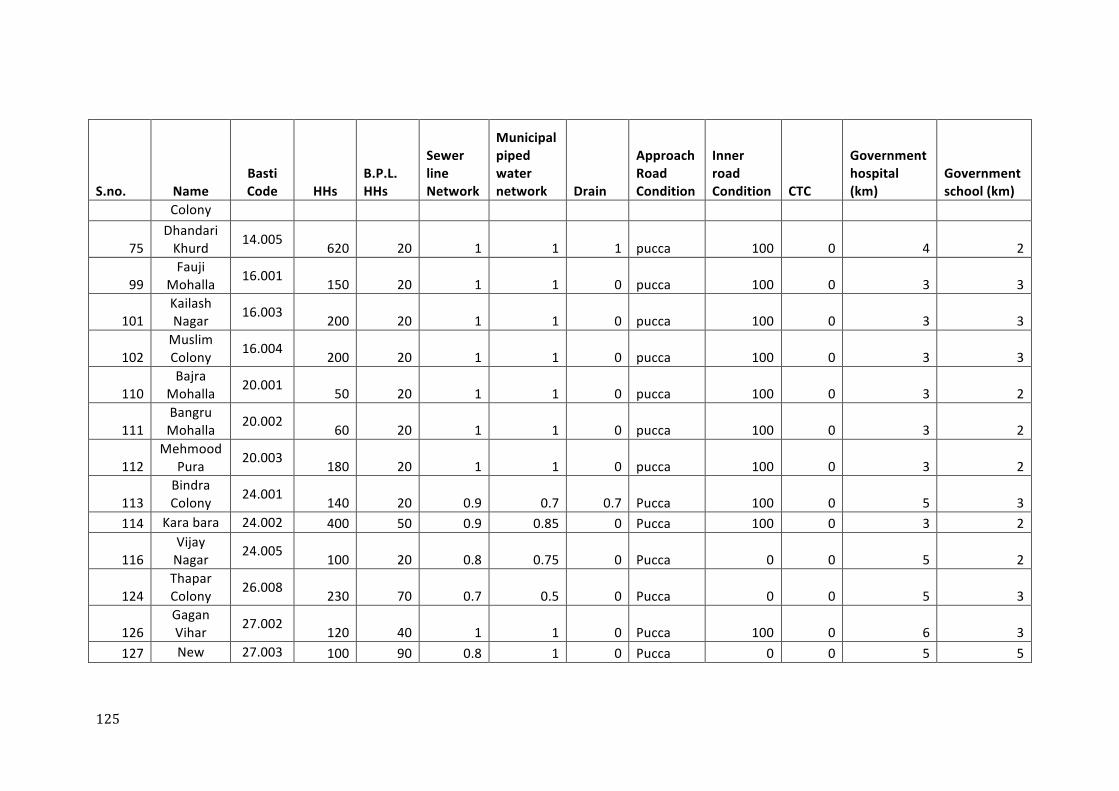
125
S.no. Name Basti Code HHs
B.P.L. HHs
Sewer line Network
Municipal piped water network Drain
Approach Road Condition
Inner road Condition CTC
Government hospital (km)
Government school (km)
Colony
75 Dhandari Khurd 14.005 620 20 1 1 1 pucca 100 0 4 2
99 Fauji
Mohalla 16.001 150 20 1 1 0 pucca 100 0 3 3
101 Kailash Nagar 16.003 200 20 1 1 0 pucca 100 0 3 3
102 Muslim Colony 16.004 200 20 1 1 0 pucca 100 0 3 3
110 Bajra
Mohalla 20.001 50 20 1 1 0 pucca 100 0 3 2
111 Bangru Mohalla 20.002 60 20 1 1 0 pucca 100 0 3 2
112 Mehmood
Pura 20.003 180 20 1 1 0 pucca 100 0 3 2
113 Bindra Colony 24.001 140 20 0.9 0.7 0.7 Pucca 100 0 5 3
114 Kara bara 24.002 400 50 0.9 0.85 0 Pucca 100 0 3 2
116 Vijay Nagar 24.005 100 20 0.8 0.75 0 Pucca 0 0 5 2
124 Thapar Colony 26.008 230 70 0.7 0.5 0 Pucca 0 0 5 3
126 Gagan Vihar 27.002 120 40 1 1 0 Pucca 100 0 6 3
127 New 27.003 100 90 0.8 1 0 Pucca 0 0 5 5
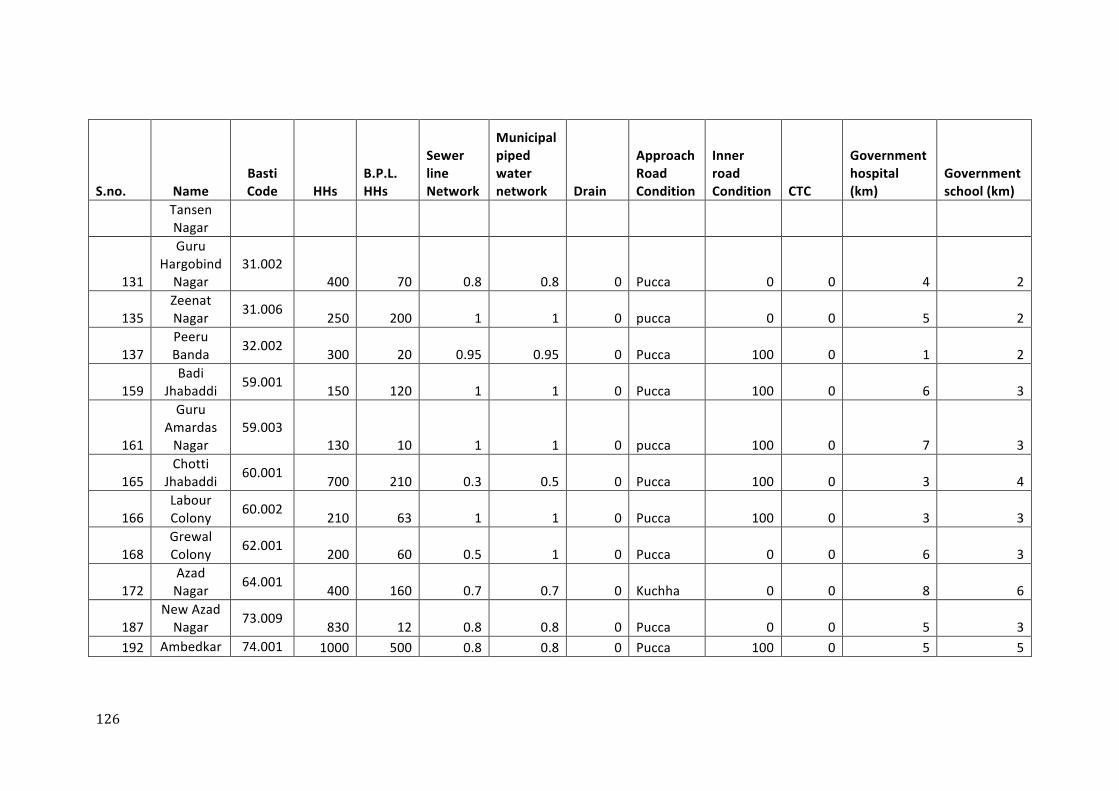
126
S.no. Name Basti Code HHs
B.P.L. HHs
Sewer line Network
Municipal piped water network Drain
Approach Road Condition
Inner road Condition CTC
Government hospital (km)
Government school (km)
Tansen Nagar
131
Guru Hargobind Nagar
31.002 400 70 0.8 0.8 0 Pucca 0 0 4 2
135 Zeenat Nagar 31.006 250 200 1 1 0 pucca 0 0 5 2
137 Peeru Banda 32.002 300 20 0.95 0.95 0 Pucca 100 0 1 2
159 Badi
Jhabaddi 59.001 150 120 1 1 0 Pucca 100 0 6 3
161
Guru Amardas Nagar
59.003 130 10 1 1 0 pucca 100 0 7 3
165 Chotti
Jhabaddi 60.001 700 210 0.3 0.5 0 Pucca 100 0 3 4
166 Labour Colony 60.002 210 63 1 1 0 Pucca 100 0 3 3
168 Grewal Colony 62.001 200 60 0.5 1 0 Pucca 0 0 6 3
172 Azad Nagar 64.001 400 160 0.7 0.7 0 Kuchha 0 0 8 6
187 New Azad Nagar 73.009 830 12 0.8 0.8 0 Pucca 0 0 5 3
192 Ambedkar 74.001 1000 500 0.8 0.8 0 Pucca 100 0 5 5
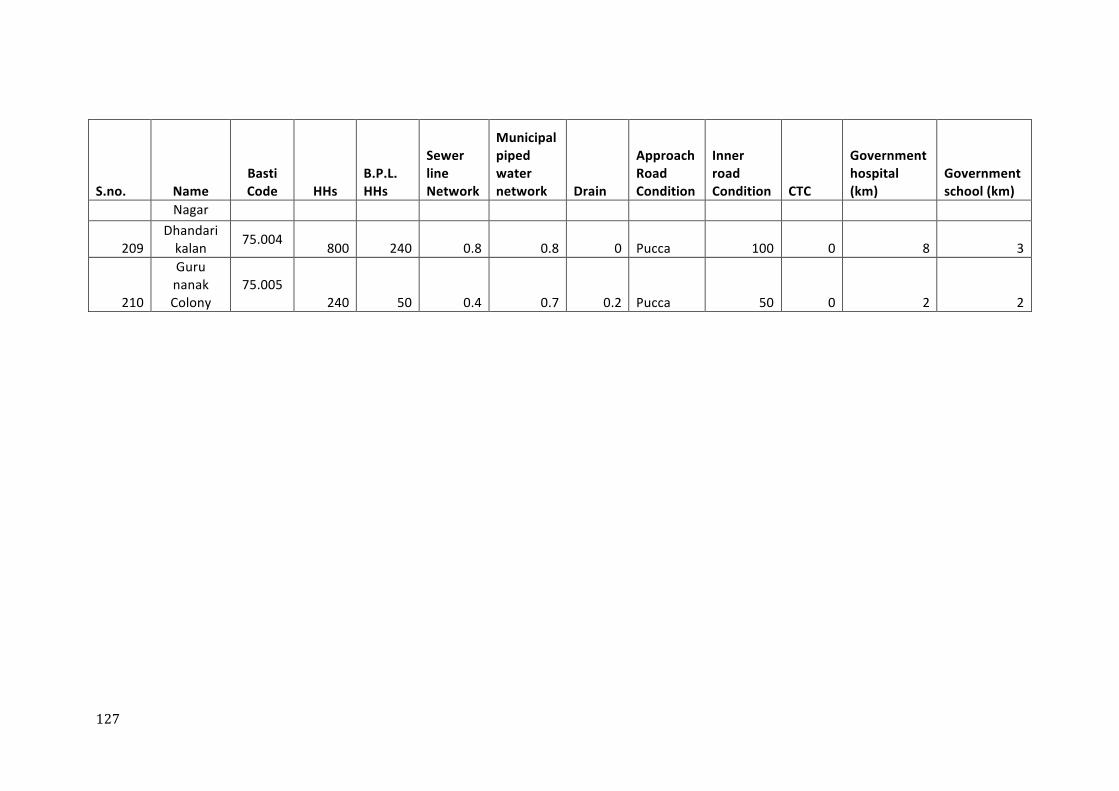
127
S.no. Name Basti Code HHs
B.P.L. HHs
Sewer line Network
Municipal piped water network Drain
Approach Road Condition
Inner road Condition CTC
Government hospital (km)
Government school (km)
Nagar
209 Dhandari kalan 75.004 800 240 0.8 0.8 0 Pucca 100 0 8 3
210
Guru nanak Colony
75.005 240 50 0.4 0.7 0.2 Pucca 50 0 2 2
128
Slums to be targeted in Phase 1
S.no. Name of Slum Ward No. Basti Code
Area (acres) Households
Land Ownership
Non confirming Land use Category
1 Vishwakarma Jhuggi 14 14.026 8.368864 800 Public MCL JJ cluster 2 Shiv Colony 17 17.005 3.140182 500 Public MCL JJ cluster 3 New prem Nagar basti 53 53.001 3.205084 134 Public Punjab Gov JJ cluster 4 Ambedkar Colony 55 55.001 1.4 70 Public MCL JJ cluster 5 Shimlapuri Jhuggi 73 73.012 1.297646 20 Public PUDA JJ cluster 6 Rajiv Gandhi jhuggi (near B.C.M School) 14 14.02 3.095349 340 Public NA JJ cluster
7 Baba Namdev Colony Outside MCL 0.001 5.3 130 Self Owned Industry
Unserviced area
8 Bazigar Dera 1 1.001 17.5 500 Self Owned Industry Unserviced area
9 Deep Vihar 1 1.003 3.2 200 Self Owned Industry Unserviced area
10 Fawda Bend 1 1.005 3.1 50 Self Owned Industry Unserviced area
11 Krishna Colony 4 4.003 26.139754 350 Self Owned Industry Unserviced area
12 Mayapuri 6 6.002 15.231583 200 Self Owned H T W Unserviced area
13 Gopal Nagar part 1 7 7.008 7.9 60 Self Owned H T W Unserviced area
14 Mahatma Enclave 7 7.013 12.929265 320 Self Owned Land fill site Unserviced area
15 Manjit Nagar 7 7.014 2.8 160 Self Owned H T W Unserviced area
16 National Colony 7 7.016 9.180587 180 Self Owned H T W Unserviced area
129
S.no. Name of Slum Ward No. Basti Code
Area (acres) Households
Land Ownership
Non confirming Land use Category
17 New Puneet Nagar 7 7.017 29.532699 1000 Self Owned H T W Unserviced area
18 Prem Vihar 7 7.02 38.721679 980 Self Owned H T W Unserviced area
19 Raju Colony + New Raju Colony 7 7.022 15.775265 400 Self Owned H T W Unserviced area
20 Shiv Shanker Nagar 7 7.027 9.362991 180 Self Owned Landfill side Unserviced area
21 Vijay Nagar 7 7.031 14.803286 150 Self Owned budda nala Unserviced area
22 Bihari Colony
8 8.001
1.8 206
part self owned part public budda nala
Unserviced area
23 Jiwan Nagar 13 13.003 39.8 450 Self Owned Highway Unserviced area
24 Durga Colony -‐ Vehda 14 14.006 11.7 3200 Self Owned Industry colony+Vehda
25 Garcha Colony
14 14.007
8.2 650 Self Owned Highway and railway line colony+Vehda
26 Ishwar Colony -‐ Vehda 14 14.011 0.6 120 Self Owned Railway line colony+Vehda
27 New Durga Colony 14 14.016 3.533006 150 Self Owned Railway line Unserviced area
28 Shiv Colony 14 14.023 7.164067 250 Self Owned Railways line Unserviced area
29 vishwakarma Colony 14 14.025 9.72164 80 Self Owned Railway line Unserviced area
30 New Valmiki Nagar 32 32.001 2.124078 150 Public Railway line Unserviced area
130
S.no. Name of Slum Ward No. Basti Code
Area (acres) Households
Land Ownership
Non confirming Land use Category
31 Jasal House (Jagraon Bridge) 36 36.001 0.3 45 Public Railway line Unserviced area
32 Preet Nagar 45 45.002 1.42948 80 Self Owned H T W Unserviced area
33 Dairy complex p-‐1
55 55.002
2.1 90 Public Highway and railway line
Unserviced area
34 Gaspur Khal 72 72.001 2.6 110 Self Owned H T W Unserviced area
35 Bhoot Colony 75 75.001 0.7 45 Self Owned Industry colony+Vehda
36 Bihari Colony 75 75.002 4.4 100 Self Owned Industry Unserviced area
37 Chambal Ghati Basti 75 75.003 0.6 30 Self Owned Industry Unserviced area
38 mata dudh kurshi Colony
75 75.011
2.768044 80 Public Highway and railway line
Unserviced area
39 Ravi das veda
75 75.012
6.500985 100 Self Owned Highway and railway line colony+Vehda
40 Sabji mandi vedas 75 75.013 6.265587 150 Self Owned Industry colony+Vehda
131
Phase 2: Slums to be targeted in Phase 2
S.no. Name of Slum Ward No. Basti Code
Area (acres) Households
Land Ownership
Non confirming Land use Category
1 Namdev Colony Outside MCL 0.002 10.327231 150 Self Owned No
Unserviced area
2 New Star City Outside MCL 0.003 14.291281 300 Self Owned No
Unserviced area
3 Bharti Colony 7 1.002 16.1 250 Self Owned No Unserviced area
4 Golden Vihar 1 1.007 3.3 150 Self Owned No Unserviced area
5 New Aman Nagar ext 1 1.008 2.931323 30 Self Owned No Unserviced area
6 Nanda Colony 3 3.001 7.172528 120 Self Owned No Unserviced area
7 Yashpal Colony 3 3.002 8.56863 150 Self Owned No Unserviced area
8 Baldev Nagar 4 4.001 4.8 200 Self Owned No Unserviced area
9 Kailash Nagar 4 4.002 7.1 300 Self Owned No Unserviced area
10 Vardhman Nagar 4 4.004 18.523555 800 Self Owned No Unserviced area
11 Gujjar Colony 5 5.002 6.1 250 Self Owned No Unserviced area
12 Jai Singh Nagar 5 5.003 5.6 90 Self Owned No Unserviced area
13 Nalwa Colony 6 6.003 3.268997 300 Self Owned No Unserviced area
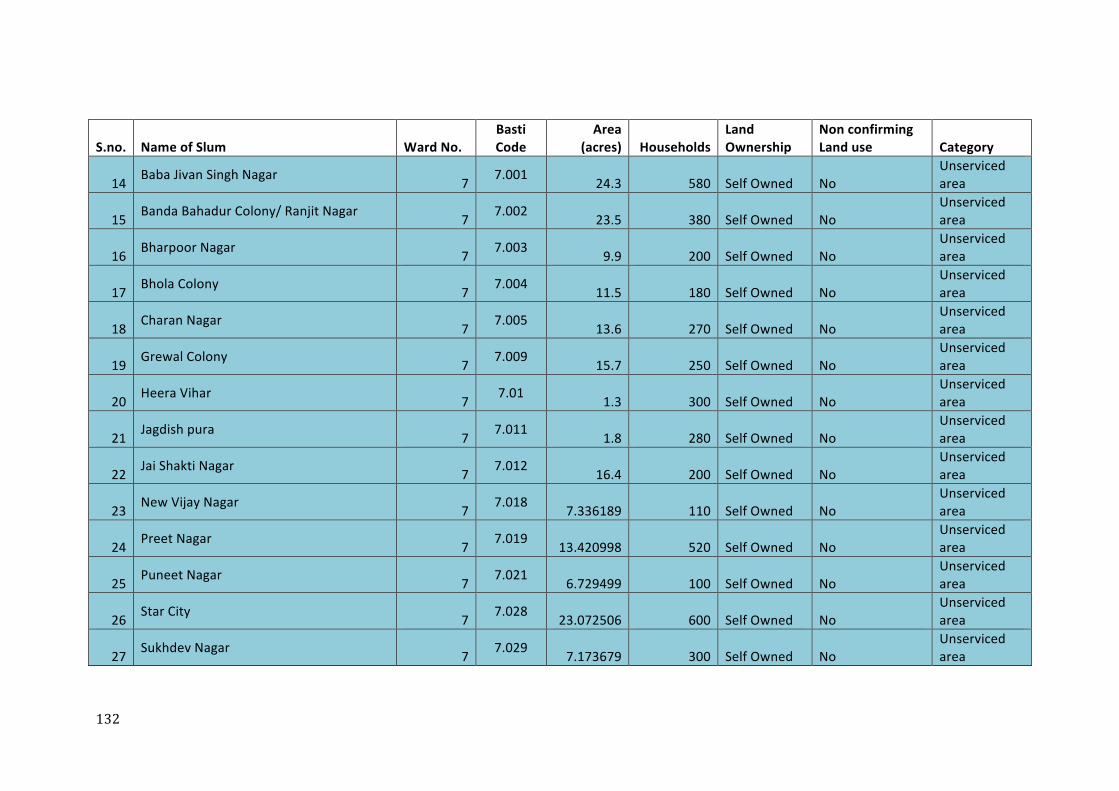
132
S.no. Name of Slum Ward No. Basti Code
Area (acres) Households
Land Ownership
Non confirming Land use Category
14 Baba Jivan Singh Nagar 7 7.001 24.3 580 Self Owned No Unserviced area
15 Banda Bahadur Colony/ Ranjit Nagar 7 7.002 23.5 380 Self Owned No Unserviced area
16 Bharpoor Nagar 7 7.003 9.9 200 Self Owned No Unserviced area
17 Bhola Colony 7 7.004 11.5 180 Self Owned No Unserviced area
18 Charan Nagar 7 7.005 13.6 270 Self Owned No Unserviced area
19 Grewal Colony 7 7.009 15.7 250 Self Owned No Unserviced area
20 Heera Vihar 7 7.01 1.3 300 Self Owned No Unserviced area
21 Jagdish pura 7 7.011 1.8 280 Self Owned No Unserviced area
22 Jai Shakti Nagar 7 7.012 16.4 200 Self Owned No Unserviced area
23 New Vijay Nagar 7 7.018 7.336189 110 Self Owned No Unserviced area
24 Preet Nagar 7 7.019 13.420998 520 Self Owned No Unserviced area
25 Puneet Nagar 7 7.021 6.729499 100 Self Owned No Unserviced area
26 Star City 7 7.028 23.072506 600 Self Owned No Unserviced area
27 Sukhdev Nagar 7 7.029 7.173679 300 Self Owned No Unserviced area
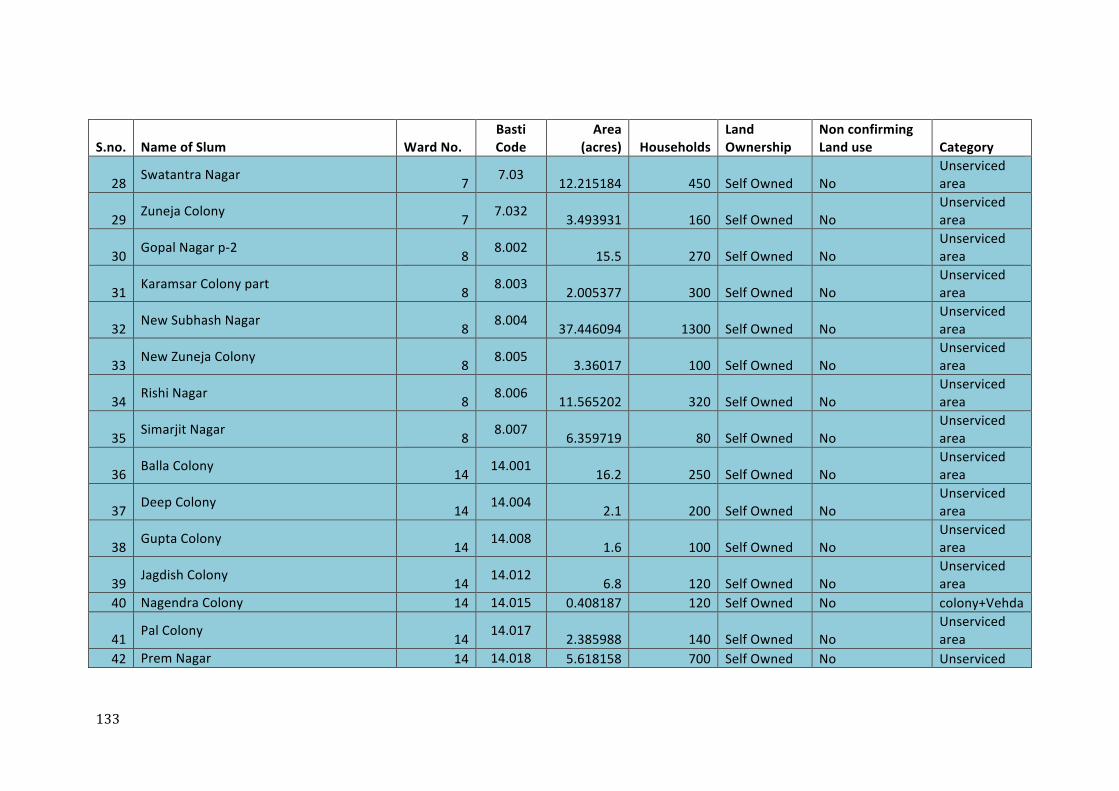
133
S.no. Name of Slum Ward No. Basti Code
Area (acres) Households
Land Ownership
Non confirming Land use Category
28 Swatantra Nagar 7 7.03 12.215184 450 Self Owned No Unserviced area
29 Zuneja Colony 7 7.032 3.493931 160 Self Owned No Unserviced area
30 Gopal Nagar p-‐2 8 8.002 15.5 270 Self Owned No Unserviced area
31 Karamsar Colony part 8 8.003 2.005377 300 Self Owned No Unserviced area
32 New Subhash Nagar 8 8.004 37.446094 1300 Self Owned No Unserviced area
33 New Zuneja Colony 8 8.005 3.36017 100 Self Owned No Unserviced area
34 Rishi Nagar 8 8.006 11.565202 320 Self Owned No Unserviced area
35 Simarjit Nagar 8 8.007 6.359719 80 Self Owned No Unserviced area
36 Balla Colony 14 14.001 16.2 250 Self Owned No Unserviced area
37 Deep Colony 14 14.004 2.1 200 Self Owned No Unserviced area
38 Gupta Colony 14 14.008 1.6 100 Self Owned No Unserviced area
39 Jagdish Colony 14 14.012 6.8 120 Self Owned No Unserviced area
40 Nagendra Colony 14 14.015 0.408187 120 Self Owned No colony+Vehda
41 Pal Colony 14 14.017 2.385988 140 Self Owned No Unserviced area
42 Prem Nagar 14 14.018 5.618158 700 Self Owned No Unserviced
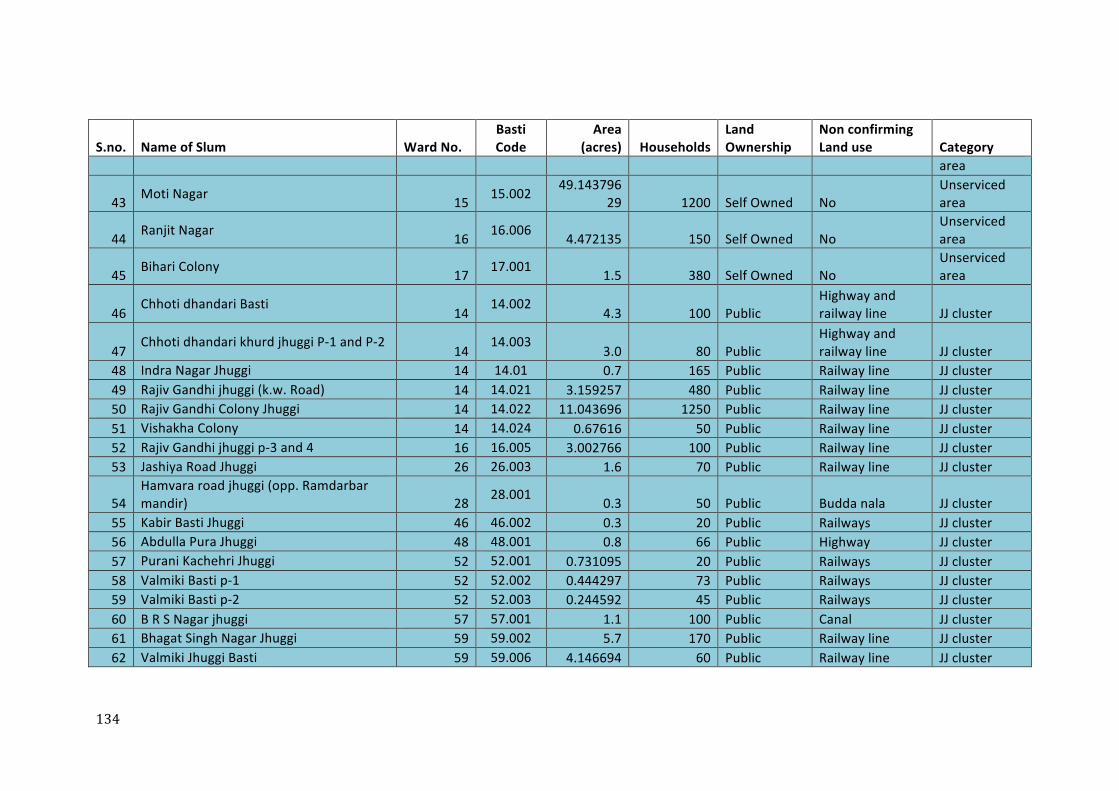
134
S.no. Name of Slum Ward No. Basti Code
Area (acres) Households
Land Ownership
Non confirming Land use Category
area
43 Moti Nagar 15 15.002 49.14379629 1200 Self Owned No
Unserviced area
44 Ranjit Nagar 16 16.006 4.472135 150 Self Owned No Unserviced area
45 Bihari Colony 17 17.001 1.5 380 Self Owned No Unserviced area
46 Chhoti dhandari Basti
14 14.002
4.3 100 Public Highway and railway line JJ cluster
47 Chhoti dhandari khurd jhuggi P-‐1 and P-‐2
14 14.003
3.0 80 Public Highway and railway line JJ cluster
48 Indra Nagar Jhuggi 14 14.01 0.7 165 Public Railway line JJ cluster 49 Rajiv Gandhi jhuggi (k.w. Road) 14 14.021 3.159257 480 Public Railway line JJ cluster 50 Rajiv Gandhi Colony Jhuggi 14 14.022 11.043696 1250 Public Railway line JJ cluster 51 Vishakha Colony 14 14.024 0.67616 50 Public Railway line JJ cluster 52 Rajiv Gandhi jhuggi p-‐3 and 4 16 16.005 3.002766 100 Public Railway line JJ cluster 53 Jashiya Road Jhuggi 26 26.003 1.6 70 Public Railway line JJ cluster
54 Hamvara road jhuggi (opp. Ramdarbar mandir) 28 28.001 0.3 50 Public Budda nala JJ cluster
55 Kabir Basti Jhuggi 46 46.002 0.3 20 Public Railways JJ cluster 56 Abdulla Pura Jhuggi 48 48.001 0.8 66 Public Highway JJ cluster 57 Purani Kachehri Jhuggi 52 52.001 0.731095 20 Public Railways JJ cluster 58 Valmiki Basti p-‐1 52 52.002 0.444297 73 Public Railways JJ cluster 59 Valmiki Basti p-‐2 52 52.003 0.244592 45 Public Railways JJ cluster 60 B R S Nagar jhuggi 57 57.001 1.1 100 Public Canal JJ cluster 61 Bhagat Singh Nagar Jhuggi 59 59.002 5.7 170 Public Railway line JJ cluster 62 Valmiki Jhuggi Basti 59 59.006 4.146694 60 Public Railway line JJ cluster
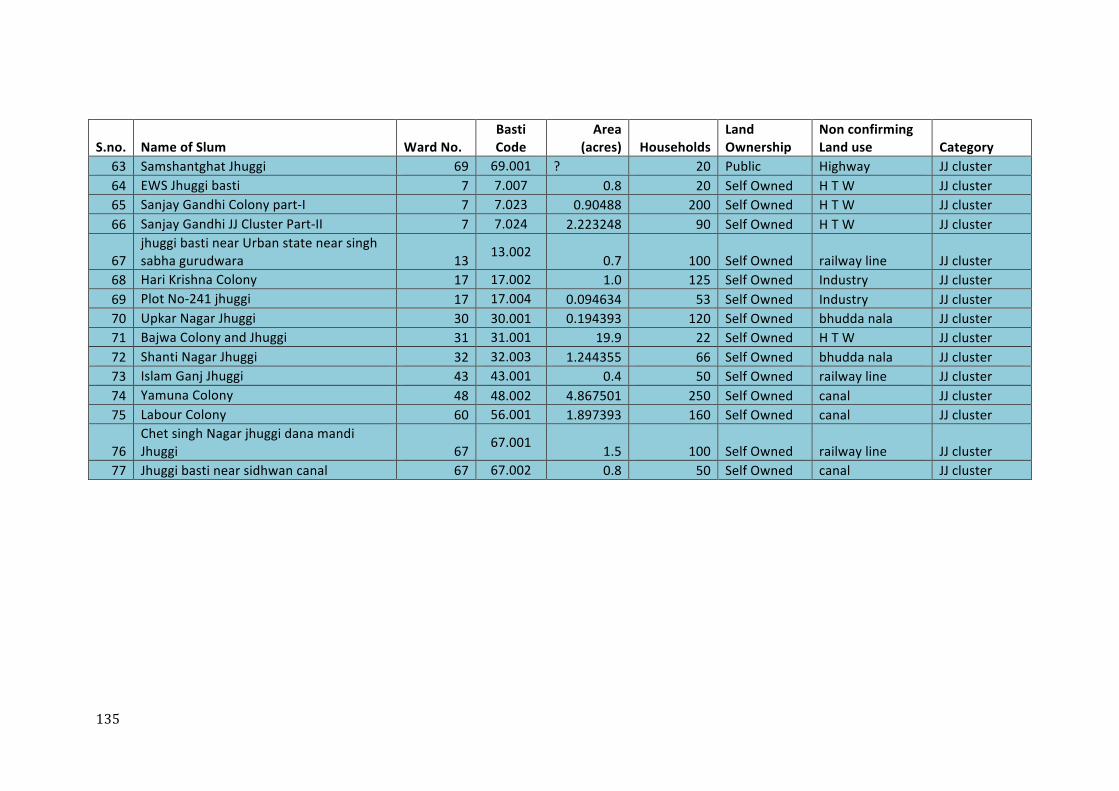
135
S.no. Name of Slum Ward No. Basti Code
Area (acres) Households
Land Ownership
Non confirming Land use Category
63 Samshantghat Jhuggi 69 69.001 ? 20 Public Highway JJ cluster 64 EWS Jhuggi basti 7 7.007 0.8 20 Self Owned H T W JJ cluster 65 Sanjay Gandhi Colony part-‐I 7 7.023 0.90488 200 Self Owned H T W JJ cluster 66 Sanjay Gandhi JJ Cluster Part-‐II 7 7.024 2.223248 90 Self Owned H T W JJ cluster
67 jhuggi basti near Urban state near singh sabha gurudwara 13 13.002 0.7 100 Self Owned railway line JJ cluster
68 Hari Krishna Colony 17 17.002 1.0 125 Self Owned Industry JJ cluster 69 Plot No-‐241 jhuggi 17 17.004 0.094634 53 Self Owned Industry JJ cluster 70 Upkar Nagar Jhuggi 30 30.001 0.194393 120 Self Owned bhudda nala JJ cluster 71 Bajwa Colony and Jhuggi 31 31.001 19.9 22 Self Owned H T W JJ cluster 72 Shanti Nagar Jhuggi 32 32.003 1.244355 66 Self Owned bhudda nala JJ cluster 73 Islam Ganj Jhuggi 43 43.001 0.4 50 Self Owned railway line JJ cluster 74 Yamuna Colony 48 48.002 4.867501 250 Self Owned canal JJ cluster 75 Labour Colony 60 56.001 1.897393 160 Self Owned canal JJ cluster
76 Chet singh Nagar jhuggi dana mandi Jhuggi 67 67.001 1.5 100 Self Owned railway line JJ cluster
77 Jhuggi basti near sidhwan canal 67 67.002 0.8 50 Self Owned canal JJ cluster
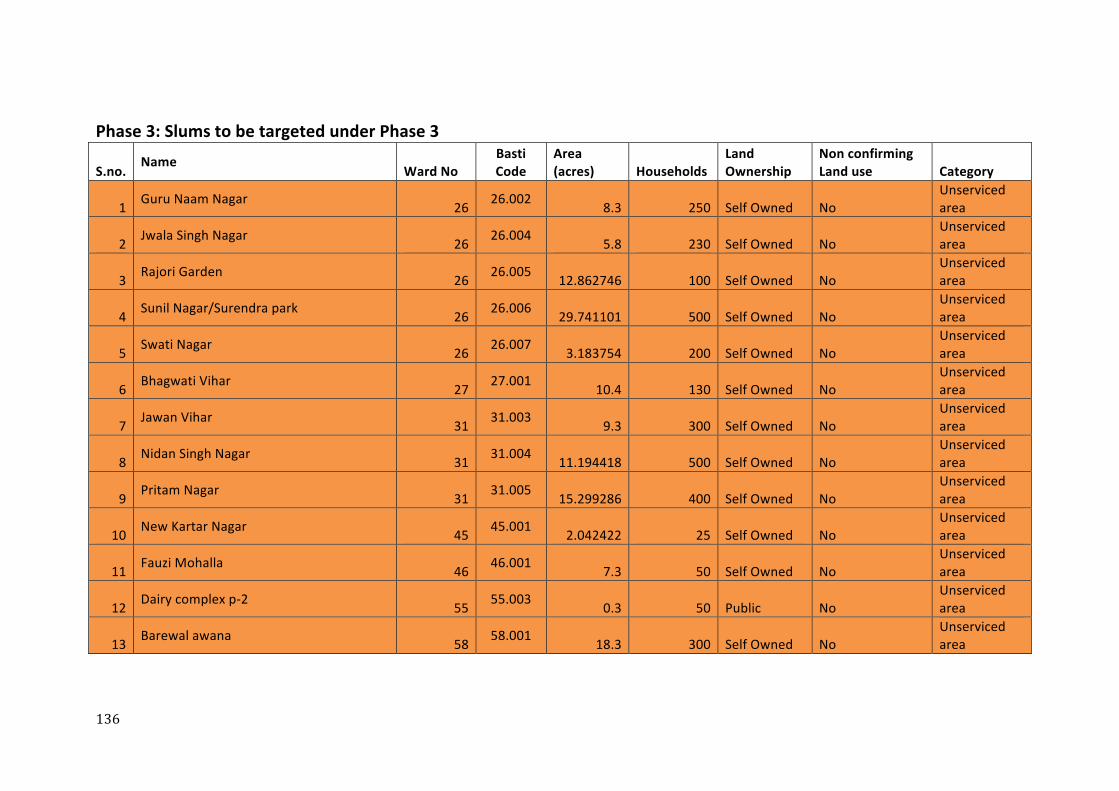
136
Phase 3: Slums to be targeted under Phase 3
S.no. Name
Ward No Basti Code
Area (acres) Households
Land Ownership
Non confirming Land use Category
1 Guru Naam Nagar 26 26.002 8.3 250 Self Owned No Unserviced area
2 Jwala Singh Nagar 26 26.004 5.8 230 Self Owned No Unserviced area
3 Rajori Garden 26 26.005 12.862746 100 Self Owned No Unserviced area
4 Sunil Nagar/Surendra park 26 26.006 29.741101 500 Self Owned No Unserviced area
5 Swati Nagar 26 26.007 3.183754 200 Self Owned No Unserviced area
6 Bhagwati Vihar 27 27.001 10.4 130 Self Owned No Unserviced area
7 Jawan Vihar 31 31.003 9.3 300 Self Owned No Unserviced area
8 Nidan Singh Nagar 31 31.004 11.194418 500 Self Owned No Unserviced area
9 Pritam Nagar 31 31.005 15.299286 400 Self Owned No Unserviced area
10 New Kartar Nagar 45 45.001 2.042422 25 Self Owned No Unserviced area
11 Fauzi Mohalla 46 46.001 7.3 50 Self Owned No Unserviced area
12 Dairy complex p-‐2 55 55.003 0.3 50 Public No Unserviced area
13 Barewal awana 58 58.001 18.3 300 Self Owned No Unserviced area
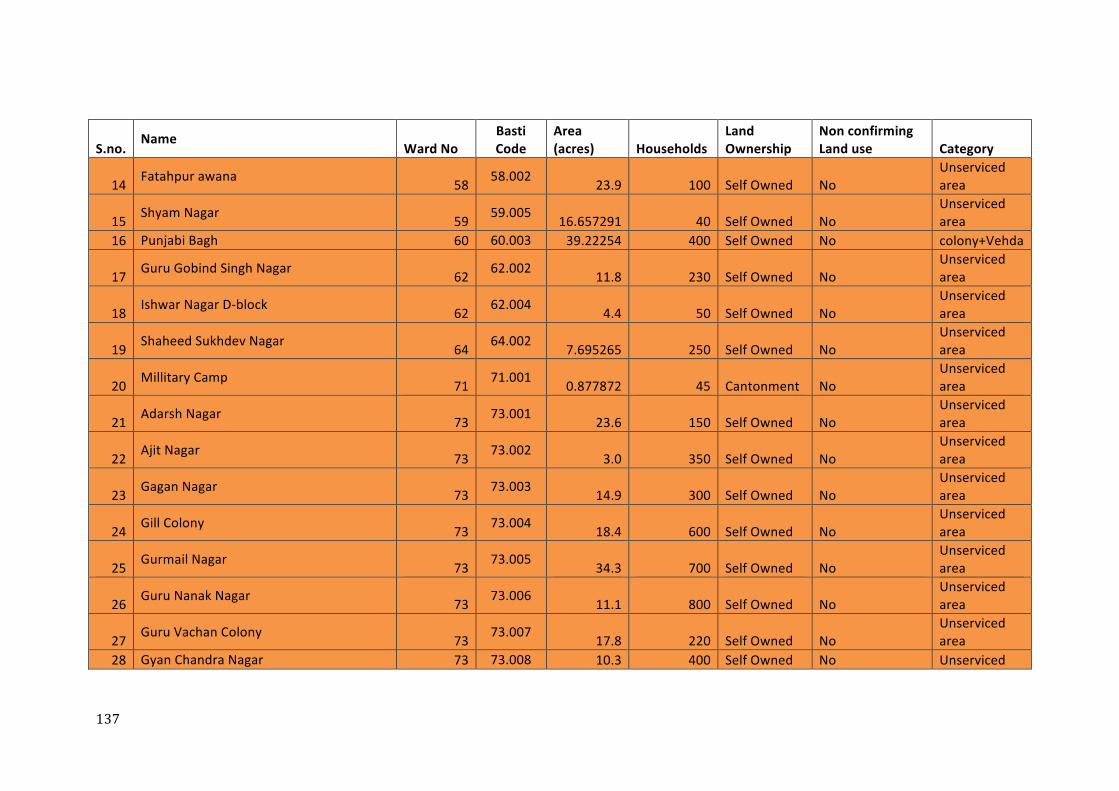
137
S.no. Name
Ward No Basti Code
Area (acres) Households
Land Ownership
Non confirming Land use Category
14 Fatahpur awana 58 58.002 23.9 100 Self Owned No Unserviced area
15 Shyam Nagar 59 59.005 16.657291 40 Self Owned No Unserviced area
16 Punjabi Bagh 60 60.003 39.22254 400 Self Owned No colony+Vehda
17 Guru Gobind Singh Nagar 62 62.002 11.8 230 Self Owned No Unserviced area
18 Ishwar Nagar D-‐block 62 62.004 4.4 50 Self Owned No Unserviced area
19 Shaheed Sukhdev Nagar 64 64.002 7.695265 250 Self Owned No Unserviced area
20 Millitary Camp 71 71.001 0.877872 45 Cantonment No Unserviced area
21 Adarsh Nagar 73 73.001 23.6 150 Self Owned No Unserviced area
22 Ajit Nagar 73 73.002 3.0 350 Self Owned No Unserviced area
23 Gagan Nagar 73 73.003 14.9 300 Self Owned No Unserviced area
24 Gill Colony 73 73.004 18.4 600 Self Owned No Unserviced area
25 Gurmail Nagar 73 73.005 34.3 700 Self Owned No Unserviced area
26 Guru Nanak Nagar 73 73.006 11.1 800 Self Owned No Unserviced area
27 Guru Vachan Colony 73 73.007 17.8 220 Self Owned No Unserviced area
28 Gyan Chandra Nagar 73 73.008 10.3 400 Self Owned No Unserviced
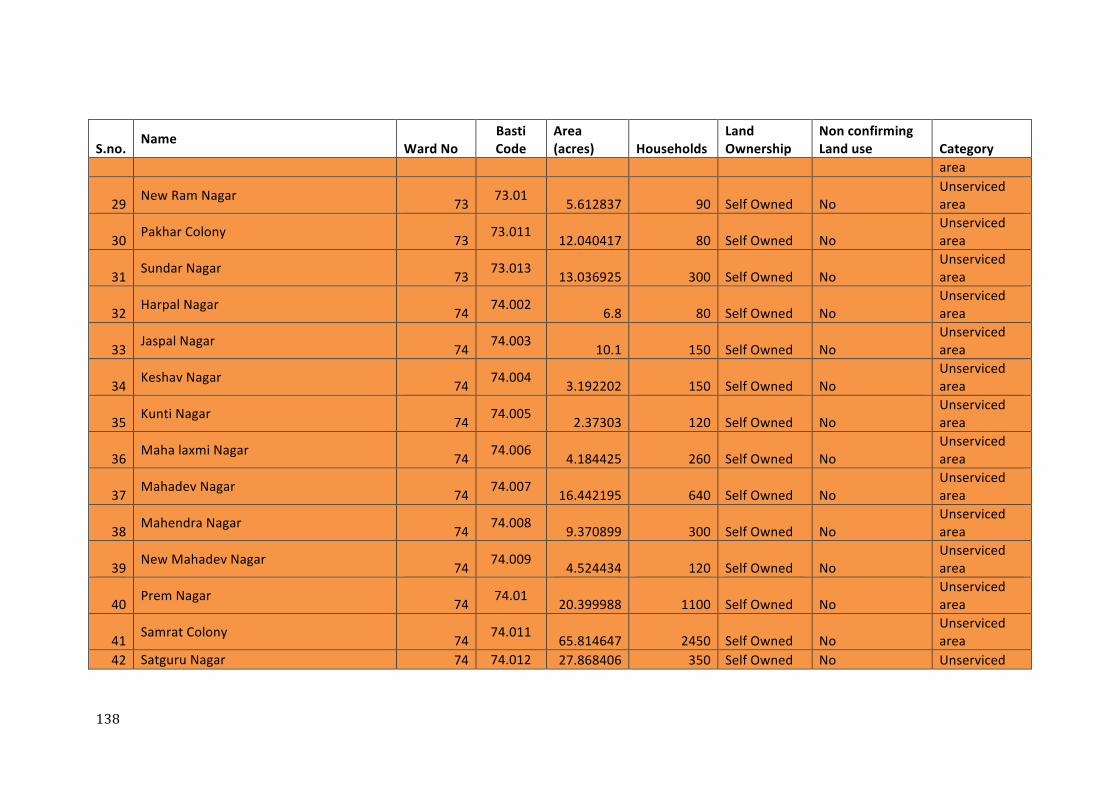
138
S.no. Name
Ward No Basti Code
Area (acres) Households
Land Ownership
Non confirming Land use Category
area
29 New Ram Nagar 73 73.01 5.612837 90 Self Owned No Unserviced area
30 Pakhar Colony 73 73.011 12.040417 80 Self Owned No Unserviced area
31 Sundar Nagar 73 73.013 13.036925 300 Self Owned No Unserviced area
32 Harpal Nagar 74 74.002 6.8 80 Self Owned No Unserviced area
33 Jaspal Nagar 74 74.003 10.1 150 Self Owned No Unserviced area
34 Keshav Nagar 74 74.004 3.192202 150 Self Owned No Unserviced area
35 Kunti Nagar 74 74.005 2.37303 120 Self Owned No Unserviced area
36 Maha laxmi Nagar 74 74.006 4.184425 260 Self Owned No Unserviced area
37 Mahadev Nagar 74 74.007 16.442195 640 Self Owned No Unserviced area
38 Mahendra Nagar 74 74.008 9.370899 300 Self Owned No Unserviced area
39 New Mahadev Nagar 74 74.009 4.524434 120 Self Owned No Unserviced area
40 Prem Nagar 74 74.01 20.399988 1100 Self Owned No Unserviced area
41 Samrat Colony 74 74.011 65.814647 2450 Self Owned No Unserviced area
42 Satguru Nagar 74 74.012 27.868406 350 Self Owned No Unserviced
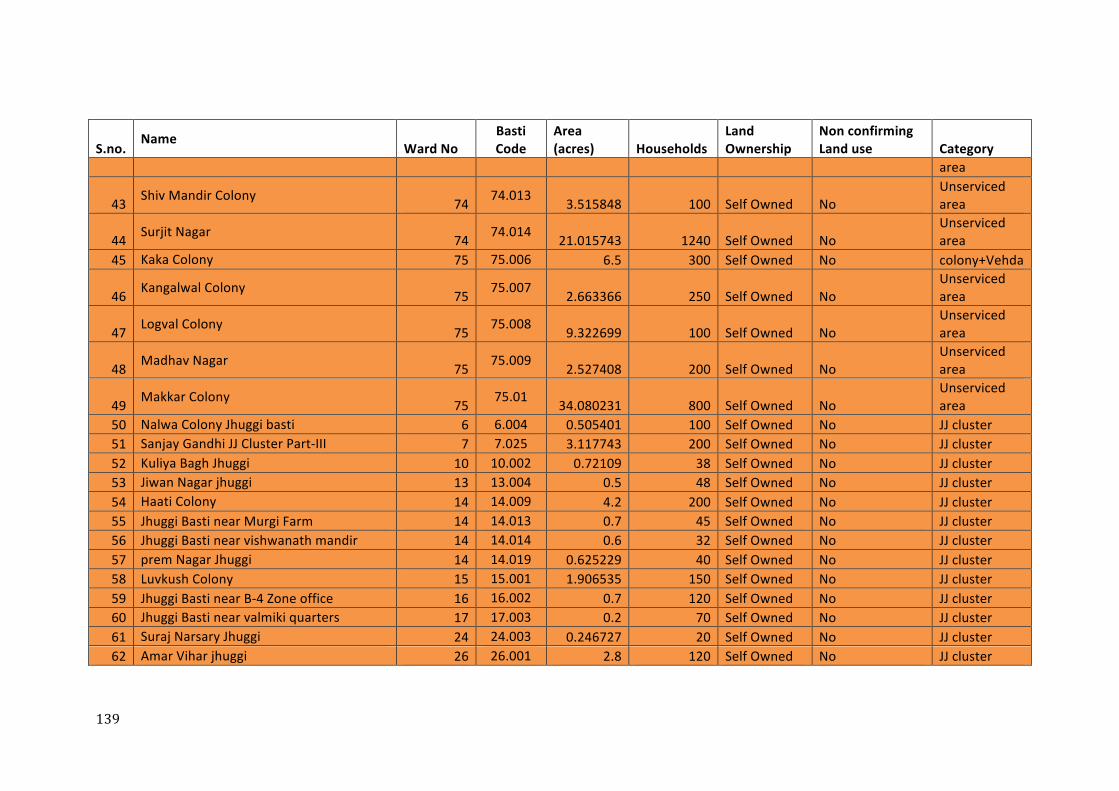
139
S.no. Name
Ward No Basti Code
Area (acres) Households
Land Ownership
Non confirming Land use Category
area
43 Shiv Mandir Colony 74 74.013 3.515848 100 Self Owned No Unserviced area
44 Surjit Nagar 74 74.014 21.015743 1240 Self Owned No Unserviced area
45 Kaka Colony 75 75.006 6.5 300 Self Owned No colony+Vehda
46 Kangalwal Colony 75 75.007 2.663366 250 Self Owned No Unserviced area
47 Logval Colony 75 75.008 9.322699 100 Self Owned No Unserviced area
48 Madhav Nagar 75 75.009 2.527408 200 Self Owned No Unserviced area
49 Makkar Colony 75 75.01 34.080231 800 Self Owned No Unserviced area
50 Nalwa Colony Jhuggi basti 6 6.004 0.505401 100 Self Owned No JJ cluster 51 Sanjay Gandhi JJ Cluster Part-‐III 7 7.025 3.117743 200 Self Owned No JJ cluster 52 Kuliya Bagh Jhuggi 10 10.002 0.72109 38 Self Owned No JJ cluster 53 Jiwan Nagar jhuggi 13 13.004 0.5 48 Self Owned No JJ cluster 54 Haati Colony 14 14.009 4.2 200 Self Owned No JJ cluster 55 Jhuggi Basti near Murgi Farm 14 14.013 0.7 45 Self Owned No JJ cluster 56 Jhuggi Basti near vishwanath mandir 14 14.014 0.6 32 Self Owned No JJ cluster 57 prem Nagar Jhuggi 14 14.019 0.625229 40 Self Owned No JJ cluster 58 Luvkush Colony 15 15.001 1.906535 150 Self Owned No JJ cluster 59 Jhuggi Basti near B-‐4 Zone office 16 16.002 0.7 120 Self Owned No JJ cluster 60 Jhuggi Basti near valmiki quarters 17 17.003 0.2 70 Self Owned No JJ cluster 61 Suraj Narsary Jhuggi 24 24.003 0.246727 20 Self Owned No JJ cluster 62 Amar Vihar jhuggi 26 26.001 2.8 120 Self Owned No JJ cluster
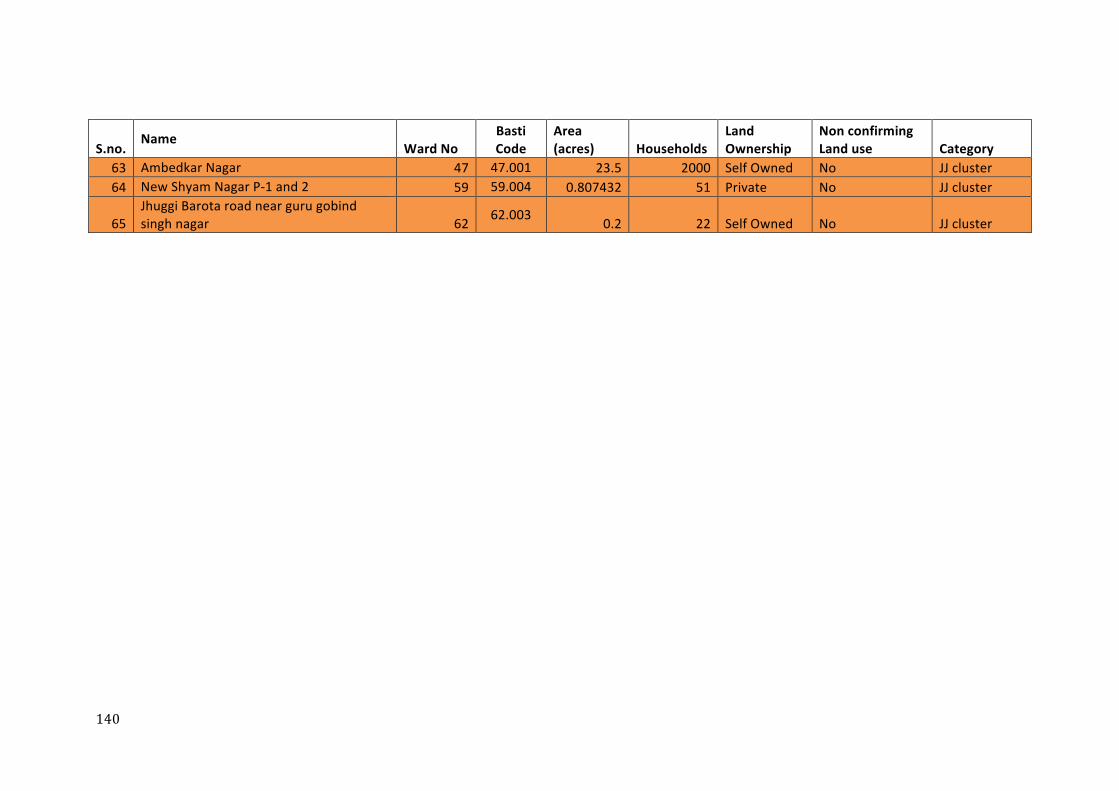
140
S.no. Name
Ward No Basti Code
Area (acres) Households
Land Ownership
Non confirming Land use Category
63 Ambedkar Nagar 47 47.001 23.5 2000 Self Owned No JJ cluster 64 New Shyam Nagar P-‐1 and 2 59 59.004 0.807432 51 Private No JJ cluster
65 Jhuggi Barota road near guru gobind singh nagar 62 62.003 0.2 22 Self Owned No JJ cluster
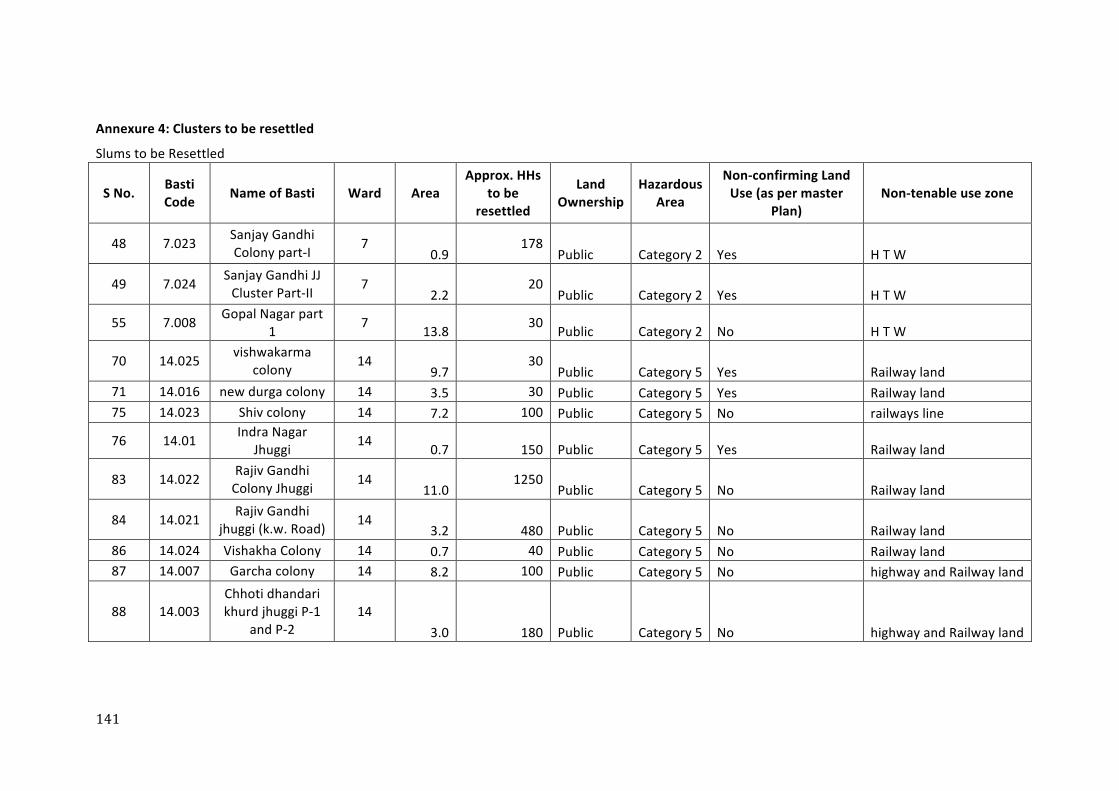
141
Annexure 4: Clusters to be resettled
Slums to be Resettled
S No. Basti Code Name of Basti Ward Area
Approx. HHs to be
resettled
Land Ownership
Hazardous Area
Non-‐confirming Land Use (as per master
Plan) Non-‐tenable use zone
48 7.023 Sanjay Gandhi Colony part-‐I 7
0.9 178
Public Category 2 Yes H T W
49 7.024 Sanjay Gandhi JJ Cluster Part-‐II 7
2.2 20
Public Category 2 Yes H T W
55 7.008 Gopal Nagar part 1 7 13.8 30 Public Category 2 No H T W
70 14.025 vishwakarma colony 14
9.7 30
Public Category 5 Yes Railway land 71 14.016 new durga colony 14 3.5 30 Public Category 5 Yes Railway land 75 14.023 Shiv colony 14 7.2 100 Public Category 5 No railways line
76 14.01 Indra Nagar Jhuggi 14 0.7 150 Public Category 5 Yes Railway land
83 14.022 Rajiv Gandhi Colony Jhuggi 14
11.0 1250
Public Category 5 No Railway land
84 14.021 Rajiv Gandhi jhuggi (k.w. Road) 14
3.2 480 Public Category 5 No Railway land 86 14.024 Vishakha Colony 14 0.7 40 Public Category 5 No Railway land 87 14.007 Garcha colony 14 8.2 100 Public Category 5 No highway and Railway land
88 14.003 Chhoti dhandari khurd jhuggi P-‐1
and P-‐2 14
3.0 180 Public Category 5 No highway and Railway land
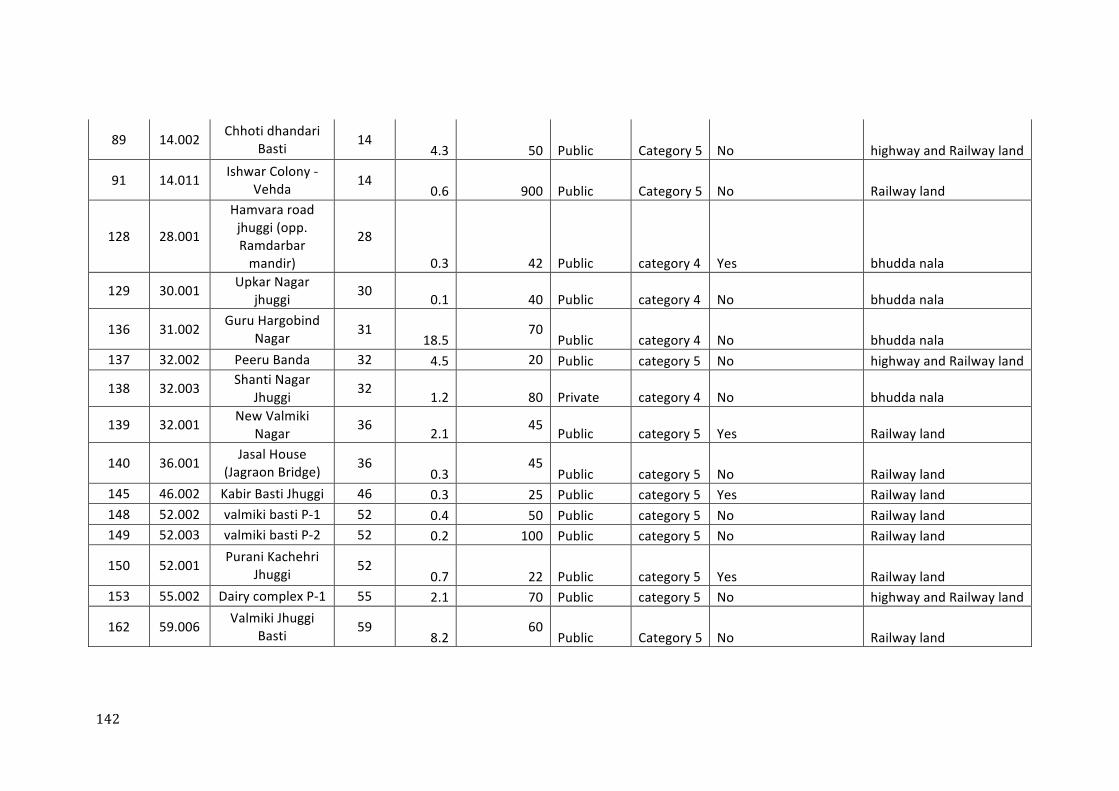
142
89 14.002 Chhoti dhandari Basti 14
4.3 50 Public Category 5 No highway and Railway land
91 14.011 Ishwar Colony -‐ Vehda 14
0.6 900 Public Category 5 No Railway land
128 28.001
Hamvara road jhuggi (opp. Ramdarbar mandir)
28
0.3 42 Public category 4 Yes bhudda nala
129 30.001 Upkar Nagar jhuggi 30 0.1 40 Public category 4 No bhudda nala
136 31.002 Guru Hargobind Nagar 31
18.5 70
Public category 4 No bhudda nala 137 32.002 Peeru Banda 32 4.5 20 Public category 5 No highway and Railway land
138 32.003 Shanti Nagar Jhuggi 32 1.2 80 Private category 4 No bhudda nala
139 32.001 New Valmiki Nagar 36 2.1 45 Public category 5 Yes Railway land
140 36.001 Jasal House (Jagraon Bridge) 36
0.3 45
Public category 5 No Railway land 145 46.002 Kabir Basti Jhuggi 46 0.3 25 Public category 5 Yes Railway land 148 52.002 valmiki basti P-‐1 52 0.4 50 Public category 5 No Railway land 149 52.003 valmiki basti P-‐2 52 0.2 100 Public category 5 No Railway land
150 52.001 Purani Kachehri Jhuggi 52
0.7 22 Public category 5 Yes Railway land 153 55.002 Dairy complex P-‐1 55 2.1 70 Public category 5 No highway and Railway land
162 59.006 Valmiki Jhuggi Basti 59
8.2 60
Public Category 5 No Railway land
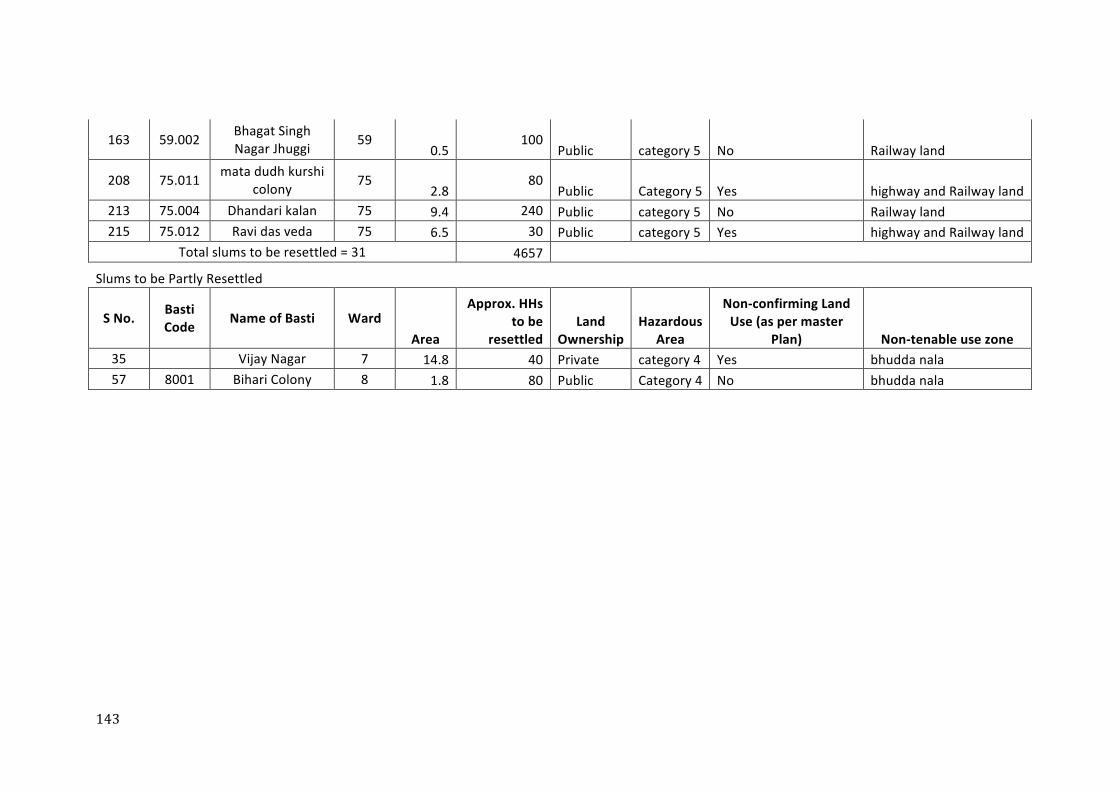
143
163 59.002 Bhagat Singh Nagar Jhuggi 59
0.5 100
Public category 5 No Railway land
208 75.011 mata dudh kurshi colony 75
2.8 80
Public Category 5 Yes highway and Railway land 213 75.004 Dhandari kalan 75 9.4 240 Public category 5 No Railway land 215 75.012 Ravi das veda 75 6.5 30 Public category 5 Yes highway and Railway land
Total slums to be resettled = 31 4657
Slums to be Partly Resettled
S No. Basti Code Name of Basti Ward
Area
Approx. HHs to be
resettled Land
Ownership Hazardous
Area
Non-‐confirming Land Use (as per master
Plan) Non-‐tenable use zone 35 Vijay Nagar 7 14.8 40 Private category 4 Yes bhudda nala 57 8001 Bihari Colony 8 1.8 80 Public Category 4 No bhudda nala
Related Documents