Scholars' Mine Scholars' Mine Masters Theses Student Theses and Dissertations 1966 Slope stability analysis of a fissured glacial clay Slope stability analysis of a fissured glacial clay Byron G. Walker Follow this and additional works at: https://scholarsmine.mst.edu/masters_theses Part of the Civil Engineering Commons Department: Department: Recommended Citation Recommended Citation Walker, Byron G., "Slope stability analysis of a fissured glacial clay" (1966). Masters Theses. 5787. https://scholarsmine.mst.edu/masters_theses/5787 This thesis is brought to you by Scholars' Mine, a service of the Missouri S&T Library and Learning Resources. This work is protected by U. S. Copyright Law. Unauthorized use including reproduction for redistribution requires the permission of the copyright holder. For more information, please contact [email protected].

Welcome message from author
This document is posted to help you gain knowledge. Please leave a comment to let me know what you think about it! Share it to your friends and learn new things together.
Transcript

Scholars' Mine Scholars' Mine
Masters Theses Student Theses and Dissertations
1966
Slope stability analysis of a fissured glacial clay Slope stability analysis of a fissured glacial clay
Byron G. Walker
Follow this and additional works at: https://scholarsmine.mst.edu/masters_theses
Part of the Civil Engineering Commons
Department: Department:
Recommended Citation Recommended Citation Walker, Byron G., "Slope stability analysis of a fissured glacial clay" (1966). Masters Theses. 5787. https://scholarsmine.mst.edu/masters_theses/5787
This thesis is brought to you by Scholars' Mine, a service of the Missouri S&T Library and Learning Resources. This work is protected by U. S. Copyright Law. Unauthorized use including reproduction for redistribution requires the permission of the copyright holder. For more information, please contact [email protected].

SLoPE STABILITY ANALYSIS OF A
FISSURED GLACIAL CLAY
BY J'{/ rl
BYRON G~ WALKER- J 1 ~ t.
A
THESIS
submitted to the faculty of
THE UNIVERSITY OF MISSOURI AT ROLLA
in partial fulfillment of the requirements for the
Degree of
MASTER OF SCIENCE IN CIVIL ENGINEERING
Rolla, Missouri
1966
Approved by
t:71'.-i~--~~~-.4.....__ . ..... i ...... OfJ'-JII""'---(advisor)
121423
~_\ / ,v.. '}-'
' \ \

ii
ABSTRACT
A slope in an over-consolidated, fissured clay was analyzed by the
Swedish Method of Slices.
Values of cohesion (c) and angles of friction (0) were determined
by three different types of direct shear tests (undrained, drained and
residual).
Factors of safety (functions of c and 0) indicated that the direct
shear test parameter gave a factor of safety approximately four times
that represented by failure conditions in the field. Drained tests
gave a factor of safety nearly 2.3 times the value represented by
field conditions. The conclusion is made that these two tests are
of limited value for slope stability analyses in stiff fissured clays.
The residual strength tests gave factors of safety values close
to those represented by field conditions (1.2 and 1.1 versus 1.0 -
0.8 and 0.6 versus 1.0 for a theory modification). Further studies
are required to evaluate the residual shear strength approach as a
general method of analysis.

ACKNOWLEDGEMENTS
The author wishes to express his sincere appreciation to Dr.
Thomas S. Fry and Professor John B. Heagler, Jr. for two years of
guidance and instruction.
iii
The author further appreciates the assistance of the following
individuals and organizations during his thesis research: Mr. Kenneth
Perkins, Mr. J. B. Jackson, Mr. Joseph Landrum, Mr. Harvey Cramer and
Mr. George Long of the Missouri Highway Department; Mr. Wallace B.
Howe and Mr. James H. Williams of the Missouri Geological Survey; Mr.
Marvin Byington and Captain William L. Jones, students at the Univer
sity of Missouri at Rolla.
Finally, the author wishes to express his indebtedness to his
wife, Alice Marie, and two boys, Victor and Andy, for their role in
encouragement and adaption to a study environment.

iv
TABLE OF CONTENTS
PAGE
ABSTRACT • . . . . . . . . . . . . . . . . . . . . . . . . . . . . . . . . . . . • . . . . . . . . . . . . . . . • • i i
ACKNOWLEDGEMENTS • . . . . . . . . . . . . . . . . . . . • . . . . . . . . . . . . . . . . . . . . • • • • • iii
LIST OF FIGURES . . . . . . . • . . . . . . . . . . . . . . . . . . . . . . • . • . . . . . . • . . • . . . • vi
LIST OF TABLES . . . . . • . . . • . . . . . . . . . . . . . . . . . . . . . . . . . . . . . . . . . . . . . • vii
I. INTRODUCTION • • . . . . . . . . . . . . . . . . . . . . . . . . . . • . . . . . . • . . . . . • • 1
II. REVIEW OF LITERATURE . • . . . . . . . . . . . . . . . . . . . . . . . . . . . . . . . . • 2
III. LOCATION, TOPOGRAPHY, GEOLOGY AND HISTORY OF THE SLIDE . 9
A. Location . . • . . . . • . • . . . . • . . . . . . . • . . . . . . . . . . . • . . . . . . • • 9
B. Topography . • • . . . . . . . • . . . . . . . . . • . . . . . . . . . . . . . . . . . . . • 9
C. Geology • • • • . • • • . • . . • . . . . • • • . • . . . . . . . • . . . . • . . . . . . . • • 9
D. History of the Slide • . . . • . . . . . . . . . . • . . . . . • • . . . . . . • . 10
IV. FIELD INVESTIGATION • . . . . . . . . . . . . . . . . . . . . . . . . . . . • . . . . . • • 12
A. General . • . . . . . . . . . . . . . . . . . . . . • . . . . . . . . . . . . . . . . . . . • • 12
B. Topography • . . • . . . . . . . . . . . . . . . . . . . • . • . • . . . . . . . . . . . . • 12
C. Drilling and Sampling Program...................... 12
V. LABORATORY TESTING . . . . . . . . . . . . . . . . . . . . . . . . . . . . . . . . . . . . • 13
VI. PROPERTIES OF MATERIALS •...............•......... ....•• 14
A. Visual Description and Texture ...••••.....•••..•••. 14
B. Dry Strengths . • . . . . • . . . . . . • . • • . • . • . • . . • • • • . • • . . . . • • 14
C. Natural Water Contents ..•... •••. •. .•...•••.••.....• 15
D. Natural Unit Weights • . • . • . • • . • • . • . • • . • . • . • . • • • . • • . • 15
E. Mechanical Analyses . • • • . . • . . . • • • . . . • • • . • . • . . • • • . . . . 15
F. A tterberg Limits . • . • . . • . . . • . . . . . . . . . . . . . . . . . . . . . . • • 15
G. Unconfined Compressive Tests • • . . . • . • . . . . . . . • • . . . . . • 15

v
PAGE
H. Shear Vane Tests . . . . . . . . . . . . . . . . . . . . . . . . . . . . . . . . . . • 16
I. Direct Shear Tests . . . . . . . . . . . . . . . . . . . . . . . . . . . . . . . . . 16
J. Sensitivity Tests • . . . . . . . . . . . • . . . . . . . . . . . . . . . . . . . • .. 18
K. Specific Gravity Tests ..... ...... ...•..... .. ....... 18
L. Consolidation Tests . . . . . . . . . . . . . . . . . . . . . . . . . . . . . . . • 18
M. Free Swell Tests • . . . . . . . . . . . . . . . . . . . . . . . . . . . . . . . . . • 18
VII. SLOPE ANALYSES . . . . . . . . . . . . . . . . . . . . . . . . . . . . . . . . . . . . . . . • . 20
A. General • . . . . . . • . . . . . . . . . . . . . . . . . . . . . . . . . . . . . . . . . . . • 20
B. Geometry of the Slide.............................. 21
C. Input Data . . . . . • . . . . . . . . . . . . . . . . . . . . . . . . . . . . . . . . . • • 21
D. Calculations . • . . . . • . . . . • . . • . . • . • • • .. . . . . . . . . . . . . . . . • 21
VIII. CONCLUSIONS AND DISCUSSION............................. 23
IX. RECOMMENDATION FOR FURTHER STUDY....................... 25
APPENDIX A, FIGURES . . . . . . . . . . . . . . . . . . . . . . . . . . . • . . . . . . . . . . . . . . • 2 6
APPENDIX B, TABLES • . . . . . . . . . . . . . . . . . . . . . • • . . . . . . . . . . . . . • . . . . . • 40
BIBLIOGRAPIIY . . . . . . . . . . . . . . . . . . . . . . . . . . . . . . . . . . . . . . . . . . . . . . . . • • 49
VITA . . . . . . . . . . . . . . . . . . . . . . . . . . . . . • . . • . • • • • • • . . . . . . . . . . • . . . . . • 52

vi
LIST OF FIGURES
FIGURE PAGE
1 SKETCH OF ROAD CUT IN TILLS ........................• 10
2 CONTOUR MAP OF THE SLIDE ........................... . 27
3 PHOTO OF CLAY SAMPLE ..............................•• 28
4 ELEVATION VERSUS NATURAL WATER CONTENTS AND UNIT WEIGHTS ..........................................• 29
5 ELEVATION VERSUS MECHANICAL ANALYSES ...............• 30
6 ELEVATION VERSUS ATTERBERG LIMITS .................•• 31
7 PLASTICITY CHART •..................................• 32
8 MOISTURE CONTENT VERSUS UNCONFINED COMPRESSIVE STRENGTH (CLAY) . . . . . . . . . . . . . . . . . . . . . . . . . . . . . . . . ... 33
9 SHEAR STRENGTH VERSUS NORMAL STRESS (DIRECT SHEAR) .. 34
10 DIAL READING VERSUS LOG TIME, 32 TSF .............•.. 35
11 VOID RATIO- PRESSURE RELATIONSHIP •...............•• 36
12 PROFILE OF SLOPE, 6 JUNE 1962 (ORIGINAL) ..........•• 37
13 FORCE DIAGRAM FOR A SLICE ..........................• 38
14 FACTOR OF SAFETY DIAGRAM •..........................• 39

TABLE
I
II
III
IV
v
VI
VII
VIII
LIST OF TABLES
NATURAL WATER CONTENTS ............................ .
NATURAL UNIT WEIGHTS .............................. .
MECHANICAL ANALYSES ...............................•
ATTERBERG LIMITS .................................. .
UNCONFINED COMPRESSIVE STRENGTHS ..................•
SHEAR STRENGTH OF CLAY (DIRECT SHEAR) ............. .
INDEPENDENT CALCULATIONS .......................... .
SUMMARY OF ANALYSES ............................... .
vii
PAGE
41
42
43
44
45
46
47
48

1
I. INTRODUCTION
Popular slope stability analyses require an assessment of soil
engineering properties. Similarity between shearing strength and
other engineering properties of a soil assigned through testing and
those exhibited in the field precludes safe and economical design.
Many slope failures in stiff fissured clays attest to a lack of such
correlation.
This investigation was conducted to study recognized methods of
slope stability analyses when applied to a stiff, fissured clay.
A slide was chosen, in cooperation with the Missouri Highway De
partment, in which shearing strengths of the soil at failure could be
calculated. These values were then compared to corresponding data
from favored laboratory tests. Should the laboratory tests fail to
indicate an unstable slope, modified tests or new approaches suggested
by recent authors would be applied to determine their reliability in
predicting slope behavior.
Field studies were required to obtain representative soil samples,
determine the geometry of the slide and soils involved and measure
ground water conditions. Laboratory tests were required to evaluate
the engineering properties of the materials.

II. REVIEW OF LITERATURE
A quote from Dr. Karl v. Terzaghi at the opening of the First
International Conference on Soil Mechanics and Foundation Engineering
2
in 1936 is as follows: "The catastrophic descent of the slopes of the
deepest cut on the Panama Canal issued a warning that we were overstep
ping the limits of our ability to predict the consequences of our ac
tions." (BINGER, 1948). At this lecture, Dr. Terzaghi presented a
paper on the stability of slopes in natural clay. He revealed the lack
of correlation between shear strengths obtained from unconfined compres
sion tests and the shear strength of stiff, fissured clays as computed
from slope failures. He suggested that water softening of the clay
along fissures reduced the shear strength (TERZAGHI, 1960). The mech
anism for entry of water into nearly universal networks of hair cracks
or slickensides in stiff clay is explained by the release of stresses
during excavation and subsequent expansion of the clay. Some of the
fissures open up allowing water to gain access and to soften the clay.
A slide occurs as soon as the shearing resistance of the clay fails to
match the shearing stresses contributed by gravity (TERZAGHI and PECK,
19 48' p . 3 63) .
CASSEL (1948) suggested that the circular slip theory and tests on
undisturbed soil samples do not provide reliable slope stability analyses
in fissured clays. His studies indicated a deterioration of strength in
the zone of fluctuating ground water levels. Unconfined compression
tests seemed to greatly overestimate the strength of the fissured clays.
SKEMPTON (1948) also established that unconfined compression tests
on unsoftened clays gave shear strength values much too high for actual

3
slope failures in London Clay. He suggested an empirical approach for
solutions to the problem through collection of data to include original
strengths, fully softened strengths, average strength at failure, time
interval between construction and failure, and the depth of the slip
surface.
BINGER (1948) connected the phenomenon of the decrease in shear
strength of a clay during remolding as sliding progressed within the
Panama Canal Culebra slides (22% of the original strength).
Since these early papers were presented, an overwhelming mass of
testimony has been published with the general theme that conventional
laboratory shear tests and even field shear vane tests (BAZETT, ADAMS,
and MATYAS, 1961) consistently suggested strength values greater than
those evidence by slope failures.
BINGER and THOMPSON (1949) concluded that total stress shear
strengths decrease with time, and suggested a test to estimate the
minimum shear strength of the soil at a future date under a given set
of conditions.
HENKEL and SKEMPTON (1955) found that by allowing the effective
cohesion to approach zero, the factor of safety for a slide in fis
sured over-c~nsolidated clay equaled 1.07 when analyzed in terms of
the effective angle of shearing resistance. Tests on samples from
the shear zone gave shearing resistance values in the magnitude of
450 pounds per square foot versus values from samples outside the
shear zone of 1,600 pounds per square foot. They surmised that un
drained tests should be conducted only on samples obtained from the
shear zone.

4
HENKEL (1957) later proposed that effective stress methods of
stability analyses offered greater advantage (reliability) over meth
ods that assumed the angle of shearing resistance equal to zero. Al
though tests on his clay samples gave values other than zero for the
effective angle of shearing resistance (0') and effective cohesion
(c'), he postulated that c' approached zero on a geologic time scale.
SKEMPTON and DELORY (1957) ~lso concluded that c' of stiff fis
sured clays approached zero on a geological time scale.
DEWET (1961) introduced an energy concept that shearing strength
resistance is proportional to the product of volume change and pres
sure. Points of failure must be characterized by values of moisture
content, pressure and strength which are uniquely interrelated.
MURAYAMA and SHIBATA (1961) compared the shear strength of clay
to structural viscosity based on the frequency of the mutual exchange
of position between each water molecule and its void in a bond material
containing soil properties.
SAITO and UEZAWA (1961) suggested slope failures could be fore
cast by measuring the surface strain of a slope.
SKEMPTON (1961) analyzed the horizontal stresses in an overcon
solidated clay and partially described the pressure distribution for
pore water during triaxial shear tests and a method of determining
capillary pressures.
SCOTT (1963) states that mineral composition, water content, de
gree of saturation and structure are the most important factors in de
termining the behavior of cohesive materials. He reviews clay miner
alogy and strengths due to primary (ionic, covalent, hydrogen, and
hydroxyl) and secondary (Vander Waals - London forces) bonds.

5
Implications are made that cohesion is nonexistent in a pure dispersed
clay unless Van der Waals attractive forces predominate over electro
statis repulsions (throughout this paper the terms cohesion and ap
parent cohesion are used interchangeably). Further, £loculated clays
would exhibit a threshold shearing strength to overcome the adhesion
at contacts and to make one particle move relative to another. Thixo
trophy is partially explained as a reorientation of clay crystals and
water molecules to changes in stress conditions due to vibratory mo
tions of atoms and molecules. Cohesion itself represents the remnant
effects of overconsolidation.
SKEMPTON (1964) concluded that the field shear strength of fis
sured clays in natural and cut slopes decreased in time to a "residual
shear strength" value found in the laboratory. Residual shear strength
was measured by straining a drained direct shear test sample past the
peak strength until a constant shear strength was reached. Residual
shear strengths determined had a c' of zero and a 0' lower than the
peak 0' by 1° to 10°.
The failure plane was found to be a continuous band of strongly
oriented clay particles in a softened zone after residual shear
strengths had been reached. This method of testing was an advance in
the concepts suggested earlier by BINGERand THOMPSON (1949).
BJERRUM (1965) indicates that slides in overconsolidated clays
are preceded by development of a continuous sliding surface by pro
gressive failure. Recoverable strain energy of the clay resulting
from processes in its geologic past is thought to contribute to pro
gressive failure.

6
A possible mechanism for failure of overconsolidated clays under
shear stress becomes apparent from the above works.
Assuming that the clay is homogenous under maximum consolidation
loads seems unwise considering the three-dimensional non-homogenuity
of the fine and colloidal particle distribution and variations in void
ratios, mineralogical compositions, permeability, and complex stress
transmission patterns. Pressures at zones of contacts between particles
are probably quite large, causing recrystallization and perhaps ad
hesion due to Van der Waals or other forces. Cementing agents could
also weld some of the particles together. Particle reorientation
surely takes place through the early stages of secondary compression.
Should conditions be such to form very strong bonds, the clay will be
come indurated.
Under stress relief, an opportunity for strain energy recovery is
presented. Weak diagenetic bonds would be recovered rapidly after un
loading. Stronger bonds may require liberation through weathering or
remain as energy losses. A major portion of recoverable energy in
clays is thought to be primarily the result of deformation of the
flexible flake-shaped clay particles (BJERRUM, 1965). Thus the clay
is continually becoming adjusted to its environment. Differential
settlements, expansions, volume changes, and stress patterns would
produce hair-line cracks, fissures, and slickensides. Rapid stress
relief such as a man made cut or excavation would superimpose a new
system of stresses upon an existing program of adjustment. Stress
distribution on a potential failure plane would not be uniform, but
would contain concentrations of stresses at points more resistant to
strain. Overall loss of strength due to the action of water entering

7
along fissures or other permeable routes, dilation, and other forces
such as weathering and shearing of bonds under localized high stresses
may eventually result in a failure of the sum of resistant forces to
match those forces causing deformation, at which time slope failure
would occur. The importance of time in the processes just described
cannot be overemphasized.
Shearing resistance per unit area of cohesive soil may be repre
sented by the empirical equation
s = c + o- tan 0 (TERZAGHI, 1943)
where s = shearing resistance per unit area
c = apparent cohesion
DW = normal stress (compressive only)
0 = apparent angle of shearing resistance.
This equation is known as Coulomb's equation. Values for c and 0 are
determined by laboratory or field tests and vary to considerable de
grees depending upon how the tests are conducted. During rapid strain
or loading programs such that pore water pressure will not reach equi
librium, part of the applied normal stress would be carried by excess
hydrostatic pressures. Slower tests that allow dissipation of the pore
water pressures permit the normal stress to be transmitted directly
through bond strengths or grain to grain contacts. Allowing for pore
water pressures rather than using terms of total stresses, Coulomb's
equation may be rewritten in terms of effective stress as
s = c' + ( ~ - u) tan 0'
where c' =effective cohesion intercept
u = pore pressure
0 1 = effective angle of shearing resistance.

8
Only that portion of the total available shear resistance, s,
along a potential failure surface to balance the total shear force,
r, will be engaged. The ratio of s to I is defined as the factor of
safety (F). Thus
F = .E s I Z 7', (~= summation)
l: r = l: s I F' or
~ s = I: c 1 I F + ~ ( &-- - u) tan 0 1 I F
in terms of effective stresses.
Defining F equal to 1.0 places the slope under analysis in un-
stable equilibrium and all available shear strength of the clay is
mobilized. Thus, by definition, a slope is stable ifF is greater
than 1.0 and will fail ifF is less than 1.0.
For further study on the foregoing discussion, reference is made
to HOUGH, 1957; JUMIKIS, 1962; PECK, HANSON, and THORNBURN, 1953; SCOTT,
1963; SPANGLER, 1963; TERZAGHI, 1943; and TERZAGHI and PECK, 1948.
All methods of slope stability analyses require certain simplify
ing assumptions and conditions for their application. The conditions
in the field must closely parallel those integral to the method of
analysis employed to obtain reliable results. The Swedish Slice Method
or Method of Slices without the Bishop refinements was chosen for anal
yses in this paper. Reasons for this selection were that the failure
surface could be closely approximated by an arc, the ground surface was
irregular, the slide zone was composed of different lithologic units,
effects of ground waters could be included and it seemed flexible
enough to adapt required assumptions.
A review of the Swedish Slice Method is not included here as the
method is illustrated in detail under the slope analyses beginning on
page 20.

III. LOCATION, TOPOGRAPHY, GEOLOGY AND HISTORY OF THE SLIDE
A. Location
The slide chosen for analysis is located approximately 3/4 mile
north and 1 1/2 mile west of Clark, Missouri; on the west side of a
cut for U. S. Highway 63; BOO feet south from a Gulf Mobile and Ohio
Railroad overpass. Clark is located in Randolph County in North Cen
tral Missouri; and is mapped on the Clark Quadrangle, Missouri, 7.5
minute series (Topographic), U. S. Geological Survey, scale 1:24000,
N. 3915 - W. 9215/7.5, 1953.
B. Topography
9
The topography of the area is a relatively level plain with less
than ten foot elevation differentials over areas of one or two square
miles, dissected by a mature dendritic drainage pattern with elevation
differentials reaching seventy feet. Hills are rounded and most of the
valleys are wide and V-shaped with natural slopes not greater than ap
proximately 10:1.
C. Geology
The area is within a dissected glacial plain. From field observa
tions and stratigraphy, two ages of glaciation seem to be in evidence.
Figure 1 on page 10 is a sketch of the road cut in relation to the
ground surface and till materials.
The lower brown till is highly weathered and may be Nebraskan
till. Superimposed over this till is approximately sixteen feet of
stiff fissured gray clay. The upper till, perhaps Kansan, rests on
the clay and extends to the ground surface in the region of the slide.

Gray Clay
Brown Weathered
Till
FIGURE 1. SKETCH OF ROAD CUT IN TILLS
10
The clay, as well as the tills, are described in further detail under
Properties of Materials beginning on page 14.
The clay appears to be an accretionary deposit in depressions on
the underlying till, however genesis through the weathering of the lower
till, similar to the formation of Aftonian soil or gumbotil, is not pre-
eluded (HOWE, 1966; LOBECK, 1939; RUHE, 1956; SCOTT, 1964; WILLIAMS,
1966).
D. History of the Slide
This history is compiled from Missouri State Highway Department
maintenance records and personnel, compaction inspectors and grading
diaries (LONG, 1966).
The road cut was opened on or about 5 July 1960. The original
backslope was designed at 2:1. Considerable difficulty was encountered
in excavating the tough stiff gray clay. The first slide occurred in
March 1962, during construction. This slip was repaired by the con-
tractor around 6 June 1962. An eight-foot wide bench was built about

half way up the slope and the upper cut slope laid back to approxi
mately 2 1/2 or 3:1. On 9 January 1963, the highway was opened to
traffic. The slope slid again in June of 1963 and was repaired by
maintenance personnel by reshaping and light compaction. Lime stabi
lization was also attempted. During the summer of 1964 the slope
again gave way. Repairs included reshaping and compacting the slope,
and the addition of riprap stone in the region of the toe. The area
slid again and remains in its present form.
11

IV. FIELD INVESTIGATION
A. General
Field investigations were conducted to determine the geometry of
the area of the slide, sliding mass, soils and waters; and to obtain
representative samples of materials involved.
B. Topography
A contour map of the slide was prepared and is presented as
Figure 2 on page 27. From this map, profiles could be extracted as
desired and original cut slope surfaces could be reconstructed. Fur
ther, surface drainage features could be delineated in relation to
failure zones under study.
All elevations and stations used in this paper are as assumed
on Figure 2. For outside correlations, station 2 + 30 on Figure 2
is approximately equal to station 529 + 40 on Highway 63. Elevation
100 on Figure 2 is approximately equal to 850 feet above sea level.
C. Drilling and Sampling Program
Six- and two-inch hand auger holes and four-inch truck mounted
power auger holes were drilled to determine the geometry of the sub
surface. Hole locations are indicated on Figure 2.
Three- and two-inch shelby tube samples, split spoon samples,
undisturbed block samples and disturbed samples were taken to es
tablish representative engineering properties of the materials in
the laboratory. Water measurements were taken in various drill
holes to calculate pore water pressure.
12

V. LABORATORY TESTING
Testing procedures were those suggested by ASTM specifications,
Missouri State Highway Department standing operating procedures,
laboratory techniques as suggested by LAMBE (1951) and modified
tests as described in detail when encountered later in the thesis.
Tests on the gray fissured clay or bounding tills included
visual descriptions, texture, dry strengths, natural water contents,
natural unit weights, mechanical analyses, liquid limits, plastic
limits, shrinkage limits, unconfined compressive, shear vane, direct
shear, sensitivity, specific gravity, consolidation and free swell.
13
14
VI. PROPERTIES OF MATERIALS
A. Visual Description and Texture
The basal till is light brown to tan in color. Joints have sep
arated the material into blocks not longer than one inch along a side.
Numerous subrounded to rounded grains of resistant minerals are visi
ble including a number of pebbles. Outlines of decomposed rocks and
mineral crystals can be distinguished by color and texture change.
Surfaces of points or fractures are dull and rough. The material
feels gritty and sandy.
The clay is gray in color with flat black organic spots through
out the mass and on the faces of slickensides. Resistant rounded
sand grains and small pebbles are commonly encountered with higher
concentrations located near the base. The clay is jointed and fis
sured with numerous slickensides. Figure 3, a photo of a three-inch
shelby tube sample, shows some slickensides, the mottled gray pattern
of color and the black spots located on the slickensides. Fresh frac
tures appear platy with glossy slickensides.
The upper till resembles the lower. It is light brown in color
and somewhat darker than the lower till. Jointing is not nearly as
evident as in the lower till. Resistant pebbles and rocks are present
with some lenses of sand. Decomposed granite rocks have been recovered
and numerous mineral and crystal outlines can be seen without visual
aids.
B. Dry Strengths
Dry fragments of both tills and the gray clay are very hard to
crush; however, larger pieces of the till will fracture at lower pres
sures and are somewhat friable.

C. Natural Water Contents
Natural water contents are listed in Table I on page 41 and de
picted in Figure 4 on page 29. The average natural water contents
for the upper till, clay and lower till are 18.1%, 30.6% and 16.6%
respectively.
D. Natural Unit Weights
Natural unit weights are listed in Table II on page 42 and are
depicted in Figure 4 on page 29. The average unit weights for the
upper till, clay and lower till were 131.5, 120.1 and 135.4 pounds
per cubic foot respectively.
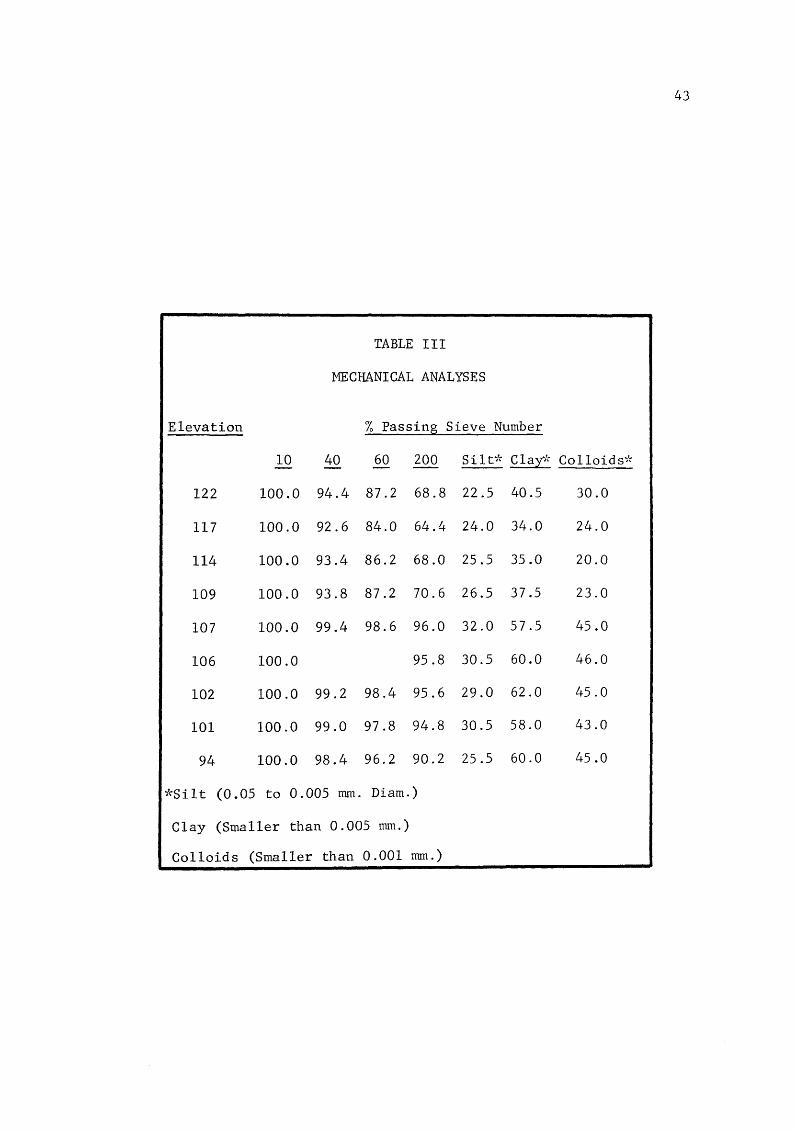
E. Mechanical Analyses
Results of mechanical analyses are tabulated in Table III on
page 43 and depicted in Figure 5 on page 30.
F. Atterberg Limits
Atterberg Limits are listed in Table IV on page 29 and are de
picted in Figures 6 and 7 on pages 31 and 32.
The average shrinkage limit shown was for an undisturbed sample.
15
The average shrinkage limit for remolded samples was 9.6%. Particle
orientation along slickesides would seem somewhat analogous to remold
ing. Thus the clay in these zones of remolding would, according to
HOLTZ and GIBBS (1954), exhibit over 30% volume change from a dry to
saturated condition (very high).
G. Unconfined Compressive Tests
Unconfined compression tests gave an average peak strength of
2.58 tons per square foot for the upper till, 1.35 tons per square
foot for the clay, and 5.24 tons per square foot for the lower till,
(see Table V, page 45).

16
Strength variation with change in moisture content is illustrated
on Figure 8 for the remolded gray clay under a given compactive effort.
Unconfined compressive strengths from undisturbed samples are plotted
for comparison. Creep strength was studied via unconfined compression
on specimens under static loads. Samples of the clay consistently
failed, in time, under loads of 0.8 and 0.9 of the standard unconfined
compressive strengths.
H. Shear Vane Tests
Shear vane tests on undisturbed samples of gray clay gave an
average shear strength of 1.58 tons per square foot. Upon remolding,
the average shear strength dropped to 0.30 ton per square foot.
Thixotropic effects were observed. Remolded samples were allowed to
rest for twelve hours at which time the average shear strength had
risen to 0.48 ton per square foot.
I. Direct Shear Tests
Direct shear tests were conducted on samples of the gray clay.
Table VI lists values of shear resistance (strength) for different
normal stresses, strain rates and testing methods.
BISHOP and HENKEL (1957) describe three types of triaxial tests
as follows: " ..•. tests are therefore classified according to the con
ditions at drainage obtaining during each stage:
i. Undrained tests. No drainage, and hence no dissipation of
pore pressure, is permitted during the application of the
all-around stress. No drainage is allowed during the ap
plication of the deviator stress.
ii. Consolidated-undrained tests. Drainage is permitted during
the application of the all-around stress, so that the sample

is fully consolidated under this pressure. No drainage is
allowed during the application of the deviator stress.
17
iii. Drained tests*. Drainage is permitted throughout the test,
so that full consolidation occurs under the all-around
stress and excess pore pressure is set up during the ap
plication of the deviator stress .••
*··· Classes i, ii, and iii are therefore sometimes referred to
as quick, consolidated quick, and slow tests respectively."
Similar test nomenclature is used in this paper for direct shear
tests.
All test specimens were allowed to consolidate in the direct shear
test apparatus for approximately one hour before testing. This con
solidation effort was considered sufficient to seat the test equipment.
Twenty-two hours were required to reach 100% primary consolidation
under 4 tons per square foot during consolidation tests.
As no detection equipment to measure pore water pressures during
consolidation or during the shear test was available, the test titled
"Drained Tese' may be a misnomer.
The tests labeled ''Residual Shear Tests" in Table VI were designed
to evaluate the shear resistance on a well developed shear zone
(SKEMPTON, 1964). The tests were conducted in conventional strain
rate-controlled direct shear machines. A specimen was stressed to
0.2 inch strain and then returned to the starting position. This
procedure was repeated until the shearing resistance, corrected for
cross-sectional area change, approached a constant value. Usually
an accumulated strain of two inches was sufficient to establish con
stant values for residual shear strength tests, however, tests were

18
carried to an accumulative strain of three inches. Shear zones were
well developed at the end of the tests and appeared similar to natural
slickensides.
Strains were extended on specimens used to evaluate peak shear
strengths during conventional undrained testing. Erratic shear zones
resulted in such a distribution of values that a general trend could
not be established.
The procedure was refined by first slicing the specimen with a
wire saw along the proposed shear plane.
Results of the undrained, drained and residual shear (controlled
shear zone) tests are plotted on Figure 9, page 34.
J. Sensitivity Tests
Sensitivity is the ratio of the undisturbed peak shear strength
to the remolded shear strength of a sample. Sensitivity for the gray
clay averaged 5.3 by shear vane and direct shear tests.
K. Specific Gravity Tests
The specific gravity of solids in the clay averaged 2.66.
L. Consolidation Tests
Nearly fifty hours were required for the samples to reach 100%
primary consolidation. The samples had a tendency to swell under 0.5,
1.0 and 2.0 tons per square foot normal load. The average pre-consoli-·
dation load on the clay was 11.6 tons per square foot as determined by
the A. Casagrade Method (PECK, HANSON and THOMBURN, 1953; SPANGLER,
1963). Reference is made to Figures 10 and 11 on pages 35 and 36.
M. Free Swell Tests
Free swell tests were conducted on samples of the gray clay.
These tests were performed by slow addition of 10 milliliters (ml.)

of minus 40 air-dried material into a 100 ml. graduate of distilled
de-aired water. Free swell is equal to the change in volume of the
sample divided by the original volume and multiple by 100, or
V(final) - V(initial) x 100 V(initial)
where V(initial) equals 10 ml.
19
Average free swell was 130% (relatively high, indicating volume change
potential with variation in moisture content).

A. General
VII. SLOPE ANALYSES
Swedish Method of Slices
Reference is made to KAROL (1960, p. 86-101), TAYLOR (1948, p.
406-476), SPANGLER (1963, p. 288-301) and U. s. Army Engineer School
(1962, p. 655-672). A slope analysis consists basically of deter
mining those forces acting upon the soil mass above an assumed slid
ing surface and comparing those forces tending to produce rotation
of the mass to those tending to resist movement.
20
A section of the slide of unit thickness was chosen for analysis
at station 2 + 30 on Figure 2. This section was then divided into
slices of width b as shown in Figure 13. Forces on the sides of the
slices are neglected (the Bishop refinements make some allowances for
these forces).
Figure 13, page 38, illustrates a force diagram for a slice where
I, the shear force, is equal to P sino( (angle which the bottom of the
slice makes with the horizontal).
The shear strength, derived from those forces tending to resist
movement, acts on the bottom of the slice and is composed of the ef
fective cohesion (c') multiplied by the length of the bottom of the
slice (b seco<:.) plus the effective pressure (a---u) on the bottom of
the slice multiplied by tan 0' ( o--= P cosoL.). Thus Coulombs equation,
previously reviewed, may be re-written:
s = c' b seco<.+ (P cos c1..- u b seco£.) tan 0' .
The moments of all the shear forces about the center of the
rupture arc (failure zone) must equal the moments of all the strengths

if the soil mass is to be in equilibrium, i.e.,
F = 1; or
REP sinaL= R £ s (R = radius of curvature)
B. Geometry of the Slide
21
Stratigraphy and present ground profiles were relatively easy to
determine. Greater difficulty was encountered in establishing the lo
cation of the failure zones and original ground profiles. Failure
zones were located from the relationship of materials, evident fault
scarps, over-riding at the toe of the slope, discontinuities from ex
pected physical properties (during drilling) and caving of holes.
The original ground profiles are estimates based on recorded and re
lated information. Figure 12 shows the original ground line chosen
for analysis, the division of the profile into slices, the present
ground line, the estimated spring water table and the stratigraphy.
C. Input Data
Average unit weights are used for calculations. Values for c
and ~ are based on the type test from which they are derived (see
Figure 9 on page 34).
Shear strengths for the upper till were taken as half the uncon
fined compressive strengths.
D. Calculations
Table VII on page 47 shows the calculations for determining the
forces acting on the soil mass.
During the spring of 1966, the water table was at the ground sur
face on the uplands, and water was seeping from the slide. Thus the
ground water table was selected as shown on Figure 12 to represent
this most critical period.

In June and July of 1966, a little water was encountered in
sand layers in the till, close to contact with the clay. However,
the clay and lower till appeared to be unsaturated (void ratio de
terminations and swelling in the consolidometer).
22
Therefore, two cases are analyzed - one with saturated soils
and pore water pressures and one without allowances for pore water.
Not readily apparent in the text, values of 3.0 plus for un
confined compressive strengths in the upper till are limited to ele
vation 112 thru 114. Sections of the till were largely composed of
relatively cleaner sand. Strengths dropped off rapidly towards the
surface to a value of 0.95 at 4 feet. Shelby tube samples taken in
the spring from the surface to a depth of three feet would not retain
their shape before loading in the unconfined compression machine.
Hard samples rapidly lost strength when saturated. Through the sum
mer to winter, cracks approximately 2 inches wide and 2.5 feet plus
in depth were observed near the crest of the slope. Rather than dif
ferentiate across the failure zone, the shear strength of the upper
till horizon was established, based on weighted averages, as 0.3
tons per square foot (c) for elevations 108 through 124.
Table VIII on page 48 lists values of c, 0, and F for the un
drained, drained and residual tests. The equation at the foot of
Table VIII was used to solve for F.

VIII. CONCLUSIONS AND DISCUSSION
Consistent with earlier investigations, as referenced in the
Review of Literature, conventional direct shear methods of analysis
provided very optimistic results for slope stability. (F = 4.3,
total stress; F = 3.9, effective stress). Analyses by drained di
rect shear test data, with safety factors of 2.5 and 2.2, gave no
indications of impending slope stability problems.
Strength values derived from the residual strength tests gave
safety factors of 1.2 and 1.1.
23
Safety factor values of 0.8 and 0.6, derived from the residual
shear tests and the theory that c approaches zero in time, indicated
a possible failure in the future, i.e., the safety factor would de
crease from 1.2 to 0.8 or 1.1 to 0.6.
Normal highway design procedure includes the acceptance of slopes
with safety factors of 1.3. Strength parameters derived from the
residual shear approach would have led to a review of the design of
this particular slope.
In conclusion, the residual shear strength analyses and the modi
fication of allowing cohesion to approach zero indicated that the slope
was just stable when constructed and that it would fail in time. In
the field, a portion of the slope failed during construction and new
sections failed farther to the south after standing for some two years.
Further, the standard direct shear test does not give strength data
representative of field conditions in stiff fissured clays.
The importance of selecting a laboratory value close to the field
value for cohesion is evident, since a major portion of the shear

24
strength is attributed to this parameter. A change in the cohesion
intercept might influence considerably the calculated factor of
safety. This exacting factor in the analyses is the one that gives
rise to the largest errors. The use of slow drained tests for measur
ing residual strengths, with effective strength analyses, might provide
an even closer correlation than those established in this paper.
Till strengths presented may be too high. SCOTT (1964) found an
average value of cohesion for Kansas till of 0.125 ton per square foot
versus 0.30 ton per square foot used in the foregoing analyses. Joint
ing, surface cracks and block sliding would all tend to decrease this
average cohesion value. These conditions tend to change the shape of
the failure zone from a circle to a spiral having a nearly vertical
portion extending down from the surface. Thus, when the influence of
cohesion decreases, the importance of 0 increases. As a result, 0
should be determined for all soils host to the failure zone.
Assuming a common safety factor in the analysis equation for the
portion that is a function of cohesion and the portion that is a func
tion of 0 seems unwise. In Figure 14, a laboratory value for cohesion
and 0 is located at point A. Combinations of friction and cohesion
represented by the area BCO are critical (F = 1.0 or less). The value
of 0 becomes the dominant parameter as cohesion is allowed to approach
zero.
Finally, the decision on which data to base an analysis rests with
the engineer. Factors of safety vary with the type structure and tend
to mask slight errors in parameter values. However, for good engineer
ing and economy in design, test values should represent field conditions.

IX. RECOMMENDATION FOR FURTHER SlUDY
Two areas that are only partially understood are the mechanism
of shear strength loss in the field and what minimum value of shear
strength will be reached. This paper represents one analysis that
correlates laboratory values of minimum shear strengths with an ac
tual slope failure. Any general inference that the technique could
be used for slope stability analyses must await support from more
case histories.
Another area closely related and open for study is the factors
that affect the rate of shear strength loss.
25

APPENDIX A
FIGURES
26

~128
FIGURE 2, CONTOUR MAP OF THE SLIDE
s~
t DRILL HOLE CONTOUR LINE
- PAVEMENT EDGE _.,. SLIDE BOUNDARY
N
2 FOOT CONTOUR INTERVAL SCALE
1" : 301 liiiiiiil
0 20 40 60 80
27


120.0
0 110.0 I 0
•.-l .u co :> Q)
M ~
100.0
I 9o.o I
FIGURE 4.
0
00
0
0 0
000
0
0 0
Till 0
-------- 0
dk~ Clay 00 oo
00
Clay --- -- --
1
oo I I Till
15 25 35 115 125
Water Contents in % Unit Weight, #/ft3
ELEVATION VERSUS NATURAL WATER CONTENTS AND UNIT WEIGHTS
0
0
135 140
N \0

Legend
130 0 Passing #40 Sieve
• Passing #60 Sieve 6 Passing #200 Sieve
• Silt (0.05 to 0.005 mm. Dia.) 0 Clay (smaller than 0.005 mm.) • Colloids (irna\ter t~n 0.001 mm.) 6
120
• 0 6
• • 0 6
~ 110 0 Till ·r-l •• 0 6. -1-J -Clay - - - - - - -ttl • • 0 :> • • 0 (])
r-l l'il
• • 0
100 • • 0
Clay • • 0
TiiT - - - -- - - - -
90 0 20 40 60
Percent, %
FIGURE 5. ELEVATION VERSUS MECHANICAL ANALYSES
• 0
• 0
• 0
• 0 - ---~«>
&~ 6.«)
/::;. eo -- - --
80 100
w 0

120.0 r-.w
~ Q) 110.0 Q)
~ -r.
c 0
•r-l .w ttl I :> Q)
,.....-! 100.0 ~
90.0 10
6
6 0
6 0
.6 0 -- -
.6 .6
.6 .6
6
20
Legend
0 Liquid Limit
6 Plastic Limit 0 0 0 Plastic Index
0
0
0 Till
- ------ - - -- -- -0 0 Clay
0 0
0 0 0 0
0
0 0
Moisture Content, %
0 Clay
-Till-
FIGURE 6. ELEVATION VERSUS ATTERBERG LIHITS
w ~

60
50
X Q)
'"0 40 r:: H
» .u •.-I 30 CJ
•.-I .u U)
co r-l 20 P-1
10
Legend
1. Gumbo Clay of Miss, Ark, Tex, 2. Kaolin Clay
3. • Upper Till 4. o Gray Clay
• 3e .. ,2
Reference: LAMBE (1951)
10 30 50 70 90
Liquid Limit
FIGURE 7. PLASTICITY CHART
110
w N

50.0
~ 40.0 '-"
.w t:: C) .w r;:j 0
C,.)
~ C) .w (ij
!3:
30.0
20.0 0.0 0.5
Legend
• Remolded Samples D Undisturbed Samples
0
0 oo 0
~ 0 0
0 ----------0 0 0 0 0
l 1.0 1.5 2.0
Unconfined Compressive Strength (Tons/Square Foot)
FIGURE 8. WATER CONTENT VERSUS UNCONFINED COHPRESSIVE STRENGTH (CLAY)
0
2.5
w w

,-.... .1-J
...c 0 .1-J 0 b.O~ ~ (!) (!)
~ ~ .1-J C\l {/) ::l
0"' ~{/) cu-........ (!) (/)
...c c {/) 0
H '--'
2 .or- Legend
1. Undrained Test 2. Drained Test ----3. Residual Shear Test ---1.51
17'"'
1.0
~~~~;~ ~--- 0 = 14° c = 0.31
I ------ - 3 ---- 0 = 5°
c = 0.10 o.oL I I I I I I J
0.0 0.5 1.0 1.5 2.0 2.5 3.0
Normal Stress (Tons/Square Foot)
FIGURE 9. SHEAR STRENGTH VERSUS NORNAL STRESS (DIRECT SHEAR)
--
-
---
----
I 3.5
w ~

1000
1100
1200
,-.... 1300 bO....::t ~ I
·r-l 0 "0 r-1 co 1400 Q) >:: 0:: ..c r-1 C)
co ~ •r-l H 1500 A '-"
1600
1700
r----r---1-------........... r-..... I ~ ~I
'\
1\ I
I \ i I
I I \ I I 1\_ I
K r--..._
- -- ------ --- --~--- ~---------- ------1..-----
0.1 0.5 1.0 5 10 50 100 500 1000 5000
Log Time (Minutes)
FIGURE 10. DIAL READING VERSUS LOG TIME, 32 TSF
w l.l1

1.0
0.9
0.8
-.. 0.7 Q) '-"'
0 •r-1 .u C'lj 0.6 ~
'"0 •r-1 0 0.5 :>
0.4
0.3 0.1 0.5 1 5 10
Log P (Tons per Square Foot)
FIGURE 11. VOID RATIO - PRESSURE RELATIONSHIP
so
w 0\

~ 0
•..4 .1-J co :> Q)
,...-l
J::il
140
120
100
Legend t ~ - Present Ground Profile ___ Original Ground Profile (1962) -- - · · · Shear Zone
Lithologic Contact .......... Water Table
1-1)_-·~
...... 1 •• ..,....., # '
Radius, R = 57.2 ft.
~
Till
Clay
Clay
Till
so~--------~--------~--------._--------~--------~--------._--~ 20 0 20 40 60 80 100
Horizontal Distance
FIGURE 12. PROFILE OF SLOPE, 6 JUNE 1962 (ORIGINAL)
w '-l

p -
0'-' -
r-
Center of Assumed Rupture Arc
Legend
Total Weight of Slice Normal Force Shear Force
.,....., _..-
---__. p
Ground
FIGURE 13. FORCE DIAGRAM FOR A SLICE
38

<J
... c: 0
•.-I U)
Q)
..c 0 u 44 0
U)
Q) ;::j rl co :>
Legend
Line B-C: F = 1.0 Line A-D: Decrease in c,0 constant Line A-E: Decrease in 0,c constant
E A
D
Values of Angle of Friction, 0
FIGURE 14. FACTOR OF SAFETY DIAGRAN
w 1..0

APPENDIX B
TABLES
40

41
TABLE I
NATURAL WATER CONTENTS'-"'
Elevation Sample Number Water Content, %
120 JL - 66 - (2) - 1 - 1 19.4
120 JL - 66 - (2) - 1 - 1 15.7
119 JL - 66 - (2) - 1 - 1 19.6
117 KP - 2 - 3 - 1 - 1 16.5
110 ST 411 - 2 18.0
110 ST 4/:1 - 2 17.7
108 KP - 2 - 3 - 1 - 7 21.9
106 JL - 66 - (2) - 1 - 3 30.0
105 ST ifftl - 6 33.7
105 ST fftl - 6 32.2
104 ST =/ftl - 6 32.2
104 ST ill - 6 33.1
103 B5 (2) - 878 - 1 27.8
103 B5 (2) - 878 - 1 27.9
103 B5 (2) - 878 - 1 27.5
102 KP - 2 - 3 - 1 - 9 29.4
93 JL - 66 - (2) - 1 - 4 16.5
92 JL - 66 - (2) - 1 - 4 16.9
92 JL - 66 - (2) .. 1 - 4 16.3
(Representative values, see Figure 4 for supplemental data.

Elevation
120
119
114
110
108
to
106
106
to
104
104
103
103
93
92
TABLE II
NATURAL UNIT WEIGIITS
Sample Number
JL - 66 - (2) - 1 - 1
JL - 66 - (2) - 1 - 1
B 5 (2) - 869
ST i/:1 - 2
JL - 66 - (2) - 1 - 2
JL - 66 - (2) - 1 - 3
ST ill - 6
B 5 (2) - 878 - 2
B 5 (2) - 878 - 1
JL - 66 - (2) - 1 - 4
JL - 66 - (2) - 1 - 4
Natural Unit Weight Pounds/Cubic Foot
132.0
128.0
138.2
128.0
119.8
121.2
120.5
121.4
120.2
120.2
124.2
120.5
120.0
120.5
117.8
118.2
119.8
119.5
119.7
120.0
135.8
135.0
42
43
TABLE III
MECHANICAL ANALYSES
Elevation % Passing Sieve Number
10 40 60 200 S i 1 t'i\- Clayi' Colloid s'i'r
122 100.0 94.4 87.2 68.8 22.5 40.5 30.0
117 100.0 92.6 84.0 64.4 24.0 34.0 24.0
114 100.0 93.4 86.2 68.0 25.5 35.0 20.0
109 100.0 93.8 87.2 70.6 26.5 37.5 23.0
107 100.0 99.4 98.6 96.0 32.0 57.5 45.0
106 100.0 95.8 30.5 60.0 46.0
102 100.0 99.2 98.4 95.6 29.0 62.0 45.0
101 100.0 99.0 97.8 94.8 30.5 58.0 43.0
94 100.0 98.4 96.2 90.2 25.5 60.0 45.0
'i'-"Silt (O .05 to 0.005 mm. Diam.)
Clay (Smaller than 0 . 005 nun. )
Colloids (Smaller than 0.001 mm.)

44
TABLE IV
ATTERBERG LIMITS*
Liquid Plastic Plasticity Ac ti vi ty'~'~·k Shrinkage Elevation Limit Limit Index Coefficient Limit
122 47 15 32 0. 79
117 35 13 22 0.65
114 37 14 23 0.66
109 42 15 27 0.72
107 65 19 46 0.80
106 75 20 55 0.92 28.8
102 69 21 48 0.77
101 62 24 38 0.65
94 66 20 46 0.77
·k Moisture contents in %
"'~""Ac ti vi ty coefficient equal to plastic index/% clay

45
TABLE V
UNCONFINED COMPRESSIVE STRENGTHS
Tons per Square Foot
Elevation Sample Number Strength
117 KP - (2) - 3 - 1 - 1 0. 95
114 KP - (2) - 3 - 1 - 3 3.75
112 KP - (2) - 3 - 1 - 5 3.70
110 KP - (2) - 3 - 2 - 13 2.50
109 KP - (2) - 3 - 3 - 19 2.00
108 KP - (2) - (3) - 1 - 7 1.80
108 KP - (2) - 3 - 3 - 21 1.20
107 BS (2) - 874 0.85
106 JL - 66 - (2) - 1 - 3 1.47
105 JL - 66 - (2) - 1 - 3 1.49
105 ST 111 - 5 1.44
104 ST 111 - 6 2.53
104 KP - (2) - 3 - 2 - 15 0.80
104 KP - (2) - 3 - 2 - 17 1.25
103 B5 (2) - 878 1.00
103 KP - (2) - 3 - 3 - 22 2.20
103 KP - (2) - 3 - 3 - 23 1.10
102 KP - (2) - 3 - (1) - 9 0.70
102 KP - (2) - 3 - (1) - 11 1.10
93 JL - 66 - 2 - 1 - 4 5.25
92 JL - 66 - (2) - 1 - 4 5.11
92 JL - 66 - (2) - 1 - 4 5.37

TABLE VI
SHEAR STRENGTH OF CLAY (DIRECT SHEAR)
(Tons per Square Foot)
Normal Stress (Tons per Square Foot) Strain Rate
0.425 0.660 0.85 1.72 2.06 2.64 3.46 in./min.
0.741
0.684
0.122
Undrained Test
1.058 1.366 1.525 1.586 0.0605
1.065 1.511 1.511 0.0605
1.145 0.0605
Drained Test
0.557 1.023 1.110 0.0004
Residual Shear Test, Uncontrolled Shear Zone, Strain Approximately Three Inches
0.550 0.650 0.650 0.910 0.0605
0.240 0.575
Residual Shear Test, Controlled Shear Zone, Strain Approximately Three Inches
0.255 0.312
0.0605
0.1333
0.115 0.200 0.260 0.280 0.305 0.0605
0.175 0.302 0.0345
0.170 0.300 0.0170
46

TABLE VII
INDEPENDENT CALCULATIONS
6 June 1962 Profile
b sec oL. p cos oL- p cos oL-Slice P,lb. Clay u P cosoL p cos oL ub sec ot.. ub seco( Number Total Degree P sine<:. ft. lb/ft Till Clay Till Clay
1 769 -15.6 -207 4.15 125 741 222 2 2210 -11.8 -451 4.09 219 2163 1267 3 3435 - 7.7 -460 4.04 312 3404 2144 4 4636 - 3.8 -307 4.01 487 4626 2673 5 5714 10.3 30 4.00 587 5714 3366 6 6670 14.3 500 4.01 686 6651 3900 7 7004 8.3 1011 4.04 743 6930 3928 8 6668 12.5 1443 4.10 774 6510 3337 9 6727 16.5 1911 4.17 811 6450 3068
10 6777 20.8 2407 4.28 786 6335 2971 11 6802 25.0 2875 4.41 774 6165 2752 12 6779 29.4 3328 4.59 711 5906 2643 13 5055 33.4 2783 3.59 668 4220 1822 14 4813 37.0 2896 562 3844 1731 15 3866 41.0 2536 468 2918 1055 16 3840 45.6 2743 324 2688 835 17 2170 52.8 1728 50 1312 898 -
24766 56.48 10762 65815 4519 34093 I ~ ~

Cohesion
Source of Data c = c'
(lb/ ft2)
Undrained Direct Shear 0.65
Drained Direct Shear 0.31
Residual Direct Shear 0.10
Theory 0.0
R P sin = R
Assumptions: Fl = F2
TABLE VIII
SUMMARY OF ANALYSES
Angle of Friction 0 = 0'
(degrees)
17
14
5
5
c b sec + R Fl
Safety Factor (F) (Total Analyses) (Effective Analyses)
4.3
2.5
1.2
0.8
(W cos - u b sec ) tan 0 F2
3.9
2.2
1.1
0.6
Constant Data: R = 57.2 feet
Till Strength: c = c' 0 = 0'
0.3 tons per square foot 0.0
~ CX>

49
BIBLIOGRAPHY
BASETT, D. J. and J. I. ADAMS, E. L. MATYAS (1961) An investigation of a slide in a test trench excavated in fissured sensitive marine clay. Proc. of the Fifth Int. Conf. on Soil Mech. and Foun. Engr., v. I, p. 431-435.
BJERRUM, L. (1965) Notes on third Terzaghi lecture. 66 p.
BINGER, W. V. (1948) Analytical studies of Panama Canal Slides. Proc. of the Second Int. Conf. on Soil Mech. V. 2, p. 54-59.
BINGER, W. V. and T. Fo THOMPSON (1949) Excavation slopes, Panama Canal. ASCE Transactions, v. 114, p. 734.
BISHOP, A. W. and D. J. HENKEL (1957) the measurement of soil properties in the triaxial test. Arnold, London, p. 1-32.
CASSEL, F. L. (1948) Slips in fissured clay. Proc. of Second Int. Conf. on Soil Mech., v. II, p. 46-49.
DEWET, J. A. (1961) The use of the energy concept in soil mechanics. Proc. of the Fifth Int. Conf. on Soil Mech. and Foun. Engr. v. I, p. 403-406.
HENKEL, D. J. and A. W. SKEMPTON (1955) The landslide at Jackfield, Shropshire, in a heavily over-consolidated clay. Ceotechnique, v. V, p. 131-137.
HENKEL, Do J. (1957) Investigation of two long-term failures in London clay slopes at Woodgreen and Northolt. Proc. of the Fourth Int. Conf. on Soil Mech., v. II, p. 315-320.
HOLMES, A. (1945) Principles of physical geology. Ronald, New York, 532 p.
HOLTZ, W. G. and H. J. GIBBS (1954) Engineering properties of expansive clays. Proc. of ASCE, Oct. v. 80, p. 516-1 - 516-28.
HOUGH, B. K. (1957) Basic soils engineering. Ronald, New York. 513 p.
HOWE, W. B. (1966) Personal communication.
JUMIKIS, A. R. (1962) Soil mechanics. Nostrand, New York. 791 p.
KAROL, Ro H. (1960) Soils and soil engineering. Prentice-Hall, Englewood Cliffs. 194 p.
LAMBE, T. W. {1961) Soil testing for engineers. Wiley, New York, 165 p.
LOBECK, A. K. (1939) Geomorphology. McGraw-Hill, New York. 731 p.

50
LONG, G. (1966) Personal communication.
MURAYAM, S. and T. SHIBATA (1961) Rheological properties of clays. Proc. of the Fifth Int. Conf. on Soil Mech. and Foun. Engr. v. 1, p. 269-273.
PECK, R. B. and W. E. HANSON, T. H. THORNBURN (1953) Foundation engineering. Wiley, New York. 410 p.
REYNOLDS, H. R. and P. PROTOPAPADAKIS (1959) Practical problems in soil mechanics. Ungar, New York. p. 1-66.
RUHE, R. V. (1956) Geomorphic surfaces and the nature of soils. Soil Science, v. 82, no. 6, p. 441-455.
SAITO, M. and H. UEQAWA (1961) Failure of soil due to creep. Proc. of the Fifth Int. Conf. on Soil Mech. and Foun. Engr. v. 1, p. 315-318.
SCOTT, J. D. (1964) Slope failures in over-consolidated fissured clays in southwestern Iowa. Thesis, Univ. of Ill. 181 p.
SCOTT, R. J. (1963) Principles of soil mechanics. Addison-Wesley, Reading. 550 p.
SKEMPTON, A. Wo (1948) The rate of softening in stiff fissured clays with special reference to London Clay. Proc. of the Second Int. Conf. on Soil Mech., v. II, p. 50-53.
SKEMPTON, A. W. and F. A. DELORY (1957) Stability of natural slopes in the London clay. Proc. of the Fourth Int. Conf. on Soil Mech., v. II, P. 378-381.
SKEMPTON, A. W. (1961) Horizontal stresses in an over-consolidated Eocene clay. Proc. of the Fifth Int. Conf. on Soil Mech. and Foun. Engr. v. 1, p. 351-357.
SKEMPTON, A. W. and J. D. BROWN (1961) A landslide in boulder clay at Selset, Yorkshire. Geotechnique, v. XI, no. 4, p. 280-293.
SKEMPTON, A. W. (1964) Fourth Rankine Lecture: Long-term stability of clay slopes. Geotechnique, v. XIV, no. 2, p. 75-102.
SPANGLER, M. G. (1963) Soil engineering, 2 ed. International, Scranton. 483 p.
TAYLOR, D. W. (1948) Fundamentals of soil mechanics. Wiley, New York. 700 p.
TERZAGHI, K. (1943) Theoretical soil mechanics. Wiley, New York. 510 p.
T.ERZAGHI, K. and R. B. PECK (1948) Soil mechanics in engineering practice. Wiley, New York, 566 p.
TERZAGHI, K. (1960), I. BJERRUM, A. CASAGRANDE, R. B. PECK, A. W.
51
SKEMPTON From theory to practice in soil mechanics, selections from the writings of Earl Terzaghi. Wiley, New York. 425 p.
U. s. Army Engineer School (1962) Soils engineering. Stu. Adv. Sheet. Sec. i, Vol. III, Ch. X, XI, XII, p. 655-667.
WILLIAMS, J. H. (1966) Personal communication.

VITA
Byron George Walker was born on 23 February 1936 at Pueblo,
Colorado. He received his primary and secondary education in the
Minturn, Colorado, public school system.
52
In May, 1959, he was graduated from the Colorado School of Mines
with the degree of Geological Engineer and was commissioned immediately
into the United States Army.
After a short time as an engineer with the U. S. Forest Service,
he was called to active duty in the Corps of Engineers. He has served
with the Corps since that time and presently holds the rank of Captain.
He was assigned to the University of Missouri at Rolla in Septem
ber, 1964, for graduate study; and became a registered Professional
Engineer in the State of Missouri in 1966.
Captain Walker is married to the former Alice Marie Pierson of
Minturn, Colorado. They have two sons, Victor Lynn and Howard Andrew.
Related Documents