Slide 7.1 Saunders, Lewis and Thornhill, Research Methods for Business Students, 5 th Edition, © Mark Saunders, Philip Lewis and Adrian Thornhill 2009 Selecting Samples and Sample Size

Welcome message from author
This document is posted to help you gain knowledge. Please leave a comment to let me know what you think about it! Share it to your friends and learn new things together.
Transcript
Slide 7.1
Saunders, Lewis and Thornhill, Research Methods for Business Students, 5th Edition, © Mark Saunders, Philip Lewis and Adrian Thornhill 2009
Selecting Samples and Sample Size

Slide 7.2
Saunders, Lewis and Thornhill, Research Methods for Business Students, 5th Edition, © Mark Saunders, Philip Lewis and Adrian Thornhill 2009
The Sampling Design Process
Define the Population
Determine the Sampling Frame
Select Sampling Technique(s)
Determine the Sample Size
Execute the Sampling Process
Slide 7.3
Saunders, Lewis and Thornhill, Research Methods for Business Students, 5th Edition, © Mark Saunders, Philip Lewis and Adrian Thornhill 2009
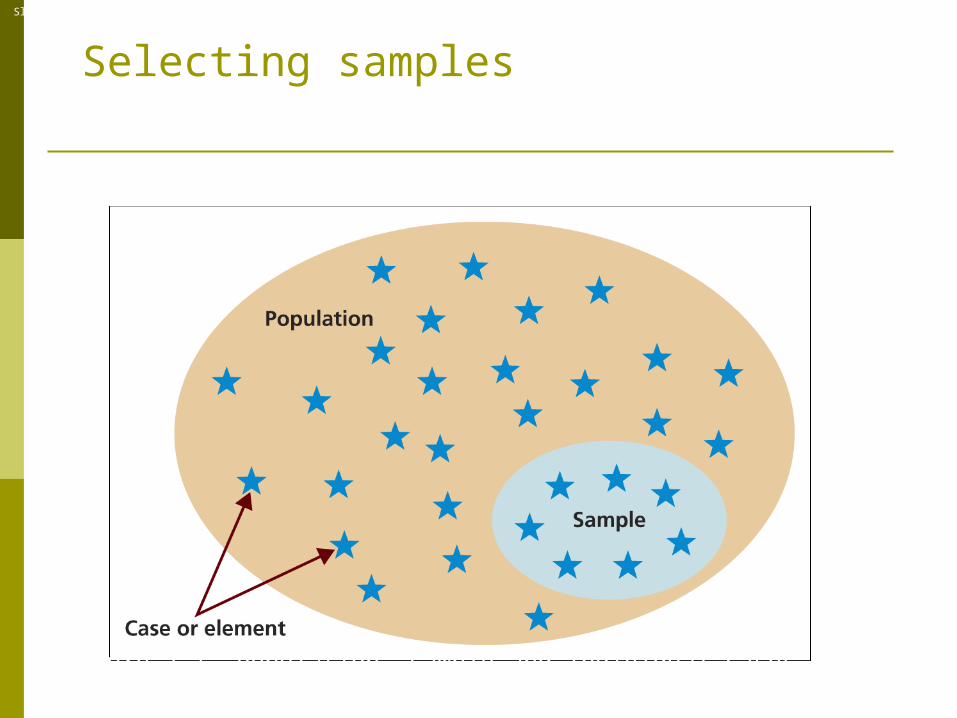
Selecting samples
Figure 7.1 Population, sample and individual cases
Slide 7.4
Saunders, Lewis and Thornhill, Research Methods for Business Students, 5th Edition, © Mark Saunders, Philip Lewis and Adrian Thornhill 2009
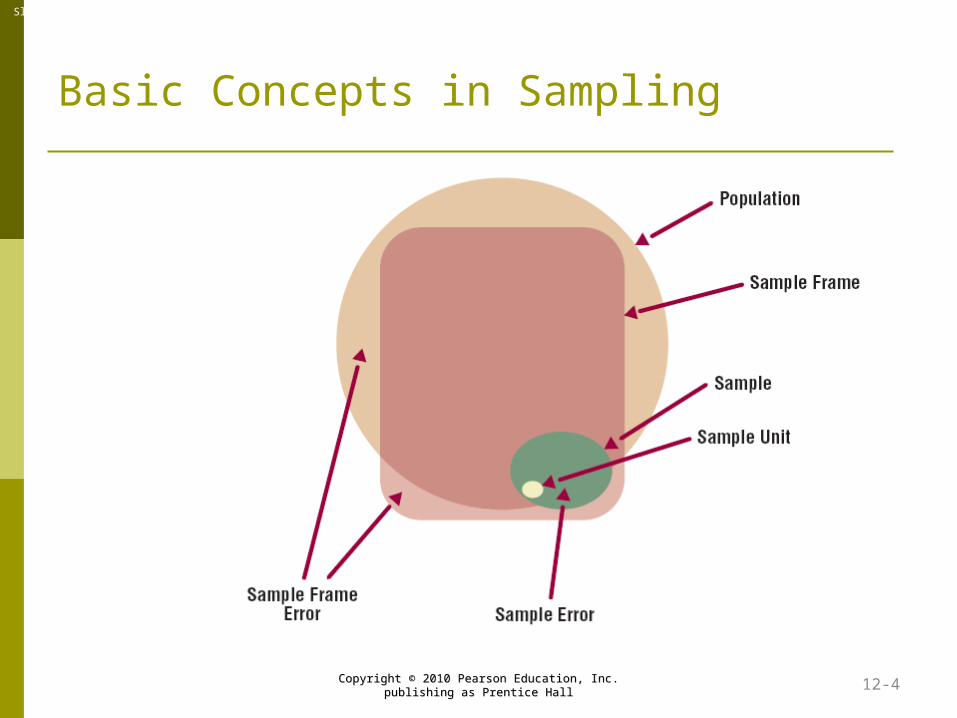
Basic Concepts in Sampling
Copyright © 2010 Pearson Education, Inc. Copyright © 2010 Pearson Education, Inc. publishing as Prentice Hallpublishing as Prentice Hall 12-4
Slide 7.5
Saunders, Lewis and Thornhill, Research Methods for Business Students, 5th Edition, © Mark Saunders, Philip Lewis and Adrian Thornhill 2009
The need to sample - Sampling- a valid alternative to a census when
A survey of the entire population is impracticable Budget constraints restrict data collection Time constraints restrict data collection Results from data collection are needed quickly
Imagine that in a lawsuit the defendant, a utility firm, overbilled customers. The plaintiffs determined that the average overbilling amounted to $49.50 per customer. The judge learned that the amount was based on a sample and did not want to rely on an analysis of a sample. He insisted upon a three-month process of analyzing each bill. The exact amount of overbilling was $49.48!!! There are many actual situations similar to this.
They are MORE accurate than a census (when the population is large). The large field staff needed to collect data from a large census make many errors.
Slide 7.6
Saunders, Lewis and Thornhill, Research Methods for Business Students, 5th Edition, © Mark Saunders, Philip Lewis and Adrian Thornhill 2009
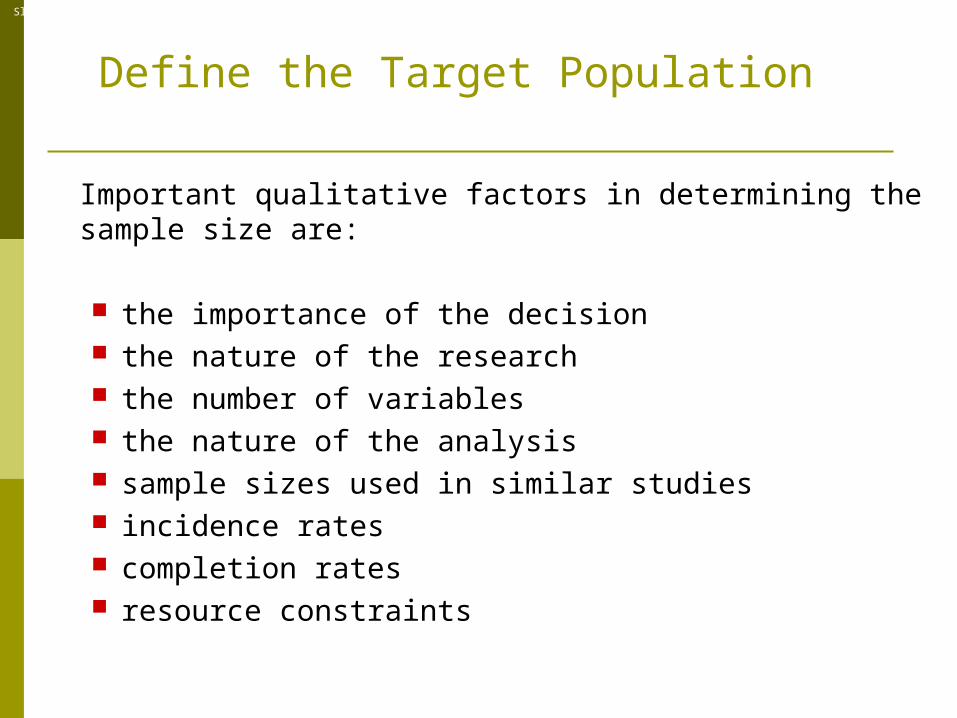
Define the Target Population
Important qualitative factors in determining the sample size are:
the importance of the decision the nature of the research the number of variables the nature of the analysis sample sizes used in similar studies incidence rates completion rates resource constraints
Slide 7.7
Saunders, Lewis and Thornhill, Research Methods for Business Students, 5th Edition, © Mark Saunders, Philip Lewis and Adrian Thornhill 2009
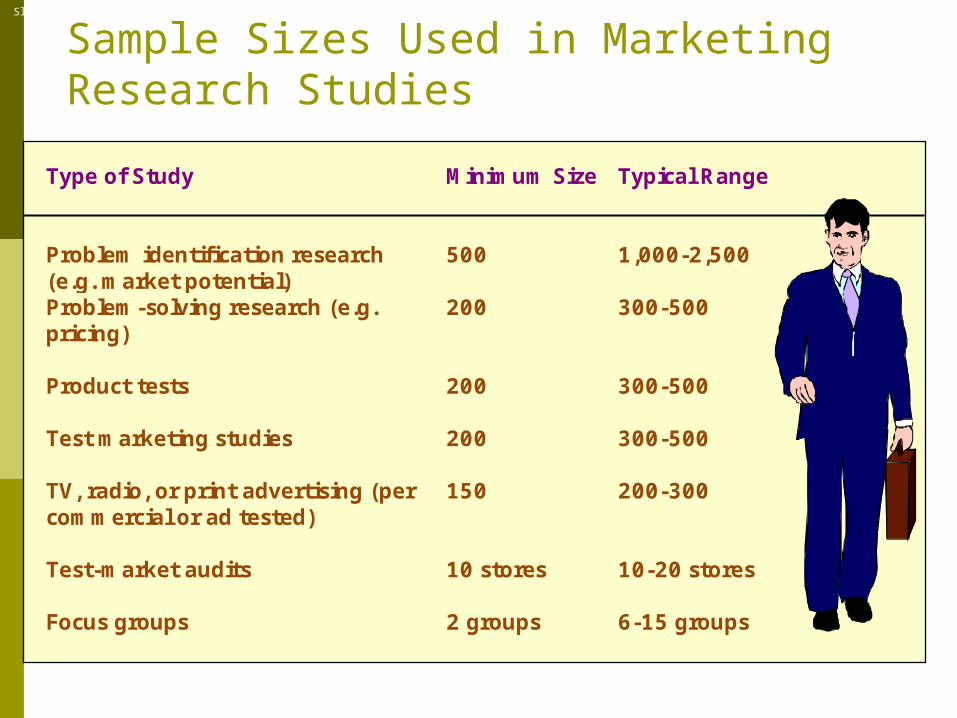
Sample Sizes Used in Marketing Research Studies
Type of Study
Minimum Size Typical Range
Problem identification research (e.g. market potential)
500
1,000-2,500
Problem-solving research (e.g. pricing)
200 300-500
Product tests
200 300-500
Test marketing studies
200 300-500
TV, radio, or print advertising (per commercial or ad tested)
150 200-300
Test-market audits
10 stores
10-20 stores
Focus groups
2 groups 6-15 groups
Slide 7.8
Saunders, Lewis and Thornhill, Research Methods for Business Students, 5th Edition, © Mark Saunders, Philip Lewis and Adrian Thornhill 2009
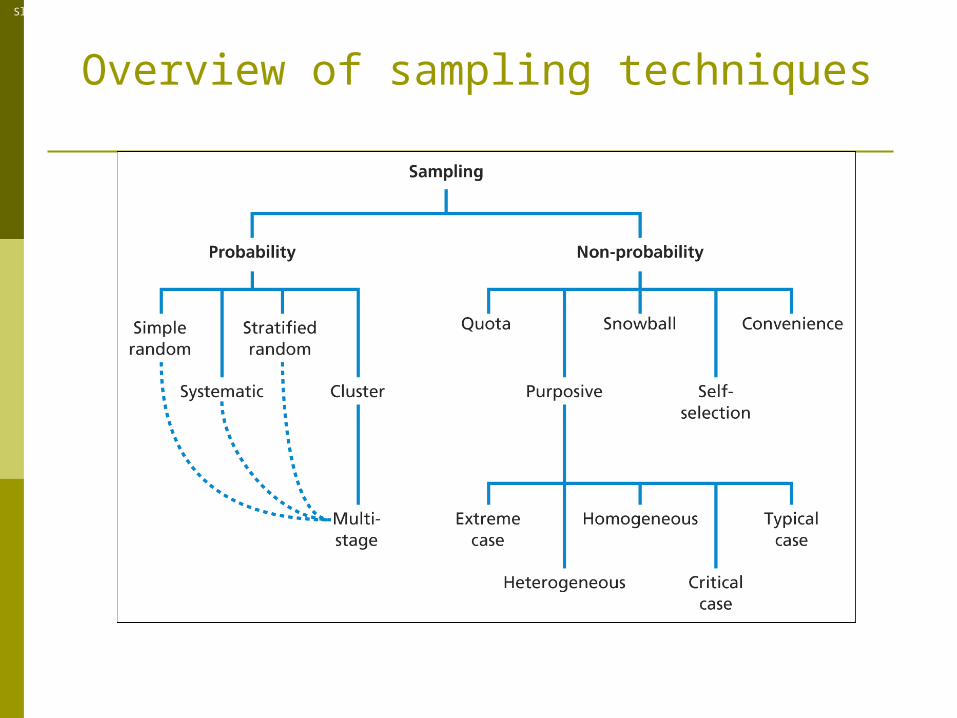
Overview of sampling techniques
Figure 7.2 Sampling techniques
Slide 7.9
Saunders, Lewis and Thornhill, Research Methods for Business Students, 5th Edition, © Mark Saunders, Philip Lewis and Adrian Thornhill 2009
Convenience Sampling
Convenience sampling attempts to obtain a sample of convenient elements. Often, respondents are selected because they happen to be in the right place at the right time.
Use of students, and members of social organizations
Mall intercept interviews without qualifying the respondents
Department stores using charge account lists
“People on the street” interviews
Slide 7.10
Saunders, Lewis and Thornhill, Research Methods for Business Students, 5th Edition, © Mark Saunders, Philip Lewis and Adrian Thornhill 2009
Judgmental Sampling
Judgmental sampling is a form of convenience sampling in which the population elements are selected based on the judgment of the researcher.
Test markets
Purchase engineers selected in industrial marketing research
Bellwether precincts selected in voting behavior research
Expert witnesses used in court
Slide 7.11
Saunders, Lewis and Thornhill, Research Methods for Business Students, 5th Edition, © Mark Saunders, Philip Lewis and Adrian Thornhill 2009
Judgment - Purposive Sample
Extreme case or deviant sampling
Focuses on unusual or special cases on the basis that the data collected about these unusual or extreme outcomes will enable you to learn the most and to answer your research question's and to meet your objective most effectively. This is often based on the premises that findings from extreme cases will be relevant in understanding or explaining more typical cases
Heterogeneous or maximum variation samplingEnables you to collect data to describe and explain the key themes
that can be observed. Although this might appear a contradiction, as a small sample may contain cases that are completely different
In direct contrast to heterogeneous sampling, homogeneous sampling focuses on one particular sub-group in which all the sample members are similar, this enables you to study the group in great depth
Slide 7.12
Saunders, Lewis and Thornhill, Research Methods for Business Students, 5th Edition, © Mark Saunders, Philip Lewis and Adrian Thornhill 2009
Quota Sampling
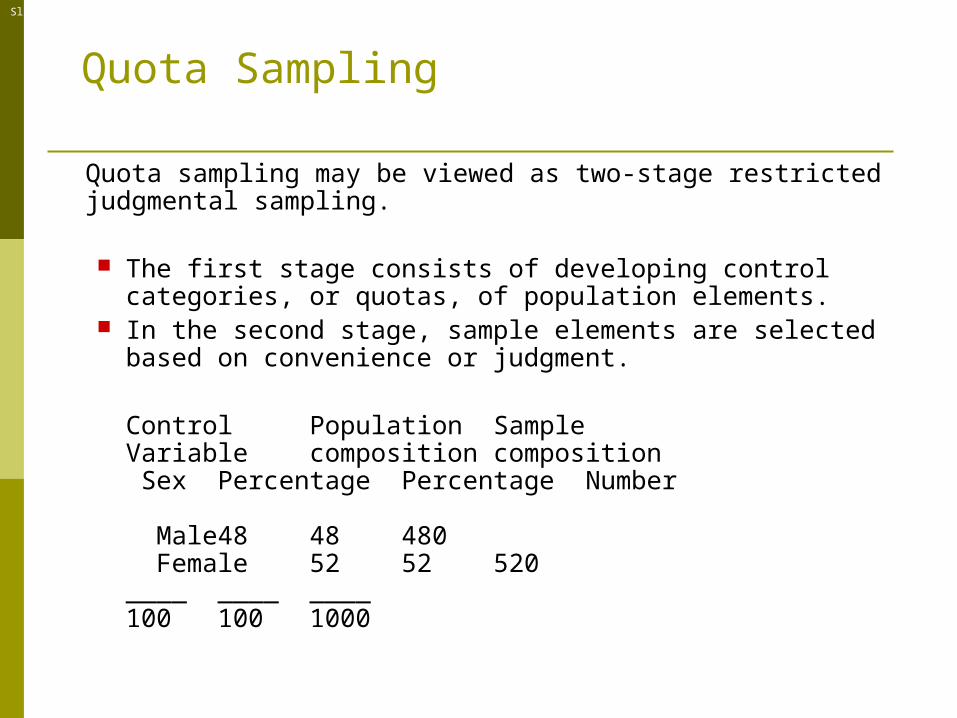
Quota sampling may be viewed as two-stage restricted judgmental sampling.
The first stage consists of developing control categories, or quotas, of population elements.
In the second stage, sample elements are selected based on convenience or judgment.
Control Population SampleVariable composition composition Sex Percentage Percentage Number
Male 48 48 480 Female 52 52 520
____ ____ ____100 100 1000

Slide 7.13
Saunders, Lewis and Thornhill, Research Methods for Business Students, 5th Edition, © Mark Saunders, Philip Lewis and Adrian Thornhill 2009
Snowball Sampling
In snowball sampling, an initial group of respondents is selected, usually at random.
After being interviewed, these respondents are asked to identify others who belong to the target population of interest.
Subsequent respondents are selected based on the
referrals.
Slide 7.14
Saunders, Lewis and Thornhill, Research Methods for Business Students, 5th Edition, © Mark Saunders, Philip Lewis and Adrian Thornhill 2009
Simple Random Sampling
Each element in the population has a known and equal probability of selection.
Each possible sample of a given size (n) has a known and equal probability of being the sample actually selected.
This implies that every element is selected independently of every other element.
Slide 7.15
Saunders, Lewis and Thornhill, Research Methods for Business Students, 5th Edition, © Mark Saunders, Philip Lewis and Adrian Thornhill 2009
Systematic Sampling
The sample is chosen by selecting a random starting point and then picking every i-th element in succession from the sampling frame.
The sampling interval, i, is determined by dividing the population size N by the sample size n and rounding to the nearest integer.
When the ordering of the elements is related to the characteristic of interest, systematic sampling increases the representativeness of the sample.
Slide 7.16
Saunders, Lewis and Thornhill, Research Methods for Business Students, 5th Edition, © Mark Saunders, Philip Lewis and Adrian Thornhill 2009
Systematic Sampling
If the ordering of the elements produces a cyclical pattern, systematic sampling may decrease the representativeness of the sample.
For example, there are 100,000 elements in the population and a sample of 1,000 is desired. In this case the sampling interval, i, is 100. A random number between 1 and 100 is selected. If, for example, this number is 23, the sample consists of elements 23, 123, 223, 323, 423, 523, and so on.
Slide 7.17
Saunders, Lewis and Thornhill, Research Methods for Business Students, 5th Edition, © Mark Saunders, Philip Lewis and Adrian Thornhill 2009
Stratified Sampling
A two-step process in which the population is partitioned into subpopulations, or strata.
The strata should be mutually exclusive and collectively exhaustive in that every population element should be assigned to one and only one stratum and no population elements should be omitted.
Next, elements are selected from each stratum by a random procedure, usually SRS.
A major objective of stratified sampling is to increase precision without increasing cost.
Slide 7.18
Saunders, Lewis and Thornhill, Research Methods for Business Students, 5th Edition, © Mark Saunders, Philip Lewis and Adrian Thornhill 2009
Stratified Sampling
The elements within a stratum should be as homogeneous as possible, but the elements in different strata should be as heterogeneous as possible.
The stratification variables should also be closely related to the characteristic of interest.
Finally, the variables should decrease the cost of the stratification process by being easy to measure and apply.
Slide 7.19
Saunders, Lewis and Thornhill, Research Methods for Business Students, 5th Edition, © Mark Saunders, Philip Lewis and Adrian Thornhill 2009
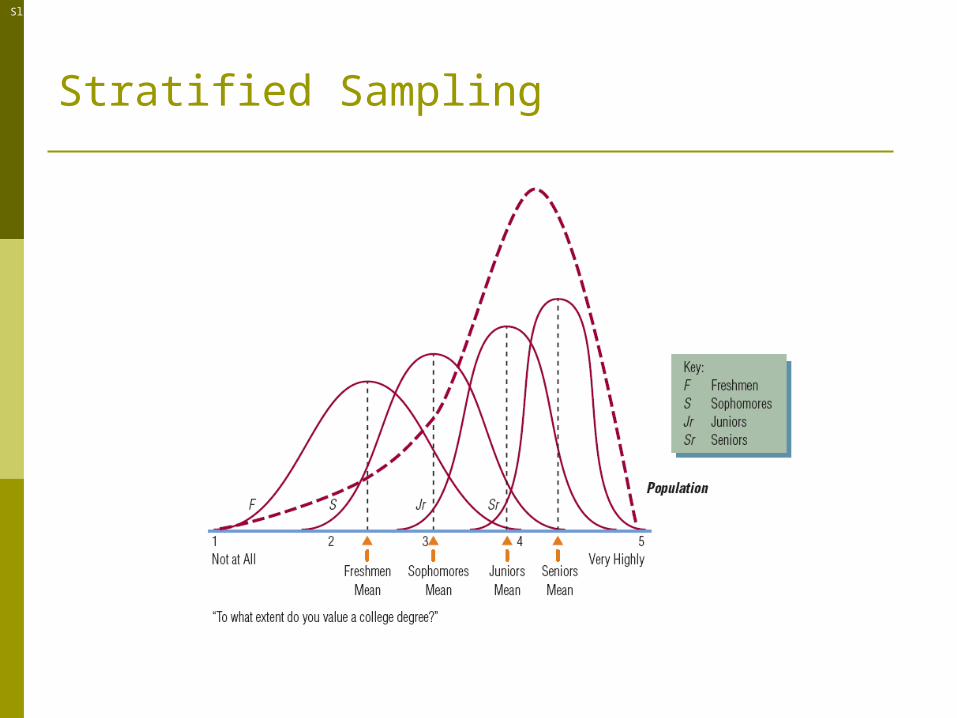
Stratified Sampling
Slide 7.20
Saunders, Lewis and Thornhill, Research Methods for Business Students, 5th Edition, © Mark Saunders, Philip Lewis and Adrian Thornhill 2009
Stratified Sampling
In proportionate stratified sampling, the size of the sample drawn from each stratum is proportionate to the relative size of that stratum in the total population.
In disproportionate stratified sampling, the size of the sample from each stratum is proportionate to the relative size of that stratum and to the standard deviation of the distribution of the characteristic of interest among all the elements in that stratum.
Slide 7.21
Saunders, Lewis and Thornhill, Research Methods for Business Students, 5th Edition, © Mark Saunders, Philip Lewis and Adrian Thornhill 2009
Cluster Sampling
The target population is first divided into mutually exclusive and collectively exhaustive subpopulations, or clusters.
Then a random sample of clusters is selected, based on a probability sampling technique such as SRS.
For each selected cluster, either all the elements are included in the sample (one-stage) or a sample of elements is drawn probabilistically (two-stage).
Slide 7.22
Saunders, Lewis and Thornhill, Research Methods for Business Students, 5th Edition, © Mark Saunders, Philip Lewis and Adrian Thornhill 2009
Cluster Sampling
Elements within a cluster should be as heterogeneous as possible, but clusters themselves should be as homogeneous as possible. Ideally, each cluster should be a small-scale representation of the population.
In probability proportionate to size sampling, the clusters are sampled with probability proportional to size. In the second stage, the probability of selecting a sampling unit in a selected cluster varies inversely with the size of the cluster.

Slide 7.23
Saunders, Lewis and Thornhill, Research Methods for Business Students, 5th Edition, © Mark Saunders, Philip Lewis and Adrian Thornhill 2009
Strengths and Weaknesses of Basic Sampling Techniques
Technique Strengths WeaknessesNonprobability Sampling Convenience sampling
Least expensive, leasttime-consuming, mostconvenient
Selection bias, sample notrepresentative, not recommended fordescriptive or causal research
Judgmental sampling Low cost, convenient,not time-consuming
Does not allow generalization,subjective
Quota sampling Sample can be controlledfor certain characteristics
Selection bias, no assurance ofrepresentativeness
Snowball sampling Can estimate rarecharacteristics
Time-consuming
Probability sampling Simple random sampling(SRS)
Easily understood,results projectable
Difficult to construct samplingframe, expensive, lower precision,no assurance of representativeness
Systematic sampling Can increaserepresentativeness,easier to implement thanSRS, sampling frame notnecessary
Can decrease representativeness
Stratified sampling Include all importantsubpopulations,precision
Difficult to select relevantstratification variables, not feasible tostratify on many variables, expensive
Cluster sampling Easy to implement, costeffective
Imprecise, difficult to compute andinterpret results
Slide 7.24
Saunders, Lewis and Thornhill, Research Methods for Business Students, 5th Edition, © Mark Saunders, Philip Lewis and Adrian Thornhill 2009
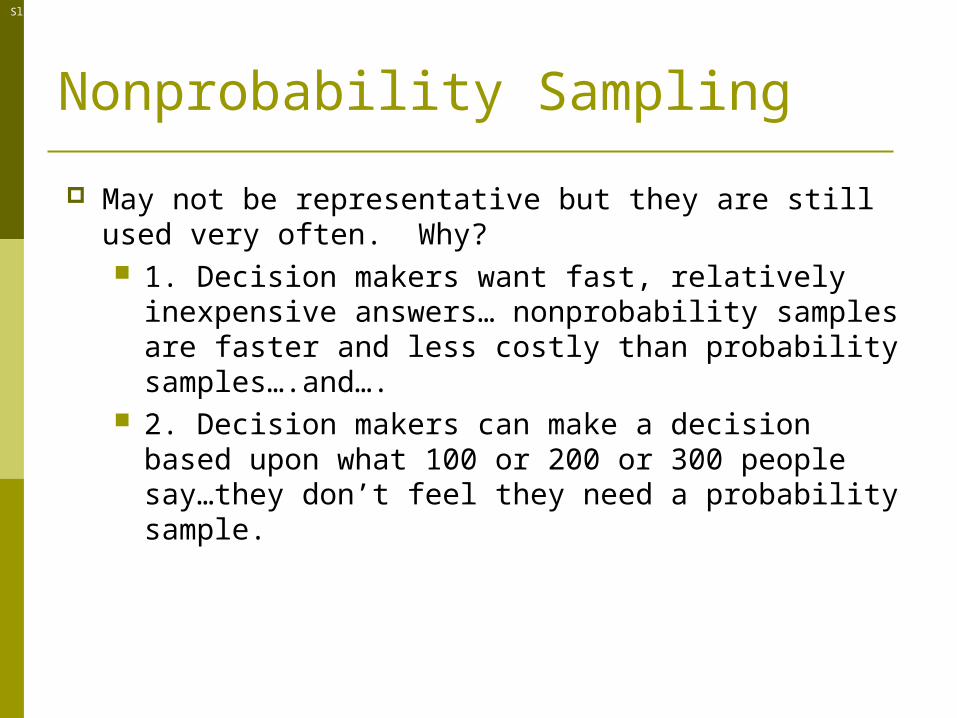
Nonprobability Sampling
May not be representative but they are still used very often. Why? 1. Decision makers want fast, relatively inexpensive
answers… nonprobability samples are faster and less costly than probability samples….and….
2. Decision makers can make a decision based upon what 100 or 200 or 300 people say…they don’t feel they need a probability sample.
Slide 7.25
Saunders, Lewis and Thornhill, Research Methods for Business Students, 5th Edition, © Mark Saunders, Philip Lewis and Adrian Thornhill 2009
https://www.surveysampling.com

Slide 7.26
Saunders, Lewis and Thornhill, Research Methods for Business Students, 5th Edition, © Mark Saunders, Philip Lewis and Adrian Thornhill 2009
A Classification of Internet Sampling
Internet Sampling
Online InterceptSampling
Recruited OnlineSampling
Other Techniques
NonrandomRandom Panel Nonpanel
RecruitedPanels
Opt-inPanels
Opt-in List
Rentals
Slide 7.27
Saunders, Lewis and Thornhill, Research Methods for Business Students, 5th Edition, © Mark Saunders, Philip Lewis and Adrian Thornhill 2009
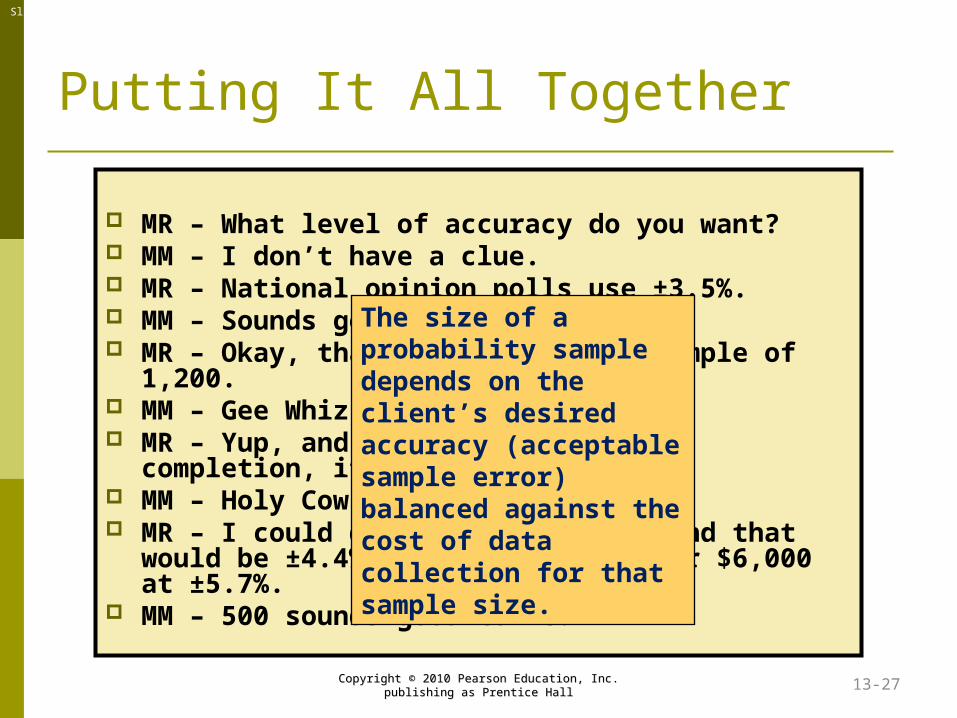
Putting It All Together
MR – What level of accuracy do you want? MM – I don’t have a clue. MR – National opinion polls use ±3.5%. MM – Sounds good to me. MR – Okay, that means we need a sample of
1,200. MM – Gee Whiz. That small? MR – Yup, and at a cost of $20 per completion,
it will be $24,000. MM – Holy Cow! That much? MR – I could do 500 for $10,000, and that
would be ±4.4% accurate, or 300 for $6,000 at ±5.7%.
MM – 500 sounds good to me.
The size of a probability sample depends on the client’s desired accuracy (acceptable sample error) balanced against the cost of data collection for that sample size.
Copyright © 2010 Pearson Education, Inc. Copyright © 2010 Pearson Education, Inc. publishing as Prentice Hallpublishing as Prentice Hall 13-27
Slide 7.28
Saunders, Lewis and Thornhill, Research Methods for Business Students, 5th Edition, © Mark Saunders, Philip Lewis and Adrian Thornhill 2009
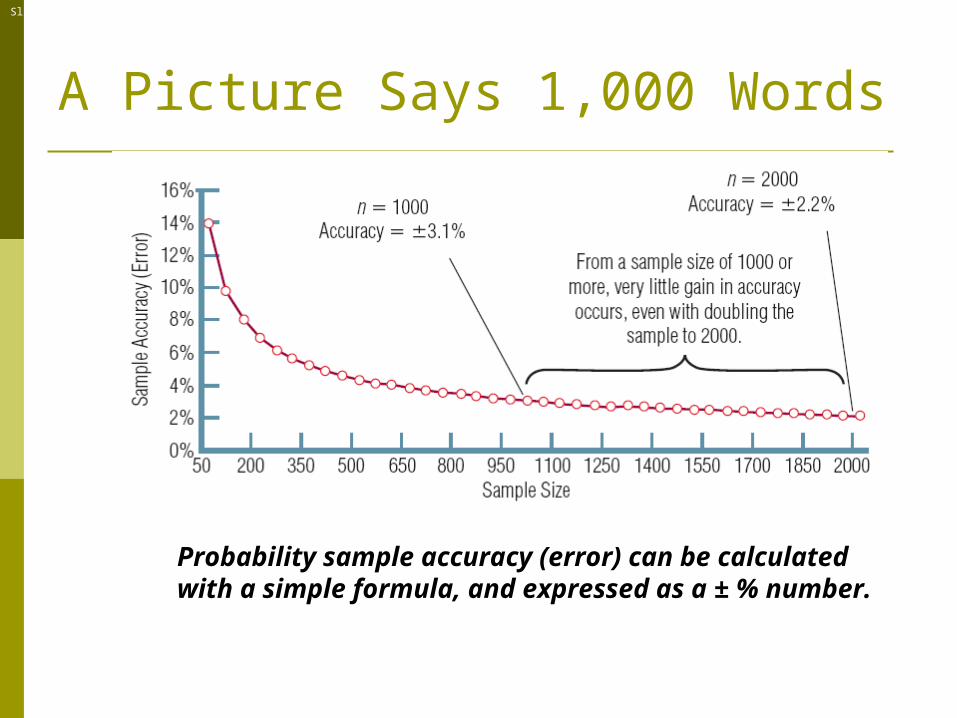
A Picture Says 1,000 Words
Probability sample accuracy (error) can be calculated with a simple formula, and expressed as a ± % number.

Slide 7.29
Saunders, Lewis and Thornhill, Research Methods for Business Students, 5th Edition, © Mark Saunders, Philip Lewis and Adrian Thornhill 2009
Sample Size Formula
Fortunately, statisticians have given us a formula which is based upon these relationships. The formula requires that we:
Specify the amount of confidence we wish Estimate the variance in the population Specify the amount of desired accuracy we
want When we specify the above, the formula
tells us what sample we need to use…n

Slide 7.30
Saunders, Lewis and Thornhill, Research Methods for Business Students, 5th Edition, © Mark Saunders, Philip Lewis and Adrian Thornhill 2009
Sample Size Formula
Standard sample size formula for estimating a percentage:
Slide 7.31
Saunders, Lewis and Thornhill, Research Methods for Business Students, 5th Edition, © Mark Saunders, Philip Lewis and Adrian Thornhill 2009
Practical Considerations in Sample Size Determination
How to estimate variability (p times q) in the population Expect the worst cast (p=50; q=50) Estimate variability: Previous studies?
Conduct a pilot study?

Slide 7.32
Saunders, Lewis and Thornhill, Research Methods for Business Students, 5th Edition, © Mark Saunders, Philip Lewis and Adrian Thornhill 2009
Practical Considerations in Sample Size Determination
How to determine the amount of desired sample error Researchers should work with
managers to make this decision. How much error is the manager willing to tolerate?
Convention is + or – 5%. The more important the decision, the
more (smaller number) the sample error.

Slide 7.33
Saunders, Lewis and Thornhill, Research Methods for Business Students, 5th Edition, © Mark Saunders, Philip Lewis and Adrian Thornhill 2009
Practical Considerations in Sample Size Determination
How to decide on the level of confidence desired Researchers should work with
managers to make this decision. The more confidence, the larger the sample size.
Convention is 95% (z=1.96) The more important the decision, the
more likely the manager will want more confidence. 99% confidence, z=2.58.

Slide 7.34
Saunders, Lewis and Thornhill, Research Methods for Business Students, 5th Edition, © Mark Saunders, Philip Lewis and Adrian Thornhill 2009
Definitions and Symbols
Precision level: When estimating a population parameter by using a sample statistic, the precision level is the desired size of the estimating interval. This is the maximum permissible difference between the sample statistic and the population parameter.
Confidence interval: The confidence interval is the range into which the true population parameter will fall, assuming a given level of confidence.
Confidence level: The confidence level is the probability that a confidence interval will include the population parameter.

Slide 7.35
Saunders, Lewis and Thornhill, Research Methods for Business Students, 5th Edition, © Mark Saunders, Philip Lewis and Adrian Thornhill 2009
95% Confidence Interval
XL
_XU
_X_
0.475
0.475

Slide 7.36
Saunders, Lewis and Thornhill, Research Methods for Business Students, 5th Edition, © Mark Saunders, Philip Lewis and Adrian Thornhill 2009
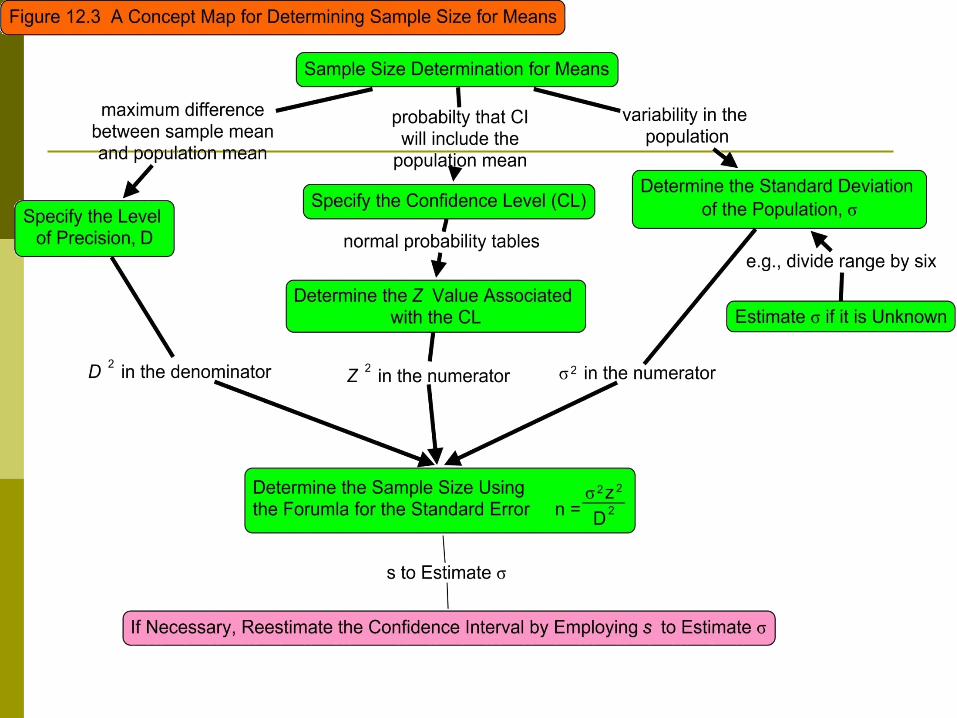
Sample Size Determination for Means and Proportions
Steps Means Proportions 1. Specify the level of precision.
D = $5.00
D = p - = 0.05
2. Specify the confidence level (CL).
CL = 95%
CL = 95%
3. Determine the z value associated with CL.
z value is 1.96
z value is 1.96
4. Determine the standard deviation of the population.
Estimate : = 55
Estimate : = 0.64
5. Determine the sample size using the formula for the standard error.
n = 2z2/D2 = 465
n = (1-) z2/D2 = 355
6. If the sample size represents 10% of the population, apply the finite population correction.
nc = nN/(N+n-1)
nc = nN/(N+n-1)
7. If necessary, reestimate the confidence interval by employing s to estimate .
= zsx
= p zsp
8. If precision is specified in relative rather than absolute terms, determine the sample size by substituting for D.
D = Rµ
n = CV2z2/R2
D = R
n = z2(1-)/(R2)
_-
Slide 7.37
Saunders, Lewis and Thornhill, Research Methods for Business Students, 5th Edition, © Mark Saunders, Philip Lewis and Adrian Thornhill 2009
Example: Estimating a Percentage in the Population
What is the required sample size? Five years ago, a survey showed that
42% of consumers were aware of the company’s brand (Consumers were either “aware” or “not aware.”)
After an intense ad campaign, management wants to conduct another survey and they want to be 95% confident that the survey estimate will be within ±5% of the true percentage of “aware” consumers in the population.
What is n?

Slide 7.38
Saunders, Lewis and Thornhill, Research Methods for Business Students, 5th Edition, © Mark Saunders, Philip Lewis and Adrian Thornhill 2009
Estimating a Percentage: What is n?
Z=1.96 (95% confidence) p=42 q=100-p=58 e=5 What is n?
Slide 7.39
Saunders, Lewis and Thornhill, Research Methods for Business Students, 5th Edition, © Mark Saunders, Philip Lewis and Adrian Thornhill 2009
Estimating a Percentage: What is n?
What does this mean? It means that if we use a sample size of 374,
after the survey, we can say the following of the results: (assume results show that 55% are aware)
Our most likely estimate of the percentage of consumers that are ‘aware’ of our brand name is 55%. In addition, we are 95% confident that the true percentage of ‘aware’ customers in the population falls between 50% and 60%.”
N=374

Slide 7.40
Saunders, Lewis and Thornhill, Research Methods for Business Students, 5th Edition, © Mark Saunders, Philip Lewis and Adrian Thornhill 2009
Estimating a Mean
Estimating a mean requires a different formula (See MRI 13.1, p. 386.)
Z is determined the same way (1.96 or 2.58)
• E is expressed in terms of the units we are estimating (i.e., if we are measuring attitudes on a 1-7 scale, we may want error to be no more than ± .5 scale units
• S is a little more difficult to estimate…
13-40
Slide 7.41
Saunders, Lewis and Thornhill, Research Methods for Business Students, 5th Edition, © Mark Saunders, Philip Lewis and Adrian Thornhill 2009
Estimating s
Since we are estimating a mean, we can assume that our data are either interval or ratio. When we have interval or ratio data, the standard deviation, s, may be used as a measure of variance.
Use standard deviation from a previous study on the target population.
Conduct a pilot study of a few members of the target population and calculate s.
Estimate the range the value you are estimating can take on (minimum and maximum value) and divide the range by 6.
13-41
Slide 7.42
Saunders, Lewis and Thornhill, Research Methods for Business Students, 5th Edition, © Mark Saunders, Philip Lewis and Adrian Thornhill 2009
Estimating s
How to estimate s Why divide the range by 6?
The range covers the entire distribution and ± 3 (or 6) standard deviations cover 99.9% of the area under the normal curve. Since we are estimating one standard deviation, we divide the range by 6.
Copyright © 2010 Pearson Education, Inc. Copyright © 2010 Pearson Education, Inc. publishing as Prentice Hallpublishing as Prentice Hall 13-42
Slide 7.43
Saunders, Lewis and Thornhill, Research Methods for Business Students, 5th Edition, © Mark Saunders, Philip Lewis and Adrian Thornhill 2009
Example: Estimating the Mean of a Population
What is the required sample size? Management wants to know
customers’ level of satisfaction with their service. They propose conducting a survey and asking for satisfaction on a scale from 1 to 10. (since there are 10 possible answers, the range=10).
Slide 7.44
Saunders, Lewis and Thornhill, Research Methods for Business Students, 5th Edition, © Mark Saunders, Philip Lewis and Adrian Thornhill 2009
Example: Estimating the Mean of a Population
What is the required sample size? Management wants to be 99%
confident in the results and they do not want the allowed error to be more than ±.5 scale points.
What is n?

Slide 7.45
Saunders, Lewis and Thornhill, Research Methods for Business Students, 5th Edition, © Mark Saunders, Philip Lewis and Adrian Thornhill 2009
Estimating a Mean: What is n?
S=10/6 or 1.7 Z=2.58 (99% confidence) e=.5 scale points What is n?
Slide 7.46
Saunders, Lewis and Thornhill, Research Methods for Business Students, 5th Edition, © Mark Saunders, Philip Lewis and Adrian Thornhill 2009
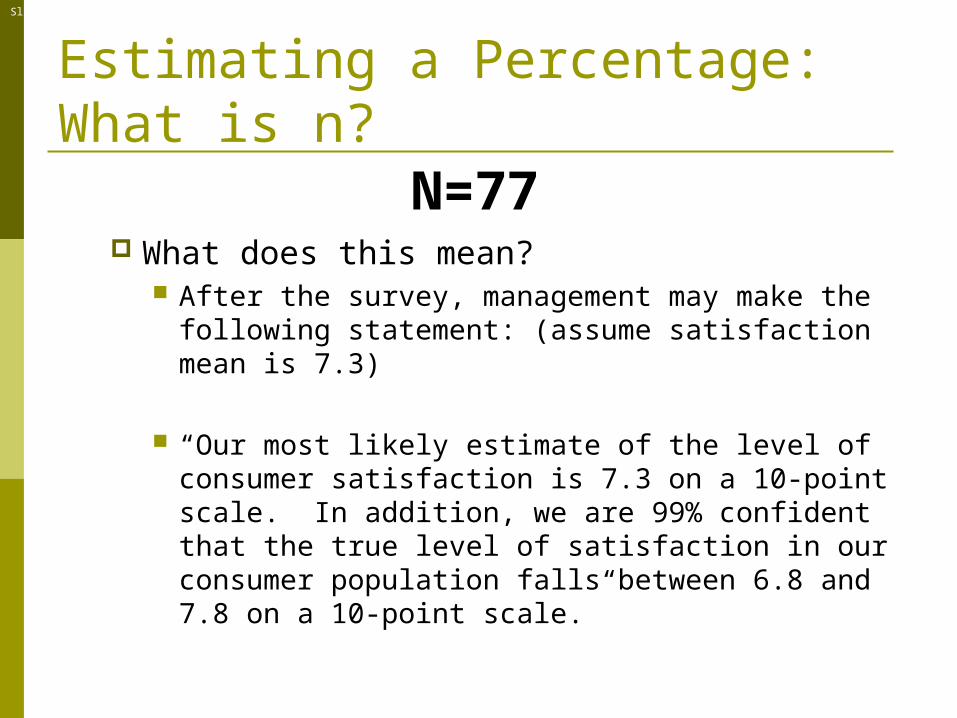
Estimating a Percentage: What is n?
What does this mean? After the survey, management may make the
following statement: (assume satisfaction mean is 7.3)
“Our most likely estimate of the level of consumer satisfaction is 7.3 on a 10-point scale. In addition, we are 99% confident that the true level of satisfaction in our consumer population falls between 6.8 and 7.8 on a 10-point scale.”
N=77

Slide 7.47
Saunders, Lewis and Thornhill, Research Methods for Business Students, 5th Edition, © Mark Saunders, Philip Lewis and Adrian Thornhill 2009
Other Methods of Sample Size Determination
Conventional sample size specification: Conventional approach follows some
convention: or number believed somehow to be the right sample size.
Using conventional sample size can result in a sample that may be too large or too small.
Conventional sample sizes ignore the special circumstances of the survey at hand.
Slide 7.48
Saunders, Lewis and Thornhill, Research Methods for Business Students, 5th Edition, © Mark Saunders, Philip Lewis and Adrian Thornhill 2009
Other Methods of Sample Size Determination
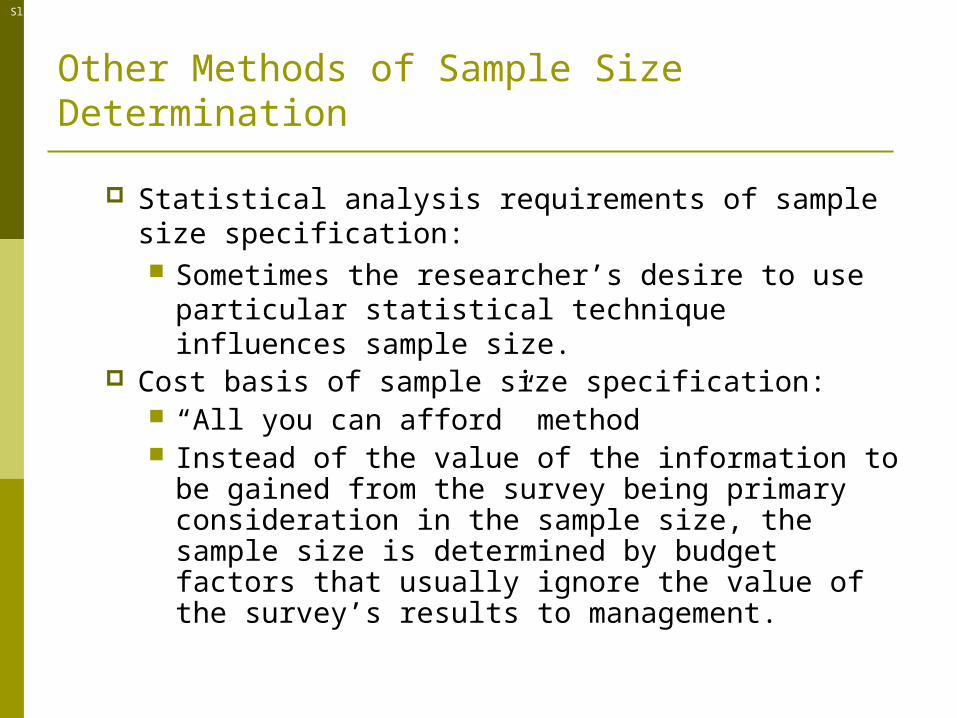
Statistical analysis requirements of sample size specification: Sometimes the researcher’s desire to use
particular statistical technique influences sample size.
Cost basis of sample size specification: “All you can afford” method Instead of the value of the information to be
gained from the survey being primary consideration in the sample size, the sample size is determined by budget factors that usually ignore the value of the survey’s results to management.
Slide 7.49
Saunders, Lewis and Thornhill, Research Methods for Business Students, 5th Edition, © Mark Saunders, Philip Lewis and Adrian Thornhill 2009
Adjusting the Statistically Determined Sample Size
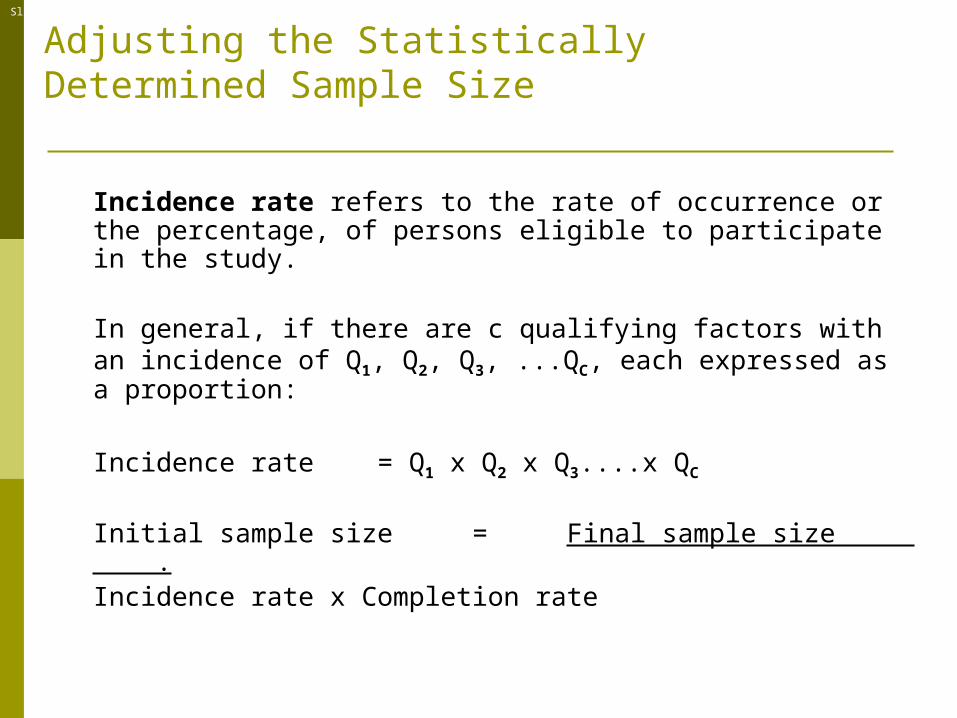
Incidence rate refers to the rate of occurrence or the percentage, of persons eligible to participate in the study.
In general, if there are c qualifying factors with an incidence of Q1, Q2, Q3, ...QC, each expressed as a proportion:
Incidence rate = Q1 x Q2 x Q3....x QC
Initial sample size = Final sample size .
Incidence rate x Completion rate
Slide 7.50
Saunders, Lewis and Thornhill, Research Methods for Business Students, 5th Edition, © Mark Saunders, Philip Lewis and Adrian Thornhill 2009
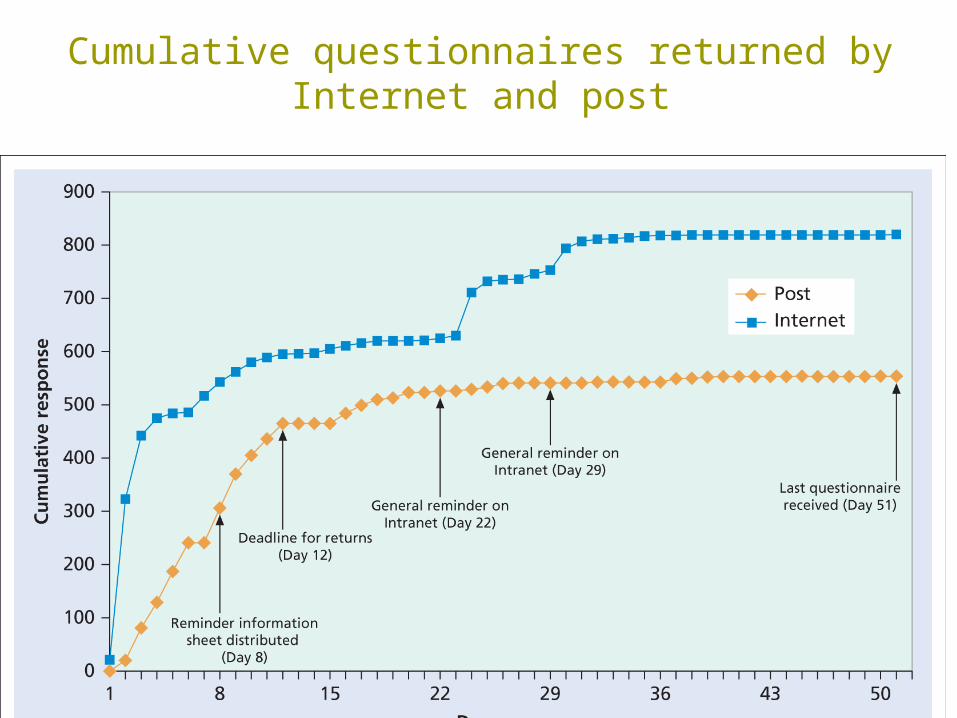
Cumulative questionnaires returned by Internet and post
Slide 7.51
Saunders, Lewis and Thornhill, Research Methods for Business Students, 5th Edition, © Mark Saunders, Philip Lewis and Adrian Thornhill 2009
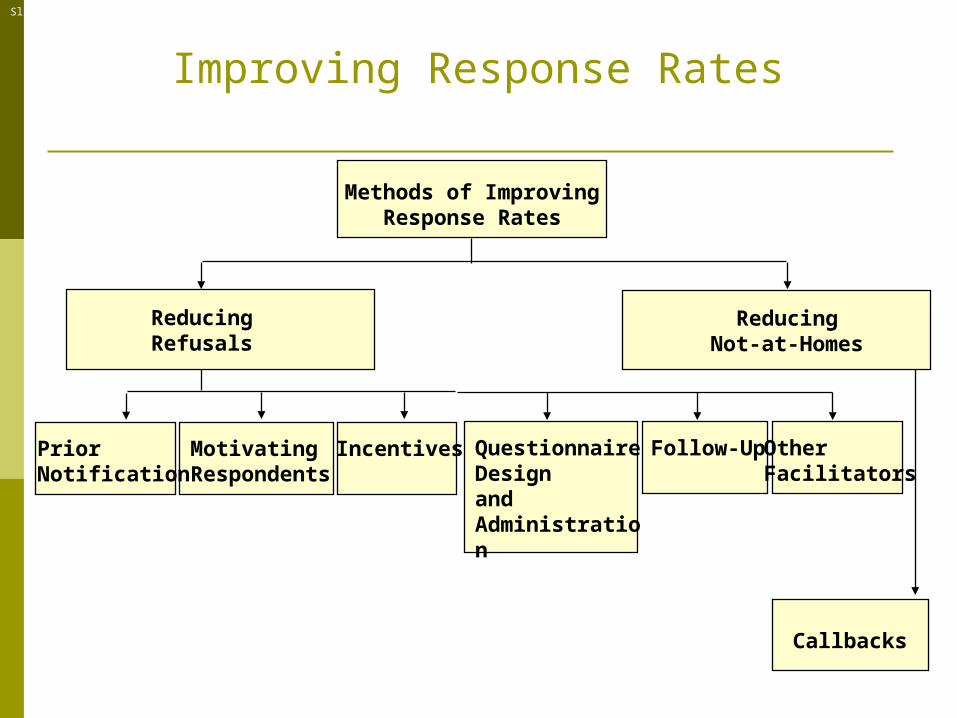
Improving Response Rates
PriorNotification
MotivatingRespondents
Incentives Questionnaire Designand Administration
Follow-Up OtherFacilitators
Callbacks
Methods of ImprovingResponse Rates
ReducingRefusals
ReducingNot-at-Homes
Slide 7.52
Saunders, Lewis and Thornhill, Research Methods for Business Students, 5th Edition, © Mark Saunders, Philip Lewis and Adrian Thornhill 2009
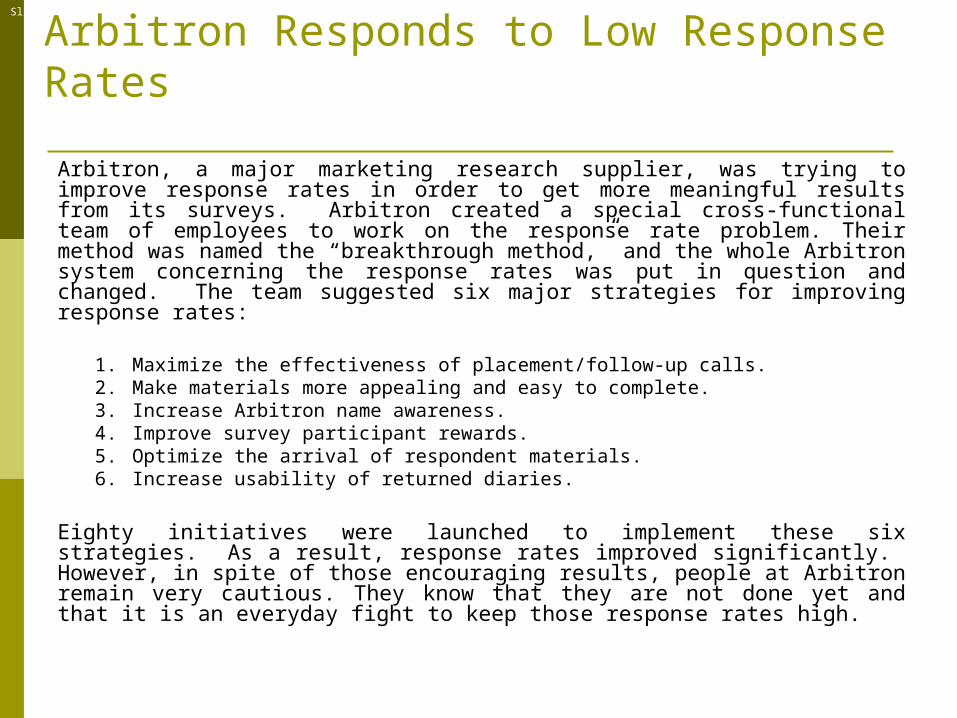
Arbitron Responds to Low Response Rates
Arbitron, a major marketing research supplier, was trying to improve response rates in order to get more meaningful results from its surveys. Arbitron created a special cross-functional team of employees to work on the response rate problem. Their method was named the “breakthrough method,” and the whole Arbitron system concerning the response rates was put in question and changed. The team suggested six major strategies for improving response rates:
1. Maximize the effectiveness of placement/follow-up calls.2. Make materials more appealing and easy to complete.3. Increase Arbitron name awareness.4. Improve survey participant rewards.5. Optimize the arrival of respondent materials.6. Increase usability of returned diaries.
Eighty initiatives were launched to implement these six strategies. As a result, response rates improved significantly. However, in spite of those encouraging results, people at Arbitron remain very cautious. They know that they are not done yet and that it is an everyday fight to keep those response rates high.
Slide 7.53
Saunders, Lewis and Thornhill, Research Methods for Business Students, 5th Edition, © Mark Saunders, Philip Lewis and Adrian Thornhill 2009
Related Documents


![Estudo da fonética_do_idioma_português_-_slides[1]](https://static.cupdf.com/doc/110x72/5593a1191a28ab663f8b466a/estudo-da-foneticadoidiomaportugues-slides1.jpg)
