Ukuran Ukuran Epidemiology

Welcome message from author
This document is posted to help you gain knowledge. Please leave a comment to let me know what you think about it! Share it to your friends and learn new things together.
Transcript

Ukuran UkuranEpidemiology
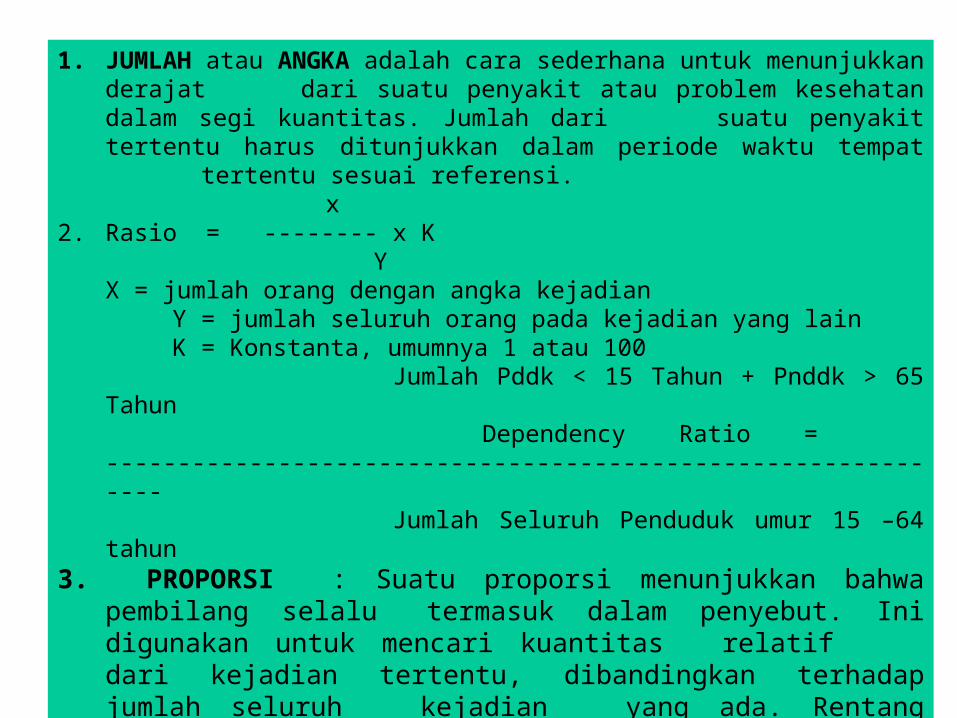
1. JUMLAH atau ANGKA adalah cara sederhana untuk menunjukkan derajat dari suatu penyakit atau problem kesehatan dalam segi kuantitas. Jumlah dari suatu penyakit tertentu harus ditunjukkan dalam periode waktu tempat tertentu sesuai referensi.
x2. Rasio = -------- x K
YX = jumlah orang dengan angka kejadian
Y = jumlah seluruh orang pada kejadian yang lain K = Konstanta, umumnya 1 atau 100
Jumlah Pddk < 15 Tahun + Pnddk > 65 Tahun Dependency Ratio = -------------------------------------------------------------
Jumlah Seluruh Penduduk umur 15 –64 tahun3. PROPORSI : Suatu proporsi menunjukkan bahwa pembilang selalu
termasuk dalam penyebut. Ini digunakan untuk mencari kuantitas relatif dari kejadian tertentu, dibandingkan terhadap jumlah seluruh kejadian yang ada. Rentang dari proporsi adalah 0-1. Bagaimanapun jika pengali, 100, digunakan sehingga rentang proporsi menjadi 0-100, ini disebut persentase
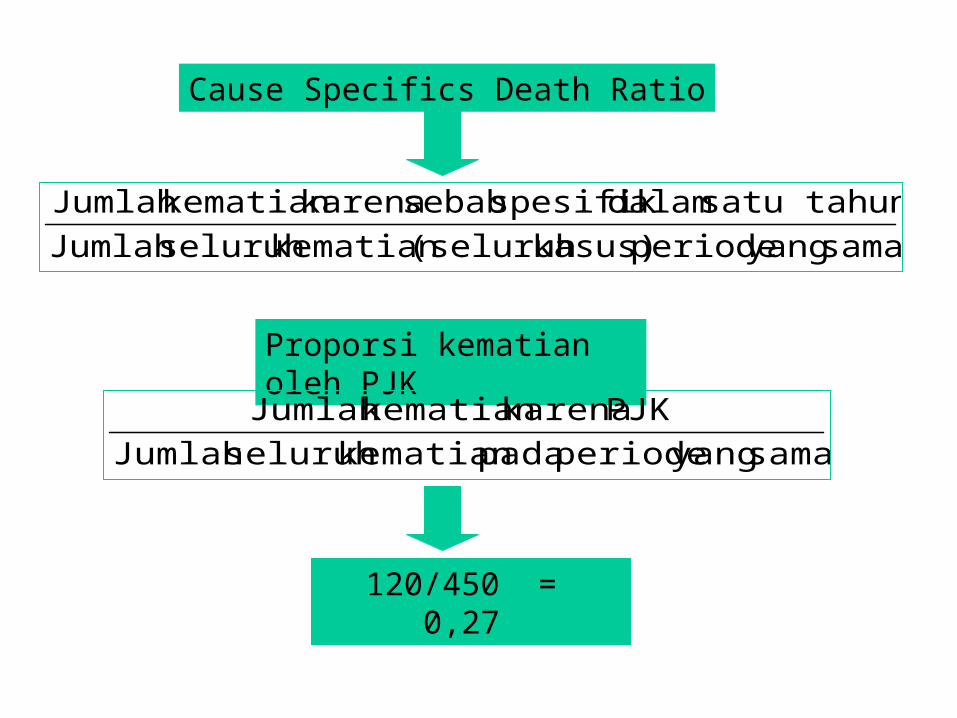
sama yang periode kasus)(seluruh kematian seluruh Jumlah satu tahun dalamspesifik sebab karenakematian Jumlah
Cause Specifics Death Ratio
Proporsi kematian oleh PJK
sama yang periode padakematian seluruh Jumlah PJK karenakematian Jumlah
120/450 = 0,27

INDEKS 1. Kata indeks secara umum digunakan terbatas dalam kesehatan
masyarakat.2. Biasanya sebagian besar indeks adalah indeks vital3. Pada kenyataan, angka, rasio, proporsi, adalah seluruh indeks
kesehatan, karena seluruhnya dapat menunjukkan tingkat kesehatan, dalam aspek yang berbeda.
1. Ukuran mortalitas (angka kematian)2. Ukuran morbiditas (angka kesakitan)3. Ukuran kekuatan kelompok (Resiko Relatif)4. Ukuran hubungan potensial (Fraksi atributabel populasi)
Ukuran Ukuran Epidemiologi
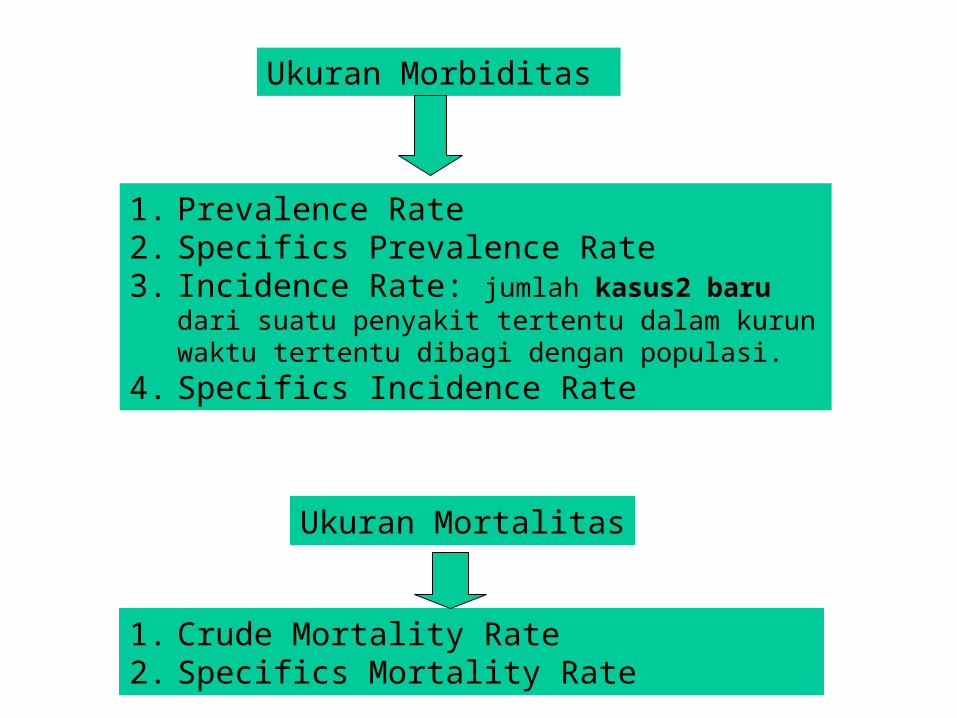
Ukuran Morbiditas
1. Prevalence Rate2. Specifics Prevalence Rate 3. Incidence Rate: jumlah kasus2 baru dari suatu penyakit
tertentu dalam kurun waktu tertentu dibagi dengan populasi.4. Specifics Incidence Rate
Ukuran Mortalitas
1. Crude Mortality Rate2. Specifics Mortality Rate
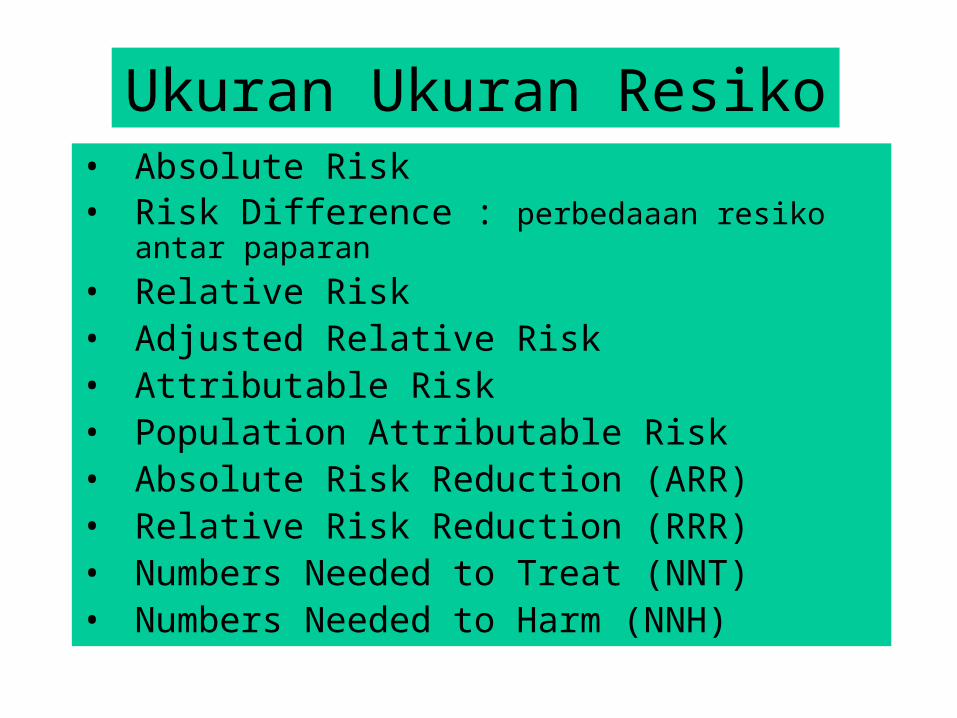
Ukuran Ukuran Resiko• Absolute Risk• Risk Difference : perbedaaan resiko antar paparan• Relative Risk• Adjusted Relative Risk• Attributable Risk• Population Attributable Risk• Absolute Risk Reduction (ARR)• Relative Risk Reduction (RRR)• Numbers Needed to Treat (NNT)• Numbers Needed to Harm (NNH)

Apakah A berhubugan dengan B?
• Exposure• Treatment• Program• Process• Characteristic• Behavior
• Effect• Death• Outcome• Cost• Disease
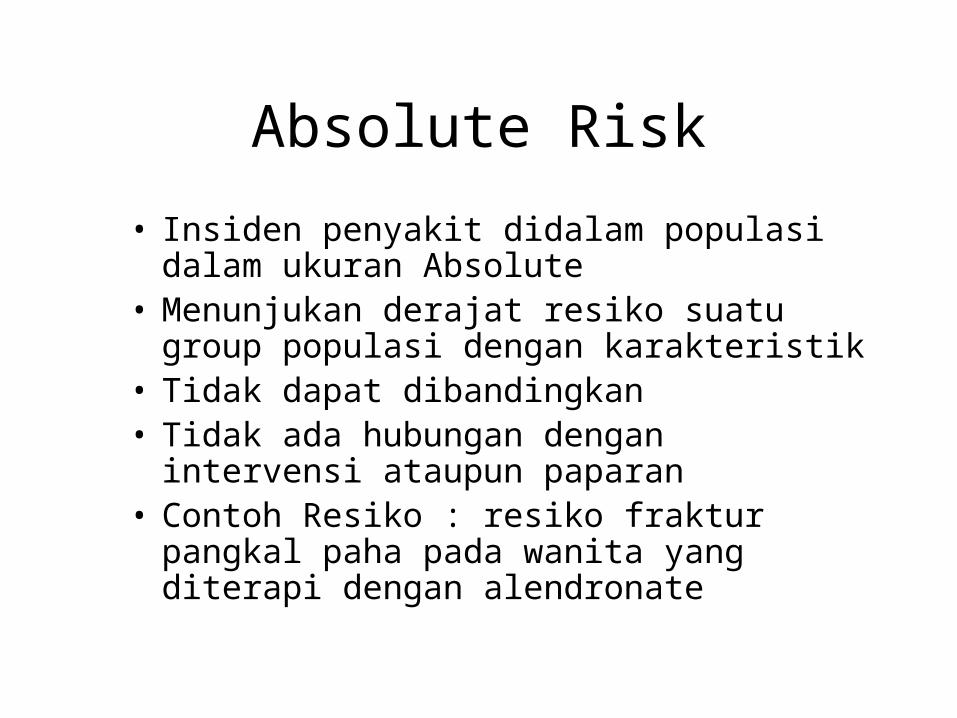
Absolute Risk
• Insiden penyakit didalam populasi dalam ukuran Absolute
• Menunjukan derajat resiko suatu group populasi dengan karakteristik
• Tidak dapat dibandingkan• Tidak ada hubungan dengan intervensi ataupun
paparan• Contoh Resiko : resiko fraktur pangkal paha
pada wanita yang diterapi dengan alendronate
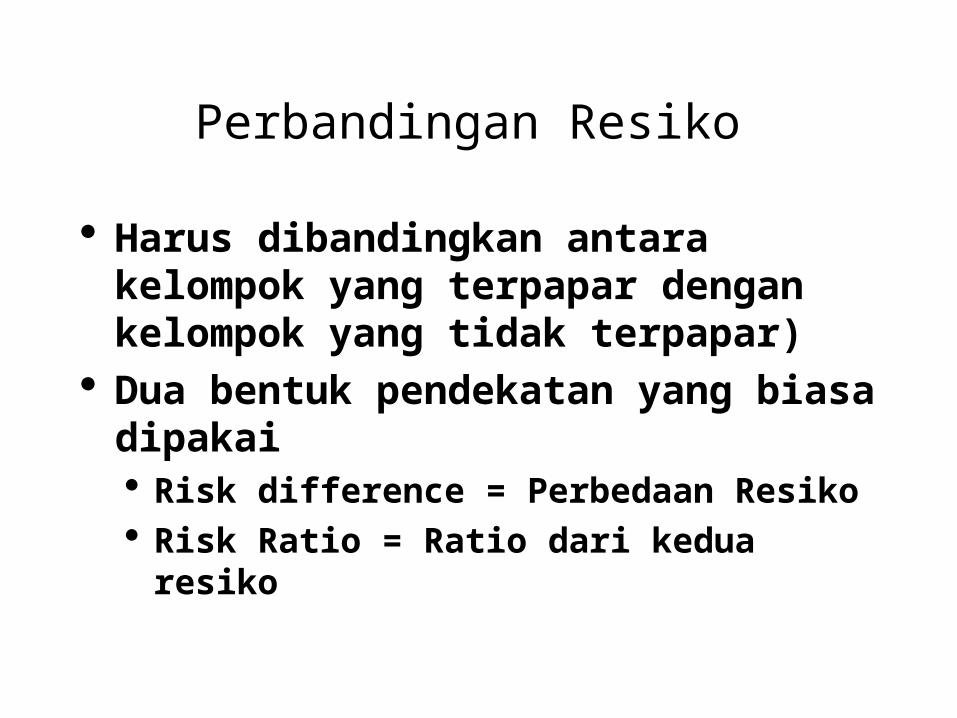
Perbandingan Resiko
Harus dibandingkan antara kelompok yang terpapar dengan kelompok yang tidak terpapar)
Dua bentuk pendekatan yang biasa dipakai Risk difference = Perbedaan Resiko Risk Ratio = Ratio dari kedua resiko
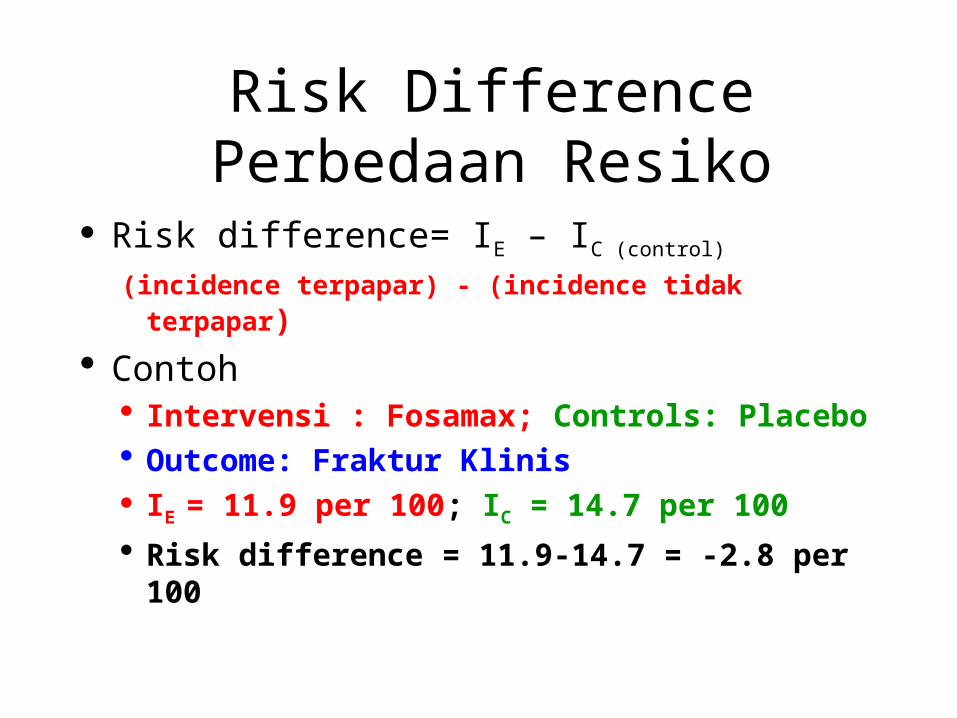
Risk DifferencePerbedaan Resiko
Risk difference= IE – IC (control)
(incidence terpapar) - (incidence tidak terpapar) Contoh
Intervensi : Fosamax; Controls: Placebo Outcome: Fraktur Klinis IE = 11.9 per 100; IC = 14.7 per 100 Risk difference = 11.9-14.7 = -2.8 per 100
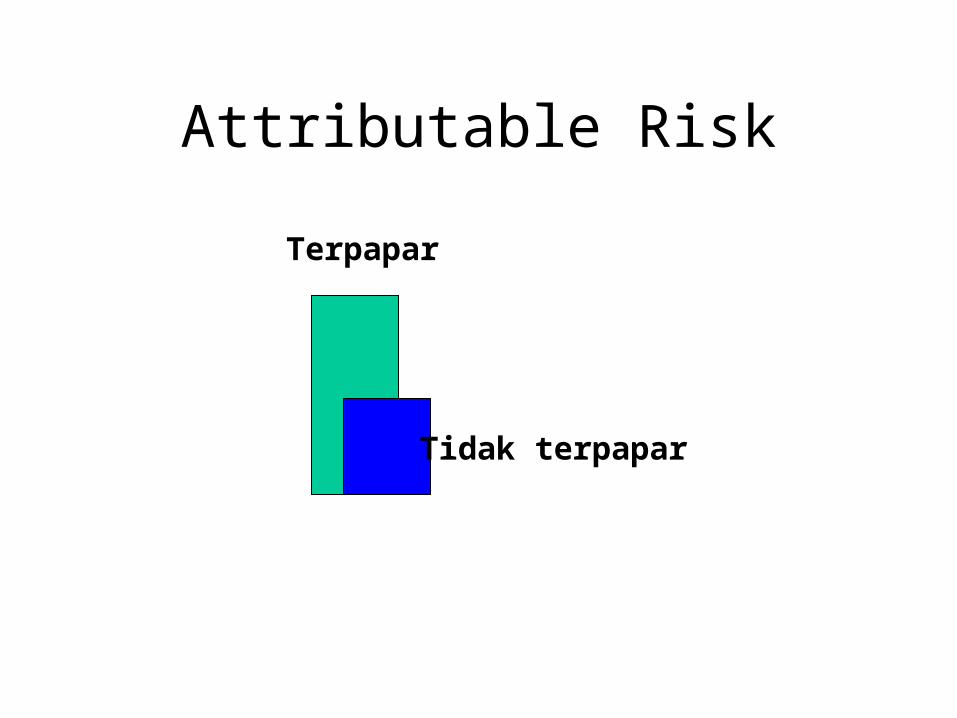
Attributable Risk
Terpapar
Tidak terpapar
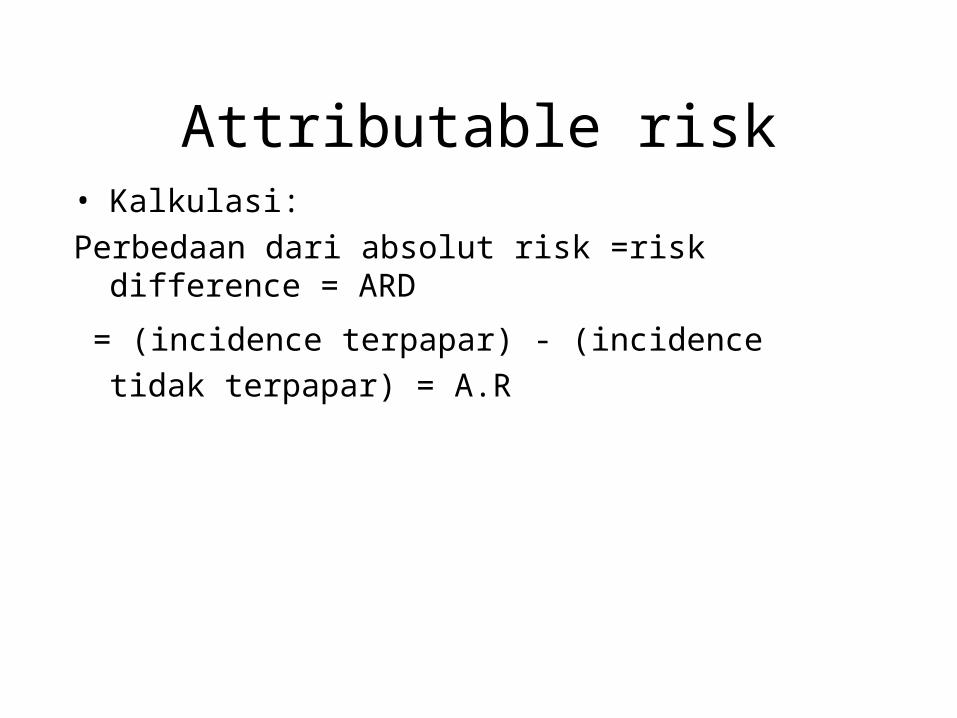
Attributable risk• Kalkulasi:Perbedaan dari absolut risk =risk difference = ARD
= (incidence terpapar) - (incidence tidak terpapar) = A.R

Relative Risk (RR)
• RR = IE/IC– (incidence in exposed) / (incidence in non-
exposed) Contoh:
Intervensi: Fosamax; Controls: Placebo Outcome: Fraktur Klinis IE = 11.9 per 100; IC = 14.7 per 100 RR = 11.9/14.7 = 0.81
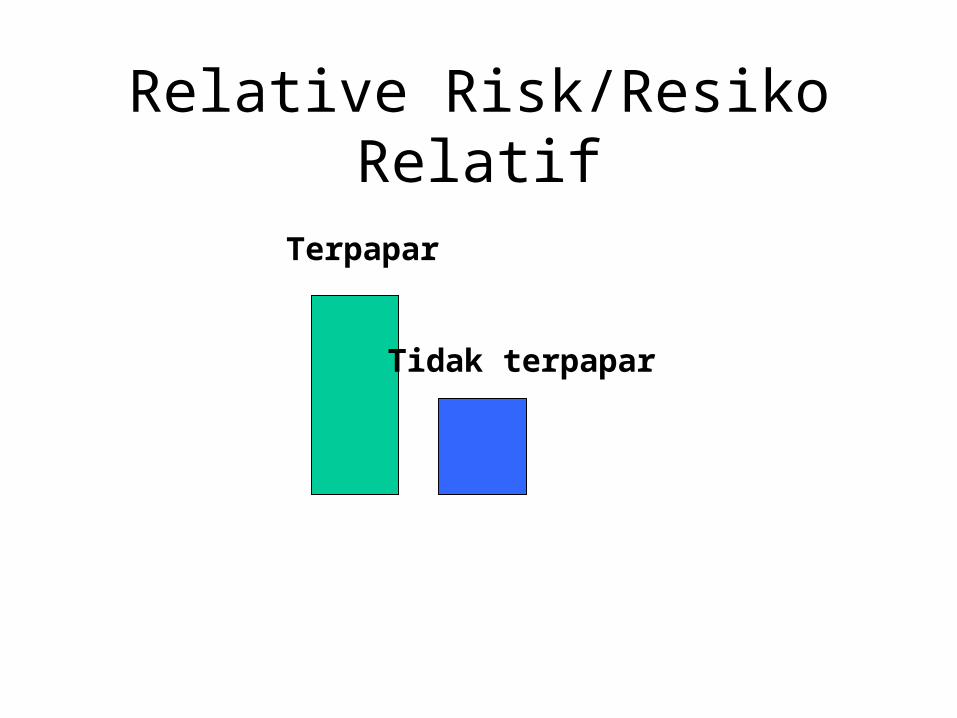
Relative Risk/Resiko Relatif
Terpapar
Tidak terpapar

Interpretasi dari Relative Risk
• RR = 1
• RR > 1
• RR < 1
• Insiden kelompok terpapar dan tidak terpapar(Tidak ada Hubungan)
• Insiden kelompok terpapar lebih besar dari kelompok tidak terpapar.
• Insiden kelompok terpapar lebih kecil dari kelompok tidak terpapar.(Protektif)
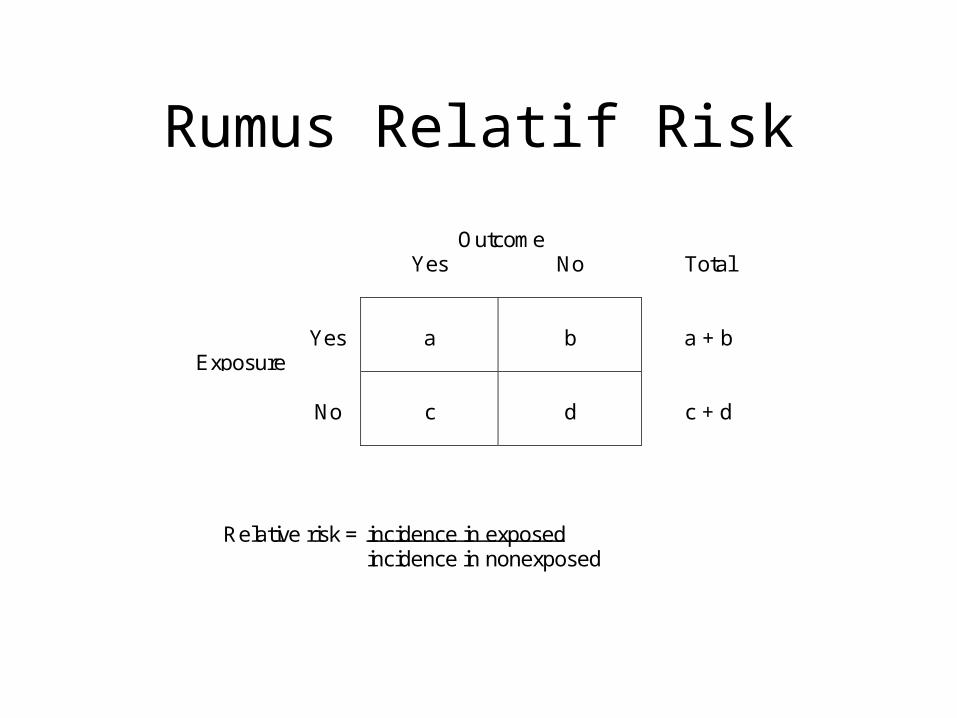
Rumus Relatif Risk
OutcomeYes No Total
ExposureYes a b a + b
No c d c + d
Relative risk = incidence in exposedincidence in nonexposed
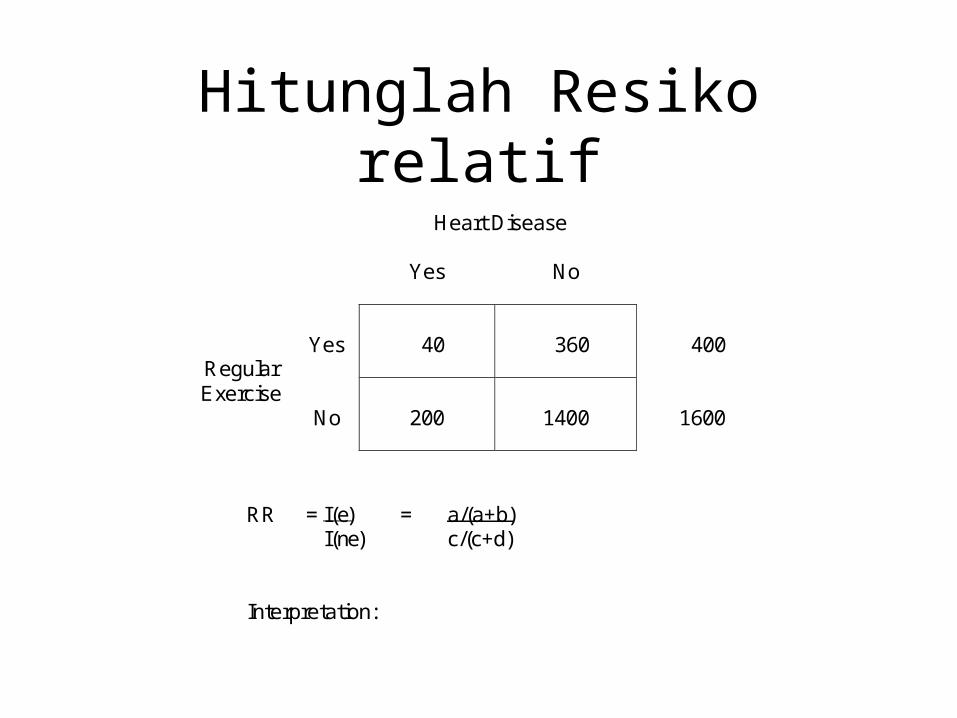
Hitunglah Resiko relatif Heart Disease
Yes No
RegularYes 40 360 400
ExerciseNo 200 1400 1600
RR = I(e) = a/(a+b)I(ne) c/(c+d)
Interpretation:
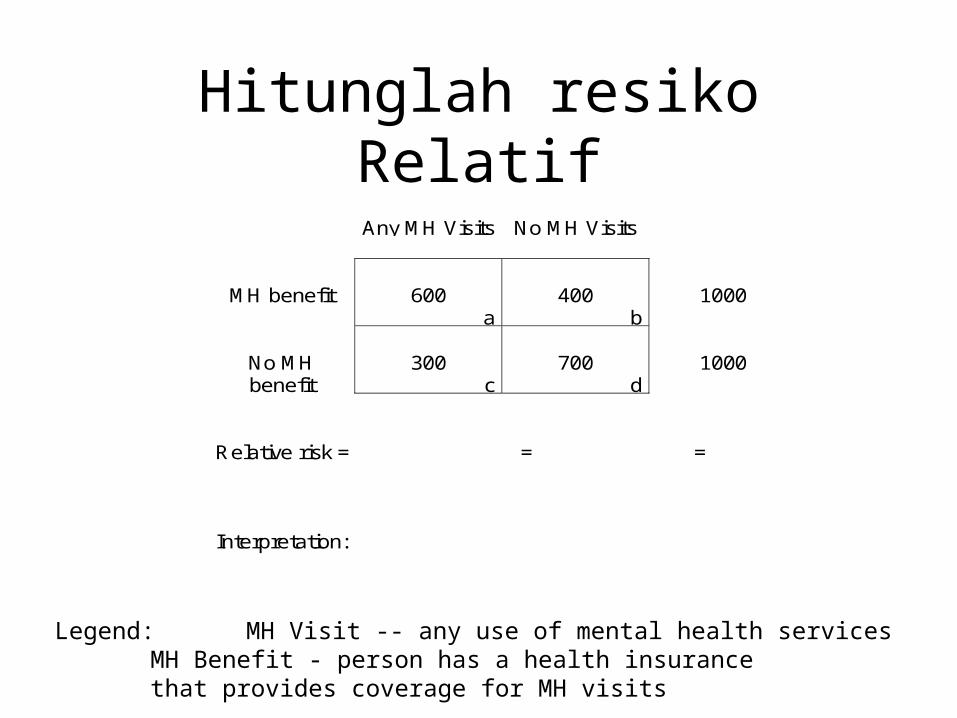
Hitunglah resiko RelatifAny MH Visits No MH Visits
MH benefit 600a
400b
1000
No MHbenefit
300c
700d
1000
Relative risk = = =
Interpretation:
Legend: MH Visit -- any use of mental health servicesMH Benefit - person has a health insurance that provides coverage for MH visits

Penelitian Kasus Kontrol
Hip Fracture(cases)
NoHip Fracture
(controls)
ReceivedHealthPromo
a
Did NotReceiveHealthPromo
c
ReceivedHealthPromo
b
Did NotReceiveHealthPromo
d

Penelitian Kasus KontrolHip Fx(cases)
No Hip Fx(controls)
Promo a b
No Promo c d
Total a + c b + d
Odds Ratio (OR) or Relative Odds (RO) =
Odds that a case was exposed = a dOdds that a control was exposed b c
Promo -- Person has participated in injury prevention programHip Fx -- Person has a hip fracture
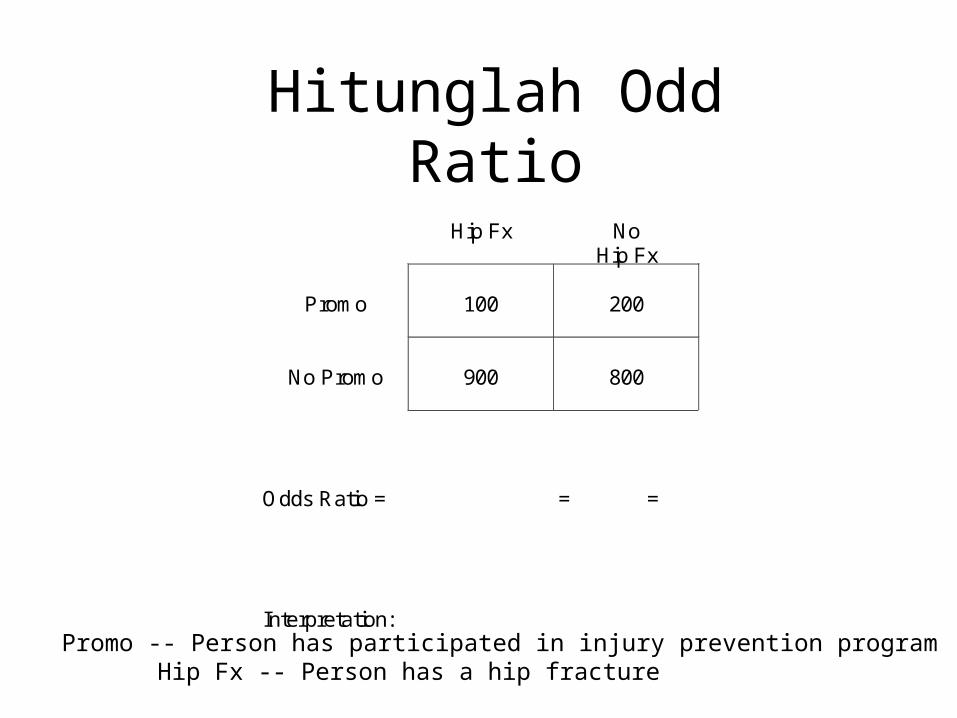
Hitunglah Odd RatioHip Fx No
Hip Fx
Promo 100 200
No Promo 900 800
Odds Ratio = = =
Interpretation:Promo -- Person has participated in injury prevention program
Hip Fx -- Person has a hip fracture
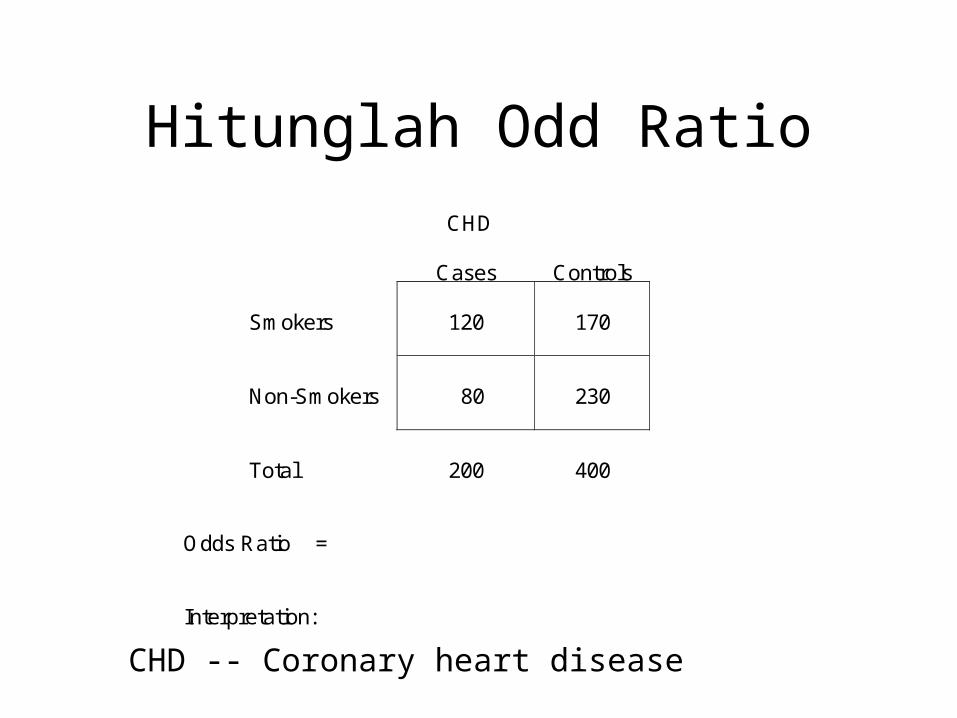
Hitunglah Odd RatioCHD
Cases Controls
Smokers 120 170
Non-Smokers 80 230
Total 200 400
Odds Ratio =
Interpretation:
CHD -- Coronary heart disease
Adjusted RiskResiko yang disesuaikan
• Kegunaan
– Untuk dapat dibandingkan– Memperhitungan perbedaan Co-
Variate yang ada dalam group yang diteliti

Metoda Penyesuaian/Adjustment
• Standarisasi• Mantel – Haenszel• Log-linear models
– risk models– odds models– rate models– incidence-time models
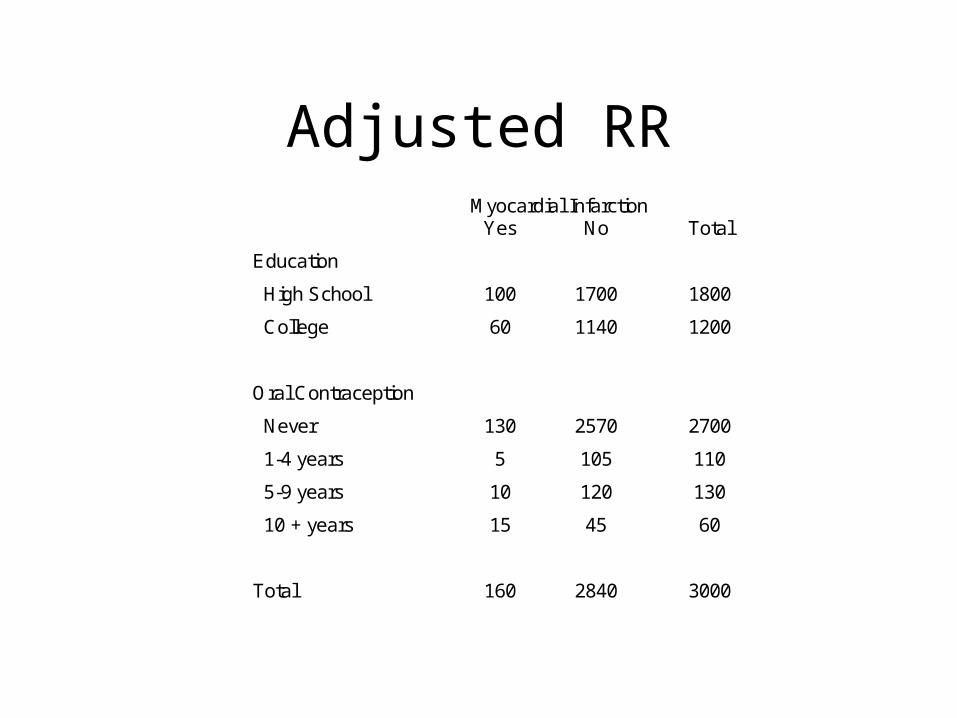
Adjusted RRMyocardial Infarction
Yes No Total
Education
High School 100 1700 1800
College 60 1140 1200
Oral Contraception
Never 130 2570 2700
1-4 years 5 105 110
5-9 years 10 120 130
10 + years 15 45 60
Total 160 2840 3000
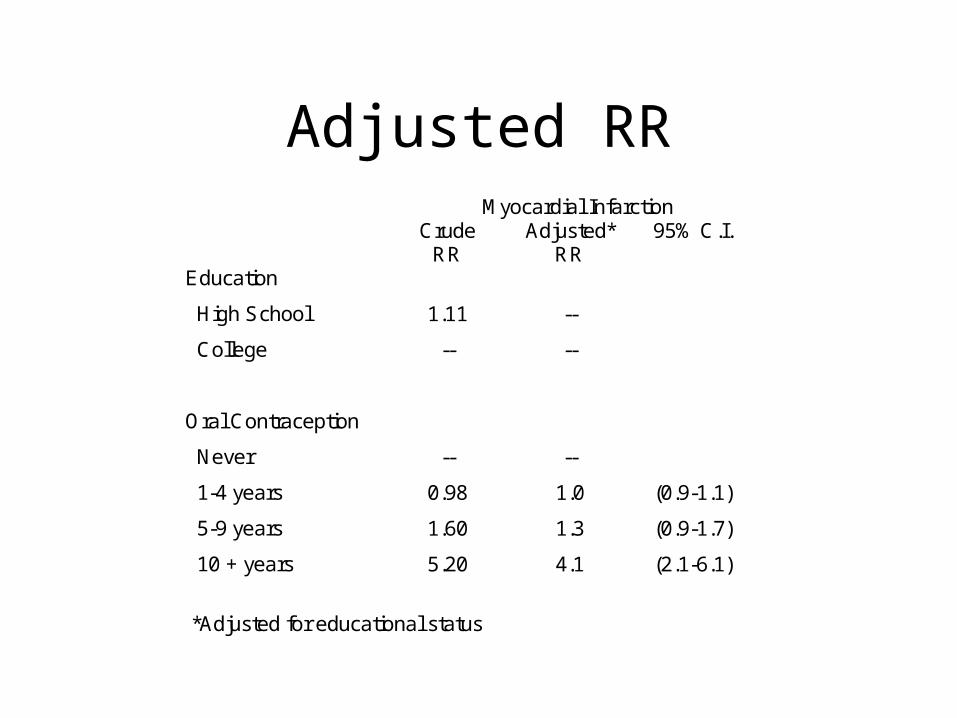
Adjusted RR
Myocardial Infarction Crude
RR Adjusted*
RR 95% C.I.
Education
High School 1.11 --
College -- --
Oral Contraception
Never -- --
1-4 years 0.98 1.0 (0.9-1.1)
5-9 years 1.60 1.3 (0.9-1.7)
10 + years 5.20 4.1 (2.1-6.1)
*Adjusted for educational status
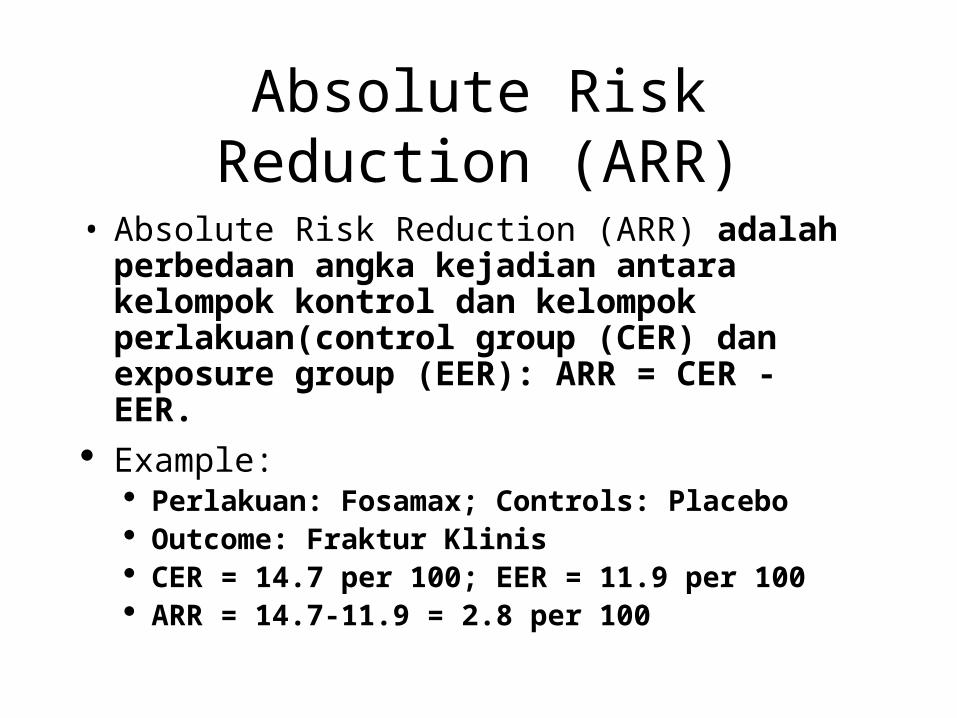
Absolute Risk Reduction (ARR)
• Absolute Risk Reduction (ARR) adalah perbedaan angka kejadian antara kelompok kontrol dan kelompok perlakuan(control group (CER) dan exposure group (EER): ARR = CER - EER.
Example: Perlakuan: Fosamax; Controls: Placebo Outcome: Fraktur Klinis CER = 14.7 per 100; EER = 11.9 per 100 ARR = 14.7-11.9 = 2.8 per 100

Hitunglah Absolute Reduction Risk
• ARR (Fosamax vs Placebo) untuk fraktur pangkal paha for hip fracture risk in the study reported in the article:– Black DM; Cummings SR; Karpf DB; Cauley JA;
Thompson DE; Nevitt MC et al. Randomised trial of effect of alendronate on risk of fracture in women with existing vertebral fractures. Fracture Intervention Trial Research Group. Lancet 1996; 348:1535-41

Number needed to treat
• NNTNNT Adalah penderita yang harus diobati untuk mengurangi 1 tambahan outcome yang jelek (death, stroke, etc.).
• Perhitungan: NNT = 1/ARR• NNHsNNHs Adalah jumlah penderita yang harus
ditambahkan untuk menimbulkan 1 effek buruk (side effect, etc.)
• For more information: http://cebm.jr2.ox.ac.uk/docs/nnt.html
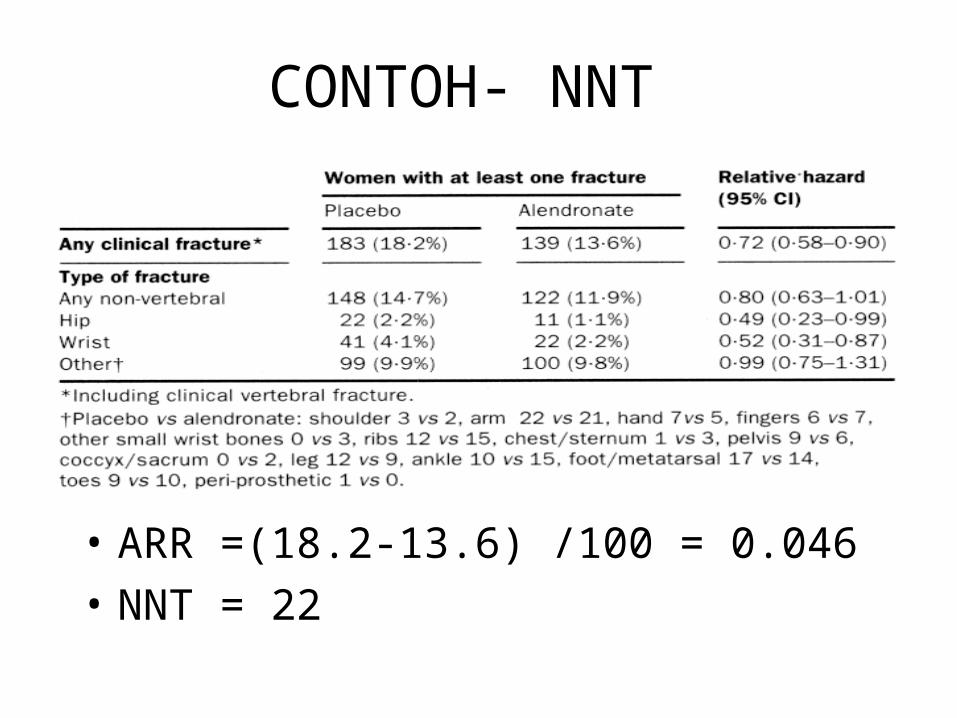
CONTOH- NNT
• ARR =(18.2-13.6) /100 = 0.046• NNT = 22

HITUNGLAH NNT
• Hitunglah NNT untuk Hip FrakturDari artikel
• Black DM; Cummings SR; Karpf DB; Cauley JA; Thompson DE; Nevitt MC et al. Randomised trial of effect of alendronate on risk of fracture in women with existing vertebral fractures. Fracture Intervention Trial Research Group. Lancet 1996; 348:1535-41
Population attributable risk
• Proporsi populasi dengan penyakit tertentu dan paparan tertentu
• Perhitungan:
(incidence in total population) - (incidence in non-exposed group)
Relative Risk Reduction (RRR)
• Relative Risk Reduction (RRR) • RRR = (CER - EER) / CER * 100
• Cara Kalkulasi lainnya:
– RRR = (1-RR) * 100
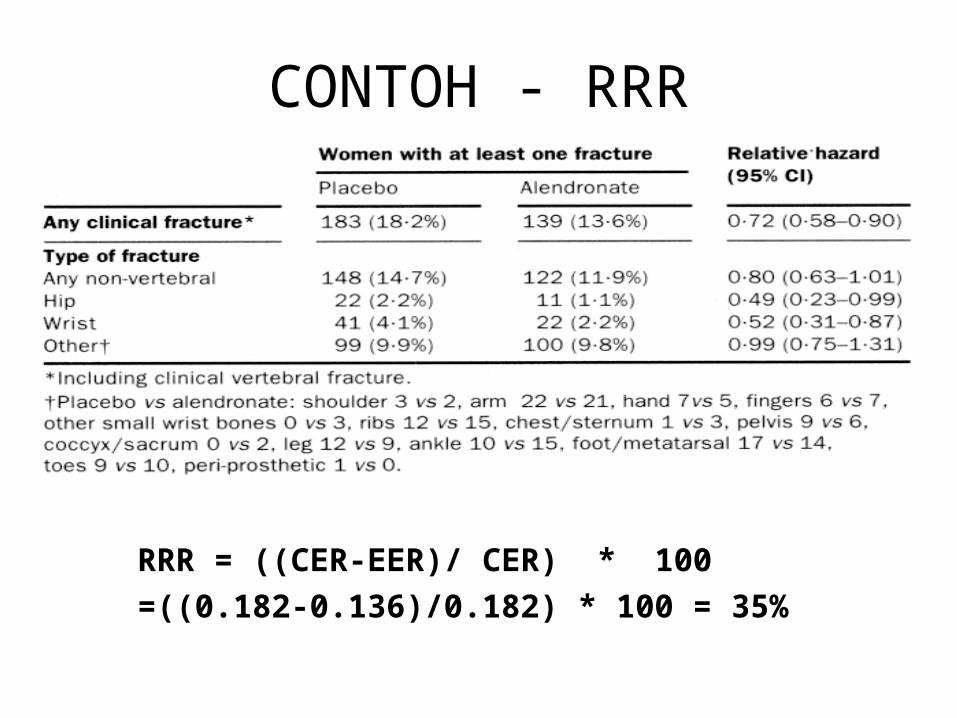
CONTOH - RRR
RRR = ((CER-EER)/ CER) * 100=((0.182-0.136)/0.182) * 100 = 35%
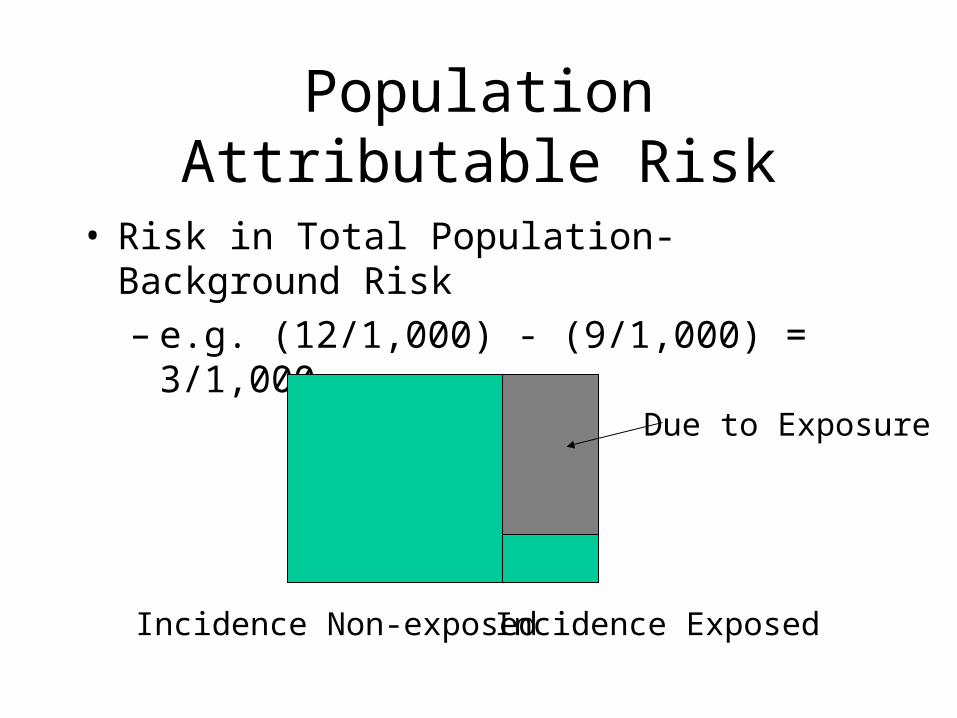
Population Attributable Risk
• Risk in Total Population-Background Risk– e.g. (12/1,000) - (9/1,000) = 3/1,000
Incidence ExposedIncidence Non-exposed
Due to Exposure
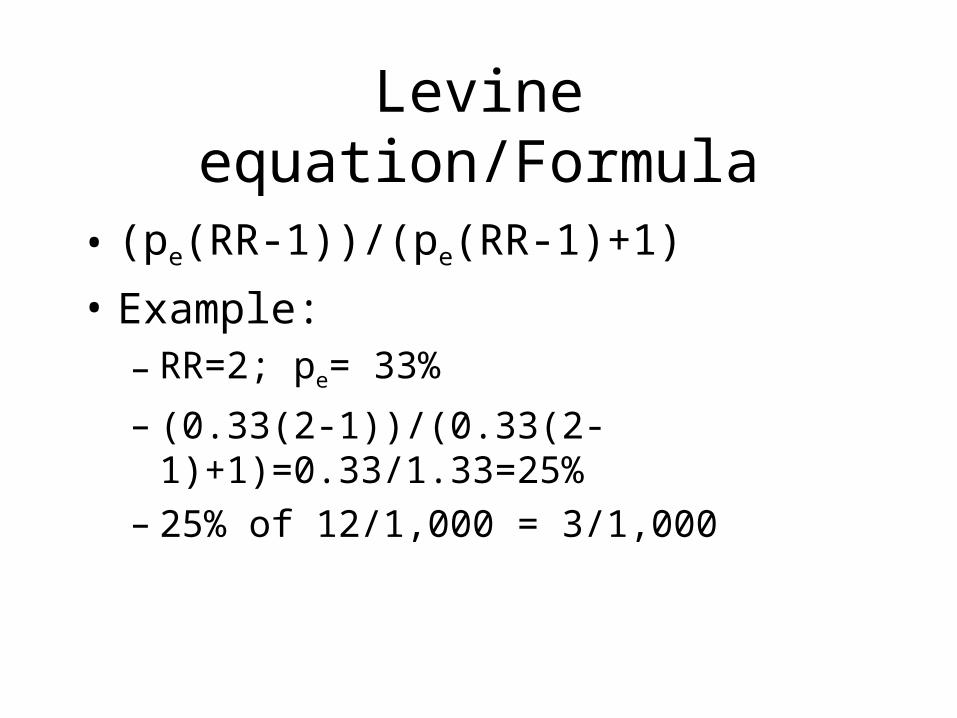
Levine equation/Formula
• (pe(RR-1))/(pe(RR-1)+1)• Example:
– RR=2; pe= 33%– (0.33(2-1))/(0.33(2-1)+1)=0.33/1.33=25%– 25% of 12/1,000 = 3/1,000
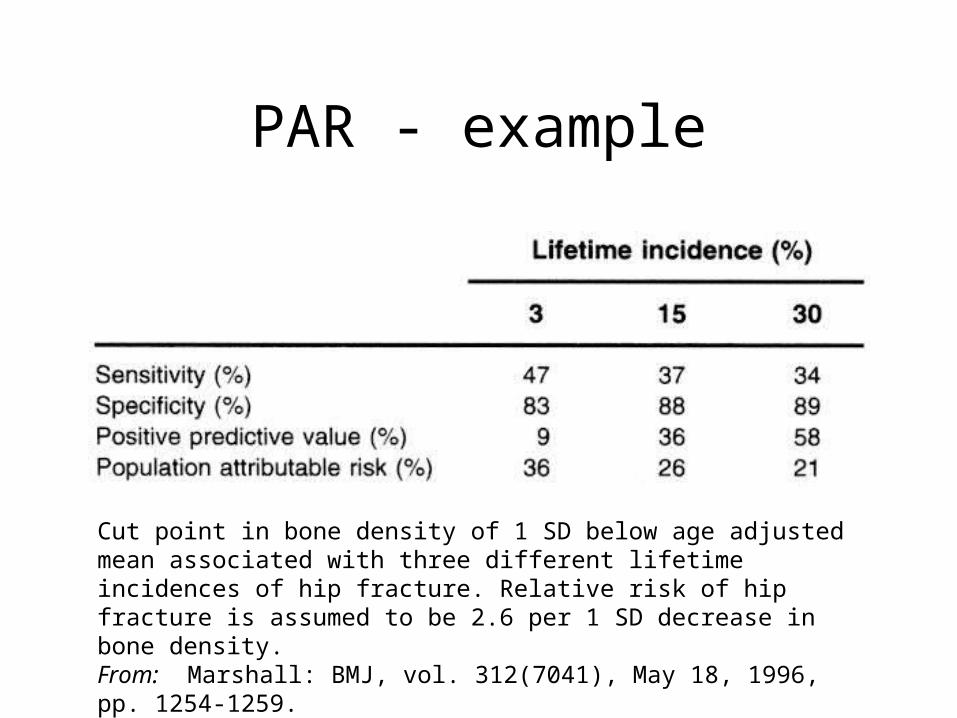
PAR - example
Cut point in bone density of 1 SD below age adjusted mean associated with three different lifetime incidences of hip fracture. Relative risk of hip fracture is assumed to be 2.6 per 1 SD decrease in bone density. From: Marshall: BMJ, vol. 312(7041), May 18, 1996, pp. 1254-1259.
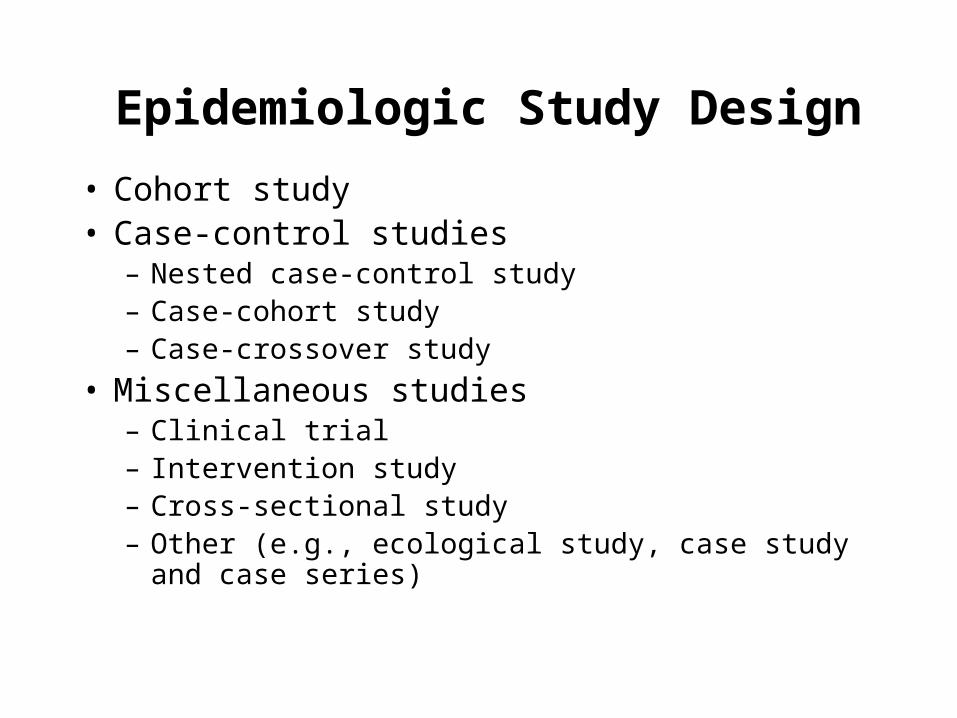
• Cohort study• Case-control studies
– Nested case-control study– Case-cohort study– Case-crossover study
• Miscellaneous studies– Clinical trial– Intervention study– Cross-sectional study– Other (e.g., ecological study, case study and case series)
Epidemiologic Study Design

Source: partially adapted from WHO, 1993
R1
R0
A1
A0
Incidence rate among exposed IR1 = A1 (no. exposed cases) / R1 (total person-time exposed) Incidence rate among unexposed IR0 = A0 (no. unexposed cases) / R0 (total person-time unexposed)
Incidence rate ratio (exposed vs. unexposed) = IR1 / IR0 = (A1/A0) / (R1/R0)
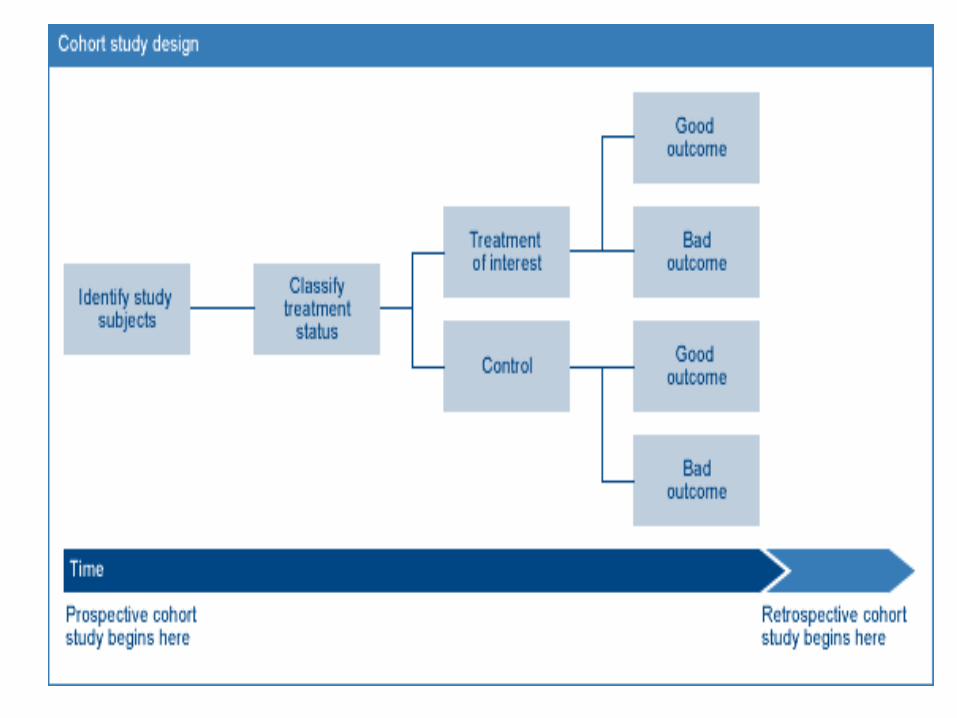
Design of a Cohort Study
Worksheet for Using an Article About Prognosis

Source: partially adapted from WHO, 1993
a
bc
d
•Exposure odds among cases D1 = a (no. exposed cases) / b (no. unexposed cases) •Exposure odds among controls D0 = c (no. exposed controls) / d (no. unexposed controls)
•Exposure odds ratio (cases vs. controls) = (a/b) / (c/d) where a/b = A1/A0 as shown for cohort study
should be representative of source populationnote that c and d should be appropriate representation of R1 and R0 as shown for cohort study
Design of a Case-Control Study

X
X
OX
Time
t1
O
Nested Case-Control Study (1)
Consider the following hypothetical cohort:
X = lung cancer caseO = loss to follow-up
t2 t3
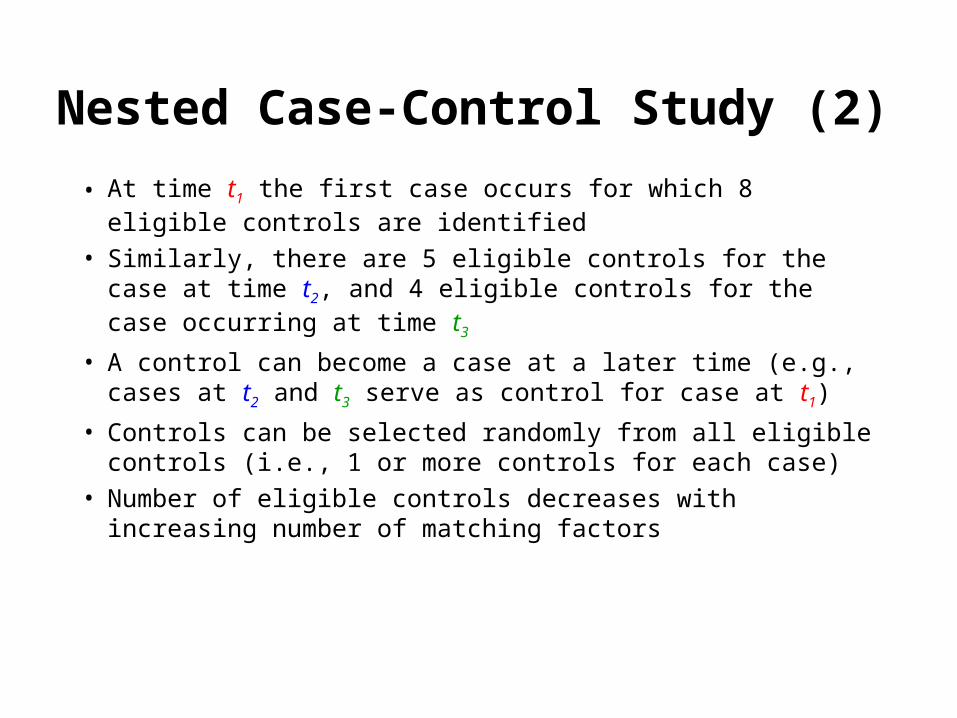
• At time t1 the first case occurs for which 8 eligible controls are identified
• Similarly, there are 5 eligible controls for the case at time t2, and 4 eligible controls for the case occurring at time t3
• A control can become a case at a later time (e.g., cases at t2 and t3 serve as control for case at t1)
• Controls can be selected randomly from all eligible controls (i.e., 1 or more controls for each case)
• Number of eligible controls decreases with increasing number of matching factors
Nested Case-Control Study (2)
X
X
OX
Time
O
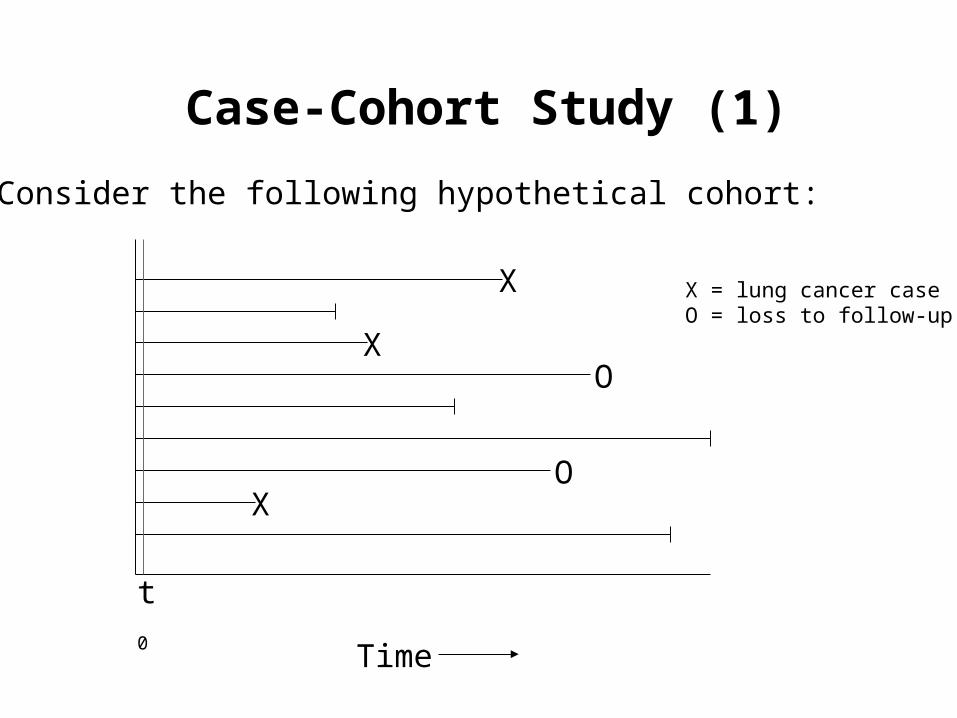
Case-Cohort Study (1)
Consider the following hypothetical cohort:
X = lung cancer caseO = loss to follow-up
t0

• In closed cohort (in this case, when everybody enters cohort at t0), a sample of control subjects (“sub-cohort”) is randomly selected from cohort members at start of follow-up t0
• In open cohort (i.e., when time of entry into cohort is variable), a sample of control subjects (“sub-cohort”) is randomly selected from members of entire cohort (i.e., regardless of when subjects entered the cohort)
• Case-cohort study population consists of all cases of any disease of interest, and members of “sub-cohort”(can use same control group for many different outcomes)
• A subject can be both case and member of “sub-cohort”
Case-Cohort Study (2)

• Study of “triggers” within an individual• ”Case" and "control" component, but information of both
components will come from the same individual• ”Case component" = hazard period which is the time period
right before the disease or event onset• ”Control component" = control period which is a specified
time interval other than the hazard period • Exposure must vary from time to time within person• Disease must have abrupt onset, and effect of exposure must
be brief
Case-Crossover Study

• Cohort and case-control studies can be either prospective or retrospective, or both– Prospective: Exposure information is collected during follow-up, and
period of time at risk occurs during conduct of the study– Retrospective: Cohorts (cohort study) or cases (case-control study) are
identified from recorded information, and period of time at risk has already occurred before the study has begun
• Measures of effect (ratios)– Cohort study: Incidence rate ratio (open cohort) or risk ratio (closed cohort)– Case-control study: Exposure odds ratio as estimate of incidence rate ratio
(e.g., incidence density sampling) or risk ratio (e.g., cumulative incidence sampling)
Final Remarks on Cohort and Case-control Studies

Miscellaneous Study Designs
• Clinical trials– randomization of individuals to a treatment or reference
group• Cross-sectional studies
– measures prevalence of health outcomes or determinants of health (e.g., biomarkers) at a point in time or over a short period
• Intervention studies– intervention usually on community level rather than
individual level
Related Documents