SlideShare Upload Login or Signup Go Pro Email Favorite Download Embed inShare 1

Slide Share
Aug 27, 2014
Welcome message from author
This document is posted to help you gain knowledge. Please leave a comment to let me know what you think about it! Share it to your friends and learn new things together.
Transcript

SlideShare
Upload Login or Signup Go Pro
Email Favorite Download Embed
inShare 1

«BeerislivingproofthatGodlovesusandwantsustobehappy»-BenjaminFranklinJonØyvindBjørnstadChristianAdelerNormannBeerIndustryTuesday,9August2011
Agenda•HistoryofBeer..............................................................3•Historyofbeer-lastdecade................................4•GlobalMacroEnvironAnalysis.............................5•GlobalBeerEnvironAnalysis.................................6•Howisbeermade.......................................................8•Overviewoftheglobalbeermk.........................9•Briefly-EUBeverages....................................13•Briefly-AsianMarkets...................................14•Beerthenaturalchoice..........................................15•Commodityprices&effectsonbeerprices/volumes........................................................16•ProductionMargins..................................................18•Porter’s5Forces........................................................20•GrowthOpportunities...........................................21•M&A..................................................................................24•M&A-Ourthoughts......................................27•EmergingMarkets......................................................36•Asia,LatinAmericaandEasternEU•DevelopedMarkets..................................................42•EU,NorthAmerica,Asia&Oceania•Social&CulturalIssue............................................46•Self-Regulation.............................................................47•Risks...............................................................
....................49•Marketing&Advertising........................................51•CorporateSocialResponsibility(CSR).........56•Conclusion.....................................................................57•TheBIGFOUR...........................................................58•ABInBev.................................................................60•SABMiller..............................................................66•Heineken................................................................72•Carlsberg................................................................80•Ratios................................................................................87•InvestmentRecommendation............................89Tuesday,9August2011
HistoryofBeer•Beerisoneoftheworld’soldestbeverages,recordedbacktothe6thmillennium•Averyimportantdrinkinmanycultures•Familyandmicrobreweriesdominatedaroundtheworldupuntillthe20thcentury•Thehuntfortasteversusthehuntforprofits•ThedevelopmentofthebeerindustryintheUSA•Todayaglobalandfiercelycompetitivebusiness3Tuesday,9August2011

•Consolidationtrendsgoingevenfurther•Thetop10andtheirmarketshare•Thetop4todaydominating•Othertrends•FinancialcrisisimpactHistoryofbeer–thelastdecade4Tuesday,9August2011

•Emergingmarketsalmost50%ofglobalgrowth(4.3%Q1)•Advancedeconomiesweakgrowth,2.5%comparedto3%fromlastyear.•Developingeconomiesprojectedastronggrowth,butwilldeclinefrom7.5%(2010)to6.5%(2011)•IMFfiguresusuallyover-optimistic,soweestimateslightlyweakerglobalgrowthsGlobalMacroEnvironmentalAnalysis5Tuesday,9August2011

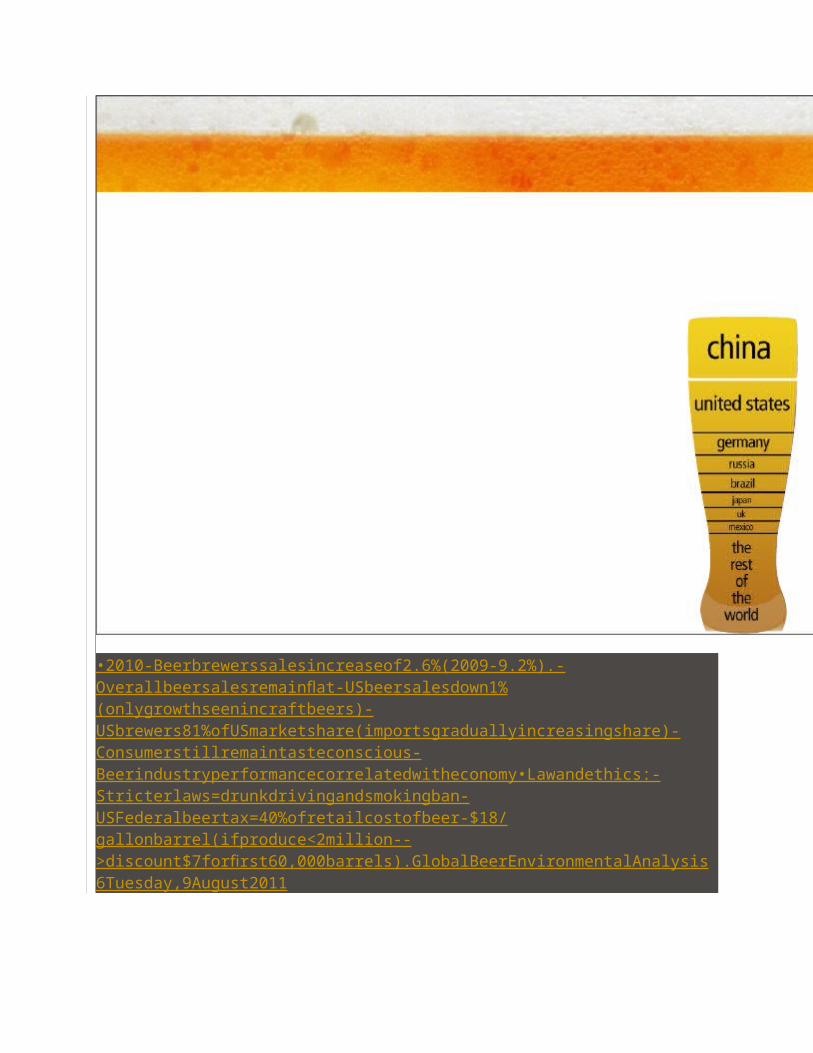
•2010-Beerbrewerssalesincreaseof2.6%(2009-9.2%).-Overallbeersalesremainflat-USbeersalesdown1%(onlygrowthseenincraftbeers)-USbrewers81%ofUSmarketshare(importsgraduallyincreasingshare)-Consumerstillremaintasteconscious-Beerindustryperformancecorrelatedwitheconomy•Lawandethics:-Stricterlaws=drunkdrivingandsmokingban-USFederalbeertax=40%ofretailcostofbeer-$18/gallonbarrel(ifproduce<2million-->discount$7forfirst60,000barrels).GlobalBeerEnvironmentalAnalysis6Tuesday,9August2011
•Diversity&GlobalTrends:-2011globalpopulation7bn-->in2050-9.5bn(majoritygrowthindevelopingcountries)-WealthshiftingtoEast&Southcountries(Globalization)-Changesinpreferencesandattitudestowardbeerconsumption•Technology:•Advances-->necessarytomaintaincompetitiveadvantage&efficiencyGlobalBeerEnvironmentalAnalysis7Tuesday,9August2011

Howisbeermade?8Tuesday,9August2011

•Thebeerindustry:–Consumernon-cyclical•Outputs–Beer,measuredinbarrels•Majortrends –Consolidation–Shiftinginpreferencesinemergingmarkets–Shiftinginpreferencesindevelopedmarkets•Compoundannualgrowthrateof3,5%globally–twoverydifferentpictures-Emergingmarketsshowingstronggrowthwith6.8%-Developedmarketsshowinganegativegrowthof3.4%Overviewoftheglobalbeermarket9Tuesday,9August2011

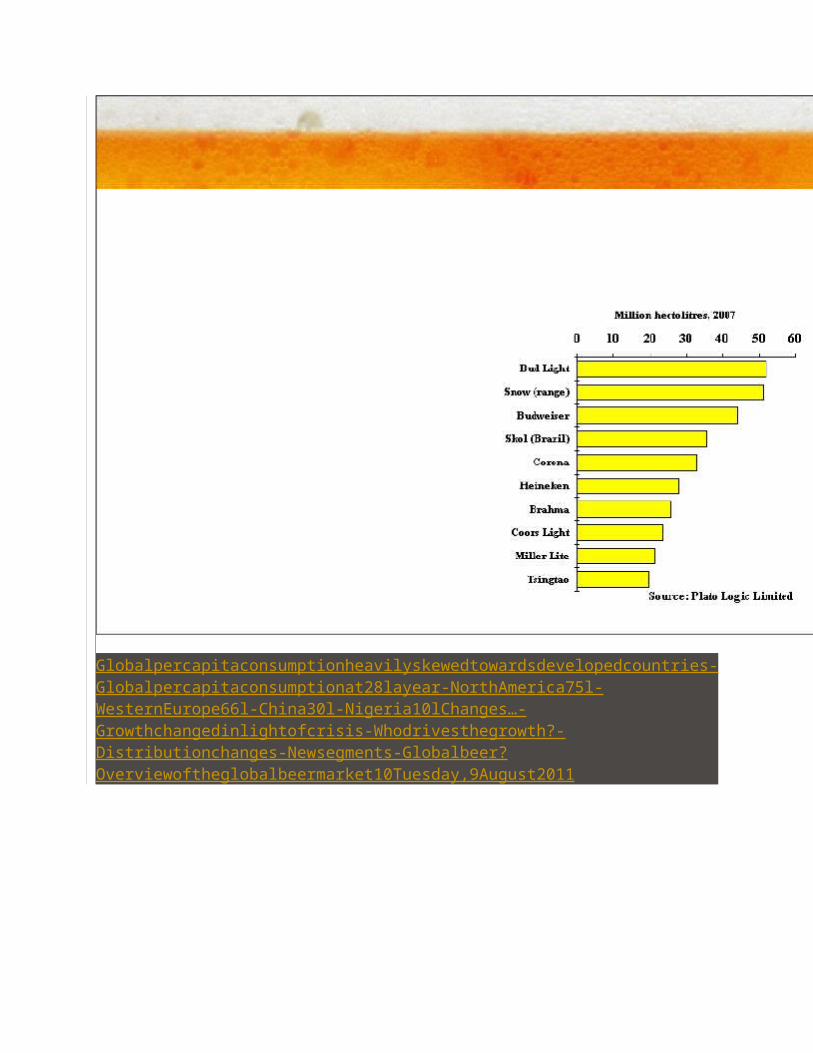
Globalpercapitaconsumptionheavilyskewedtowardsdevelopedcountries-Globalpercapitaconsumptionat28layear-NorthAmerica75l-WesternEurope66l-China30l-Nigeria10lChanges…-Growthchangedinlightofcrisis-Whodrivesthegrowth?-Distributionchanges-Newsegments-Globalbeer?Overviewoftheglobalbeermarket10Tuesday,9August2011
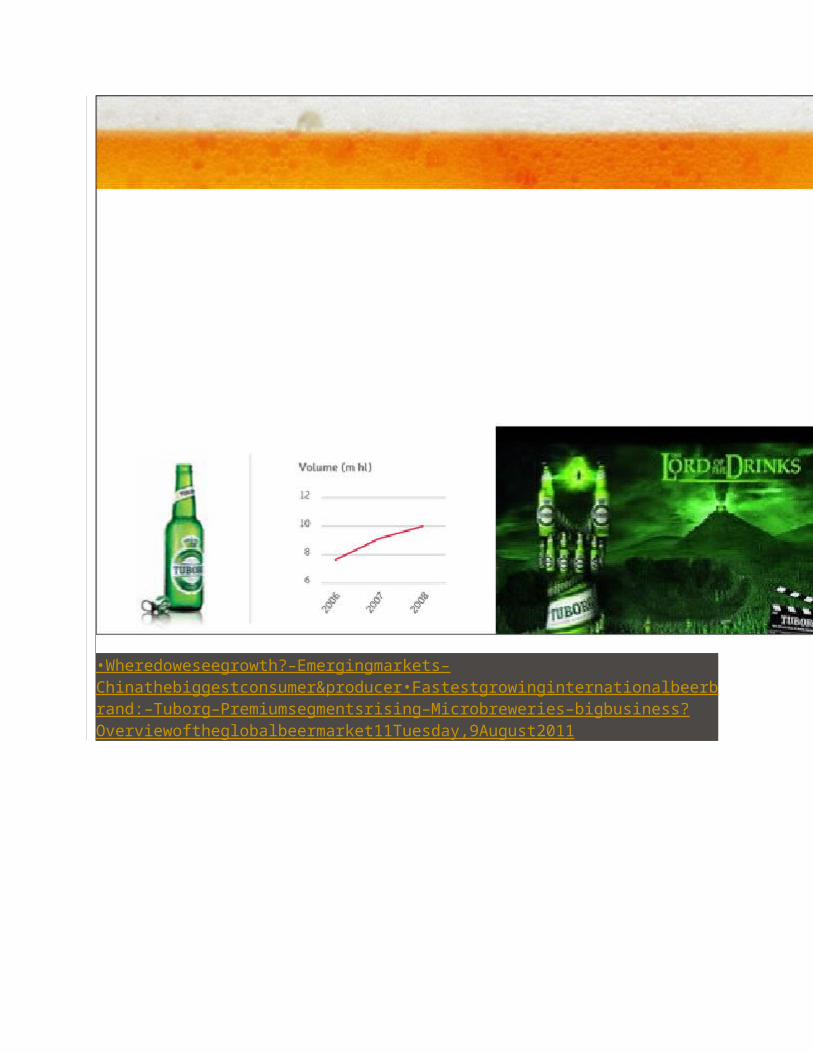
•Wheredoweseegrowth?–Emergingmarkets–Chinathebiggestconsumer&producer•Fastestgrowinginternationalbeerbrand:–Tuborg–Premiumsegmentsrising–Microbreweries–bigbusiness?Overviewoftheglobalbeermarket11Tuesday,9August2011
Overviewoftheglobalbeermarket12Tuesday,9August2011

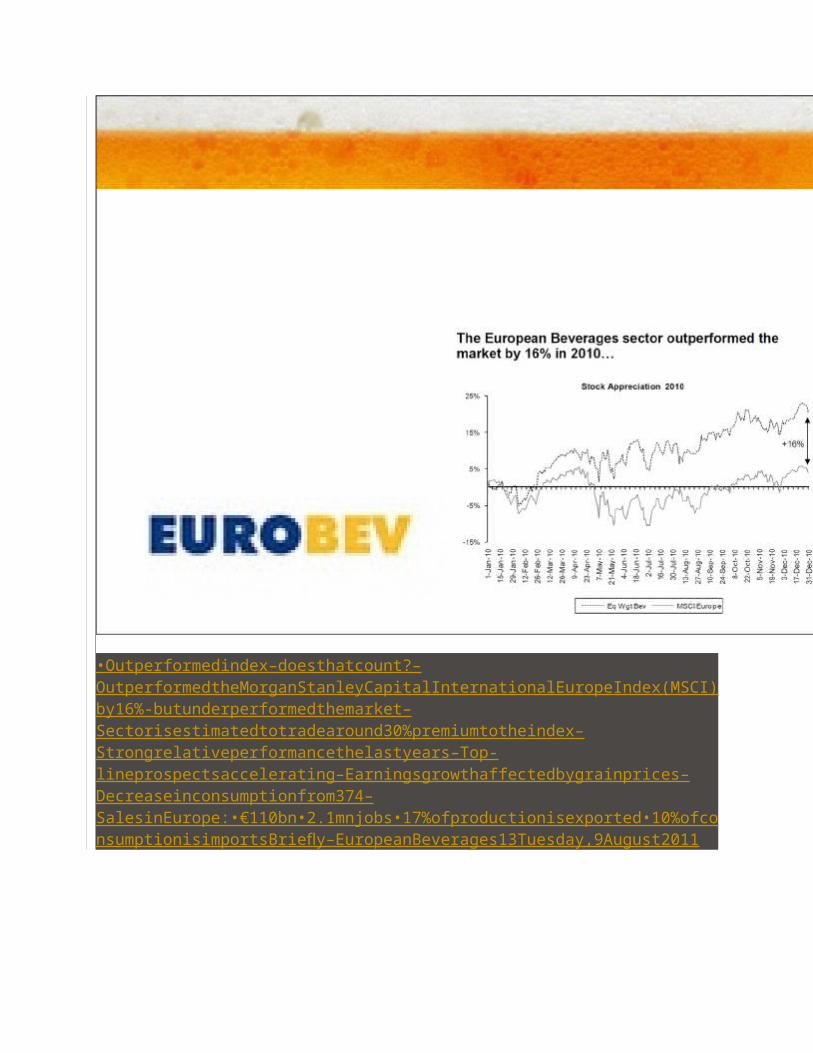
•Outperformedindex–doesthatcount?–OutperformedtheMorganStanleyCapitalInternationalEuropeIndex(MSCI)by16%-butunderperformedthemarket–Sectorisestimatedtotradearound30%premiumtotheindex–Strongrelativeperformancethelastyears–Top-lineprospectsaccelerating–Earningsgrowthaffectedbygrainprices–Decreaseinconsumptionfrom374–SalesinEurope:•€110bn•2.1mnjobs•17%ofproductionisexported•10%ofconsumptionisimportsBriefly–EuropeanBeverages13Tuesday,9August2011
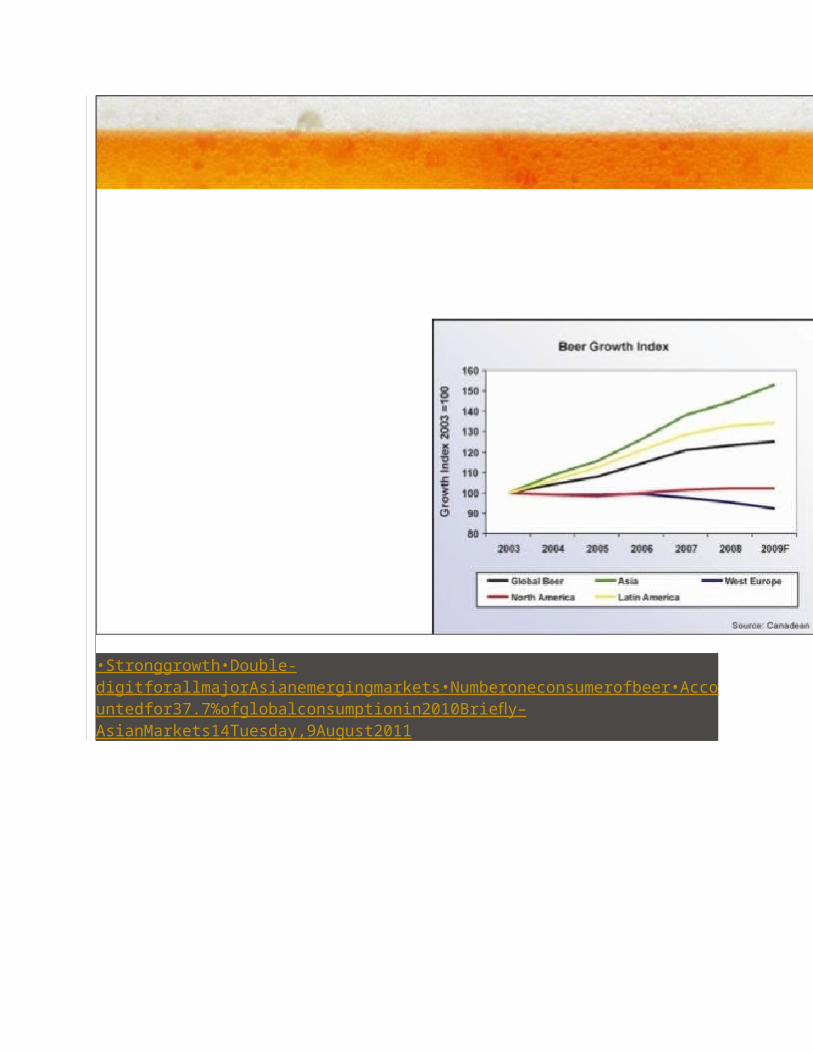
•Stronggrowth•Double-digitforallmajorAsianemergingmarkets•Numberoneconsumerofbeer•Accountedfor37.7%ofglobalconsumptionin2010Briefly–AsianMarkets14Tuesday,9August2011
•95%ofbeeriswater•3rdmostpopulardrink(afterwater&tea)•Easytomake,butstandardsarehighBeerthenaturalchoice?•Oneofthehealthiestdrinks0fats&cholesterol-94calories(asinotherdrinks)-Containsvitamins(barleywhenmalted-->vitaminB)-Fibre,antioxidantsandminerals-silicon-Lowinsodium(salt)andhighinpotassium15Tuesday,9August2011

-Forecasttoraisenextdecade(40%by2020-globalcerealstockinlowest)-Guilty:-Unfavourableweather-CatastropheinJapan-PoliticaluncertaintyAfrica&NearEast-Strongincreaseoilprices-Uncertaintyfinancialmksandglobaleconomy0%22%43%65%87%108%130%CARMICF&BIBarleyMaize(corn)WheatAluminiumRice9%34%125%102%46%35%27%YoY%changeofmaincommoditiesaffectingbeercompanies*CARMI-Commod.Agri.RawMaterialIndex*CF&BI-Commod.Food&BeverageIndexCommodityprices&effectsonbeerprices/volumes16Tuesday,9August2011

•Corporateresponses/strategies:-Consumerpriceincreases-needofstrongconsumerloyaltytoensuresales-Cost-cutting-absorbingcosts=cost-cutting-SupplychainM&Aandstrategicalliances-fixpricepurchasingwithcommodityderivatives-forward-buying-->tominimizevalueatriskCommodityprices&effectsonbeerprices/volumes17Tuesday,9August2011
Risk&ConclusionProductionMargins1%2%4%8%15%17%25%28%CostsBreakdownLargeBreweryPackagingTaxSales&MarketingProductionMaltMinoringredientsAdjuntsHops18Tuesday,9August2011

Risk&ConclusionProductionMargins25%50%75%100%ABInBevCarlsbergHeinekenSABMiller24%37%46%44%76%63%54%56%GrossProfit&COGSMarginsas%ofRevenuesGrossProfitMarginCOGSMargin19Average38%Tuesday,9August2011

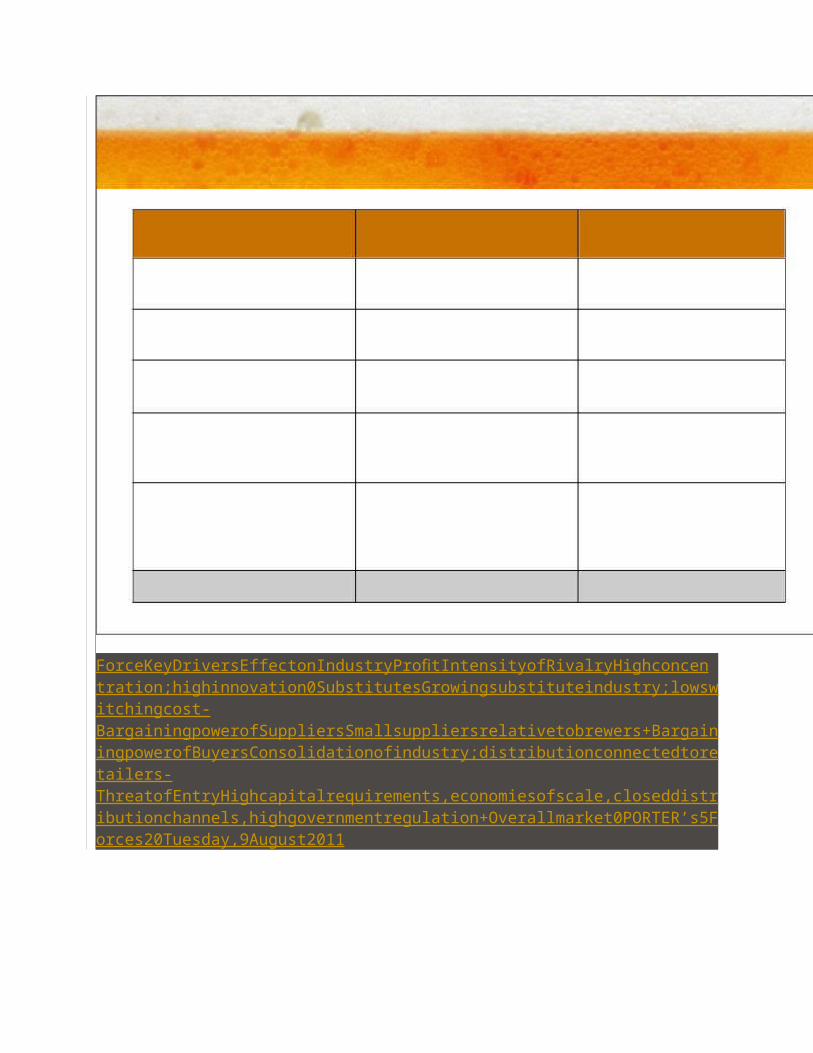
ForceKeyDriversEffectonIndustryProfitIntensityofRivalryHighconcentration;highinnovation0SubstitutesGrowingsubstituteindustry;lowswitchingcost-BargainingpowerofSuppliersSmallsuppliersrelativetobrewers+BargainingpowerofBuyersConsolidationofindustry;distributionconnectedtoretailers-ThreatofEntryHighcapitalrequirements,economiesofscale,closeddistributionchannels,highgovernmentregulation+Overallmarket0PORTER’s5Forces20Tuesday,9August2011
•Expansionintoemergingmarkets(Chinaworld’snextbigconsumer)020406080100ChinaBrazilRussiaVietnamUSAMexicoIndiaThailandUkraineNigeria0%8%16%24%32%40%39.7%8.3%7.1%5.3%4.3%3.9%4.2%2.5%2.2%1.9%96.0020.2017.3012.9012.209.408.606.105.304.60BeerConsumptionincrementalgrowth(2010-2015F)inmhlForecastcontributiontoindustrygrowth(2011-2015)GrowthOpportunities21Plato-March2011Tuesday,9August2011« ‹ › »
/90
Related More
1

Brand Management - Us Beer Market
ECR_demand_brussels_forum_trends
Cobra Presentation
Revolution in Digital Media Consumption
The Global Brewery Industry
Heinekein
Social Media Marketing For Biotech and P…
Public days swedisch broadcasting presen…

TCC Presentation - Digital 101 (Sydney, …
Heineken case study business analysis
Heineken Case Study business Analysis
SEO eMarketing Presentation 2011
Heineken neil group
What Works in Online Fundraising NRB 201…
Communicate POWERFULLY Onstage - Michell…
Google Analytics Training 201
Unconventional Evernote, Dmitry Stavisky…

Boston Beer Company Valuation
Boston Beer Company PPT
Samuel Adams %281%29
+ Follow
Beer industry by Christian Adeler on Aug 14, 2011
6,519 views
Beer Industry global analysis, study of Big Four companies in the industry (ABInBev, SABMiller, Heineken & Carlsberg)
More…
17 comments
1–10 of 17 comments next Post a comment
HP Yang , student Hi~it's really nice presentation! If it possible , could u please sent me the download link to [email protected] ?? Thank u very much! And thank to share the slide for us ^^ 1 day ago
Giuseppe Valenti at Eni very nice job. would be possible to receive copy of the presentation?

My address is the following [email protected] 4 days ago
Austine Imoukhuede Amazing wok, please send the link to my email as well [email protected]. This is really helpful. 2 weeks ago
Minh Nhat Nguyen at Minh Nhat Nguyen What a wow presentation! Please send me the download link to [email protected]. Thank you very much! 1 month ago
sabermanjoo hi
please send me your email address, i would like to engage with you on an assignmetn that i am doing on SABMILLER 1 month ago
MJRENAUD Thank you so much Marie 1 month ago
milind_raikar Well made presentation. If possible forward the download link to [email protected] 1 month ago
繼忠 楊 Great . Please send me the download link to [email protected]. Thank you very much! 1 month ago
MJRENAUD Great . Please send me the download link to [email protected]. Thank you very much! 2 months ago
Elisa Magnani great work! Could you please send me the presentation to [email protected]? thanks a lot Elisa 2 months ago
Subscribe to comments Post Comment
24 Favorites

HP Yang , student 1 day ago
Giuseppe Valenti at Eni 4 days ago
Edward Brown 1 week ago
Austine Imoukhuede 2 weeks ago
Bob King , General Manager at Emerson Brewing Co Ltd 1 month ago
Irina Khamzina 1 month ago
Николай Гавриленко 2 months ago
Aleksey Bezugly , Head of Marketing at Obolon CJSC 2 months ago
Amelie Roujou de Boubee , Strategy & Marketing Director at Arena, Havas media Group Tags beer industry 2 months ago
Best Linh , CEO at Show Co., Ltd Tags beer 2 months ago
More…
Beer industry — Presentation Transcript 1. Beer Industry «Beer is living proof that God loves us and wants us to be happy» -
Benjamin Franklin Jon Øyvind Bjørnstad Christian Adeler NormannTuesday, 9 August 2011
2. Agenda • History of Beer..............................................................3 • Emerging Markets......................................................36 • History of beer - last decade................................4 • Asia, Latin America and Eastern EU • Global Macro Environ Analysis.............................5 • Developed Markets..................................................42 • Global Beer Environ Analysis.................................6 • EU, North America, Asia & Oceania • How is beer made.......................................................8 • Social & Cultural Issue............................................46 • Overview of the global beer mk.........................9 • Self-Regulation.............................................................47 • Briefly - EU

Beverages....................................13 • Risks...................................................................................49 • Briefly - Asian Markets...................................14 • Marketing & Advertising........................................51 • Beer the natural choice..........................................15 • Corporate Social Responsibility (CSR).........56 • Commodity prices & effects on beer • Conclusion.....................................................................57 prices/volumes........................................................16 • The BIG FOUR...........................................................58 • Production Margins..................................................18 • AB InBev.................................................................60 • Porter’s 5 Forces........................................................20 • SAB Miller..............................................................66 • Growth Opportunities...........................................21 • Heineken................................................................72 • M&A..................................................................................24 • Carlsberg................................................................80 • M&A - Our thoughts......................................27 • Ratios................................................................................87 • Investment Recommendation............................89Tuesday, 9 August 2011
3. History of Beer • Beer is one of the world’s oldest beverages, recorded back to the 6th millennium • A very important drink in many cultures • Family and microbreweries dominated around the world up untill the 20th century • The hunt for taste versus the hunt for profits • The development of the beer industry in the USA • Today a global and fiercely competitive business 3Tuesday, 9 August 2011
4. History of beer – the last decade • Consolidation trends going even further • The top 10 and their market share • The top 4 today dominating • Other trends • Financial crisis impact 4Tuesday, 9 August 2011
5. Global Macro Environmental Analysis • Emerging markets almost 50% of global growth (4.3% Q1) • Advanced economies weak growth, 2.5% compared to 3% from last year. • Developing economies projected a strong growth, but will decline from 7.5% (2010) to 6.5% (2011) • IMF figures usually over- optimistic, so we estimate slightly weaker global growths 5Tuesday, 9 August 2011
6. Global Beer Environmental Analysis • 2010 - Beer brewers sales increase of 2.6% (2009 - 9.2%). - Overall beer sales remain flat - US beer sales down 1% (only growth seen in craft beers) - US brewers 81% of US market share (imports gradually increasing share) - Consumer still remain taste conscious - Beer industry performance correlated with economy • Law and ethics: - Stricter laws = drunk driving and smoking ban - US Federal beer tax = 40% of retail cost of beer - $18/gallon barrel (if produce <2million --> discount $7 for first 60,000barrels). 6Tuesday, 9 August 2011
7. Global Beer Environmental Analysis • Diversity & Global Trends: - 2011 global population 7bn --> in 2050 - 9.5bn (majority growth in developing countries) - Wealth shifting to East&South countries (Globalization) - Changes in preferences and attitudes toward beer consumption • Technology: • Advances --> necessary to maintain competitive advantage & efficiency 7Tuesday, 9 August 2011
8. How is beer made? 8Tuesday, 9 August 2011

9. Overview of the global beer market • The beer industry: – Consumer non-cyclical • Outputs – Beer, measured in barrels • Major trends – Consolidation – Shifting in preferences in emerging markets – Shifting in preferences in developed markets • Compound annual growth rate of 3,5% globally – two very different pictures - Emerging markets showing strong growth with 6.8% - Developed markets showing a negative growth of 3.4% 9Tuesday, 9 August 2011
10. Overview of the global beer market Global per capita consumption heavily skewed towards developed countries - Global per capita consumption at 28l a year - North America 75 l - Western Europe 66 l - China 30 l - Nigeria 10 l Changes… - Growth changed in light of crisis - Who drives the growth? - Distribution changes - New segments - Global beer? 10Tuesday, 9 August 2011
11. Overview of the global beer market • Where do we see growth? – Emerging markets – China the biggest consumer & producer • Fastest growing international beer brand: – Tuborg – Premium segments rising – Microbreweries – big business? 11Tuesday, 9 August 2011
12. Overview of the global beer market 12Tuesday, 9 August 2011 13. Briefly – European Beverages • Outperformed index – does that count? –
Outperformed the Morgan Stanley Capital International Europe Index (MSCI) by 16% - but underperformed the market – Sector is estimated to trade around 30% premium to the index – Strong relative performance the last years – Top-line prospects accelerating – Earnings growth affected by grain prices – Decrease in consumption from 374 – Sales in Europe: • €110 bn • 2.1 mn jobs • 17% of production is exported • 10% of consumption is imports 13Tuesday, 9 August 2011
14. Briefly – Asian Markets • Strong growth • Double-digit for all major Asian emerging markets • Number one consumer of beer • Accounted for 37.7% of global consumption in 2010 14Tuesday, 9 August 2011
15. Beer the natural choice? • 95% of beer is water • 3rd most popular drink (after water&tea) • Easy to make, but standards are high •One of the healthiest drinks 0 fats & cholesterol - 94 calories (as in other drinks) - Contains vitamins (barley when malted --> vitamin B) - Fibre, antioxidants and minerals - silicon - Low in sodium(salt) and high in potassium 15Tuesday, 9 August 2011
16. Commodity prices & effects on beer prices/volumes YoY % change of main commodities affecting beer companies130% 125% - Forecast to raise next decade108% (40% by 2020 - global cereal 102% stock in lowest) 87% - Guilty: -Unfavourable weather 65% -Catastrophe in Japan -Political uncertainty Africa & 46% Near East 43% 27% 35% 34% -Strong increase oil prices 22% -Uncertainty financial mks 9% and global economy 0% CARMI CF&BI Barley Maize (corn) Wheat Aluminium Rice * CARMI - Commod. Agri.Raw Material Index * CF&BI - Commod. Food&Beverage Index 16Tuesday, 9 August 2011
17. Commodity prices & effects on beer prices/volumes • Corporate responses/strategies: -Consumer price increases - need of strong consumer loyalty to ensure sales -Cost-cutting - absorbing costs = cost-cutting -Supply chain M&A and strategic alliances - fix price purchasing with commodity derivatives - forward-buying --> to minimize value at risk 17Tuesday, 9 August 2011

18. Risk & Conclusion Production Margins Costs Breakdown Large Brewery 2% Packaging 4%1% Tax 8% Sales&Marketing 28% Production Malt 15% Minor ingredients Adjunts Hops 17% 25% 18Tuesday, 9 August 2011
19. Risk & Conclusion Production Margins COGS Margin Gross Profit Margin Gross Profit & COGS Margins as % of Revenues 100% 24% 44% 37% 75% 46% Average 38% 50% 76% 56% 63% 25% 54% AB InBev Carlsberg Heineken SABMiller 19Tuesday, 9 August 2011
20. PORTER’s 5 Forces Force Key Drivers Effect on Industry Profit Intensity of Rivalry High concentration; high 0 innovation Substitutes Growing substitute industry; low - switching cost Bargaining power of Small suppliers relative to + Suppliers brewers Bargaining power of Consolidation of industry; - Buyers distribution connected to retailers Threat of Entry High capital requirements, + economies of scale, closed distribution channels, high government regulation Overall market 0 20Tuesday, 9 August 2011
21. Growth Opportunities • Expansion into emerging markets (China world’s next big consumer) 100 96.00 40% Beer Consumption incremental growth (2010-2015F) in mhl Forecast contribution to industry growth (2011-2015) 80 32% 60 24% 39.7% 40 16% 20.20 17.30 20 12.90 8% 12.20 9.40 8.60 8.3% 6.10 5.30 4.60 7.1% 5.3% 4.3% 3.9% 4.2% 2.5% 2.2% 1.9% 0 0% China Brazil Russia Vietnam USA Mexico India Thailand Ukraine Nigeria 21 Plato - March 2011Tuesday, 9 August 2011
22. Growth Opportunities • Saturation of traditional markets --> growth = strategic M&A • reorganised industry and strengthened the big players • Consumer preferring lighter and “healthier” beers --> new trend (40% of all beer sold) • Innovative product formats --> new trend = large packages • Sales = ALL about strong branding & marketing • Companies to be successful must focus on: - variety (only 10% men loyal to a specific brand) - relationships with distributors - innovative marketing&advertising strategies to build brand - control and reduce manufacturing costs 22Tuesday, 9 August 2011
23. Growth Opportunities • Forces with strong influence over next 3-5 years: • Globalization - creates bigger market + additional competition • Consumer Preferences - bigger portfolio of products • Regulations - consumption heavily regulated • Sustainability - programs to reduce, reuse and recycle materials (environmental friendly) 23Tuesday, 9 August 2011
24. M&A • Main aims = - develop economies of scale Top 10 companies as a % of market share - increase product portfolio --> 70% 63% international interest 53% 37% • High consolidation 35% - “Big four” - 50% all global 18% beer consumed 0% • “Big four” - in size, Boston Beer is 1% 2000 2010 of InBev --> minimal effects if acquired • “Too big to need financing” to expand. - Top companies profit increases of 7-12% - Buying companies “out of their main scope” 24Tuesday, 9 August 2011
25. M&A • 2002: SAB PLC combined with Miller Brewing --> SABMiller - Miller #2 in US and #6 in world - SAB #4 world and brands in Africa, China and East EU. - $5.6bn deal ($2bn in assumed debt and $3.6bn in stock --> 64% stake of Miller - Phillip Morris will keep 36%) - SABMiller #2 Brewer (Miller needed it to remain competitive) - Sharper focus on selling beer - 2004: InBev created from merger Interbrew and AmBev - Interbrew paid €9.2 for 57% stake in Ambev (stock&debt deal) - Interbrew was #3 in world by volume and Ambev #5 - Deal was giving InBev approx. 25% of world beer sales 25Tuesday, 9 August 2011

26. M&A M&A • 2008: Anheuser-Busch and InBev merger to create AB InBev • $52bn deal • Created Global Beer Leader and Top 5 consumer companies • Access to new local markets (geo diversity) - leader in top 5 world markets - no geo overlap • 40% revenues from the US • Coors acquires Molson in 2004 • Heineken purchased FEMSA (Early 2010) 26Tuesday, 9 August 2011
27. M&A - Our thoughts • Craft beer outlook • Predictions in the future – China – Emerging markets – Developed markets • M&As 27Tuesday, 9 August 2011
28. Craft Beer Outlook • Prohibition killed off diversity, but what now? • Recent growth in craft beer segment • The three-tiered future? – Macro – Regional – Micro 28Tuesday, 9 August 2011
29. Predictions • China – Slowdown in consolidation • Top 3 brands market share of 52.5% • Over 80 M&As in the last decade • Fewer good acquisition targets • Opening new plants instead of acquiring businesses 29Tuesday, 9 August 2011
30. Predictions • Emerging markets – Same as China in other markets? – “hotshots” slowing down M&A pace – M&A booms in “younger” emerging markets like a lot of the African countries • Developed markets – Market division settled, best targets acquired already – Acquiring craft brewers • Pros • Cons 30Tuesday, 9 August 2011
31. M&A Predictions • Foster’s – SABMiller’s June 21st bid on Foster’s Group Limited – Bid valued Fosters at USD 10 billion – Market reactions to the bid and rejection – What happens now? • Foster’s is an attractive target • Could trade at values of 5.40-50 per share, pricing it as high as USD 11 billion. 31Tuesday, 9 August 2011
32. M&A Predictions • Potential buyer: Asahi – Leading brewer and soft-drink company out of Tokyo, Japan – 40% of Japanese beer market – Stake in Foster’s Group already, acquired in 1990 – Cadbury Schweppes Australia acquired in 2009 – Moving into new markets – Tsingtao stake acquired from ABInBev in 2009 – Is looking to expand in Asia and Oceania, an acquisition of Foster’s would place them as a leading player in the area. 32Tuesday, 9 August 2011
33. M&A Predictions • Megabrew – potential merger between ABInBev and SABMiller – A merger would have positive and negative sides • Pros: amazing growth, not much geographic overlap, one corporate HQ • Cons: culture clash, US beer category, changes causing divesting, cultural risk – Numbers don’t add up: • High leverage deal meeting currency issues • A huge amount of equity required • Net-net it is harder to pull off than BUD because: 1) SAB offers lower synergies, 2) SAB’s emerging market cash flow makes it harder to lever, 3) SAB is on a slightly higher multiple than BUD and 4) the execution risks are much higher. • Discussions of a merger are not new, there were meetings in 2007, but InBev were unwilling to pay a significant premium. – Conclusion: We don’t see the benefits of a merger outweighing the downsides. 33Tuesday, 9 August 2011
34. M&A Predictions • Molson Coors moving into India – Joint Venture with Cobra India – “beginning of a long-term commitment” – Follows a 2009 deal between Molson Coors UK and Cobra Beer covering sales outside south Asia. 34Tuesday, 9 August 2011
35. M&A Predictions • Opportunities in Africa – Plenty of room for growth – Heineken recently bought into the Ethiopian market – Nigeria and increased minimum wage – SABMiller entering discount beer market 35Tuesday, 9 August 2011

36. Emerging Markets • Potential emerging markets – Asia – Latin-America – Africa – Eastern Europe • Main trends: – Rising disposable incomes – Economic growth – ”Westernizing” • Areas and countries in detail: 36Tuesday, 9 August 2011
37. Asia ASIA • Steady economic growth for some time • China the main contributor • More developed countries stalling or declining • Two promising markets: – China – India 37Tuesday, 9 August 2011
38. Latin-America LATIN AMERICA • In the long run we see tax benefits in markets like Panama, Peru and Colombia • Markets are concentrated with high entry-barriers • Especially premium segments look promising • Two promising markets: – Mexico – Brazil 38Tuesday, 9 August 2011
39. Africa AFRICA • Mostly lager is produced here • Re-usage of bottles delivered in store • A lot of people, but a lot of uncertainty • Some promising countries: – South Africa – Nigeria – Ethiopia 39Tuesday, 9 August 2011
40. Ethiopia - Growth Opportunity • Beer consumption rising, and it’s still extremely low at 4 l per capita a year, and much lower than its neighbouring countries • Economic progress in the country • Double digit growth rates projected and experienced in the recent years • Heineken and BGI Ethiopia • Risks – famine 40Tuesday, 9 August 2011
41. Eastern Europe EASTERN EUROPE • Growth is expected to continue • Driven by Russia • Some growth in developed markets as well • Interesting markets: – Czech Republic – Russia 41Tuesday, 9 August 2011
42. Developed MARKETS DEVELOPED markets • Trends: – Declining consumption – Increased health awareness • Changes in: – Tastes – Alcoholic beverages – Drinking patterns 42Tuesday, 9 August 2011
43. Europe EUROPE • UK – big business, but a declining consumption trend • Netherlands – Heineken domination • France – wine… and beer? • Germany – beer a major part of the culture. • Poland – a big consumer 43Tuesday, 9 August 2011
44. North America NORTH AMERICA • USA – Few players dominate – Three-tier system • Canada – International influence – Microbrewers 44Tuesday, 9 August 2011
45. Asia & OCEANIA ASIA & Oceania • Japan – New products with lower tax • South Korea – High entry barriers – Microbreweries • Australia – High consumption per capita – Dominated by Foster’s 45Tuesday, 9 August 2011
46. Social and Cultural Issues Social & Cultural Issues • History of opposition – Alcohol always had enemies • Sin taxes – Affecting the end-customer – Seen as a regressive form of taxation • Religion – Islam the only one with a non-alcohol policy – Some extremist churches • Science and medicine – Long term use linked to cancer, heart disease, diabetes and liver failure 46Tuesday, 9 August 2011
47. Self-regulation Self-Regulation • A code of practice or set of guiding principles governing the content of advertisements. • A process for the establishment, review, and application of the code or principles. • Why do this? • Is it working? 47Tuesday, 9 August 2011
48. Self-Regulationexamples.. Self-regulation Examples • Australia – Minimal legislation and requirements, self-regulatory code organized in 1998 • Netherlands – Some legislation, and Code of Beverages • UK – International Code of advertising • South Africa – Self-regulatory code set up in 1989 by ARA 48Tuesday, 9 August 2011
49. RISKS Risks • Beer excise duty: • Highly taxable product --> increase in tax = increase sale price • price-sensitive consumption • Russia 200% increase implemented in

2010 --> increase prices --> russian mk share under pressure • Legal/Regulatory restrictions & changes: • Several mks have restrictions on sales, availability and advertising regulation • Pressure from authorities&stakeholders to reduce alcohol consumption --> impacting consumer behavior • Economic environment: • Global recession with weak GDP growth projected for 2011 • Poor/raising unemployment --> weak consumer demand 49Tuesday, 9 August 2011
50. RISKS Risks • Commodity price volatility • Input costs skyrocketing --> sales prices increasing • Change in consumer preferences: • Strong portfolios to meet consumer needs • Critical to anticipate quickly to market needs • Management capability impairment • “Unstable” emerging markets • Customary risk • Political, economic and regulatory uncertainty • Competition •“eat or be eaten” 50Tuesday, 9 August 2011
51. MARKETING & ADVERTISING MARKETING & ADVERTISING • Compete on POSITIONING: target, image, communication • Marketing-driven business --> adds not necessarily to increase demand, but to increase brand awareness --> develop brand image! Sales & Mk Expenses (in Billion $) 2009 - 2010 Beer Industry Advertising Expenditures ($ in millions) 1170 1175 1175 5 1200 4.9 1083 3.75 1090 1027 985 979 2009 980 910 2.5 4.7 2010 2.3 870 800 1.25 2.0 764 1.7 2.1 2.1 1.8 760 0 InBev Carlsberg Heineken SABMiller 650 1998 1999 2000 2001 2002 2003 2004 2005 2006 2007 Source: Company Annual Reports • Successful brands --> balance of “push” and “pull” strategies • “push” - relationships with distributor - place brand on the shelf • “pull” - marketing directly to consumer 51Tuesday, 9 August 2011
52. MARKETING & ADVERTISING MARKETING & ADVERTISING • “Fight for space” (shelf placement): • “Visual equity” is more important than “memory equity” • product must be in consumer’s face - literally!! • Shelf placement: (picture) “TOP AREAS”: - +20% # people seeing you & probability of been chosen “GOLDEN ZONE”: - # “Facings”/chances increased --> chances being bought = +28% --> chances low mk share brands = 67% • Strategies to claim space: • multiple packaging --> billboard effect • maximising types of beers to sell 52Tuesday, 9 August 2011
53. MARKETING & ADVERTISING MARKETING & ADVERTISING • Advertising & marketing code: (follow certain ethical standards) • Portray beer in a socially responsible way • Communicating solely to adult consumers of legal drinking age • 70% audience --> to be over drinking age • Should not undervalue other competing beers • only be factual, no interpretations • Advertised at college campuses or events only when permitted • Applied also to “product placement” of beer • not portray sexually explicit activity as result of consuming beer • no graphic nudity 53Tuesday, 9 August 2011
54. MARKETING & ADVERTISING MARKETING & ADVERTISING • “Basic” steps for building successful beer brand: 1. Identify target group 2. Brand message: clear & appealing 3. Creating brand image 4. Consistent quality 5. Brand recognition--> get share shelf for their products 6. Consumer ownership --> distinctive atmosphere 7. Packaging: compelling, interesting and comfortable 54Tuesday, 9 August 2011
55. MARKETING & ADVERTISING MARKETING & ADVERTISING • Social Media Marketing (SMM): • Rise of social networks --> changed way people interact with brands • “one-one” interaction with customers - presence on the same playing field • specific campaigns & promotions • closely monitor customers and instant feedback • SMM -> all in the same battlefield --> the one with most strategical power --> will survive the battle 55Tuesday, 9 August 2011

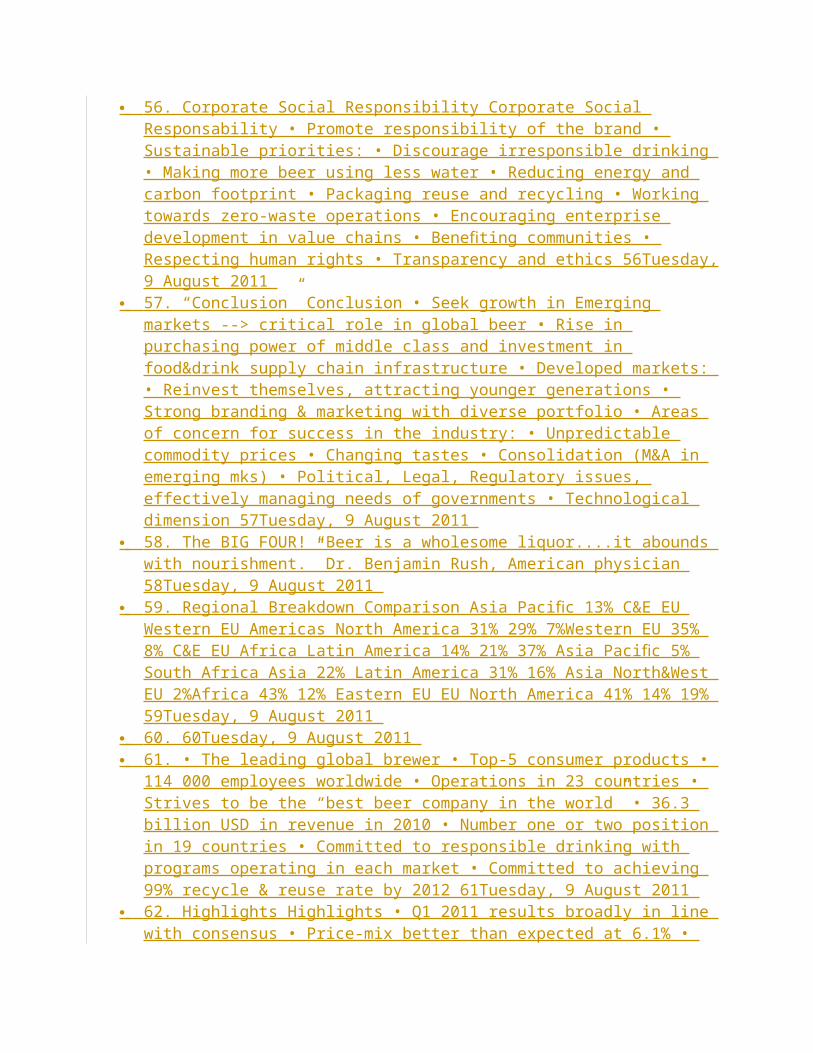
56. Corporate Social Responsibility Corporate Social Responsability • Promote responsibility of the brand • Sustainable priorities: • Discourage irresponsible drinking • Making more beer using less water • Reducing energy and carbon footprint • Packaging reuse and recycling • Working towards zero-waste operations • Encouraging enterprise development in value chains • Benefiting communities • Respecting human rights • Transparency and ethics 56Tuesday, 9 August 2011
57. “Conclusion” Conclusion • Seek growth in Emerging markets --> critical role in global beer • Rise in purchasing power of middle class and investment in food&drink supply chain infrastructure • Developed markets: • Reinvest themselves, attracting younger generations • Strong branding & marketing with diverse portfolio • Areas of concern for success in the industry: • Unpredictable commodity prices • Changing tastes • Consolidation (M&A in emerging mks) • Political, Legal, Regulatory issues, effectively managing needs of governments • Technological dimension 57Tuesday, 9 August 2011
58. The BIG FOUR! “Beer is a wholesome liquor....it abounds with nourishment.” Dr. Benjamin Rush, American physician 58Tuesday, 9 August 2011
59. Regional Breakdown Comparison Asia Pacific 13% C&E EU Western EU Americas North America 31% 29% 7%Western EU 35% 8% C&E EU Africa Latin America 14% 21% 37% Asia Pacific 5% South Africa Asia 22% Latin America 31% 16% Asia North&West EU 2%Africa 43% 12% Eastern EU EU North America 41% 14% 19% 59Tuesday, 9 August 2011
60. 60Tuesday, 9 August 2011 61. • The leading global brewer • Top-5 consumer products • 114 000 employees
worldwide • Operations in 23 countries • Strives to be the “best beer company in the world” • 36.3 billion USD in revenue in 2010 • Number one or two position in 19 countries • Committed to responsible drinking with programs operating in each market • Committed to achieving 99% recycle & reuse rate by 2012 61Tuesday, 9 August 2011
62. Highlights Highlights • Q1 2011 results broadly in line with consensus • Price-mix better than expected at 6.1% • Results in North America – Slow but steady improvement • Brazil was weak as expected – margins expanded on the back of strong gross profit and cost savings 62Tuesday, 9 August 2011
63. Regional Breakdown • North America – Continued suffering from unemployment – Top-line weakness offset by organic expansion and reduciton in barley costs • Latin America North – New brewery in Brazil online in Q3 2011 Asia Pacific – Volume growth in Brazil slowing down due to 13% • Heavy rain & flooding C&E EU • Deliberate volume/ share management 7% North America • Modest slowdown in GDP growth 35% • General inflation nearing minimum wage increases Western EU 8% • Latin America South – Volumes showing continued sequential improvement Latin America driven by beer 37% – Revenue growth remained strong 63Tuesday, 9 August 2011
64. Regional Breakdown • Western Europe – Organic trends remain weak – Strong bottom-line margin expansion – Minor growth expected for 2011 • Central & Eastern Europe – Modest growth partly offsetting the decline last year – Price-mix up 16.5% – Projected growth of around 9% in 2011 • Asia – Trends driven by BUD’s Chinese operation – Almost 10% organic revenue growth – Expected revenue growth (Bern) of around 10% along with margin expansion of about 110 bps 64Tuesday, 9 August 2011
65. RiskRisks & Conclusion & Conclusions • Risks – QE in the US leading to high inflation and dollar value falling – Intensification of competition in the US and Brazilian
markets – Disposal process failing – FX risks – ZBB-cost reduction program failing to meet targets – Global crisis in oil supply could put pressure on commodities • Conclusion – Underperformed peers and MSCI Europe for the first months of 2011 – Closed the gap in April – Management has a great track record – Currently at a 4% premium to peers, we expect 10% – Rating: OUTPERFORM 65Tuesday, 9 August 2011
66. 66Tuesday, 9 August 2011 67. SABMiller • Basic Facts: • Covers 75 countries on 6 continents South Africa 22%
Latin America 31% Asia • Employs over 70,000 people 2% Africa 12% North America EU • Well balanced portfolio (developed and 14% 19% emerging mks) • Over 200 different brands • International premium brands: Pilsner Urquell, Peroni, Miller and Grolsch • 20% market share in China 67Tuesday, 9 August 2011
68. SABMiller Highlights • 6% EBITA growth • Strong FCF generation (reduction 200m in CapEx) • +80% EBITA coming from high growth emerging markets (plus MillerCoors synergies) • Positive growth prospects in emerging markets (Asia & Africa) • Strong momentum into F12 - improvement top-line growth as Colombia recovers from last years tax hike, and C&E Euro beer markets pick up •Hedged 50% their input costs. 68Tuesday, 9 August 2011
69. SABMiller Regional Breakdown • Latin America: • 2% revenue growth, with flat organic volume ( Colombia 50% of region - impacted by VAT increase) • North America • Flat organic revenue growth (declining volumes) • Impact of economy uncertainty and unemployment • Benefiting from MillerCoors strong synergies/cost savings • Central&Eastern Europe: • Flat sales growth • Challenging trading conditions 69Tuesday, 9 August 2011
70. SABMiller Regional Breakdown • Africa: • Strong top-line and improvement in capacity utilisation • 24% volume growth • Asia: • Very strong top-line performance • 14% org revenue growth (drivers China & India) • Increased marketing support behind key brands • South Africa: • 8% revenue growth • Market share stabilised (after loosing Amstel brand) 70Tuesday, 9 August 2011
71. SABMiller Risks • The south-african governm. radically changes duty regime • A global crisis in the supply of oil could further put pressure on commodities in general and alu, energy & glass in particular. • Significant FX movements • Intensification of market battles with AmBev in South American • Further consumption slowdown in major economies such as South Africa, Colombia, Peru or Polan. 71Tuesday, 9 August 2011
72. 72Tuesday, 9 August 2011 73. Heineken • Owns over 125 breweries in more than 70 countries • 3rd largest brewer
in the world • Employs approx. 54.000 people • More than 170 international brands (including Cruzcampo, Tiger Beer, Żywiec, Starobrno, Zagorka, Birra Moretti, Ochota, Murphy’s, Star and of course Heineken Pilsener). 73Tuesday, 9 August 2011
74. Heineken Highlights • Last 10 years it has gone from trading at a 130% premium to peers in 2000 to a current 10% discount (over-exposure to low growth W Europe and over reliance in the US market) • Acquisition of FEMSA --> exposure to high-growth EM (Mexico&Brazil, but well below SABMiller) • Development of premium segment --> top-line growth • Improving margins (cost saving & synergies from FEMSA deal) 74Tuesday, 9 August 2011
75. Heineken Regional Breakdown • Western EU • Challenging trading conditions (leader in UK, Netherlands, co-leader but loosing territory in Spain) • Offset by cost

savings • Largest revenue & profit pool (42% & 31%) Western EU Americas 31% 29% • C&E EU • 20% & 14% in volume and profit C&E EU Africa • Improvement primarily on the back of 14% Asia Pacific 21% economic recovery 5% • Russia stabile after 27% drop in 2010 (market 6% down) • 33% market share in Romania&Poland (attractive mks) 75Tuesday, 9 August 2011
76. Heineken Regional Breakdown • Americas • 29% of groups profits • FEMSA deal improves prospects (45% of Mexican market) • Opportunity to develop further the premium segment in Mexico&Brazil •Africa & Middle east: • 21% of group profits • Strong growth (notable Nigeria, Heineken #1 leader) • Strong driver for profits and huge potential consumption increase • Asia Pacific: (operating mainly through JV’s) - 5% of profits • Favorable GDP growth --> earnings growth 76Tuesday, 9 August 2011
77. Heineken Relevant Info.: • FEMSA acquisition (2,5bn) changed growth profile and TCM programme (total cost management) gives triumph of hope. • YTD in line with market and outperforming peers (2010 - outperformed MSCI EU by 4% & underperf. peers by 6%) • Px way below 90s levels (driven by high US growth) • 230% premium to peers in 2000 to 10% discount today • Paying expensive prices for acquisitions • Solid export figures to the USA 77Tuesday, 9 August 2011
78. Heineken Near Future • Expect moderate pressure on input costs • Significantly improved FCF generation • approx. 3x in the last 2-3 years • 5 year profit expectations • Strong deliverance mainly from FEMSA synergies and ongoing savings from CM • All regions to deliver strong growth • Lower costs 78Tuesday, 9 August 2011
79. Risks • Timing and execution of cost saving programme slower than expected • Breakdown in three-tier distribution system in the USA would expose producers of beverage alcohol to greater margin pressure from retailers • Significant FX movement such as a decline in the dollar • Global crisis in supply of oil could put further upward pressure on commodities in general and especially aluminum, glass & energy • Price of oil weakening significantly could put Nigerian and Russian under pressure and be significant drag on group profits 79Tuesday, 9 August 2011
80. 80Tuesday, 9 August 2011 81. • Founded in 1847 in Denmark, outside Copenhagen • World’s 4th largest brewery
group • Employing 41 000 people • Characterized by great diversity in: – Brands – Markets – Cultures • Ambition of becoming the fastest growing global beer company • Main regions of operation – Eastern Europe – Northern & Western Europe – Asia 81Tuesday, 9 August 2011
82. Highlights • 2011 a rollercoaster in terms of quarters, we expect 2012 to be more even • 2010 performance a bit light • Net profit (pre-exceptionals) in-line with expectations • Guidance: 2-4% market volume growth in Russia. – Overall a high single-digit percentage growth in operating profit in 2011 • Adjusting EPS estimates to account for weaker than expected recovery from increased input costs in Eastern Europe 82Tuesday, 9 August 2011
83. Guidance & Outlook • Operating margin targets – Northern & Western Europe at 15-17% – Eastern Europe at 26-29% – Asia at 15-20% – Carlsberg Group at around 20% 83Tuesday, 9 August 2011
84. Regional Breakdown • Eastern Europe – Organic volumes declined by 9%, but revenue increased by 11% organically – Negative price mix of 2% as a response to the excise hike – Operating margins contracted 1280 bps in Q4, a total of 80bps contraction
in 2010 – Net volume expected to grow 5% in 2010 – Expect significant price increase to recover from the 1 extra RUB in excise and higher input costs – Positive results from Ukraine Asia 16% North&West EU 43% Eastern EU 41% 84Tuesday, 9 August 2011
85. Regional Breakdown • Northern& Western Europe – Weak top-line offset by strong margin expansion – Volumes flat during 2010 – Significant improvement in UK – Expect a 1% decrease in volume in 2011 • Asia – Strong growth in volume 14% and revenue 17% – Contraction in Q4 2010 – Margin expansion of 280bps in FY10 vs FY09 – Expected regional strength to continue with 10% organic volume growth and 13% organic revenue growth 85Tuesday, 9 August 2011
86. RisksRisk & Conclusion & Conclusion • Upside risks – Geopolitical and macroeconomic factors causing FX appreciation – Faster West European recovery – Exceeding cost-cutting expectations in N&W Europe – Inflation decreasing – Recent surge in raw material prices quick return • Downside risks – Russian government putting pressure on alcohol consumption – Geopolitical and macroeconomic factors causing FX depreciation – Inflation increasing – Prolonged recession in Western Europe – Altering strategy for group, reducing value – Slips in management’s ability to deliver • Conclusion – Share price rallied in 2010, but has halted as input cost headwinds were announced – Believe that it should be traded at a discount to its peers 86Tuesday, 9 August 2011
87. Risk & Conclusion Ratios ABInbev SABMiller Heineken Carlsberg 25 Breweries Average - 21x 20 15 23 25 10 16 15 5 0 P/E Bloomberg 87Tuesday, 9 August 2011
88. Risk & Conclusion Ratios ABInbev SABMiller Heineken Carlsberg 20 15 10 18 12 11 5 8 9 10 8 6 6 4 3 0 0 ROE ROA ROIC Capital Ratios (%) 88Tuesday, 9 August 2011
89. Investment& Conclusion Risk Recommendation! - Solid Ratios - Regional breakdown - Strong position in emerging markets (Americas & Africa) Western EU Americas 31% 29% - Share price with room to grow - Femsa acquisition synergies - All areas to deliver strong growth C&E EU Africa 14% 21% Asia Pacific 5% 89Tuesday, 9 August 2011
90. 90Tuesday, 9 August 2011
SlideShare on mobile
Follow us on Twitter Find us on Facebook Connect on LinkedIn
Learn About Us About Careers Our Blog Press Contact us Help & Support
Using SlideShare
SlideShare 101 Terms of Use Privacy Policy Copyright & DMCA Community Guidelines
Pro & more Go PRO New Business Solutions Advertise on SlideShare
Developers & API Developers Section Developers Group Engineering Blog Blog Widgets
© 2012 SlideShare Inc. All rights reserved.
RSS Feed

Risk&ConclusionProductionMargins25%50%75%100%ABInBevCarlsbergHeinekenSABMiller24%37%46%44%76%63%54%56%GrossProfit&COGSMarginsas%ofRevenuesGrossProfitMarginCOGSMargin19Average38%Tuesday,9August2011
ForceKeyDriversEffectonIndustryProfitIntensityofRivalryHighconcentration;highinnovation0SubstitutesGrowingsubstituteindustry;lowswitchingcost-BargainingpowerofSuppliersSmallsuppliersrelativetobrewers+BargainingpowerofBuyersConsolidationofindustry;distributionconnectedtoretailers-ThreatofEntryHighcapitalrequirements,economiesofscale,closeddistributionchannels,highgovernmentregulation+Overallmarket0PORTER’s5Forces20Tuesday,9August2011

•Expansionintoemergingmarkets(Chinaworld’snextbigconsumer)020406080100ChinaBrazilRussiaVietnamUSAMexicoIndiaThailandUkraineNigeria0%8%16%24%32%40%39.7%8.3%7.1%5.3%4.3%3.9%4.2%2.5%2.2%1.9%96.0020.2017.3012.9012.209.408.606.105.304.60BeerConsumptionincrementalgrowth(2010-2015F)inmhlForecastcontributiontoindustrygrowth(2011-2015)GrowthOpportunities21Plato-March2011Tuesday,9August2011« ‹ › »
/90 1
Related Documents