These slides are designed to accompany Software Engineering: A Practitioner’s Approach, 7/e (McGraw-Hill, 2009). Slides copyright 2009 by Roger Pressman. (revised and added by Seung-Hoon Na 1 Appendix 1 Introduction to UML Slide Set to accompany Software Engineering: A Practitioner’s Approach, 8/e by Roger S. Pressman Slides copyright © 1996, 2001, 2005, 2009 by Roger S. Pressman For non-profit educational use only May be reproduced ONLY for student use at the university level when used in conjunction with Software Engineering: A Practitioner's Approach, 7/e. Any other reproduction or use is prohibited without the express written permission of the author. All copyright information MUST appear if these slides are posted on a website for student use.

Welcome message from author
This document is posted to help you gain knowledge. Please leave a comment to let me know what you think about it! Share it to your friends and learn new things together.
Transcript

These slides are designed to accompany Software Engineering: A Practitioner’s Approach, 7/e (McGraw-Hill,
2009). Slides copyright 2009 by Roger Pressman. (revised and added by Seung-Hoon Na 1
Appendix 1
Introduction to UML
Slide Set to accompany
Software Engineering: A Practitioner’s Approach, 8/eby Roger S. Pressman
Slides copyright © 1996, 2001, 2005, 2009 by Roger S. Pressman
For non-profit educational use only
May be reproduced ONLY for student use at the university level when used in conjunction
with Software Engineering: A Practitioner's Approach, 7/e. Any other reproduction or use is
prohibited without the express written permission of the author.
All copyright information MUST appear if these slides are posted on a website for student
use.

UML
The Unified Modeling Language (UML)
a standard language for writing software blueprints.
used to visualize, specify, construct, and document
the artifacts of a software-intensive system
developed by Grady Booch, Jim Rumbaugh, and Ivar
Jacobson in the mid-1990s with much feedback from
the software development community.
In 1997, UML 1.0 was submitted to the Object
Management Group
The current standard is UML 2.3 and is now an ISO
standard.
These slides are designed to accompany Software Engineering: A Practitioner’s Approach, 7/e
(McGraw-Hill, 2009). Slides copyright 2009 by Roger Pressman. 2

UML
UML 2.3 provides 13 different diagrams for use
in software modeling.
What we cover here
class diagram
deployment diagram
use case diagram
Sequence diagram
Communication diagram
Activity diagram
State diagram
3

Class Diagram
Model classes, including their attributes,
operations, and their relationships and
associations with other classes
A class diagram provides a static or structural
view of a system.
It does not show the dynamic nature of the
communications between the objects of the
classes in the diagram.
These slides are designed to accompany Software Engineering: A Practitioner’s Approach, 7/e
(McGraw-Hill, 2009). Slides copyright 2009 by Roger Pressman. 4

Class Diagram
The top part contains the name of the class.
The middle section lists the attributes of the
class.
An attribute refers to something that an object of that
class knows or can provide all the time.
The third section contains the operations or
behaviors of the class.
An operation refers to what objects of the class can
do. It is usually implemented as a method of the
class.
These slides are designed to accompany Software Engineering: A Practitioner’s Approach, 7/e
(McGraw-Hill, 2009). Slides copyright 2009 by Roger Pressman. 5

Example
Thoroughbred class that models thoroughbred horses.
These slides are designed to accompany Software Engineering: A Practitioner’s Approach, 7/e
(McGraw-Hill, 2009). Slides copyright 2009 by Roger Pressman. 6

Class Diagram: Attribute &
Operation
Each attribute can have a name, a type, and a level of
visibility. The type and visibility are optional
The visibility is indicated by a preceding –, #, ~, or +,
indicating, respectively, private, protected, package, or
public visibility
You can also specify that an attribute is a static or
class attribute by underlining it
Each operation can also be displayed with a level of
visibility, parameters with names and types, and a
return type
7

Class Diagram: Abstract
class & method
An abstract class or abstract method is
indicated by the use of italics for the name in
the class diagram.
An interface is indicated by adding the phrase
“«interface»” (called a stereotype) above the
name.
An interface can also be represented graphically by a
hollow circle.
These slides are designed to accompany Software Engineering: A Practitioner’s Approach, 7/e
(McGraw-Hill, 2009). Slides copyright 2009 by Roger Pressman. 8

Class Diagram: Relationship
b/w Classes A class that is a subclass of another class is connected to it by
an arrow with a solid line for its shaft and with a triangular
hollow arrowhead. The arrow points from the subclass to the
superclass.
An arrow with a dashed line for the arrow shaft indicates
implementation of an interface. In UML, such a relationship is
called a realization.
9

Example
10
• the Thoroughbred and QuarterHorse classes are shown to be
subclasses of the Horse abstract class.
• Horse class implements or realizes the OwnedObject interface.• there is an association between OwnedObject and Person in which the
Person plays the role of owner.

Class Diagram: Association
An association between two classes means that
there is a structural relationship between them.
Associations are represented by solid lines. An
association has many optional parts. It can be
labeled, as can each of its ends, to indicate the
role of each class in the association.
Arrows on either or both ends of an association
line indicate navigability. Also, each end of the
association line can have a multiplicity value
displayed.
These slides are designed to accompany Software Engineering: A Practitioner’s Approach, 7/e
(McGraw-Hill, 2009). Slides copyright 2009 by Roger Pressman. 11

Class Diagram: Association
An association with an arrow at one end
indicates one-way navigability.
The arrow means that from one class you can easily
access the second associated class to which the
association points, but from the second class, you
cannot necessarily easily access the first class.
An association with no arrows usually indicates
a two-way association
It could just mean that the navigability is not
important and so was left off.
These slides are designed to accompany Software Engineering: A Practitioner’s Approach, 7/e
(McGraw-Hill, 2009). Slides copyright 2009 by Roger Pressman. 12

Class Diagram:
Attribute of a class
An attribute of a class is very much the same
thing as an association of the class with the
class type of the attribute.
Attribute approach: To indicate that a class has
a property called “name” of type String, one
could display that property as an attribute
Association approach: one could create a one-
way association from the Horse class to the
String class with the role of the String class
being “name.”
13

Class Diagram:
Dependency relationship A dependency relationship represents another
connection between classes and is indicated by a
dashed line (with optional arrows at the ends and with
optional labels)
One class depends on another if changes to the second class
might require changes to the first class.
An association from one class to another automatically
indicates a dependency. No dashed line is needed between
classes if there is already an association between them.
For a transient relationship, we should draw a dashed line
from the first class to the second.
E.g.) the Thoroughbred class uses the Date class whenever
its getCurrentAge() method is invoked, and so the
dependency is labeled “uses.”14

Class Diagram:
Multiplicity
The multiplicity of one end of an association means the number
of objects of that class associated with the other class.
A multiplicity is specified by a nonnegative integer or by a range
of integers.
A multiplicity specified by “0..1” means that there are 0 or 1
objects on that end of the association.
A multiplicity specified by “1..*” means one or more, and a
multiplicity specified by “0..*” or just “*“ means zero or more.
E.g.) An * was used as the multiplicity on the OwnedObject end of the
association with class Person in Figure A1.2 because a Person can
own zero or more objects
15

Class Diagram:
Aggregation & composition
An aggregation is a special kind of association
indicated by a hollow diamond on one end of the
icon.
It indicates a “whole/part” relationship, in that the
class to which the arrow points is considered a
“part” of the class at the diamond end of the
association.
A composition is an aggregation indicating strong
ownership of the parts. In a composition, the parts
live and die with the owner because they have no
role in the software system independent of the
owner.16

Class Diagram: Note
a note is represented by a box with a dog-
eared corner and is connected to other icons
by a dashed line. It can have arbitrary content
(text and graphics) and is similar to comments
in programming languages
These slides are designed to accompany Software Engineering: A Practitioner’s Approach, 7/e
(McGraw-Hill, 2009). Slides copyright 2009 by Roger Pressman. 17

These slides are designed to accompany Software Engineering: A Practitioner’s Approach, 7/e
(McGraw-Hill, 2009). Slides copyright 2009 by Roger Pressman. 18
• A College has an aggregation of Building objects
• A College has a composition of Course objects
• Note the constraint attached to the Course class

Deployment Diagram
Deployment diagram focuses on the structure
of a software system and is useful for showing
the physical distribution of a software system
among hardware platforms and execution
environments
These slides are designed to accompany Software Engineering: A Practitioner’s Approach, 7/e
(McGraw-Hill, 2009). Slides copyright 2009 by Roger Pressman. 19

Deployment Diagram:
Example
Suppose, for example, you are developing a Web-based graphics-
rendering package.
Users of your package will use their Web browser to go to your website
and enter rendering information.
Your website would render a graphical image according to the user’s
specification and send it back to the user.
Because graphics rendering can be computationally expensive, you
decide to move the rendering itself off the Web server and onto a
separate platform.
Therefore, there will be three hardware devices involved in your
system: the Web client (the users’ computer running a browser), the
computer hosting the Web server, and the computer hosting the
rendering engine.
20

Deployment Diagram:
Example
21

Deployment Diagram
Deployment diagrams can also display
execution environment nodes, which are drawn
as boxes containing the label “«execution
environment»”.
These nodes represent systems, such as
operating systems, that can host other
software.
These slides are designed to accompany Software Engineering: A Practitioner’s Approach, 7/e
(McGraw-Hill, 2009). Slides copyright 2009 by Roger Pressman. 22

Use-Case Diagram
The UML use-case diagram help you determine the
functionality and features of the software from the user’s
perspective.
E.g.) a software application for managing digital music files,
similar to Apple’s iTunes software
Download an MP3 music file and store it in the application’s library.
Capture streaming music and store it in the application’s library.
Manage the application’s library (e.g., delete songs or organize them in
playlists).
Burn a list of the songs in the library onto a CD.
Load a list of the songs in the library onto an iPod or MP3 player.
Convert a song from MP3 format to AAC format and vice versa.
23

Use-Case Diagram: Example
24

Use-Case Diagram
The stick figure represents an actor (Chapter 5)
that is associated with one category of user (or
other interaction element).
Some use cases in a system might be related
to each other.
To avoid duplication in use cases, it is usually
better to create a new use case representing
the duplicated activity, and then let the other
uses cases include this new use case as one
of their steps.
These slides are designed to accompany Software Engineering: A Practitioner’s Approach, 7/e
(McGraw-Hill, 2009). Slides copyright 2009 by Roger Pressman. 25

These slides are designed to accompany Software Engineering: A Practitioner’s Approach, 7/e
(McGraw-Hill, 2009). Slides copyright 2009 by Roger Pressman. 26

Sequence Diagram
A sequence diagram is used to show the
dynamic communications between objects
during execution of a task.
In contrast to class diagrams and deployment
diagrams, which show the static structure of a
software component,
It shows the temporal order in which messages
are sent between the objects to accomplish
that task.
It can be used to show the interactions in one
use case or in one scenario of a software
system.27

Sequence Diagram
These slides are designed to accompany Software Engineering: A Practitioner’s Approach, 7/e
(McGraw-Hill, 2009). Slides copyright 2009 by Roger Pressman. 28

Sequence Diagram
Each box in the row at the top of the diagram usually corresponds to
an object
Below each box there is a dashed line called the lifeline of the object
A sequence diagram shows method calls using horizontal arrows
from the caller to the callee,
When an object is executing a method (that is, when it has an
activation frame on the stack), you can optionally display a white bar,
called an activation bar,
The diagram can also optionally show the return from a method call
with a dashed arrow and an optional label.
• We can leave off the return arrow when a void method has been called
• A black circle with an arrow coming from it indicates a found message
whose source is unknown or irrelevant
29

Sequence Diagram
If you insist on including loops, conditionals,
and other control structures in a sequence
diagram, you can use interaction frames, which
are rectangles that surround parts of the
diagram and that are labeled with the type of
control structures they represent.
The phrases in square brackets are called
guards, which are Boolean conditions that
must be true if the action inside the interaction
frame is to continue.
These slides are designed to accompany Software Engineering: A Practitioner’s Approach, 7/e
(McGraw-Hill, 2009). Slides copyright 2009 by Roger Pressman. 30

Sequence Diagram
31
The MouseListener is sent the rectDragged message.
The MouseListener then tells the drawing to highlight all figures in the rectangle by called the
method highlightFigures(), passing the rectangle as the argument.
The method loops through all Figure objects in the Drawing object and, Figure intersects the
rectangle, the Figure is asked to highlight itself. The phrases in square brackets are called
guards, which are Boolean conditions that must be true if the action inside the interaction
frame is to continue.

Sequence Diagram
1. You can distinguish between synchronous and asynchronous
messages. Synchronous messages are shown with solid arrowheads
while asynchronous messages are shown with stick arrowheads.
2. You can show an object sending itself a message with an arrow
going out from the object, turning downward, and then pointing back to
the same object.
3. You can show object creation by drawing an arrow appropriately
labeled (for example, with a «create» label) to an object’s box. In this
case, the box will appear lower in the diagram than the boxes
corresponding to objects already in existence when the action begins.
4. You can show object destruction by a big X at the end of the object’s
lifeline. Other objects can destroy an object, in which case an arrow
points from the other object to the X. An X is also useful for indicating
that an object is no longer usable and so is ready for garbage
collection. 32

Sequence Diagram
33

Communication Diagram
The UML communication diagram (called a
“collaboration diagram” in UML 1.X) provides
another indication of the temporal order of the
communications but emphasizes the
relationships among the objects and classes
instead of the temporal order.
These slides are designed to accompany Software Engineering: A Practitioner’s Approach, 7/e
(McGraw-Hill, 2009). Slides copyright 2009 by Roger Pressman. 34

The highlight() message invokes three other messages:
setColor(), drawRect(), and drawstring(). The numbering in each label shows the
nesting as well as the sequential nature of each message. 35

Communication Diagram
The interacting objects are represented by rectangles.
Associations between objects are represented by lines
connecting the rectangles.
There is typically an incoming arrow to one object in the
diagram that starts the sequence of message passing.
That arrow is labeled with a number and a message
name.
If the incoming message is labeled with the number 1
and if it causes the receiving object to invoke other
messages on other objects, then those messages are
represented by arrows from the sender to the receiver
along an association line and are given numbers 1.1,
1.2, and so forth, in the order they are called.
36

Activity Diagrams
A UML activity diagram depicts the dynamic
behavior of a system or part of a system
through the flow of control between actions that
the system performs.
It is similar to a flowchart except that an activity
diagram can show concurrent flows.
These slides are designed to accompany Software Engineering: A Practitioner’s Approach, 7/e
(McGraw-Hill, 2009). Slides copyright 2009 by Roger Pressman. 37
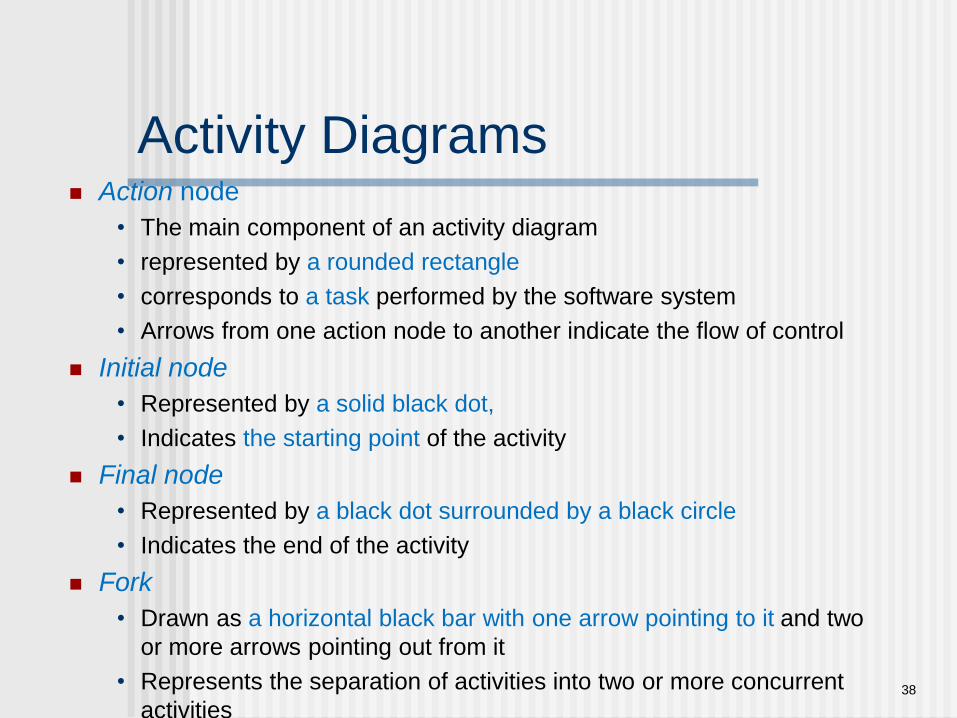
Activity Diagrams Action node
• The main component of an activity diagram
• represented by a rounded rectangle
• corresponds to a task performed by the software system
• Arrows from one action node to another indicate the flow of control
Initial node
• Represented by a solid black dot,
• Indicates the starting point of the activity
Final node
• Represented by a black dot surrounded by a black circle
• Indicates the end of the activity
Fork
• Drawn as a horizontal black bar with one arrow pointing to it and two
or more arrows pointing out from it
• Represents the separation of activities into two or more concurrent
activities38

These slides are designed to accompany Software Engineering: A Practitioner’s Approach, 7/e
(McGraw-Hill, 2009). Slides copyright 2009 by Roger Pressman. 39
join

Activity Diagrams
Join
A way of synchronizing concurrent flows of control.
represented by a horizontal black bar with two or more incoming
arrows and one outgoing arrow.
The flow of control represented by the outgoing arrow cannot
begin execution until all flows represented by incoming arrows
have been completed.
Decision node
Corresponds to a branch in the flow of control based on a
condition.
Displayed as a white triangle with an incoming arrow and two or
more outgoing arrows
These slides are designed to accompany Software Engineering: A Practitioner’s Approach, 7/e
(McGraw-Hill, 2009). Slides copyright 2009 by Roger Pressman. 40

Activity Diagrams
Swimlane diagram
To represent how the actions are divided among the
participants
Formed by dividing the diagram into strips or “lanes,”
each of which corresponds to one of the participants.
These slides are designed to accompany Software Engineering: A Practitioner’s Approach, 7/e
(McGraw-Hill, 2009). Slides copyright 2009 by Roger Pressman. 41

42
Activity diagram with swimlanes added

State Diagrams
A UML State diagram
models an object’s states, the actions that are
performed depending on those states, and the
transitions between the states of the object.
Example: The state diagram for a part of a
Java compiler
The input to the compiler is a text file as a long string
of characters
The compiler reads characters one at a time and
from them determines the structure of the program
43

These slides are designed to accompany Software Engineering: A Practitioner’s Approach, 7/e
(McGraw-Hill, 2009). Slides copyright 2009 by Roger Pressman. 44
State diagram

State Diagrams
Activity state
The state in which an object performs some activity,
called a do-activity,
Non-activity state (normal case)
• when an object is in a state, it usually does nothing but
sit and wait for a trigger event to occur.
Represented by the bottom half of the state’s
rounded rectangle the phrase “do/” followed by the
activity that is to be done while in that state.
45

46

Object Constraint Language
Often, graphical representations are not enough
The Object Constraint Language (OCL)
Complements UML by allowing you to use a formal grammar and
syntax to construct unambiguous statements about various design
model elements
OCL is constructed in four parts
(1) a context that defines the limited situation in which the statement
is valid,
(2) a property that represents some characteristics of the context
(3) an operation (e.g., arithmetic, set-oriented) that manipulates or
qualifies a property
(4) keywords (e.g., if, then, else, and, or, not, implies) that are used
to specify conditional expressions.47

OCL: Example
48
customerself.authorizationAuthority ‘yes’
authorization can only occur if the customer is authorized to approve
the cost of the job.

Object Constraint Language
As the design model is created, there are often
instances in which pre- or postconditions must
be satisfied prior to completion of some action
specified by the design.
OCL provides a powerful tool for specifying
pre- and postconditions in a formal manner.
These slides are designed to accompany Software Engineering: A Practitioner’s Approach, 7/e
(McGraw-Hill, 2009). Slides copyright 2009 by Roger Pressman. 49

OCL: Example
These slides are designed to accompany Software Engineering: A Practitioner’s Approach, 7/e
(McGraw-Hill, 2009). Slides copyright 2009 by Roger Pressman. 50
context PrintJob::validate(upperCostBound : Integer, custDeliveryReq : Integer)pre: upperCostBound > 0 and custDeliveryReq > 0 and self.jobAuthorization ‘no’
post: if self.totalJobCost < upperCostBound and self.deliveryDate < custDeliveryReqthen
self.jobAuthorization = ‘yes’endif
the customer provides an upper cost bound for the print job and
a “drop-dead” delivery date at the same time as other print job
characteristics are specified.
If cost and delivery estimates exceed these bounds, the job is not
submitted and the customer must be notified.
Related Documents