Slide 2.4- 1 Copyright © 2007 Pearson Education, Inc. Publishing as Pearson Addison-Wesley

Slide 2.4- 1 Copyright © 2007 Pearson Education, Inc. Publishing as Pearson Addison-Wesley.
Dec 28, 2015
Welcome message from author
This document is posted to help you gain knowledge. Please leave a comment to let me know what you think about it! Share it to your friends and learn new things together.
Transcript
Slide 2.4- 1 Copyright © 2007 Pearson Education, Inc. Publishing as Pearson Addison-Wesley

Copyright © 2008 Pearson Education, Inc. Publishing as Pearson Addison-Wesley
OBJECTIVES
Relations and Functions
Learn the definition of a relation.
Learn the definition of a function and learn how to determine which relations are functions.
Learn to use functional notation and find function values.
Learn to find the domain of a function.
SECTION 2.4
1
2
3
4

Copyright © 2008 Pearson Education, Inc. Publishing as Pearson Addison-Wesley
OBJECTIVES
Relations and Functions
Learn to identify the graph of a function.
Learn to find the average rate of change of a function.
Learn to solve applied problems by using functions.
SECTION 2.4
5
6
7
Slide 2.4- 4 Copyright © 2007 Pearson Education, Inc. Publishing as Pearson Addison-Wesley
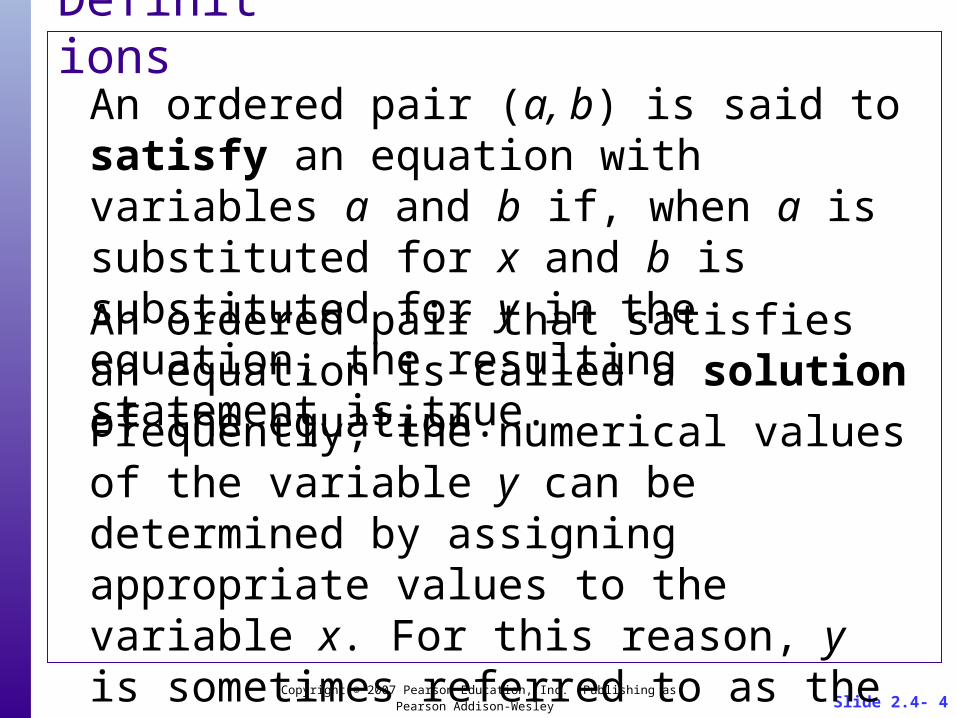
DefinitionsAn ordered pair (a, b) is said to satisfy an equation with variables a and b if, when a is substituted for x and b is substituted for y in the equation, the resulting statement is true.
An ordered pair that satisfies an equation is called a solution of the equation.
Frequently, the numerical values of the variable y can be determined by assigning appropriate values to the variable x. For this reason, y is sometimes referred to as the dependent variable and x as the independent variable.
Slide 2.4- 5 Copyright © 2007 Pearson Education, Inc. Publishing as Pearson Addison-Wesley
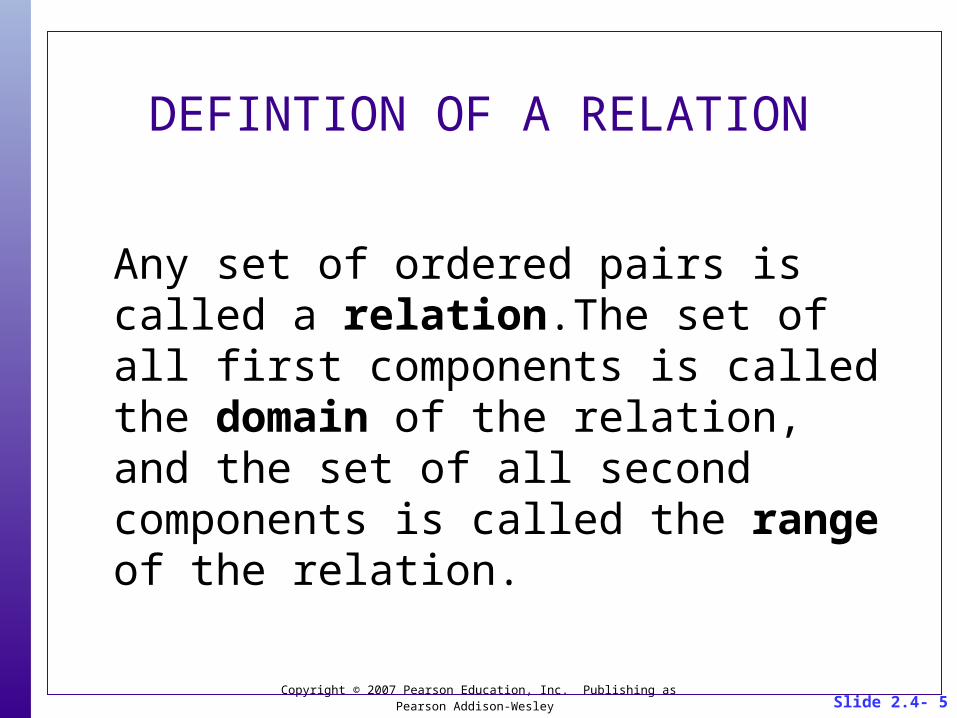
DEFINTION OF A RELATION
Any set of ordered pairs is called a relation.The set of all first components is called the domain of the relation, and the set of all second components is called the range of the relation.
Slide 2.4- 6 Copyright © 2007 Pearson Education, Inc. Publishing as Pearson Addison-Wesley
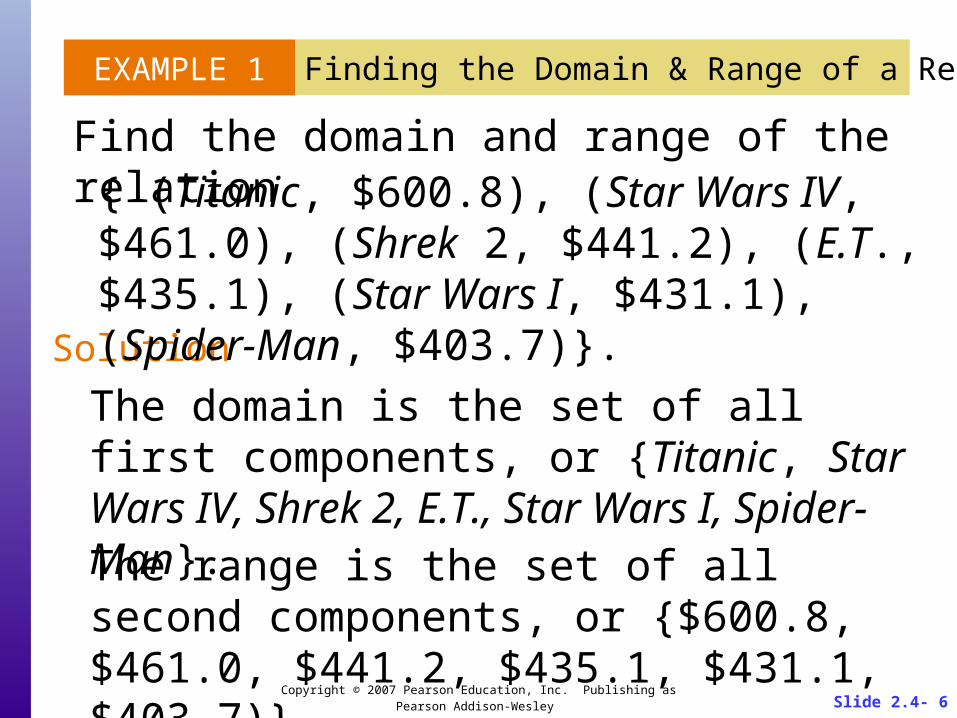
EXAMPLE 1 Finding the Domain & Range of a Relation
Find the domain and range of the relation
Solution
The domain is the set of all first components, or {Titanic, Star Wars IV, Shrek 2, E.T., Star Wars I, Spider-Man}.
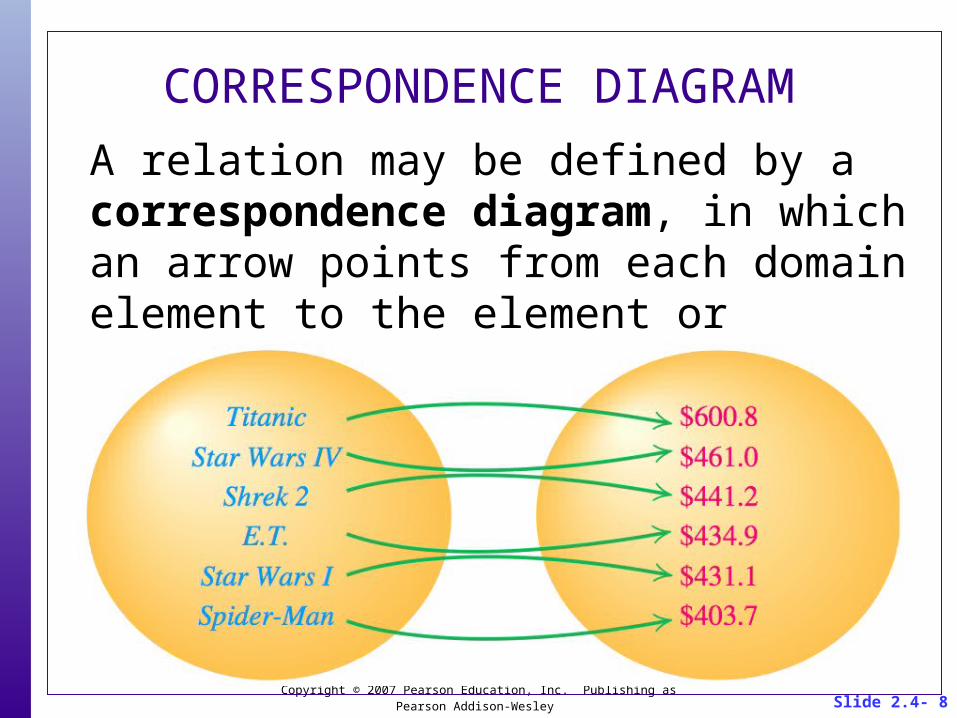
{ (Titanic, $600.8), (Star Wars IV, $461.0), (Shrek 2, $441.2), (E.T., $435.1), (Star Wars I, $431.1), (Spider-Man, $403.7)}.
The range is the set of all second components, or {$600.8, $461.0, $441.2, $435.1, $431.1, $403.7)}.
Slide 2.4- 7 Copyright © 2007 Pearson Education, Inc. Publishing as Pearson Addison-Wesley
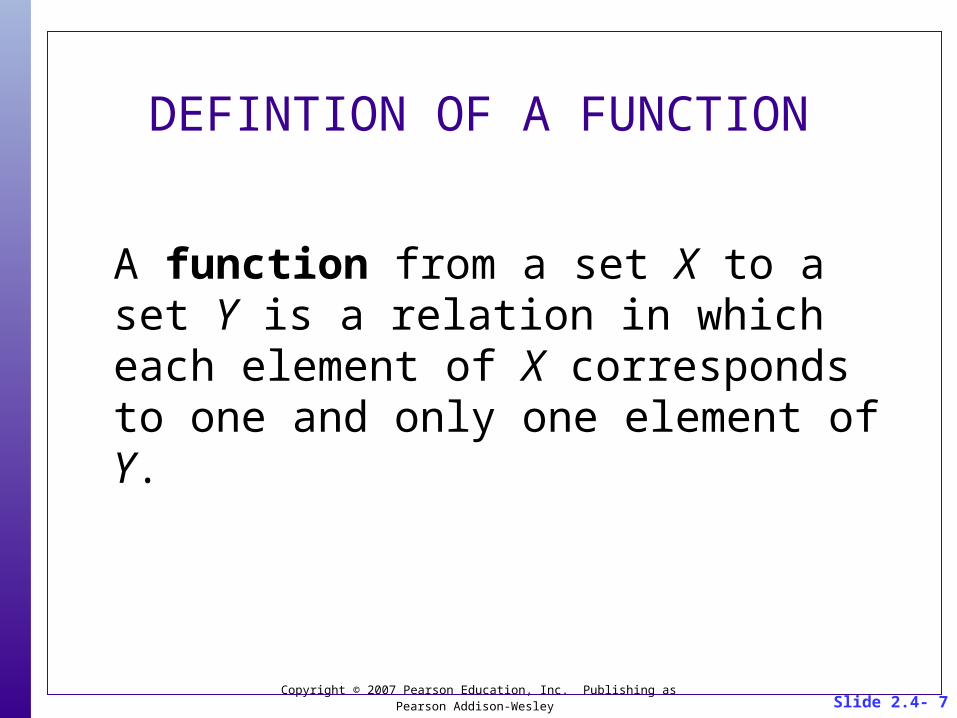
DEFINTION OF A FUNCTION
A function from a set X to a set Y is a relation in which each element of X corresponds to one and only one element of Y.
Slide 2.4- 8 Copyright © 2007 Pearson Education, Inc. Publishing as Pearson Addison-Wesley
CORRESPONDENCE DIAGRAMA relation may be defined by a correspondence diagram, in which an arrow points from each domain element to the element or elements in the range that correspond to it.
Slide 2.4- 9 Copyright © 2007 Pearson Education, Inc. Publishing as Pearson Addison-Wesley
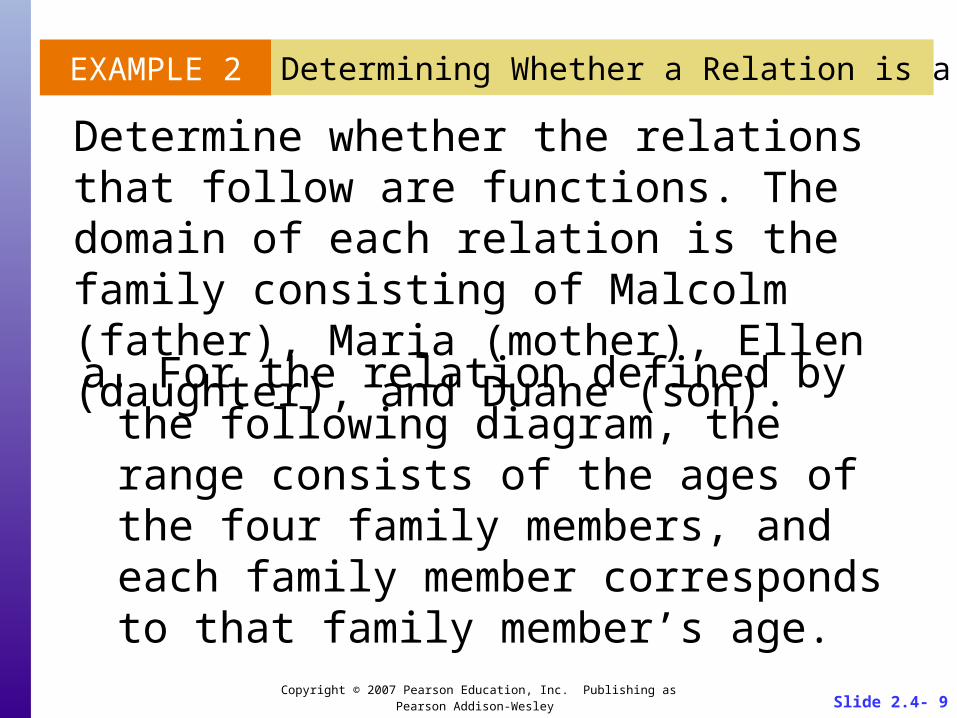
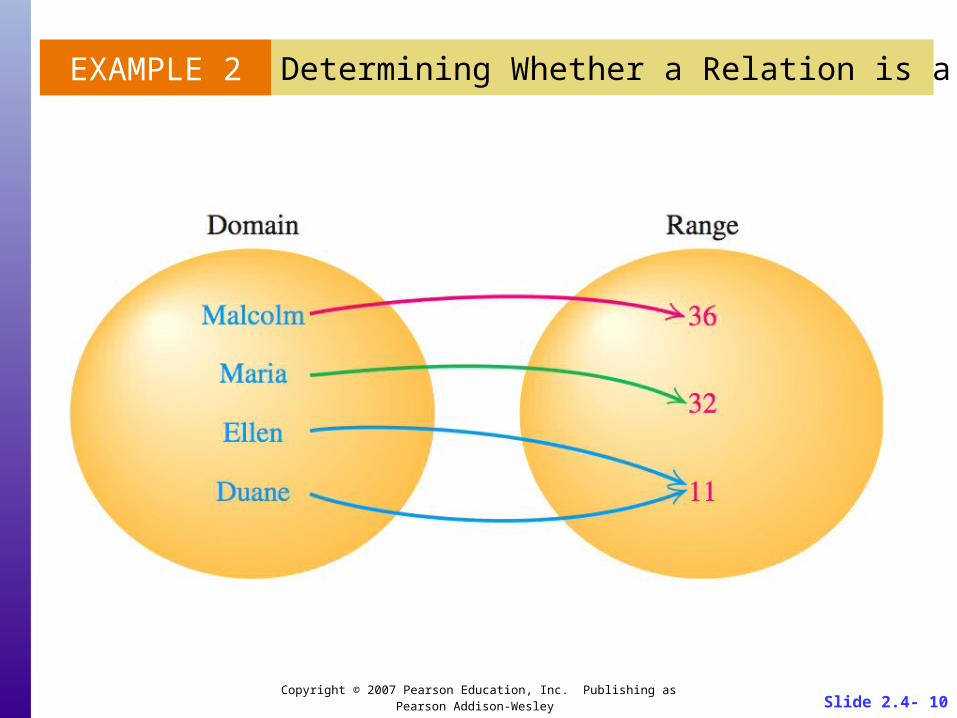
EXAMPLE 2 Determining Whether a Relation is a Function
Determine whether the relations that follow are functions. The domain of each relation is the family consisting of Malcolm (father), Maria (mother), Ellen (daughter), and Duane (son).
a. For the relation defined by the following diagram, the range consists of the ages of the four family members, and each family member corresponds to that family member’s age.
Slide 2.4- 10 Copyright © 2007 Pearson Education, Inc. Publishing as Pearson Addison-Wesley
EXAMPLE 2 Determining Whether a Relation is a Function
Slide 2.4- 11 Copyright © 2007 Pearson Education, Inc. Publishing as Pearson Addison-Wesley
EXAMPLE 2 Determining Whether a Relation is a Function
Solution
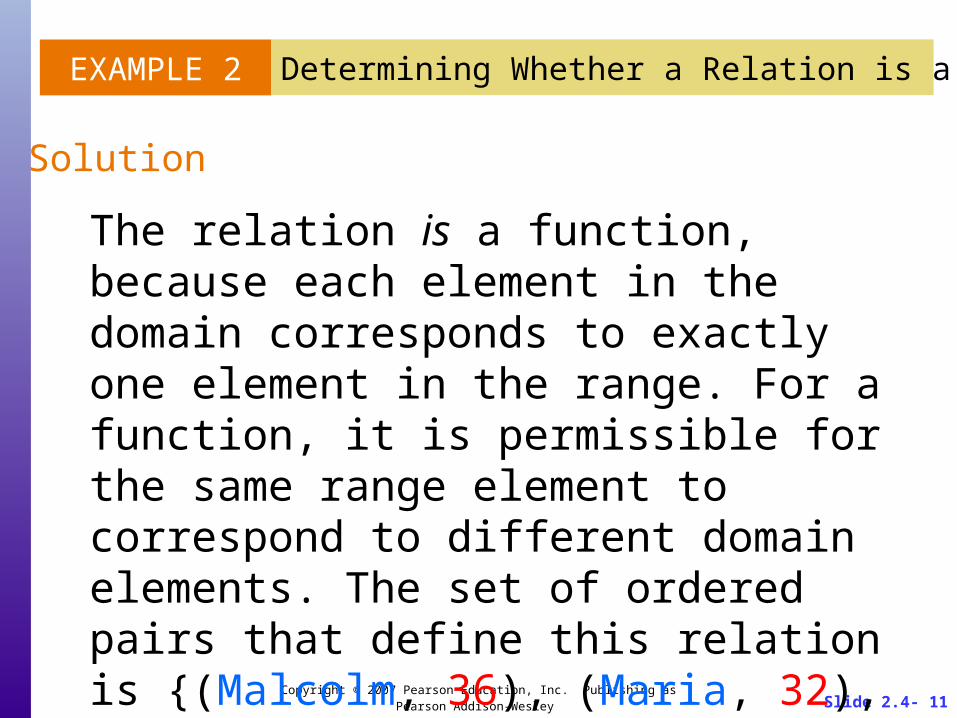
The relation is a function, because each element in the domain corresponds to exactly one element in the range. For a function, it is permissible for the same range element to correspond to different domain elements. The set of ordered pairs that define this relation is {(Malcolm, 36), (Maria, 32), (Ellen, 11), (Duane, 11)}.
Slide 2.4- 12 Copyright © 2007 Pearson Education, Inc. Publishing as Pearson Addison-Wesley
EXAMPLE 2 Determining Whether a Relation is a Function
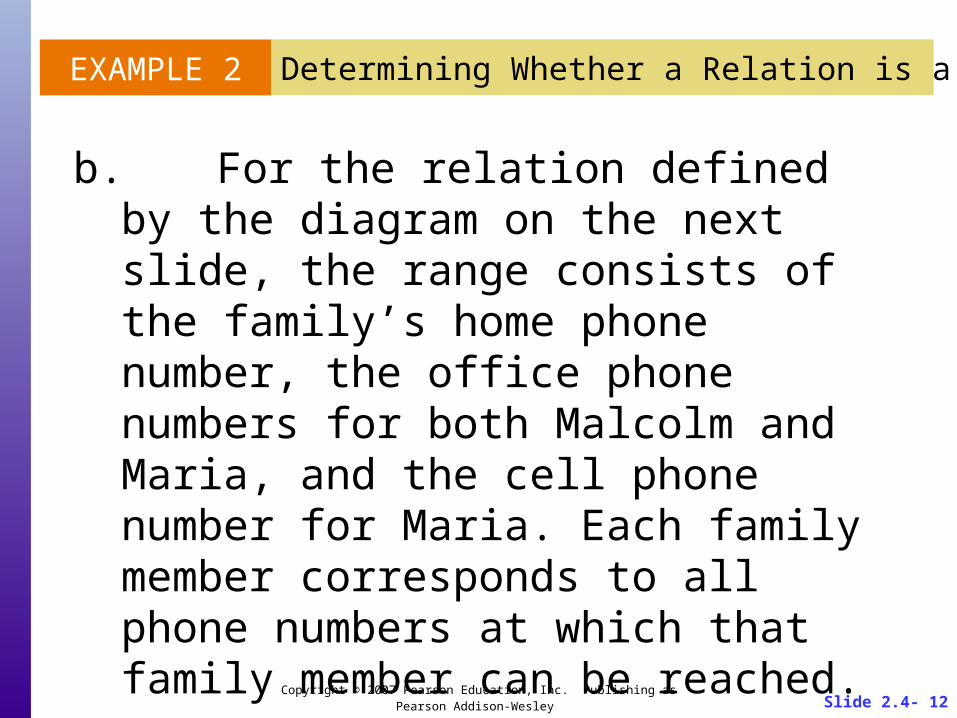
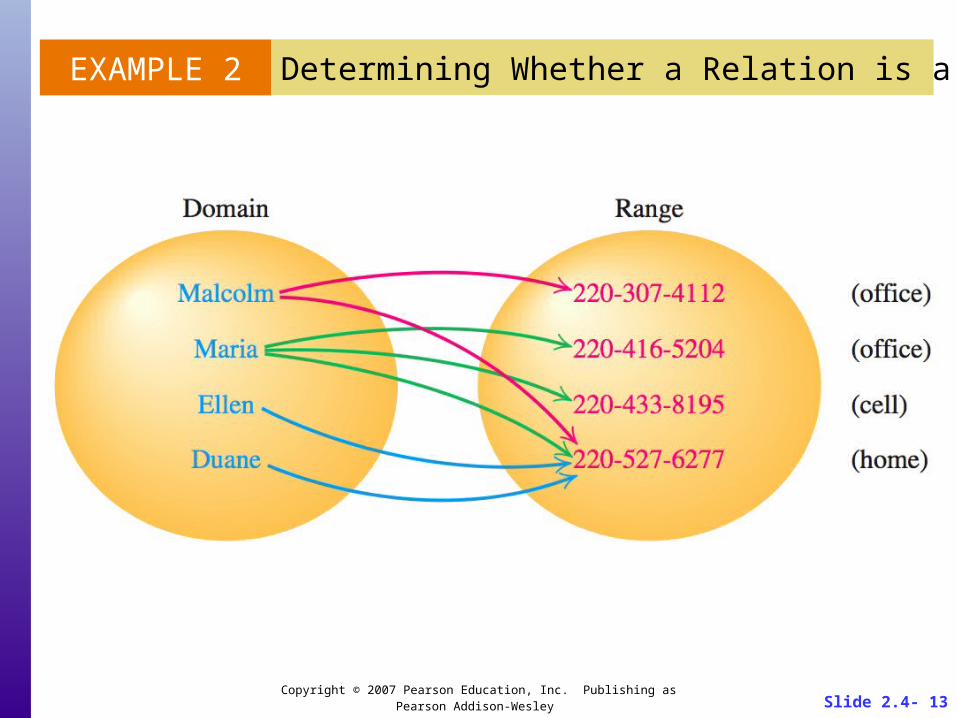
b. For the relation defined by the diagram on the next slide, the range consists of the family’s home phone number, the office phone numbers for both Malcolm and Maria, and the cell phone number for Maria. Each family member corresponds to all phone numbers at which that family member can be reached.
Slide 2.4- 13 Copyright © 2007 Pearson Education, Inc. Publishing as Pearson Addison-Wesley
EXAMPLE 2 Determining Whether a Relation is a Function

Slide 2.4- 14 Copyright © 2007 Pearson Education, Inc. Publishing as Pearson Addison-Wesley
EXAMPLE 2 Determining Whether a Relation is a Function
The relation is not a function, because more than one range element corresponds to the same domain element. For example, both an office phone number and a home phone number correspond to Malcolm. The set of ordered pairs that define this relation is {(Malcolm, 220-307-4112), (Malcolm, 220-527-6277 ), (Maria, 220-527-6277), (Maria, 220-416-5204), (Maria, 220-433-8195), (Ellen, 220-527-6277), (Duane, 220-527-6277)}.
Solution
Slide 2.4- 15 Copyright © 2007 Pearson Education, Inc. Publishing as Pearson Addison-Wesley
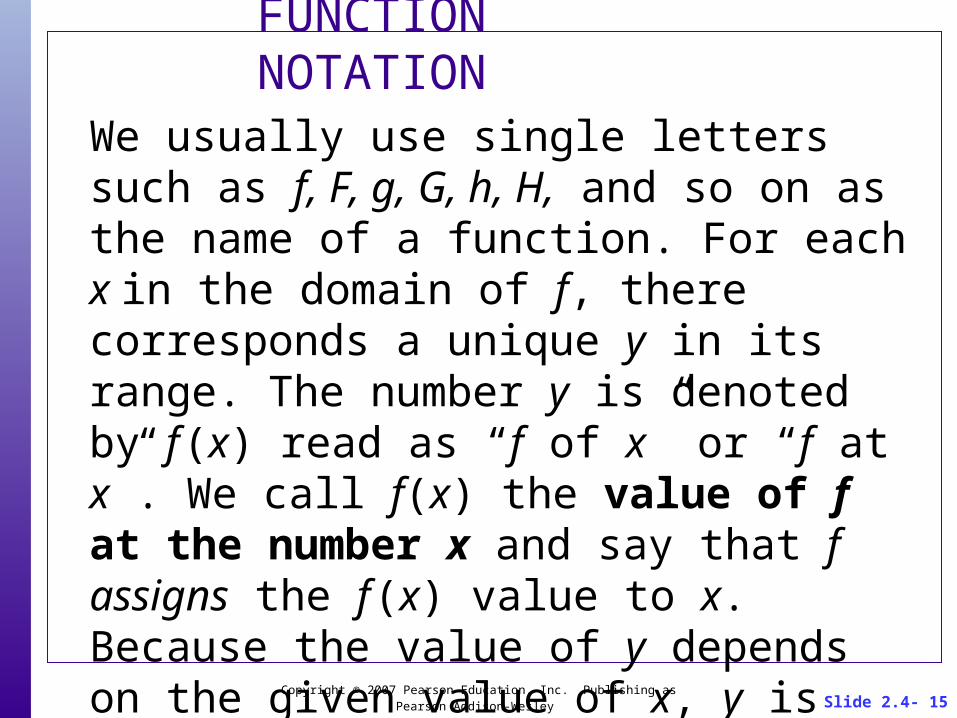
FUNCTION NOTATIONWe usually use single letters such as f, F, g, G, h, H, and so on as the name of a function. For each x in the domain of f, there corresponds a unique y in its range. The number y is denoted by f (x) read as “f of x” or “f at x”. We call f(x) the value of f at the number x and say that f assigns the f (x) value to x. Because the value of y depends on the given value of x, y is called the dependent variable and x is called the independent variable.

Slide 2.4- 16 Copyright © 2007 Pearson Education, Inc. Publishing as Pearson Addison-Wesley
FUNCTION NOTATION
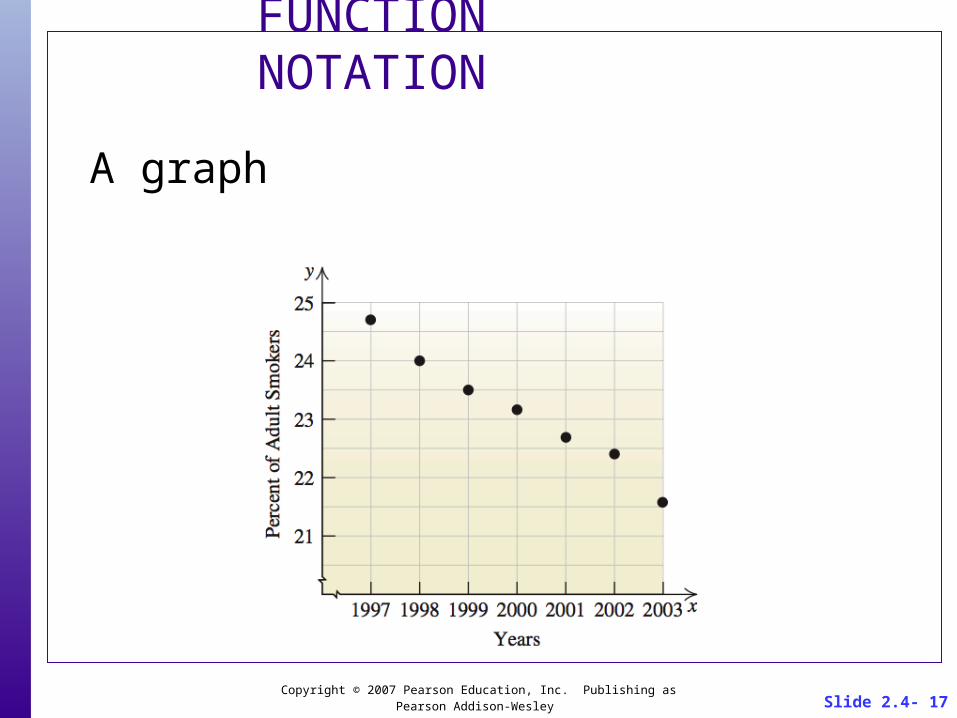
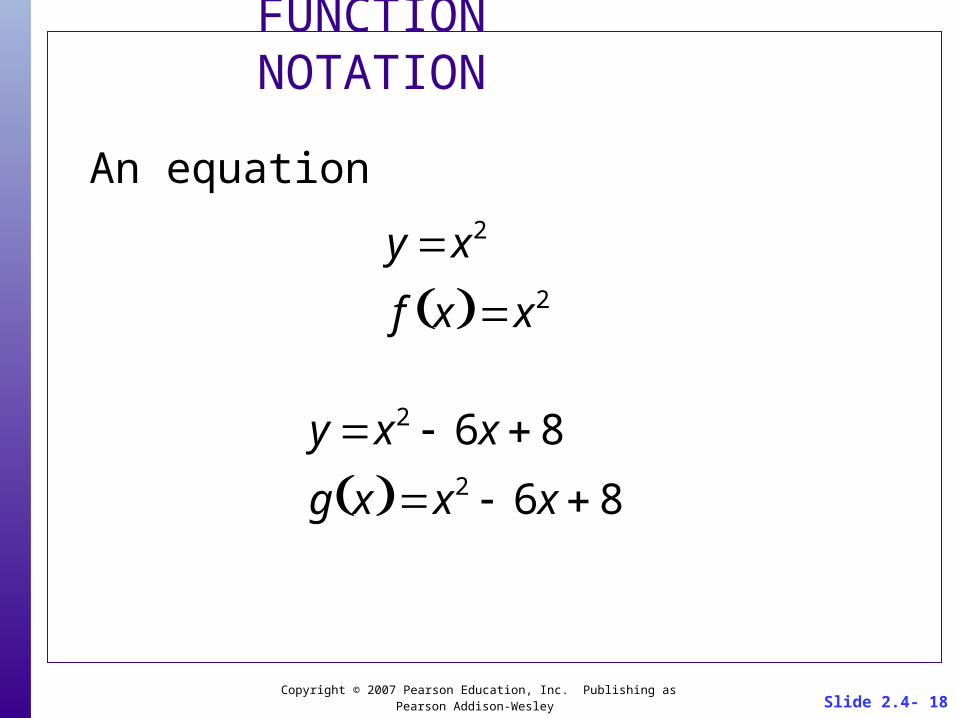
We can describe functions in many ways:
A table
Slide 2.4- 17 Copyright © 2007 Pearson Education, Inc. Publishing as Pearson Addison-Wesley
FUNCTION NOTATION
A graph
Slide 2.4- 18 Copyright © 2007 Pearson Education, Inc. Publishing as Pearson Addison-Wesley
FUNCTION NOTATION
An equation
y x2
f x x2
y x2 6x 8
g x x2 6x 8
Slide 2.4- 19 Copyright © 2007 Pearson Education, Inc. Publishing as Pearson Addison-Wesley
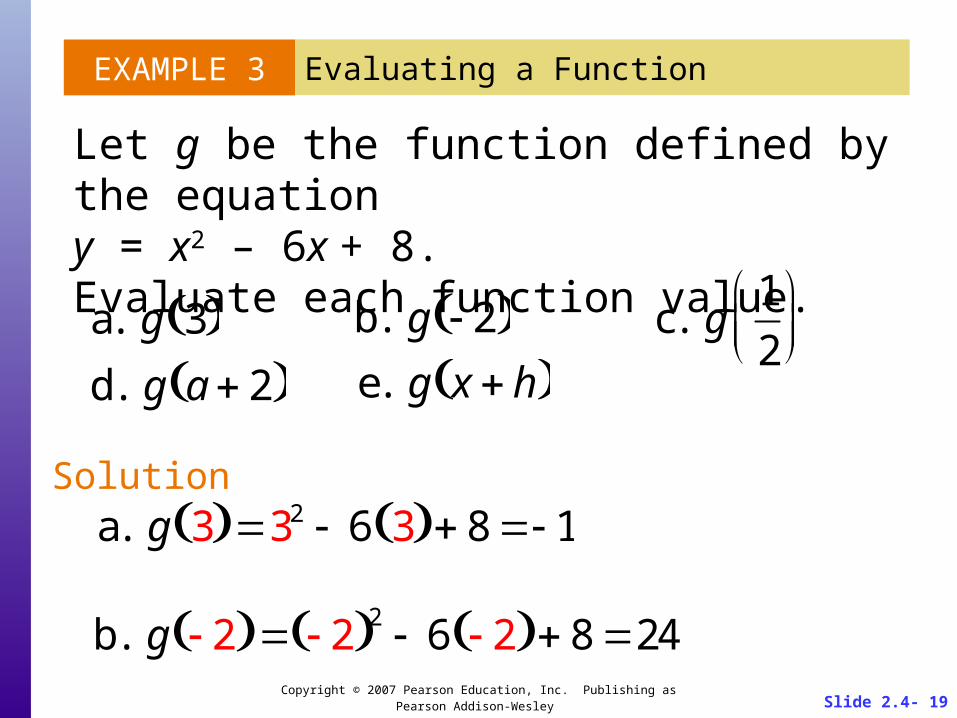
EXAMPLE 3 Evaluating a Function
Solution
Let g be the function defined by the equationy = x2 – 6x + 8.Evaluate each function value.
a. g 3 b. g 2 c. g1
2
d. g a 2 e. g x h
a. g 3 32 6 3 8 1
b. g 2 2 2 6 2 8 24

Slide 2.4- 20 Copyright © 2007 Pearson Education, Inc. Publishing as Pearson Addison-Wesley
EXAMPLE 3 Evaluating a Function
Solution continued
c. g1
2
1
2
2
61
2
8
21
4
d. g a 2 a 2 2 6 a 2 8
a2 4a 4 6a 12 8
a2 2a
e. g x h x h 2 6 x h 8
x2 2xh h2 6x 6h 8

Slide 2.4- 21 Copyright © 2007 Pearson Education, Inc. Publishing as Pearson Addison-Wesley
EXAMPLE 4Determining Whether an Equation Defines a Function
Determine whether each equation determines y as a function of x. a. 6x2 – x – 2 b. y2 – x2 = 4
One value of y corresponds to one value of x so it defines y as a function of x.
Solution6x2 3y 12
6x2 3y 3y 12 12 3y 12
6x2 12 3y
2x2 4 y
a.

Slide 2.4- 22 Copyright © 2007 Pearson Education, Inc. Publishing as Pearson Addison-Wesley
EXAMPLE 4Determining Whether an Equation Defines a Function
Solution continued
b. y2 – x2 = 4
Two values of y correspond to the same value of x so it does not define y as a function of x.
y2 x2 4
y2 x2 x2 4 x2
y2 x2 4
y x2 4

Slide 2.4- 23 Copyright © 2007 Pearson Education, Inc. Publishing as Pearson Addison-Wesley
AGREEMENT ON DOMAIN
If the domain of a function that is defined by an equation is not explicitly specified, then we take the domain of the function to be the largest set of real numbers that result in real numbers as outputs.

Slide 2.4- 24 Copyright © 2007 Pearson Education, Inc. Publishing as Pearson Addison-Wesley
EXAMPLE 5 Finding the Domain of a Function
Find the domain of each function.
a. f x 1
1 x2
Solution
a. f is not defined when the denominator is 0.
b. g x x
c. h x 1
x 1d. P t 2t 1
1 x2 0
x 1Domain: {x|x ≠ –1 and x ≠ 1}
° , 1 U 1,1 U 1, °
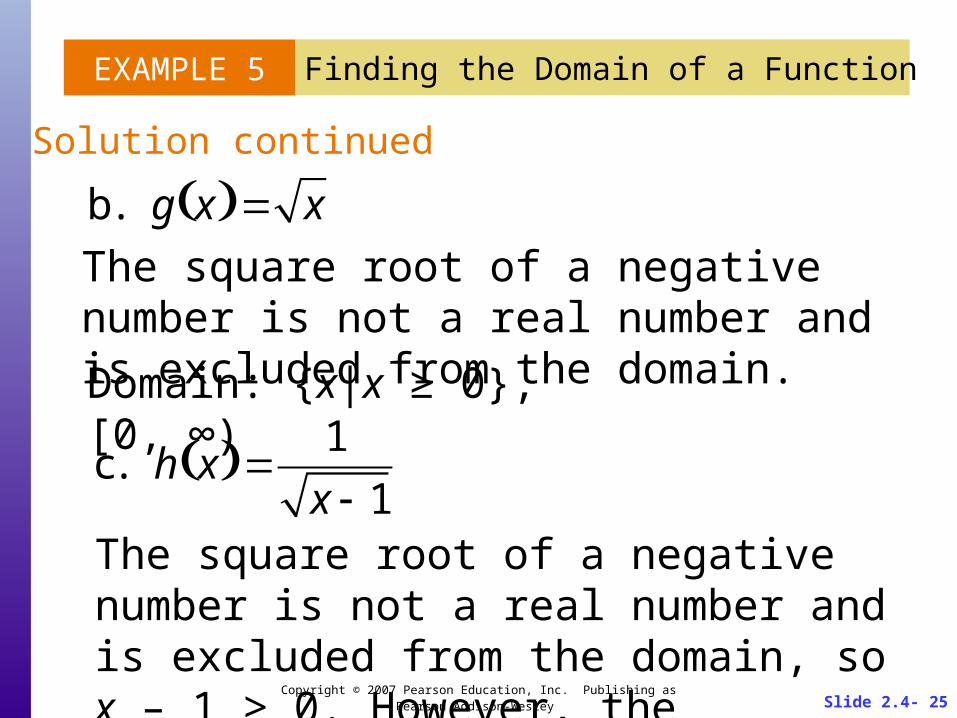
Slide 2.4- 25 Copyright © 2007 Pearson Education, Inc. Publishing as Pearson Addison-Wesley
EXAMPLE 5 Finding the Domain of a Function
Solution continued
The square root of a negative number is not a real number and is excluded from the domain.
b. g x x
c. h x 1
x 1
Domain: {x|x ≥ 0}, [0, ∞)
The square root of a negative number is not a real number and is excluded from the domain, so x – 1 ≥ 0. However, the denominator ≠ 0.

Slide 2.4- 26 Copyright © 2007 Pearson Education, Inc. Publishing as Pearson Addison-Wesley
EXAMPLE 5 Finding the Domain of a Function
Solution continued
So x – 1 > 0 so x > 1.
d. P t 2t 1
Domain: {x|x > 1}, or (1, ∞)
Any real number substituted for t yields a unique real number.
Domain: {t|t is a real number}, or (–∞, ∞)
Slide 2.4- 27 Copyright © 2007 Pearson Education, Inc. Publishing as Pearson Addison-Wesley
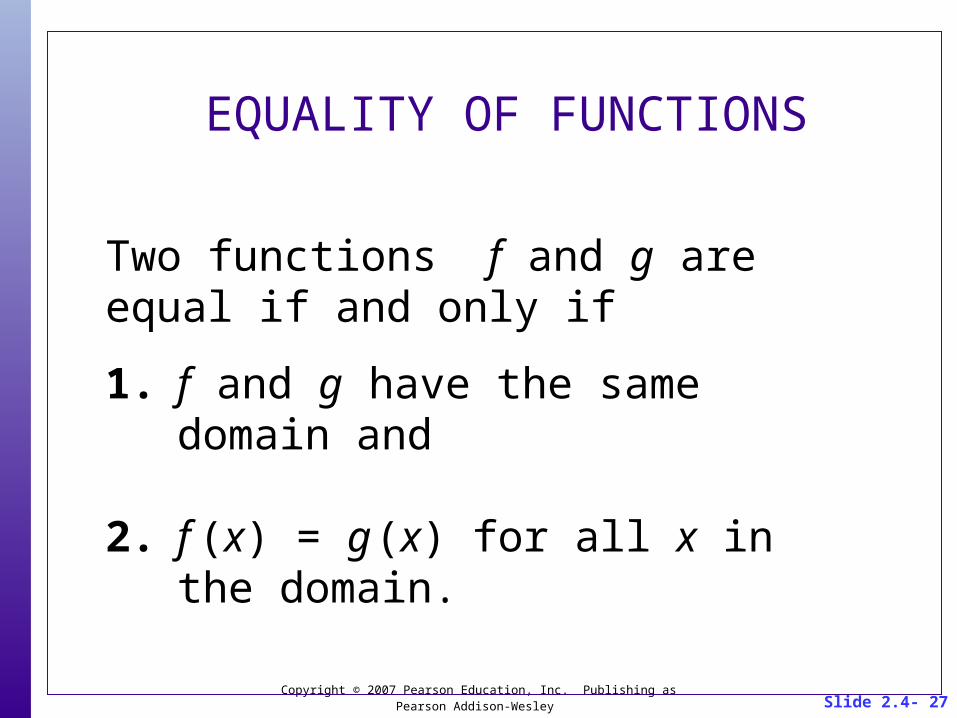
EQUALITY OF FUNCTIONS
Two functions f and g are equal if and only if
1. f and g have the same domain and
2. f (x) = g (x) for all x in the domain.
Slide 2.4- 28 Copyright © 2007 Pearson Education, Inc. Publishing as Pearson Addison-Wesley
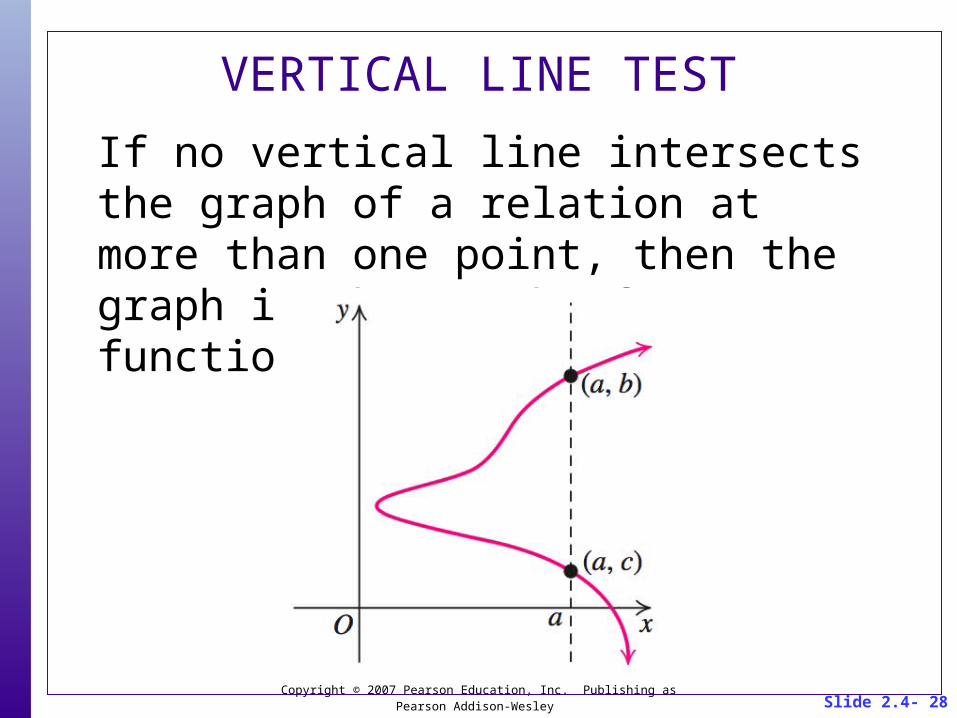
VERTICAL LINE TEST
If no vertical line intersects the graph of a relation at more than one point, then the graph is the graph of a function.

Slide 2.4- 29 Copyright © 2007 Pearson Education, Inc. Publishing as Pearson Addison-Wesley
EXAMPLE 6
Use the vertical-line test to determine which graphs are graphs of functions.
Identifying the Graph of a Function
Solution
Not a function Does not pass the vertical line test

Slide 2.4- 30 Copyright © 2007 Pearson Education, Inc. Publishing as Pearson Addison-Wesley
EXAMPLE 6
Use the vertical-line test to determine which graphs are graphs of functions.
Identifying the Graph of a Function
Solution
Not a function Does not pass the vertical line test

Slide 2.4- 31 Copyright © 2007 Pearson Education, Inc. Publishing as Pearson Addison-Wesley
EXAMPLE 6
Use the vertical-line test to determine which graphs are graphs of functions.
Identifying the Graph of a Function
Solution
Is a functionDoes pass the vertical line test

Slide 2.4- 32 Copyright © 2007 Pearson Education, Inc. Publishing as Pearson Addison-Wesley
EXAMPLE 6
Use the vertical-line test to determine which graphs are graphs of functions.
Identifying the Graph of a Function
Solution
Is a functionDoes pass the vertical line test
Slide 2.4- 33 Copyright © 2007 Pearson Education, Inc. Publishing as Pearson Addison-Wesley
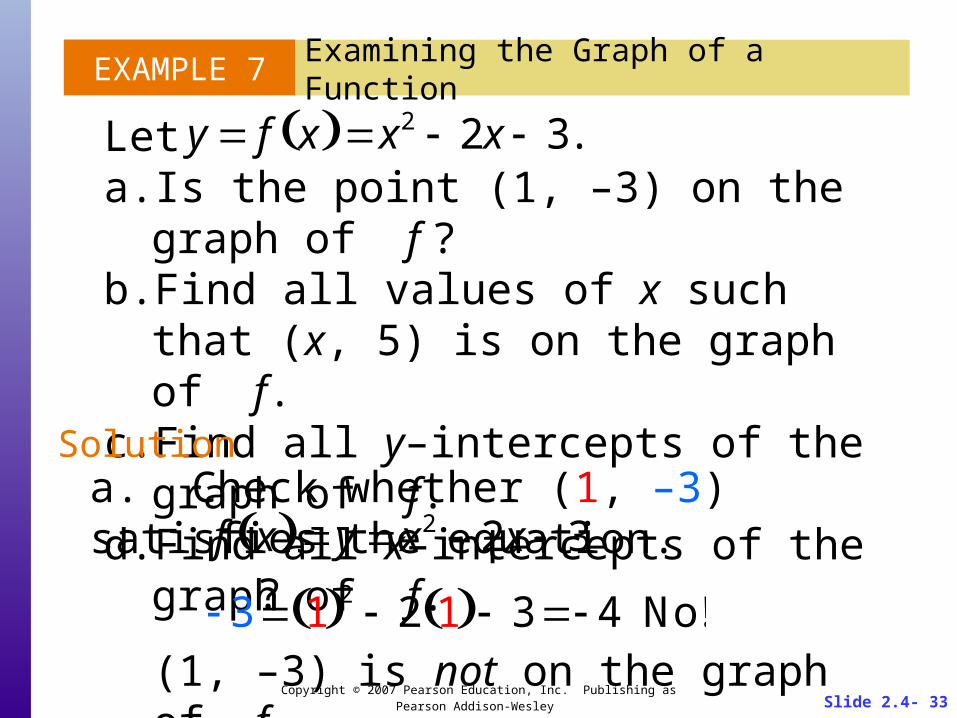
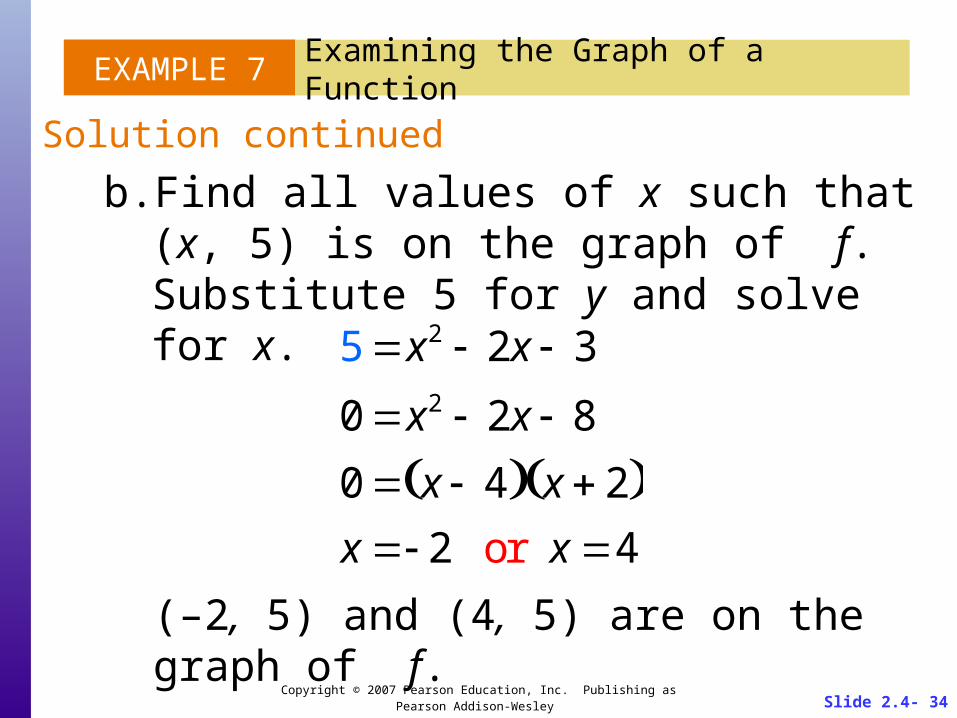
EXAMPLE 7
Leta. Is the point (1, –3) on the graph of f ?b. Find all values of x such that (x, 5) is on the
graph of f.c. Find all y–intercepts of the graph of f.d. Find all x–intercepts of the graph of f.
Examining the Graph of a Function
y f x x2 2x 3.
Solutiona. Check whether (1, –3) satisfies the equation.
(1, –3) is not on the graph of f.
f x y x2 2x 3
3 1 2 2 1 3 4 No!?
Slide 2.4- 34 Copyright © 2007 Pearson Education, Inc. Publishing as Pearson Addison-Wesley
EXAMPLE 7
b. Find all values of x such that (x, 5) is on the graph of f.Substitute 5 for y and solve for x.
Examining the Graph of a Function
Solution continued
5 x2 2x 3
0 x2 2x 8
0 x 4 x 2 x 2 or x 4
(–2, 5) and (4, 5) are on the graph of f.

Slide 2.4- 35 Copyright © 2007 Pearson Education, Inc. Publishing as Pearson Addison-Wesley
EXAMPLE 7
c. Find all y–intercepts of the graph of f. Substitute 0 for x and solve for y.
Examining the Graph of a Function
Solution continued
y x2 2x 3
y 02 2 0 3
y 3
The only y-intercept is –3.

Slide 2.4- 36 Copyright © 2007 Pearson Education, Inc. Publishing as Pearson Addison-Wesley
EXAMPLE 7
d. Find all x–intercepts of the graph of f.Substitute 0 for y and solve for x.
Examining the Graph of a Function
Solution continued
y x2 2x 3
0 x2 2x 3
0 x 1 x 3 x 1 or x 3
The x–intercepts of the graph of f are –1 and 3.

Slide 2.4- 37 Copyright © 2007 Pearson Education, Inc. Publishing as Pearson Addison-Wesley
THE AVERAGE RATE OF CHANGE OF A FUNCTION
f b f a b a
, a b.
Let (a, f (a)) and (b, f (b)) be points on the graph of a function f. Then the average rate of change of f (x) as x changes from a to b is defined by

Slide 2.4- 38 Copyright © 2007 Pearson Education, Inc. Publishing as Pearson Addison-Wesley
EXAMPLE 8
Find the average rate of change off (x) = 2x2 – 3 as x changesa. from x = 2 to x = 4;b. from x = 3 to x = 6;c. from x = c to x = c + h, h ≠ 0.
Finding the Average Rate of Change
f 4 f 2
4 2
2 4 2
– 3 2 2 2– 3
4 212
Solution
Average rateof change

Slide 2.4- 39 Copyright © 2007 Pearson Education, Inc. Publishing as Pearson Addison-Wesley
EXAMPLE 8
b. from x = 3 to x = 6;
Finding the Average Rate of Change
Solution continued
f 6 f 3
6 3
2 6 2
– 3 2 3 2– 3
6 3
69 15
3
54
318
Average rate of change

Slide 2.4- 40 Copyright © 2007 Pearson Education, Inc. Publishing as Pearson Addison-Wesley
EXAMPLE 8
c. from x = c to x = c + h, h ≠ 0.
Finding the Average Rate of Change
Solution cont’
Average rate of change
f c h f c
c h c
2 c h 2
– 3 2 c 2– 3
c h c
2 c2 2ch h2 – 3 2c2 – 3
h
4ch 2h2
h
h 4c 2h h
4c 2h

Slide 2.4- 41 Copyright © 2007 Pearson Education, Inc. Publishing as Pearson Addison-Wesley
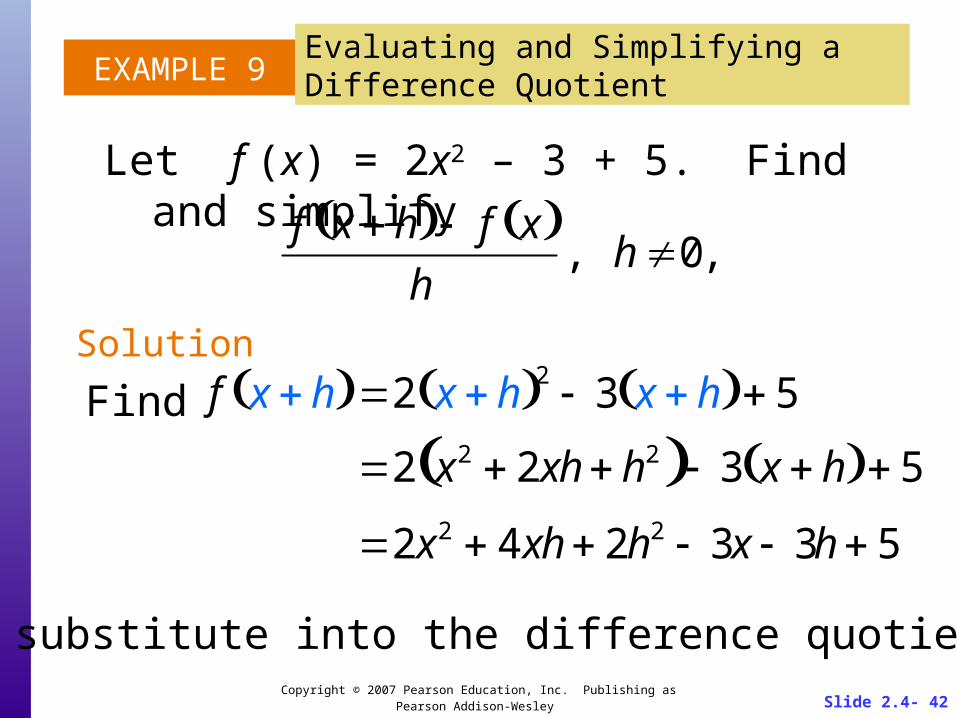
DIFFERENCE QUOTIENT
f x h f x h
, h 0,
For a function f , the quantity
is called the difference quotient.
Slide 2.4- 42 Copyright © 2007 Pearson Education, Inc. Publishing as Pearson Addison-Wesley
EXAMPLE 9
Let f (x) = 2x2 – 3 + 5. Find and simplify
Evaluating and Simplifying a Difference Quotient
Solutionf x h 2 x h 2 3 x h 5
2 x2 2xh h2 3 x h 5
2x2 4xh 2h2 3x 3h 5
Find
f x h f x h
, h 0,
Now substitute into the difference quotient.

Slide 2.4- 43 Copyright © 2007 Pearson Education, Inc. Publishing as Pearson Addison-Wesley
EXAMPLE 9Evaluating and Simplifying a Difference Quotient
Solution continued
2x2 4xh 2h2 3x 3h 5 2x2 3x 5
h
2x2 4xh 2h2 3x 3h 5 2x2 3x 5
h
4xh 3h 2h2
h
h 4x 3 2h h
4x 3 2h

Slide 2.4- 44 Copyright © 2007 Pearson Education, Inc. Publishing as Pearson Addison-Wesley
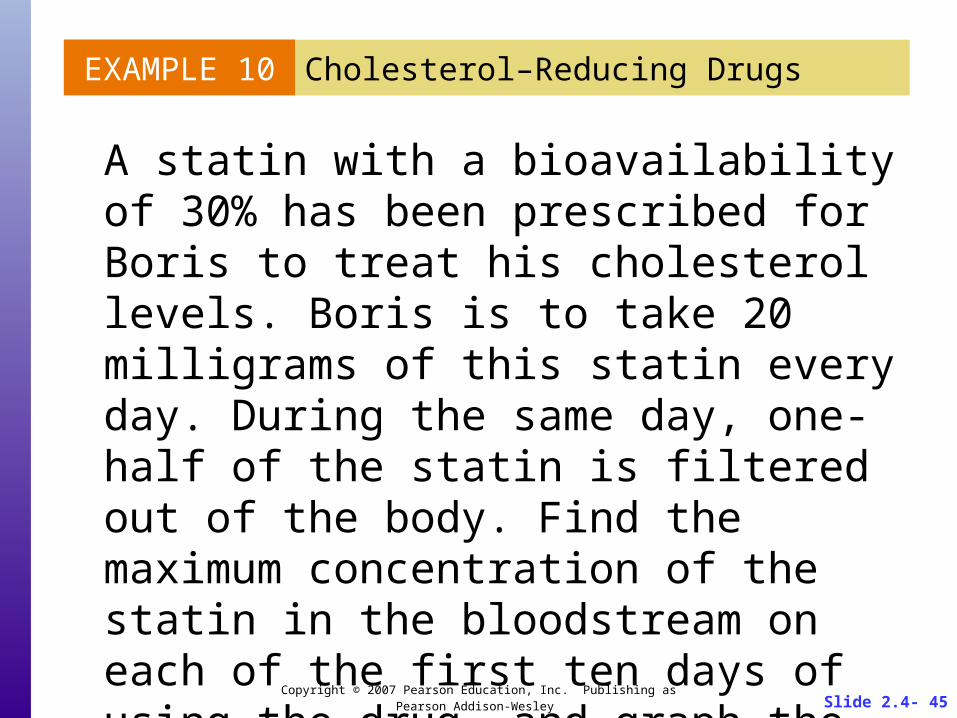
EXAMPLE 10
Many drugs used to lower high blood cholesterol levels are called statins and are very popular and widely prescribed. These drugs, along with proper diet and exercise, help prevent heart attacks and strokes. Recall from the introduction to this section that bioavailability is the amount of a drug you have ingested that makes it into your bloodstream.
Cholesterol–Reducing Drugs
Slide 2.4- 45 Copyright © 2007 Pearson Education, Inc. Publishing as Pearson Addison-Wesley
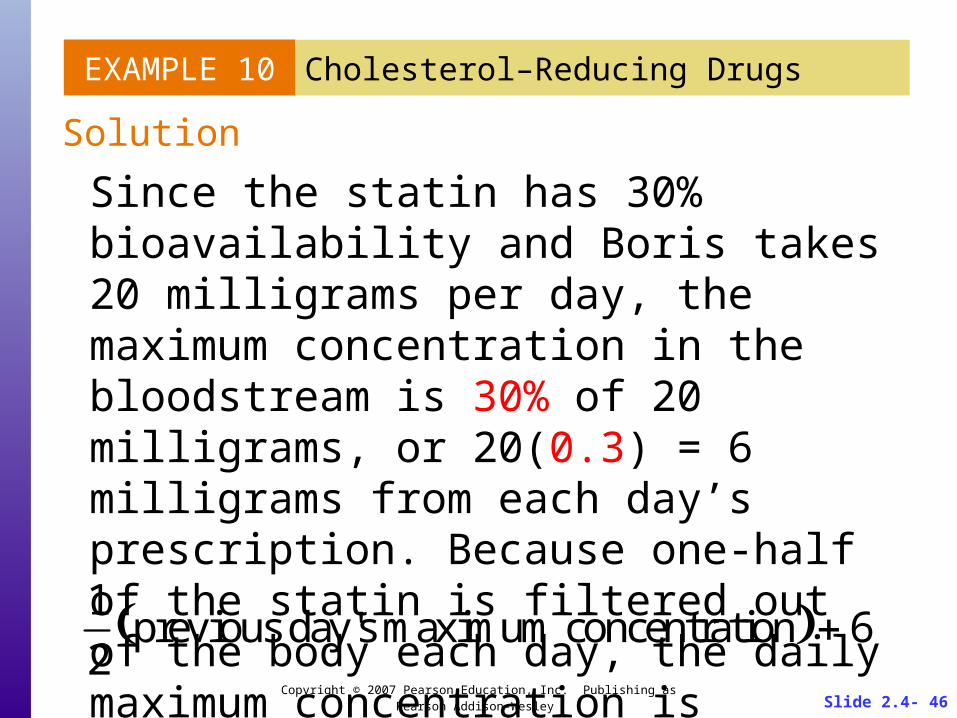
EXAMPLE 10
A statin with a bioavailability of 30% has been prescribed for Boris to treat his cholesterol levels. Boris is to take 20 milligrams of this statin every day. During the same day, one-half of the statin is filtered out of the body. Find the maximum concentration of the statin in the bloodstream on each of the first ten days of using the drug, and graph the result.
Cholesterol–Reducing Drugs
Slide 2.4- 46 Copyright © 2007 Pearson Education, Inc. Publishing as Pearson Addison-Wesley
EXAMPLE 10
Since the statin has 30% bioavailability and Boris takes 20 milligrams per day, the maximum concentration in the bloodstream is 30% of 20 milligrams, or 20(0.3) = 6 milligrams from each day’s prescription. Because one-half of the statin is filtered out of the body each day, the daily maximum concentration is
Cholesterol–Reducing Drugs
Solution
1
2previous day's maximum concentration 6

Slide 2.4- 47 Copyright © 2007 Pearson Education, Inc. Publishing as Pearson Addison-Wesley
EXAMPLE 10 Cholesterol–Reducing Drugs
Solution continued
Day Max Concentration
1 6.000
2 9.000
3 10.500
4 11.250
5 11.625
6 11.813
7 11.906
8 11.953
9 11.977
10 11.988Maximum concentration approaches 12 mg.

Slide 2.4- 48 Copyright © 2007 Pearson Education, Inc. Publishing as Pearson Addison-Wesley
FUNCTIONS IN ECONOMICS
C x variable cost fixed costs ax b
b is the fixed costa (the cost of producing each item in dollars per item) is called the marginal cost.
Linear Cost Function
C x C x x
Average Cost

Slide 2.4- 49 Copyright © 2007 Pearson Education, Inc. Publishing as Pearson Addison-Wesley
FUNCTIONS IN ECONOMICS
p x mx d
or
x p np k
Suppose x items can be sold (demanded) at a price of p dollars per item.
Linear Price–Demand Function

Slide 2.4- 50 Copyright © 2007 Pearson Education, Inc. Publishing as Pearson Addison-Wesley
FUNCTIONS IN ECONOMICS
R x pgx mx d x
Revenue Function
Profit Function
Revenue = (Price per item) (Number of items sold)
P x R x C x Profit = Revenue – Cost

Slide 2.4- 51 Copyright © 2007 Pearson Education, Inc. Publishing as Pearson Addison-Wesley
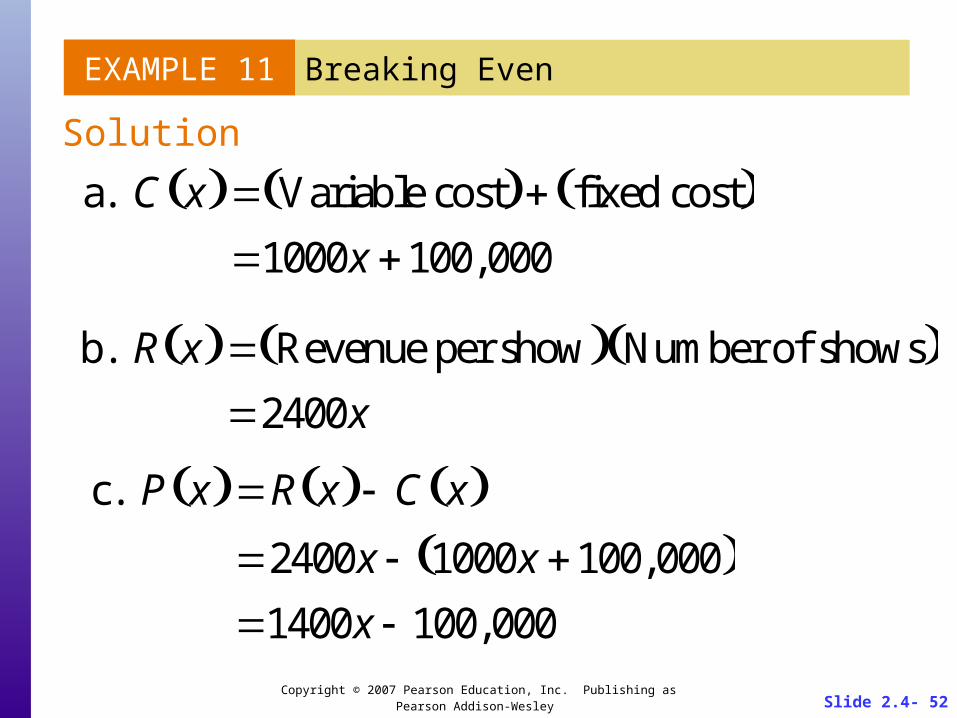
EXAMPLE 11
Metro Entertainment Co. spent $100,000 on production costs for its off-Broadway play Bride and Prejudice. Once running, each performance costs $1000 per show and the revenue from each is $2400. Using x to represent the number of shows,
Breaking Even
a. Write cost function C(x).b. Write revenue function R(x).c. Write profit function P(x).d. How many showings of Bride and Prejudice
must be held for Metro to break even?
Slide 2.4- 52 Copyright © 2007 Pearson Education, Inc. Publishing as Pearson Addison-Wesley
EXAMPLE 11 Breaking Even
Solution
a. C x Variable cost fixed cost 1000x 100, 000
b. R x Revenue per show Number of shows 2400x
c. P x R x C x 2400x 1000x 100, 000 1400x 100, 000
Slide 2.4- 53 Copyright © 2007 Pearson Education, Inc. Publishing as Pearson Addison-Wesley
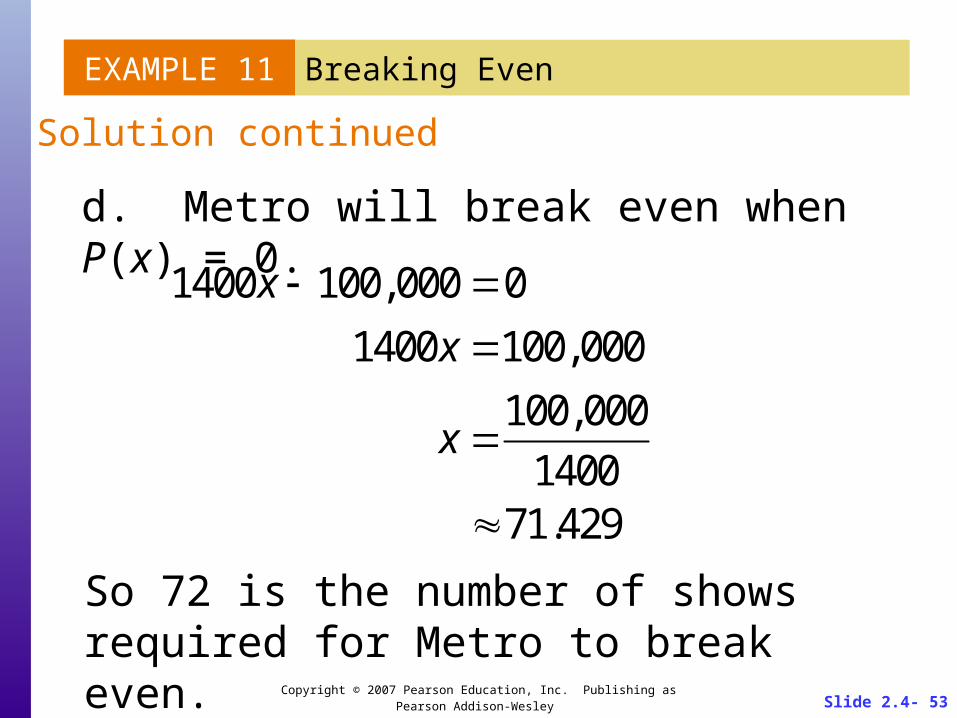
EXAMPLE 11 Breaking Even
Solution continued
1400x 100,000 0
1400x 100,000
x 100,000
140071.429
d. Metro will break even when P(x) = 0.
So 72 is the number of shows required for Metro to break even.
Related Documents