Slide 1 Time and Throughput Management & Improvement © Van Mieghem Bottleneck Management and Improvement Time and Throughput: – Critical Path vs. Bottleneck Analysis • Pizza Pazza Company • Levers for Improvement – Multi-product Capacity Management and Investment • Joint Marketing & Production Decisions • Optimal Capacity Investment • Bariatric Surgery

Slide 1Time and Throughput Management & Improvement© Van Mieghem Bottleneck Management and Improvement Time and Throughput: –Critical Path vs. Bottleneck.
Dec 16, 2015
Welcome message from author
This document is posted to help you gain knowledge. Please leave a comment to let me know what you think about it! Share it to your friends and learn new things together.
Transcript

Slide 1Time and Throughput Management & Improvement © Van Mieghem
Bottleneck Management and Improvement
Time and Throughput:– Critical Path vs. Bottleneck Analysis
• Pizza Pazza Company• Levers for Improvement
– Multi-product Capacity Management and Investment• Joint Marketing & Production Decisions• Optimal Capacity Investment• Bariatric Surgery

Slide 2Time and Throughput Management & Improvement © Van Mieghem
Operational Performance Measures
How to measure and decrease flow times? How to measure and increase throughput?
What is the best achievable performance?

Slide 3Time and Throughput Management & Improvement © Van Mieghem
Flow Time
Critical Path
(Theoretical) Capacity of a Resource
Bottleneck Resource
(Theoretical) Capacity of the Process
Concepts to Cover and Analyze
Slide 4Time and Throughput Management & Improvement © Van Mieghem
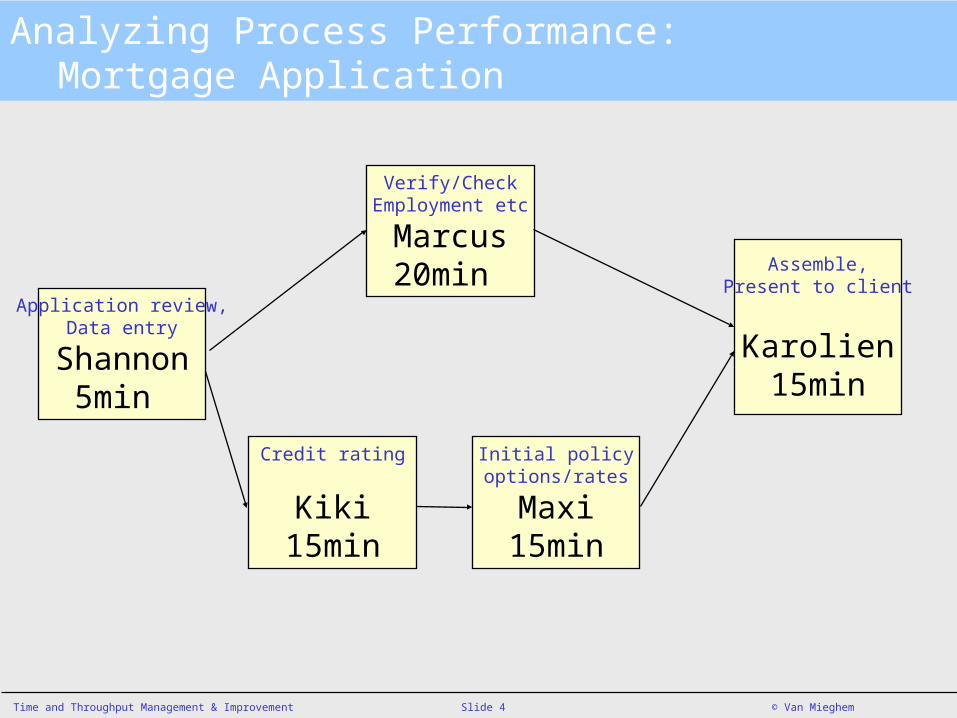
Analyzing Process Performance:Mortgage Application
Credit rating
Kiki15min
Verify/CheckEmployment etc
Marcus20min
Initial policyoptions/rates
Maxi15min
Assemble,Present to client
Karolien15min
Application review,Data entry
Shannon5min

Slide 5Time and Throughput Management & Improvement © Van Mieghem
Pizza Pazza: Flow Chartif job order = 2 identical pizzas
start Take Order Sauce Prep Dough Prep Spread
Activity time: 2 3 12 = 2Resource: Jean Jean Jean, Pan
end BillUnload &
PackBake
Load & Set timer
Activity time: 2 1 2 = 2 3 15 1Resource: Jaqueline Jaqueline, Pan Pan Oven, Pan Jaqueline, Oven, Pan
cool

Slide 6Time and Throughput Management & Improvement © Van Mieghem
Levers for Reducing Flow Time
Decrease the work content of critical activities– work smarter– work faster– do it right the first time– change product mix
Move work content from critical to non-critical activities– to non-critical path or to ``outer loop’’
Restructure sequential activities into parallel activities Reduce waiting time.

Slide 7Time and Throughput Management & Improvement © Van Mieghem
A Recipe for Capacity Measurements: Minimal resource capacity = bottleneck
Resource Unit Load Resource Capacity Process Resource(time/job) Unit Capacity # of units Total Capacity Utilization*
*assuming system is processing at full capacity
Define a “job” = …

Slide 8Time and Throughput Management & Improvement © Van Mieghem
Jacky Jean Oven0
2
4
6
8
10
12
14
16
18
Unit workload

Slide 9Time and Throughput Management & Improvement © Van Mieghem
Product Mix Decisions:Pizza Pazza offers 2 pizza types
Sale Price of thin crust: €5
Cost of Direct Materials: €1.40
Sale Price of deep dish: €7.50
Cost of Direct Materials: €2.10
Which of these two products should Jean push to customers that call in and are undecided?

Slide 10Time and Throughput Management & Improvement © Van Mieghem
Product Mix Decisions
Unit margin of thin crust pizza = €3.60
Unit margin of deep dish pizza = €5.40
Margin rate from thin crust
= €3.60 * 7.5/hr = € 27/hr
Margin rate from deep dish
= €5.40 * 4/hr = € 21.60/hr

Slide 11Time and Throughput Management & Improvement © Van Mieghem
How increase capacity? Summary of Typical Actions
Key action = optimize only bottleneck management
Decrease the work content of bottleneck activities– Never unnecessarily idle (“starve”) bottlenecks = eliminate bottleneck waits:
Reduce variability if it leads to bottleneck waiting Synchronize flows to and from the bottleneck: sync when resources start an activity
– work smarter: Reduce & externalize setups/changeover times, streamline + eliminate non-value added work
– do it right the first time: eliminate rework/corrections– work faster
Move work content from bottlenecks to non-bottlenecks– create flexibility to offload tasks originally assigned to bottleneck to non-critical resource
or to third party Can we offload tasks to cross-trained staff members?
Increase Net Availability of Process– work longer: increase scheduled availability– increase scale of process: invest in more human and capital resources– eliminate unscheduled downtimes/breakdowns
Preventive maintenance, backups, etc.
Slide 12Time and Throughput Management & Improvement © Van Mieghem
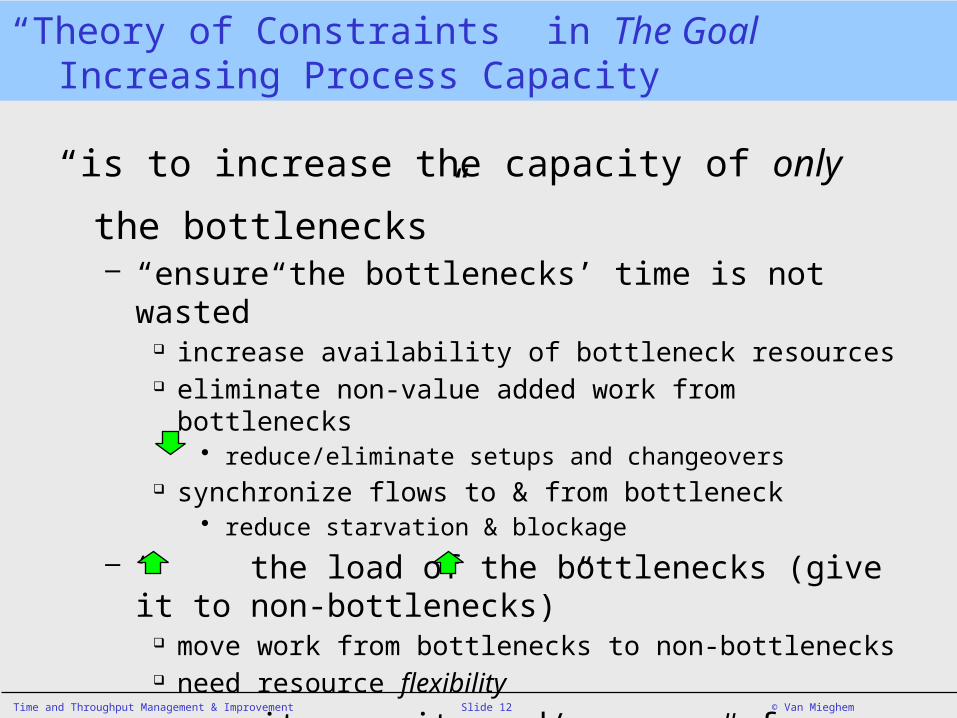
“is to increase the capacity of only the bottlenecks”– “ensure the bottlenecks’ time is not wasted”
increase availability of bottleneck resources eliminate non-value added work from bottlenecks
• reduce/eliminate setups and changeovers synchronize flows to & from bottleneck
• reduce starvation & blockage
– “ the load of the bottlenecks (give it to non-bottlenecks)” move work from bottlenecks to non-bottlenecks need resource flexibility
– unit capacity and/or #of units. invest
“Theory of Constraints” in The Goal Increasing Process Capacity

Bariatric Surgery Flow Chart
5 x 1.2 = 6 min(20% callback)
Patient Receptionist
Cash
Requesttests
Initialconsul-tation
Initialphone
call
Setappointmt for test 1
Test 1delay
decide
30 minPatient Surgeon
10 minPatient
Surgeon
5 minPatient
Receptionist
60 minPatient
Care-nurseOutpatient room
2 daysPatient
Setappointmt
5 minPatient
Receptionist
40% quit
More tests (50%)
80% approved
Yes (50%)Insurance 90%MedicalNecessity
Letter
InsuranceApproval
decide
20 minPatient
Surgeon
10% quit
Setappointmt for test 2
5 minPatientReceptionist
Visit 215 minPatientSurgeon
Test 230 minPatientCare-nurseOutpatient room
delay2 daysPatient
InsuranceApproval
2 wksPatient
20% denied & quit
Pre-surgeryVisit 3
20 minPatient
SurgeonOutpatient room
Schedulesurgery
10 minPatient
Care-nurse
PatientsArrive &Check-in
Pre-surgerySeminar
60 min6 PatientsSurgeon
Seminar room
OR Cleaning
15 min2 s-nurses
OR
Patient Prep
30 minPatient
Care-nurse
Drs. Prep
15 minSurgeon
anesthetist
LaparoscopicSurgery
75 min2 surgery nurses
Anesthetist, surgeonpatient, OR
Check-ups&
Recovery
2 daysPatient,
Inpatient roomCare nurse 120min
(10minx6x2)
OpenSurgery
Check-ups&
Recovery
4 daysPatient,
Inpatient roomCare nurse 240min
(10minx6x4)
FollowUp
30 minPatient
Care-nurse
45 min2 surgery nurses
Anesthetist, surgeonpatient, OR
PatientLeaves
x %
1- x %
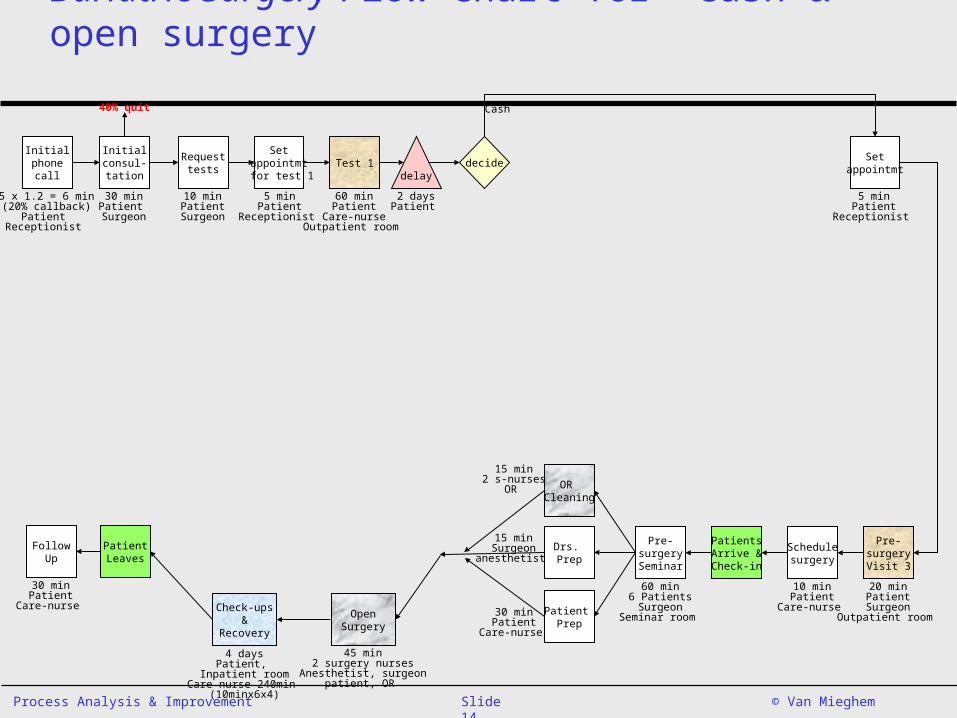
Bariatric Surgery Flow Chart for “cash & open surgery”
5 x 1.2 = 6 min(20% callback)
Patient Receptionist
Cash
Requesttests
Initialconsul-tation
Initialphone
call
Setappointmt for test 1
Test 1delay
decide
30 minPatient Surgeon
10 minPatient
Surgeon
5 minPatient
Receptionist
60 minPatient
Care-nurseOutpatient room
2 daysPatient
Setappointmt
5 minPatient
Receptionist
40% quit
Pre-surgeryVisit 3
20 minPatient
SurgeonOutpatient room
Schedulesurgery
10 minPatient
Care-nurse
PatientsArrive &Check-in
Pre-surgerySeminar
60 min6 PatientsSurgeon
Seminar room
OR Cleaning
15 min2 s-nurses
OR
Patient Prep
30 minPatient
Care-nurse
Drs. Prep
15 minSurgeon
anesthetist
OpenSurgery
Check-ups&
Recovery
4 daysPatient,
Inpatient roomCare nurse 240min
(10minx6x4)
FollowUp
30 minPatient
Care-nurse
45 min2 surgery nurses
Anesthetist, surgeonpatient, OR
PatientLeaves

Slide 15Time and Throughput Management & Improvement © Van Mieghem
Bariatric Surgery Capacity – Open Surgeries & Cash Payment
* inpatient rooms used 5 days/wk
Cash-Open
Resource Units Load/patient Patients/hr Hrs/day Patient/day Patients/wk resources Capacity/wk
Receptionist min 12 5.00 12 60.00 300.00 1 300.00Care Nurse min 222 0.27 12 3.24 16.22 10 162.16Surg. Nurse Team min 36 1.67 12 20.00 100.00 2 200.00Surgeon min 90 0.67 12 8.00 40.00 4 160.00OR min 36 1.67 12 20.00 100.00 2 200.00Inpatient rooms days 2.4 2.08 63 131.25Outpatient rooms min 48 1.25 12 15.00 75.00 2 150.00Anesthesist min 36 1.67 12 20.00 100.00 2 200.00
Capacity 131.25 inflow patients/wk78.75 outflow patients/wk
Expected unit workload per inflow patient
Slide 16Time and Throughput Management & Improvement © Van Mieghem
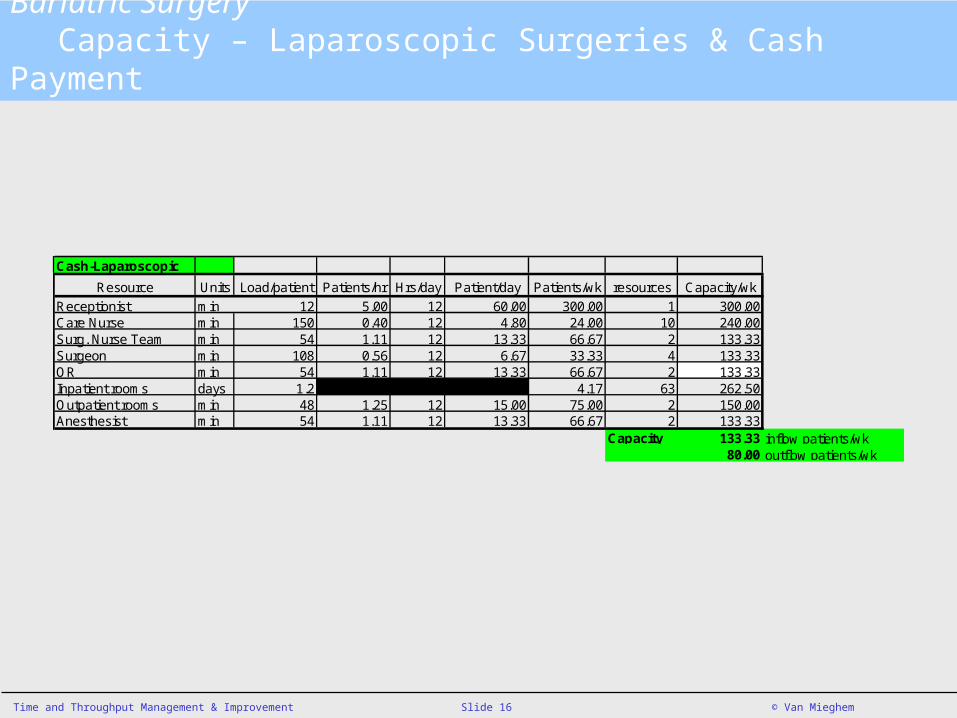
Bariatric Surgery Capacity – Laparoscopic Surgeries & Cash Payment
Cash-Laparoscopic
Resource Units Load/patient Patients/hr Hrs/day Patient/day Patients/wk resources Capacity/wk
Receptionist min 12 5.00 12 60.00 300.00 1 300.00Care Nurse min 150 0.40 12 4.80 24.00 10 240.00Surg. Nurse Team min 54 1.11 12 13.33 66.67 2 133.33Surgeon min 108 0.56 12 6.67 33.33 4 133.33OR min 54 1.11 12 13.33 66.67 2 133.33Inpatient rooms days 1.2 4.17 63 262.50Outpatient rooms min 48 1.25 12 15.00 75.00 2 150.00Anesthesist min 54 1.11 12 13.33 66.67 2 133.33
Capacity 133.33 inflow patients/wk80.00 outflow patients/wk
Slide 17Time and Throughput Management & Improvement © Van Mieghem
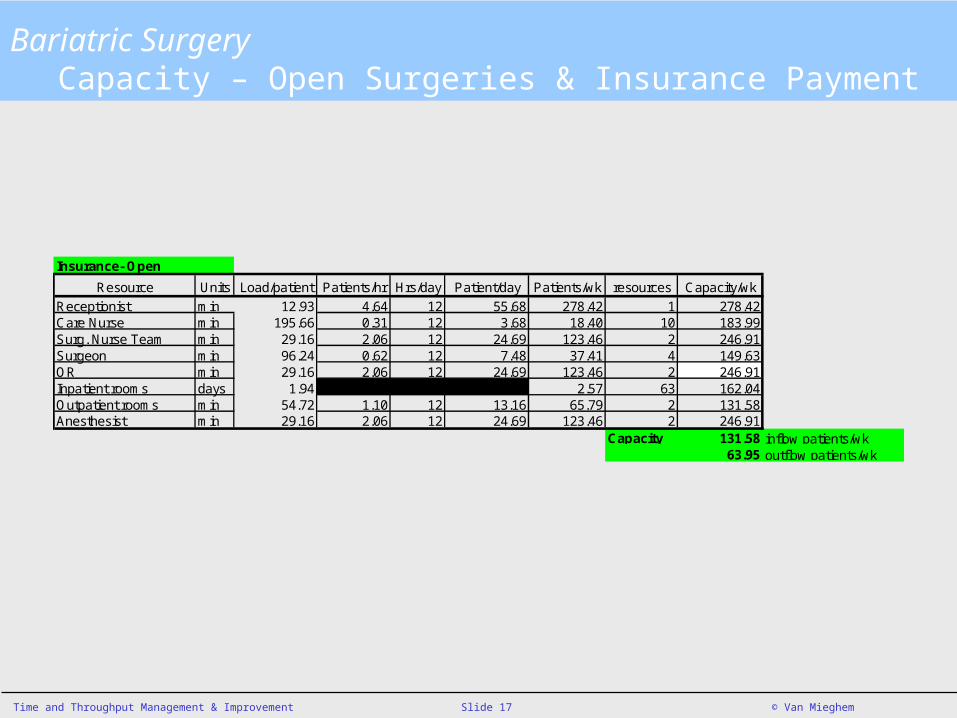
Bariatric Surgery Capacity – Open Surgeries & Insurance Payment
Insurance- Open
Resource Units Load/patient Patients/hr Hrs/day Patient/day Patients/wk resources Capacity/wk
Receptionist min 12.93 4.64 12 55.68 278.42 1 278.42Care Nurse min 195.66 0.31 12 3.68 18.40 10 183.99Surg. Nurse Team min 29.16 2.06 12 24.69 123.46 2 246.91Surgeon min 96.24 0.62 12 7.48 37.41 4 149.63OR min 29.16 2.06 12 24.69 123.46 2 246.91Inpatient rooms days 1.94 2.57 63 162.04Outpatient rooms min 54.72 1.10 12 13.16 65.79 2 131.58Anesthesist min 29.16 2.06 12 24.69 123.46 2 246.91
Capacity 131.58 inflow patients/wk63.95 outflow patients/wk

Slide 18Time and Throughput Management & Improvement © Van Mieghem
Bariatric Surgery Capacity – Laparoscopic Surgeries & Insurance Payment
Insurance-Laparoscopic
Resource Units Load/patient Patients/hr Hrs/day Patient/day Patients/wk resources Capacity/wk
Receptionist min 12.9 4.64 12 55.68 278.42 1 278.42Care Nurse min 137.3 0.44 12 5.24 26.21 10 262.12Surg. Nurse Team min 43.7 1.37 12 16.46 82.30 2 164.61Surgeon min 110.8 0.54 12 6.50 32.49 4 129.94OR min 43.7 1.37 12 16.46 82.30 2 164.61Inpatient rooms days 1.0 5.14 63 324.07Outpatient rooms min 54.7 1.10 12 13.16 65.79 2 131.58Anesthesist min 43.7 1.37 12 16.46 82.30 2 164.61
Capacity 129.94 inflow patients/wk63.15 outflow patients/wk

Slide 19Time and Throughput Management & Improvement © Van Mieghem
Product Mix Decisions:Open or Laparoscopic Surgery
Revenue per open surgery: $15,000
Variable Cost of Materials: $1,000
Revenue per Laparoscopic surgery:$18,000
Variable Cost of Materials: $2,000

Slide 20Time and Throughput Management & Improvement © Van Mieghem
Open and Laparoscopic have exactly the same process. The only difference is
in surgery (laparoscopic takes 30 minutes extra) and in the rooms
(laparoscopic uses rooms for 2 days whereas open uses rooms for 4 days.
Product Mix Decisions

Slide 21Time and Throughput Management & Improvement © Van Mieghem
Margin per Open surgery = $14,000
Margin per Laparoscopic surgery = $16,000
Margin per week from Open surgery = 72.72*(15,000 - 1,000) = $1,018,055 / week
Margin per week from Laparoscopic surgery = 63.15*(18,000 - 2,000) = $1,010,400 / week
Product Mix Decisions

Slide 22Time and Throughput Management & Improvement © Van Mieghem
Manage better using the key operational measures and an inter-functional process view of the organization
Process measures and corresponding improvement levers: – Flow time manage critical activities– Capacity manage bottleneck resources
Many marketing and financial decisions are linked to process– Effect of product mix decisions on process capacity
marginal contribution per unit of bottleneck capacity used– Bottleneck may shift on adding capacity
diminishing returns to capacity investment
Learning Objectives: Time and Throughput Management
Related Documents