Slide 1.6- 1 Copyright © 2007 Pearson Education, Inc. Publishing as Pearson Addison-Wesley

Welcome message from author
This document is posted to help you gain knowledge. Please leave a comment to let me know what you think about it! Share it to your friends and learn new things together.
Transcript

Slide 1.6- 1 Copyright © 2007 Pearson Education, Inc. Publishing as Pearson Addison-Wesley
Copyright © 2008 Pearson Education, Inc. Publishing as Pearson Addison-Wesley
OBJECTIVES
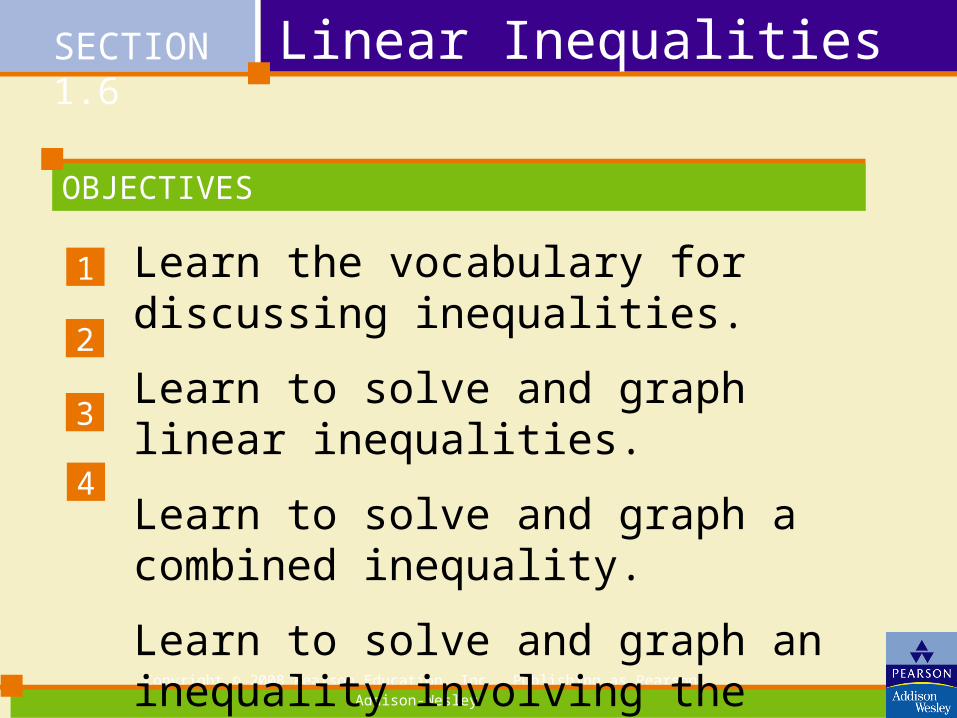
Linear Inequalities
Learn the vocabulary for discussing inequalities.
Learn to solve and graph linear inequalities.
Learn to solve and graph a combined inequality.
Learn to solve and graph an inequality involving the reciprocal of a linear expression.
SECTION 1.6
1
2
3
4

Slide 1.6- 3 Copyright © 2007 Pearson Education, Inc. Publishing as Pearson Addison-Wesley
INEQUALITIES
EquationReplace =
byInequality
x = 5 < x < 5
3x + 2 = 14 ≤ 3x + 2 ≤ 14
5x + 7 = 3x + 23 > 5x + 7 > 3x + 23
x2 = 0 ≥ x2 ≥ 0

Slide 1.6- 4 Copyright © 2007 Pearson Education, Inc. Publishing as Pearson Addison-Wesley
DefinitionsAn inequality is a statement that one algebraic expression is less than, or is less than or equal to, another algebraic expression.
The domain of a variable in an inequality is the set of all real numbers for which both sides of the inequality are defined.
The solutions of the inequality are the real numbers that result in a true statement when those numbers are substituted for the variable in the inequality.
Slide 1.6- 5 Copyright © 2007 Pearson Education, Inc. Publishing as Pearson Addison-Wesley
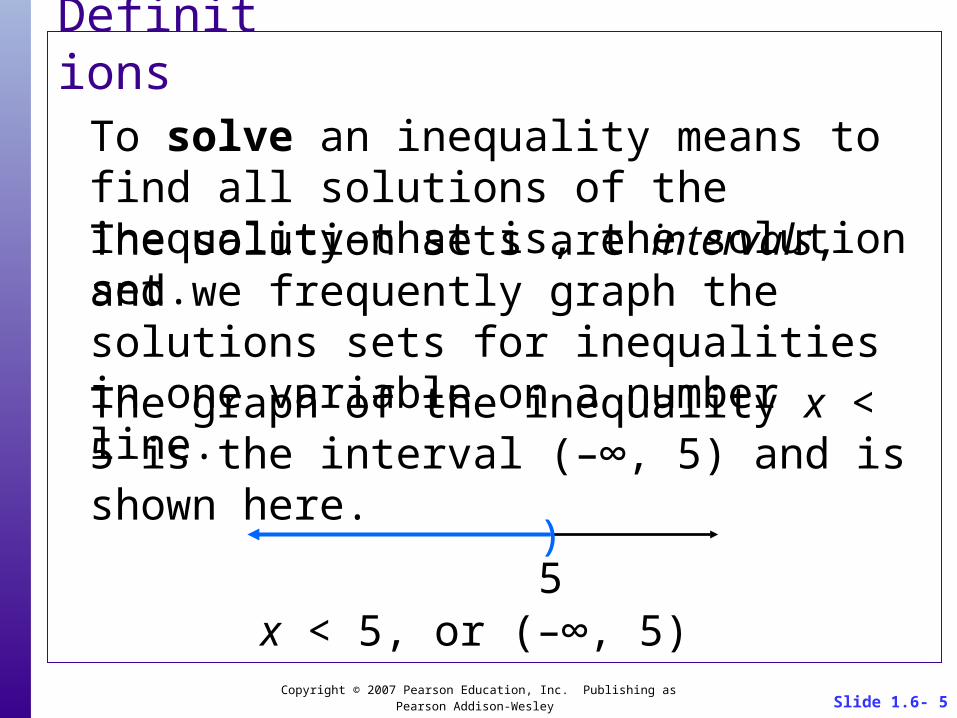
DefinitionsTo solve an inequality means to find all solutions of the inequality–that is, the solution set.
The graph of the inequality x < 5 is the interval (–∞, 5) and is shown here.
The solution sets are intervals, and we frequently graph the solutions sets for inequalities in one variable on a number line.
x < 5, or (–∞, 5)
)5

Slide 1.6- 6 Copyright © 2007 Pearson Education, Inc. Publishing as Pearson Addison-Wesley
Definitions
A conditional inequality such as x < 5 has in its domain at least one solution and at least one number that is not a solution.
An inconsistent inequality is one in which no real number satisfies it.
An identity is an inequality that is satisfied by every real number in the domain.

Slide 1.6- 7 Copyright © 2007 Pearson Education, Inc. Publishing as Pearson Addison-Wesley
THE NONNEGATIVE IDENTITY
for any real number x.
x2 0
Because x2 = x•x is the product of either (1) two positive factors, (2) two negative factors, or (3) two zero factors, x2 is always either a positive number or zero. That is, x2 is never negative, or is nonneagtive.
Slide 1.6- 8 Copyright © 2007 Pearson Education, Inc. Publishing as Pearson Addison-Wesley
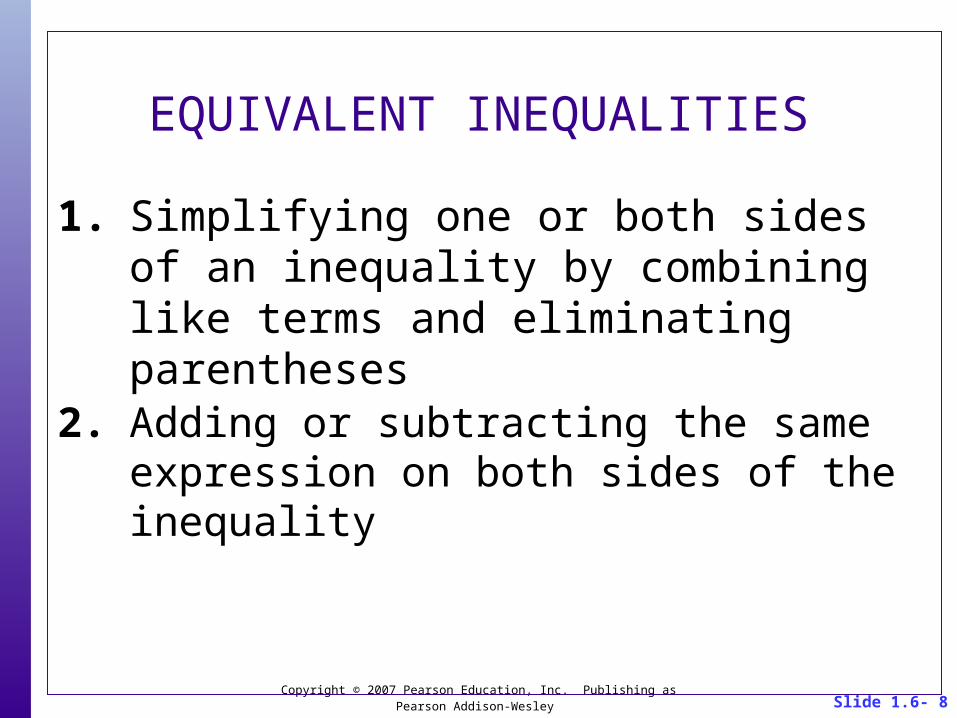
EQUIVALENT INEQUALITIES
1. Simplifying one or both sides of an inequality by combining like terms and eliminating parentheses
2. Adding or subtracting the same expression on both sides of the inequality

Slide 1.6- 9 Copyright © 2007 Pearson Education, Inc. Publishing as Pearson Addison-Wesley
Signof C
Inequality Sense Example
A < B < 3x < 12
positive A•C < B •C Unchanged
positive Unchanged
negative A•C > B •C Reversed
negative Reversed
1
33x 1
312
3x
3
12
3
1
33x
1
312
3x
3
12
3
A
C
B
C
A
C
B
C
Slide 1.6- 10 Copyright © 2007 Pearson Education, Inc. Publishing as Pearson Addison-Wesley
Linear Inequalities
A linear inequality in one variable is an inequality that is equivalent to one of the forms
ax + b < 0 or ax + b ≤ 0,
where a and b represent real numbers and a ≠ 0.
Slide 1.6- 11 Copyright © 2007 Pearson Education, Inc. Publishing as Pearson Addison-Wesley
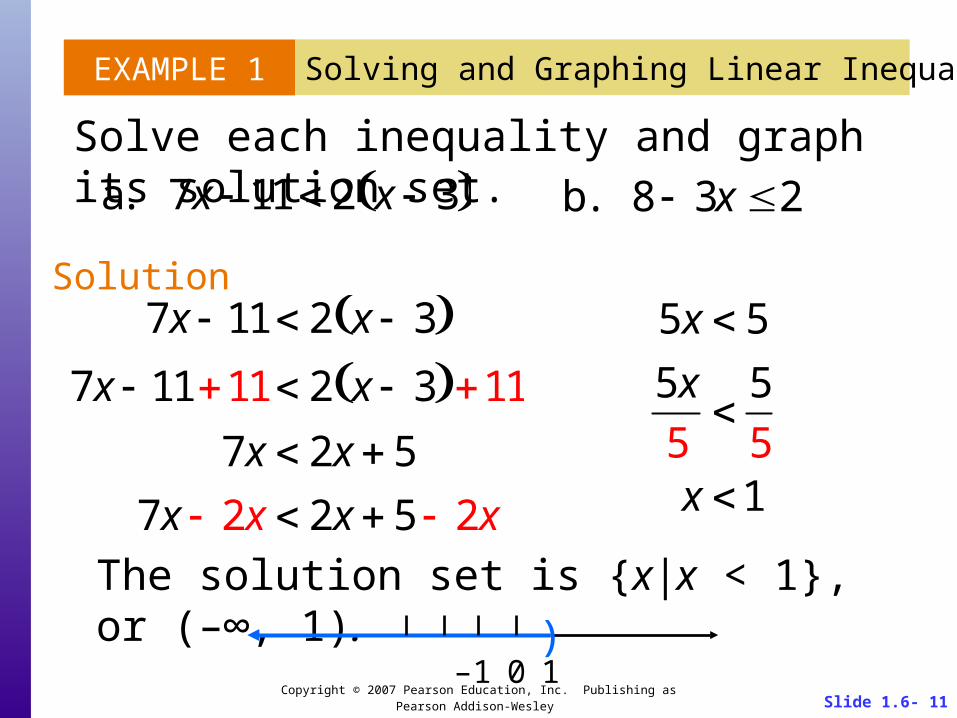
EXAMPLE 1 Solving and Graphing Linear Inequalities
Solve each inequality and graph its solution set.
The solution set is {x|x < 1}, or (–∞, 1).
a. 7x 11 2 x 3 b. 8 3x 2
Solution7x 11 2 x 3
7x 1111 2 x 3 11
7x 2x 5
7x 2x 2x 5 2x
5x 5
5x
5
5
5x 1
)0 1–1

Slide 1.6- 12 Copyright © 2007 Pearson Education, Inc. Publishing as Pearson Addison-Wesley
EXAMPLE 1 Solving and Graphing Linear Inequalities
The solution set is {x|x ≥ 2}, or [2, ∞).
Solution continued
8 3x 2
8 3x 8 2 8
3x 6
3x
3
6
3x 2
[1 20
b. 8 3x 2

Slide 1.6- 13 Copyright © 2007 Pearson Education, Inc. Publishing as Pearson Addison-Wesley
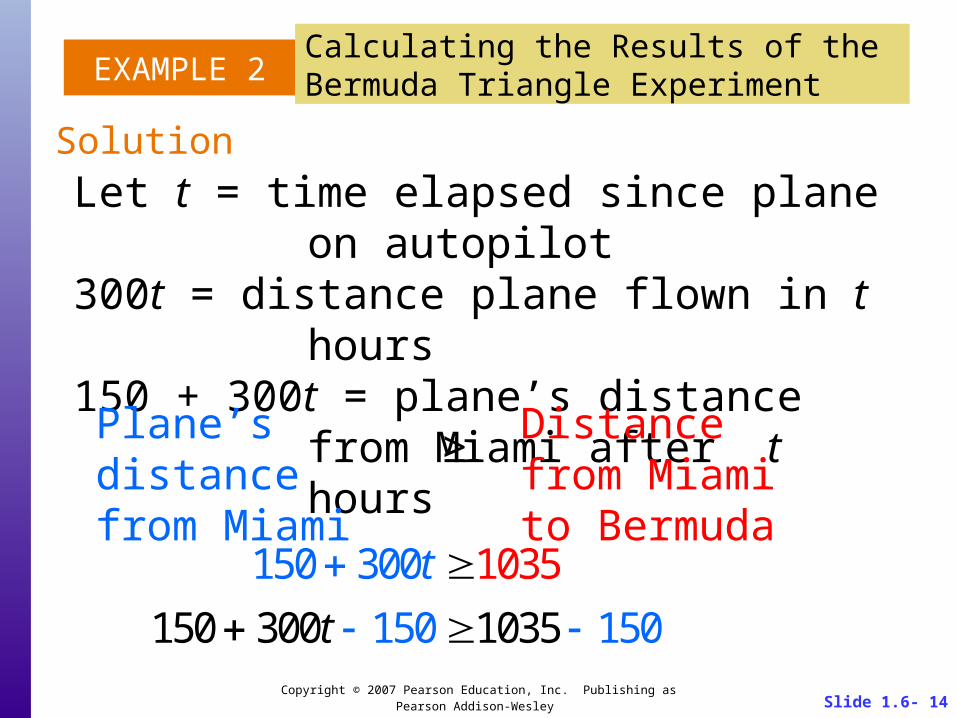
EXAMPLE 2Calculating the Results of the Bermuda Triangle Experiment
In the introduction to this section, we discussed an experiment to test the reliability of compass settings and flight by automatic pilot along one edge of the Bermuda Triangle. The plane is 150 miles along its path from Miami to Bermuda, cruising at 300 miles per hour, when it notifies the tower that it is now set on automatic pilot.
The entire trip is 1035 miles, and we want to determine how much time we should let pass before we become concerned that the plane has encountered trouble.
Slide 1.6- 14 Copyright © 2007 Pearson Education, Inc. Publishing as Pearson Addison-Wesley
EXAMPLE 2
Let t = time elapsed since plane on autopilot300t = distance plane flown in t hours150 + 300t = plane’s distance from Miami after
t hours
Solution
Calculating the Results of the Bermuda Triangle Experiment
Plane’s distance from Miami
Distance from Miami to Bermuda
≥
150 300t 1035
150 300t 150 1035 150

Slide 1.6- 15 Copyright © 2007 Pearson Education, Inc. Publishing as Pearson Addison-Wesley
EXAMPLE 2
Solution continued
Calculating the Results of the Bermuda Triangle Experiment
300t 885
300t
300
885
300t 2.95
Since 2.95 is roughly 3 hours, the tower will suspect trouble if the plane has not arrived in 3 hours.

Slide 1.6- 16 Copyright © 2007 Pearson Education, Inc. Publishing as Pearson Addison-Wesley
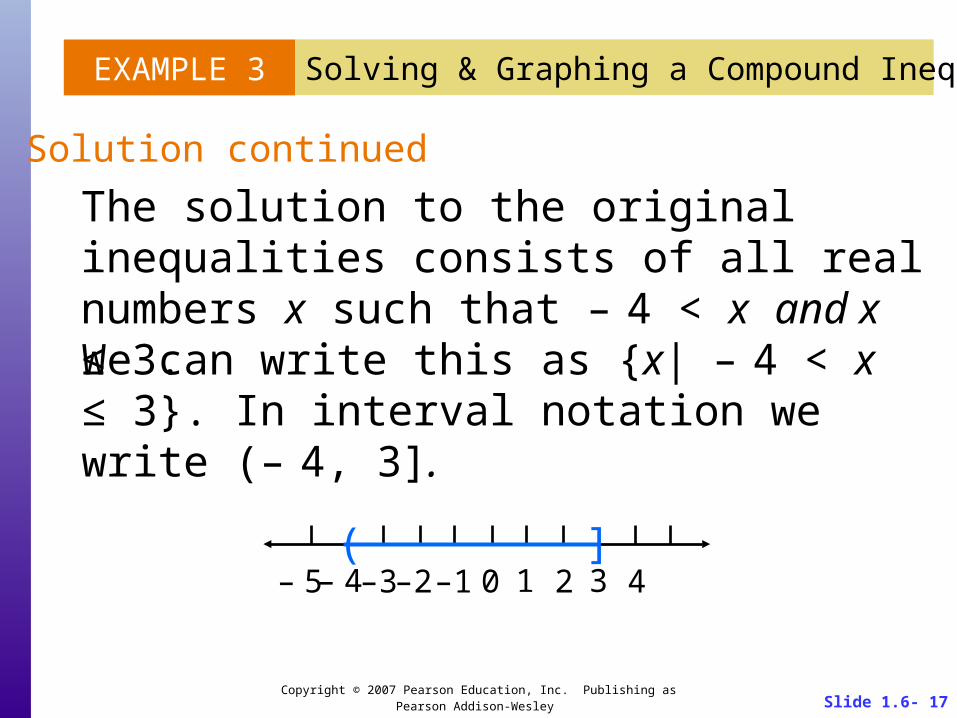
EXAMPLE 3 Solving & Graphing a Compound Inequality
Solve the inequality 5x 2x 3 9 graph its solution set.
and
Solution
First, solve the inequalities separately.
5 2x 3
5 3 2x 3 3
8
2
2x
2 4 x
2x 3 9
2x 3 3 9 3
2x
2
6
2x 3
Slide 1.6- 17 Copyright © 2007 Pearson Education, Inc. Publishing as Pearson Addison-Wesley
EXAMPLE 3 Solving & Graphing a Compound Inequality
We can write this as {x| – 4 < x ≤ 3}. In interval notation we write (– 4, 3].
Solution continued
The solution to the original inequalities consists of all real numbers x such that – 4 < x and x ≤ 3.
]31
(–1 0 4– 4– 5 2–2–3
Slide 1.6- 18 Copyright © 2007 Pearson Education, Inc. Publishing as Pearson Addison-Wesley
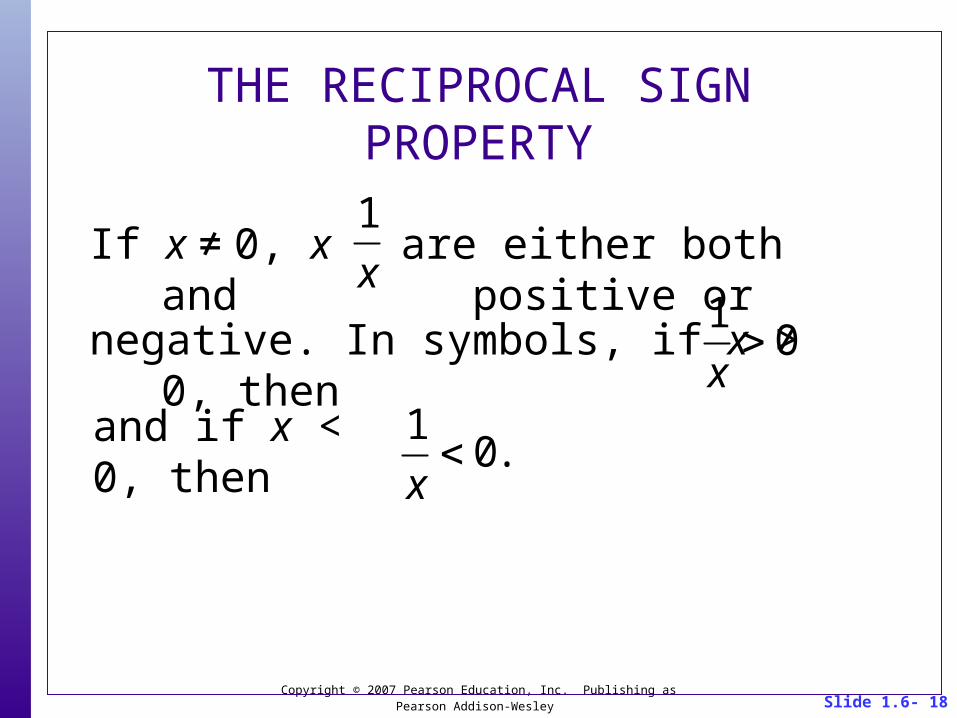
THE RECIPROCAL SIGN PROPERTY
If x ≠ 0, x and 1
xare either both positive or
negative. In symbols, if x > 0, then 1
x 0
and if x < 0, then1
x 0.
Slide 1.6- 19 Copyright © 2007 Pearson Education, Inc. Publishing as Pearson Addison-Wesley
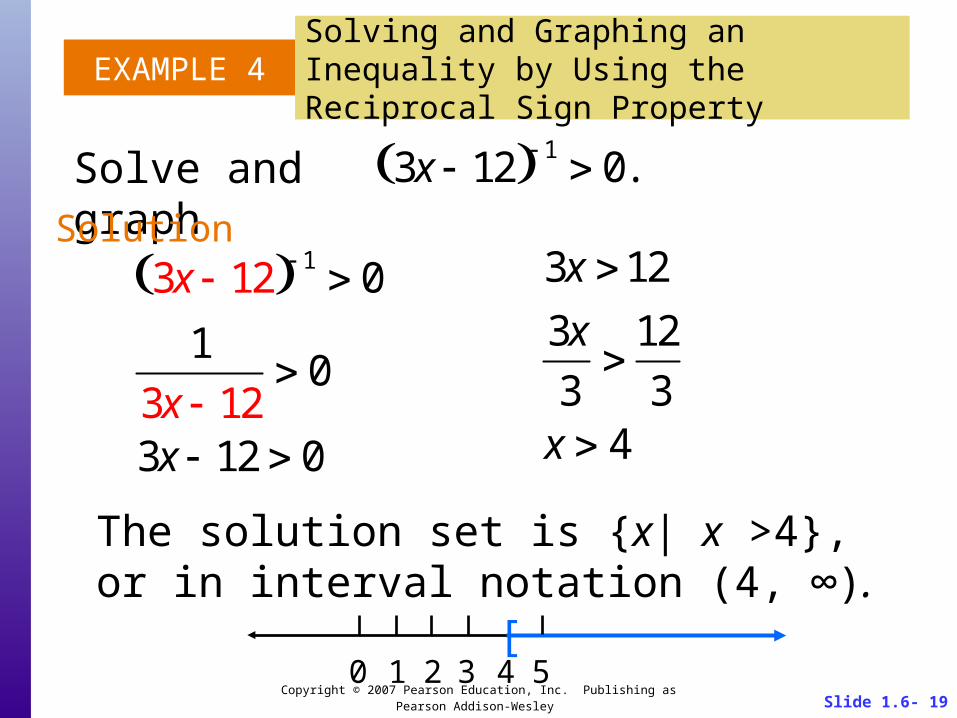
EXAMPLE 4Solving and Graphing an Inequality by Using the Reciprocal Sign Property
Solve and graph 3x 12 1 0.
Solution3x 12 1 0
1
3x 12 0
3x 12 0
3x 12
3x
3
12
3x 4
The solution set is {x| x >4}, or in interval notation (4, ∞).
[1 20 4 53
Slide 1.6- 20 Copyright © 2007 Pearson Education, Inc. Publishing as Pearson Addison-Wesley
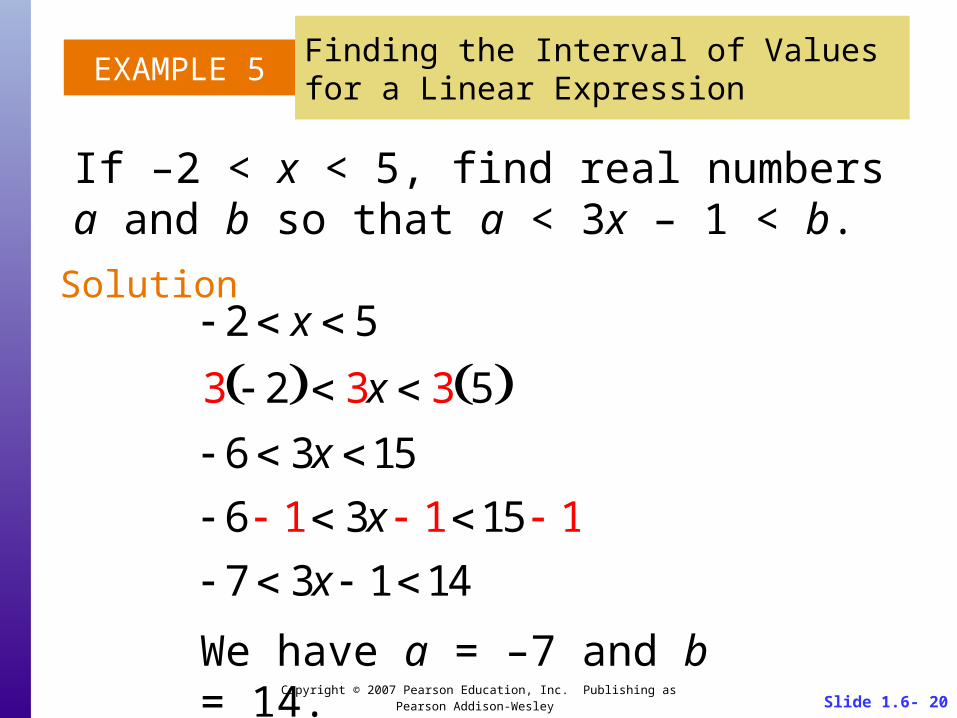
EXAMPLE 5Finding the Interval of Values for a Linear Expression
If –2 < x < 5, find real numbers a and b so that a < 3x – 1 < b.
Solution 2 x 5
3 2 3x 3 5 6 3x 15
6 1 3x 1 15 1
7 3x 1 14
We have a = –7 and b = 14.
Slide 1.6- 21 Copyright © 2007 Pearson Education, Inc. Publishing as Pearson Addison-Wesley
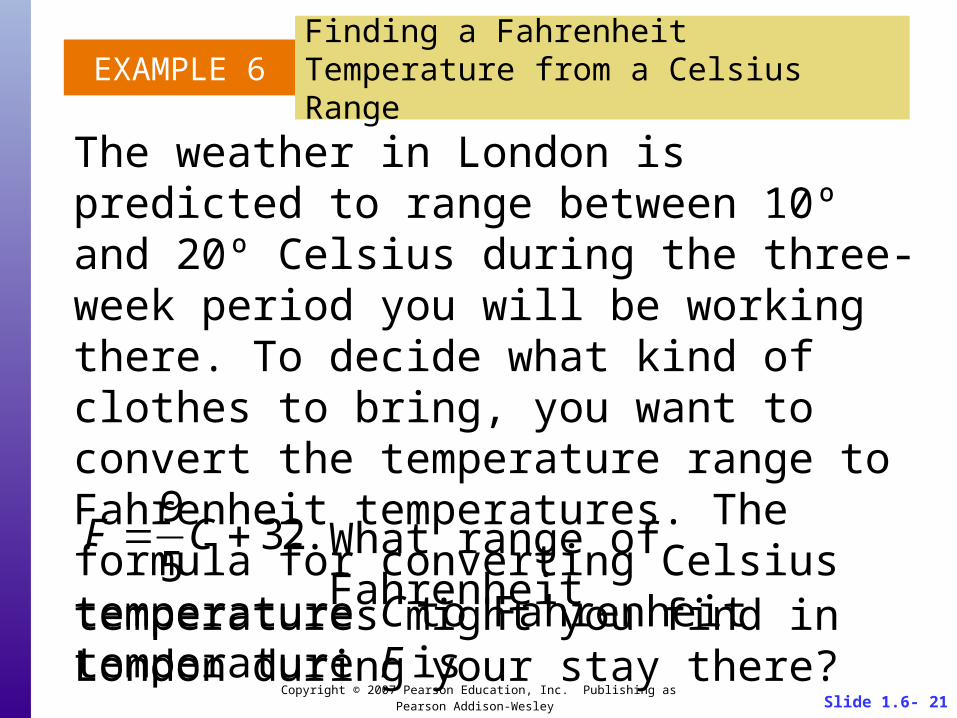
EXAMPLE 6Finding a Fahrenheit Temperature from a Celsius Range
The weather in London is predicted to range between 10º and 20º Celsius during the three-week period you will be working there. To decide what kind of clothes to bring, you want to convert the temperature range to Fahrenheit temperatures. The formula for converting Celsius temperature C to Fahrenheit temperature F is
temperatures might you find in London during your stay there?
F 9
5C 32. What range of Fahrenheit

Slide 1.6- 22 Copyright © 2007 Pearson Education, Inc. Publishing as Pearson Addison-Wesley
EXAMPLE 6Finding a Fahrenheit Temperature from a Celsius Range
Let C = temperature in Celsius degrees.Solution
9
510 9
5C
9
520
18 9
5C 36
18 32 9
5C 32 36 32
For the three weeks under consideration10 ≤ C ≤ 20.
Slide 1.6- 23 Copyright © 2007 Pearson Education, Inc. Publishing as Pearson Addison-Wesley
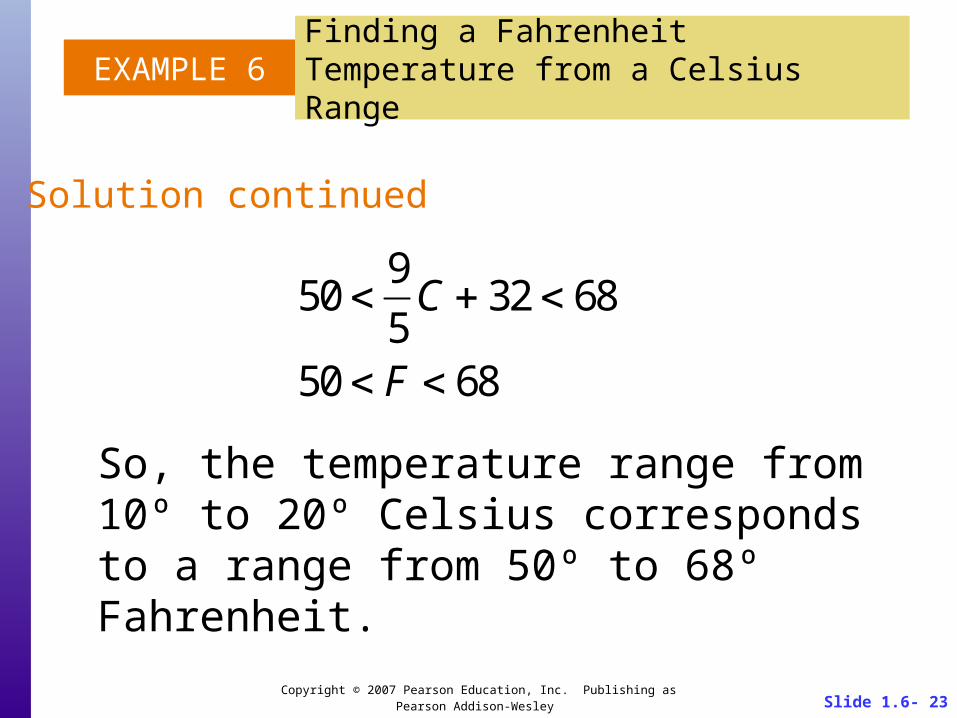
EXAMPLE 6Finding a Fahrenheit Temperature from a Celsius Range
Solution continued
50 9
5C 32 68
50 F 68
So, the temperature range from 10º to 20º Celsius corresponds to a range from 50º to 68º Fahrenheit.
Related Documents