Slide 1 U.S. Energy Situation, Ethanol, and Energy Policy Wally Tyner

Slide 1 U.S. Energy Situation, Ethanol, and Energy Policy Wally Tyner.
Dec 21, 2015
Welcome message from author
This document is posted to help you gain knowledge. Please leave a comment to let me know what you think about it! Share it to your friends and learn new things together.
Transcript

Slide 1
U.S. Energy Situation, Ethanol, and Energy Policy
Wally Tyner

Slide 2
U.S. Share of World
4.6
17.5
23.6
0
5
10
15
20
25
Population Energy Production Energy Consumption
%

Slide 3
Total Energy Consumption - 2003
0
20
40
60
80
100
120
United States WesternEurope
China Japan Former USSR Africa
Qu
adri
llio
n B
TU

Slide 4
Per Capita Energy Consumption - 2003
0
50
100
150
200
250
300
350
400
United States WesternEurope
China Japan Former USSR Africa
Mill
ion
BT
Us

Slide 5
Energy Cons./GDP - 2003
0
10000
20000
30000
40000
50000
60000
70000
80000
90000
100000
United States Germany China Japan Russia Mali
BT
U/$

Slide 6
U.S. Energy Consumption 2003
23%
23%40%
8%3% 3%
Coal
Nat. gas
Oil
Nuclear
Hydro
Renewable

Slide 7
Slide 8
Crude Oil Imports by Country or Region, 2004
16%
13%
23%16%
4%
11%
17%
Mexico
Venezuela
Persian Gulf
Canada
North Sea
Nigeria
Other

Slide 9
Unleaded Regular Gasoline, U.S. City Average Retail Price
0
50
100
150
200
250
300
350
Cen
ts p
er G
allo
n
Nominal gasoline price Real gasoline price
March 1981 - $3.20
March 1981 - $1.42
Sept. 2005 - $2.94

Slide 10
Energy and National Security
A common perception in the US is that there is a national security cost of imported oil that makes the real cost of oil products much higher than the cost consumers pay
Economists commonly advocate internalizing the cost of such an externality

Slide 11
Demand and supply side options On the demand side, the major options are a
fuel tax and stronger fuel economy standards – for the moment, these options have been rejected in the political process
On the supply side, government support of domestic alternatives to oil can take many forms
The key is risk reduction for private investments

Slide 12
Annual Gasoline Consumption
60
70
80
90
100
110
120
130
140
150

Slide 13
U.S. Energy and Ethanol
U.S. is the world’s largest energy consumer (in total and per capita)
U.S. imports over 60% of our oil 40% of our energy consumption is oil Ethanol is now about 3% of our
gasoline consumption

Slide 14
Bio-fuels: Ethanol Ethanol – ethyl alcohol, produced through
fermentation of starch and sugars. In the U.S., about 90% comes from corn.
Ethanol is used as a gasoline extender, octane enhancer, and oxygenate, – Extender – just an addition to fuel supply– Octane enhancer – increases gasoline octane– Oxygenate – adds oxygen to make gasoline
burn cleaner

Slide 15
Additional Information Ethanol has higher octane than gasoline, but it
has lower energy content. Ethanol blends get slightly less mileage than
equivalent gasoline. Ethanol blends burn cleaner than standard
gasoline because of the increased oxygen, but may increase evaporative emissions
MTBE will not be used much in the US after May 8, so in the short-run, ethanol demand is very high

Slide 16
Key Legislation
Energy Tax Act of 1978, provided a 54 cent per gallon subsidy for ethanol ($0.14/l).
Clean Air Act of 1990 mandated more oxygen in fuels (ethanol has more oxygen than standard gasoline).
American Jobs Creation Act of 2004 extended the 0.51/gal. (0.135/l.) federal subsidy through 2010 and changed the subsidy mechanism so it no longer comes from the gasoline tax.
Energy Policy Act of 2005 – renewable fuels standard and eliminated oxygen requirement
Slide 17
Energy Policy Act of 2005
Energy Policy Act of 2005 – renewable fuels standard that starts at 4 bil. gal. in 2006 and goes to 7.5 bil. in 2012
Standard encompasses both ethanol and bio-diesel
Will not reduce gasoline prices Will not stimulate energy conservation Does provide some funding for research
(authorized but not appropriated)

Slide 18
Ethanol Production
0
500
1000
1500
2000
2500
3000
3500
4000
4500
1000 g
al./y
r.

Slide 19
Ethanol Economics Until very recently, ethanol has not been
economic without a government subsidy. However, with $70 oil and $2.25 corn, ethanol is
profitable with no subsidy. In addition, some states provide subsidies as
well Under current conditions, ethanol is very
profitable with market conditions plus subsidies Renewable fuel standard should provide an
assured market for the product

Slide 20
Corn Use for Ethanol Currently about 1.5 bil. bu. of corn is used
for ethanol That will at least double in the next 5 years With more corn used for ethanol, we might
expect:– More corn to be produced and higher prices– Less corn to be exported– Less corn to be fed– Higher price volatility

Slide 21
Ethanol Impacts Currently the ethanol subsidy costs about $2.5
billion per year. Over the past 25 years, ethanol has been an
industry that exists solely due to government subsidies. Today, however, it could be viable without subsidies so long as oil prices stay high and corn prices low.
If the subsidies and the RFS continue, corn use for ethanol will increase beyond the 7.5 billion gallon standard by 2012.

Slide 22
Ag and Energy Policy Links
With 15 percent or more of the corn crop going to ethanol, there will be upward price pressure on corn– Costs of agricultural subsidies could fall– Subsidizing ethanol or bio-diesel is WTO
legal, whereas coupled crop subsidies are likely to be limited in the future
– Corn to ethanol produces DDGS, which is a moderate protein animal feed

Slide 23
Policy Analysis
We are doing policy analysis on both bio-fuels and coal liquids
Will describe here research leading to a new subsidy mechanism for corn based ethanol
The coal liquids risk reduction research applies equally well to ethanol from cellulose

Slide 24
Objectives of Ethanol Research Given the increasing annual cost of the corn
ethanol subsidy, is there a more efficient way to achieve the same results?
Determine a relationship between corn and ethanol prices and ethanol profitability
Create a variable payment ethanol subsidy based on above relationship
Compare results of both subsidies using historic prices
Slide 25
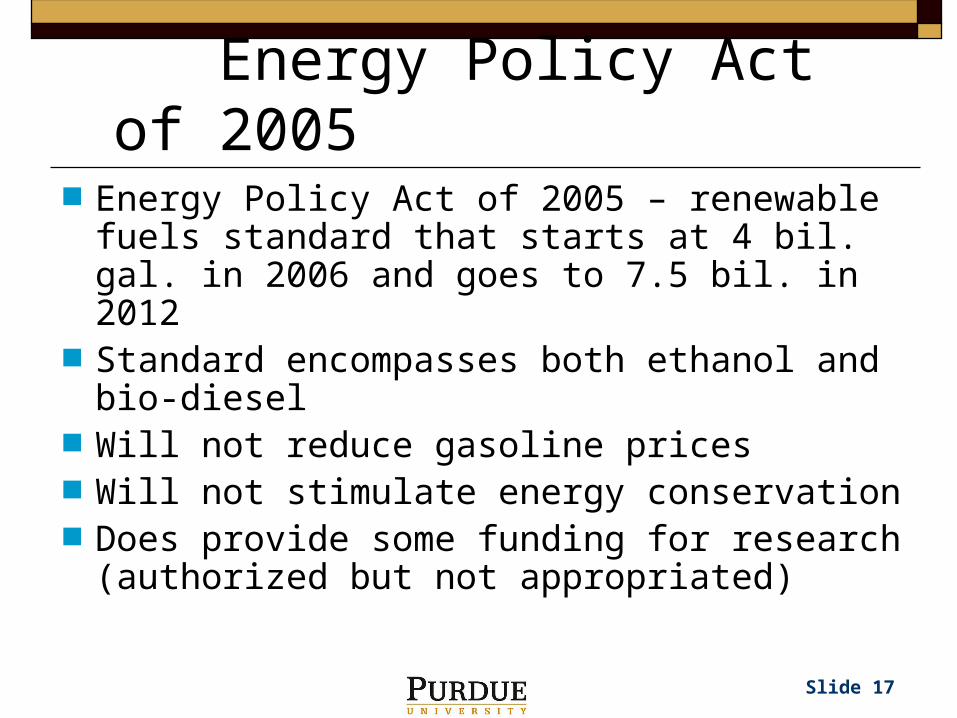
Monthly Corn and Gasoline Prices
$0.00
$0.20
$0.40
$0.60
$0.80
$1.00
$1.20
$1.40
$1.60
Jun-
86
Jun-
87
Jun-
88
Jun-
89
Jun-
90
Jun-
91
Jun-
92
Jun-
93
Jun-
94
Jun-
95
Jun-
96
Jun-
97
Jun-
98
Jun-
99
Jun-
00
Jun-
01
Jun-
02
Jun-
03
Jun-
04
Date
gas
olin
e ($
/gal
)
$0.00
$0.50
$1.00
$1.50
$2.00
$2.50
$3.00
$3.50
$4.00
$4.50
$5.00
corn
$/b
u
Monthly Gasoline Spot Prices Monthly Corn Prices

Slide 26
Research Methods
The research took place in 4 major steps:1. Estimation of profitability under a wide range of
corn and ethanol prices2. Use data from step 1 to quantify the
relationship between corn and ethanol prices and ethanol profitability and use the results as the basis for the variable subsidy
3. Develop a variable subsidy based on gasoline and corn rather than ethanol and corn
4. Compare results of the variable subsidy with the $0.51 flat rate subsidy using historic prices.

Slide 27
Government Savings
Using historical data total subsidy cost for the time period was:
• Fixed Subsidy = $17.19 billion• Variable Subsidy = $10.81 billion• Total Government Savings = $6.38 billion • Average Annual Government Savings = $642
million or 37%

Slide 28
Fixed Subsidy Vs. Variable Subsidy
$0.00
$0.10
$0.20
$0.30
$0.40
$0.50
$0.60
$0.70
$0.80
Jul-9
5
Nov-9
5
Mar
-96
Jul-9
6
Nov-9
6
Mar
-97
Jul-9
7
Nov-9
7
Mar
-98
Jul-9
8
Nov-9
8
Mar
-99
Jul-9
9
Nov-9
9
Mar
-00
Jul-0
0
Nov-0
0
Mar
-01
Jul-0
1
Nov-0
1
Mar
-02
Jul-0
2
Nov-0
2
Mar
-03
Jul-0
3
Nov-0
3
Mar
-04
Jul-0
4
Nov-0
4
Mar
-05
Date
Va
riab
le S
ub
sid
y C
ost
Fixed Subsidy
Variable Subsidy is less than fixed subsidy 88% of the months.

Slide 29
Producer Risk
Fixed and Variabile Subsidy Profitability
$0.00
$0.10
$0.20
$0.30
$0.40
$0.50
$0.60
$0.70
$0.80
Sep-9
5
Jan-
96
May
-96
Sep-9
6
Jan-
97
May
-97
Sep-9
7
Jan-
98
May
-98
Sep-9
8
Jan-
99
May
-99
Sep-9
9
Jan-
00
May
-00
Sep-0
0
Jan-
01
May
-01
Sep-0
1
Jan-
02
May
-02
Sep-0
2
Jan-
03
May
-03
Sep-0
3
Jan-
04
May
-04
Sep-0
4
Jan-
05
May
-05
Time
Pro
fit(
$/G
allo
n)
Flat Rate Subsidy Profitability Variable Subsidy Profitability

Slide 30
Producer Risk
Fixed SubsidyAverage Profit = $0.39
Coefficient of Variation = 0.43
Variable SubsidyAverage Profit - $0.21
Coefficient of Variation = 0.34
CV = Standard Deviation/Mean

Slide 31
Results
Over the historic period:– Average annual government savings were 37%– Average annual producer risk reduction was
21%
If the variable subsidy were in effect today, the cost for the first half of 2006 would be $0, but producers would be protected from future oil price drops or corn price increases

Slide 32
Results
Locus of Zero Subsidy Ethanol and Corn Prices
1.2
1.3
1.4
1.5
1.6
1.7
1.8
1.9
2
1.5 1.75 2 2.25 2.5 2.75 3 3.25 3.5 3.75 4
Corn Price ($/bu.)
Eth
ano
l Pri
ce (
$/g
al.)
Subsidy zone
No subsidy zone

Slide 33
Future Energy Policy Choices Need to find cost effective ways to stimulate
national production of liquid fuel alternatives to imported oil
Today, almost anything is profitable, but that could easily change tomorrow, so reducing the risk from oil price drops is key
Corn ethanol will play a prominent role Cellulose ethanol and diesel from oilseeds
and coal could also be important if we reduce investor risk
The policy set that works for corn ethanol may be different from policy to stimulate other sources

Slide 34
Thanks very much!
Questions and Comments
Related Documents