Slide 1 Analysis of Covariance, ANCOVA (GLM2) Prof. Andy Field

Slide 1 Analysis of Covariance, ANCOVA (GLM2) Prof. Andy Field.
Dec 30, 2015
Welcome message from author
This document is posted to help you gain knowledge. Please leave a comment to let me know what you think about it! Share it to your friends and learn new things together.
Transcript

Slide 1
Analysis of Covariance, ANCOVA (GLM2)
Prof. Andy Field

Slide 2
Aims
• When and Why do we use ANCOVA?
• Partitioning Variance• Carrying out on IBM SPSS• Interpretation
– Main Effects– Covariates

Slide 3
When And Why
• To test for differences between group means when we know that an extraneous variable affects the outcome variable.
• Used to control known extraneous variables.

Slide 4
Advantages of ANCOVA
• Reduces Error Variance– By explaining some of the
unexplained variance (SSR) the error variance in the model can be reduced.
• Greater Experimental Control:– By controlling known extraneous
variables, we gain greater insight into the effect of the predictor variable(s).

Slide 5
Variance
SSR
Error in Model
SSM
Improvement Due to the Model
SST
Total Variance In The Data
SSRCovariate

Slide 6
An Example
• We will use Field’s (2013) Viagra example (from the ANOVA lecture).– There are several possible confounding
variables – e.g. Partner’s libido, medication.
• We can conduct the same study but measure partner’s libido over the same time period following the dose of Viagra.– Outcome (or DV) = Participant’s libido– Predictor (or IV) = Dose of Viagra (Placebo,
Low & High)– Covariate = Partner’s libido
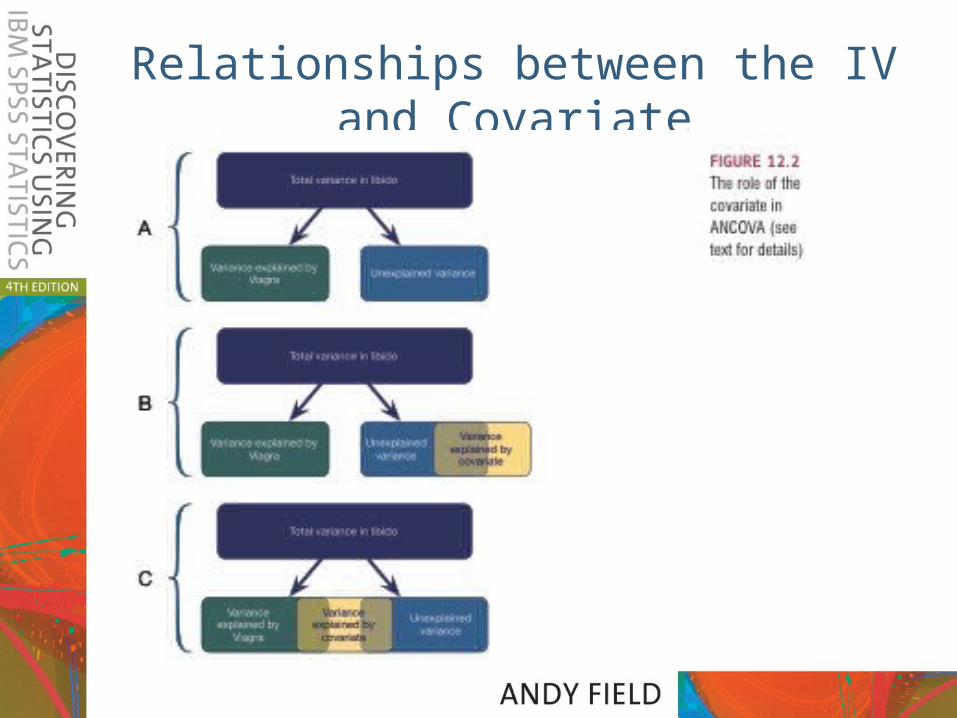
Relationships between the IV and Covariate

Homogeneity of Regression Slopes

Slide 9

Slide 10
How Does ANCOVA Work?
• Imagine we had just two groups:– Placebo– Low Dose
• This paradigm can be expressed as a regression equation using a dummy coding variable:
ii
ii
DosebbLibido
XbbY
10
10
Slide 11
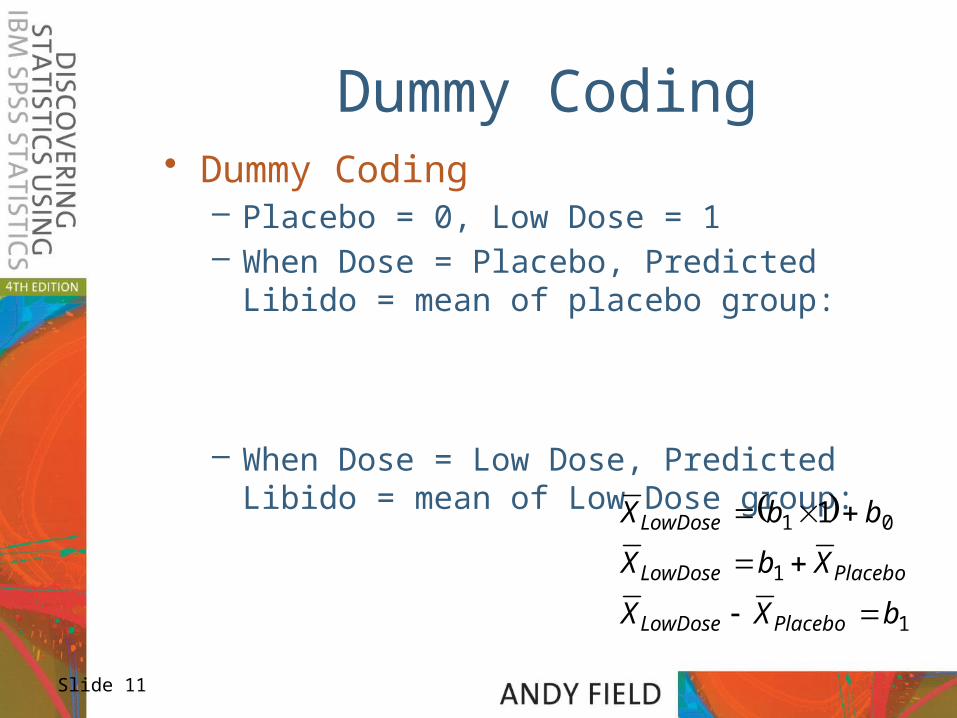
Dummy Coding• Dummy Coding
– Placebo = 0, Low Dose = 1– When Dose = Placebo, Predicted Libido
= mean of placebo group:
– When Dose = Low Dose, Predicted Libido = mean of Low Dose group:
1
1
01 1
bXX
XbX
bbX
PlaceboLowDose
PlaceboLowDose
LowDose

Slide 12
ANOVA As Regression• We can run a regression with Libido as
the outcome and the Dose (Placebo or Low) as the predictor, Note:– Intercept is the mean of Placebo group– b for the Dummy Variable is the difference
between the means of the placebo and low dose group (4.88-3.22 = 1.66)
Coefficientsa
3.222 .547 5.888 .000
1.653 .798 .472 2.072 .056
(Constant)
Dummy Variable 1(Placebo vs. Low)
Model1
B Std. Error
UnstandardizedCoefficients
Beta
StandardizedCoefficients
t Sig.
Dependent Variable: Libidoa.

Slide 13
ANCOVA• ANCOVA extends this basic idea.• The covariate can be added to the
regression model of the ANOVA.• To evaluate the effect of the
experimental manipulation controlling for the covariate we enter the covariate into the model first (think back to hierarchical regression).
Covariate210 bXbbY ii
iii bDosebbLibido Libido sPartner'210

Slide 14
To Recap
• To control for the effect of a covariate all we do is do a multiple regression in which we enter the covariate in the first step.
• We enter Dose in a second step• The result is that we see the effect of
dose above and beyond the effect of the covariate.
Coefficientsa
.421 .534 .788 .443
.596 .082 .883 7.293 .000
-.362 .440 -.824 .424
.872 .094 1.291 9.295 .000
-1.847 .487 -.527 -3.795 .002
(Constant)
Partner's Libido
(Constant)
Partner's Libido
Dummy Variable 1(Placebo vs. Low)
Model1
2
B Std. Error
UnstandardizedCoefficients
Beta
StandardizedCoefficients
t Sig.
Dependent Variable: Libidoa.

Slide 15
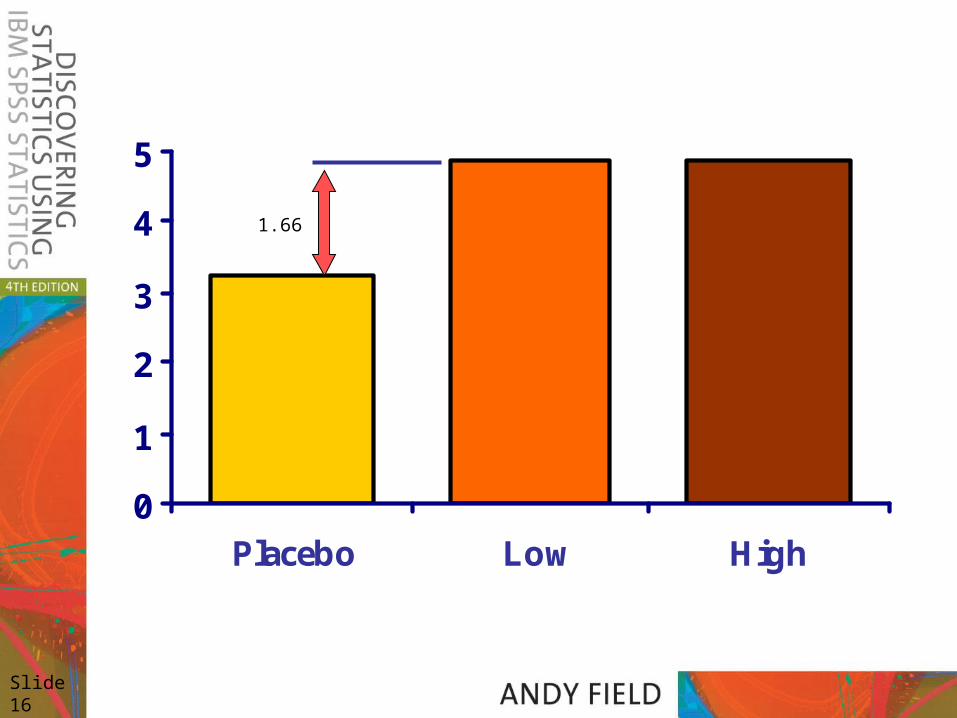
Slide 16
4.854.883.22
0
1
2
3
4
5
Placebo Low High
1.66

ANCOVA on IBM SPSS
Slide 17

Contrasts
Slide 18

Options
Slide 19

Slide 20
Without the Covariate
Tests of Between-Subjects Effects
Dependent Variable: Libido
16.844a 2 8.422 2.416 .108
535.184 1 535.184 153.522 .000
16.844 2 8.422 2.416 .108
94.123 27 3.486
683.000 30
110.967 29
SourceCorrected Model
Intercept
DOSE
Error
Total
Corrected Total
Type III Sumof Squares df Mean Square F Sig.
R Squared = .152 (Adjusted R Squared = .089)a.

Output
Slide 21

Slide 22
Output Continued

Slide 23
SPSS Output: Contrasts

Output: Pairwise Comparisons

Slide 25
4.854.883.22
0
1
2
3
4
5
Placebo Low High
3.22
4.88 4.85
Unadjusted Means

Slide 26
The Main Effect
2.934.71
5.15
0
2
4
6
8
10
Placebo Low High
F(2, 26) = 4.14, p < .05

Slide 27
The Covariate
F(1, 26) = 4.96, p < .05

Calculating the Effect Size of Main Effects

Calculating Effect Size of Contrasts

Reporting Main Effects
• The covariate, partner’s libido, was significantly related to the participant’s libido, F(1, 26) = 4.96, p = .035, r = .40. There was also a significant effect of Viagra on levels of libido after controlling for the effect of partner’s libido, F(2, 26) = 4.14, p = .027, partial η2 = .24.

Reporting Contrasts
• Planned contrasts revealed that having a high dose of Viagra significantly increased libido compared to having a placebo, t(26) = −2.77, p = .01, r = .48, but not compared to having a low dose, t(26) = −0.54, p = .59, r = .11.
Related Documents

![On the Covariance of Regression Coefficients · P. G. Bagos, M. Adam 681 methods such as the t-test, the Analysis of Variance (ANOVA) and the Analysis of Covariance (ANCOVA) [1] [2],](https://static.cupdf.com/doc/110x72/5f250afc6481ef7ddb0f724b/on-the-covariance-of-regression-coefficients-p-g-bagos-m-adam-681-methods-such.jpg)


![Analyse de la covariance ANCOVA. Exemple Modèle général linéaire de lANCOVA [valeur observée] = grande moyenne + [effet du traitement] + [effet de la.](https://static.cupdf.com/doc/110x72/551d9db5497959293b8da65e/analyse-de-la-covariance-ancova-exemple-modele-general-lineaire-de-lancova-valeur-observee-grande-moyenne-effet-du-traitement-effet-de-la.jpg)