1 Sleepiness, Sleep Disordered Breathing and Accident Risk Factors in Commercial Vehicle Drivers Mark E. Howard 1 , Anup V. Desai 2 , Ronald R. Grunstein 2 , Craig Hukins 3 , John G. Armstrong 3 , David Joffe 2 , Philip Swann 4 , Donald A. Campbell 5 , Robert J. Pierce 1 1 Institute of Breathing & Sleep, Austin Health and University of Melbourne, Victoria, Australia 2 Woolcock Institute of Medical Research University of Sydney, Royal Prince Alfred Hospital and Royal North Shore Hospitals, New South Wales, Australia 3 Princess Alexandra Hospital, Queensland, Australia 4 Department of Road Safety, Vicroads, Victoria, Australia 5 Monash Institute of Health Services Research, Monash Medical Centre, Victoria, Australia Reprint address: Dr Mark Howard, Institute of Breathing & Sleep, Bowen Centre, Austin Health, Heidelberg, Victoria, Australia, 3084 Corresponding author: Dr Mark Howard, Institute of Breathing & Sleep, Bowen Centre, Austin Health, Heidelberg, Victoria, Australia, 3084. Phone: 613 93871000, Fax: 613 94965124, Email: [email protected] Supported by grants from Vicroads and Roads and Traffic Authority of New South Wales, NHMRC Practitioner Fellowship for Professor Grunstein, NHMRC Postgraduate Scholarship Dr Howard, Community Health and Anti-Tuberculosis Association and CONROD Grant from Royal Australasian College of Physicians for Dr Desai. AJRCCM Articles in Press. Published on August 18, 2004 as doi:10.1164/rccm.200312-1782OC Copyright (C) 2004 by the American Thoracic Society.

Welcome message from author
This document is posted to help you gain knowledge. Please leave a comment to let me know what you think about it! Share it to your friends and learn new things together.
Transcript
1
Sleepiness, Sleep Disordered Breathing and Accident Risk Factors in
Commercial Vehicle Drivers
Mark E. Howard1, Anup V. Desai2, Ronald R. Grunstein2, Craig Hukins3, John G.
Armstrong3, David Joffe2, Philip Swann 4, Donald A. Campbell 5, Robert J. Pierce1
1 Institute of Breathing & Sleep, Austin Health and University of Melbourne, Victoria,
Australia
2 Woolcock Institute of Medical Research University of Sydney, Royal Prince Alfred
Hospital and Royal North Shore Hospitals, New South Wales, Australia
3 Princess Alexandra Hospital, Queensland, Australia
4 Department of Road Safety, Vicroads, Victoria, Australia
5 Monash Institute of Health Services Research, Monash Medical Centre, Victoria,
Australia
Reprint address: Dr Mark Howard, Institute of Breathing & Sleep, Bowen Centre,
Austin Health, Heidelberg, Victoria, Australia, 3084
Corresponding author: Dr Mark Howard, Institute of Breathing & Sleep, Bowen
Centre, Austin Health, Heidelberg, Victoria, Australia, 3084. Phone: 613 93871000,
Fax: 613 94965124, Email: [email protected]
Supported by grants from Vicroads and Roads and Traffic Authority of New South
Wales, NHMRC Practitioner Fellowship for Professor Grunstein, NHMRC
Postgraduate Scholarship Dr Howard, Community Health and Anti-Tuberculosis
Association and CONROD Grant from Royal Australasian College of Physicians for
Dr Desai.
AJRCCM Articles in Press. Published on August 18, 2004 as doi:10.1164/rccm.200312-1782OC
Copyright (C) 2004 by the American Thoracic Society.
2
Running Head: Sleep Disorders in Commercial Drivers
Descriptor Number: 108
Word count for body of manuscript: 3860
This article has an online data supplement, which is accessible from this issue's table
of content online at www.atsjournals.org

1
ABSTRACT
Sleep disordered breathing and excessive sleepiness may be more common in
commercial vehicle drivers than the general population. The relative importance of
factors causing excessive sleepiness and accidents in this population remains unclear. We
measured the prevalence of excessive sleepiness and sleep disordered breathing and
assessed accident risk factors in 2342 respondents to a questionnaire distributed to a
random sample of 3268 Australian commercial vehicle drivers and another 161 drivers
among 244 invited to undergo polysomnography. 59.6% of drivers had sleep disordered
breathing and 15.8% had obstructive sleep apnea syndrome. 24% of drivers had excessive
sleepiness. Increasing sleepiness was related to an increased accident risk. The sleepiest
5% of drivers on the Epworth Sleepiness Scale and Functional Outcomes of Sleep
Questionnaire had an increased risk of an accident (odds ratio 1.91, p=0.02 and 2.23,
p<0.01 respectively) and multiple accidents (odds ratio 2.67, p<0.01 and 2.39, p=0.01),
adjusted for established risk factors. There was an increased accident risk with narcotic
analgesic use (odds ratio 2.40, p<0.01) and antihistamine use (odds ratio 3.44, p=0.04).
Chronic excessive sleepiness and sleep disordered breathing are common in Australian
commercial vehicle drivers. Accident risk was related to increasing chronic sleepiness
and antihistamine and narcotic analgesic use.
Key Words: accidents traffic, antihistamines, narcotic analgesics, obesity
Word count for abstract: 200
2
INTRODUCTION
Motor vehicle accidents remain a common cause of injury and premature death (1).
Between 20 and 30 percent of accidents involving commercial vehicle drivers are sleep
related (2, 3). Sleep restriction, circadian rhythm effects and sleep disordered breathing
have been implicated as factors contributing to sleep related accidents, but their relative
contribution to sleepiness and accidents in the road transport industry is unclear. Several
studies have suggested that chronic excessive sleepiness is no more common amongst
commercial vehicle drivers than the general population (4-6). Studies assessing the
relationship between chronic excessive sleepiness and accidents have found conflicting
results for both subjective and objective tests of sleepiness and have not quantified the
degree of sleepiness that confers a high accident risk. (4, 7-10). Sleep disordered
breathing is associated with an increased crash risk in the general population (10-13).
Twenty-four percent of adult males of working age have sleep disordered breathing (14,
15). Although some studies have suggested that there may be a higher prevalence of sleep
disordered breathing amongst heavy vehicle drivers (6, 16) this is controversial. These
prevalence estimates have varied between different countries, which may be due, at least
in part, to varying frequencies of obesity (17).
Alcohol and cannabis contribute to road accidents in both the general community and
commercial vehicle drivers, with amphetamines also contributing to accidents in the latter
group (18, 19). Commonly used drugs, such as benzodiazepines, tricyclic antidepressants
and narcotic analgesics, have also been implicated as contributing factors to accidents in
the general community (20, 21). Their role in causing accidents in commercial vehicle
drivers has not been described.

3
We have undertaken a study to assess the prevalence of excessive sleepiness, sleep
disordered breathing and obesity amongst commercial vehicle drivers in Australia and to
evaluate which individual factors and work habits are associated with accident risk. Some
of the results of this study have been previously reported in the form of abstracts (22, 23).
METHODS
The study comprised two samples of commercial vehicle drivers. 3268 drivers were
invited to complete a questionnaire and anthropormorphic measurements. Another 244
drivers were also invited to attend in-laboratory polysomnography.
Questionnaire Sample
A simple random sample of 98 workplaces was selected from 395 workplaces on the
database of the Transport Workers Union in Australia. The workplaces were visited by
study investigators and questionnaires distributed to the drivers. Questionnaires were
completed without assistance and returned anonymously. The questionnaire included
demographics, sleep and work habits and self reported accidents from the preceding three
years (Appendix E1, online supplement). The Multivariable Apnea Prediction
questionnaire was used to assess the probability of having sleep disordered breathing
(24). Sleepiness was measured using the Epworth Sleepiness Scale (25). A score of 11 or
more was used to indicate excessive sleepiness (5). The Functional Outcomes of Sleep
Questionnaire was included to measure sleep related quality of life (26). Height and
weight were measured by the investigators.

4
Polysomnography Sample
For the polysomnography sample we randomly selected 244 drivers from the databases of
the Transport Workers Union. We collected data on age, gender, height and weight from
drivers who declined to participate. Drivers who agreed to participate underwent full in
laboratory polysomnography (Compumedics S series, Compumedics Melbourne,
Australia) in addition to completing the questionnaire described above. Sleep staging and
scoring of respiratory events was performed according to standard criteria (27, 28). A
respiratory disturbance index (RDI) of five events per hour or above was considered
consistent with sleep disordered breathing. Obstructive sleep apnea syndrome was
defined as an RDI of at least five together with an Epworth Sleepiness Scale Score of 11
or more.
Statistical Methods
Adjustments were made for analyses of the questionnaire sample to account for cluster
sampling (see online supplement). Demographic variables, which were normally
distributed, are described as mean and standard deviation with comparison between
groups made with the student T-test. Categorical variables are reported as proportions
with 95% confidence intervals. We used the Multivariable Apnea Prediction Score to
estimate the prevalence of sleep disordered breathing in the questionnaire sample (see
online supplement(29)).
Multivariate logistic regression was used to assess the relationship between excessive
sleepiness and personal and work related factors, adjusted for age. Similarly, to assess the
relationship between potential explanatory variables and accident risk we calculated odds
ratios adjusted for age, alcohol intake and hours of driving (established major accident

5
risk factors (30-32)). We performed the same analysis with sleepiness classified as a
categorical variable. Forward stepwise logistic regression analysis was performed with
sleepiness and accidents as dependant variables. We included explanatory variables with
an alpha of less than 0.10 on univariate analysis. Analysis of variance was used to assess
the relationship between sleepiness and the different severities of sleep disordered
breathing. A two-sided P value (or multisided where appropriate) of less than 0.05 was
considered to indicate statistical significance.
Written informed consent was obtained from study participants. The protocol was
approved by the Human Research and Ethics Committees at each participating institution.
RESULTS
Response Rate and Demographic Features
There was an average of 33.3 drivers (SD 42.5, median 22.3) at each workplace, with a
range of 4 to 318. Of 3268 drivers invited to participate in the questionnaire sample,
2342 drivers (72%) returned completed questionnaires. Ninety-nine percent of drivers in
the sample were male compared to 97% of drivers on the Transport Workers Union
database. Mean age for drivers in the sample was 42.4 years compared to 45.0 years for
those on the database. Drivers in the questionnaire sample were younger than those in the
polysomnography sample, but there was no difference in other risk factors for sleep
disordered breathing, or the degree of sleepiness (Table 1). They had a lower average
Multivariable Apnea Prediction Score.

6
161 drivers completed overnight polysomnography, 66% of the 244 invited in the
polysomnography sample. There was no difference in age, height, weight or proportion of
males for drivers who completed polysomnography compared to those who declined to
participate (Table 2). 84% of drivers were overweight or obese (Table 1).
Prevalence of Excessive Sleepiness and Sleep Disordered Breathing
59.6% (95% confidence interval (CI) 51.6% to 67.3%) of drivers in the polysomnography
sample had sleep disordered breathing (Table 1). Sixteen percent had obstructive sleep
apnea syndrome (excessive sleepiness and sleep disordered breathing). Thirty-six percent
of drivers in the questionnaire sample had a high Multivariable Apnea Prediction Score
(> 0.5). A score of 0.5 produced a positive predictive value for at least mild sleep
disordered breathing (RDI > 5) of 0.74 and a negative predictive value of 0.57. Using
these values we estimated a prevalence of 54.0% (95% CI 47.2% to 60.8%) for at least
mild sleep disordered breathing in the questionnaire sample, compared to 59.6%
measured directly in the polysomnography sample (29).
Twenty-four percent of drivers in both the polysomnography and questionnaire samples
had excessive sleepiness (5). The degree of sleepiness increased with increasing severity
of sleep disordered breathing on polysomnography. Mean Epworth Sleepiness Scale
Score was 6.8 for those with normal polysomnography (RDI <5) and 7.4, 9.0 and 9.9 for
those with mild, moderate and severe sleep disordered breathing respectively (F (3, 154)
=3.3, p=0.02).
Factors Associated with Excessive Sleepiness
Adjusted for age, there was an increased odds of excessive sleepiness with an increase in
the Multivariable Apnea Prediction Score, hours worked per week and afternoon or night
7
shift work (Table 3, Table 4). Obtaining more sleep on days off, increasing stimulant use
and caffeine intake were also associated with increased sleepiness.
In a forward stepwise logistic regression model for excessive sleepiness the Multivariable
Apnea Prediction Score entered first, followed respectively by hours of sleep on work
days, past history of sleep apnea or heart disease and hours of sleep on days off. The odds
of excessive sleepiness increased by 50 percent (odds ratio 1.56, 95% CI, 1.37 to 1.78)
for an increase in the Multivariable Apnea Prediction Score of 1 standard deviation (SD
0.19, range 0 to 1.00). Drivers who averaged less than 7 hours of sleep per night during
the working week were more likely to report excessive sleepiness than those who had 7-8
hours of sleep per night. For those who averaged less than 5 hours per night the odds ratio
for excessive sleepiness was 2.74 (95% CI, 1.84 to 4.08). The odds of reporting excessive
sleepiness actually increased in those who had more than 8 hours of sleep, with an odds
ratio of 5.62 for more than 9 hours (95% CI, 1.93 to 16.34).
Factors Associated with Self-reported Accidents in the Preceding three years
2079 of 2342 drivers (88.8%) answered the questions about accidents. 739 drivers
(35.5%, 95% CI, 32.1% to 38.9%) had a total of 1407 accidents in the previous three
years, with 48.3% of these drivers having had more than one accident (95% CI, 44.3% to
52.3%). Most accidents were work related (81.6%, 95% CI, 78.7% to 84.4%). We
assessed the relationship between accident risk over the preceding three years and
personal and work related factors using odds ratios adjusted for the established risk
factors age, alcohol and hours of driving per week (Tables 3 and 4). We also evaluated
the relationship between accident risk adjusted for established risk factors and categories
of chronic sleepiness (Epworth Sleepiness Scale) and the functional impact of sleep
8
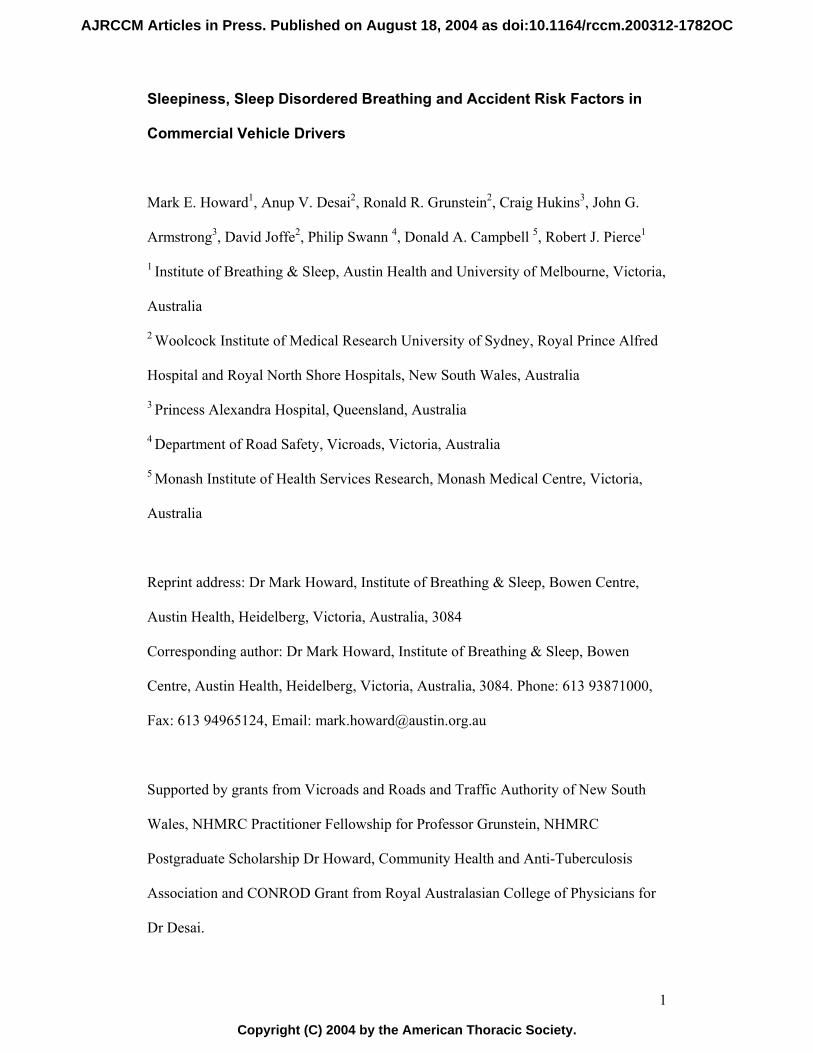
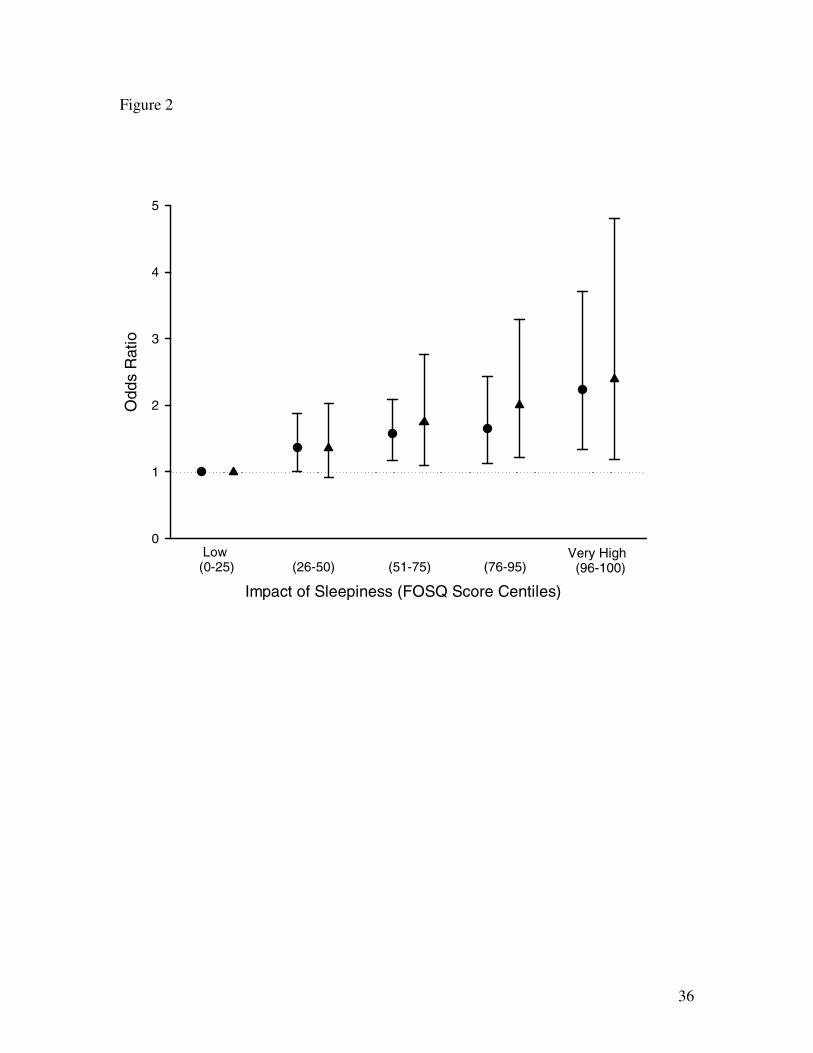
(Functional Outcomes of Sleep Questionnaire) (Figures 1 and 2). There was an increased
risk of an accident with increasing excessive sleepiness. Those with a very high level of
sleepiness (Epworth Sleepiness Scale score of 18 to 24, sleepiest 5% of drivers) had an
increased risk of any accident (odds ratio 1.91, 95% CI, 1.09 to 3.35) and of multiple
accidents (odds ratio 2.67, 95% CI, 1.29 to 5.52). A similar relationship was evident
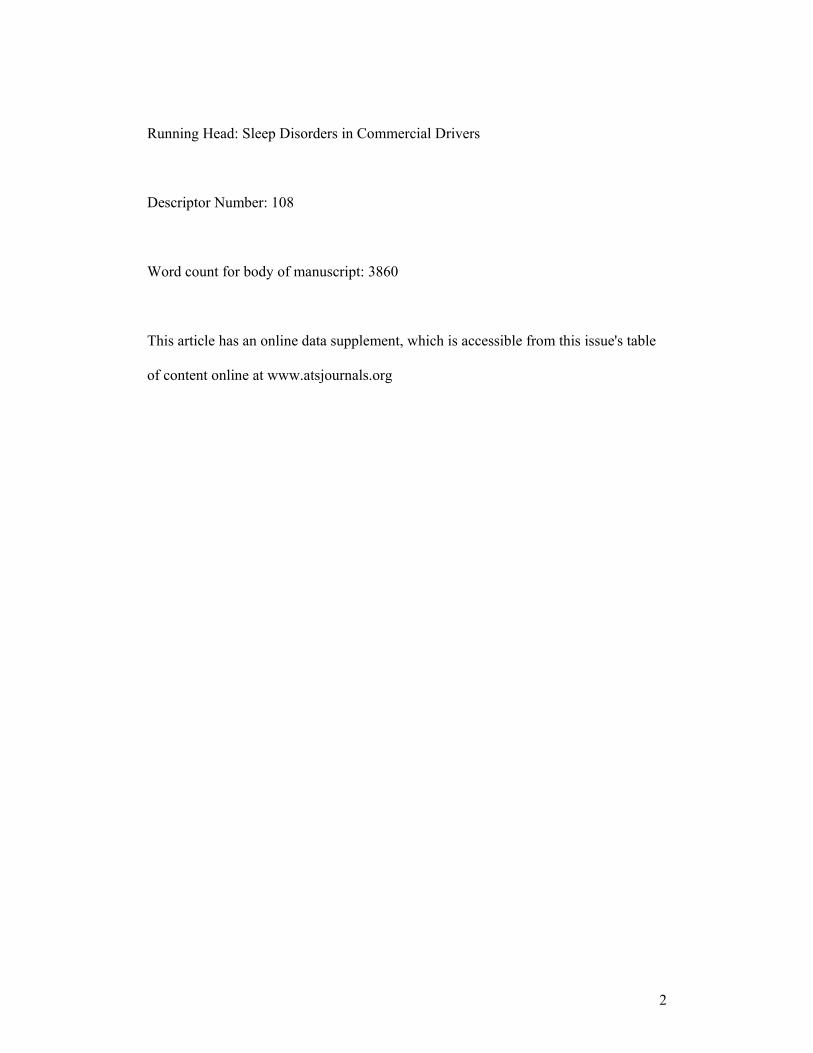
between the Functional Outcomes of Sleep Questionnaire total score and accident risk
(Figure 2). The sleepiest five percent of drivers had an odds ratio of 2.23 for having an
accident (95% CI, 1.34 to 3.71) and 2.39 for multiple accidents (95% CI, 1.19 to 4.80).
The Multivariable Apnea Prediction Score was weakly related to the risk of a single
vehicle accident (odds ratio 1.14, 95% CI, 0.99 to 1.33, P=0.07), but not to total accident
history (Table 3). Those with symptoms of obstructive sleep apnea syndrome (Epworth
Sleepiness Scale Score >11 and Multivariable Apnea Prediction Score >0.50) had a
higher risk of any accident (Table 3), and of a single vehicle accident (odds ratio 1.63,
95% CI, 1.08-2.48). In the polysomnography group there was no relationship between
severity of sleep disordered breathing and accident risk (odds ratio 0.82, 95% CI, 0.15
to3.57 for change in RDI of 1 standard deviation).
Frequency of use of narcotic analgesics, antihistamines and benzodiazepines was related
to accident risk, but stimulant use was not (Table 3). Altogether 4% of drivers used one
of these drugs (see table E2, online supplement). Narcotic analgesic use (odds ratio 2.17,
95% CI, 1.31-3.60) and benzodiazepine use (odds ratio 3.21, 95% CI, 1.25-8.24) were
also related to the risk of multiple accidents. Having more sleep on days off, working
night shift and country or interstate driving were related to a lower accident risk (Table
4).
9
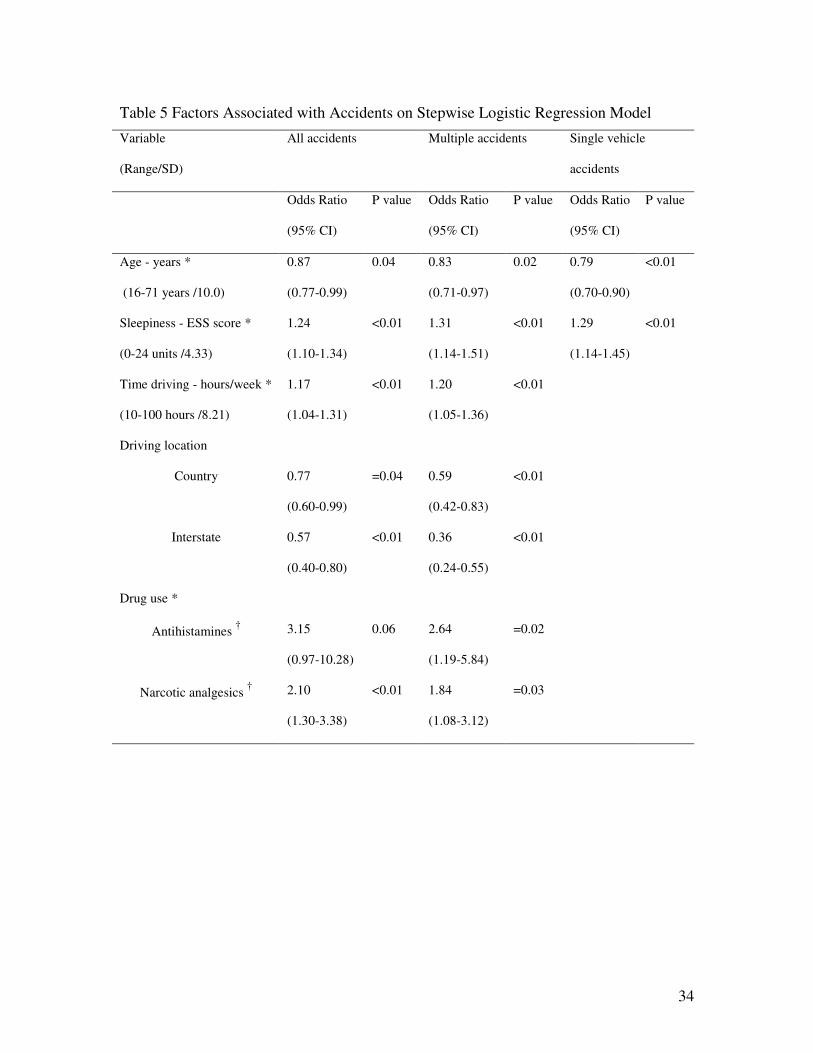
A forward stepwise selection model identified sleepiness (Epworth Sleepiness Scale
Score), time spent driving, interstate and country driving, narcotic analgesic use and age
as the strongest independent predictors of accident risk (Table 5). The same variables
were included in a model for risk of having multiple accidents, with antihistamine use as
an additional factor. Sleepiness followed by age, were the only factors included in a
model for single vehicle accidents.
DISCUSSION
We found a high prevalence of excessive sleepiness, sleep disordered breathing and
obesity amongst commercial vehicle drivers. Excessive sleepiness was predominantly
related to sleep disordered breathing risk and hours of sleep, with increasing sleepiness in
those averaging less than 7 hours of sleep. We identified a relationship between narcotic
analgesic and antihistamine use and motor vehicle accidents, which was independent
from other potentially confounding factors such as age, alcohol intake, driving exposure
and sleepiness. To our knowledge this has not been previously identified in this
population. We have also quantified a relationship between subjective excessive
sleepiness and accident risk using two independent measures of sleepiness.
Sleep Disordered Breathing
Sixty percent of drivers had sleep disordered breathing and sixteen percent had
obstructive sleep apnea syndrome, compared respectively with twenty-four percent and
four percent of working males in the general community (14, 15). Previous studies
identified sleep disordered breathing in between 25 and 78 percent of commercial drivers

10
(6, 16, 33-35). Some of these studies selected drivers from isolated areas of the transport
industry and may not be representative of the whole industry (6, 16). Other studies were
limited by a small sample size (6). Some studies used screening devices for diagnosis,
which might affect the prevalence estimate (6, 33, 36). Stoohs found the highest
prevalence of 78 percent amongst American truck drivers (16). This study was performed
at a single company and drivers were not randomly selected, hence the sample may not
be representative of the broader population of drivers. The prevalence of obesity varies
between countries and this could affect the prevalence of sleep disordered breathing
within the different populations (17, 37). A Spanish study found the lowest prevalence of
sleep disordered breathing in commercial vehicle drivers at 25% (34). Obesity was less
common in this study compared to Stoohs’ study and our study, which could explain their
relatively low prevalence. In a recent American study, 406 drivers were sampled from
1391 respondents to a questionnaire and studied with full in laboratory polysomnography
(35). 28.1% of drivers had sleep disordered breathing and, similar to our study, obesity
was common. A low initial response rate to the questionnaire raises the possibility of
response bias, although age and gender were similar between respondents and non-
respondents. A higher proportion of women and more stringent criteria for scoring
respiratory events in this study may explain the lower prevalence compared to our study.
The combination of a predominantly male population, obesity, the age distribution and
sleep deprivation could account for the high prevalence of sleep disordered breathing in
this population. Males are 2.5 times more likely to have sleep disordered breathing and
99 percent of our drivers were male (14). Increasing weight is associated with a higher
risk of sleep disordered breathing (17). Forty-two percent of our drivers were obese,
11
compared to 16 percent of subjects in the Australian general population study of sleep
disordered breathing and 16 percent of adult Australian males (15, 38). Finally, sleep
deprivation may increase the severity of sleep disordered breathing (39). Seventeen
percent of our drivers averaged five hours of sleep or less, which might increase the
prevalence of sleep disordered breathing.
Excessive Sleepiness
Twenty-four percent of drivers had chronic excessive sleepiness, compared to 10.9
percent of working adults in another Australian study (5). Sleep disordered breathing was
associated with increasing sleepiness. Thirty-seven percent of drivers were involved in
night shift work, which is associated with excessive sleepiness (40). Chronic sleep
restriction was also common. It was associated with excessive sleepiness in those
averaging less than 7 hours of sleep per night. This supports laboratory evidence
demonstrating that chronic sleep restriction increases sleepiness and impairs psychomotor
functions that are important for driving, such as vigilance and reaction time (41).
Accident Risk
We found a relationship between accident risk and chronic sleepiness using both the
Epworth Sleepiness Scale and Functional Outcomes of Sleep Questionnaire. There was a
twofold increased risk of an accident in the sleepiest 5% of drivers. This relationship was
even stronger with multiple accidents. To our knowledge a relationship between the
Functional Outcomes of Sleep Questionnaire and accident risk has not previously been
reported, although several authors have found an association between the Epworth
Sleepiness Scale and accident risk. Powell found an increased average Epworth
Sleepiness Scale score in drivers with four or more accidents (8). In a large case control

12
study drivers who had sleep related accidents were much more likely to have excessive
sleepiness (9). However, other authors have not found any significant relationship
between a high Epworth Sleepiness Scale Score and accident risk (7, 10). Our study,
together with others (8, 9, 33, 42-44), suggest that self-report measures of sleepiness
could be used to identify drivers with excessive sleepiness who are at increased accident
risk. Although treatment of sleep disordered breathing reduces accident risk (12, 45) it
has not been proven that other interventions that reduce sleepiness will reduce accident
risk.
The degree of risk imparted by severe chronic sleepiness was similar to that of regular
cellular phone use while driving (46) or driving just over the legal blood alcohol limit in
Australia (0.05 to 0.07%), although higher blood alcohol concentrations convey a much
higher accident risk (47). Similarly driving at night, up to about 2 am, doubles the risk of
having an accident, whilst driving later at night results in a higher accident risk (48-50).
General population studies have shown an increased risk of accidents in those with
obstructive sleep apnea, but this has not been demonstrated in commercial vehicle
drivers. (10, 12, 13, 42, 51, 52). In our study the Multivariable Apnea Prediction Score
was related to an increased risk of single vehicle accidents, but not all accidents.
Sleepiness related vehicle accidents are more likely to be single vehicle accidents, which
could explain the latter finding (31). It is interesting that sleepiness was predictive of
accident risk, whilst the Multivariable Apnea Prediction Score was not strongly
predictive. It is possible that there is a survival effect and that those with significant sleep
disorders and sleepiness leave the industry because of their symptoms or because they
have an accident. Given that both sleepiness and sleep disordered breathing were very
13
common amongst our drivers it seems unlikely that this is a major effect. The moderate
accuracy of the Multivariable Apnea Prediction Score for predicting sleep disordered
breathing would also tend to reduce the likelihood of finding an association with accident
risk. We did not find any relationship between severity of sleep disordered breathing and
accident risk in the polysomnography group either. This could be a true finding, but
several factors may have resulted in a false negative finding. As described above there
could be a survivor bias. The crash data for this group was not anonymous, which would
increase the likelihood of reporting bias. Finally this sample was not powered to detect
such a relationship. We estimate that a sample of at least 328 drivers would be required to
demonstrate a twofold increase in accident risk in those with sleep disordered breathing.
There was an increased accident risk in drivers using antihistamines and narcotic
analgesics and a weaker relationship with benzodiazepine use. Benzodiazepines and
tricyclic antidepressants have previously been linked to increased accident risk (53, 54).
Leveille found an increased risk for crashes of 1.8 in elderly drivers using opiate
analgesics, but this has not been demonstrated in younger drivers (55). Kay suggests that
sedating antihistamines increase accident risk and our data supports this (56).
Antihistamines impair simulated driving performance to a similar degree to alcohol and
interestingly this is not associated with sleepiness (57).
We found a lower accident rate in those involved in country and interstate driving and
night shift. Our accident definition included minor accidents with property damage only
in addition to accidents involving injuries. Traffic density is related to increased accident
risk, although accidents in traffic dense urban areas tend to occur at lower speeds and
hence are less likely to cause serious injury or result in death (58). Lower traffic density

14
in country, interstate and night driving is the most likely explanation for the lower
accident rates we found in these groups.
Current Study
The strengths of our prevalence study include the large randomly selected samples of
drivers and high response rate. We used full laboratory polysomnography to diagnose
sleep disordered breathing in our polysomnography sample and were able to assess the
diagnostic accuracy of the Multivariable Apnea Prediction Score for use in our larger
questionnaire sample. Our polysomnography sample appeared to be representative of the
population, being similar to the larger questionnaire sample for the major risk factors for
sleep disordered breathing, apart from being older. We also estimated the prevalence of
sleep disordered breathing in the questionnaire sample, which at 54 percent was still
much higher than the general population.
The use of subjective measures of sleepiness and self report of accidents may lead to
underestimation of the degree of sleepiness and accident rates or measurement bias.
However we found a higher accident rate (4, 59) and prevalence of sleepiness (4, 5) than
previous authors, suggesting that drivers did not tend to underreport these problems.
There would still be the potential for a survival bias resulting in fewer serious accidents
and no fatal to the driver accidents being included in our study (45). Reporting of
accidents in Australia is only mandatory if someone is injured, and it is not possible to
link insurance data to individuals who drive for companies. Hence these sources would
have underestimated accident rates. Drivers with symptoms of sleepiness or sleep
disordered breathing may under-report accidents because of concerns for job security,
which would tend to weaken any association between these disorders and accidents.

15
Whilst a positive bias for reporting of accidents by subjects with sleep disorders is
possible this seems unlikely.
Of the established objective and subjective tests for chronic sleepiness only the Epworth
Sleepiness Scale, a subjective test, has been shown to correlate with accident risk (4, 10).
We used two independent subjective measures of chronic sleepiness, which showed
strikingly similar relationships between increasing sleepiness and increased accident risk.
Both of the sleepiness measures we used report on stable, trait like characteristics of
sleepiness (25, 26). Any individual can reach a severe level of sleepiness as a result of
recent sleep deprivation or circadian rhythm effects (sleepiness state rather than trait),
without being chronically sleepy. The commonly used objective measures of sleepiness
(the multiple sleep latency test and maintenance of wakefulness test) are influenced by
these recent sleep habits as well as the chronic level of sleepiness (60, 61). Prior sleep
patterns need to be controlled in order to perform these tests optimally, but this is difficult
to do in commercial vehicle drivers because of their very irregular sleep and work
patterns. The study used a clustered sampling design for the questionnaire sample,
selecting truck yards rather than randomly selecting commercial vehicle drivers.
Adjustments needed to be made for the design effect in the statistical analysis (see online
supplement), resulting in wider confidence intervals. However this design enabled us to
obtain a large sample of drivers with a good response rate, which may not have been
possible otherwise.
In conclusion we have found a high prevalence of sleep disordered breathing and
excessive sleepiness amongst commercial vehicle drivers. Obesity was common, which at
least partially explains the high prevalence of sleep disordered breathing. Sleep apnea and
16
sleep duration were the main factors related to excessive sleepiness. There was an
increased accident risk in those with excessive sleepiness, and narcotic analgesic or
antihistamine use. Interventions to reduce sleepiness amongst professional drivers may
reduce accident risk. Physicians and drivers also need to be aware of medications that
may increase accident risk.

17
Acknowledgments We gratefully acknowledge The Transport Workers Union of
Australia for assistance with recruiting companies and drivers, Dr Guy Marks for
assistance with analyzes of data and, Dr Jonathan Williamson and Dr Ben Harris for
collecting data. This paper is dedicated to the late Dr Helen Bearpark.
18
REFERENCES
1. Van Der Weyden M. The Burden of Disease and Injury in Australia: Time for
Action. MJA 1999;171(6):581-2.
2. House of Representatives Standing Committee on Communication, Transport and
the Arts. "Beyond The Midnight Oil", An Inquiry Into Managing Fatigue In Transport.
Canberra: The Parliament of the Commonwealth of Australia; October 2000. Available
from: URL:
http://www.aph.gov.au/house/committee/cta/manfatigue/report/mfcontents.htm
3. Akerstedt T. Consensus statement: fatigue and accidents in transport operations.
Journal of Sleep Research. 2000;9(4):395.
4. Maycock G. Sleepiness and driving: the experience of heavy goods vehicle
drivers in the UK. J Sleep Res 1997;6(4):238-44.
5. Johns M, Hocking B. Daytime sleepiness and sleep habits of Australian workers.
Sleep 1997;20(10):844-9.
6. Hui D, Chan J, Ko F, Choy D, Li T, Chan A, Wong K, Lai C. Prevalence of
snoring and sleep-disordered breathing in a group of commercial bus drivers in Hong
Kong. Intern Med J 2002;32:149-157.
7. Masa JF, Rubio M, Findley LJ. Habitually sleepy drivers have a high frequency of
automobile crashes associated with respiratory disorders during sleep. Am J Respir Crit
Care Med 2000;162(4 Pt 1):1407-12.
8. Powell NB, Schechtman KB, Riley RW, Li K, Guilleminault C. Sleepy driving:
accidents and injury. Otolaryngology - Head & Neck Surgery. 2002;126(3):217-27.
19
9. University of North Carolina Highway Research Center and School of Medicine.
Why Do People Have Drowsy Driver Crashes? Washington, D.C.: AAA Foundation for
Traffic Safety; November. 2003 May. Available from:
http://www.aaafoundation.org/pdf/sleep.pdf
10. Young T, Blustein J, Finn L, Palta M. Sleep-disordered breathing and motor
vehicle accidents in a population- based sample of employed adults. Sleep
1997;20(8):608-13.
11. Findley LJ, Unverzagt ME, Suratt PM. Automobile accidents involving patients
with obstructive sleep apnea. Am Rev Respir Dis 1988;138(2):337-40.
12. George CF. Reduction in motor vehicle collisions following treatment of sleep
apnoea with nasal CPAP. Thorax 2001;56(7):508-12.
13. Teran-Santos J, Jimenez-Gomez A, Cordero-Guevara J. The association between
sleep apnea and the risk of traffic accidents. Cooperative Group Burgos-Santander. N
Engl J Med 1999;340(11):847-51.
14. Young T, Palta M, Dempsey J, Skatrud J, Weber S, Badr S. The occurrence of
sleep-disordered breathing among middle-aged adults. N Engl J Med 1993;328(17):1230-
5.
15. Bearpark H, Elliott L, Grunstein R, Cullen S, Schneider H, Althaus W, Sullivan
C. Snoring and sleep apnea. A population study in Australian men. Am J Respir Crit Care
Med 1995;151(5):1459-65.
16. Stoohs RA, Bingham LA, Itoi A, Guilleminault C, Dement WC. Sleep and sleep-
disordered breathing in commercial long-haul truck drivers. Chest 1995;107(5):1275-82.

20
17. Young T, Shahar E, Nieto FJ, Redline S, Newman AB, Gottlieb DJ, Walsleben
JA, Finn L, Enright P, Samet JM, Sleep Heart Health Study Research G. Predictors of
sleep-disordered breathing in community-dwelling adults: the Sleep Heart Health Study.
Arch Intern Med 2002;162(8):893-900.
18. Kintz P, Cirimele V, Mairot F, Muhlmann M, Ludes B. [Drug tests on 198 drivers
involved in an accident]. Presse Medicale. 2000;29(23):1275-8.
19. Vicroads. Drugs, Alcohol and Fatigue in Heavy Vehicle Safety. Melbourne,
Victoria: State Government of Victoria; 2002 October. Available from: URL:
http://www.ntc.gov.au/filemedia/publications/drugsalcoholfatigueinhvsafetydrp.pdf
20. Skegg DC, Richards SM, Doll R. Minor tranquillisers and road accidents. Br Med
J 1979;1(6168):917-9.
21. Chesher GB. The influence of analgesic drugs in road crashes. Accid Anal Prev
1985;17(4):303-9.
22. Howard M, Worsnop C, Campbell D, Swann P, Pierce R. Sleep Disordered
Breathing In Victorian Transport Drivers. Am J Respir Crit Care Med 2001;163(5):A933.
23. Howard M, Worsnop C, Campbell D, Swann P, Pierce R. Transport Drivers are
Sleepier than Working Adults and their Vehicle Accidents are Related to Duration of
Sleep and Work. Respirology 2000;5(Supplement):A65.
24. Maislin G, Pack AI, Kribbs NB, Smith PL, Schwartz AR, Kline LR, Schwab RJ,
Dinges DF. A survey screen for prediction of apnea. Sleep 1995;18(3):158-66.
25. Johns MW. A new method for measuring daytime sleepiness: the Epworth
sleepiness scale. Sleep 1991;14(6):540-5.
21
26. Weaver TE, Laizner AM, Evans LK, Maislin G, Chugh DK, Lyon K, Smith PL,
Schwartz AR, Redline S, Pack AI, Dinges DF. An instrument to measure functional
status outcomes for disorders of excessive sleepiness. Sleep 1997;20(10):835-43.
27. Sleep-related breathing disorders in adults: recommendations for syndrome
definition and measurement techniques in clinical research. The Report of an American
Academy of Sleep Medicine Task Force. Sleep 1999;22(5):667-89.
28. Rechtschaffen A, Kales A. A manual of standardized terminolgy, techniques and
scoring system for sleep stages in human subjects. The National Institutes of Health;
Washington DC 1968.
29. Marshall RJ. Validation study methods for estimating exposure proportions and
odds ratios with misclassified data. J Clin Epidemiol 1990;43(9):941-7.
30. Glucksman E. Alcohol and accidents. Br Med Bull 1994;50(1):76-84.
31. Pack AI, Pack AM, Rodgman E, Cucchiara A, Dinges DF, Schwab CW.
Characteristics of crashes attributed to the driver having fallen asleep. Accid Anal Prev
1995;27(6):769-75.
32. Summala H, Mikkola T. Fatal accidents among car and truck drivers: effects of
fatigue, age, and alcohol consumption. Hum Factors 1994;36(2):315-26.
33. Carter N, Ulfberg J, Nystrom B, Edling C. Sleep debt, sleepiness and accidents
among males in the general population and male professional drivers. Accid Anal Prev
2003;35(4):613-7.
34. Diaz J, Guallar J, Arnedo A, Oliva S, Gala J. [The prevalence of sleep apnea-
hypopnea syndrome among long-haul professional drivers]. Arch Bronconeumol
2001;37(11):471-476.
22
35. Pack AI, Dinges DF, Maislin G. A study of the prevalence of sleep apnea among
commercial truck drivers. Washington: FMCSA; May 2002. Publication No. DOT-RT-
02-030.
36. Stoohs RA, Guilleminault C, Itoi A, Dement WC. Traffic accidents in commercial
long-haul truck drivers: the influence of sleep-disordered breathing and obesity. Sleep.
1994;17(7):619-23.
37. Wang Y, Monteiro C, Popkin BM. Trends of obesity and underweight in older
children and adolescents in the United States, Brazil, China, and Russia. Am J Clin Nutr
2002;75(6):971-7.
38. National Health Survey - Summary of Results, Australia. Canberra. Australian
Bureau of Statistics. 2001. Available from: URL:
http://www.abs.gov.au/ausstats/abs%40.nsf
39. Persson HE, Svanborg E. Sleep deprivation worsens obstructive sleep apnea.
Comparison between diurnal and nocturnal polysomnography. Chest. 1996;109(3):645-
50.
40. Akerstedt T, Torsvall L, Gillberg M. Sleepiness in shiftwork. A review with
emphasis on continuous monitoring of EEG and EOG. Chronobiol Int 1987;4(2):129-40.
41. Van Dongen HP, Maislin G, Mullington JM, Dinges DF. The Cumulative Cost of
Additional Wakefulness: Dose-Response Effects on Neurobehavioral Functions and
Sleep Physiology From Chronic Sleep Restriction and Total Sleep Deprivation. Sleep
2003;26(2):117-126.
42. Lloberes P, Levy G, Descals C, Sampol G, Roca A, Sagales T, de la Calzada MD.
Self-reported sleepiness while driving as a risk factor for traffic accidents in patients with

23
obstructive sleep apnoea syndrome and in non-apnoeic snorers. Respir Med
2000;94(10):971-6.
43. Noda A, Yagi T, Yokota M, Kayukawa Y, Ohta T, Okada T. Daytime sleepiness
and automobile accidents in patients with obstructive sleep apnea syndrome. Psychiatry
Clin Neurosci 1998;52(2):221-2.
44. Maycock G. Sleepiness and driving: the experience of UK car drivers. J Sleep Res
1996;5(4):229-37.
45. Findley L, Smith C, Hooper J, Dineen M, Suratt PM. Treatment with nasal CPAP
decreases automobile accidents in patients with sleep apnea. Am J Respir Crit Care Med.
2000;161(3 Pt 1):857-9.
46. Laberge-Nadeau C, Maag U, Bellavance F, Lapierre SD, Desjardins D, Messier S,
Saidi A. Wireless telephones and the risk of road crashes. Accid Anal Prev.
2003;35(5):649-60.
47. Hurst PM, Harte D, Frith WJ. The Grand Rapids dip revisited. Accid Anal Prev.
1994;26(5):647-54.
48. Akerstedt T, Kecklund G, Horte LG. Night driving, season, and the risk of
highway accidents. Sleep. 2001;24(4):401-6.
49. Rice TM, Peek-Asa C, Kraus JF. Nighttime driving, passenger transport, and
injury crash rates of young drivers. Inj Prev. 2003;9(3):245-50.
50. Folkard S. Black times: temporal determinants of transport safety. Accid Anal
Prev 1997;29(4):417-30.

24
51. Barbe, Pericas J, Munoz A, Findley L, Anto JM, Agusti AG. Automobile
accidents in patients with sleep apnea syndrome. An epidemiological and mechanistic
study. Am J Respir Crit Care Med 1998;158(1):18-22.
52. Horstmann S, Hess CW, Bassetti C, Gugger M, Mathis J. Sleepiness-related
accidents in sleep apnea patients. Sleep 2000;23(3):383-9.
53. Christensen LQ, Nielsen LM, Nielsen SL. Traffic accidents and drivers suspected
for drug influence. Forensic Sci Int 1990;45(3):273-80.
54. Ray WA, Fought RL, Decker MD. Psychoactive drugs and the risk of injurious
motor vehicle crashes in elderly drivers. Am J Epidemiol 1992;136(7):873-83.
55. Leveille SG, Buchner DM, Koepsell TD, McCloskey LW, Wolf ME, Wagner EH.
Psychoactive medications and injurious motor vehicle collisions involving older drivers.
Epidemiology. 1994;5(6):591-8.
56. Kay GG, Quig ME. Impact of sedating antihistamines on safety and productivity.
Allergy Asthma Proc. 2001;22(5):281-3.
57. Weiler JM, Bloomfield JR, Woodworth GG, Grant AR, Layton TA, Brown TL,
McKenzie DR, Baker TW, Watson GS. Effects of fexofenadine, diphenhydramine, and
alcohol on driving performance. A randomized, placebo-controlled trial in the Iowa
driving simulator.[comment]. Annal Intern Med 2000;132(5):354-63.
58. Greibe P. Accident prediction models for urban roads. Accid Anal Prev
2003;35(2):273-285.
59. Maislin G, Dinges G, Woodle C, Pack A. Apnoea risk as determined by a short
self-administered assessment tool is associated with crash rates in a population of
commercial motor vehicle operators. Sleep Research 1997;26:A421.

25
60. Sugerman JL, Walsh JK. Physiological sleep tendency and ability to maintain
alertness at night. Sleep 1989;12(2):106-12.
61. Bishop C, Roehrs T, Rosenthal L, Roth T. Alerting effects of methylphenidate
under basal and sleep-deprived conditions. Experimental & Clinical
Psychopharmacology. 1997;5(4):344-52.

26
Figure Legends
Figure1
Accident risk related to subjective sleepiness (Epworth Sleepiness Scale). ● represents
odds ratio for one or more accidents and ▲ the odds ratio for multiple accidents. Error
bars represent 95 percent confidence intervals for the odds ratios. Odds ratios are adjusted
for age, average daily alcohol intake and hours of driving per week. Definition of
abbreviation: ESS = Epworth Sleepiness Scale.
Figure2
Accident risk related to impact of sleepiness (Functional Outcomes of Sleep
Questionnaire). ● represents odds ratio for one or more accidents and ▲ the odds ratio
for multiple accidents. Error bars represent 95 percent confidence intervals for the odds
ratios. Odds ratios are adjusted for age, average daily alcohol intake and hours of driving
per week. Definition of abbreviation: FOSQ = Functional Outcomes of Sleep
Questionnaire.
27
Footnotes
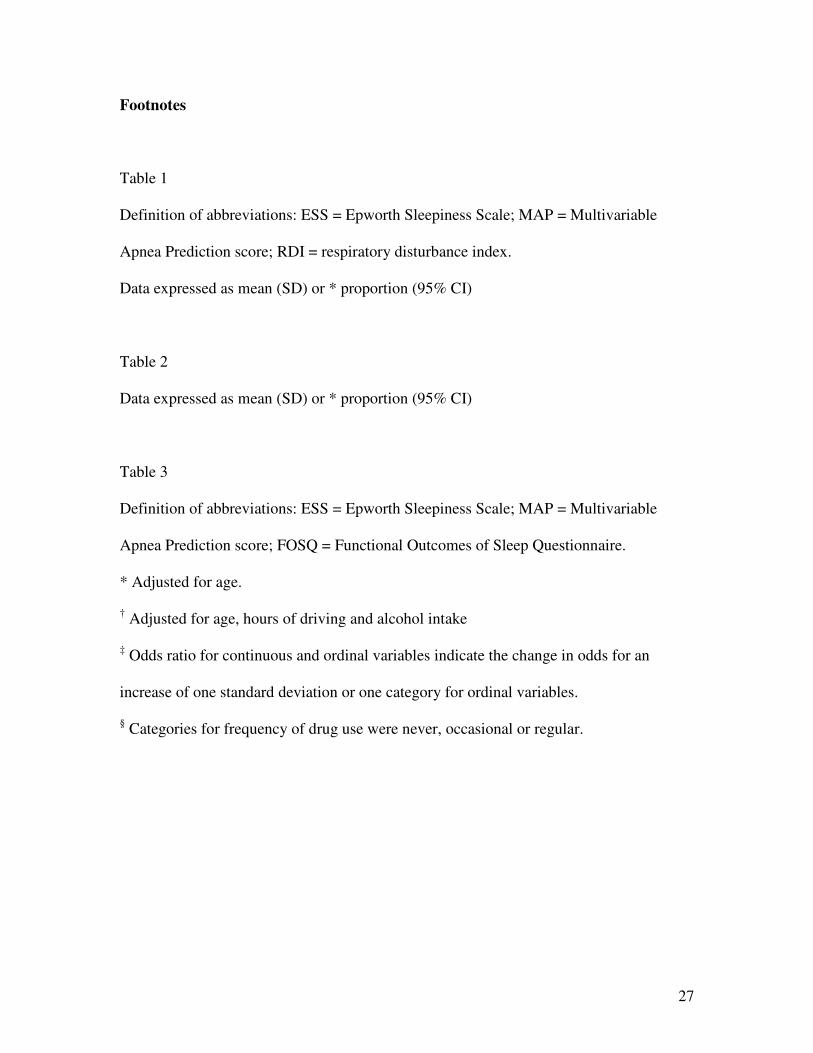
Table 1
Definition of abbreviations: ESS = Epworth Sleepiness Scale; MAP = Multivariable
Apnea Prediction score; RDI = respiratory disturbance index.
Data expressed as mean (SD) or * proportion (95% CI)
Table 2
Data expressed as mean (SD) or * proportion (95% CI)
Table 3
Definition of abbreviations: ESS = Epworth Sleepiness Scale; MAP = Multivariable
Apnea Prediction score; FOSQ = Functional Outcomes of Sleep Questionnaire.
* Adjusted for age.
† Adjusted for age, hours of driving and alcohol intake
‡ Odds ratio for continuous and ordinal variables indicate the change in odds for an
increase of one standard deviation or one category for ordinal variables.
§ Categories for frequency of drug use were never, occasional or regular.
28
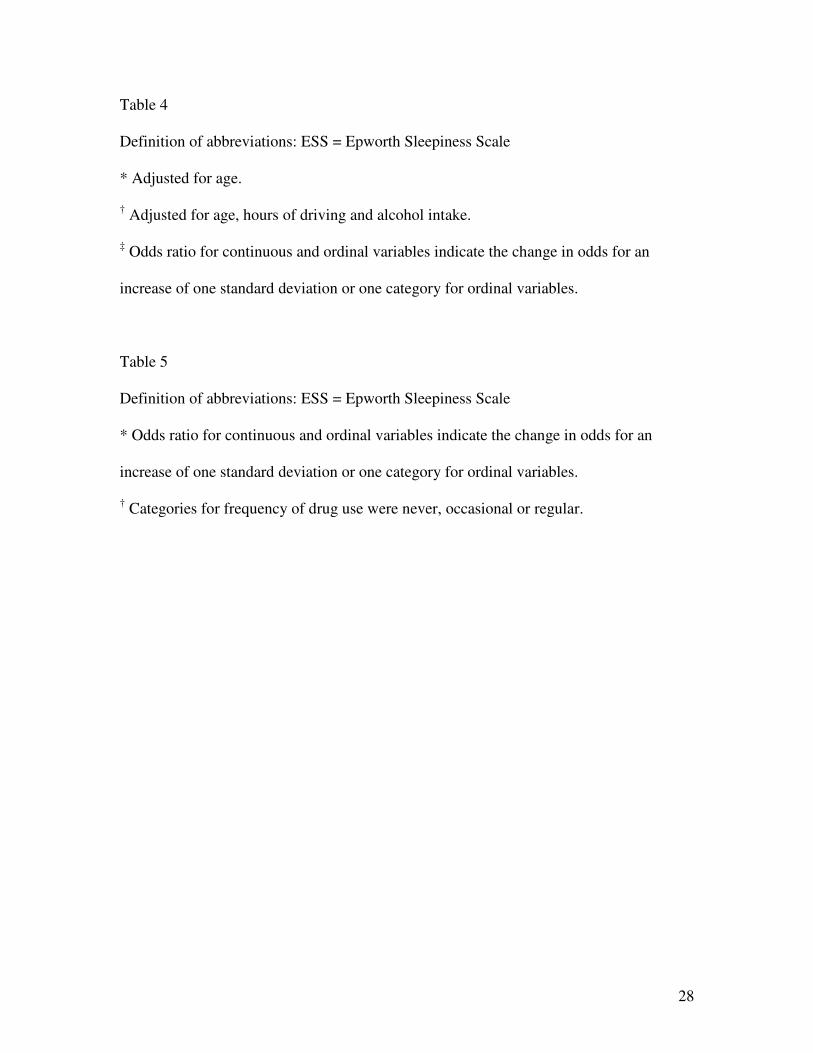
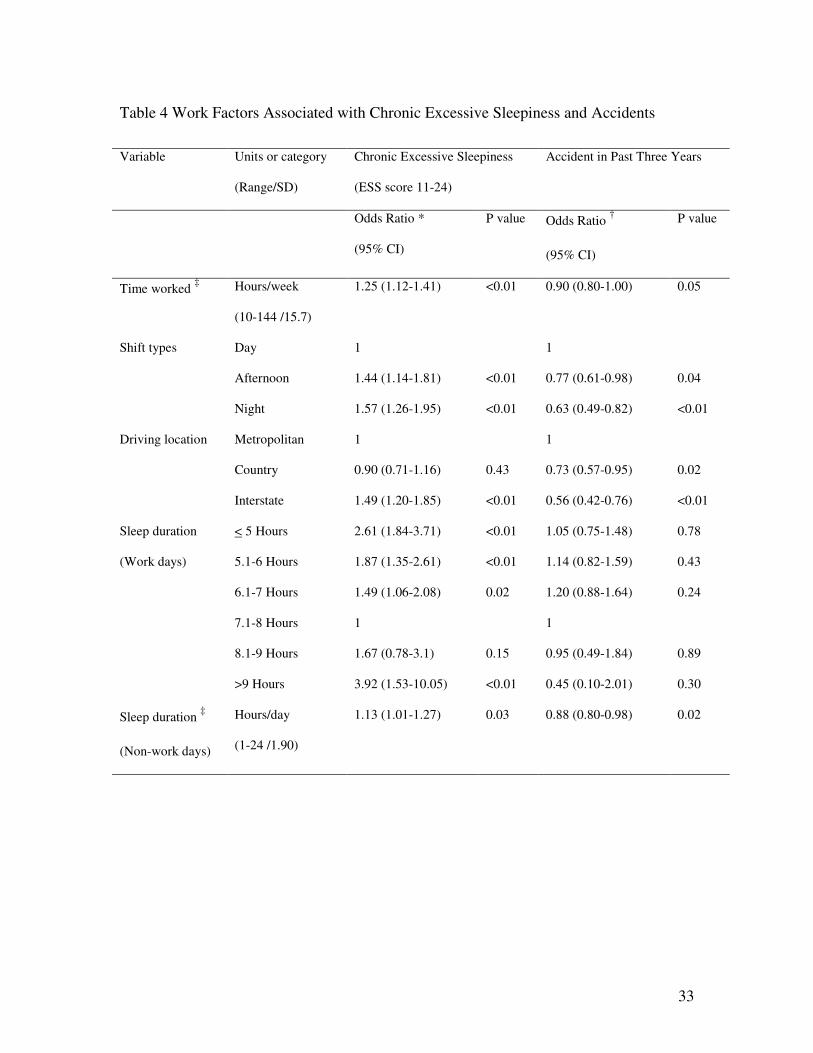
Table 4
Definition of abbreviations: ESS = Epworth Sleepiness Scale
* Adjusted for age.
† Adjusted for age, hours of driving and alcohol intake.
‡ Odds ratio for continuous and ordinal variables indicate the change in odds for an
increase of one standard deviation or one category for ordinal variables.
Table 5
Definition of abbreviations: ESS = Epworth Sleepiness Scale
* Odds ratio for continuous and ordinal variables indicate the change in odds for an
increase of one standard deviation or one category for ordinal variables.
† Categories for frequency of drug use were never, occasional or regular.

29
Table 1 Characteristics of Polysomnography and Questionnaire Samples
Polysomnography
(n=161)
Questionnaire
(n=2342)
P value
Age 47.8 years (9.3) 42.4 years (10.0) <0.01
Proportion of males 99.4% (96.6-100) 99.1% (98.5-99.7) 0.75
Body mass index 29.7 kg/m2 (5.1) 29.0 kg/m2 (5.0) 0.09
Overweight 42.2% (34.5-50.3) * 43.4% (41.3-45.4) * 0.78
Obese 41.6% (33.9-49.6) * 36.4% (33.5-39.2) * 0.19
History of sleep apnea 6.2% (3.0–11.1) * 4.7% (3.9-5.5) * 0.39
ESS score 7.69 (4.34) 7.54 (4.32) 0.68
Chronic excessive sleepiness
(ESS score > 11)
24.1% (17.6 – 31.5) * 24.1% (21.9-26.3) * 0.99
Sleep disordered breathing
Normal (RDI < 5) 40.4% (32.7 – 48.4) *
Mild (RDI 5 – 14.9) 34.8% (27.5 – 42.7) *
Moderate (RDI 15 – 29.9) 14.3% (9.3 – 20.7) *
Severe (RDI > 30) 10.6% (6.3 – 16.4) *
Sleep apnea syndrome
(RDI > 5 & ESS > 11)
15.8% (10.5 – 22.5) *
Sleep apnea risk
(MAP score)
0.49 (0.19) 0.40 (0.19) <0.01

30
Table 2 Demographic Features of Responders and Non-Responders for Polysomnography
Responders
(n=161)
Non-responders
(n=84)
P value
Age 47.8 years (9.3) 46.0 years (9.4) 0.16
Height 176 cm (6.9) 177 cm (7.7) 0.30
Weight 92.0 kg (15.9) 88.9 kg (14.5) 0.13
Proportion of males 99.4% (96.6-100) * 98.8% (93.5-100) * 0.33

31
Table 3 Personal Factors Associated with Chronic Excessive Sleepiness and Accidents
Variable Units or category
(Range/SD)
Chronic Excessive Sleepiness
(ESS score 11-24)
Accident in Past Three
Years
Odds Ratio *
(95% CI)
P value Odds Ratio †
(95% CI)
P value
Gender Female 1 1
Male 0.41 (0.17-0.97) 0.04 0.74 (0.29-1.95) 0.54
Age ‡ Years
(16-71 years/10.0)
1.08 (0.99-1.18) 0.08 0.86 (0.78-0.95) 0.03
Sleep disordered
breathing risk ‡
MAP Score
(0-1.0 unit/0.19)
1.64 (1.45-1.86) <0.01 1.01 (0.90-1.13) 0.88
Sleepiness ‡ ESS Score
(0-24 units/4.32)
1.18 (1.09-1.29) <0.01
Impact of Sleepiness ‡ FOSQ Score
(20-5.6 units/2.08)
1.20 (1.07-1.35) <0.01
Sleep apnea syndrome
(symptom diagnosis)
(MAP score > 0.5
and ESS score 11-24)
1.30 (1.00-1.69) 0.05
Past medical history Diabetes 1.87 (1.10-3.17) 0.02 0.86 (0.49-1.53) 0.61
Heart Disease 2.04 (1.21-3.42) <0.01 0.92 (0.53-1.60) 0.77
Sleep apnea 2.87 (1.88-4.40) <0.01 0.82 (0.53-1.26) 0.36
Drug use ‡ Stimulant drugs § 1.79 (1.30-2.08) <0.01 0.94 (0.86-1.03) 0.20
Benzodiazepines § 1.27 (0.75-2.15) 0.38 1.91 (0.90-4.07) 0.09
Antihistamines § 1.66 (0.49-5.65) 0.42 3.44 (1.06-11.16) 0.04
Narcotic analgesics § 0.96 (0.54-1.70) 0.88 2.40 (1.46-3.92) <0.01
Alcohol Intake ‡ Standard drinks/day
(0-18 drinks/1.84)
0.98 (0.87-1.11) 0.75 1.09 (0.99-1.19) 0.07

32
Caffeine ‡ Cups/day
(0-38 cups/3.69)
1.20 (1.08-1.33) <0.01 0.96 (0.86-1.04) 0.28
33
Table 4 Work Factors Associated with Chronic Excessive Sleepiness and Accidents
Variable Units or category
(Range/SD)
Chronic Excessive Sleepiness
(ESS score 11-24)
Accident in Past Three Years
Odds Ratio *
(95% CI)
P value Odds Ratio †
(95% CI)
P value
Time worked ‡ Hours/week
(10-144 /15.7)
1.25 (1.12-1.41) <0.01 0.90 (0.80-1.00) 0.05
Shift types Day 1 1
Afternoon 1.44 (1.14-1.81) <0.01 0.77 (0.61-0.98) 0.04
Night 1.57 (1.26-1.95) <0.01 0.63 (0.49-0.82) <0.01
Driving location Metropolitan 1 1
Country 0.90 (0.71-1.16) 0.43 0.73 (0.57-0.95) 0.02
Interstate 1.49 (1.20-1.85) <0.01 0.56 (0.42-0.76) <0.01
Sleep duration < 5 Hours 2.61 (1.84-3.71) <0.01 1.05 (0.75-1.48) 0.78
(Work days) 5.1-6 Hours 1.87 (1.35-2.61) <0.01 1.14 (0.82-1.59) 0.43
6.1-7 Hours 1.49 (1.06-2.08) 0.02 1.20 (0.88-1.64) 0.24
7.1-8 Hours 1 1
8.1-9 Hours 1.67 (0.78-3.1) 0.15 0.95 (0.49-1.84) 0.89
>9 Hours 3.92 (1.53-10.05) <0.01 0.45 (0.10-2.01) 0.30
Sleep duration ‡
(Non-work days)
Hours/day
(1-24 /1.90)
1.13 (1.01-1.27) 0.03 0.88 (0.80-0.98) 0.02
34
Table 5 Factors Associated with Accidents on Stepwise Logistic Regression Model
Variable
(Range/SD)
All accidents Multiple accidents Single vehicle
accidents
Odds Ratio
(95% CI)
P value Odds Ratio
(95% CI)
P value Odds Ratio
(95% CI)
P value
Age - years *
(16-71 years /10.0)
0.87
(0.77-0.99)
0.04 0.83
(0.71-0.97)
0.02 0.79
(0.70-0.90)
<0.01
Sleepiness - ESS score *
(0-24 units /4.33)
1.24
(1.10-1.34)
<0.01 1.31
(1.14-1.51)
<0.01 1.29
(1.14-1.45)
<0.01
Time driving - hours/week *
(10-100 hours /8.21)
1.17
(1.04-1.31)
<0.01 1.20
(1.05-1.36)
<0.01
Driving location
Country 0.77
(0.60-0.99)
=0.04 0.59
(0.42-0.83)
<0.01
Interstate 0.57
(0.40-0.80)
<0.01 0.36
(0.24-0.55)
<0.01
Drug use *
Antihistamines † 3.15
(0.97-10.28)
0.06 2.64
(1.19-5.84)
=0.02
Narcotic analgesics † 2.10
(1.30-3.38)
<0.01 1.84
(1.08-3.12)
=0.03

35
Figure 1
Sleepiness (ESS Score)
Odd
s R
atio
0
1
2
3
4
5
6
Low Normal (0-4)
Normal (5-7)
High Normal (8-10)
High(11-17)
Very High (18-24)
36
Figure 2
Impact of Sleepiness (FOSQ Score Centiles)
Odd
s R
atio
0
1
2
3
4
5
Low(0-25) (26-50) (51-75) (76-95)
Very High (96-100)

Online data supplement
Sleepiness, Sleep Disordered Breathing and Accident Risk Factors in
Commercial Vehicle Drivers
Mark E. Howard, Anup V. Desai, Ron R. Grunstein, Craig Hukins, John G. Armstrong,
David Joffe, Philip Swann, Donald A. Campbell, Robert J. Pierce

1
METHODS
The study comprised two samples of commercial vehicle drivers. 3268 drivers were
invited to complete a questionnaire and anthropormorphic measurements. Another 244
drivers were also invited to attend in-laboratory polysomnography.
Questionnaire Sample
For the questionnaire sample a clustered sample was used with truck yards as the primary
sampling unit. This enabled us to personally access a large number of drivers. 98
workplaces (including 3268 current commercial vehicle drivers) were selected from 395
workplaces on the databases of the Transport Workers Union branches in the three most
populous states in Australia (Victoria, New South Wales and Queensland) using simple
random sampling. The workplaces were visited by a study investigator together with a
Union official and questionnaires were distributed to the drivers. The drivers completed
the questionnaire without assistance and returned them anonymously in order to
maximize participation and encourage honesty in their responses. The questionnaire
included demographics, sleep and work habits and self reported accidents from the
previous three years (Appendix E1). Drivers were asked to "include any accident where
someone was injured, the police were called or a vehicle was damaged and required
repair". Subjects were asked the following details: type of vehicle driven; driving
locality; hours of driving and work; shift types; sleep hours; alcohol and drug intake and
medical history. The Multivariable Apnea Prediction questionnaire was included to
assess the probability of having sleep disordered breathing (E1). This incorporates age,
gender, body mass index and symptom scores into a predictive equation for risk of
having sleep disordered breathing. Sleepiness was measured subjectively using the
2
Epworth Sleepiness Scale (E2) (E3) (E4). This uses eight questions to assess the
likelihood of falling asleep in a variety of situations. A score of 11 or more was used as
the cut-off for excessive sleepiness (E5). The Functional Outcomes of Sleep
Questionnaire was used as an additional measure of sleepiness (E6). This is a quality of
life questionnaire assessing the impact of sleepiness on a variety of daily activities.
Polysomnography Sample
For the polysomnography sample drivers were selected from the databases of the
Transport Workers Union in New South Wales and Victoria using simple random
sampling. Drivers were contacted in batches of 20. They were assessed for entry criteria
and invited to participate in the study until a sample of 160 drivers had agreed to
participate in the study. All subjects were current commercial vehicle drivers driving a
minimum of 10 hours per week for work. We collected data on age, gender, height and
weight from drivers who declined to participate. Full overnight polysomnography in the
laboratory was used to diagnose sleep disordered breathing (Compumedics S series,
Compumedics Melbourne, Victoria, Australia). Studies were performed at the Austin
Hospital in Victoria and Royal Prince Alfred and Royal North Shore Hospitals in New
South Wales. Variables recorded during polysomnography included the following:
electroencephalogram activity (standard central lead C3-A2); left and right electro-
occulogram; submental electromyogram; body position; right and left leg movements
(peizoelectric movement sensors); oxygen saturation (OxiRadometer; Radiometer,
Copenhagen, Denmark); nasal pressure; thoracic and abdominal movements using
respiratory inductance plethysmography; and single lead electrocardiogram. Data were
stored on magnetooptical disc for analysis. Sleep was staged according to the criteria of
3
Rechtschaffen and Kales (E7). Respiratory events during sleep were scored manually
according to the recommendations of the American Academy of Sleep Medicine Task
Force (E8). Apneas were scored if there was cessation of airflow according to nasal
pressure for at least 10 seconds. Hypopneas were scored if there was a reduction in the
nasal pressure signal of at least 50% lasting at least 10 seconds or a clear reduction of less
than 50% in association with a fall in oxygen saturation of 3% or an arousal on
electroencephalogram. Dual channel respiratory inductance plethysmography was used to
measure breathing if there was failure of the nasal pressure signal. A single scientist in
each state staged the studies for sleep and scored them for respiratory events, calculating
the respiratory disturbance index. The scientists were blinded to other study results The
intraclass correlation co-efficient between scientists was 0.98 (P<0.01) for the respiratory
disturbance index.
Written informed consent was obtained from study participants. The protocol was
approved by the Human Research and Ethics Committees at the Austin Hospital,
Melbourne, Royal Prince Alfred Hospital, Sydney and Princess Alexandra Hospital,
Brisbane.
4
Statistical Methods
We calculated that a sample size of 160 subjects for polysomnography would provide a
95% power for demonstrating a prevalence of sleep disordered breathing or excessive
sleepiness of at least double that documented in male working populations, with an alpha
of 0.05 (sleep disordered breathing prevalence of 50% or excessive sleepiness prevalence
of 22%). Results were entered into a Microsoft Access database and analyzed using Stata
6.0 for windows.
We calculated the positive and negative predictive value of a Multivariable Apnea
Prediction Score of 0.5 or above for detecting sleep disordered breathing using data from
the polysomnography sample. These values together with the prevalence of a score over
0.5 were used to estimate the prevalence of sleep disordered breathing in the
questionnaire sample using the method described by Marshall (E9, 10). Using this
method an estimate of the true proportion of subjects with a disease can be made from a
population using a screening tool (in this case the Multivariable Apnoea Prediction
Score) with known error. A validation study can be used to assess the degree of error and
calculate positive and negative predictive values (calculated using data from our
polysomnography sample). The prevalence estimate is then derived using the following
equation:
P(e) = PPV . P(x) + (1 – NPV) . P(x _)
P(e) = estimated true proportion with disease
PPV = positive predictive value, NPV = negative predictive value
P(x) = measured proportion with disease (Multivariable Apnoea Prediction Score > 0.5)

5
P(x _) = measured proportion without disease (Multivariable Apnoea Prediction Score <
0.5)
A cluster sampling design, as used in this study, may result in a marked increase in
variance. Adjustments were made for all analyses of the questionnaire sample to account
for cluster sampling, with truck yard as the sampling unit. We calculated intraclass
correlation co-efficients for key variables, and the design effect (deff), which reflects the
effect of the study design on variance. The intraclass correlation co-efficients varied
between 0.03 and 0.13 (see Table E1) and deff varied between 0.95 and 1.51, indicating a
modest effect on variance. In our analysis the cluster sampling scheme was accounted for
with the use of a robust variance estimate using the “cluster” option in the Stata
commands. This has the effect of increasing the standard errors compared to analysis
without adjustment for cluster sampling.
Table E1 Intraclass Correlation Coefficients for Key Variables
Variable ICC Design Effect
ESS 0.03 0.99
MAP 0.05 1.51
Body mass index 0.04 0.95
Age 0.13 1.30
Hours of driving 0.06 1.40
Total accidents 0.08
ICC = intraclass correlation co-efficient, ESS = Epworth Sleepiness Scale and MAP =
Multivariable Apnoea Prediction Score.

6
Multivariate logistic regression was used to assess the relationship between excessive
sleepiness and personal and work related factors, adjusted for age. Continuous and
ordinal variables were analyzed continuously unless otherwise indicated, with the odds
ratio indicating the change in odds for an increase of one standard deviation for
continuous variables or one category for ordinal variables (Table 3). The number of hours
of sleep on workdays was analyzed as a categorical variable because of a non-linear
relationship with sleepiness. Similarly, to assess the relationship between potential
explanatory variables and accident risk (risk of one or more accidents compared to no
accidents) we calculated odds ratios adjusted for age, alcohol intake (established major
accident risk factors (E11-13)) and hours of driving (to adjust for driving exposure). We
performed the same analysis with sleepiness (Epworth Sleepiness Scale and Functional
Outcomes of Sleep Questionnaire) classified as a categorical variable. The categories
were based on the 25th, 50th, 75th and 95th centiles for sleepiness. For these categories the
risk of having multiple accidents (two or more compared to no accidents) was also
calculated.
Results
Table E2 Prevalence of Drug Use Amongst Drivers
Drug Proportion of Drivers
Stimulant drugs 18.6% (14.7-22.5)
Benzodiazepines 1.3% (0.6-1.9)
Antihistamines 0.7% (0.4-1.0)
Narcotic analgesics 2.1% (1.4-2.7)
7
REFERENCES
E1. Maislin G, Pack AI, Kribbs NB, Smith PL, Schwartz AR, Kline LR, Schwab RJ,
Dinges DF. A survey screen for prediction of apnea. Sleep 1995;18(3):158-66.
E2. Johns MW. A new method for measuring daytime sleepiness: the Epworth
sleepiness scale. Sleep 1991;14(6):540-5.
E3. Johns MW. Reliability and factor analysis of the Epworth Sleepiness Scale. Sleep
1992;15(4):376-81.
E4. Johns MW. Daytime sleepiness, snoring, and obstructive sleep apnea. The
Epworth Sleepiness Scale. Chest 1993;103(1):30-6.
E5. Johns M, Hocking B. Daytime sleepiness and sleep habits of Australian workers.
Sleep 1997;20(10):844-9.
E6. Weaver TE, Laizner AM, Evans LK, Maislin G, Chugh DK, Lyon K, Smith PL,
Schwartz AR, Redline S, Pack AI, Dinges DF. An instrument to measure functional
status outcomes for disorders of excessive sleepiness. Sleep 1997;20(10):835-43.
E7. Rechtschaffen A, Kales A. A manual of standardized terminolgy, techniques and
scoring system for sleep stages in human subjects. The National Institutes of Health;
Washington DC 1968.
E8. Sleep-related breathing disorders in adults: recommendations for syndrome
definition and measurement techniques in clinical research. The Report of an American
Academy of Sleep Medicine Task Force [see comments]. Sleep 1999;22(5):667-89.
E9. Marshall RJ. Validation study methods for estimating exposure proportions and
odds ratios with misclassified data. J Clin Epidemiol 1990;43(9):941-7.
8
E10. Green MS. Use of predictive value to adjust relative risk estimates biased by
misclassification of outcome status. American Journal of Epidemiology. 1983;117(1):98-
105.
E11. Glucksman E. Alcohol and accidents. Br Med Bull 1994;50(1):76-84.
E12. Pack AI, Pack AM, Rodgman E, Cucchiara A, Dinges DF, Schwab CW.
Characteristics of crashes attributed to the driver having fallen asleep. Accid Anal Prev
1995;27(6):769-75.
E13. Summala H, Mikkola T. Fatal accidents among car and truck drivers: effects of
fatigue, age, and alcohol consumption. Hum Factors 1994;36(2):315-26.

9
Appendix E1 Questionnaire
1. What type of vehicle do you drive at work?
2. At work, do you drive?
3. Which shifts do you work?
4. Do you rotate shifts?
5. Where do you drive?
6. How many hours is your longest shift?
7. How many days do you work per week?
8. How many hours do you work per week?
9. How many hours do you drive per week?
10. How many kilometers do you drive each year?
11. How many hours of sleep do you have each night or day?
12. How many glasses of alcohol do you normally have each day?
13. How many cups do you have each day of the following beverages?
semitrailer truck & trailerB double forkliftrigid truck car/vanbus other
your own vehicle a company vehicle
days afternoons nights
yes no
metropolitan country interstate
at work not work related
at work not work related
on work days on days off
on work days on days off
tea coffee cola
For The Following Questions Put A Cross In One Or More Boxes
For The Following Questions Write The Appropriate Number In The Box
000 km 000 km
We want to ask you some questions about driving.The following questions relate to your main occupation.

10
14. Do you have any illnesses? Please put across in the box to indicate that you have any of the following and give details.
15. Most drivers get tired while driving. Have you ever used tablets to stay awake while driving? (Put a cross in one box)
16. Please list any medications that you take, including sleeping tablets and pain relievers. Put a cross in one box to indicate whether you take them regularly or occasionally.
17. Do you use any of the following treatments for sleep apnea? (put a cross in one or more boxes)
18. Have you had any motor vehicle accidents in the last 3 years?
Tick Yes No(put a number in each box opposite)
heart disease (details)________lung disease (details)________diabetesepilepsyhigh blood pressuresleep apneaother (details)________
occasionally most days every day never
regular occasional1)______________________2)______________________3)______________________4)______________________5)______________________
CPAP mask mandibular splintnone throat surgery
number of accidents involving another vehicle:at work non work related
number of accidents with no other vehicle involved:at work non work related
Now we would like to ask you about any medical conditions you have and any medications you take.
Only answer the next question if you have sleep apnoea
Most drivers have had an accident at some time. We would like to ask you about any accidents in the last three years.
Include any accident where someone was injured, the police were called or a vehicle was damaged and required repair
Related Documents
![Sleep-Disordered Breathing and COPD: The Overlap Syndromerc.rcjournal.com/content/respcare/55/10/1333.full.pdf · Sleep-disordered breathing (mainly obstructive sleep apnea [OSA])](https://static.cupdf.com/doc/110x72/5f091e047e708231d4254f5b/sleep-disordered-breathing-and-copd-the-overlap-sleep-disordered-breathing-mainly.jpg)


![Sleep-disordered breathing: clinical features, …considered as sleep disordered breathing [7–10]. Based on the underlying pathophysiological mech-anisms, sleep-related breathing](https://static.cupdf.com/doc/110x72/5fe0151cc0e57633260dbecd/sleep-disordered-breathing-clinical-features-considered-as-sleep-disordered-breathing.jpg)