SLEEP, Vol. 35, No. 1, 2012 81 Sleep and Diabetes—Perfect et al stages of sleep (N1 and N2) 7,10 and in REM, 11 and less time in SWS. 7,11 In contrast, 2 small studies 12,13 with children with T1DM did not show a difference in sleep architecture compared to healthy participants. However, these studies did demonstrate that participants with T1DM had more frequent and longer awakenings, 12 and arousals were associated with increased glu- cose variability during the night. 13 SDB has primarily been examined in adults with T2DM and those at risk for diabetes. 14-16 As the severity of SDB increases, there is an association with poor glucose control 14-17 and compli- cations of diabetes, such as neuropathy. 18 Interestingly, Villa et al. found increased frequency and longer apneas, in particular cen- tral apneas, in young children (ages 5 to 11 years) with T1DM compared to healthy children. 17 Further, participants with poorly controlled diabetes (hemoglobin A1c ≥ 8.0%) had more frequent and longer apneas compared with patients with better controlled diabetes and controls. 17 Aside from possible glucose dysregula- tion, SDB has other potential clinical (e.g., cardiovascular dis- ease, 19 insulin resistance 20 ) and psychosocial (e.g., behavioral, grades, neurocognitive abilities) 21-30 consequences. Current Study Given the prevalence of diabetes in youth and the limited research addressing sleep in youth with T1DM, more research is needed to determine the potential role of sleep in diabetes management. To that end, the first aim of the current study was to examine the relations between sleep parameters and glucose regulation in youth with T1DM. We hypothesized that compared to those without evidence of SDB (total apnea-hypopnea index [Total-AHI] < 1.5), 31,32 youth with evidence of SDB (Total-AHI ≥ 1.5) would have significantly worse glucose control. The sec- INTRODUCTION Research has supported the role of slow wave sleep (SWS) in glucose maintenance and insulin sensitivity. 1,2 Most research examining the association of sleep and risk of diabetes and/or its complications has focused on adults, and in particular, adults with type 2 diabetes (T2DM). Markedly less research has fo- cused on children with type 1 diabetes (T1DM), one of the most common pediatric chronic medical conditions (1 in 300 for youth ages 10 to 19). 3 With the recognition that sleep may im- pact glucose regulation, it is important to determine the role that sleep plays in the management of diabetes in youth with T1DM. Diabetes, Sleep, and Sleep Disordered Breathing Inadequate amounts of sleep, sleepiness, anomalies in sleep architecture, and sleep disordered breathing (SDB) are aspects of sleep that may be particularly problematic for individuals at risk for or already diagnosed with T1DM or T2DM. 4-7 Although sleep loss mostly has been implicated as a risk factor for T2DM, 8 Donga and colleagues found that sleep restriction contributed to reduced peripheral insulin sensitivity in adults with T1DM. 9 Sleep architecture may be altered in adults with T1DM and T2DM. In 3 studies, diabetic patients spent more time in lighter SLEEP, GLUCOSE, AND DAYTIME FUNCTION IN YOUTH WITH TYPE 1 DIABETES http://dx.doi.org/10.5665/sleep.1590 Sleep, Glucose, and Daytime Functioning in Youth with Type 1 Diabetes Michelle M. Perfect, PhD 1 ; Priti G. Patel, MD 2 ; Roxanne E. Scott, MA 1 ; Mark D. Wheeler, MD 2 ; Chetanbabu Patel, MD 2 ; Kurt Griffin, PhD, MD 2 ; Seth T. Sorensen, MA 1 ; James L. Goodwin, PhD 3 ; Stuart F. Quan, MD 3,4 1 Department of Disability and Psychoeducational Studies, University of Arizona, Tucson, AZ; 2 Department of Pediatrics, Section of Endocrinology, University of Arizona, Tucson, AZ; 3 Arizona Respiratory Center, Department of Medicine, University of Arizona College of Medicine, Tucson, AZ; 4 Division of Sleep Medicine, Harvard Medical School, Boston, MA Submitted for publication October, 2010 Submitted in final revised form August, 2011 Accepted for publication September, 2011 Address correspondence to: Michelle M. Perfect, PhD, Department of Disability and Psychoeducational Studies, University of Arizona, 1430 E. 2nd St., Tucson, AZ 85721; Tel: (520) 626-1228; E-mail: mperfect@email. arizona.edu Study Hypotheses: 1) Youth with evidence of SDB (total apnea-hypopnea index [Total-AHI] ≥ 1.5) would have significantly worse glucose control than those without SDB; 2) Elevated self-reported sleepiness in youth with T1DM would be related to compromised psychosocial functioning; and 3) Youth with T1DM would have significantly less slow wave sleep (SWS) than controls. Design: The study utilized home-based polysomnography, actigraphy, and questionnaires to assess sleep, and continuous glucose monitors and hemo- globin A1C (HbA1C) values to assess glucose control in youth with T1DM. We compared sleep of youth with T1DM to sleep of a matched control sample. Setting: Diabetic participants were recruited in a pediatric endocrinology clinic. Participants: Participants were youth (10 through 16 years) with T1DM. Controls, matched for sex, age, and BMI percentile, were from the Tucson Children’s Assessment of Sleep Apnea study. Results: Participants with a Total-AHI ≥ 1.5 had higher glucose levels. Sleepiness and/or poor sleep habits correlated with reduced quality of life, depressed mood, lower grades, and lower state standardized reading scores. Diabetic youth spent more time (%) in stage N2 and less time in stage N3. Findings related to sleep architecture included associations between reduced SWS and higher HbA1C, worse quality of life, and sleepi- ness. More time (%) spent in stage N2 related to higher glucose levels/hyperglycemia, behavioral difficulties, reduced quality of life, lower grades, depression, sleep-wake behavior problems, poor sleep quality, sleepiness, and lower state standardized math scores. Conclusions: Sleep should be routinely assessed as part of diabetes management in youth with T1DM. Keywords: Sleep, type 1 diabetes, youth, continuous glucose monitor, polysomnography Citation: Perfect MM; Patel PG; Scott RE; Wheeler MD; Patel C; Griffin K; Sorensen ST; Goodwin JL; Quan SF. Sleep, glucose, and daytime functioning in youth with type 1 diabetes. SLEEP 2012;35(1):81-88.

Welcome message from author
This document is posted to help you gain knowledge. Please leave a comment to let me know what you think about it! Share it to your friends and learn new things together.
Transcript
SLEEP, Vol. 35, No. 1, 2012 81 Sleep and Diabetes—Perfect et al
stages of sleep (N1 and N2)7,10 and in REM,11 and less time in SWS.7,11 In contrast, 2 small studies12,13 with children with T1DM did not show a difference in sleep architecture compared to healthy participants. However, these studies did demonstrate that participants with T1DM had more frequent and longer awakenings,12 and arousals were associated with increased glu-cose variability during the night.13
SDB has primarily been examined in adults with T2DM and those at risk for diabetes.14-16 As the severity of SDB increases, there is an association with poor glucose control14-17 and compli-cations of diabetes, such as neuropathy.18 Interestingly, Villa et al. found increased frequency and longer apneas, in particular cen-tral apneas, in young children (ages 5 to 11 years) with T1DM compared to healthy children.17 Further, participants with poorly controlled diabetes (hemoglobin A1c ≥ 8.0%) had more frequent and longer apneas compared with patients with better controlled diabetes and controls.17 Aside from possible glucose dysregula-tion, SDB has other potential clinical (e.g., cardiovascular dis-ease,19 insulin resistance20) and psychosocial (e.g., behavioral, grades, neurocognitive abilities)21-30 consequences.
Current StudyGiven the prevalence of diabetes in youth and the limited
research addressing sleep in youth with T1DM, more research is needed to determine the potential role of sleep in diabetes management. To that end, the first aim of the current study was to examine the relations between sleep parameters and glucose regulation in youth with T1DM. We hypothesized that compared to those without evidence of SDB (total apnea-hypopnea index [Total-AHI] < 1.5),31,32 youth with evidence of SDB (Total-AHI ≥ 1.5) would have significantly worse glucose control. The sec-
INTRODUCTIONResearch has supported the role of slow wave sleep (SWS)
in glucose maintenance and insulin sensitivity.1,2 Most research examining the association of sleep and risk of diabetes and/or its complications has focused on adults, and in particular, adults with type 2 diabetes (T2DM). Markedly less research has fo-cused on children with type 1 diabetes (T1DM), one of the most common pediatric chronic medical conditions (1 in 300 for youth ages 10 to 19).3 With the recognition that sleep may im-pact glucose regulation, it is important to determine the role that sleep plays in the management of diabetes in youth with T1DM.
Diabetes, Sleep, and Sleep Disordered BreathingInadequate amounts of sleep, sleepiness, anomalies in sleep
architecture, and sleep disordered breathing (SDB) are aspects of sleep that may be particularly problematic for individuals at risk for or already diagnosed with T1DM or T2DM.4-7 Although sleep loss mostly has been implicated as a risk factor for T2DM,8 Donga and colleagues found that sleep restriction contributed to reduced peripheral insulin sensitivity in adults with T1DM.9
Sleep architecture may be altered in adults with T1DM and T2DM. In 3 studies, diabetic patients spent more time in lighter
SLEEP, GLUCOSE, AND DAYTIME FUNCTION IN YOUTH WITH TYPE 1 DIABETEShttp://dx.doi.org/10.5665/sleep.1590
Sleep, Glucose, and Daytime Functioning in Youth with Type 1 DiabetesMichelle M. Perfect, PhD1; Priti G. Patel, MD2; Roxanne E. Scott, MA1; Mark D. Wheeler, MD2; Chetanbabu Patel, MD2; Kurt Griffin, PhD, MD2; Seth T. Sorensen, MA1; James L. Goodwin, PhD3; Stuart F. Quan, MD3,4
1Department of Disability and Psychoeducational Studies, University of Arizona, Tucson, AZ; 2Department of Pediatrics, Section of Endocrinology, University of Arizona, Tucson, AZ; 3Arizona Respiratory Center, Department of Medicine, University of Arizona College of Medicine, Tucson, AZ; 4Division of Sleep Medicine, Harvard Medical School, Boston, MA
Submitted for publication October, 2010Submitted in final revised form August, 2011Accepted for publication September, 2011Address correspondence to: Michelle M. Perfect, PhD, Department of Disability and Psychoeducational Studies, University of Arizona, 1430 E. 2nd St., Tucson, AZ 85721; Tel: (520) 626-1228; E-mail: [email protected]
Study Hypotheses: 1) Youth with evidence of SDB (total apnea-hypopnea index [Total-AHI] ≥ 1.5) would have significantly worse glucose control than those without SDB; 2) Elevated self-reported sleepiness in youth with T1DM would be related to compromised psychosocial functioning; and 3) Youth with T1DM would have significantly less slow wave sleep (SWS) than controls.Design: The study utilized home-based polysomnography, actigraphy, and questionnaires to assess sleep, and continuous glucose monitors and hemo-globin A1C (HbA1C) values to assess glucose control in youth with T1DM. We compared sleep of youth with T1DM to sleep of a matched control sample.Setting: Diabetic participants were recruited in a pediatric endocrinology clinic.Participants: Participants were youth (10 through 16 years) with T1DM. Controls, matched for sex, age, and BMI percentile, were from the Tucson Children’s Assessment of Sleep Apnea study.Results: Participants with a Total-AHI ≥ 1.5 had higher glucose levels. Sleepiness and/or poor sleep habits correlated with reduced quality of life, depressed mood, lower grades, and lower state standardized reading scores. Diabetic youth spent more time (%) in stage N2 and less time in stage N3. Findings related to sleep architecture included associations between reduced SWS and higher HbA1C, worse quality of life, and sleepi-ness. More time (%) spent in stage N2 related to higher glucose levels/hyperglycemia, behavioral difficulties, reduced quality of life, lower grades, depression, sleep-wake behavior problems, poor sleep quality, sleepiness, and lower state standardized math scores.Conclusions: Sleep should be routinely assessed as part of diabetes management in youth with T1DM.Keywords: Sleep, type 1 diabetes, youth, continuous glucose monitor, polysomnographyCitation: Perfect MM; Patel PG; Scott RE; Wheeler MD; Patel C; Griffin K; Sorensen ST; Goodwin JL; Quan SF. Sleep, glucose, and daytime functioning in youth with type 1 diabetes. SLEEP 2012;35(1):81-88.
SLEEP, Vol. 35, No. 1, 2012 82 Sleep and Diabetes—Perfect et al
Home-Based Polysomnography (PSG)Unattended overnight PSGs were completed with the Com-
pumedics PS-2 system (Abbotsford, Victoria, Australia). We used the same montage consisting of EEG, ECG, and respiratory measurements that has been described previously in TuCASA studies.34 The sleep studies were scored by a trained technician in accordance with the American Academy of Sleep Medicine (AASM) pediatric scoring guidelines.35 The technician used the AASM pediatric hypopnea rule,35 which was a > 50% drop in nasal pressure with a 3% drop in SaO2 and/or accompanied by an arousal. Consistent with Kelly and colleagues,32 we comput-ed a Total-AHI that included all apneas (central and obstructive events) and hypopneas, as well as an obstructive AHI (O-AHI) that included obstructive apneas plus hypopneas.
School Sleep Habits Survey (SSHS)The SSHS was used to address participants’ sleep patterns
(weekday and weekend), sleep disturbances (nighttime awaken-ings, trouble falling asleep, perceived sleep quality), depressed mood, sleepiness, and circadian preferences including school night and weekend variations over 2 weeks prior to taking the survey.36,37 The SSHS also contains a question about race/ethnic-ity and a question about self-reported grades, with higher scores representing worse grades. We describe scales, provide examples, and detail scoring in the appendices. Appendix 1 also provides information about how we recoded individual items to match the scaling of questions administered to the matched controls.
Diabetes Quality of Life Youth Version (DQOL-Y)The DQOL-Y is composed of 58 items divided into 3 sub-
scales: Life Satisfaction, Disease-Related Worries, and Disease Impact. The first subscale uses a 5-point Likert scale with an-chors 1 = never or very unsatisfied to 5 = all of the time or very satisfied (range 17–85). Participants rate each item on the other 2 subscales using a 5-point Likert scale from 1 = never to 5 = all of the time (ranges 11 to 55, and 23 to 115, respectively), with higher scores reflecting worse diabetes quality of life.38
Pediatric Symptom Checklist (PSC)Parents rated the frequency (0 = never to 2 = often) of their
child’s emotional, behavioral, or learning problems across 35 items.39
Medical Record ReviewA medical records review was conducted to obtain the fol-
lowing information, if available: date or age of diagnosis, HbA1c, Tanner staging, height, weight, blood pressure, and other laboratory results. We used the height and weight within no more than 4 months of participation and computed BMI z-scores and percentiles using formulae provided by the Centers for Disease Control and Prevention, adjusted for sex and age. Median household income using census tract data served as a proxy for socioeconomic (SES) status.
School RecordsWe obtained official school grades, most recent state stan-
dardized test scores (converted to z-scores), and attendance re-cords (monthly absences and tardies). We manually computed grade point average (GPA) with all classes weighted equally.
ond aim was to examine the impact of sleep patterns on daytime functioning in youth with T1DM. We expected to find that ele-vated self-reported sleepiness in youth with T1DM would be re-lated to compromised psychosocial functioning (i.e., behavioral problems, grades, and depression). The third aim was to com-pare the sleep of youth with T1DM to that of a matched control sample of youth without diabetes. We hypothesized that youth with T1DM would have significantly less SWS than controls.
METHODS
ParticipantsYouth (ages 10 through 16 years) with T1DM were recruited
in a pediatric endocrinology clinic. There were no exclusions, other than psychiatric, cognitive, genetic (e.g., Down syndrome), or neurological conditions that could impact SDB or participation. Matched control participants were identified from the second ex-amination of the Tucson Children’s Assessment of Sleep Apnea (TuCASA) study,33 who were recruited from the same geographic region as the youth with diabetes. For each diabetic participant with polysomnography (PSG) results, there was a TuCASA partic-ipant matched for sex, age, and body mass index (BMI) percentile.
ProceduresThe local Human Subjects Protection Program approved this
study. Research team members recruited potential participants during scheduled diabetes clinics in an endocrinology office over a one-year period. During this enrollment visit, adolescents and parents completed the consent and assent process. Once enrolled, adolescents had a continuous glucose monitor (CGM) inserted by a research team member who was certified by Medtronics and had an actigraph placed on the non-dominant wrist. Participants were provided with a blood glucose meter and strips, were instructed to use the provided meter ≥ 4 times a day for ≥ 5 days, and asked to document their levels on a glucose/food/activity log. They also were provided with a sleep diary during the period that the acti-graph was worn to assist with scoring. During the 5-day period, participants who opted to undergo PSG (n = 47) completed the sleep study in their home. Approximately a week after the start of wearing the CGM and actigraph and filling out the glucose log and sleep diary, parent and child participants completed the ap-propriate questionnaires and then received compensation.
Measures
Continuous Glucose Monitoring System (CGM)The CGM sensor (ipro CGM, Medtronics, Minneapolis, MN)
was placed subcutaneously and the recorder was attached to the sensor. The interstitial blood glucose readings were sent every 5 min for the duration of the study and stored in the recorder. Partici-pants were not able to view the glucose readings until the unit was downloaded. We examined average glucose levels across the total recording period, percentage of time spent hypoglycemic (≤ 60 mg/dL), and percentage of time spent hyperglycemic (≥ 180 mg/dL).
ActigraphyAn actigraph (MiniMitter 64K, Portland, Oregon) was worn
for approximately 5 days to examine multiday sleep-wake ac-tivity patterns.
SLEEP, Vol. 35, No. 1, 2012 83 Sleep and Diabetes—Perfect et al
ly less time in REM than those who identified themselves as non-White or Hispanic, t(31) = −2.59, P = 0.014 , d = 0.93, 95% CI [−7.64, −9.16]. Age was the only demographic or disease-related variable (e.g., BMI z-score, diabetes age onset) that was significantly related to HbA1c (P = 0.002). Diabetes duration was significantly correlated with CGM values (P = 0.025).
Sleep Parameters and Glucose RegulationThe associations between objective and self-reported sleep pa-
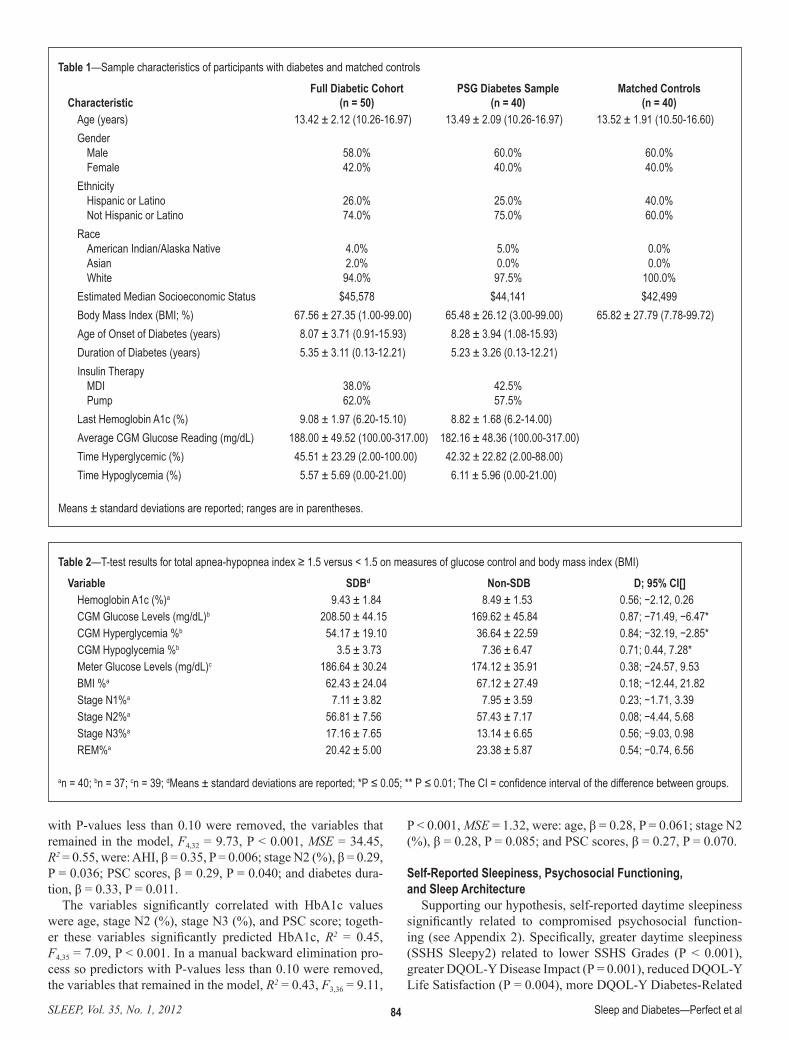
rameters and glucose regulation are shown in Table 2, Figure 1, and the correlation matrices in Appendix 2. In regard to SDB, regardless of the Total-AHI or O-AHI groupings, those with evi-dence of SDB had significantly more obstructive, central, and combined events than those without. There were 14 participants in the SDB group using the Total-AHI cutoff. Consistent with our hypothesis, participants with a Total-AHI ≥ 1.5 events per hour displayed higher CGM glucose levels (M = 208.5 mg/dL, SD = 44.15 mg/dL), t(23) = −2.48, P = 0.021, d = 0.87, 95% CI [−71.49, −6.47] and a greater percentage of time experienc-ing hyperglycemia (M = 54.17%, SD = 19.10%), t(26) = −2.46, P = 0.021, d = 0.84, 95% CI [−32.19, −2.86] across the full re-cording period. The means and standard deviations for those with Total-AHIs < 1.5 were 169.52 mg/dL (SD = 45.84 mg/dL) and 36.64% (SD = 22.59%), respectively. Average glucose val-ues with meter testing (d = 0.38) and HbA1C (d = 0.56) were not different between the groups. A reanalysis of the data using the O-AHI included 9 or 10 participants in the SDB group, for CGM and HbA1c data, respectively. There were no significant differences in glucose parameters between these 2 groups, but the pattern was the same with individuals with O-AHI ≥ 1.5 hav-ing higher glucose levels (204.56 mg/dL versus 174.96 mg/dL) and experiencing more hyperglycemia (50.67% versus 39.64%).
With regards to sleep architecture, less time spent in stage N3 was associated with higher HbA1c (P = 0.003; as shown in Appendix 2). We also found that percentage of time spent in stage N2 was positively associated with HbA1c (P < 0.001), average CGM glucose levels (P = 0.014), and the percentage of time hyperglycemic (P = 0.03). See Figure 1 for a scatterplot depicting the relation between stage N2 and HbA1c.
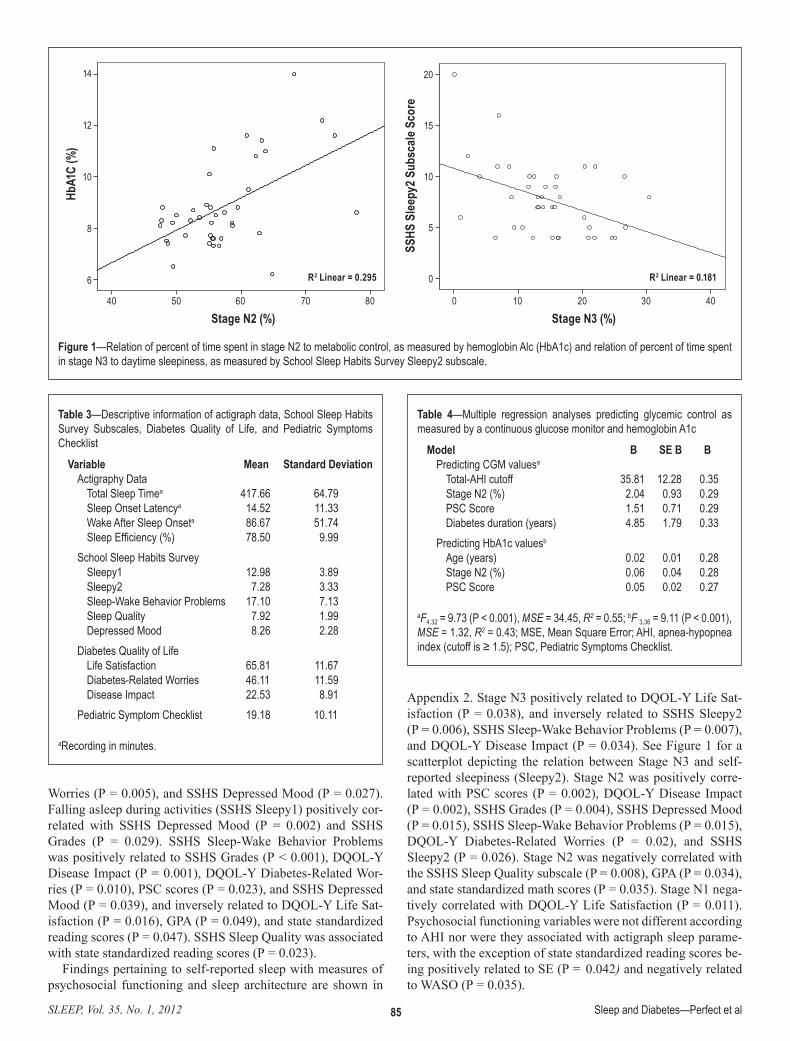
As can be seen on Table 3, participants’ average TST, as measured by actigraphy, was 6.96 h (SD = 1.01 h) and their mean sleep efficiency was 78.5% (SD = 9.99%). Overall sleep parameters did not relate to glucose control. TST each night also did not predict awakening glucose levels.
None of the self-reported sleep variables were related to gly-cemic control. The PSC was the only psychosocial variable re-lated to HbA1c (P = 0.013). The PSC was also correlated with CGM glucose levels (P = 0.012) as well as DQOL-Y Disease Impact (P = 0.01).
Given that multiple variables correlated with glucose control, and in order to start the model-building process, we conducted 2 multiple regression analyses (see Table 4): one predicting CGM glucose values and the other predicting HbA1c. The variables significantly correlated with CGM average glucose values were the AHI cutoff, stage N2 (%), PSC score, DQOL-Y Disease Impact, and diabetes duration; together these variables signifi-cantly predicted CGM glucose levels, F5,30 = 7.15, P < 0.001, MSE = 35.09, R2 = 0.54, where MSE is the mean square er-ror. In a manual backward elimination process so predictors
Variables for Matched ControlsSleep studies for control participants were conducted using
the same equipment and rescored by the same technician using the AASM scoring guidelines.35 Methodology for recruitment and study design have been described previously.34 Parental self-reported income served as a marker of SES. Control par-ticipants also completed a screening questionnaire that included the items that were similar to items on the SSHS; however, they had to be modified to have similar scaling. The specific items and recodes are available in Appendix 1.
Data Analyses Pearson correlations were used to examine the relations be-
tween sleep architecture and self-reported sleep variables with measures of psychosocial functioning. Because of skewness, average monthly absences were log-transformed. Independent t-tests (using equal variances not assumed due to unequal sample size) were used to compare the effect of SDB (Total-AHI ≥ 1.5) on glucose levels. Data were also reexamined using O-AHI to de-fine groups of < or ≥ the 1.5 cutoff to assess the impact of only obstructive events. Cohen’s d was the measure of effect size. The Kruskal-Wallis statistic was used to determine if obstructive or central apneas differed according to SDB groupings. A general-ized linear mixed effects model, with participants as the random intercept, was employed to examine if TST each night predicted awakening glucose values the next day (glucose reading that in-tersected with awakening and one immediately following awak-ening). Paired t-tests were used to compare sleep architecture of the diabetes sample with matched controls’ sleep architecture. Co-hen’s d for within subject analyses served as the measure of effect size. To determine if any differences in sleep architecture were attributable to SDB, we also ran 2 mixed design between-within ANOVAs with SDB (Total-AHI and O-AHI groupings) as the be-tween factor and matched pairs as the within factor. The Wilcoxon signed rank test was employed for within-group comparisons of respiratory parameters, which were skewed. All analysis used an α level of 0.05 for significance testing unless otherwise noted.
RESULTS
Demographic InformationOut of the 50 participants, there were 40 valid PSGs, with
3 participants opting not to do a sleep study, one study being inadvertently erased from the computer, one study accidently being recorded over, one study not downloading from the card, and 4 participants having connection problems. Table 1 pro-vides the sample characteristics; there were no significant dif-ferences in demographic or health variables between the full diabetic cohort and the ones who had valid PSG data. There were 47 participants with 1 to 6 days of CGM data; one CGM was not downloaded, one sensor was not returned by the par-ticipant, and one downloaded without data. Actigraphy data (n = 49) ranged from 2 to 7 days, with one not downloaded. Table 2 contains a summary of the PSG, actigraph, and self-reported questionnaire data of psychosocial variables. As it is well recognized,40,41 stage N2 significantly increased with age, r(40) = 0.49, P = 0.001, whereas stage N3 significantly decreased with age, r(40) = −0.58, P < 0.001. Individuals who identified themselves as White, Non-Hispanic spent significant-
SLEEP, Vol. 35, No. 1, 2012 84 Sleep and Diabetes—Perfect et al
P < 0.001, MSE = 1.32, were: age, β = 0.28, P = 0.061; stage N2 (%), β = 0.28, P = 0.085; and PSC scores, β = 0.27, P = 0.070.
Self-Reported Sleepiness, Psychosocial Functioning, and Sleep Architecture
Supporting our hypothesis, self-reported daytime sleepiness significantly related to compromised psychosocial function-ing (see Appendix 2). Specifically, greater daytime sleepiness (SSHS Sleepy2) related to lower SSHS Grades (P < 0.001), greater DQOL-Y Disease Impact (P = 0.001), reduced DQOL-Y Life Satisfaction (P = 0.004), more DQOL-Y Diabetes-Related
with P-values less than 0.10 were removed, the variables that remained in the model, F4,32 = 9.73, P < 0.001, MSE = 34.45, R2 = 0.55, were: AHI, β = 0.35, P = 0.006; stage N2 (%), β = 0.29, P = 0.036; PSC scores, β = 0.29, P = 0.040; and diabetes dura-tion, β = 0.33, P = 0.011.
The variables significantly correlated with HbA1c values were age, stage N2 (%), stage N3 (%), and PSC score; togeth-er these variables significantly predicted HbA1c, R2 = 0.45, F4,35 = 7.09, P < 0.001. In a manual backward elimination pro-cess so predictors with P-values less than 0.10 were removed, the variables that remained in the model, R2 = 0.43, F3,36 = 9.11,
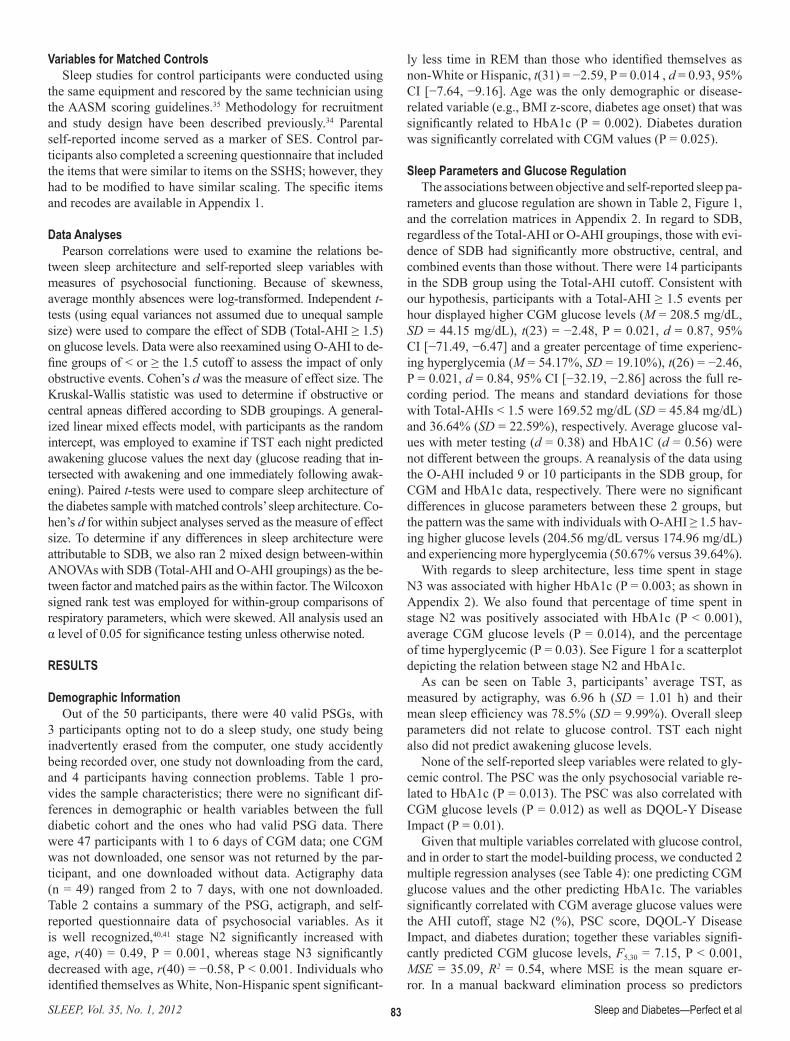
Table 1—Sample characteristics of participants with diabetes and matched controls
CharacteristicFull Diabetic Cohort
(n = 50)PSG Diabetes Sample
(n = 40)Matched Controls
(n = 40)Age (years) 13.42 ± 2.12 (10.26-16.97) 13.49 ± 2.09 (10.26-16.97) 13.52 ± 1.91 (10.50-16.60)Gender
Male 58.0% 60.0% 60.0%Female 42.0% 40.0% 40.0%
EthnicityHispanic or Latino 26.0% 25.0% 40.0%Not Hispanic or Latino 74.0% 75.0% 60.0%
RaceAmerican Indian/Alaska Native 4.0% 5.0% 0.0%Asian 2.0% 0.0% 0.0%White 94.0% 97.5% 100.0%
Estimated Median Socioeconomic Status $45,578 $44,141 $42,499Body Mass Index (BMI; %) 67.56 ± 27.35 (1.00-99.00) 65.48 ± 26.12 (3.00-99.00) 65.82 ± 27.79 (7.78-99.72)Age of Onset of Diabetes (years) 8.07 ± 3.71 (0.91-15.93) 8.28 ± 3.94 (1.08-15.93)Duration of Diabetes (years) 5.35 ± 3.11 (0.13-12.21) 5.23 ± 3.26 (0.13-12.21)Insulin Therapy
MDI 38.0% 42.5%Pump 62.0% 57.5%
Last Hemoglobin A1c (%) 9.08 ± 1.97 (6.20-15.10) 8.82 ± 1.68 (6.2-14.00)Average CGM Glucose Reading (mg/dL) 188.00 ± 49.52 (100.00-317.00) 182.16 ± 48.36 (100.00-317.00)Time Hyperglycemic (%) 45.51 ± 23.29 (2.00-100.00) 42.32 ± 22.82 (2.00-88.00)Time Hypoglycemia (%) 5.57 ± 5.69 (0.00-21.00) 6.11 ± 5.96 (0.00-21.00)
Means ± standard deviations are reported; ranges are in parentheses.
Table 2—T-test results for total apnea-hypopnea index ≥ 1.5 versus < 1.5 on measures of glucose control and body mass index (BMI)
Variable SDBd Non-SDB D; 95% CI[]Hemoglobin A1c (%)a 9.43 ± 1.84 8.49 ± 1.53 0.56; −2.12, 0.26CGM Glucose Levels (mg/dL)b 208.50 ± 44.15 169.62 ± 45.84 0.87; −71.49, −6.47*CGM Hyperglycemia %b 54.17 ± 19.10 36.64 ± 22.59 0.84; −32.19, −2.85*CGM Hypoglycemia %b 3.5 ± 3.73 7.36 ± 6.47 0.71; 0.44, 7.28*Meter Glucose Levels (mg/dL)c 186.64 ± 30.24 174.12 ± 35.91 0.38; −24.57, 9.53BMI %a 62.43 ± 24.04 67.12 ± 27.49 0.18; −12.44, 21.82Stage N1%a 7.11 ± 3.82 7.95 ± 3.59 0.23; −1.71, 3.39Stage N2%a 56.81 ± 7.56 57.43 ± 7.17 0.08; −4.44, 5.68Stage N3%a 17.16 ± 7.65 13.14 ± 6.65 0.56; −9.03, 0.98REM%a 20.42 ± 5.00 23.38 ± 5.87 0.54; −0.74, 6.56
an = 40; bn = 37; cn = 39; dMeans ± standard deviations are reported; *P ≤ 0.05; ** P ≤ 0.01; The CI = confidence interval of the difference between groups.
SLEEP, Vol. 35, No. 1, 2012 85 Sleep and Diabetes—Perfect et al
Appendix 2. Stage N3 positively related to DQOL-Y Life Sat-isfaction (P = 0.038), and inversely related to SSHS Sleepy2 (P = 0.006), SSHS Sleep-Wake Behavior Problems (P = 0.007), and DQOL-Y Disease Impact (P = 0.034). See Figure 1 for a scatterplot depicting the relation between Stage N3 and self-reported sleepiness (Sleepy2). Stage N2 was positively corre-lated with PSC scores (P = 0.002), DQOL-Y Disease Impact (P = 0.002), SSHS Grades (P = 0.004), SSHS Depressed Mood (P = 0.015), SSHS Sleep-Wake Behavior Problems (P = 0.015), DQOL-Y Diabetes-Related Worries (P = 0.02), and SSHS Sleepy2 (P = 0.026). Stage N2 was negatively correlated with the SSHS Sleep Quality subscale (P = 0.008), GPA (P = 0.034), and state standardized math scores (P = 0.035). Stage N1 nega-tively correlated with DQOL-Y Life Satisfaction (P = 0.011). Psychosocial functioning variables were not different according to AHI nor were they associated with actigraph sleep parame-ters, with the exception of state standardized reading scores be-ing positively related to SE (P = 0.042) and negatively related to WASO (P = 0.035).
Worries (P = 0.005), and SSHS Depressed Mood (P = 0.027). Falling asleep during activities (SSHS Sleepy1) positively cor-related with SSHS Depressed Mood (P = 0.002) and SSHS Grades (P = 0.029). SSHS Sleep-Wake Behavior Problems was positively related to SSHS Grades (P < 0.001), DQOL-Y Disease Impact (P = 0.001), DQOL-Y Diabetes-Related Wor-ries (P = 0.010), PSC scores (P = 0.023), and SSHS Depressed Mood (P = 0.039), and inversely related to DQOL-Y Life Sat-isfaction (P = 0.016), GPA (P = 0.049), and state standardized reading scores (P = 0.047). SSHS Sleep Quality was associated with state standardized reading scores (P = 0.023).
Findings pertaining to self-reported sleep with measures of psychosocial functioning and sleep architecture are shown in
Figure 1—Relation of percent of time spent in stage N2 to metabolic control, as measured by hemoglobin Alc (HbA1c) and relation of percent of time spent in stage N3 to daytime sleepiness, as measured by School Sleep Habits Survey Sleepy2 subscale.
Hb
A1C
(%)
Stage N2 (%) Stage N3 (%)
SSHS
Sle
epy2
Sub
scale
Sco
re
20
15
10
5
0
0 10 20 30 4040 50 60 70 80
14
12
10
8
6 R2 Linear = 0.295 R2 Linear = 0.181
Table 3—Descriptive information of actigraph data, School Sleep Habits Survey Subscales, Diabetes Quality of Life, and Pediatric Symptoms Checklist
Variable Mean Standard DeviationActigraphy Data
Total Sleep Timea 417.66 64.79 Sleep Onset Latencya 14.52 11.33 Wake After Sleep Onseta 86.67 51.74 Sleep Efficiency (%) 78.50 9.99
School Sleep Habits SurveySleepy1 12.98 3.89Sleepy2 7.28 3.33Sleep-Wake Behavior Problems 17.10 7.13Sleep Quality 7.92 1.99Depressed Mood 8.26 2.28
Diabetes Quality of LifeLife Satisfaction 65.81 11.67Diabetes-Related Worries 46.11 11.59Disease Impact 22.53 8.91
Pediatric Symptom Checklist 19.18 10.11
aRecording in minutes.
Table 4—Multiple regression analyses predicting glycemic control as measured by a continuous glucose monitor and hemoglobin A1c
Model B SE B ΒPredicting CGM valuesa
Total-AHI cutoff 35.81 12.28 0.35Stage N2 (%) 2.04 0.93 0.29PSC Score 1.51 0.71 0.29Diabetes duration (years) 4.85 1.79 0.33
Predicting HbA1c valuesb
Age (years) 0.02 0.01 0.28Stage N2 (%) 0.06 0.04 0.28PSC Score 0.05 0.02 0.27
aF4,32 = 9.73 (P < 0.001), MSE = 34.45, R2 = 0.55; bF 3,36 = 9.11 (P < 0.001), MSE = 1.32, R2 = 0.43; MSE, Mean Square Error; AHI, apnea-hypopnea index (cutoff is ≥ 1.5); PSC, Pediatric Symptoms Checklist.
SLEEP, Vol. 35, No. 1, 2012 86 Sleep and Diabetes—Perfect et al
N2 were more likely to have higher average daily glucose val-ues, experience more hyperglycemia, and have higher HbA1c levels. Moreover, stage N2 was associated with parental reports of emotional and behavioral difficulties, reduced diabetes qual-ity of life, lower grades, sleep-wake behavior problems, depres-sive mood, daytime poor sleep quality, sleepiness, and worse math performance. The associations between sleep architecture with poor glycemic control and diminished daytime function-ing is particularly problematic given that we also found that youth with T1DM spent significantly more time (%) in stage N2 and less time in SWS than matched controls. Further, al-though groups had comparable Total-AHIs and O-AHIs, youth with diabetes had more central apneas.
This study adds to the burgeoning evidence that SDB may result in higher glucose levels.14,15,17,42 Using the Total-AHI, the data supported large effects of at least mild SDB negatively im-pacting daily CGM values and hyperglycemia. To put it into per-spective, the mean glucose level of the SDB group was above the hyperglycemic cut-off (≥ 180 mg/dL), whereas the mean of the non-SDB group although still high, was below the hypergly-cemic range. Using the same cutoff (Total-AHI ≥ 1.5), Kelly and colleagues32 found that individuals with SDB had greater insulin resistance relative to individuals without SDB. Further, our data are consistent with findings reported by Villa and colleagues17 and as well as the Sleep Heart Health Study.43 In these studies, individuals with diabetes presented with more central breathing abnormalities relative to non-diabetics, suggesting that diabet-ics may have a defect in central respiratory control. When SDB groupings were based on O-AHI (i.e., without central events), our results did not achieve statistical significance. Nevertheless, qualitatively similar patterns were found. We believe that the mean differences between groups are still notable because the findings suggest that both central and obstructive events have the potential to negatively impact glycemic control. Ultimate-ly, a larger sample will be needed to fully understand the role of SDB and its various subtypes on glucose dysregulation in youth with T1DM. A longitudinal perspective would also help
Sleep Architecture and SDB Differences Between Diabetic Cohort and Controls
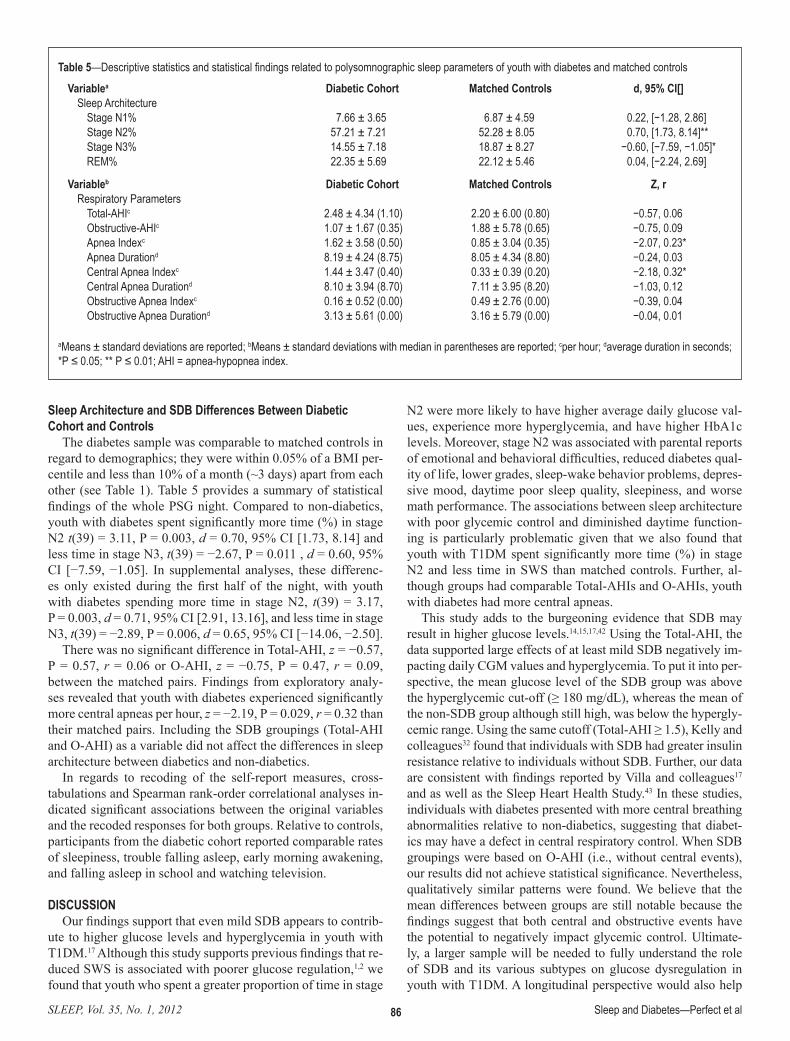
The diabetes sample was comparable to matched controls in regard to demographics; they were within 0.05% of a BMI per-centile and less than 10% of a month (~3 days) apart from each other (see Table 1). Table 5 provides a summary of statistical findings of the whole PSG night. Compared to non-diabetics, youth with diabetes spent significantly more time (%) in stage N2 t(39) = 3.11, P = 0.003, d = 0.70, 95% CI [1.73, 8.14] and less time in stage N3, t(39) = −2.67, P = 0.011 , d = 0.60, 95% CI [−7.59, −1.05]. In supplemental analyses, these differenc-es only existed during the first half of the night, with youth with diabetes spending more time in stage N2, t(39) = 3.17, P = 0.003, d = 0.71, 95% CI [2.91, 13.16], and less time in stage N3, t(39) = −2.89, P = 0.006, d = 0.65, 95% CI [−14.06, −2.50].
There was no significant difference in Total-AHI, z = −0.57, P = 0.57, r = 0.06 or O-AHI, z = −0.75, P = 0.47, r = 0.09, between the matched pairs. Findings from exploratory analy-ses revealed that youth with diabetes experienced significantly more central apneas per hour, z = −2.19, P = 0.029, r = 0.32 than their matched pairs. Including the SDB groupings (Total-AHI and O-AHI) as a variable did not affect the differences in sleep architecture between diabetics and non-diabetics.
In regards to recoding of the self-report measures, cross-tabulations and Spearman rank-order correlational analyses in-dicated significant associations between the original variables and the recoded responses for both groups. Relative to controls, participants from the diabetic cohort reported comparable rates of sleepiness, trouble falling asleep, early morning awakening, and falling asleep in school and watching television.
DISCUSSIONOur findings support that even mild SDB appears to contrib-
ute to higher glucose levels and hyperglycemia in youth with T1DM.17 Although this study supports previous findings that re-duced SWS is associated with poorer glucose regulation,1,2 we found that youth who spent a greater proportion of time in stage
Table 5—Descriptive statistics and statistical findings related to polysomnographic sleep parameters of youth with diabetes and matched controls
Variablea Diabetic Cohort Matched Controls d, 95% CI[]Sleep Architecture
Stage N1% 7.66 ± 3.65 6.87 ± 4.59 0.22, [−1.28, 2.86]Stage N2% 57.21 ± 7.21 52.28 ± 8.05 0.70, [1.73, 8.14]**Stage N3% 14.55 ± 7.18 18.87 ± 8.27 −0.60, [−7.59, −1.05]*REM% 22.35 ± 5.69 22.12 ± 5.46 0.04, [−2.24, 2.69]
Variableb Diabetic Cohort Matched Controls Z, rRespiratory Parameters
Total-AHIc 2.48 ± 4.34 (1.10) 2.20 ± 6.00 (0.80) −0.57, 0.06Obstructive-AHIc 1.07 ± 1.67 (0.35) 1.88 ± 5.78 (0.65) −0.75, 0.09Apnea Indexc 1.62 ± 3.58 (0.50) 0.85 ± 3.04 (0.35) −2.07, 0.23*Apnea Durationd 8.19 ± 4.24 (8.75) 8.05 ± 4.34 (8.80) −0.24, 0.03Central Apnea Indexc 1.44 ± 3.47 (0.40) 0.33 ± 0.39 (0.20) −2.18, 0.32*Central Apnea Durationd 8.10 ± 3.94 (8.70) 7.11 ± 3.95 (8.20) −1.03, 0.12Obstructive Apnea Indexc 0.16 ± 0.52 (0.00) 0.49 ± 2.76 (0.00) −0.39, 0.04Obstructive Apnea Durationd 3.13 ± 5.61 (0.00) 3.16 ± 5.79 (0.00) −0.04, 0.01
aMeans ± standard deviations are reported; bMeans ± standard deviations with median in parentheses are reported; cper hour; daverage duration in seconds; *P ≤ 0.05; ** P ≤ 0.01; AHI = apnea-hypopnea index.
SLEEP, Vol. 35, No. 1, 2012 87 Sleep and Diabetes—Perfect et al
This study is not without limitations. First, the study design and statistical analyses did not control for insulin dosage, a critical factor in glucose regulation in T1DM. Second, the low number of participants with AHI ≥ 5 precluded meaningful analyses of the impact of more severe SDB. For future studies, it may help to exclude those with intermediate AHI and com-pare differences between children without SDB and with more clear-cut SDB. Third, with respect to our matched controls, due to the small number of participants, we did not include Tanner staging or race/ethnicity as part of matching criteria. One pre-vious study did find a small difference in staging according to this latter characteristic for younger participants41 and we found differences in REM. Nonetheless, although we cannot defini-tively exclude the possibility that race/ethnicity confounded our results, there were comparable proportions of Whites and non-Whites in both samples. Fourth, we conducted a large number of analyses with a modest sample size without a correction to adjust for multiple hypothesis testing. Although the possibil-ity of type I error exists and findings need to be replicated, the associations were internally consistent with each other, in the expected direction in most cases, and consistent with previous literature. Finally, we used actigraphy as an estimate of sleep and wakefulness during the CGM measurements rather than PSG. Although PSG would have provided actual measurements of sleep architecture, it is not feasible for continuous serial data collection over several days. Moreover, in the absence of overt insomnia or SDB, estimates of sleep and wakefulness with ac-tigraphy correlate well with PSG data.
Overall, this study supports the need to inquire about sleepi-ness and sleep habits as part of the clinical care of youth with T1DM. Clinicians and school-based professionals need to be aware that reports of daytime sleepiness, disrupted sleep, or poor sleep habits, may affect patients’ daytime functioning, including the possibility of interfering with their diabetes self-care,quality of life, and school performance. Future research is also needed to determine the exact prevalence of SDB in youth with T1DM and its impact on metabolic function to determine if universal PSG screening is appropriate. Percent of time in stage N2 in particular was associated with several potentially adverse outcomes and this stage of sleep also needs to be exam-ined further in this population.
ACKNOWLEDGMENTSThis project was funded by the Father’s Day Council, Tuc-
son, Arizona and the University of Arizona Foundation Faculty Small Grants Program. Johnson and Johnson (Lifescan) donat-ed all One Touch Ultra Meters and a portion of the Strips used in the study. We would like to acknowledge Tina Frick, RN, and graduate students Jennifer Lehr, MA, and Martha Youman, MEd for their assistance with this study. Further, we appreciate the assistance of Deborah Levine-Donnerstein, PhD for her sta-tistical expertise. TuCASA was supported by HL62373.
DISCLOSURE STATEMENTThis was not an industry supported study. Johnson and John-
son (Lifescan) donated all One Touch Ultra Meters and a por-tion of the Strips used in the study. Dr. Goodwin has received research support from Phillips/Respironics. Drs. Griffin, C. Pa-tel, M. Wheeler, and P. Patel have received research support
to discern whether SDB affects glucose control, or if perhaps it is the other way; that is, dyregulated glucose contributes to the onset and/or persistence of SDB in youth with T1DM. At the very least, physicians involved in the clinical care of youth with T1DM should evaluate the potential for SDB as a source of interference with maintaining optimal glucose levels.
Although stage N3 was related to HbA1c, stage N2 also re-lated to glycemic control and remained in the model. It is im-portant to keep in mind that these data are correlational and do not mean that sleep problems cause glucose dysregulation, or vice versa. However, they are consistent with the physiological mechanisms that occur during sleep. For instance, there is nor-mally more parasympathetic than sympathetic activity during SWS. If there is less SWS, then sympathetic activity is more likely to predominate. Sympathetic activity means more release of certain counterregulatory hormones (e.g., epinephrine), which may increase glucose.1,2
Using daily TST estimated by the actigraphy, youth slept less than the recommended nine hours of sleep. However, we did not find that sleep duration predicted awakening glucose values. Future research needs to further examine the impact of sleep restriction9 or short sleep duration on awakening and day-to-day variability in glucose levels in T1DM, taking into account other factors implicated in glucose regulation, particu-larly insulin, diet, and physical activity.
These findings lend support for the role of sleepiness in depressive symptoms,36 reduced diabetes quality of life, and perceptions of lower grades. Poor sleep habits also associated with these psychosocial variables as well as parental reports of emotional and behavioral difficulties and worse performance in reading. Less attention has been paid to sleep architecture and school-related outcomes. Youth with diabetes are already at-risk for school-related problems.44 The finding related to the associations of perceived and actual grades as well as math per-formance with stage N2 should serve as an impetus for future research to better understand the role of sleep in altering school functioning in youth with diabetes.
Unlike large cohort studies,25,29,30 the current study did not find that mild SDB was related to psychosocial outcomes. However, this finding is partially consistent with previous re-search,45 as it is likely that these effects are more noticeable with more severe SDB.26,28,30 We chose to use the Total-AHI with a cut-off of 1.5 as our referral for further evaluation and for statistical analyses based on previous literature on SDB in pediatric populations.31,32 Future research should examine the joint impact of sleep related respiratory problems and glucose dysregulation in youth with T1DM on SDB and diabetes symp-toms as well as daytime functioning with larger samples and longitudinally. Research would be enhanced by including neu-rocognitive measures, which have been found to be affected by SDB22,23 and glycemic control.46
Supporting our hypothesis and previous findings,7,11 youth with T1DM spent significantly more time in stage N2 and less time in stage N3 than non-diabetics. The difference was approximately 5% of the night, which means based on a 7-hour night, youth with diabetes would spend 21 minutes less in SWS. Thus, even though it is slightly less than a half hour, this pattern of sleep architecture is associated with worse glycemic control and problems in sleepi-ness, mood, behavior, quality of life, and school performance.
SLEEP, Vol. 35, No. 1, 2012 88 Sleep and Diabetes—Perfect et al
25. Rosen CL, Storfer-Isser A, Taylor HG, Kirchner HL, Emancipator JL, Redline S. Increased behavioral morbidity in school-aged children with sleep-disordered breathing. Pediatrics 2004;114:1640-8.
26. Chervin RD, Archbold KH, Dillon JE, et al. Inattention, hyperactivity, and symptoms of sleep disordered breathing. Pediatrics 2002;2:501-10.
27. Chervin R, Dillon J, Bassetti C, Ganoczy D, Pituch K. Symptoms of sleep disorders, inattention, and hyperactivity in children. Sleep 1997;20:1185-92.
28. Ting H, Wong RH, Yang HJ, Lee SP, Lee SD, Wang L. Sleep-disordered breathing, behavior, and academic performance in Taiwan schoolchildren. Sleep Breath 2010;15:91-8.
29. Mulvaney SA, Goodwin JL, Morgan WJ, Rosen GR, Quan SF, Kaem-ingk KL. Behavior problems associated with sleep disordered breathing in school-aged children--the Tucson children’s assessment of sleep apnea study. J Pediatr Psychol 2006;31:322-30.
30. Zhao Q, Sherrill DL, Goodwin JL, Quan SF. Association between sleep disordered breathing and behavior in school-aged children: the Tuc-son Children’s Assessment of Sleep Apnea Study. Open Epidemiol J 2008;1:1-9.
31. Witmans MB, Keens TG, Davidson Ward SL, Marcus CL. Obstructive hypopneas in children and adolescents: normal values. Am J Respir Crit Care Med 2003;168:1540.
32. Kelly A, Dougherty S, Cucchiara A, Marcus CL, Brooks LJ. Catechol-amines, adiponectin, and insulin resistance as measured by HOMA in children with obstructive sleep apnea. Sleep 2010;33:1185-91.
33. Goodwin JL, Vasquez MM, Silva GE, Quan SF. Incidence and remission of sleep-disordered breathing and related symptoms in 6- to 17-year old children--the Tucson Children’s Assessment of Sleep Apnea Study. J Pe-diatr 2010;157:57-61.
34. Goodwin JL, Enright PL, Morgan W, et al. Feasibility of using un-attended polysomnography in children for research: report of the Tuc-son Children’s Assessment of Sleep Apnea Study (TuCASA). Sleep 2001;24:937-44.
35. Iber C, Ancoli-Israel S, Chesson AL, Quan SF. The AASM Manual for the scoring of sleep and associated events: rules, terminology, and technical specifications. Westchester, IL: American Academy of Sleep Medicine; 2007.
36. Wolfson AR, Carskadon MA. Sleep schedules and daytime functioning in adolescents. Child Dev 2008;69:875-87.
37. Acebo C, Carskadon MA. Influence of irregular sleep patterns on waking behavior. In: Carskadon MA, ed. Adolescent sleep patterns: biological, social, and psychological influences. Cambridge, UK: Cambridge Uni-versity Press;2002:220-35.
38. Ingersoll GM, Marrero DG. A modified quality-of-life measure for youths: psychometric properties. Diabetes Educ 1991;17:114-18.
39. Jellinek MS, Murphy JM, Little M, et al. Use of the Pediatric Symptoms Checklist (PSC) to screen for psychosocial problems in pediatric primary care. Arch Pediatr Adolesc Med 1999;153:201-9.
40. Jenni OG, Carskadon MA. Sleep behavior and sleep regulation from infancy through adolescence: normative aspects. Sleep Med Clin 2007;2:321-9.
41. Quan SF, Goodwin JL, Babar SI, et al. Sleep architecture in normal Cau-casian and Hispanic children aged 6-11 years recorded during unattended home polysomnography: experience from the Tucson Children’s Sleep Apnea Study (TuCASA). Sleep Med 2003;4:13-9.
42. Coughlin S, Mawdsley L, Mugarza J, et al. Obstructive sleep apnea is independently associated with an increase prevalence of metabolic syn-drome. Eur Heart J 2004;25:735-41.
43. Resnick HE, Redline S, Shahar E, et al. Diabetes and sleep disturbances: findings from the Sleep Heart Health Study. Diabetes Care 2003; 26: 702-9.
44. Al-Haidar FA. Psychosocial aspects of diabetes mellitus in children and adolescents. Arab J Psychiatr 2006;17:197-214.
45. Calhoun SL, Mayes SD, Vgontzas AN, Tsaoussoglou M, Shifflett LJ, Bixler EO. No relationship between neurocognitive functioning and mild sleep disordered breathing in a community sample of children. J Clin Sleep Med 2009;5:228-34.
46. Naguib JM, Kulinskaya E, Lomax CL, Garralda ME. Neurocognitive performance in children with type 1 diabetes–a meta-analysis. J Pediatr Psychol 2009;34:271-82.
from Dyomid Corporation and Lilly. The authors have indicat-ed no financial conflicts of interest.
REFERENCES1. Dijk D. Slow-wave sleep, diabetes, and the sympathetic nervous system.
Pro Natl Acad Sci U S A 2008;105:1107-8.2. Tasali E, Leproult R, Ehrmann DA, Cauter EV. Slow-wave sleep
and the risk of type 2 diabetes in humans. Pro Natl Acad Sci U S A 2008;105:1044-9.
3. SEARCH for Diabetes in Youth Study Group. The burden of diabetes mellitus among US youth: prevalence estimates from the SEARCH for Diabetes in Youth Study. Pediatrics 2006:118:1510-8.
4. Vigg A. Sleep in type 2 diabetes. J Assoc Physicians India 2003;51:479-81.5. Sridhar GR, Madhu K. Prevalence of sleep disturbances in diabetes mel-
litus. Diabetes Res Clin Pract 1994;23:183-6.6. Perfect MM, Elkins GR, Lahroud TL, Posey JR. Stress and quality of sleep
among individuals diagnosed with diabetes. Stress Health 2010;26:61-74.7. Jauch-Chara K, Schmid SM, Hallschmid M, Born J, Schultes B. Altered
neuroendocrine sleep architecture in patients with type 1 diabetes. Diabe-tes Care 2008;31:1183-8.
8. Spiegel K, Knutson K, Leproult R, Tasali E, Cauter EV. Sleep Loss: a novel risk factor for insulin resistance and Type 2 Diabetes. J Appl Physi-ol 2005;99:2008-19.
9. Donga E, van Dijk M, van Dijk JG, et al. Partial sleep restriction decreas-es insulin sensitivity in type 1 diabetes. Diabetes Care 2010;33:1573-7.
10. Serrano RM, Navascues I, Ordonez A, et al. Nocturnal growth hormone surges in type 1 diabetes mellitus are both sleep- and glycemia-depen-dent: assessment under continuous sleep monitoring. Diabetes Res Clin Pract 1990;10:1-8.
11. Pallayova M, Domic V, Gesova S, Pergrim I, Tomori Z. Do differences in sleep architecture exist between persons with Type 2 diabetes and nondia-betic controls? J Diabetes Sci Technol (Online) 2010;4:344-52.
12. Matyka KA, Crawford C, Wiggs L, Dunger DB, Stores G. Alterations in sleep physiology in young children with insulin-dependent diabetes mel-litus: relationship to nocturnal hypoglycemia. J Pediatr 2000;137:233-8.
13. Pillar G, Schuschiem G, Weiss R, et al. Interactions between hypogly-cemia and sleep architecture in children with type 1 diabetes mellitus. J Pediatr 2003;142:163-8.
14. Aronsohn RS, Whitmore H, Cauter EV, Tasali E. Impact of untreated ob-structive sleep apnea on glucose (OSA) control in type 2 diabetes. Am J Respir Crit Care Med 2010;181:507-13.
15. Punjabi NM, Shahar E, Redline S, et al. Sleep-disordered breathing, glu-cose intolerance, and insulin resistance: the Sleep Heart Health Study. Am. J. Epidemiol 2004;160:521-30.
16. Reichmuth KJ, Austin D, Skatrud JB, Young T. Association of sleep apnea and type II diabetes: a population-based study. Am J Respir Crit Care Med 2005;172:1590-5.
17. Villa MP, Multari G, Montesano M. et al. Sleep apnoea in children with diabetes mellitus: effect of glycoemic control. Diabetologia 2000;43:696-702.
18. Bottini P, Dottorini ML, Cordoni MC, Casucci G, Tantucci C. Sleep-dis-ordered breathing in nonobese diabetic subjects with autonomic neuropa-thy. Eur Respir J 2003;22:654-60.
19. Liao D, Li X, Rodriguez-Colon SM, et al. Sleep-disordered breathing and cardiac autonomic modulation in children. Sleep Med 2010;11:484-8.
20. Stoohs RA, Facchini F, Guilleminault C. Insulin resistance and sleep-disordered breathing in healthy humans. Am J Respir Crit Care Med 1996;154:170-4.
21. Johnson EO, Roth T. An epidemiologic study of sleep-disordered breath-ing symptoms among adolescents. Sleep 2006;29:1135-42.
22. Blunden SL, Lushington K, Lorenzen, B, Kennedy, D, Martin J. Neu-ropsychological and psychosocial function in children with a history of either snoring or disorders of initiating and maintaining sleep. J Pediatr 2005;146:780-6.
23. Kaemingk KL, Pasvogel AE, Goodwin JL, et al. Learning in children and sleep disordered breathing: findings of the Tucson Children’s Assessment of Sleep Apnea (TuCASA) prospective cohort study. J Int Neuropsychol Soc 2003;9:1016-26.
24. Perez-Chada D, Perez-Lioret S, Videla AJ, et al. Sleep disordered breath-ing and daytime sleepiness are associated with poor academic perfor-mance in teenagers. A study using the Pediatric Daytime Sleepiness Scale (PDSS). Sleep 2007;30:1698-703.
SLEEP, Vol. 35, No. 1, 2012 88A Sleep and Diabetes—Perfect et al
APPENDIX #1
School Sleep Habits Survey (SSHS)Within each scale, item scores are summed to comprise a
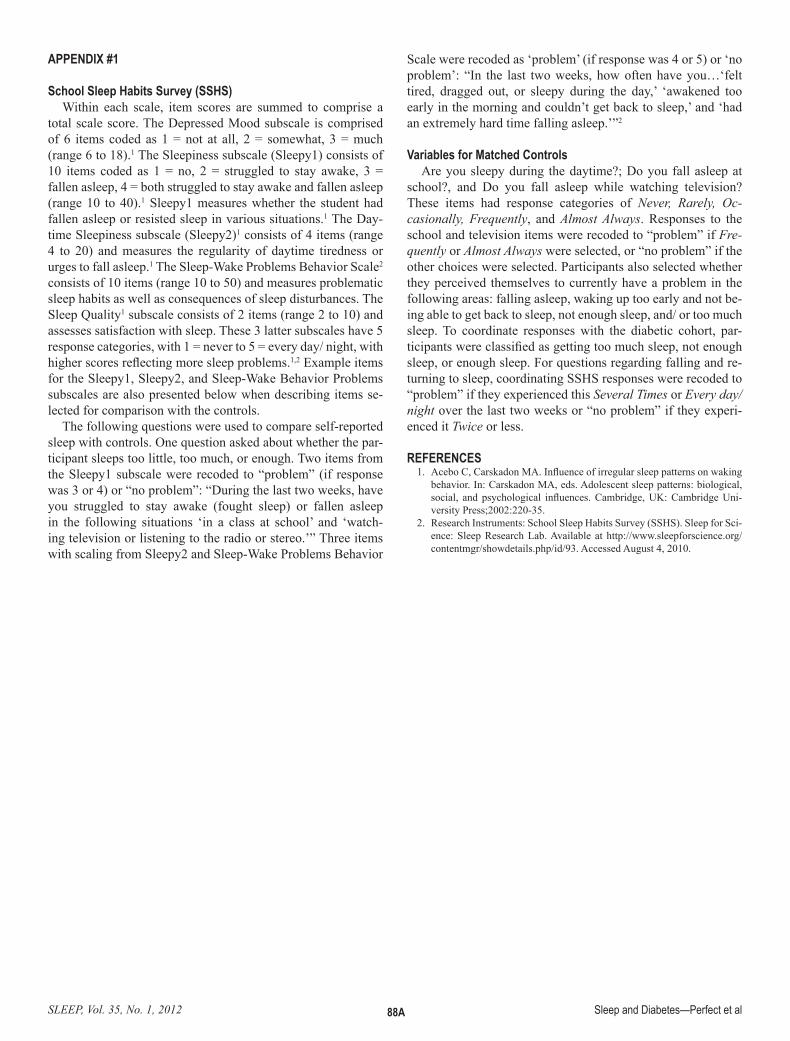
total scale score. The Depressed Mood subscale is comprised of 6 items coded as 1 = not at all, 2 = somewhat, 3 = much (range 6 to 18).1 The Sleepiness subscale (Sleepy1) consists of 10 items coded as 1 = no, 2 = struggled to stay awake, 3 = fallen asleep, 4 = both struggled to stay awake and fallen asleep (range 10 to 40).1 Sleepy1 measures whether the student had fallen asleep or resisted sleep in various situations.1 The Day-time Sleepiness subscale (Sleepy2)1 consists of 4 items (range 4 to 20) and measures the regularity of daytime tiredness or urges to fall asleep.1 The Sleep-Wake Problems Behavior Scale2 consists of 10 items (range 10 to 50) and measures problematic sleep habits as well as consequences of sleep disturbances. The Sleep Quality1 subscale consists of 2 items (range 2 to 10) and assesses satisfaction with sleep. These 3 latter subscales have 5 response categories, with 1 = never to 5 = every day/ night, with higher scores reflecting more sleep problems.1,2 Example items for the Sleepy1, Sleepy2, and Sleep-Wake Behavior Problems subscales are also presented below when describing items se-lected for comparison with the controls.
The following questions were used to compare self-reported sleep with controls. One question asked about whether the par-ticipant sleeps too little, too much, or enough. Two items from the Sleepy1 subscale were recoded to “problem” (if response was 3 or 4) or “no problem”: “During the last two weeks, have you struggled to stay awake (fought sleep) or fallen asleep in the following situations ‘in a class at school’ and ‘watch-ing television or listening to the radio or stereo.’” Three items with scaling from Sleepy2 and Sleep-Wake Problems Behavior
Scale were recoded as ‘problem’ (if response was 4 or 5) or ‘no problem’: “In the last two weeks, how often have you…‘felt tired, dragged out, or sleepy during the day,’ ‘awakened too early in the morning and couldn’t get back to sleep,’ and ‘had an extremely hard time falling asleep.’”2
Variables for Matched ControlsAre you sleepy during the daytime?; Do you fall asleep at
school?, and Do you fall asleep while watching television? These items had response categories of Never, Rarely, Oc-casionally, Frequently, and Almost Always. Responses to the school and television items were recoded to “problem” if Fre-quently or Almost Always were selected, or “no problem” if the other choices were selected. Participants also selected whether they perceived themselves to currently have a problem in the following areas: falling asleep, waking up too early and not be-ing able to get back to sleep, not enough sleep, and/ or too much sleep. To coordinate responses with the diabetic cohort, par-ticipants were classified as getting too much sleep, not enough sleep, or enough sleep. For questions regarding falling and re-turning to sleep, coordinating SSHS responses were recoded to “problem” if they experienced this Several Times or Every day/ night over the last two weeks or “no problem” if they experi-enced it Twice or less.
REFERENCES1. Acebo C, Carskadon MA. Influence of irregular sleep patterns on waking
behavior. In: Carskadon MA, eds. Adolescent sleep patterns: biological, social, and psychological influences. Cambridge, UK: Cambridge Uni-versity Press;2002:220-35.
2. Research Instruments: School Sleep Habits Survey (SSHS). Sleep for Sci-ence: Sleep Research Lab. Available at http://www.sleepforscience.org/contentmgr/showdetails.php/id/93. Accessed August 4, 2010.
SLEEP, Vol. 35, No. 1, 2012 88B Sleep and Diabetes—Perfect et al
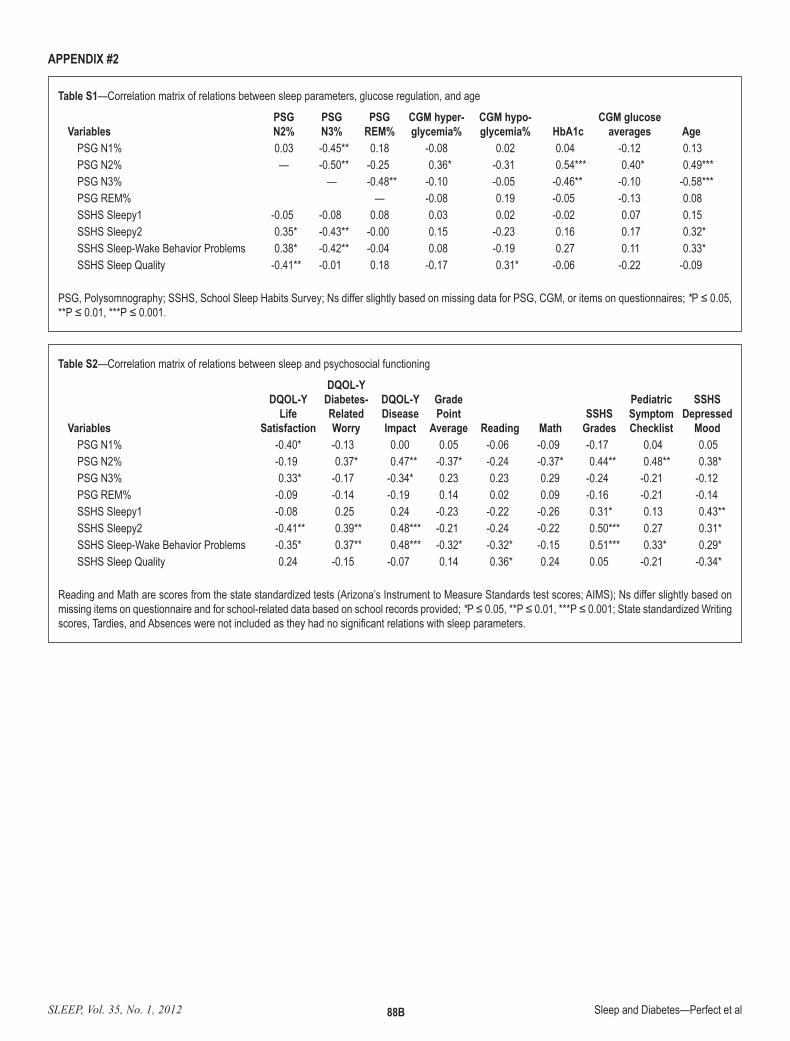
Table S1—Correlation matrix of relations between sleep parameters, glucose regulation, and age
VariablesPSGN2%
PSGN3%
PSGREM%
CGM hyper-glycemia%
CGM hypo-glycemia% HbA1c
CGM glucose averages Age
PSG N1% 0.03 -0.45** 0.18 -0.08 0.02 0.04 -0.12 0.13PSG N2% — -0.50** -0.25 0.36* -0.31 0.54*** 0.40* 0.49***PSG N3% — -0.48** -0.10 -0.05 -0.46** -0.10 -0.58***PSG REM% — -0.08 0.19 -0.05 -0.13 0.08SSHS Sleepy1 -0.05 -0.08 0.08 0.03 0.02 -0.02 0.07 0.15SSHS Sleepy2 0.35* -0.43** -0.00 0.15 -0.23 0.16 0.17 0.32*SSHS Sleep-Wake Behavior Problems 0.38* -0.42** -0.04 0.08 -0.19 0.27 0.11 0.33*SSHS Sleep Quality -0.41** -0.01 0.18 -0.17 0.31* -0.06 -0.22 -0.09
PSG, Polysomnography; SSHS, School Sleep Habits Survey; Ns differ slightly based on missing data for PSG, CGM, or items on questionnaires; *P ≤ 0.05, **P ≤ 0.01, ***P ≤ 0.001.
APPENDIX #2
Table S2—Correlation matrix of relations between sleep and psychosocial functioning
Variables
DQOL-Y Life
Satisfaction
DQOL-Y Diabetes-Related Worry
DQOL-Y Disease Impact
Grade Point
Average Reading MathSSHS
Grades
PediatricSymptomChecklist
SSHS Depressed
MoodPSG N1% -0.40* -0.13 0.00 0.05 -0.06 -0.09 -0.17 0.04 0.05PSG N2% -0.19 0.37* 0.47** -0.37* -0.24 -0.37* 0.44** 0.48** 0.38*PSG N3% 0.33* -0.17 -0.34* 0.23 0.23 0.29 -0.24 -0.21 -0.12PSG REM% -0.09 -0.14 -0.19 0.14 0.02 0.09 -0.16 -0.21 -0.14SSHS Sleepy1 -0.08 0.25 0.24 -0.23 -0.22 -0.26 0.31* 0.13 0.43**SSHS Sleepy2 -0.41** 0.39** 0.48*** -0.21 -0.24 -0.22 0.50*** 0.27 0.31*SSHS Sleep-Wake Behavior Problems -0.35* 0.37** 0.48*** -0.32* -0.32* -0.15 0.51*** 0.33* 0.29*SSHS Sleep Quality 0.24 -0.15 -0.07 0.14 0.36* 0.24 0.05 -0.21 -0.34*
Reading and Math are scores from the state standardized tests (Arizona’s Instrument to Measure Standards test scores; AIMS); Ns differ slightly based on missing items on questionnaire and for school-related data based on school records provided; *P ≤ 0.05, **P ≤ 0.01, ***P ≤ 0.001; State standardized Writing scores, Tardies, and Absences were not included as they had no significant relations with sleep parameters.
Related Documents