Submitted: 17 September, 2017; Revised: 10 December, 2017 © Sleep Research Society 2018. Published by Oxford University Press on behalf of the Sleep Research Society. All rights reserved. For permissions, please e-mail [email protected]. 1 Original Article Sleep duration in the United States 2003–2016: first signs of success in the fight against sleep deficiency? Mathias Basner* and David F. Dinges Department of Psychiatry, Unit of Experimental Psychiatry, Division of Sleep and Chronobiology, Perelman School of Medicine, University of Pennsylvania, Philadelphia, PA *Corresponding author. Mathias Basner, MD, PhD, MSc, Unit of Experimental Psychiatry, Division of Sleep and Chronobiology, Perelman School of Medicine, University of Pennsylvania, 1019 Blockley Hall, 423 Guardian Drive, Philadelphia, PA 19104-6021. Email: [email protected]. Abstract Study Objectives: The high prevalence of chronic insufficient sleep in the population has been a concern due to the associated health and safety risks. We evaluated secular trends in sleep duration over the most recent 14-year period. Methods: The American Time Use Survey, representative of US residents ≥15 years, was used to investigate trends in self- reported sleep duration and waking activities for the period 2003–2016 (N = 181 335 respondents). Results: Sleep duration increased across survey years both on weekdays (+1.40 min/year) and weekends (+0.83 min/year, both p < .0001, adjusted models). This trend was observed in students, employed respondents, and retirees, but not in those unemployed or not in the labor force. On workdays, the prevalence of short (≤7 hr), average (>7–9 hr), and long (>9 hr) sleep changed by −0.44% per year (p < .0001), −0.03% per year (p = .5515), and +0.48% per year (p < .0001), respectively. The change in sleep duration was predominantly explained by respondents retiring earlier in the evening. The percentage of respondents who watched TV or read before bed—two prominent waking activities competing with sleep—decreased over the same time period, suggesting that portions of the population are increasingly willing to trade time in leisure activities for more sleep. The results also suggest that increasing online opportunities to work, learn, bank, shop, and perform administrative tasks from home freed up time that likely contributed to increased sleep duration. Conclusions: The findings indicate first successes in the fight against sleep deficiency. Public health consequences of the observed increase in the prevalence of long sleep remain unclear and warrant further investigation. Key words: sleep duration; short sleep; long sleep; secular trend; health; time use Statement of Significance Chronic insufficient sleep in the US population is a concern, and it is unknown whether ongoing campaigns have been effective in increasing sleep duration. To the best of our knowledge, this is the first study to show that sleep duration increased in many segments of the US population over the period 2003–2016. The analyses indicate a greater willingness of Americans to trade time spent in discretionary activities for more sleep. They also point to additional time provided by online opportunities to work, learn, bank, shop, and perform administrative tasks from home as drivers for increased sleep time. The wealth of information derived from the American Time Use Survey stresses the importance of tracking sleep patterns longitudinally using surveys representative for the US population. SLEEPJ, 2018, 1–16 doi: 10.1093/sleep/zsy012 Advance Access Publication Date: 8 January 2018 Original Article Downloaded from https://academic.oup.com/sleep/article/41/4/zsy012/4792945 by guest on 27 August 2022

Welcome message from author
This document is posted to help you gain knowledge. Please leave a comment to let me know what you think about it! Share it to your friends and learn new things together.
Transcript
Submitted: 17 September, 2017; Revised: 10 December, 2017 © Sleep Research Society 2018. Published by Oxford University Press on behalf of the Sleep Research Society. All rights reserved. For permissions, please e-mail [email protected].
1
Original Article
Sleep duration in the United States 2003–2016: first signs of success in the fight against sleep deficiency?Mathias Basner* and David F. Dinges
Department of Psychiatry, Unit of Experimental Psychiatry, Division of Sleep and Chronobiology, Perelman School of Medicine, University of Pennsylvania, Philadelphia, PA
*Corresponding author. Mathias Basner, MD, PhD, MSc, Unit of Experimental Psychiatry, Division of Sleep and Chronobiology, Perelman School of Medicine, University of Pennsylvania, 1019 Blockley Hall, 423 Guardian Drive, Philadelphia, PA 19104-6021. Email: [email protected].
AbstractStudy Objectives: The high prevalence of chronic insufficient sleep in the population has been a concern due to the associated health and safety risks. We evaluated secular trends in sleep duration over the most recent 14-year period.
Methods: The American Time Use Survey, representative of US residents ≥15 years, was used to investigate trends in self-reported sleep duration and waking activities for the period 2003–2016 (N = 181 335 respondents).
Results: Sleep duration increased across survey years both on weekdays (+1.40 min/year) and weekends (+0.83 min/year, both p < .0001, adjusted models). This trend was observed in students, employed respondents, and retirees, but not in those unemployed or not in the labor force. On workdays, the prevalence of short (≤7 hr), average (>7–9 hr), and long (>9 hr) sleep changed by −0.44% per year (p < .0001), −0.03% per year (p = .5515), and +0.48% per year (p < .0001), respectively. The change in sleep duration was predominantly explained by respondents retiring earlier in the evening. The percentage of respondents who watched TV or read before bed—two prominent waking activities competing with sleep—decreased over the same time period, suggesting that portions of the population are increasingly willing to trade time in leisure activities for more sleep. The results also suggest that increasing online opportunities to work, learn, bank, shop, and perform administrative tasks from home freed up time that likely contributed to increased sleep duration.
Conclusions: The findings indicate first successes in the fight against sleep deficiency. Public health consequences of the observed increase in the prevalence of long sleep remain unclear and warrant further investigation.
Key words: sleep duration; short sleep; long sleep; secular trend; health; time use
Statement of SignificanceChronic insufficient sleep in the US population is a concern, and it is unknown whether ongoing campaigns have been effective in increasing sleep duration. To the best of our knowledge, this is the first study to show that sleep duration increased in many segments of the US population over the period 2003–2016. The analyses indicate a greater willingness of Americans to trade time spent in discretionary activities for more sleep. They also point to additional time provided by online opportunities to work, learn, bank, shop, and perform administrative tasks from home as drivers for increased sleep time. The wealth of information derived from the American Time Use Survey stresses the importance of tracking sleep patterns longitudinally using surveys representative for the US population.
SLEEPJ, 2018, 1–16
doi: 10.1093/sleep/zsy012Advance Access Publication Date: 8 January 2018Original Article
Dow
nloaded from https://academ
ic.oup.com/sleep/article/41/4/zsy012/4792945 by guest on 27 August 2022

IntroductionAlthough more research is needed to understand the range of functional benefits of sleep, there is no disputing that it is a daily biological imperative. According to Tononi and Cirelli, sleep is the price we pay for the brain’s plasticity—its ability to modify its wir-ing in response to experience [1, 2]. Cognitive performance and vigilant attention will decline quickly if wakefulness is extended past the typical 16 hr, increasing the risk for errors and accidents [3–5]. Experimental studies have demonstrated that both acute total and chronic partial sleep restriction in healthy adults are associated with physiological changes that can be considered precursors of manifest diseases (e.g. decreased insulin sensi-tivity) [6–10]. These changes provide biological plausibility for a causal relationship between chronic insufficient sleep and nega-tive health outcomes [11]. Accordingly, epidemiological studies consistently find associations between habitual short sleep and negative health outcomes, including obesity [12, 13], diabetes [13, 14], hypertension [15], cardiovascular disease [16], declines in cog-nitive function [17], and all-cause mortality [18, 19].
The relationship between sleep duration and negative health outcomes is often found to be U-shaped, with minimal risks for 7–8 hr of self-reported sleep duration on weekday nights. Although the number of studies providing biological plausibility for a causal role of short sleep in the genesis of negative health outcomes is considerable, the role of long sleep is less clear [20]. Although pathways for how long sleep could induce increased morbidity and mortality have been proposed [21], both reverse causation and residual confounding are plausible mechanisms which would make long sleep merely a surrogate marker of other factors (like depression and low socioeconomic status) [22] that predispose to these outcomes [23]. Accordingly, the American Academy of Sleep Medicine (AASM) and the Sleep Research Society (SRS) concluded that “it is uncertain whether sleeping more than 9 hr per night is associated with health risk” [20].
The latter statement is based on a review of the literature on the effects of sleep duration on cognitive performance and health by an expert panel convened by AASM and SRS [20]. Based on a modified RAND approach, the experts came to the conclu-sion and recommendation that “adults should sleep 7 or more hours per night on a regular basis to promote optimal health” [24]. Despite the apparent benefits of sufficient sleep for cognitive per-formance, safety, and health, and the recognition that sleep is as important for health as a balanced nutrition and regular exercise [25], representative surveys suggest that 35%–40% of the adult US population report to sleep less than 7 hr on weekday nights, whereas ca. 15% report to sleep less than 6 hr [26].
The high prevalence of habitual short sleep and its association with morbidity and mortality warrant the identification of risk factors for short sleep and interventions to increase sleep dur-ation in those with insufficient sleep. For example, AASM, SRS, and the Centers for Disease Control and Prevention (CDC) initi-ated the National Healthy Sleep Awareness Project in 2013, with the goal to improve public health by promoting adequate sleep [27]. The project website provides a wealth of information geared towards the general population related to sleep disorders and the importance of adequate sleep for health. At the same time, public interest in short sleep and its consequences has clearly increased over recent years, and the press is reporting on the topic on a regular basis. However, it is unclear whether campaigns like the National Healthy Sleep Awareness Project are effective in
lowering the prevalence of short sleep. It is therefore important to investigate secular trends in sleep duration. A further decrease in average sleep duration would warrant increased efforts to pro-mote adequate sleep that go beyond current campaigns.
Although there is some evidence that sleep duration has declined in adolescents over recent years, the findings for adult sleep duration are less conclusive and vary internationally, with both decreases and increases in sleep duration [28–31]. For the United States, Knutson et al. investigated trends in the preva-lence of short sleep between 1975 and 2006 and concluded that the increase in the odds of short sleep (defined as <6 hr) over the investigated period was significant among full-time work-ers only [32]. Bin and colleagues compared US time use surveys from the years 1985, 1992, 1994, and 2003–2007. They found a decline in short sleep duration (≤6 hr) and an increase in long sleep duration (>9 hr) from surveys collected before 2000 to sur-veys collected after 2000, but no notable trend between 2003 and 2007 [29]. Similar findings were reported by Luckhaupt et al. for National Health Interview Survey data collected in 1985 or 1990 or between 2004 and 2007 [33]. Finally, Youngstedt and col-leagues investigated secular trends in sleep duration in stud-ies objectively (actigraphy or polysomnography) assessing sleep time that were conducted between 1968 and 2013 [34]. Their analyses showed no significant association of sleep duration with study year. In conclusion, a systematic investigation of secular trends in sleep duration in the United States including data from the more recent past is missing but urgently needed.
The American Time Use Survey (ATUS) is representative for Americans 15 and older and has been performed annually by the Bureau of Labor Statistics (BLS) since 2003. ATUS respond-ents report their activities (including sleeping) on a minute-by-minute basis during a 24 hr period. The goal of this analysis was to investigate secular trends in sleep duration over the period 2003–2016 using ATUS data (N = 181 335 respondents). This extends previous ATUS analyses by Knutson et al. (2003–2006) and Bin et al. (2003–2007). The unique structure of ATUS allowed us to also investigate secular trends in waking activities, with the objective to explain any secular trend in sleep duration.
MethodsATUS is a federally administered, continuous survey on time use in the United States sponsored by the BLS and conducted by the U.S. Census Bureau. ATUS covers all residents living in US households who are at least 15 years of age, with the exception of active military personnel and people residing in institutions such as nursing homes and prisons. The major purpose of ATUS is to develop nationally representative estimates of how peo-ple spend their time. It involves a 15–20 min computer-assisted telephone interview in which people are asked about how they spent their time, with a 1 min resolution, between 04:00 am on the previous day and 04:00 am on the interview day (e.g. Sunday covers the period from Sunday morning 04:00 am until Monday morning 04:00 am), as well as where they were, and whom they were with during this time. Details on ATUS survey history, sur-vey design, data collection procedures, coding, imputation, and weighting can be found in the ATUS User’s Guide [35]. The analy-ses presented in this article are based on 181 355 respondents from the survey years 2003–2016. The number of respondents and survey response rates are listed in Table 1.
2 | SLEEPJ, 2018, Vol. 41, No. 4D
ownloaded from
https://academic.oup.com
/sleep/article/41/4/zsy012/4792945 by guest on 27 August 2022
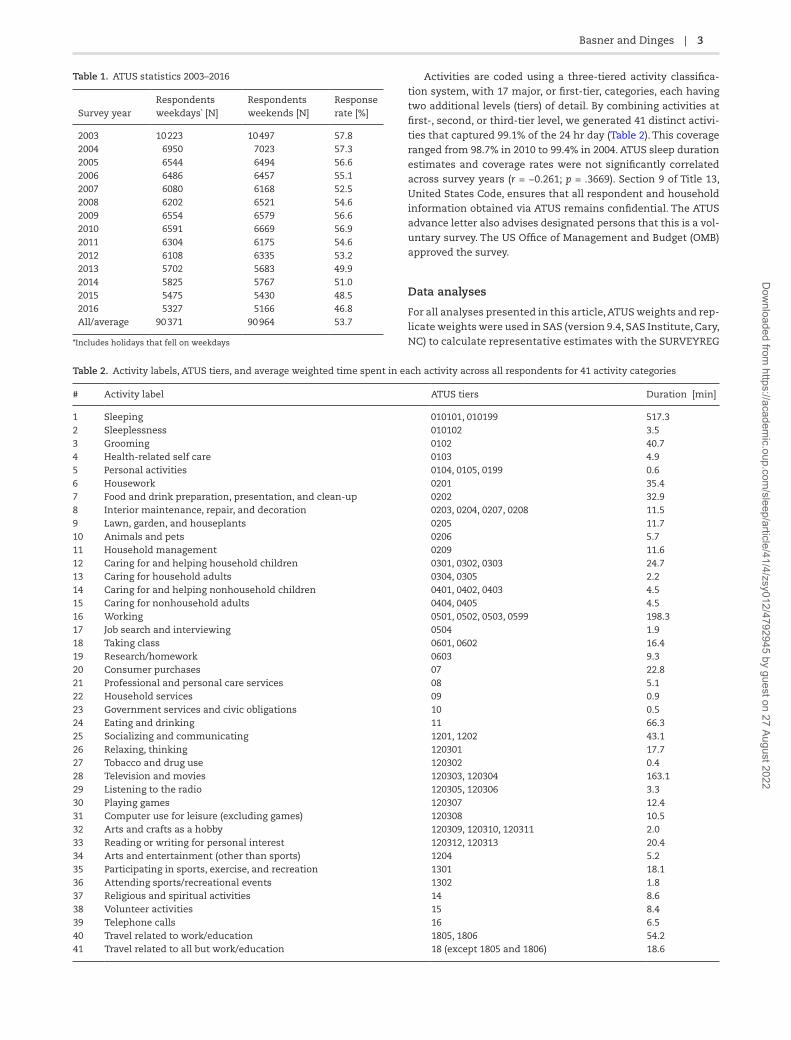
Activities are coded using a three-tiered activity classifica-tion system, with 17 major, or first-tier, categories, each having two additional levels (tiers) of detail. By combining activities at first-, second, or third-tier level, we generated 41 distinct activi-ties that captured 99.1% of the 24 hr day (Table 2). This coverage ranged from 98.7% in 2010 to 99.4% in 2004. ATUS sleep duration estimates and coverage rates were not significantly correlated across survey years (r = −0.261; p = .3669). Section 9 of Title 13, United States Code, ensures that all respondent and household information obtained via ATUS remains confidential. The ATUS advance letter also advises designated persons that this is a vol-untary survey. The US Office of Management and Budget (OMB) approved the survey.
Data analyses
For all analyses presented in this article, ATUS weights and rep-licate weights were used in SAS (version 9.4, SAS Institute, Cary, NC) to calculate representative estimates with the SURVEYREG
Table 1. ATUS statistics 2003–2016
Survey yearRespondents weekdays* [N]
Respondents weekends [N]
Response rate [%]
2003 10 223 10 497 57.82004 6950 7023 57.32005 6544 6494 56.62006 6486 6457 55.12007 6080 6168 52.52008 6202 6521 54.62009 6554 6579 56.62010 6591 6669 56.92011 6304 6175 54.62012 6108 6335 53.22013 5702 5683 49.92014 5825 5767 51.02015 5475 5430 48.52016 5327 5166 46.8All/average 90 371 90 964 53.7
*Includes holidays that fell on weekdays
Table 2. Activity labels, ATUS tiers, and average weighted time spent in each activity across all respondents for 41 activity categories
# Activity label ATUS tiers Duration [min]
1 Sleeping 010101, 010199 517.32 Sleeplessness 010102 3.53 Grooming 0102 40.74 Health-related self care 0103 4.95 Personal activities 0104, 0105, 0199 0.66 Housework 0201 35.47 Food and drink preparation, presentation, and clean-up 0202 32.98 Interior maintenance, repair, and decoration 0203, 0204, 0207, 0208 11.59 Lawn, garden, and houseplants 0205 11.710 Animals and pets 0206 5.711 Household management 0209 11.612 Caring for and helping household children 0301, 0302, 0303 24.713 Caring for household adults 0304, 0305 2.214 Caring for and helping nonhousehold children 0401, 0402, 0403 4.515 Caring for nonhousehold adults 0404, 0405 4.516 Working 0501, 0502, 0503, 0599 198.317 Job search and interviewing 0504 1.918 Taking class 0601, 0602 16.419 Research/homework 0603 9.320 Consumer purchases 07 22.821 Professional and personal care services 08 5.122 Household services 09 0.923 Government services and civic obligations 10 0.524 Eating and drinking 11 66.325 Socializing and communicating 1201, 1202 43.126 Relaxing, thinking 120301 17.727 Tobacco and drug use 120302 0.428 Television and movies 120303, 120304 163.129 Listening to the radio 120305, 120306 3.330 Playing games 120307 12.431 Computer use for leisure (excluding games) 120308 10.532 Arts and crafts as a hobby 120309, 120310, 120311 2.033 Reading or writing for personal interest 120312, 120313 20.434 Arts and entertainment (other than sports) 1204 5.235 Participating in sports, exercise, and recreation 1301 18.136 Attending sports/recreational events 1302 1.837 Religious and spiritual activities 14 8.638 Volunteer activities 15 8.439 Telephone calls 16 6.540 Travel related to work/education 1805, 1806 54.241 Travel related to all but work/education 18 (except 1805 and 1806) 18.6
Basner and Dinges | 3D
ownloaded from
https://academic.oup.com
/sleep/article/41/4/zsy012/4792945 by guest on 27 August 2022

procedure using the Balanced Repeated Replication method with a Fay coefficient of 0.5 to reflect the factor of 4 in the ATUS variance formula (see ATUS User’s Guide [35]). Survey year (the main variable of interest) was entered either as a categorical or continuous variable (to reflect linear secular trends). To investigate whether changes in sleep duration across survey years can be observed in short (≤7 hr), normal (>7–9 hr), and long (>9 hr) sleepers, we calculated the percent-age of respondents falling in these categories across survey years. We also calculated the percentage of respondents fall-ing in the following 1 hr sleep duration bins across survey years: ≤5, >5–6, >6–7, >7–8, >8–9, >9–10, >10–11, and >11 hr. To investigate whether trends observed in all respondents could also be observed separately in employed respondents, full-time high school students, full-time college or university stu-dents, retirees, unemployed respondents, and those not in the labor force, the analyses were repeated restricting the data to these classes of respondents.
For the other categories that were used for model adjust-ment (age, sex, race/ethnicity, marital status, presence of spouse or unmarried partner, number of household children, educa-tional attainment, income, multiple job status, region, day of the week, and season; see below), we introduced interaction terms between each level of a given category (reference coding) and survey year (continuous variable) while adjusting for all other categories to investigate differences in secular trends in sleep duration between the levels of each category. We ran separate models for each category and for weekdays and weekends/holidays.
The following in-depth analyses were restricted to those respondent groups that showed a significant increase in sleep duration across survey years either on weekdays or weekends (or both): employed respondents, full-time students, and retir-ees. Average duration spent in each of the 40 waking activities was calculated for each of the 14 survey years and correlated with sleep duration estimates across the same 14 years. Pearson correlation coefficients were calculated using Fisher’s z-trans-formation. p-Values were adjusted for bias.
We used ATUS activity files to investigate secular trends in the time respondents went to bed in the evening or got up in the morning. Only respondents going to bed on or after 06:00 pm and before 04:00 am were included in the “time to bed” analysis. Only respondents who were asleep at 04:00 am were included in the “time out of bed” analysis. In an effort to capture brief dis-ruptions of sleep (e.g. for voids), we determined the time of last wake up for sleep periods initiated before noon.
To investigate the percentage of respondents who read for personal interest or watched TV or movies before bed, and the duration of reading or watching in those who participated, we determined the first sleep period on or after 06:00 pm and investigated whether respondents read for personal interest or watched TV/movies immediately before sleep or two activities before sleep. Many participants visit the bathroom one more time before retiring, so we felt that we needed to include not only the last but second to last activity in this analysis. The reading category also includes the activity “writing for personal interest” (Table 2), which, however, accounted for less than 2% of the total time spent in reading or writing. We thus refer to “read-ing for personal interest” going forward only.
All statistical models were adjusted for age, sex, race/ethnicity, educational attainment, marital status, presence
of spouse or partner, number of household children, family income, employment category, multiple job status, survey region, survey day, and season. All confounders were entered as categorical variables to allow for nonlinear effects. We used effect coding for all variables so that each parameter estimate reflected the deviation from the mean of all categories, and the intercept reflected the overall mean. We repeated each analysis with different reference categories to obtain esti-mates for all categories. Models on employed respondents were restricted to those ≤65 years. Models on high school stu-dents were restricted to the age range 15–20 years and not adjusted for educational attainment, marital status, employ-ment category, and multiple job status. Models on college and university students were not adjusted for educational attainment, employment category, and multiple job status. Models on retired respondents were restricted to the age range ≥65 years and not adjusted for employment category and multiple job status.
We used Google Trends to obtain monthly estimates for Google searches on the word “sleep” for the United States in the period 2004–2017 (data before 2004 were not available). Google divides each data point by the total number of searches of the geography and time range it represents. The resulting num-bers are then scaled on a range of 0 to 100 based on a topic’s proportion to all searches on all topics. Finally, we used Web of Science to search for original research publications with the terms “sleep duration” or “sleep time” or “short sleep” or “long sleep” in the title for the time frame 2003 to 2016. For each year from 2003 to 2016, Google searches, research publications, and ATUS sleep duration estimates were averaged. Google searches and research publications were then correlated with ATUS sleep duration estimates (Pearson’s r). The rationale for this analysis was to investigate whether public and professional interest in the topic “sleep” was associated with increases in sleep time.
Results
Associations of sociodemographic characteristics and sleep duration
Table 3 shows the effects of survey year (linear trend) and several sociodemographic characteristics on ATUS sleep dura-tion estimates for all respondents separately for weekdays and weekends/holidays. Sleep duration was longest in the 18–24 year age bracket, decreased with increasing age, and was shortest in the 45–54 year age bracket on weekdays and in the 55–64 year age bracket on weekends. Men slept shorter than women. Compared with the mean across categories, sleep duration was longer in Hispanics, Asians, and Black respondents and shorter in white respondents and those clas-sified as “other race/ethnicity.” Widowed respondents slept significantly shorter and respondents never married slept sig-nificantly longer compared with the mean across marital cat-egories. Sleep duration was shorter if a spouse or unmarried partner was present. It decreased with an increasing number of household children. Sleep duration also decreased mono-tonically with increasing educational attainment. A similar trend was found for family income, with shorter sleep in the higher income categories. Students and employed respondents slept shorter (high school students on weekdays only) while retirees, unemployed respondents, and those not in the labor
4 | SLEEPJ, 2018, Vol. 41, No. 4D
ownloaded from
https://academic.oup.com
/sleep/article/41/4/zsy012/4792945 by guest on 27 August 2022

procedure using the Balanced Repeated Replication method with a Fay coefficient of 0.5 to reflect the factor of 4 in the ATUS variance formula (see ATUS User’s Guide [35]). Survey year (the main variable of interest) was entered either as a categorical or continuous variable (to reflect linear secular trends). To investigate whether changes in sleep duration across survey years can be observed in short (≤7 hr), normal (>7–9 hr), and long (>9 hr) sleepers, we calculated the percent-age of respondents falling in these categories across survey years. We also calculated the percentage of respondents fall-ing in the following 1 hr sleep duration bins across survey years: ≤5, >5–6, >6–7, >7–8, >8–9, >9–10, >10–11, and >11 hr. To investigate whether trends observed in all respondents could also be observed separately in employed respondents, full-time high school students, full-time college or university stu-dents, retirees, unemployed respondents, and those not in the labor force, the analyses were repeated restricting the data to these classes of respondents.
For the other categories that were used for model adjust-ment (age, sex, race/ethnicity, marital status, presence of spouse or unmarried partner, number of household children, educa-tional attainment, income, multiple job status, region, day of the week, and season; see below), we introduced interaction terms between each level of a given category (reference coding) and survey year (continuous variable) while adjusting for all other categories to investigate differences in secular trends in sleep duration between the levels of each category. We ran separate models for each category and for weekdays and weekends/holidays.
The following in-depth analyses were restricted to those respondent groups that showed a significant increase in sleep duration across survey years either on weekdays or weekends (or both): employed respondents, full-time students, and retir-ees. Average duration spent in each of the 40 waking activities was calculated for each of the 14 survey years and correlated with sleep duration estimates across the same 14 years. Pearson correlation coefficients were calculated using Fisher’s z-trans-formation. p-Values were adjusted for bias.
We used ATUS activity files to investigate secular trends in the time respondents went to bed in the evening or got up in the morning. Only respondents going to bed on or after 06:00 pm and before 04:00 am were included in the “time to bed” analysis. Only respondents who were asleep at 04:00 am were included in the “time out of bed” analysis. In an effort to capture brief dis-ruptions of sleep (e.g. for voids), we determined the time of last wake up for sleep periods initiated before noon.
To investigate the percentage of respondents who read for personal interest or watched TV or movies before bed, and the duration of reading or watching in those who participated, we determined the first sleep period on or after 06:00 pm and investigated whether respondents read for personal interest or watched TV/movies immediately before sleep or two activities before sleep. Many participants visit the bathroom one more time before retiring, so we felt that we needed to include not only the last but second to last activity in this analysis. The reading category also includes the activity “writing for personal interest” (Table 2), which, however, accounted for less than 2% of the total time spent in reading or writing. We thus refer to “read-ing for personal interest” going forward only.
All statistical models were adjusted for age, sex, race/ethnicity, educational attainment, marital status, presence
Table 3. Effects of survey year (continuous variable) and several sociodemographic characteristics on ATUS sleep duration estimates
Weekdays Weekends/Holidays
VariableSubjects [N] (weighted %)
Sleep duration minutes (95% CI)
Subjects [N] (weighted %)
Sleep duration minutes (95% CI)
Survey yearLinear trend [per year] 1.4 (1.1; 1.7) 0.8 (0.6; 1.1)Age [years]
15–24 9368 (17.4%) 35.7 (31.1; 40.3) 10 051 (17.4%) 29.7 (24.7; 34.6)25–34 14 132 (16.9%) 2.6 (−0.2; 5.3) 15 327 (16.9%) 13.5 (10.4; 16.5)35–44 18 241 (17.0%) −5.8 (−8.4; −3.2) 19 086 (17.0%) 5.1 (2.3; 7.9)45–54 16 397 (17.8%) −15.9 (−18.3; −13.6) 17 012 (17.8%) −6.9 (−9.6; −4.1)55–64 13 630 (14.5%) −15.2 (−17.6; −12.9) 13 821 (14.5%) −19.7 (−22.3; −17.1)65–74 9521 (9.1%) −7.7 (−11.0; −4.3) 9581 (9.0%) −17.3 (−20.8; −13.8)≥75 7510 (8.7%) 6.3 (2.2; 10.4) 7658 (8.7%) −4.5 (−9.3; 0.4)
SexMen 38 901 (48.4%) −1.9 (−2.9; −0.8) 40 436 (48.4%) −1.7 (−2.8; −0.5)Women 49 898 (51.6%) 1.9 (0.8; 2.9) 52 100 (51.6%) 1.7 (0.5; 2.8)
Race/ethnicityWhite 60 949 (68.6%) −6.5 (−9.2; −3.8) 62 739 (68.4%) −7.5 (−10.2; −4.8)Black 11 823 (11.6%) 4.7 (1.5; 7.9) 12 259 (11.7%) −0.1 (−4.4; 4.2)Hispanic 11 587 (14.4%) 1.2 (−2.4; 4.9) 12 843 (14.2%) 8.6 (5.1; 12.1)Asian 2819 (3.6%) 6.6 (1.6; 11.6) 2984 (3.8%) 9.2 (4.0; 14.3)Other 1621 (1.9%) −6.0 (−13.9; 1.9) 1711 (1.9%) −10.1 (−17.0; −3.2)
Marital statusMarried 45 082 (53.3%) 3.0 (−0.9; 6.8) 46 608 (53.1%) −0.5 (−4.4; 3.4)Divorced/separated 14 389 (11.1%) 0.3 (−2.4; 3.0) 15 224 (11.5%) 0.7 (−2.0; 3.4)Widowed 7921 (5.7%) −9.1 (−12.9; −5.3) 8106 (5.6%) −4.0 (−8.1; 0.0)Never married 21 407 (29.9%) 5.9 (3.3; 8.4) 22 598 (29.8%) 3.8 (1.0; 6.7)
Presence of spouse or unmarried partnerSpouse or unmarried partner present 47 380 (57.3%) −4.1 (−6.7; −1.5) 48 980 (57%) −3.3 (−5.9; −0.7)No spouse or unmarried partner present 41 419 (42.7%) 4.1 (1.5; 6.7) 43 556 (43%) 3.3 (0.7; 5.9)
Presence of household childrenNo child 48 441 (59.3%) 7.1 (5.3; 8.9) 49 653 (59.3%) 7.5 (5.1; 9.9)One child 16 648 (16.9%) 5.3 (3.2; 7.4) 17 571 (16.8%) 4.2 (1.8; 6.5)Two children 15 266 (14.7%) −0.6 (−2.6; 1.5) 16 419 (14.9%) −3.3 (−5.8; −0.9)Three or more children 8444 (9.2%) −11.9 (−14.5; −9.3) 8893 (9.0%) −8.3 (−10.8; −5.9)
EducationLess than high school 13 745 (17.7%) 21.5 (18.5; 24.4) 14 860 (18%) 20.1 (17.1; 23.0)High school graduate 39 192 (46.6%) −2.1 (−3.7; −0.4) 40 528 (46.3%) −1.4 (−3.3; 0.4)College graduate 25 526 (25.9%) −9.6 (−11.3; −8.0) 26 452 (25.7%) −6.3 (−8.3; −4.4)Master’s degree or higher 10 336 (9.8%) −9.8 (−12.3; −7.3) 10 696 (10.0%) −12.3 (−14.9; −9.8)
Family Income<$25 000 18 663 (18.2%) 14.6 (11.8; 17.3) 19 691 (18.1%) 7.6 (4.7; 10.4)$25 000 < $50 000 20 220 (22.2%) 3.9 (1.7; 6.1) 21 387 (22.6%) 2.3 (0.0; 4.6)$50 000 < $75 000 14 386 (16.6%) −1.9 (−4.2; 0.4) 14 757 (16.6%) 0.9 (−1.8; 3.6)$75 000 < $100 000 10 294 (11.7%) −1.5 (−4.0; 1.1) 10 803 (11.6%) −2.3 (−4.9; 0.3)$100 000 < $150 000 7130 (9.2%) −9.5 (−12.3; −6.7) 7363 (9.1%) −4.3 (−7.5; −1.2)≥ $150 000 4927 (6.5%) −7.6 (−10.9; −4.2) 5336 (6.8%) −7.4 (−11.2; −3.6)No family income information available 13 179 (15.7%) 2.0 (−0.3; 4.3) 13 199 (15.3%) 3.2 (0.4; 6.0)
EmploymentFull-time high school student 3495 (5.3%) −40.8 (−48.1; −33.5) 3728 (5.2%) 26.1 (18.7; 33.6)Full-time college or university student 2949 (4.9%) −24.9 (−31.5; −18.2) 3110 (5.0%) −12.3 (−18.8; −5.8)Retired 15 071 (14.7%) 22.3 (18.8; 25.9) 15 327 (14.8%) −9.4 (−13.4; −5.5)Unemployed 3243 (4.1%) 28.0 (22.6; 33.4) 3437 (4.2%) 1.6 (−5.0; 8.3)Not in labor force 11 548 (12.4%) 38.7 (35.2; 42.2) 12 273 (12.7%) 15.4 (12.0; 18.8)Absent from work 1910 (2.0%) 35.3 (28.8; 41.7) 2580 (2.6%) 1.7 (−4.6; 7.9)Private sector employee 36 284 (41.7%) −23.8 (−26.2; −21.5) 37 656 (41.1%) −6.0 (−8.3; −3.6)Government employee 8335 (8.5%) −24.4 (−27.4; −21.4) 8623 (8.4%) −3.1 (−6.8; 0.7)Self-employed* 5964 (6.5%) −10.5 (−14.1; −6.8) 5802 (6%) −14.1 (−18.2; −10.0)
Multiple job statusNot working on multiple jobs 83 557 (94.0%) 12.1 (9.8; 14.5) 87 045 (94.1%) 15.4 (12.8; 18.0)Working on multiple jobs 5242 (6.0%) −12.1 (−14.5; −9.8) 5491 (5.9%) −15.4 (−18.0; −12.8)
Basner and Dinges | 5D
ownloaded from
https://academic.oup.com
/sleep/article/41/4/zsy012/4792945 by guest on 27 August 2022

force or absent from work slept longer compared with mean sleep duration across categories. Those working multiple jobs obtained on average 24.2 min less sleep on weekdays and 30.8 min less sleep on weekends than those not working multiple jobs. Sleep duration was significantly longer in the West cen-sus region on workdays only. Sleep duration showed a decreas-ing trend across weekdays. It was 20.6 min longer on Mondays compared with Fridays. It was 35.9 min shorter on Saturdays compared with Sundays. Sleep duration was longest during the winter months and shortest during the summer months.
Secular trends in sleep duration
Figure 1 shows trends in sleep duration across survey years for all respondents on weekdays and weekends/holidays. Sleep duration increased on average by 1.40 min per 24 hr per year on weekdays (linear trend; unadjusted model: 1.37 min, 95% CI 1.11–1.63 min, p < .0001) and by 0.83 min per 24 hr per year on weekends (unadjusted model: 0.71 min, 95% CI 0.46–0.97 min, p < .0001).
On workdays, the prevalence of short (≤7 hr), average (>7–9 hr), and long (>9 hr) sleep changed by −0.44% per year (p < .0001), −0.03% per year (p = .5515), and +0.48% per year (p < .0001), respec-tively. Figure 2 shows changes in the size of 8 sleep duration cat-egories across survey years for all respondents on weekdays. The percentage of respondents in the short sleep duration categories ≤5, >5–6, and >6–7 hr decreased significantly across survey years, whereas the percentage of respondents in the long sleep dura-tion categories >9–10, >10–11, and >11 hr increased significantly across survey years. The percentage of respondents in the >7-8 and >8-9 hr sleep duration categories did not vary systematically across survey years. The change was most pronounced in the >6–7 hr category (−0.23% per year) and in the >9–10 hr category (+0.24% per year), i.e. those categories adjacent to what would be considered average or normal sleep duration (>7–9 hr).
These analyses were repeated for weekends and for the sub-populations employed respondents, full-time high school students,
full-time college or university students, retirees, unemployed respondents, and those not in the labor force (Table 4). Statistically significant increasing trends in sleep duration on both weekdays and weekends/holidays were found for employed respondents and retirees only. College or university students showed a statistically significant trend on weekdays only, with the largest linear increase in sleep duration among all subgroups (+3.08 min per year). High school students showed a statistically significant trend on week-ends only. In contrast, unemployed respondents and those not in the labor force did not show a statistically significant trend in sleep duration across survey years. The latter two groups were thus excluded from all further in-depth analyses.
Figure 3 shows differences in secular trends in sleep duration between the levels of several sociodemographic variables. On weekdays, significantly lower increases in sleep duration were observed for 65- to 74-year-old respondents (compared with 15- to 24-year-old respondents; p = .0462) and Hispanic respond-ents (compared with white respondents; p = .0493). Significantly higher increases in sleep duration were observed for the income categories $75K–$100K and for respondents with no income data available (compared with <$25K; p = .0411 and p = .0225, respec-tively), for Fridays (compared with Mondays; p = .0373), and for spring (compared with winter; p = .0095). On weekends, the only significant difference was observed for black respondents who showed a decrease in sleep duration across survey years (com-pared with white respondents; p = .0040).
Figure 4 shows the magnitude of linear trends in the change of activity duration across survey years for 40 waking activities and sleeping on weekdays and weekends/holidays. On week-days, the greatest absolute linear change in activity duration by far was observed for sleeping (+1.46 min/year), followed by watching television and movies (+0.57 min/year). Activities with the largest negative linear trends in activity duration across survey years included working (−0.62 min/year), read-ing for personal interest (−0.43 min/year), traveling unrelated to work or education (−0.40 min/year), eating and drinking (−0.39 min/year), and household management (−0.25 min/year). On weekends/holidays, the greatest absolute linear change in
Weekdays Weekends/Holidays
VariableSubjects [N] (weighted %)
Sleep duration minutes (95% CI)
Subjects [N] (weighted %)
Sleep duration minutes (95% CI)
Census regionSouth 32 433 (36.3%) 0.1 (−1.5; 1.6) 33 245 (35.5%) 1.7 (−0.1; 3.4)West 19 113 (21.9%) 4.2 (2.5; 6.0) 20 161 (22.1%) 0.6 (−1.3; 2.4)Midwest 21 667 (23.9%) −1.5 (−3.2; 0.3) 22 782 (24.3%) 0.0 (−1.8; 1.8)Northeast 15 586 (18.0%) −2.8 (−4.7; −1.0) 16 348 (18.1%) −2.2 (−4.5; 0.1)
Day of the weekMonday/Saturday 17 555 (19.4%) 6.4 (4.2; 8.7) 44 289 (47.6%) −21.3 (−23.5; −19.0)Tuesday/Sunday 18 049 (20.3%) 1.5 (−0.5; 3.5) 45 272 (46.8%) 14.6 (12.4; 16.7)Wednesday/Holiday 18 081 (20.3%) 3.1 (1.1; 5.2) 2975 (5.6%) 6.7 (2.9; 10.5)Thursday 17 456 (20.0%) −0.8 (−2.8; 1.1)Friday 17 658 (20.0%) −10.2 (−12.5; −8.0)
SeasonWinter (Jan–Mar) 24 028 (24.8%) 1.9 (0.3; 3.5) 24 857 (24.3%) 6.5 (4.6; 8.3)Spring (Apr–Jun) 21 843 (24.9%) −0.9 (−2.5; 0.7) 22 608 (24.8%) −2.2 (−4.3; −0.2)Summer (Jul–Sep) 21 465 (25.0%) −0.9 (−2.6; 0.8) 22 889 (25.7%) −5.7 (−7.6; −3.8)Fall (Oct–Dec) 21 463 (25.3%) −0.1 (−1.8; 1.6) 22 182 (25.2%) 1.4 (−0.6; 3.4)
Effect coding was used within each category so that each parameter estimate reflects the deviation from the mean of all category levels.
*Includes those employed without pay.
6 | SLEEPJ, 2018, Vol. 41, No. 4D
ownloaded from
https://academic.oup.com
/sleep/article/41/4/zsy012/4792945 by guest on 27 August 2022

activity duration was observed for watching TV and movies (+1.41 min/year) immediately followed by sleeping (+0.88 min/year). Activities with the largest negative linear trends in activity duration across survey years included reading for
personal interest (−0.82 min/year), traveling unrelated to work or education (−0.60 min/year), socializing and communicating (−0.47 min/year), consumer purchases (−0.43 min/year), and eating and drinking (−0.34 min/year).
7.9
8.0
8.1
8.2
8.3
8.4
8.5 Mean95% CIOverall
8.8
8.9
9.0
9.1
9.2
9.3
9.4MeanCI lowCI HighOverall
+1.40 min/year (p<0.0001)
Weekdays
+0.83 min/year (p<0.0001)
Weekends/Holidays]sruoh[
noitaruD
peelS Slee
p D
ura�
on [h
ours
]Figure 1. Changes in ATUS sleep duration estimates of all respondents on weekdays and weekends/holidays over the period 2003–2016. The panels show average
sleep duration (black line), 95% confidence intervals (dashed lines), and overall average sleep duration across years (gray line) for weekdays (N = 88 799 respondents,
left panel) and weekends/holidays (N = 92 536 respondents, right panel) based on fully adjusted models (Table 3). Linear trends across survey years are reported in the
lower right of each panel.
5%
6%
7%
8%
9%
10%
01>egatnecreP-
peelSsruoH11
10%
11%
12%
13%
14%
15%
16%
9>egatnecreP-
peelSsruoH01
17%
18%
19%
20%
21%
22%
23%
8>egatnecreP-
peelSsruoH9
18%
19%
20%
21%
22%
23%
24%7>egatnecreP-
peelSsruoH8
6%
7%
8%
9%
10%
11%
12%
peelSsruoH11>egatnecreP
12%
13%
14%
15%
16%
17%
18%
6>egatnecreP-
peelSsruoH7
5%
6%
7%
8%
9%
10%
11%
5>egatnecreP-
peelSsruoH6
4%
5%
6%
7%
8%
9%
10%
peelSsruoH5≤egatnecreP
MeanCI lowCI HighOverall
-0.12%/year (p<0.0001)-0.10%/year (p<0.0001) -0.23%/year (p<0.0001) -0.09%/year (p=0.0504)
+0.06%/year (p=0.1642)
≤ 5 hours >5-6 hours >6-7 hours >7-8 hours
>8-9 hours >9-10 hours
+0.24%/year (p<0.0001)
>10-11 hours
+0.11%/year (p<0.0001)
>11 hours
+0.12%/year (p<0.0001)
Figure 2. Changes in percentage of all respondents falling into 8 weekday sleep duration categories over the period 2003–2016. The panels show the percentage of
respondents in a given sleep duration category (black line), 95% confidence intervals (dashed lines), and overall average percent within a given category across years
(gray line) for all respondents on weekdays (N = 88 799). Linear trends across survey years are reported in the lower left of each panel. Significant linear trends were
observed for all sleep duration categories except for the >7–8 hr and >8–9 hr categories. Sleep duration categories ≤7 hr showed significant negative linear trends,
whereas sleep duration categories >9 hr showed significant positive linear trends. Data for population subgroups and weekends/holidays can be found in Table 4.
Basner and Dinges | 7D
ownloaded from
https://academic.oup.com
/sleep/article/41/4/zsy012/4792945 by guest on 27 August 2022

Figure 5 shows correlations between changes in sleep duration and changes in the duration of 40 waking activities across survey years. On weekdays, the most prominent negative correlations were found for travel unrelated to work/education (r = −0.843, p < .0001), household management (r = −0.843, p < .0001), eat-ing and drinking (r = −0.837, p = .0001), housework (r = −0.827, p = .0001), and consumer purchases (r = −0.815, p = .0002). On weekends/holidays, the most prominent negative correla-tions were found for reading for personal interest (r = −0.763, p = .0009), arts and entertainment (r = −0.728, p = .0022), caring for and helping nonhousehold children (r = −0.723, p = .0025), caring for nonhousehold adults (r = −0.678, p = .0062), and social-izing and communicating (r = −0.668, p = .0074).
On weekdays, “time to bed” shifted significantly to earlier bed times by 1.1 min/year across survey years, whereas “time out of bed” shifted significantly to later wake up times by 0.4 min/year (Figure 6). Thus, the change in sleep duration across survey years on weekdays can mostly be explained by respondents going to bed earlier at night, and to a lesser degree by getting up later in the morning (relationship approximately 2:1). On weekends/hol-idays, “time to bed” shifted significantly to earlier bed times by
1.1 min/year across survey years, which was comparable to the shift observed on weekdays, whereas “time out of bed” showed no significant linear trend across survey years.
The percentage of respondents who read for personal inter-est before bed decreased significantly by 0.24% per year across survey years on weekdays and by 0.20% per year on weekends/holidays, respectively (Figure 7). In those respondents who did read, the duration of reading increased significantly on weekday nights (+0.57 min/year, p = .0047), but not on week-end/holiday nights (+0.08 min/year, p = .6979). Similarly, the percentage of respondents who watched TV or movies before bed decreased significantly by 0.22% per year across survey years on weekdays and by 0.11% per year on weekends/holi-days, respectively. In those respondents who watched TV or movies, the duration of watching did not increase on weekday nights (+0.23 min/year, p = .0702), but it did increase signifi-cantly on weekend/holiday nights (+0.45 min/year, p = .0022). In employed respondents, work duration decreased nonsignificantly by 0.39 min/year across survey years (p = .1913). It was lowest during the economic crisis year 2010, but recovered thereafter (data not shown).
Table 4. Linear trends in sleep duration and for the relative frequency of respondents in eight sleep duration categories across survey years 2003–16 for all respondents and several population subgroups on weekdays and weekends/holidays.
Sleep dura-tion change [min/yr]
≤5 hr [%/yr]
>5–6 hr [%/yr]
>6–7 hr [%/yr]
>7–8 hr [%/yr]
>8–9 hr [%/yr]
>9–10 hr [%/yr]
>10–11 hr [%/yr]
>11 hr [%/yr]
WeekdaysAll 1.40 (0.13)*
p < .0001−0.10 (0.02)
p < .0001−0.12 (0.03)
p < .0001−0.23 (0.03)
p < .0001−0.09 (0.05)
p = .05040.06 (0.04)
p = .16420.24 (0.03)
p < .00010.11 (0.03)
p < .00010.12 (0.03)
p < .0001Employed 1.48 (0.15)
p < .0001−0.14 (0.03)
p < .0001−0.16 (0.04)
p = .0001−0.24 (0.05)
p < .0001−0.01 (0.07)
p = .83610.14 (0.06)
p = .01880.20 (0.04)
p < .00010.11 (0.03)
p = .00090.10 (0.03)
p = .0026FT HS student 1.07 (0.61)
p = .0817−0.11 (0.09)
p = .21190.03 (0.10)
p = .7857−0.23 (0.14)
p = .1035−0.26 (0.17)
p = .13170.07 (0.21)
p = .75070.62 (0.18)
p = .0010−0.13 (0.12)
p = .29210.02 (0.15)
p = .8700FT Coll./Univ. student
3.08 (0.84) p = .0003
−0.23 (0.15) p = .1400
−0.31 (0.14) p = .0284
−0.34 (0.17) p = .0441
−0.06 (0.21) p = .7730
−0.13 (0.23) p = .5807
0.32 (0.22) p = .1404
0.36 (0.16) p = .0298
0.39 (0.19) p = .0480
Retired 0.93 (0.32) p = .0039
0.04 (0.04) p = .2875
-0.07 (0.05) p = .1615
-0.19 (0.08) p = .0131
-0.31 (0.10) p = .0021
0.09 (0.12) p = .4300
0.18 (0.10) p = .0648
0.17 (0.08) p = .0388
0.08 (0.08) p = .2801
Unemployed 0.34 (0.95) p = .7198
−0.06 (0.12) p = .6017
−0.01 (0.14) p = .9416
−0.02 (0.15) p = .8977
−0.06 (0.19) p = .7689
−0.26 (0.22) p = .2356
0.26 (0.23) p = .2723
0.34 (0.20) p = .0993
−0.19 (0.21) p = .3835
Not in labor force
−0.08 (0.97) p = .9338
0.08 (0.12) p = .5036
0.11 (0.09) p = .2175
0.03 (0.15) p = .8540
−0.17 (0.19) p = .3680
−0.21 (0.20) p = .2948
−0.28 (0.22) p = .1962
0.13 (0.20) p = .5290
0.32 (0.24) p = .1889
Weekends/HolidaysAll 0.83 (0.13)
p < .0001−0.03 (0.02)
p = .0493−0.03 (0.02)
p = .0462−0.10 (0.03)
p = .0002−0.07 (0.03)
p = .0234−0.02 (0.04)
p = .5472−0.05 (0.04)
p = .22820.11 (0.04)
p = .00280.20 (0.04)
p < .0001Employed 0.93 (0.19)
p < .0001−0.05 (0.02)
p = .0239−0.06 (0.03)
p = .0305−0.09 (0.04)
p = .0108−0.06 (0.05)
p = .2383−0.01 (0.05)
p = .8994−0.05 (0.05)
p = .40250.10 (0.05)
p = .06200.22 (0.05)
p < .0001FT HS student 2.04 (0.80)
p = .0118−0.04 (0.06)
p = .51180.01 (0.07)
p = .8768−0.15 (0.08)
p = .0558−0.22 (0.12)
p = .0595−0.06 (0.16)
p = .7102−0.24 (0.16)
p = .14420.07 (0.19)
p = .72800.62 (0.25)
p = .0149FT Coll./Univ. Student
0.52 (0.81) p = .5246
−0.17 (0.11) p = .1104
0.12 (0.10) p = .2420
−0.14 (0.12) p = .2518
−0.02 (0.17) p = .8890
0.35 (0.21) p = .0950
−0.32 (0.21) p = .1240
0.11 (0.21) p = .6098
0.07 (0.24) p = .7667
Retired 0.26 (0.29) p = .3857
0.02 (0.04) p = .7026
−0.05 (0.04) p = .1727
−0.02 (0.06) p = .7748
0.02 (0.10) p = .8672
−0.05 (0.11) p = .6532
−0.01 (0.10) p = .9141
0.07 (0.08) p = .3483
0.03 (0.08) p = .7339
Unemployed −0.08 (0.97) p = .9338
0.08 (0.12) p = .5036
0.11 (0.09) p = .2175
0.03 (0.15) p = .8540
−0.17 (0.19) p = .3680
−0.21 (0.20) p = .2948
−0.28 (0.22) p = .1962
0.13 (0.20) p = .5290
0.32 (0.24) p = .1889
Not in Labor Force
0.71 (0.43) p = .0993
0.00 (0.05) p = .9246
−0.02 (0.04) p = .6620
−0.18 (0.07) p = .0089
−0.10 (0.09) p = .2456
−0.01 (0.10) p = .9220
0.00 (0.10) p = .9875
0.17 (0.12) p = .1431
0.14 (0.13) p = .2761
*Values in parentheses reflect standard errors.
FT = full-time; HS = high school.
8 | SLEEPJ, 2018, Vol. 41, No. 4D
ownloaded from
https://academic.oup.com
/sleep/article/41/4/zsy012/4792945 by guest on 27 August 2022

Figure 8 illustrates that Google searches for the term “sleep,” original research publications with the terms “sleep duration” or “sleep time” or “short sleep” or “long sleep” in the title, and ATUS sleep time estimates increased in a similar
fashion over the period 2003–2016. ATUS sleep time esti-mates were highly correlated with both Google searches for the term “sleep” and original research publications on sleep duration.
0.0
0.5
1.0
1.5
2.0
2.5
3.0
3.5
4.0
4.5
15-2
4 (r
ef)
25-3
435
-44
45-5
455
-64
65-7
475
+
Mal
e (r
ef)
Fem
ale
Whi
te (r
ef)
Blac
kHi
span
icAs
ian
Oth
er
Mar
ried
(ref)
Divo
rced
/Sep
arat
edW
idow
edN
ever
mar
ried
Spou
se p
rese
nt (r
ef)
No
spou
se p
rese
nt
No
child
(ref
)1
child
2 ch
ildre
n3+
chi
ldre
n
Less
than
hig
h sc
hool
(ref
)Hi
gh sc
hool
gra
duat
eCo
llege
gra
duat
eM
aste
r's d
egre
e or
hig
her
< $2
5,00
0 (re
f)$2
5,00
0 <
$50,
000
$50,
000
< $7
5,00
0$7
5,00
0 <
$100
,000
$100
,000
< $
150,
000
≥ $1
50,0
00N
o Da
ta
No
Mul
�ple
Jobs
(ref
)M
ul�p
le Jo
bs
Sout
h (re
f)W
est
Mid
wes
tN
orth
east
Mon
day
(ref
)Tu
esda
yW
edne
sday
Thur
sday
Frid
ay
Win
ter (
ref)
Sprin
gSu
mm
er Fall
]raeY rep setuniM[ egnahC noitaruD peelS
**
** * *
*
Weekdays
-2.0
-1.5
-1.0
-0.5
0.0
0.5
1.0
1.5
2.0
15-2
4 (r
ef)
25-3
435
-44
45-5
455
-64
65-7
475
+
Mal
e (r
ef)
Fem
ale
Whi
te (r
ef)
Blac
kHi
span
icAs
ian
Oth
er
Mar
ried
(ref)
Divo
rced
/Sep
arat
edW
idow
edN
ever
mar
ried
Spou
se p
rese
nt (r
ef)
No
spou
se p
rese
nt
No
child
(ref
)1
child
2 ch
ildre
n3+
chi
ldre
n
Less
than
hig
h sc
hool
(ref
)Hi
gh sc
hool
gra
duat
eCo
llege
gra
duat
eM
aste
r's d
egre
e or
hig
her
< $2
5,00
0 (re
f)$2
5,00
0 <
$50,
000
$50,
000
< $7
5,00
0$7
5,00
0 <
$100
,000
$100
,000
< $
150,
000
≥ $1
50,0
00N
o Da
ta
No
Mul
�ple
Jobs
(ref
)M
ul�p
le Jo
bs
Sout
h (re
f)W
est
Mid
wes
tN
orth
east
Satu
rday
(ref
)Su
nday
Holid
ay
Win
ter (
ref)
Sprin
gSu
mm
er Fall
]raeY rep setuniM[ egnahC noitaruD peelS
Weekends/Holidays
**
Figure 3. Differences in changes in ATUS sleep duration estimates over the period 2003–2016 for several sociodemographic characteristics. Analyses are based on all
respondents. Black dashed lines represent average linear increase in sleep duration across categories. Error bars reflect standard errors. *p < .05 and **p < .01 relative
to reference category (ref).
Basner and Dinges | 9D
ownloaded from
https://academic.oup.com
/sleep/article/41/4/zsy012/4792945 by guest on 27 August 2022

-1.0 -0.5 0.0 0.5 1.0 1.5 2.0
Reading for Personal Interest****Travel (all but work/educa�on)****
Socializing and Communica�ng***Consumer Purchases****
Ea�ng and Drinking****Interior Maintenance, Repair & Decora�on***
Caring for Non-Household Adults****Household Management****
Housework*Arts and Entertainment (other than Sports)***
Telephone Calls****Caring for & Helping Non-Household Children***
Listening to the Radio**Lawn, Garden, and Houseplants
Taking Class*Health-related Self Care
Religious and Spiritual Ac�vi�esA�ending Sports/Recrea�onal EventsProfessional & Personal Care Services
Household Services***Personal Ac�vi�es
Travel related to work/educa�onGrooming
Volunteer Ac�vi�esTobacco and Drug Use
Government Services & Civic Obliga�onsArts and Cra�s as a Hobby
Job Search and InterviewingCaring for Household Adults
Par�cipa�ng in Sports, Exercise, and Recrea�onRelaxing, ThinkingSleeplessness****
Caring for & Helping Household Children**Animals and Pets****
Computer Use for Leisure (excluding Games)***Research/Homework***
Food & Drink Prepara�on, Presenta�on, & Clean-up****Working
Playing Games****Sleeping****
Television and Movies****
Ac�vity Dura�on Change 2003 - 2016 [Minutes per Year]
-1.0 -0.5 0.0 0.5 1.0 1.5 2.0
Working**Reading for Personal Interest****
Travel (all but work/educa�on)****Ea�ng and Drinking****
Household Management****Interior Maintenance, Repair & Decora�on****
Socializing and Communica�ng**Consumer Purchases****
Housework**Relaxing, Thinking*
Telephone Calls****Volunteer Ac�vi�es**
Travel related to work/educa�on*Arts and Entertainment (other than Sports)***
Caring for Non-Household Adults***Professional & Personal Care Services*
A�ending Sports/Recrea�onal Events**Health-related Self Care
Lawn, Garden, and HouseplantsCaring for & Helping Non-Household Children
Caring for Household AdultsPar�cipa�ng in Sports, Exercise, and Recrea�on
Personal Ac�vi�esHousehold Services
Listening to the RadioTobacco and Drug Use
Taking ClassCaring for & Helping Household ChildrenGovernment Services & Civic Obliga�ons
Arts and Cra�s as a HobbyJob Search and Interviewing*
Sleeplessness***Grooming**
Animals and Pets****Religious and Spiritual Ac�vi�es****
Research/Homework**Playing Games****
Computer Use for Leisure (excluding Games)****Food & Drink Prepara�on, Presenta�on, & Clean-up****
Television and Movies***Sleeping****
Ac�vity Dura�on Change 2003 - 2016 [Minutes per Year]
Weekdays
Weekends/Holidays
Figure 4. Linear trends in activity duration change over the period 2003–2016 for 40 waking activities and sleep. Estimates (± standard errors) for linear trends in activ-
ity duration change across survey years are shown for employed respondents, students, and retirees on weekdays (N = 72 098, upper panel) and weekends/holidays
(N = 74 246, lower panel) in minutes per year. Sleeping was the activity with the highest and second-highest duration increase on weekdays and weekends/holidays,
respectively. Activities with the most extreme decrease consistently on weekdays and weekends/holidays were reading for personal interest and travel unrelated to
work or education. ****p < .0001; ***p < .001; **p < .01; *p < .05.
10 | SLEEPJ, 2018, Vol. 41, No. 4D
ownloaded from
https://academic.oup.com
/sleep/article/41/4/zsy012/4792945 by guest on 27 August 2022

-1.0 -0.8 -0.6 -0.4 -0.2 0.0 0.2 0.4 0.6 0.8 1.0
Travel (all but work/educa�on)****Household Management****
Ea�ng and Drinking***Housework***
Consumer Purchases***Reading for Personal Interest**
Telephone Calls**A�ending Sports/Recrea�onal Events*
Arts and Entertainment (other than Sports)*Interior Maintenance, Repair & Decora�on*
Working*Caring for Non-Household Adults
Professional & Personal Care ServicesVolunteer Ac�vi�es
Socializing and Communica�ngPersonal Ac�vi�es
Travel related to work/educa�onTobacco and Drug Use
Lawn, Garden, and HouseplantsCaring for Household Adults
Par�cipa�ng in Sports, Exercise, and Recrea�onRelaxing, Thinking
Caring for & Helping Non-Household ChildrenHousehold Services
Caring for & Helping Household ChildrenListening to the Radio
Taking ClassHealth-related Self Care
Arts and Cra�s as a HobbySleeplessness
Government Services & Civic Obliga�onsGrooming
Religious and Spiritual Ac�vi�es*Television and Movies*Research/Homework*
Job Search and Interviewing**Computer Use for Leisure (excluding Games)**
Playing Games**Animals and Pets**
Food & Drink Prepara�on, Presenta�on, & Clean-up****
Ac�vity Dura�on Change 2003 - 2016: Correla�on with Sleep Time Change [Pearson's r]
-1.0 -0.8 -0.6 -0.4 -0.2 0.0 0.2 0.4 0.6 0.8 1.0
Reading for Personal Interest***Arts and Entertainment (other than Sports)**
Caring for & Helping Non-Household Children**Caring for Non-Household Adults**
Socializing and Communica�ng**Consumer Purchases**
Household Management*Ea�ng and Drinking*
Telephone Calls*Travel (all but work/educa�on)*
Household Services*Interior Maintenance, Repair & Decora�on
HouseworkListening to the Radio
Religious and Spiritual Ac�vi�esVolunteer Ac�vi�es
Tobacco and Drug UseHealth-related Self Care
Lawn, Garden, and HouseplantsA�ending Sports/Recrea�onal Events
GroomingTravel related to work/educa�on
Professional & Personal Care ServicesTaking Class
Personal Ac�vi�esWorking
Par�cipa�ng in Sports, Exercise, and Recrea�onArts and Cra�s as a Hobby
Caring for Household AdultsRelaxing, Thinking
Government Services & Civic Obliga�onsJob Search and Interviewing
SleeplessnessComputer Use for Leisure (excluding Games)*
Food & Drink Prepara�on, Presenta�on, & Clean-up*Research/Homework*
Caring for & Helping Household Children**Television and Movies**
Playing Games**Animals and Pets***
Ac�vity Dura�on Change 2003 - 2016: Correla�on with Sleep Time Change [Pearson's r]
Weekdays
Weekends/Holidays
Figure 5. Correlation between changes in sleep duration and changes in 40 waking activities over the period 2003–2016. For each survey year in the period 2003–2016,
the average time spent in 40 waking activities and sleeping was calculated and then correlated (Pearson’s r) for employed respondents, students, and retirees on week-
days (N = 72 098, upper panel) and weekends/holidays (N = 74 246, lower panel). The highest negative correlations were observed for household management and travel
unrelated to work or education on weekdays and for reading for personal interest and attending arts and entertainment events on weekends/holidays. ****p < .0001;
***p < .001; **p < .01; *p < .05.
Basner and Dinges | 11D
ownloaded from
https://academic.oup.com
/sleep/article/41/4/zsy012/4792945 by guest on 27 August 2022

DiscussionBased on time use data representative for the noninstitution-alized population of the United States 15 years and older, this study investigated trends in sleep duration over the period from 2003 to 2016. In an analysis with all respondents, sleep duration increased significantly over this 14 year period on both week-days and weekends/holidays. This increase in sleep duration was
observed in both short sleepers (≤7 hr of sleep) and long sleepers (>9 hr of sleep), whereas the percentage of participants sleeping >7–9 hr showed no linear trend across survey years. Sleep dura-tion increased across survey years in employed respondents, retirees, full-time high school students (weekends/holidays only), and full-time college/university students (weekdays only). In contrast, no significant secular trend was found for unemployed
6:35
6:40
6:45
6:50
6:55
7:00
7:05
deBfotuoe
miT
22:25
22:30
22:35
22:40
22:45
22:50
22:55deB
ote
miT
-1.1 min/year (p<0.0001) +0.4 min/year (p=0.0049)
22:30
22:35
22:40
22:45
22:50
22:55
23:00
deBot
emiT
7:45
7:50
7:55
8:00
8:05
8:10
8:15
deBfotuoe
miT
Weekdays Weekdays
Weekends/Holidays Weekends/Holidays
-1.1 min/year (p<0.0001) -0.2 min/year (p=0.1974)
Figure 6. Changes in average clock time when respondents went to bed at night and got up in the morning over the period 2003–2016. The panels show the average
times (black lines), 95% confidence intervals (dashed lines), and overall average time across years (gray line) for employed respondents, full-time students, and retirees
on weekdays (N = 72 098, upper panels) and weekends/holidays (N = 74 246, lower panels). Linear trends across survey years are reported in the lower left of each panel.
On weekdays, the advance in evening bed time was more pronounced than the delay in morning wake-up time (−1.1 min/year vs. +0.4 min/year, respectively). On
weekends/holidays, evening bed time advanced significantly by −1.1 min/year, but there was no significant change in wake-up time across survey years.
12 | SLEEPJ, 2018, Vol. 41, No. 4D
ownloaded from
https://academic.oup.com
/sleep/article/41/4/zsy012/4792945 by guest on 27 August 2022

respondents or those not in the labor force on either weekdays or weekends/holidays. The observed increase in sleep duration across survey years was predominantly explained by retiring earlier and to a lesser degree by getting up later in the morning. The latter explains the shift in midsleep times to earlier times on weekends observed in analyses also based on the ATUS [36].
Any increase in sleep duration has to be offset by less time spent in waking activities. We therefore calculated linear trends across
survey years for 40 waking activities and also investigated how the change across survey years was correlated with the change in sleep duration. No other waking activity showed a change of similar magnitude across survey years compared with sleeping on weekdays. Sleep is a cumulative process, and despite a 1.4 min change in 24 hr sleep duration per year sounding unimpressive, it can matter greatly [37]. For example, the lowest/highest sleep dura-tion for employed respondents on weekdays was found in 2004
44%
46%
48%
50%
52%
54%
56%
deBerofeB
VTdehcta
Woh
WstnednopseR
44%
46%
48%
50%
52%
54%
56%
deBerofeB
VTdehcta
Woh
WstnednopseR
4%
6%
8%
10%
12%
14%
16%
deBerofeB
daeRoh
WstnednopseR
4%
6%
8%
10%
12%
14%
16%deB
erofeBdaeR
ohWstnednopseR
-0.24 %/year (p<0.0001) -0.22 % min/year (p<0.0001)
Weekdays Weekdays
Weekends/Holidays Weekends/Holidays
-0.20 %/year (p<0.0001) -0.11 %/year (p=0.0369)
Figure 7. Changes in the prevalence of reading or writing for personal interest before bed and watching movies and TV before bed over the period 2003–2016. The panels
show estimates for the mean (black line), 95% confidence intervals (dashed lines), and overall average across years (gray line) for employed respondents, full-time stu-
dents, and retirees on weekdays (N = 72 098, upper panels) and weekends/holidays (N = 74 246, lower panels). The prevalence of reading or writing for personal interest
decreased by 0.24% per year on weekdays and by 0.20% per year on weekends/holidays, whereas the prevalence of watching TV or movies decreased by 0.22% per year
on weekdays and by 0.11% per year on weekends/holidays (linear trends).
Basner and Dinges | 13D
ownloaded from
https://academic.oup.com
/sleep/article/41/4/zsy012/4792945 by guest on 27 August 2022

(8.05 hr) and 2015 (8.37 hr), respectively. This difference translates to 83.4 hr (or 3.5 days) more sleep per year just on weekdays.
Time spent reading for personal interest declined significantly across survey years, and changes in time spent reading across survey years were strongly negatively correlated with increases in sleep duration on both weekdays and weekends/holidays. An in-depth analysis showed that the percentage of participants read-ing before bed decreased significantly across survey years. This suggests that more and more respondents decided not to read before bed, contributing to the observed decrease in time spent reading and the concomitant increase in sleep duration.
Watching TV and movies was identified earlier as the most prominent waking activity in the 2 hr period preceding individual bed time [38]. It is therefore the #1 evening candidate activity for increasing sleep duration. However, our analyses showed a sig-nificant increasing trend in time spent watching TV and movies across survey years, and changes in watching TV and movies were positively correlated with changes in sleep duration across survey years. At the same time, an in-depth analysis showed that the per-centage of participants watching TV or movies before going to bed decreased significantly across survey years. As watching TV shows or movies on a computer is also coded as watching TV or movies, the change in how respondents watched TV or movies across sur-vey years was likely not responsible for this declining trend. Rather, these findings suggest that more and more respondents chose not to watch TV or movies at night, likely contributing to the observed increase in sleep duration. It also illustrates that changes in activi-ties that surround the sleep period are more important for sleep duration than changes in overall 24 hr activity duration.
Other activities that decreased across survey years and were negatively correlated with the change in sleep duration included travel time (both related and unrelated to work and education), household management, and consumer purchases. This sug-gests that increasing online opportunities to work, learn, bank, shop, and perform administrative tasks from home freed up time related to the activity itself or related to traveling to and from the site of the activity, and that some of this extra time was used for increasing sleep duration.
Several earlier studies identified time spent working as the waking activity predominantly exchanged for less sleep [39–41].
Although working showed a decreasing linear trend across sur-vey years in employed respondents in this study, the estimate was highly variable. Also, changes in work and sleep time across survey years were only moderately negatively correlated. Time spent working was lowest during the economic crisis year 2010 but increased again in the following years. Therefore, despite the close association of time spent working and sleeping, it is unlikely that changes in work duration can explain the observed increase in sleep duration. The fact that a secular trend in sleep dura-tion was observed for large parts of the population, but did not include unemployed respondents and those not in the labor force, is a key finding of this study. Long work hours in combination with other societal pressures (e.g. caring for household children, housework, household management, food and drink preparation) decrease the opportunity for sleep. Collectively, our findings sug-gest that decreases in time spent in activities other than working were central for the observed increasing trend in sleep duration across survey years. This would also explain why the increas-ing online opportunities to work, learn, bank, shop, and perform administrative tasks from home described above did not translate to increases in sleep duration in those groups that are not forced to accommodate both work and other societal demands within the limits of the 24 hr day (i.e. the unemployed and those not in the labor force). Retirees showed the lowest increase in sleep duration across survey years compared with employed respond-ents and students and therefore took an intermediate position between employed respondents and students, on the one hand, and unemployed respondents and those not in the labor force, on the other hand.
Time spent in eating and drinking also decreased signifi-cantly across survey years and was negatively correlated with sleep duration. In a chronic sleep restriction protocol, Spaeth and colleagues showed that participants gained weight across 5 days with only 4 hr sleep opportunity relative to a control group with 8 hr sleep opportunity [42]. Interestingly, the additional calories were exclusively consumed by the sleep-restricted group during times when the control group was sleeping. Our analyses suggest a similar phenomenon for ATUS respondents. Increasing sleep duration may thus help decrease caloric intake by decreasing opportunities for food consumption.
8.0
8.1
8.2
8.3
8.4
]sruoh[ noitaruD peelS SUTA
A CR² = 0.923
8.0
8.1
8.2
8.3
8.4
40 50 60 70 80 90 100
]h[ noitaruD peelS
Google Web Search Interest
R2 = 0.923p<0.0001 R² = 0.8519
8.0
8.1
8.2
8.3
8.4
0 50 100 150 200
]h[ noitaruD peelS
Manuscript Publica�ons
R2 = 0.852p<0.0001
Manuscripts/Sleep Dura�on
40
50
60
70
80
90
100
tseretnI evitaleR
0
20
40
60
80
100
120
140
160
180
200selcitrA lanigir
O dehsilbuPWeb Search/Sleep Dura�onB
ATUS Sleep TimeGoogle InterestPublished Ar�cles
Figure 8. Comparison of internet searches on the topic sleep, published manuscripts on sleep duration, and ATUS sleep time estimates over the period 2003–2016.
(A) shows (1) a Google Trends analysis of searches for the word “sleep” between 2004 and 2017 for the United States (blue line; each data point is divided by the total
searches of the geography and time range it represents [based on a query performed on August 31, 2017]; the resulting numbers are then scaled on a range of 0 to 100
based on a topic’s proportion to all searches on all topics), (2) the number of published original articles with the terms “sleep duration” or “sleep time” or “short sleep”
or “long sleep” in the title for the time frame 2003 to 2016 (red line; based on a Web of Science Core Collection search performed on August 31, 2017), and (3) the change
in ATUS sleep duration estimates for all respondents (N = 88 799) on weekdays over the period 2003 until 2016. (B) and (C) show Pearson correlations of ATUS sleep
duration estimates with Google searches and the number of published manuscripts, respectively.
14 | SLEEPJ, 2018, Vol. 41, No. 4D
ownloaded from
https://academic.oup.com
/sleep/article/41/4/zsy012/4792945 by guest on 27 August 2022

Notably, sleeplessness also increased significantly across sur-vey years and was positively correlated with the increase in sleep duration. Advancing bed time poses a challenge for respondents with a late circadian preference and may explain the observed increase in sleeplessness to some extent [39, 43]. Similarly, it is unclear whether the observed increase in long sleep duration across survey years poses a threat to public health. As discussed above, the role of long sleep in the genesis of negative health out-comes is still unclear. Reverse causation and residual confounding are plausible mechanisms that could partly explain the long sleep/negative health relationship, which would make long sleep merely a surrogate marker of other factors that predispose to these nega-tive health outcomes [22, 23]. More research based on prospective studies is needed to confirm or refute this hypothesis.
Strengths and limitations
Strength of this study include the timeliness of the data, the consistency of the ATUS across survey years, the fact that the data are representative for the United States, the large number of relevant confounders available for adjustment, and the large number of respondents.
The cross-sectional nature of the ATUS and the fact that information on secondary activities (performed at the same time as the primary activity) was not collected are limitations of this study. We had no detailed information on the respondents’ health status or on the content of some behaviors (e.g. which type and how much alcohol, caffeine, or drugs were consumed) that may act as confounders and influence sleep duration. As health status is not measured in ATUS (or the Current Population Survey [CPS]), our analyses cannot directly show whether and how sleep patterns contribute to health disparities.
The ATUS response rate averaged 53.7% across survey years (range 46.8%–57.8%, Table 1). A survey conducted by BLS and the Census Bureau in early 2004 analyzing responses and operations data indicated that the primary reason for refusal is survey fatigue: the designated persons are tired of par-ticipating in the CPS and do not want to respond to another survey [35]. The general trend of declining survey response rates was also found for the ATUS with a 0.85% decline in response rate per year across survey years (linear trend). It is therefore possible that the observed trends in sleep dura-tion can at least partially be explained by secular trends in survey nonresponse. However, the complex survey design of the ATUS accounts for survey nonresponse by weighing participants relative to their likelihood of responding. These weights ensure that each group is adequately represented in the population.
In ATUS, the following examples are provided in the cod-ing lexicon for the sleep category (coded as tier 010101): sleep-ing, falling asleep, dozing off, napping, getting up, waking up, dreaming, cat napping, getting some shut eye, and dozing. Some of these examples describe rest or transitions in or out of sleep rather than sleep itself. Also, the ATUS sleep category covers 24 hr sleep (including naps), not nighttime sleep or, in case of participants working the night shift, the dominant sleep period (importantly, a category “sleeplessness” does exist, and thus try-ing but not being able to fall asleep is not counted as sleep). Thus, ATUS sleep time estimates are not directly comparable with those derived from a single question asking, e.g. about average sleep duration on weekday nights. According to a comparison
of ATUS sleep time estimates with self-reported sleep time for weekdays/workdays from the 2005–2008 National Health and Nutrition Examination Survey (NHANES) [26], ATUS sleep time exceeded NHANES self-reported sleep time by approximately 1 hr on average. For the reasons noted above, readers should refrain from translating ATUS sleep time estimates to objectively assessed sleep time in a 1:1 fashion (even single-question esti-mates of sleep time have been shown to overestimate physiolog-ical sleep [44, 45]). However, due to the consistency of the ATUS across years, it is unlikely that sleep duration estimates across years were systematically biased. Also, as Mattriciani et al. [28] point out (p. 319), time use surveys are “arguably more objective than asking individuals how long they usually sleep using a sin-gle question, since participants are blind to the focus on sleep and the diary structure applies an external constraint that activi-ties conducted during a 24 hr day does indeed total 24 hr.”
Finally, due to the cross-sectional nature of the data, the findings reflect associations. Some of the potential causal mech-anisms discussed above warrant further investigation and will optimally be based on prospective data gathered using objective measures of sleep duration (e.g. actigraphy).
ConclusionsThis is the first study to show a significant increase in sleep duration over the period 2003–2016 in large parts of the US population. This increase was predominantly caused by earlier bed times in the evening and to a lesser extent by respondents getting up later in the morning. The percentage of respondents who watched TV or read before bed—two prominent waking activities competing with sleep time—decreased over the same time period. This can be interpreted as a sign of increasing will-ingness in parts of the population to relinquish these popular prebed activities to obtain more sleep and may in part be attrib-uted to educational campaigns, scientific reports of the health risks of reduced sleep duration, and the increasing interest in sleep loss and its consequences in both the scientific and the popular literature—all factors that could have been reflected in the increase in Google searches on “sleep,” and in publication of more scientific articles on the importance of obtaining adequate sleep. Analyses of decreases in waking activities concomitant to the increase in sleep duration suggest that increasing online opportunities to work, learn, bank, shop, and perform adminis-trative tasks from home freed up time related to the activities themselves and related to traveling to and from the sites of the activities, and that some of this extra time was used for increas-ing sleep duration. The findings presented here suggest that we are on the right track for a successful fight against chronic, widespread sleep deficiency, even if there is still a long way to go. Health consequences of the observed increase in the prevalence of long sleep remain unclear and warrant further investigation.
FundingThis work was supported by the Institute for Experimental Psychiatry Research Foundation (IEPRF).
NotesConflict of interest statement. None declared.
Basner and Dinges | 15D
ownloaded from
https://academic.oup.com
/sleep/article/41/4/zsy012/4792945 by guest on 27 August 2022

References1. de Vivo L, et al. Ultrastructural evidence for synaptic scal-
ing across the wake/sleep cycle. Science. 2017; 355(6324): 507–510.
2. Tononi G, et al. Sleep and the price of plasticity: from synap-tic and cellular homeostasis to memory consolidation and integration. Neuron. 2014; 81(1): 12–34.
3. Banks S, et al. Behavioral and physiological consequences of sleep restriction. J Clin Sleep Med. 2007; 3(5): 519–528.
4. Belenky G, et al. Patterns of performance degradation and restoration during sleep restriction and subsequent recov-ery: a sleep dose-response study. J Sleep Res. 2003; 12(1): 1–12.
5. Van Dongen HP, et al. The cumulative cost of additional wakefulness: dose-response effects on neurobehavioral functions and sleep physiology from chronic sleep restric-tion and total sleep deprivation. Sleep. 2003; 26(2): 117–126.
6. Buxton OM, et al. Adverse metabolic consequences in humans of prolonged sleep restriction combined with cir-cadian disruption. Sci Transl Med. 2012; 4(129): 129ra43.
7. Buxton OM, et al. Sleep restriction for 1 week reduces insulin sensitivity in healthy men. Diabetes. 2010; 59(9): 2126–2133.
8. Taheri S, et al. Short sleep duration is associated with reduced leptin, elevated ghrelin, and increased body mass index. PLoS Med. 2004; 1(3): e62.
9. Prather AA, et al. Sleep and antibody response to hepatitis B vaccination. Sleep. 2012; 35(8): 1063–1069.
10. Dettoni JL, et al. Cardiovascular effects of partial sleep dep-rivation in healthy volunteers. J Appl Physiol (1985). 2012; 113(2): 232–236.
11. Committee on Sleep Medicine Research. Sleep Disorders and Sleep Deprivation: An Unmet Public Health Problem. Washington, DC: National Academic Press; 2006.
12. Patel SR, et al. Short sleep duration and weight gain: a sys-tematic review. Obesity (Silver Spring). 2008; 16(3): 643–653.
13. Knutson KL, et al. Associations between sleep loss and increased risk of obesity and diabetes. Ann N Y Acad Sci. 2008; 1129: 287–304.
14. Beihl DA, et al. Sleep duration as a risk factor for incident type 2 diabetes in a multiethnic cohort. Ann Epidemiol. 2009; 19(5): 351–357.
15. Wang Q, et al. Short sleep duration is associated with hyper-tension risk among adults: a systematic review and meta-analysis. Hypertens Res. 2012; 35(10): 1012–1018.
16. Shankar A, et al. Sleep duration and coronary heart disease mortality among Chinese adults in Singapore: a population-based cohort study. Am J Epidemiol. 2008; 168(12): 1367–1373.
17. Ferrie JE, et al. Change in sleep duration and cognitive func-tion: findings from the Whitehall II Study. Sleep. 2011; 34(5): 565–573.
18. Gallicchio L, et al. Sleep duration and mortality: a systematic review and meta-analysis. J Sleep Res. 2009; 18(2): 148–158.
19. Cappuccio FP, et al. Sleep duration and all-cause mortality: a systematic review and meta-analysis of prospective stud-ies. Sleep. 2010; 33(5): 585–592.
20. Watson NF, et al. Joint consensus statement of the American academy of sleep medicine and sleep research society on the recommended amount of sleep for a healthy adult: methodology and discussion. Sleep. 2015; 38(8): 1161–1183.
21. Grandner MA, et al. Who are the long sleepers? Towards an understanding of the mortality relationship. Sleep Med Rev. 2007; 11(5): 341–360.
22. Patel SR, et al. Correlates of long sleep duration. Sleep. 2006; 29(7): 881–889.
23. Stamatakis KA, et al. Long sleep duration: a risk to health or a marker of risk? Sleep Med Rev. 2007; 11(5): 337–339.
24. Watson NF, et al. Recommended amount of sleep for a healthy adult: a joint consensus statement of the American Academy of Sleep Medicine and Sleep Research Society. Sleep. 2015; 38(6): 843–844.
25. Pasarica M, et al. Medical students teaching peer athletes: an innovative way of instructing the physiology of exercise, nutrition, and sleep as fundamentals for lifestyle medicine. Adv Physiol Educ. 2017; 41(3): 432–435.
26. Centers for Disease C, Prevention. Effect of short sleep dur-ation on daily activities—United States, 2005–2008. MMWR Morb Mortal Wkly Rep. 2011; 60(8): 239–242.
27. Morgenthaler TI, et al. Development of the National Healthy Sleep Awareness Project Sleep Health Surveillance ques-tions. J Clin Sleep Med. 2015; 11(9): 1057–1062.
28. Matricciani L, et al. Past, present, and future: trends in sleep duration and implications for public health. Sleep Health. 2017; 3(5): 317–323.
29. Bin YS, et al. Sleeping at the limits: the changing preva-lence of short and long sleep durations in 10 countries. Am J Epidemiol. 2013; 177(8): 826–833.
30. Bin YS, et al. Secular trends in adult sleep duration: a sys-tematic review. Sleep Med Rev. 2012; 16(3): 223–230.
31. Robinson JP, et al. Sleep as a victim of the “time crunch”—a multinational analysis. Electron Int J Time Use Res. 2010; 7(1): 61e72.
32. Knutson KL, et al. Trends in the prevalence of short sleepers in the USA: 1975-2006. Sleep. 2010; 33(1): 37–45.
33. Luckhaupt SE, et al. The prevalence of short sleep dur-ation by industry and occupation in the National Health Interview Survey. Sleep. 2010; 33(2): 149–159.
34. Youngstedt SD, et al. Has adult sleep duration declined over the last 50+ years? Sleep Med Rev. 2016; 28: 69–85.
35. American Time Use Survey User’s Guide—Understanding ATUS 2003 to 2016: U.S. Bureau of Labor Statistics and U.S. Census Bureau, 2017. Report No.: .http://www.bls.gov/tus/atususersguide.pdf on 12/20/2017.
36. Fischer D, et al. Chronotypes in the US—Influence of age and sex. PLoS One. 2017; 12(6): e0178782.
37. Basner M, et al. Sleep and alertness in medical interns and residents: an observational study on the role of extended shifts. Sleep. 2017; 40(4): 1–8.
38. Basner M, et al. Dubious bargain: trading sleep for Leno and Letterman. Sleep. 2009; 32(6): 747–752.
39. Basner M, et al. Sociodemographic characteristics and wak-ing activities and their role in the timing and duration of sleep. Sleep. 2014; 37(12): 1889–1906.
40. Basner M, et al. American time use survey: sleep time and its relationship to waking activities. Sleep. 2007; 30(9): 1085–1095.
41. Biddle JE, et al. Sleep and the allocation of time. J Political Econ. 1990; 98(5 Pt. 1): 922–943.
42. Spaeth AM, et al. Effects of experimental sleep restriction on weight gain, caloric intake, and meal timing in healthy adults. Sleep. 2013; 36(7): 981–990.
43. Wittmann M, et al. Social jetlag: misalignment of biological and social time. Chronobiol Int. 2006; 23(1-2): 497–509.
44. Silva GE, et al. Relationship between reported and meas-ured sleep times: the sleep heart health study (SHHS). J Clin Sleep Med. 2007; 3(6): 622–630.
45. Lauderdale DS, et al. Self-reported and measured sleep duration: how similar are they? Epidemiology. 2008; 19(6): 838–845.
16 | SLEEPJ, 2018, Vol. 41, No. 4D
ownloaded from
https://academic.oup.com
/sleep/article/41/4/zsy012/4792945 by guest on 27 August 2022
Related Documents