Electroencephalography and Clinical Neurophysiology, 1981,51:483--493 483 © Elsevier/North-Holland Scientific Publishers, Ltd. SLEEP DEPRIVATION: EFFECT ON SLEEP STAGES AND EEG POWER DENSITY IN MAN 1 ALEXANDER A. BORBI~LY *, FRITZ BAUMANN *, DANIEL BRANDEIS *, INGE STRAUCH ** and DIETRICH LEHMANN *** Laboratory for Sleep Studies and * Institute of Pharmacology, ** Institute of Psychology, and *** Department of Neurology, University of Zurich, Zurich (Switzerland) (Accepted for publication: January 19, 1981} The effects of total sleep deprivation on human sleep are well documented (e.g., Berger and Oswald 1962; Williams et al. 1964; Webb and Agnew 1971; Moses et al. 1975; Nakazawa et al. 1978). Evidence has been accumulating that changes in the sleep pattern of animals subjected to extended waking peri- ods are comparable to those seen in man. In particular, a selective enhancement of the slow wave sleep fraction of non-REM sleep has been reported for monkey (Reite et al. 1965; Crowley et al. 1972), cat (Ursin 1971), rabbit (Pappenheimer et al. 1975), dog (Taka- hashi et al. 1978) and rat (Borbdly and Neu- haus 1979). The generality of this finding across various species prompted us to examine more closely the effect of sleep deprivation on sleep in man. In contrast to the previous studies, the present investigation was based mainly on the spectral analysis of the EEG signal. Spectral analysis has been used previously to characterize the sleep EEG. However, such studies were either based on short EEG sam- ples obtained during sleep (Johnson et al. 1969; Dumermuth et al. 1972), or limited to the analysis of selected frequency bands (Church et al. 1975; Smith et al. 1978) or spectral coherence (Lehmann et al. 1980). 1 Supported by the Swiss National Science Founda- tion, Grants No. 3.254-0.77, 3.561-0.79 and 3.522- 0.79 and Stiftung fiir wissenschaftliche Forschung an der Universit~it Ziirich. Moreover, spectral analysis has not yet been used to investigate the effects of sleep depri- vation. In the present study, the EEG records from 32 entire nights (16 baseline nights and 16 recovery nights) were used to compute the frequency distribution of the power density in the 0.25--25 Hz range for the total sleep time, the separate NREM-REM sleep cycles and the visually scored sleep stages. Methods (A) Subjects Eight paid volunteer subjects (6 male, 2 female) aged 21--29 (mean 24.4)years were studied. They were in good health, neither taking drugs nor reporting any sleep disorders. In the 2 females the recording days did not coincide with the menstrual period. After an adaptation night in the sleep laboratory each subject was recorded for 2 consecutive base- line nights. Time in bed was approximately 7.5 h (23:00--06:30). The subsequent night and the following day were spent awake. Thus the waking time before the first recovery night was 40.5 h. Sleep records were obtained for 2 consecutive recovery nights following sleep deprivation. During the sleep depriva- tion night the subjects were in the company of supervisors participating in the experiment. They spent the following day on their usual activities (often attending courses at the uni- versity), and were instructed to avoid sleep- inducing situations.

Welcome message from author
This document is posted to help you gain knowledge. Please leave a comment to let me know what you think about it! Share it to your friends and learn new things together.
Transcript
Electroencephalography and Clinical Neurophysiology, 1 9 8 1 , 5 1 : 4 8 3 - - 4 9 3 483 © Elsevier/North-Holland Scientific Publishers, Ltd.
SLEEP DEPRIVATION: EFFECT ON SLEEP STAGES AND EEG POWER DENSITY IN MAN 1
ALEXANDER A. BORBI~LY *, FRITZ BAUMANN *, DANIEL BRANDEIS *, INGE STRAUCH ** and DIETRICH LEHMANN ***
Laboratory for Sleep Studies and * Institute of Pharmacology, ** Institute of Psychology, and *** Department of Neurology, University of Zurich, Zurich (Switzerland)
(Accepted for publication: January 19, 1981}
The effects of total sleep deprivation on human sleep are well documented (e.g., Berger and Oswald 1962; Williams et al. 1964; Webb and Agnew 1971; Moses et al. 1975; Nakazawa et al. 1978). Evidence has been accumulating that changes in the sleep pattern of animals subjected to extended waking peri- ods are comparable to those seen in man. In particular, a selective enhancement of the slow wave sleep fraction of non-REM sleep has been reported for monkey (Reite et al. 1965; Crowley et al. 1972), cat (Ursin 1971), rabbit (Pappenheimer et al. 1975), dog (Taka- hashi et al. 1978) and rat (Borbdly and Neu- haus 1979). The generality of this finding across various species prompted us to examine more closely the effect of sleep deprivation on sleep in man. In contrast to the previous studies, the present investigation was based mainly on the spectral analysis of the EEG signal.
Spectral analysis has been used previously to characterize the sleep EEG. However, such studies were either based on short EEG sam- ples obtained during sleep (Johnson et al. 1969; Dumermuth et al. 1972), or limited to the analysis of selected frequency bands (Church et al. 1975; Smith et al. 1978) or spectral coherence (Lehmann et al. 1980).
1 Supported by the Swiss National Science Founda- t ion, Grants No. 3.254-0.77, 3.561-0.79 and 3.522- 0.79 and Stiftung fiir wissenschaftliche Forschung an der Universit~it Ziirich.
Moreover, spectral analysis has not yet been used to investigate the effects of sleep depri- vation. In the present study, the EEG records from 32 entire nights (16 baseline nights and 16 recovery nights) were used to compute the frequency distribution of the power density in the 0.25--25 Hz range for the total sleep time, the separate NREM-REM sleep cycles and the visually scored sleep stages.
Methods
(A) Subjects Eight paid volunteer subjects (6 male, 2
female) aged 21--29 (mean 24.4)years were studied. They were in good health, neither taking drugs nor reporting any sleep disorders. In the 2 females the recording days did not coincide with the menstrual period. After an adaptation night in the sleep laboratory each subject was recorded for 2 consecutive base- line nights. Time in bed was approximately 7.5 h (23:00--06:30). The subsequent night and the following day were spent awake. Thus the waking time before the first recovery night was 40.5 h. Sleep records were obtained for 2 consecutive recovery nights following sleep deprivation. During the sleep depriva- tion night the subjects were in the company of supervisors participating in the experiment. They spent the following day on their usual activities (often attending courses at the uni- versity), and were instructed to avoid sleep- inducing situations.
484 A.A. BORBI~LY ET AL.
(B) Recording For EEG analysis an ipsilateral fronto-
occipital bipolar derivation was used. The electrodes were posit ioned at a distance of 6 cm from Cz with which they delimited a rectangular triangle. EEG, EMG and EOG sig- nals were recorded continuously on a Grass 78D polygraph at a paper speed of 10 mm/ sec. The pre-amplifier ou tpu t of the EEG sig- nal was recorded also on an FM magnetic tape recorder (Hewlett Packard model 3968A) at 2.38 imp/sec.
(C) Analysis Sleep stages were scored for 30 sec periods
from the polygraph records according to the criteria of Rechtschaffen and Kales (1968). However, since the fronto-occipital derivation yielded a smaller amplitude signal than the recommended C4/A1 derivation, the mini- mum peak-to-peak amplitude criterion for delta waves was set to 50 /zV. For spectral analysis the tape-recorded signals were played back into the analog-to<ligital converter of a P D P l l / 2 0 computer with a sampling rate of 64/sec through a low-pass filter (25 Hz, 24 dB/octave). The power spectra were then computed for consecutive 4 sec epochs using a Fast Fourier Transform routine (Routine FFT, Labora tory Subroutine Package, DEC). Spectra of epochs with EEG artefacts (mean: 2.9% of all epochs) were eliminated on the basis of visual inspection of the original trac- ings. The mean spectra over 1 min segments were computed by averaging spectra of 15 consecutive 4 sec epochs. If fewer than 6 artefact-free 4 sec epochs were available, the 1 min segment was omit ted from further pro- cessing (mean: 0.1% of all segments). Thus each 1 min mean spectrum corresponded to two 30 sec epochs of scored sleep stages. For the computa t ion of the power density within the various sleep stages (Figs. 2--5) 1 min seg- ments with 2 different sleep scores were not used. By computing the mean values over adjacent frequencies, the data were reduced to 0.5 Hz bin width for frequencies between 0.25 and 5.0 Hz, and to 1 Hz bin width for
frequencies between 5.25 and 25.0 Hz. Bins are referred to and plot ted in this paper by the highest frequency included (e.g., the 2.5 Hz bin refers to the averaged values of 2.25 and 2.50 Hz; the 14 Hz bin refers to the aver- aged values of 13.25, 13.5, 13.75 and 14.0 Hz).
The two-sided paired Wilcoxon test (Wil- Coxon matched-pairs signed-ranks test; Siegel 1956) was used as a non-parametric statistical test.
Results
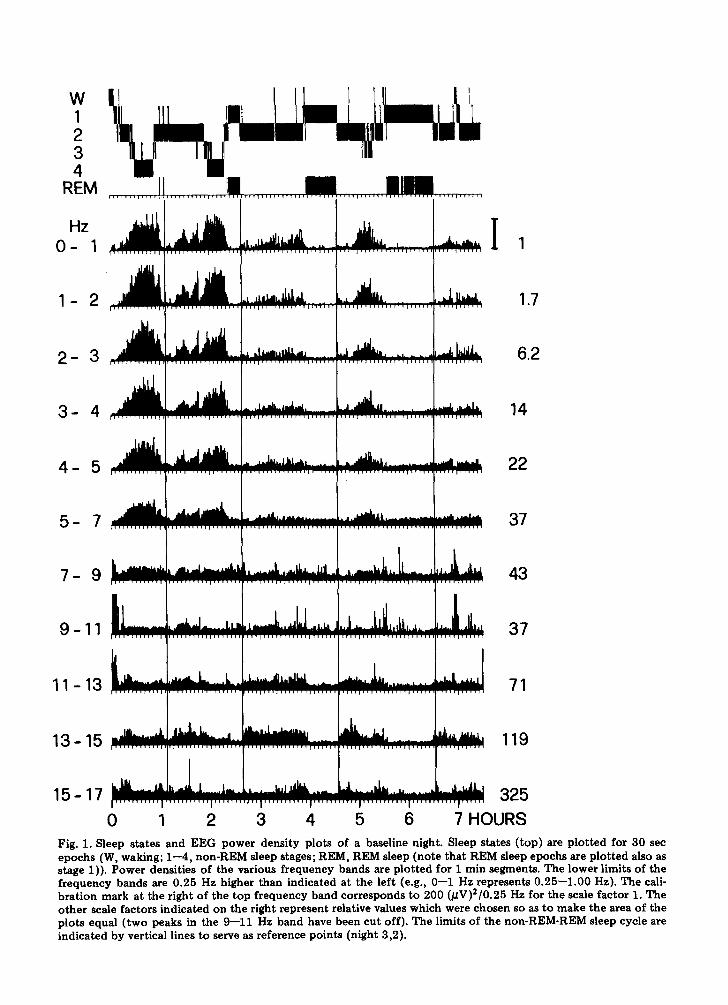
(1) Baseline nights Fig. 1 illustrates the sleep scores of a base-
line night and the corresponding power den- sity plots for successive 1 Hz or 2 Hz fre- quency bands in the range of 0.25--17.0 Hz. The scale factors indicated on the right were chosen to equalize the areas of the plots. The vertical lines indicate the limits of 4 non- REM-REM sleep cycles which were defined according to Feinberg and Floyd (1979) by the succession of a non-REM sleep period of at least 15 min duration and a REM sleep period of at least 5 min duration; no mini- mum REM sleep duration was required for the first non-REM-REM sleep cycle. The two initial large peaks in the delta frequency bands correspond to slow wave sleep (stage 3 and 4). The delta band values of the first cycle typically exceed those of the second cycle except for the lowest frequency band ( 0 . 2 5 - 0 . 5 Hz) where the reverse relationship is seen (see also Fig. 3). Peaks in power den- sity during stage 3 and 4 are present in all f requency bands up to 7 Hz. Alpha peaks cor- responding to periods scored as waking are evident between 7 and 13 Hz, bu t are most conspicuous in the 9--11 Hz band. High val- ues in the 13--15 Hz band occur typically during stage 2, and seem to reflect the spindle activity. No consistent sleep stage-related modulat ion is seen in the highest frequency band illustrated (15--17 Hz).
In Fig. 2 the frequency distribution of the
W 1 2 3 4
REM
Hz O-
_
l mm
1.7
2 - 3 6.2
3 - 4 14
4 - 5 22
5 - 7
7 - 9
37
43
- , . . . . . . . . . . I , , ; . . . . . . . . . . ; , . . . . . . " . . . . . . . . . . . . . . . . . . . . . . . . . . . . . . . . . 37
- , . . . . . . ", . . . . . . . . . . . . . . . . : ' : : , ; . . . . . . . . . . . P! . . . . . . q q ~ , , , ' - - ; ' - . , . . . . . . . . . . . 71
15 -17
0 1 2 3 4
"~ .... ~ ..... ' ...... J-~" 325
5 6 7 HOURS Fig. 1. Sleep states and EEG power density plots of a baseline night. Sleep states (top) are plotted for 30 sec epochs (W, waking; 1--4, non-REM sleep stages; REM, REM sleep (note that REM sleep epochs are plotted also as stage 1)). Power densities of the various frequency bands are plotted for 1 min segments. The lower limits of the frequency bands are 0.25 Hz higher than indicated at the left (e.g., 0--1 Hz represents 0.25--1.00 Hz). The cali- bration mark at the right of the top frequency band corresponds to 200 (/~V)2/0.25 Hz for the scale factor 1. The other scale factors indicated on the right represent relative values which were chosen so as to make the area of the plots equal (two peaks in the 9--11 Hz band have been cut off). The limits of the non-REM-REM sleep cycle are indicated by vertical lines to serve as reference points (night 3,2).

486 A.A. BORBI~LY ET AL.
4 . 0 -
3.0
i 2.0
,,=,
°~ 1.o
- 0 . 4 ~ ,
0 S4 - S 2
$4 - SREM : S2-SREM :
L
c
lO
"-..
! 15
c
o TOT - - S4 . . . . S2 ......... SREM
range. The $2 and $4 curves cross each other at 11 Hz, so that between 12 and 16 Hz the values of $2 exceed those of $4. Seven of the 8 subjects showed a peak (a higher value than the two adjacent ones) in the 12--14 Hz range in stage 2, and 5 of 8 subjects in the 8--10 Hz
Fig. 2. Frequency distribution of the EEG power den- sity in the baseline nights plotted for total sleep time (TOT), stage 4 ($4), stage 2 ($2) and stage REM (SREM). The curves connect the mean values (16 nights, 8 subjects) computed for 0.5 Hz bins between 0.25 and 5.0 Hz, and for I Hz bins between 5.25 and 25.0 Hz (means are plotted at the upper limits of the 0.5 H z o r 1 Hz bins; only every second value is indi- cated for TOT). The power density values are stan- dardized for each subject, and plotted as percentages on a logarithmic scale. The 100% value is defined for each subject as the mean power density (0.25--25.0 Hz) in stage 2 (absolute reference value for power density: 2.33 (#V)2/0.25 Hz + 0.36 S.E.M;range 1.14-- 4.11). Frequency bands with significant differences between sleep stages (P< 0.05; 2-sided paired Wil- coxon test) are indicated by filled circles and con- necting lines below the abscissa (e.g., $4 and $2 differ significantly in the frequency bands 0.5--7 Hz, 13-- 16 Hz and 25 Hz). Vertical lines at 2 Hz intervals serve as visual aids.
mean power density over all subjects was p lo t ted on a logarithmic scale for total sleep time (TOT), stage 2 ($2), stage 4 ($4) and stage REM (SREM) of the baseline nights. Between the lowest (0.5 Hz) and the highest f requency band (25.0 Hz), the values encom- pass more than 3 log units. Up to 6 Hz, the curves for the 3 sleep stages significantly differ from each other. The SREM values lie close to the $2 values in the 7--9 Hz range, bu t are distinctly lower in the 10--17 Hz
%
130
I I • 110
~ so
70
[ L oo 20 25 Hz
• 30
-" 130
110
TOT
/; '/
il / /
. . . . I . . . . I . . . . I . . . . I
e* • o-o * *
S3&S4
. . . . I . . . . I . . . . I . . . . I
t i l l " ~ i i i t
$4 $2
90
7O
50 . . . . I . . . . i . . . . i . . . . I . . . . i . . . . T . . . . r . . . . I * - * * * * 5 10 15 20 Hz
w * * * t 110 ] S R E M
90 ~ ~ - - C Y C L E 2
70 T i ~ ~ . . . . C Y C L E 3 0 5 t0 15 20 Hz
* * - - * * o* . . . . . . . . . C Y C L E 4
Fig. 3. Frequency distribution of relative EEG power density in non-REM-REM sleep cycles 2--4 of base- line nights. TOT, total sleep time; $3 and $4, stage 3 and stage 4 combined; $4, stage 4; $2, stage 2; SREM, stage REM. The curves connect mean values of 0.5 Hz or 1 Hz bins as in Fig. 2. For each subject the mean values for the first non-REM-REM sleep cycle of the 2 baseline nights were defined as 100% (horizontal line) for each frequency band. The values for the sub- sequent cycles are expressed relative to corresponding values of the first cycle. Frequency bands with signifi- cant differences (P < 0.05; 2-sided paired Wilcoxon test) between cycle 1 and cycle 2 (asterisks and con- necting lines), and between cycle 2 and cycle 3 (filled circles and connecting lines) are indicated below the abscissae. Connecting lines indicate the frequency range for which all values reach the significance level. Since all sleep stages were not invariably present in all cycles, and since the latest cycles were not invariably present in all nights, the following values for N were used for cycles 2--4: TOT, 16, 15, 9; $3 and $4 ,12 ; $4 ,7 ; $ 2 , 1 6 , 1 5 , 9 ; SREM, 15, 14, 8.

SLEEP DEPRIVATION AND EEG POWER DENSITY 487
range in REM sleep. No consistent differences between the sleep stages were seen at frequen- cies higher than 16 Hz. The power density of total sleep (Fig. 2, TOT) follows quite closely the $2 curve, particularly in the delta range.
Fig. 3 illustrates the frequency distribution of the relative power density in the various non-REM-REM sleep cycles which is expressed relative to the values of the first cycle. For total sleep time (TOT) there was a significant decrease in the 1--8 Hz and 16--20 Hz range between the first and second cycles, as well as between the second and third cycles, while the curves of cycles 3 and 4 practically coincided. For stage 3 and stage 4 combined, and for stage 4 alone, the values for the second cycle were generally lower than for the first cycle with the exception of the lowest frequency band (0.5 Hz) where the reverse relationship was seen. The differences between the second cycle of stage 3 and 4 and stage 4 were mainly due to the different numbers of nights contributing to the mean values (stage 3 and 4: N = 12; $4: N = 7). In
particular one night exhibiting 3 min of stage 3 and no stage 4 showed values in the 10 Hz range that were higher than 200%, thus raising the stage 3 and 4 curve to the 100% level. Stage 2 showed a marked progressive decrease in power density from cycle 1 to 3 which was present for extended parts of the frequency spectrum. Some decrease from the first to the second cycle was evident also for stage REM, bu t beyond cycle 2 no clear decreasing trend was seen.
(2) Nights following sleep deprivation The distribution of the sleep stages and the
sleep latencies for the 2 baseline nights B1 and B2, and the 2 recovery nights R1 and R2, are indicated in Table I. No significant differ- ences were seen between the baseline nights except for a tendency to shorter REM sleep latency in B2. The effect of sleep deprivation in the first recovery night consisted in a signif- icant reduction of awake time and stage 1 % , and a significant increase in stage 3 and 4 % and stage 4 %. The latencies to stages 1--3
TABLE I
Sleep stage parameters for 2 baseline nights (B1, B2) and two recovery nights after sleep deprivation (R1, R2). Mean values with standard error in parentheses (N = 8).
B1 B2 R1 R2
422.6 ( 6 . 2 ) 431.3 (4.9) 446.4 c ( 2 . 1 ) 435.3 b (4.0)
25.8 ( 6 . 2 ) 18.7 (4.5) 5.7 c ( 1 . 8 ) 14.3 b (3.7)
Total sleep time (min)
Time awake (rain)
NREM sleep Stage 1% 9.2 ( 1 . 0 ) Stage 2 % 59.0 ( 2 . 9 ) Stage 3 % 7.9 ( 0 . 7 ) Stage 4 % 5.0 ( 1 . 2 ) Stage 3 and 4 % 12.8 ( 1 . 7 )
REM sleep % 18.9 ( 1 . 7 )
Latency (rain) (from lights off) Stage 1 10.6 ( 3 . 1 ) Stage 2 17.1 ( 3 . 5 ) Stage 3 31.5 ( 3 . 7 ) Stage 2-3 14.4 ( 0 . 9 )
REM sleep 113.1 (15.3)
7.7 (0.8) 4.1 c ( 0 . 6 ) 5.2 c (0.8) 60.2 (3.0) 54.5 a ( 2 . 9 ) 60.1 c (3.8)
6.1 (0.5) 6.0 ( 0 . 8 ) 6.4 (1.4) 6.8 (1.8) 16.3 c ( 1 . 4 ) 8.0 (1.3)
12.9 (1.7) 22.2 c ( 1 . 4 ) 14.4 (2.4)
19.2 (1.8) 19.2 ( 2 . 1 ) 20.3 (1.6)
11.2 (4.1) 2.8 c ( 0 . 6 ) 7.0 c (2.3) 15.9 (4.1) 4.5 c ( 1 . 0 ) 9.4 c (2.6) 31.1 (3.7) 1 2 . 4 c ( 1 . 8 ) 26.6 (3.0) 15.2 (1.2) 7.9 c ( 0 . 9 ) 17.2 (2.0)
86.6 (9.2) 99.9 (16.3) 83.3 (9.1)
Differences from mean of the 2 baseline nights: a p < 0.1; b p <~ 0.02; c p < 0.01 (2-sided paired Wilcoxon test).
488 A.A. BORBI~LY ET AL.
were significantly shortened, whereas the REM sleep latency was no t affected. In the second recovery night, residual effects of sleep deprivation were still present although less prominent than in the first night. They consisted in a significant increase of total sleep time, a decrease of t ime awake and stage 1%, and a shortening of the sleep latencies for stages 1--3.
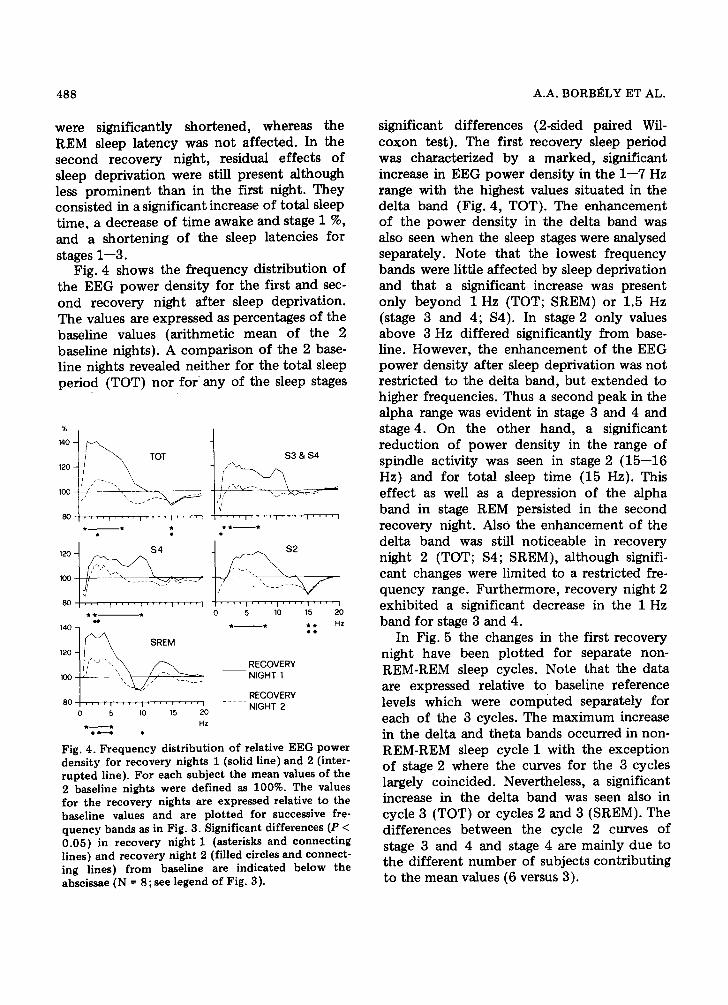
Fig. 4 shows the frequency distribution of the EEG power density for the first and sec- ond recovery night after sleep deprivation. The values are expressed as percentages of the baseline values (arithmetic mean of the 2 baseline nights). A comparison of the 2 base- line nights revealed neither for the total sleep period {TOT) nor fo r any of the sleep stages
%
120 -
100
. . . 0 5 10 15 2 0
. . * * Hz 140 7 • .
~2o SREM
100 N I G H T 1
RECOVERY 8 0 | . . . . ~ . . . . u . . . . i . . . . "i . . . . . N I G H T 2
0 5 10 15 2 0
H z e qu~--.e •
Fig. 4. Frequency distribution of relative EEG power density for recovery nights 1 (solid line) and 2 (inter- rupted line). For each subject the mean values of the 2 baseline nights were defined as 100%. The values for the recovery nights are expressed relative to the baseline values and are plotted for successive fre- quency bands as in Fig. 3. Significant differences (P < 0.05) in recovery night 1 (asterisks and connecting lines) and recovery night 2 (filled circles and connect- ing lines) from baseline are indicated below the abscissae (N = 8;see legend of Fig. 3).
significant differences (2-sided paired Wil- coxon test). The first recovery sleep period was characterized by a marked, significant increase in EEG power density in the 1--7 Hz range with the highest values situated in the delta band (Fig. 4, TOT). The enhancement of the power density in the delta band was also seen when the sleep stages were analysed separately. Note that the lowest frequency bands were little affected by sleep deprivation and that a significant increase was present 0nly beyond 1 Hz (TOT; SREM) or 1.5 Hz (stage 3 and 4; $4). In stage 2 only values above 3 Hz differed significantly from base- line. However, the enhancement of the EEG power density after sleep deprivation was not restricted to the delta band, but extended to higher frequencies. Thus a second peak in the alpha range was evident in stage 3 and 4 and stage 4. On the other hand, a significant reduction of power density in the range of spindle activity was seen in stage 2 (15--16 Hz) and for total sleep time (15 Hz). This effect as well as a depression of the alpha band in stage REM persisted in the second recovery night. Also the enhancement of the delta band was still noticeable in recovery night 2 (TOT; $4; SREM), although signifi- cant changes were limited to a restricted fre- quency range. Furthermore, recovery night 2 exhibited a significant decrease in the 1 Hz band for stage 3 and 4.
In Fig. 5 the changes in the first recovery night have been plot ted for separate non- REM-REM sleep cycles. Note that the data are expressed relative to baseline reference levels which were computed separately for each of the 3 cycles. The maximum increase in the delta and theta bands occurred in non- REM-REM sleep cycle 1 with the exception of stage 2 where the curves for the 3 cycles largely coincided. Nevertheless, a significant increase in the delta band was seen also in cycle 3 (TOT) or cycles 2 emd 3 (SREM). The differences between the cycle 2 curves of stage 3 and 4 and stage 4 are mainly due to the different number of subjects contributing to the mean values (6 versus 3).
SLEEP DEPRIVATION AND EEG POWER DENSITY 489
%
1 5 0 -
130
110
90
7O
120
100
80
180
160
140
120
100
80
~ TOT
. . . . I . . . . I . . . . I . . . . I
• -o • •
' ' 1 . . . . I
~ / ~ SREM i %', i f
/ , ' ,~ ,,~\
: x I , , ' , , , . . . . .
' ' ' ' 1 . . . . I . . . . I . . . . I
0 5 10 15 20
e. V r - - * e * HZ
$3 & $4
/i \ j , / t
S2
l . . . . I . . . . i , , 1 ~ . . . . ]
0 5 10 15 20
* * Hz = =
- - - - CYCLE 1
. . . . CYCLE 2
........ CYCLE 3
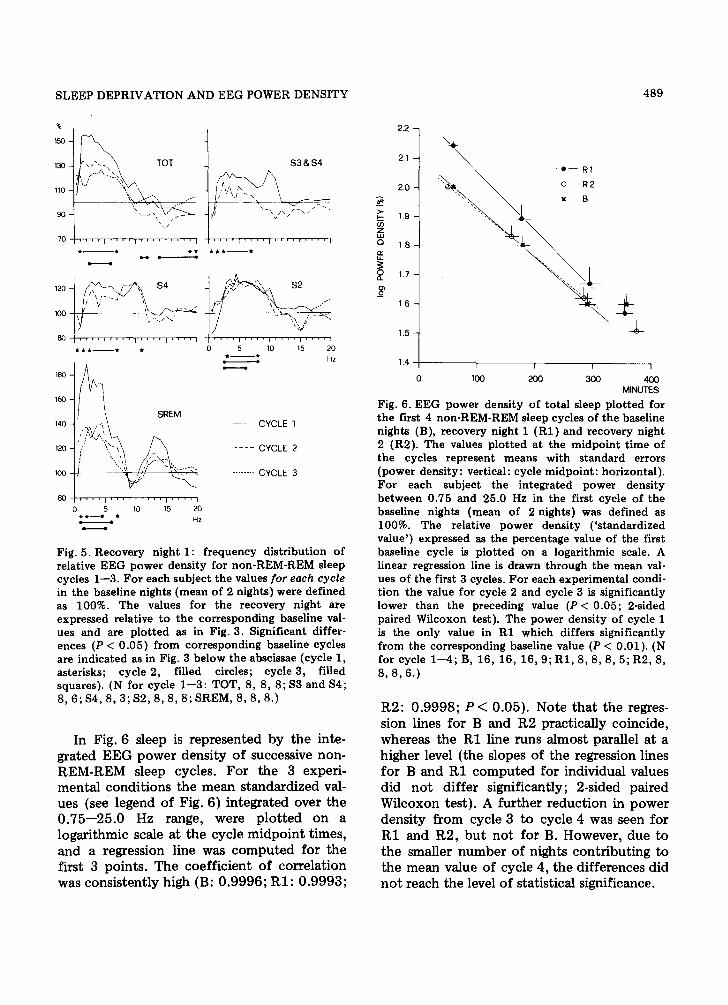
Fig. 5. Recovery night 1: frequency distribution of relative EEG power density for non-REM-REM sleep cycles 1--3. For each subject the values for each cycle in the baseline nights (mean of 2 nights) were defined as 100%. The values for the recovery night are expressed relative to the corresponding baseline val- ues and are plot ted as in Fig. 3. Significant differ- ences (P < 0.05) from corresponding baseline cycles are indicated as in Fig. 3 below the abscissae (cycle 1, asterisks; cycle 2, filled circles; cycle 3, filled squares). (N for cycle 1--3: TOT, 8, 8, 8; $3 and $4; 8, 6; $ 4 , 8 , 3 ; $ 2 , 8 , 8 , 8 ; SREM, 8, 8, 8.)
In Fig. 6 sleep is represented by the inte- grated EEG power density of successive non- REM-REM sleep cycles. For the 3 experi- mental conditions the mean standardized val- ues (see legend of Fig. 6) integrated over the 0.75--25.0 Hz range, were plotted on a logarithmic scale at the cycle midpoint times, and a regression line was computed for the first 3 points. The coefficient of correlation was consistently high (B: 0.9996; RI: 0.9993;
Z
,,=,
2 . 2 -
2 .1 -
2.0
1.9
1,8
1.7
1.6
1,5-
14
x .
\
I I I I
100 200 300 400 MINUTES
Fig. 6. EEG power density of total sleep plot ted for the first 4 non-REM-REM sleep cycles of the baseline nights (B), recovery night 1 (R1) and recovery night 2 (R2). The values plot ted at the midpoint t ime of the cycles represent means with standard errors (power density: vertical: cycle midpoint : horizontal). For each subject the integrated power density between 0.75 and 25.0 Hz in the first cycle of the baseline nights (mean of 2 nights) was defined as 100%. The relative power density ( 's tandardized value') expressed as the percentage value of the first baseline cycle is plot ted on a logarithmic scale. A linear regression line is drawn through the mean val- ues of the first 3 cycles. For each experimental condi- tion the value for cycle 2 and cycle 3 is significantly lower than the preceding value (P < 0.05; 2-sided paired Wilcoxon test). The power density of cycle 1 is the only value in R1 which differs significantly from the corresponding baseline value (P < 0.01). (N for cycle 1--4; B, 16, 16, 16, 9; R1, 8, 8, 8, 5; R2, 8, 8 , 8 , 6 . )
R2: 0.9998; P < 0.05). Note that the regres- sion lines for B and R2 practically coincide, whereas the R1 line runs almost parallel at a higher level (the slopes of the regression lines for B and R1 computed for individual values did not differ significantly; 2-sided paired Wflcoxon test). A further reduction in power density from cycle 3 to cycle 4 was seen for R1 and R2, but not for B. However, due to the smaller number of nights contributing to the mean value of cycle 4, the differences did not reach the level of statistical significance.

490 A.A. BORBI~LY ET AL.
Discussion
The percentages of stage 3 and 4 and stage 4 were enhanced on the first recovery night after sleep deprivation whereas REM sleep did not differ from the baseline value. These find- ings confirm previous results (Nakazawa et al. 1978). However, the spectral analysis of the present study revealed that the effects of sleep deprivation on sleep were inadequately reflected by the t ime spent in the various sleep stages. Although the percentages of stage 2 and REM sleep were not significantly changed on the first recovery night, a signifi- cant enhancement of the power density in the delta and theta bands was found in these stages. Yet even for stage 4, whose percentage showed a rise after sleep deprivation, the changes were incompletely mirrored by the conventional scoring procedure, since a signif- icant large increase in power density occurred also within stage4. The same argument applies to the second recovery night where persistent changes were revealed by spectral analysis within sleep stages whose percentage values did not differ from baseline.
The analysis of the EEG power density served not only to study the effects of sleep deprivation, but also to document significant trends within the baseline nights. Thus a pro- gressive decrement of power density between non-REM-REM sleep cycles 1 and 3 was evi- dent in various frequency bands for total sleep time (Fig. 3, TOT), a t rend that reflects the well known progressive decrease of stages 3 and 4 across the night. However, spectral analysis revealed unexpectedly a similar pro- gressive reduction in power density also within stage 2 which in the delta band amounted to close to 50%. The fact that stage 2 occupies a large port ion of sleep time adds to the interest of this new observation. Thus prominent trends in EEG power density across the night are clearly disregarded, if the analysis of sleep is based exclusively on the commonly applied scoring procedures. The same considerations apply also to stage 3 and 4 and stage 4 where the power density in the
delta band above 1 Hz was reduced, and the values below 1 Hz increased, from cycle 1 to cycle 2. These results confirm the data of Feinberg and coworkers (Church et al. 1975) who first reported these changes on the basis of period analysis of the sleep EEG.
EEG frequency bands are commonly classi- fied into several categories (delta band, theta band, etc.) which are often used for character- izing EEG changes. This descriptive nomencla- ture is undoubtedly convenient, and is also used in the present paper. Nevertheless, the power density distribution of the sleep EEG (Fig. 2) as well as its relative changes during baseline nights (Fig. 3) and after sleep depri- vation (Figs. 4 and 5), reveal continuous trends across the frequency spectrum which are inadequately described by the commonly used frequency categories. Thus, for example, neither the progressive reduction of the power density in the baseline nights nor its enhance- ment after sleep deprivation was limited to the delta band, as is often implicit in the liter- ature, but encompassed also a considerable part of the theta band. In stage 4 a bimodal curve with a prominent alpha peak character- ized the power density distribution in the first recovery night.
While the range of enhanced EEG frequen- cies after sleep deprivation was rather exten- sive, reductions in power density were more limited. They were confined to the 15--16 Hz band in stage 2, to the lowest delta frequen- cies in stage 4, and to the alpha band in stage REM. Since the origin and functional signifi- cance of specific EEG frequency bands is largely unknown, it is premature to speculate about mechanisms underlying the present ob- servations. It is interesting, however, that all reductions in power density persisted in the second recovery night, when the parts of the frequency spectrum which were enhanced in the first recovery night had reverted towards the baseline level.
It has been pointed out previously that slow wave sleep represents a sleep stage with a high priority, and that it is closely related to the antecedent waking time (see Webb and
SLEEP DEPRIVATION AND EEG POWER DENSITY 491
Agnew 1971). Thus the percentage of stage 3 and 4 is maintained or increased when sleep time is chronically curtailed (Webb and Agnew 1974). Moreover, as the present study has confirmed, slow wave sleep predominates in the first part of the sleep period, and is readily enhanced by sleep deprivation. The hypothesis of a specific relationship between slow wave sleep and prior waking time is sup- ported and further specified by the present data. Thus the curves indicating the decre- ment of the low frequency power density across the baseline night (Fig. 3, TOT) are largely a mirror image of those depicting the enhancement caused by sleep deprivation (Fig. 4, TOT, R1). This statement applies also to the changes seen in the lowest frequency band where the power density was reduced in stage 3 and 4 and stage 4 after sleep depriva- tion, but increased from cycle 1 to cycle 2 in the baseline night (Figs. 3 and 4). Therefore the progressive EEG changes observed within the sleep period after the usual waking time, and those induced by the extension of waking time, may both reflect the same underlying process.
A further, most important aspect of the present results consists in the observation that comparable changes in power density were present in all sleep stages examined (including REM sleep) and were not restricted to specific portions of sleep. Viewed in this light, sleep appears as a unitary process rather than as a succession of well-defined stages.
It has been proposed on the basis of human (Feinberg 1974) and animal data (Borb~ly and Neuhaus 1979) that a prevalence of slow waves in the EEG indicates the intensity of a sleep process. To further analyse this process, we have plotted the integrated power density values for successive non-REM-REM sleep cycles at the cycle midpoint times, and ob- served for the first 3 points a significantly decreasing trend with a close fit to an expo- nential function (Fig. 6). An exponential decline throughout the sleep period has been reported for the EEG amplitude (Sinha et al. 1972; Feinberg 1974) as well as for the dura-
tions of stage 2 and 4 sleep (Feinberg 1974; Feinberg et al. 1978) in man, and for slow wave sleep in rat (Borb~ly, in preparation), whereas a linear decrement was observed for some delta parameters (Feinberg et al. 1978). The present data did not allow firm conclu- sions with respect to the type of function un- derlying the decrement in power density. It was clear, however, that sleep deprivation enhanced the power density particularly in the first non-REM-REM sleep cycle, although significant effects were present also in subse- quent cycles (Figs. 5 and 6). The results are therefore compatible with the assumption that EEG parameters reflect a monotonically declining process during sleep whose level at sleep onset is determined by the length of the prior waking period. Although the existence of such a process is still hypothetical, there is evidence that during the usual waking period, and particularly during extended sleep depri- vation, an endogenous sleep enhancing factor accumulates in the CSF and brain which, upon administration to naive animals, aug- ments sleep and reduces motor activity (Fencl et al. 1971; Nagasaki et al. 1974; Pappen- heimer et al. 1975; Sachs et al. 1976; Borb~ly and Tobler 1980). The sleep factor was shown to induce the high amplitude slow wave EEG pattern which is typically seen after sleep deprivation (Pappenheimer et al. 1975). The results of the present study are consistent with the hypothesis that the intensity of a sleep process, as reflected by the EEG power density in the low frequency range, is related to the level of an endogenous sleep compound which is eliminated or inactivated during sleep.
Summary
Sleep was analysed in 8 young adult sub- jects during two baseline nights and two recovery nights following 40.5 h sleep depri- vation. Sleep stages were scored from the polygraph records according to conventional criteria. In addition, the EEG records of the

492 A.A. BORBI~LY ET AL.
entire nights were subjected to spectral anal- ysis to compute the frequency distribution of the power density in the 0.25--25 Hz range for 0.5 Hz or 1.0 Hz bins. In the first recovery night, the power density in the delta band was significantly higher than baseline for total sleep time as well as for sleep stages 2, 3 and 4, 4 and REM. These changes were not restricted to the delta band, but extended to higher fre- quency bands. Minor, but significant, effects of sleep deprivation were seen in the power density distribution of the second recovery night. In the baseline nights, a progressive reduction of power density in the del ta/ theta range was present for successive non-REM- REM sleep cycles for total sleep time and stages 2, 3 and 4, and 4. The results show that effects of sleep deprivation as well as trends within the sleep periods are readily apparent from spectral analysis, but are inadequately reflected by conventional sleep scoring. When the power density values were integrated over the entire frequency range (0.75--25 Hz) for each non-REM-REM sleep cycle, an exponen- tial decline from cycle 1 to cycle 3 was sug- gested. The present findings support the hypothesis that the EEG power density in the low frequency range is an indicator of a pro- gressively declining process during sleep whose initial value is determined by the dura- tion of prior waking.
R6sum6
Privation de sommeil: effets sur les stades de sommei l et la densitd de puissance dlectroen- cgphalographique chez l 'Homme
Le sommeil de 8 jeunes adultes a 6td enre- gistr~ pendant 2 nuits de base et 2 nuits de rdcup6ration apr~s une privation de sommeil de 40,5 h. Les stades de sommeil furent iden- tifi6s selon des crit~res conventionnels sur la base d'enregistrements polygraphiques. En plus, I 'EEG fut soumis ~ l 'analyse spectrale pour obtenir la distribution de frdquence (0,25--25 Hz en bins de 0,5 Hz ou 1,0 Hz) de
la densitd de puissance. Pendant la premiAre nuit de rdcuperation la densitd de puissance de la bande delta ~tait significativement supdrieure ~ celle des nuits de base pour le temps de sommefl total ainsi que pour les stades 2, 3 et 4, 4 et REM. Ces effets ne s'obervaient pas seulement pour la bande delta, mais dtaient 6galement prdsents dans des bandes de fr6quences plus dlevdes. La dis- tribution de la densitd de puissance montrait des changements mineurs, mais significatifs, dans la deuxibme nuit de rdcup6ration. Pen- dant les nuits de base, une rdduction progres- sive de la densitd de puissance dans la bande delta/th~ta s'observait pour les cycles non- REM-REM successifs pour le temps de som- meil total ainsi que pour les stades 2, 3 et 4, et 4. Ces r6sultats montrent que les effets de la privation de sommeil ainsi que des tendan- ces dans les p6riodes de sommeil sont mis en ~vidences par l'analyse spectrale, rnais ne sont apparents qu'en partie dans la distribution des stades de sommeil. Apr~s l'int~gration des valeurs de densitd de puissance sur la gamme de fr6quence enti~re (0,75--25,0 Hz) pour chaque cycle non-REM-REM une ddcroissance exponentielle s'observait entre cycle 1 et cycle 3. Les rdsultats sont compatibles avec l 'hypoth~se que la densit6 de puissance de I'EEG dans les bandes de frdquences basses est un indicateur d 'un processus de sommeil qui ddcroit progressivement et dont la valeur ini- tiale est ddterminde par la durde de l'6veil prd- cddent.
The help of the following persons is gratefully acknowledged: Ms M. Loepfe (data analysis and supervision of experiments), Ms M. Eglin and Mr. A. WShrle (supervision of experiments), Dr. I. Tobler (comments on the manuscript), Ms K. Schwarz (illu- strations) and Ms R. Steiger (typing).
References
Berger, R.J. and Oswald, I. Effects of sleep depriva- t ion on behaviour, subsequent sleep, and dream- ing. J. ment. Sci., 1962, 108: 457--465.
Borb61y, A.A. and Neuhaus, H.U. Sleep-deprivation: effects on sleep and EEG in the rat. J. comp. physiol. Psychol., 1979, 133: 71--87.
SLEEP DEPRIVATION AND EEG POWER DENSITY 493
Borb~ly, A.A. and Tobler, I. The search for an endo- genous 'sleep-substance'. Trends pharmacol. Sci., 1980, 1: 356--358.
Church, M.W., March, J.D., Hibi, S., Benson, K., Cav- ness, C. and Feinberg, I. Changes in frequency and amplitude of delta activity during sleep. Electro- enceph, clin. Neurophysiol., 1975, 39: 1--7.
Crowley, T.J., Kripke, D.F., Haiberg, F., Pegram, G.V. and Schildkraut, J.J. Circadian rhythms of Macaca mulatta: sleep, EEG, body and eye move- ment, and temperature. Primates, 1972, 13: 149-- 168.
Dumermuth, G., Walz, W., Scollo-Lavizzari, G. and Kleiner, B. Spectral analysis of EEG activity in dif- ferent sleep stages in normal adults. Europ. Neu- rol., 1972, 7: 265--296.
Feinberg, I. Changes in sleep cycle pattern with age. J. psychiat. Res., 1974, 10: 283--306.
Feinberg, I. and Floyd, T.C. Systematic trends across the night in human sleep cycles. Psychophysiol- ogy, 1979, 16: 283--291.
Feinberg, I., March, J.D., Fein, G., Floyd, T.C., Walker, J.M. and Price, L. Period and amplitude analysis of 0.5--3 c/sec activity in nREM sleep of young adults. Electroenceph. clin. Neurophysiol., 1978, 44: 202--213.
Fencl, V., Koski, G. and Pappenheimer, J.R. Factors in cerebrospinal fluid from goats that affect sleep and activity in rats. J. Physiol. (Lond.), 1971, 216: 565--589.
Johnson, L., Lubin, A., Naitoh, P., Nute, C. and Austin, M. Spectral analysis of the EEG of domi- nant and non-dominant alpha subjects during wak- ing and sleeping. Electroenceph. clin. Neurophy- siol., 1969, 26: 361--370.
Lehmann, D., Meier, C.A. and Dumermuth, G. EEG power and coherence during NREM, REM and wakefulness. In: L. Popoviciu, B. Asgian and G. Badiu (Eds.), Sleep 1978. Karger, Basel, 1980: 577--580.
Moses, J.M., Johnson, L.C., Naitoh, P. and Lubin, A. Sleep stage deprivation and total sleep loss: effects on sleep behavior. Psychophysiology, 1975, 12: 141--146.
Nagasaki, H., Iriki, M., Inou~, S. and Uchizono, K. The presence of a sleep-promoting material in the brain of sleep-deprived rats. Proc. Jap. Acad., 1974, 50: 241--247.
Nakazawa, Y., Kotorii, M., Oshima, M., Kotorii, T. and Hasuzawa, H. Changes in sleep pattern after sleep deprivation. Folia psychiat, neurol, jap., 1978, 32: 85--93.
Pappenheimer, J.R., Koski, G., Fencl, V., Karnovsky, M.L. and Krueger, J. Extraction of sleep-promot- ing factor S from cerebrospinal fluid and from brains of sleep-deprived animals. J. Neurophysiol., 1975, 38: 1299--1311.
Rechtschaffen, A. and Kales, A. (Eds.) A Manual of Standardized Terminology, Techniques, and Scor- ing System for Sleep Stages of Human Subjects. National Institutes of Health, Publication No. 204. U.S. Govt. Printing Office, Washington, D.C., 1968.
Reite, M.L., Rhodes, J.M., Kavan, E. and Adey, W.R. Normal sleep patterns in macaque monkey. Arch. Neurol. (Chic.), 1965, 12: 133--144.
Sachs, J., Ungar, J., Waser, P.G. and Borb41y, A.A. Factors in cerebrospinal fluid affecting motor activity in the rat. Neurosci. Lett., 1976, 2: 83-- 86.
Siegel, S. Nonparametric Statistics for the Behavioral Sciences. McGraw-Hill/Kogakusha, Tokyo, 1956.
Sinha, A.K., Smythe, H., Zarcone, V.P., Barchas, J.D. and Dement, W.C. Human sleep-electroencephalo- gram: a damped oscillatory phenomenon. J. theor. Biol., 1972, 35: 387--393.
Smith, J.R., Karacan, I. and Yang, M. Automated analysis of the human sleep EEG. Waking Sleeping, 1978, 2: 75--82.
Takahashi, Y., Ebihara, S., Nakamura, Y. and Taka- hashi, K. Temporal distributions of delta wave sleep and REM sleep during recovery sleep after 12-h forced wakefulness in dogs; similarity to hu- man sleep. Neurosci. Lett., 1978, 10: 329--334.
Ursin, R. Differential effect of sleep deprivation on the two slow wave sleep stages in the cat. Acta physiol, scand., 1971, 83: 352--361.
Webb, W.B. and Agnew, Jr., H.W. Stage 4 sleep: influence of time course variables. Science, 1971, 174: 1354--1356.
Webb, W.B. and Agnew, Jr., H.W. The effects of a chronic limitation of sleep length. Psychophysiol- ogy, 1974, 11: 265--274.
Williams, H.L., Hammack, J.T., Daly, R.L., Dement, W.C. and Lubin, A. Responses to auditory stimula- tion, sleep loss and the EEG stages of sleep. Electro- enceph, clin. Neurophysiol., 1964, 16: 269--279.
Related Documents


